Guatemalan vs Immigrants from Latvia Married-Couple Family Poverty
COMPARE
Guatemalan
Immigrants from Latvia
Married-Couple Family Poverty
Married-Couple Family Poverty Comparison
Guatemalans
Immigrants from Latvia
7.0%
MARRIED-COUPLE FAMILY POVERTY
0.0/ 100
METRIC RATING
307th/ 347
METRIC RANK
4.5%
MARRIED-COUPLE FAMILY POVERTY
99.1/ 100
METRIC RATING
77th/ 347
METRIC RANK
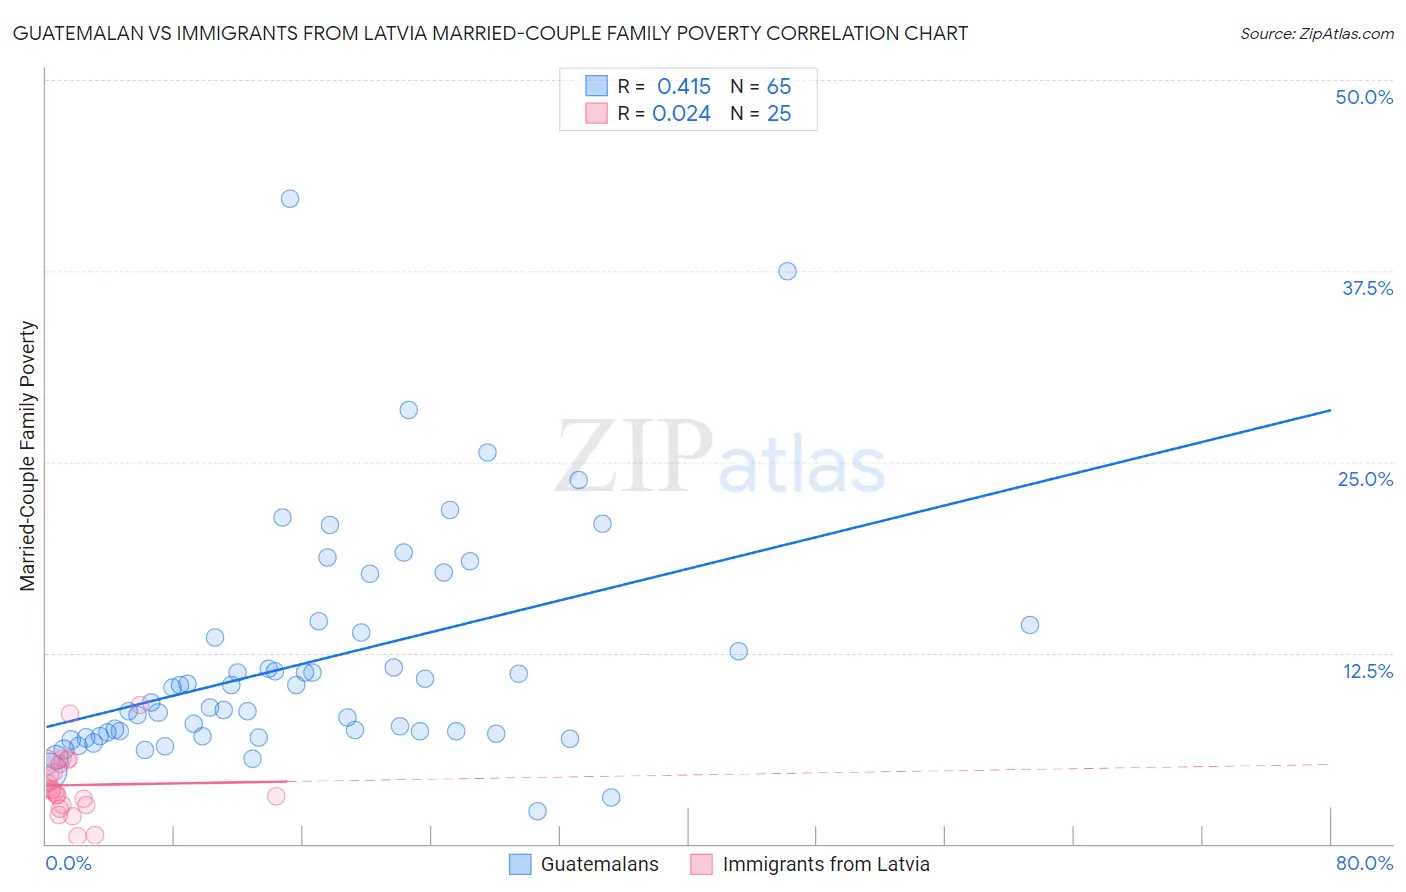
Guatemalan vs Immigrants from Latvia Married-Couple Family Poverty Correlation Chart
The statistical analysis conducted on geographies consisting of 406,520,979 people shows a moderate positive correlation between the proportion of Guatemalans and poverty level among married-couple families in the United States with a correlation coefficient (R) of 0.415 and weighted average of 7.0%. Similarly, the statistical analysis conducted on geographies consisting of 113,402,178 people shows no correlation between the proportion of Immigrants from Latvia and poverty level among married-couple families in the United States with a correlation coefficient (R) of 0.024 and weighted average of 4.5%, a difference of 56.1%.
Married-Couple Family Poverty Correlation Summary
| Measurement | Guatemalan | Immigrants from Latvia |
| Minimum | 2.1% | 0.50% |
| Maximum | 42.2% | 9.1% |
| Range | 40.1% | 8.6% |
| Mean | 11.9% | 3.8% |
| Median | 9.3% | 3.5% |
| Interquartile 25% (IQ1) | 7.1% | 2.5% |
| Interquartile 75% (IQ3) | 14.1% | 5.3% |
| Interquartile Range (IQR) | 7.0% | 2.8% |
| Standard Deviation (Sample) | 7.5% | 2.1% |
| Standard Deviation (Population) | 7.5% | 2.0% |
Similar Demographics by Married-Couple Family Poverty
Demographics Similar to Guatemalans by Married-Couple Family Poverty
In terms of married-couple family poverty, the demographic groups most similar to Guatemalans are Spanish American Indian (7.1%, a difference of 0.18%), Hopi (7.1%, a difference of 0.78%), Immigrants from Nicaragua (7.1%, a difference of 0.81%), Immigrants from Dominica (7.1%, a difference of 0.86%), and Immigrants from Armenia (7.1%, a difference of 0.86%).
| Demographics | Rating | Rank | Married-Couple Family Poverty |
| Immigrants | Belize | 0.0 /100 | #300 | Tragic 6.7% |
| Central Americans | 0.0 /100 | #301 | Tragic 6.7% |
| Immigrants | Ecuador | 0.0 /100 | #302 | Tragic 6.7% |
| Immigrants | El Salvador | 0.0 /100 | #303 | Tragic 6.8% |
| Cubans | 0.0 /100 | #304 | Tragic 6.8% |
| Haitians | 0.0 /100 | #305 | Tragic 6.8% |
| Immigrants | Haiti | 0.0 /100 | #306 | Tragic 7.0% |
| Guatemalans | 0.0 /100 | #307 | Tragic 7.0% |
| Spanish American Indians | 0.0 /100 | #308 | Tragic 7.1% |
| Hopi | 0.0 /100 | #309 | Tragic 7.1% |
| Immigrants | Nicaragua | 0.0 /100 | #310 | Tragic 7.1% |
| Immigrants | Dominica | 0.0 /100 | #311 | Tragic 7.1% |
| Immigrants | Armenia | 0.0 /100 | #312 | Tragic 7.1% |
| Immigrants | St. Vincent and the Grenadines | 0.0 /100 | #313 | Tragic 7.1% |
| British West Indians | 0.0 /100 | #314 | Tragic 7.1% |
Demographics Similar to Immigrants from Latvia by Married-Couple Family Poverty
In terms of married-couple family poverty, the demographic groups most similar to Immigrants from Latvia are Scotch-Irish (4.5%, a difference of 0.080%), Immigrants from South Africa (4.5%, a difference of 0.17%), Cambodian (4.5%, a difference of 0.28%), Immigrants from Iran (4.5%, a difference of 0.31%), and Icelander (4.5%, a difference of 0.38%).
| Demographics | Rating | Rank | Married-Couple Family Poverty |
| Immigrants | Korea | 99.4 /100 | #70 | Exceptional 4.5% |
| Immigrants | North America | 99.3 /100 | #71 | Exceptional 4.5% |
| Immigrants | England | 99.3 /100 | #72 | Exceptional 4.5% |
| Ukrainians | 99.2 /100 | #73 | Exceptional 4.5% |
| Immigrants | Austria | 99.2 /100 | #74 | Exceptional 4.5% |
| Cambodians | 99.2 /100 | #75 | Exceptional 4.5% |
| Immigrants | South Africa | 99.1 /100 | #76 | Exceptional 4.5% |
| Immigrants | Latvia | 99.1 /100 | #77 | Exceptional 4.5% |
| Scotch-Irish | 99.1 /100 | #78 | Exceptional 4.5% |
| Immigrants | Iran | 99.0 /100 | #79 | Exceptional 4.5% |
| Icelanders | 99.0 /100 | #80 | Exceptional 4.5% |
| Immigrants | Greece | 98.9 /100 | #81 | Exceptional 4.5% |
| Canadians | 98.8 /100 | #82 | Exceptional 4.5% |
| Immigrants | Denmark | 98.8 /100 | #83 | Exceptional 4.6% |
| Immigrants | Croatia | 98.7 /100 | #84 | Exceptional 4.6% |