Guatemalan Wage/Income Gap
COMPARE
Guatemalan
Select to Compare
Wage/Income Gap
Guatemalan Wage/Income Gap
22.6%
WAGE/INCOME GAP
99.9/ 100
METRIC RATING
65th/ 347
METRIC RANK
Guatemalan Wage/Income Gap Correlation Chart
The statistical analysis conducted on geographies consisting of 409,292,341 people shows a mild positive correlation between the proportion of Guatemalans and wage/income gap percentage in the United States with a correlation coefficient (R) of 0.309 and weighted average of 22.6%. On average, for every 1% (one percent) increase in Guatemalans within a typical geography, there is an increase of 0.22% in wage/income gap percentage.
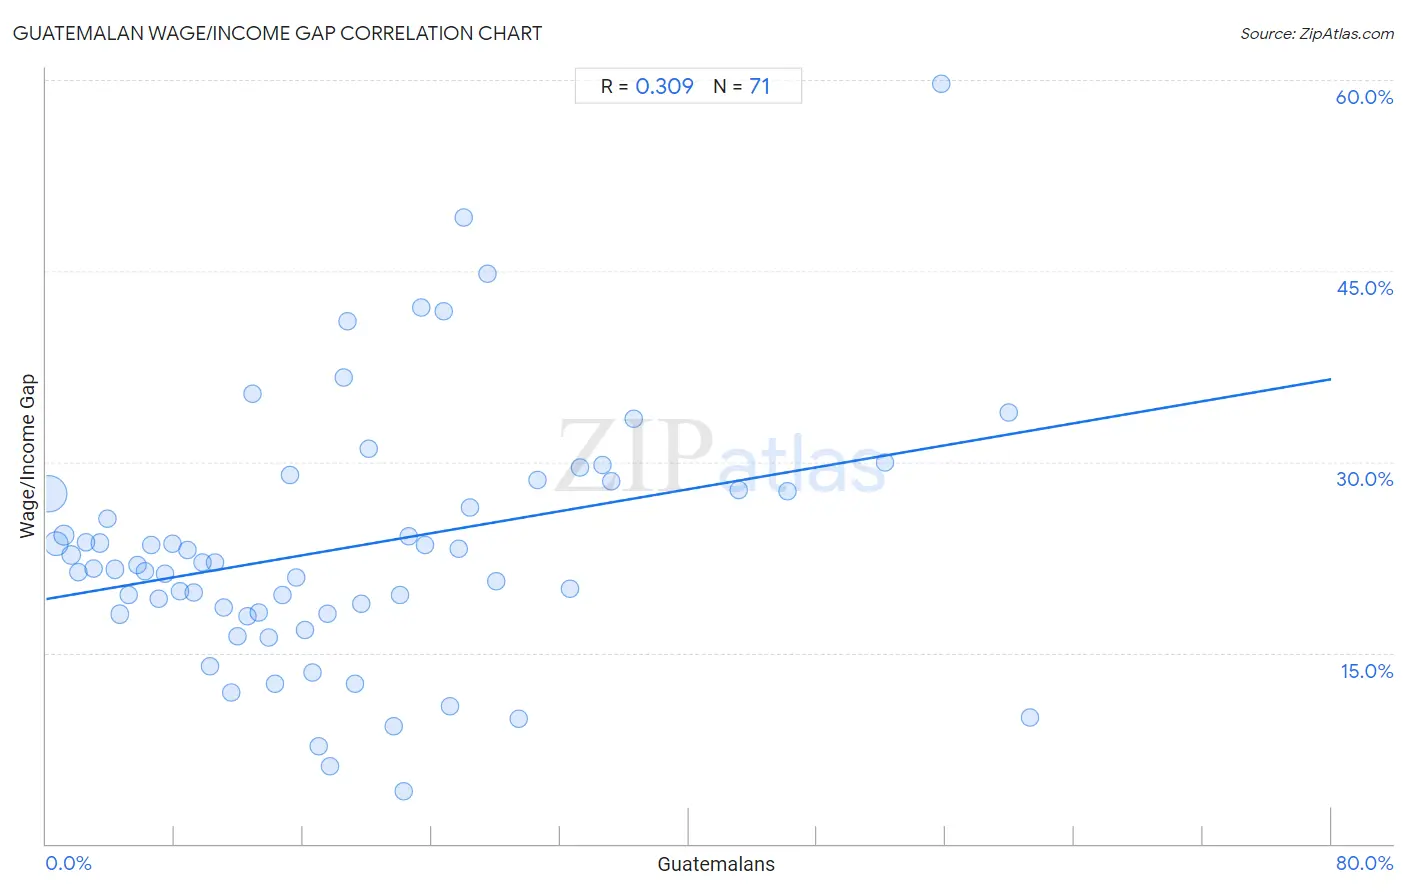
It is essential to understand that the correlation between the percentage of Guatemalans and wage/income gap percentage does not imply a direct cause-and-effect relationship. It remains uncertain whether the presence of Guatemalans influences an upward or downward trend in the level of wage/income gap percentage within an area, or if Guatemalans simply ended up residing in those areas with higher or lower levels of wage/income gap percentage due to other factors.
Demographics Similar to Guatemalans by Wage/Income Gap
In terms of wage/income gap, the demographic groups most similar to Guatemalans are Central American Indian (22.7%, a difference of 0.24%), Spanish American Indian (22.5%, a difference of 0.32%), Menominee (22.7%, a difference of 0.41%), Immigrants from Nigeria (22.7%, a difference of 0.42%), and Indonesian (22.7%, a difference of 0.45%).
| Demographics | Rating | Rank | Wage/Income Gap |
| Immigrants from Cuba | 100.0 /100 | #58 | Exceptional 22.4% |
| Navajo | 100.0 /100 | #59 | Exceptional 22.4% |
| Immigrants from Middle Africa | 100.0 /100 | #60 | Exceptional 22.4% |
| Immigrants from Fiji | 100.0 /100 | #61 | Exceptional 22.4% |
| Immigrants from Guatemala | 100.0 /100 | #62 | Exceptional 22.5% |
| Immigrants from Ecuador | 100.0 /100 | #63 | Exceptional 22.5% |
| Spanish American Indians | 100.0 /100 | #64 | Exceptional 22.5% |
| Guatemalans | 99.9 /100 | #65 | Exceptional 22.6% |
| Central American Indians | 99.9 /100 | #66 | Exceptional 22.7% |
| Menominee | 99.9 /100 | #67 | Exceptional 22.7% |
| Immigrants from Nigeria | 99.9 /100 | #68 | Exceptional 22.7% |
| Indonesians | 99.9 /100 | #69 | Exceptional 22.7% |
| Immigrants from Uzbekistan | 99.9 /100 | #70 | Exceptional 22.7% |
| Immigrants from El Salvador | 99.9 /100 | #71 | Exceptional 22.8% |
| Sub-Saharan Africans | 99.9 /100 | #72 | Exceptional 22.8% |
Guatemalan Wage/Income Gap Correlation Summary
| Measurement | Guatemalan Data | Wage/Income Gap Data |
| Minimum | 0.18% | 4.1% |
| Maximum | 61.2% | 59.7% |
| Range | 61.1% | 55.6% |
| Mean | 18.7% | 23.3% |
| Median | 16.1% | 21.9% |
| Interquartile 25% (IQ1) | 7.9% | 18.1% |
| Interquartile 75% (IQ3) | 25.7% | 27.8% |
| Interquartile Range (IQR) | 17.8% | 9.7% |
| Standard Deviation (Sample) | 14.2% | 10.0% |
| Standard Deviation (Population) | 14.1% | 9.9% |
Correlation Details
| Guatemalan Percentile | Sample Size | Wage/Income Gap |
[ 0.0% - 0.5% ] 0.18% | 243,600,005 | 27.5% |
[ 0.5% - 1.0% ] 0.63% | 82,561,857 | 23.5% |
[ 1.0% - 1.5% ] 1.12% | 27,847,158 | 24.2% |
[ 1.5% - 2.0% ] 1.57% | 17,253,301 | 22.7% |
[ 2.0% - 2.5% ] 2.01% | 9,186,068 | 21.3% |
[ 2.0% - 2.5% ] 2.45% | 5,843,799 | 23.7% |
[ 2.5% - 3.0% ] 2.95% | 4,651,255 | 21.6% |
[ 3.0% - 3.5% ] 3.36% | 2,155,113 | 23.6% |
[ 3.5% - 4.0% ] 3.81% | 1,756,641 | 25.5% |
[ 4.0% - 4.5% ] 4.26% | 1,700,379 | 21.6% |
[ 4.5% - 5.0% ] 4.61% | 4,926,742 | 18.0% |
[ 5.0% - 5.5% ] 5.17% | 1,066,174 | 19.5% |
[ 5.5% - 6.0% ] 5.67% | 604,447 | 21.9% |
[ 6.0% - 6.5% ] 6.12% | 589,639 | 21.5% |
[ 6.5% - 7.0% ] 6.52% | 483,221 | 23.5% |
[ 6.5% - 7.0% ] 6.97% | 447,188 | 19.2% |
[ 7.0% - 7.5% ] 7.38% | 640,462 | 21.2% |
[ 7.5% - 8.0% ] 7.85% | 389,471 | 23.6% |
[ 8.0% - 8.5% ] 8.30% | 439,557 | 19.9% |
[ 8.5% - 9.0% ] 8.82% | 292,925 | 23.0% |
[ 9.0% - 9.5% ] 9.22% | 307,758 | 19.7% |
[ 9.5% - 10.0% ] 9.72% | 267,864 | 22.1% |
[ 10.0% - 10.5% ] 10.22% | 345,791 | 13.9% |
[ 10.5% - 11.0% ] 10.54% | 250,383 | 22.1% |
[ 11.0% - 11.5% ] 11.07% | 354,522 | 18.6% |
[ 11.5% - 12.0% ] 11.50% | 132,821 | 11.9% |
[ 11.5% - 12.0% ] 11.94% | 89,720 | 16.3% |
[ 12.5% - 13.0% ] 12.51% | 126,968 | 17.9% |
[ 12.5% - 13.0% ] 12.82% | 23,698 | 35.3% |
[ 13.0% - 13.5% ] 13.23% | 136,235 | 18.2% |
[ 13.5% - 14.0% ] 13.87% | 102,117 | 16.2% |
[ 14.0% - 14.5% ] 14.27% | 46,669 | 12.5% |
[ 14.5% - 15.0% ] 14.69% | 31,874 | 19.5% |
[ 15.0% - 15.5% ] 15.16% | 5,139 | 28.9% |
[ 15.5% - 16.0% ] 15.56% | 81,504 | 20.9% |
[ 16.0% - 16.5% ] 16.13% | 79,754 | 16.8% |
[ 16.5% - 17.0% ] 16.59% | 38,498 | 13.5% |
[ 16.5% - 17.0% ] 16.94% | 13,633 | 7.7% |
[ 17.0% - 17.5% ] 17.48% | 2,368 | 18.1% |
[ 17.5% - 18.0% ] 17.66% | 10,020 | 6.0% |
[ 18.5% - 19.0% ] 18.51% | 1,275 | 36.7% |
[ 18.5% - 19.0% ] 18.73% | 7,495 | 41.1% |
[ 19.0% - 19.5% ] 19.19% | 12,295 | 12.6% |
[ 19.5% - 20.0% ] 19.62% | 102,397 | 18.8% |
[ 20.0% - 20.5% ] 20.11% | 3,347 | 31.0% |
[ 21.5% - 22.0% ] 21.63% | 39,358 | 9.3% |
[ 22.0% - 22.5% ] 22.04% | 20,072 | 19.6% |
[ 22.0% - 22.5% ] 22.25% | 6,624 | 4.1% |
[ 22.5% - 23.0% ] 22.60% | 36,405 | 24.1% |
[ 23.0% - 23.5% ] 23.33% | 553 | 42.1% |
[ 23.5% - 24.0% ] 23.56% | 50,387 | 23.5% |
[ 24.5% - 25.0% ] 24.76% | 7,932 | 41.8% |
[ 25.0% - 25.5% ] 25.11% | 56,969 | 10.8% |
[ 25.5% - 26.0% ] 25.67% | 1,796 | 23.2% |
[ 26.0% - 26.5% ] 26.00% | 50 | 49.2% |
[ 26.0% - 26.5% ] 26.37% | 5,468 | 26.4% |
[ 27.0% - 27.5% ] 27.49% | 211 | 44.8% |
[ 27.5% - 28.0% ] 27.98% | 2,205 | 20.6% |
[ 29.0% - 29.5% ] 29.43% | 10,418 | 9.9% |
[ 30.5% - 31.0% ] 30.55% | 635 | 28.6% |
[ 32.5% - 33.0% ] 32.60% | 2,506 | 20.0% |
[ 33.0% - 33.5% ] 33.22% | 5,759 | 29.6% |
[ 34.5% - 35.0% ] 34.63% | 10,371 | 29.8% |
[ 35.0% - 35.5% ] 35.17% | 981 | 28.4% |
[ 36.5% - 37.0% ] 36.61% | 631 | 33.4% |
[ 43.0% - 43.5% ] 43.14% | 21,778 | 27.8% |
[ 46.0% - 46.5% ] 46.15% | 182 | 27.7% |
[ 52.0% - 52.5% ] 52.21% | 113 | 30.0% |
[ 55.5% - 56.0% ] 55.70% | 149 | 59.7% |
[ 59.5% - 60.0% ] 59.89% | 1,112 | 33.9% |
[ 61.0% - 61.5% ] 61.24% | 129 | 9.9% |