Guatemalan vs Subsaharan African Married-Couple Family Poverty
COMPARE
Guatemalan
Subsaharan African
Married-Couple Family Poverty
Married-Couple Family Poverty Comparison
Guatemalans
Sub-Saharan Africans
7.0%
MARRIED-COUPLE FAMILY POVERTY
0.0/ 100
METRIC RATING
307th/ 347
METRIC RANK
5.7%
MARRIED-COUPLE FAMILY POVERTY
4.9/ 100
METRIC RATING
229th/ 347
METRIC RANK
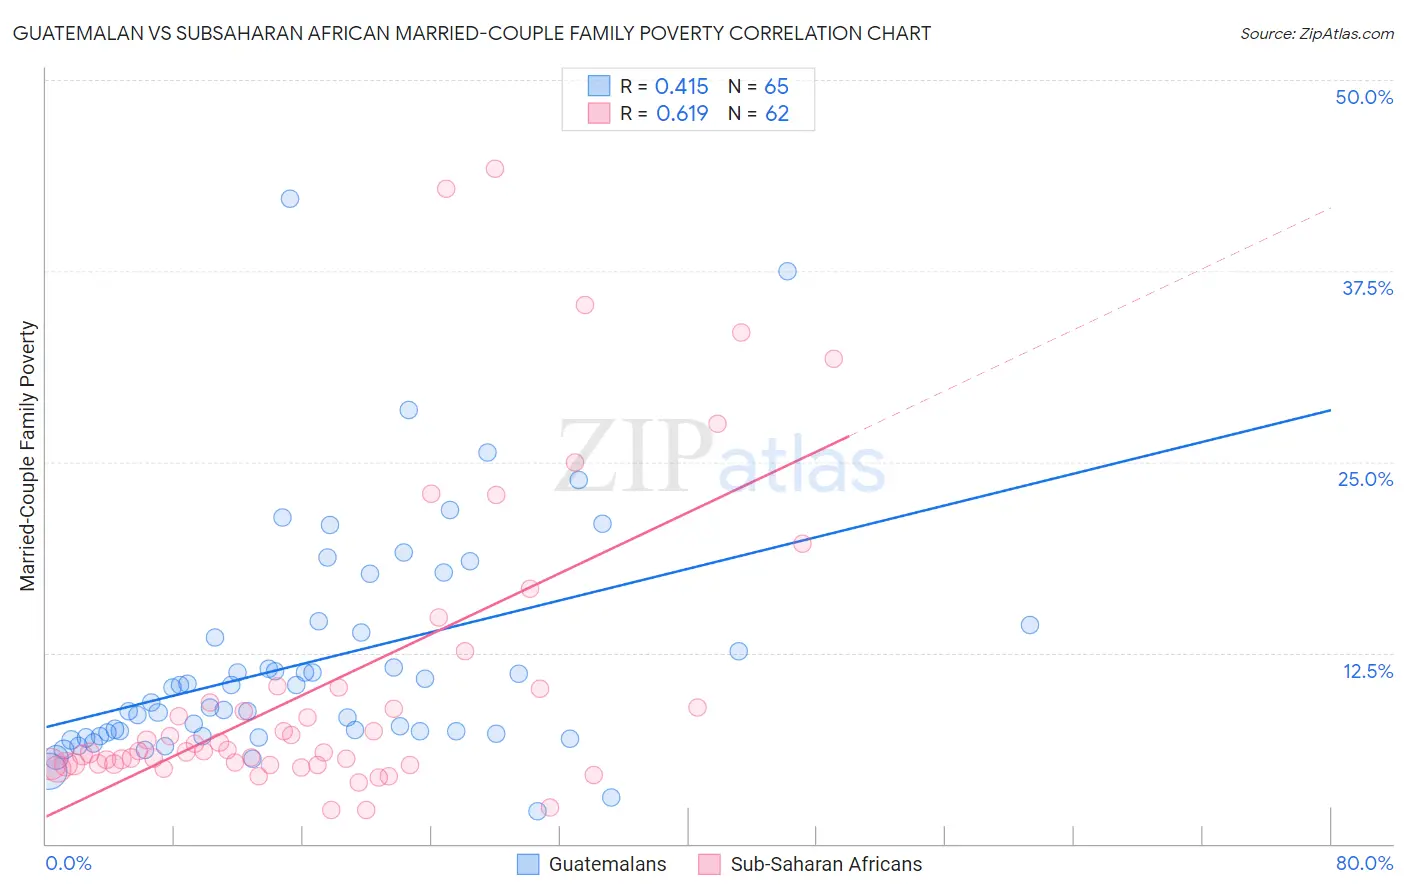
Guatemalan vs Subsaharan African Married-Couple Family Poverty Correlation Chart
The statistical analysis conducted on geographies consisting of 406,520,979 people shows a moderate positive correlation between the proportion of Guatemalans and poverty level among married-couple families in the United States with a correlation coefficient (R) of 0.415 and weighted average of 7.0%. Similarly, the statistical analysis conducted on geographies consisting of 501,239,511 people shows a significant positive correlation between the proportion of Sub-Saharan Africans and poverty level among married-couple families in the United States with a correlation coefficient (R) of 0.619 and weighted average of 5.7%, a difference of 24.2%.
Married-Couple Family Poverty Correlation Summary
| Measurement | Guatemalan | Subsaharan African |
| Minimum | 2.1% | 2.2% |
| Maximum | 42.2% | 44.2% |
| Range | 40.1% | 42.0% |
| Mean | 11.9% | 10.4% |
| Median | 9.3% | 6.1% |
| Interquartile 25% (IQ1) | 7.1% | 5.2% |
| Interquartile 75% (IQ3) | 14.1% | 10.1% |
| Interquartile Range (IQR) | 7.0% | 4.9% |
| Standard Deviation (Sample) | 7.5% | 9.8% |
| Standard Deviation (Population) | 7.5% | 9.7% |
Similar Demographics by Married-Couple Family Poverty
Demographics Similar to Guatemalans by Married-Couple Family Poverty
In terms of married-couple family poverty, the demographic groups most similar to Guatemalans are Spanish American Indian (7.1%, a difference of 0.18%), Hopi (7.1%, a difference of 0.78%), Immigrants from Nicaragua (7.1%, a difference of 0.81%), Immigrants from Dominica (7.1%, a difference of 0.86%), and Immigrants from Armenia (7.1%, a difference of 0.86%).
| Demographics | Rating | Rank | Married-Couple Family Poverty |
| Immigrants | Belize | 0.0 /100 | #300 | Tragic 6.7% |
| Central Americans | 0.0 /100 | #301 | Tragic 6.7% |
| Immigrants | Ecuador | 0.0 /100 | #302 | Tragic 6.7% |
| Immigrants | El Salvador | 0.0 /100 | #303 | Tragic 6.8% |
| Cubans | 0.0 /100 | #304 | Tragic 6.8% |
| Haitians | 0.0 /100 | #305 | Tragic 6.8% |
| Immigrants | Haiti | 0.0 /100 | #306 | Tragic 7.0% |
| Guatemalans | 0.0 /100 | #307 | Tragic 7.0% |
| Spanish American Indians | 0.0 /100 | #308 | Tragic 7.1% |
| Hopi | 0.0 /100 | #309 | Tragic 7.1% |
| Immigrants | Nicaragua | 0.0 /100 | #310 | Tragic 7.1% |
| Immigrants | Dominica | 0.0 /100 | #311 | Tragic 7.1% |
| Immigrants | Armenia | 0.0 /100 | #312 | Tragic 7.1% |
| Immigrants | St. Vincent and the Grenadines | 0.0 /100 | #313 | Tragic 7.1% |
| British West Indians | 0.0 /100 | #314 | Tragic 7.1% |
Demographics Similar to Sub-Saharan Africans by Married-Couple Family Poverty
In terms of married-couple family poverty, the demographic groups most similar to Sub-Saharan Africans are Moroccan (5.7%, a difference of 0.030%), Arab (5.7%, a difference of 0.25%), Immigrants from Iraq (5.7%, a difference of 0.29%), Immigrants from Laos (5.7%, a difference of 0.35%), and Immigrants from Zaire (5.6%, a difference of 0.38%).
| Demographics | Rating | Rank | Married-Couple Family Poverty |
| Cajuns | 6.9 /100 | #222 | Tragic 5.6% |
| Immigrants | Fiji | 6.7 /100 | #223 | Tragic 5.6% |
| Sudanese | 6.4 /100 | #224 | Tragic 5.6% |
| Immigrants | Cambodia | 6.1 /100 | #225 | Tragic 5.6% |
| South Americans | 5.7 /100 | #226 | Tragic 5.6% |
| Immigrants | Zaire | 5.6 /100 | #227 | Tragic 5.6% |
| Arabs | 5.4 /100 | #228 | Tragic 5.7% |
| Sub-Saharan Africans | 4.9 /100 | #229 | Tragic 5.7% |
| Moroccans | 4.9 /100 | #230 | Tragic 5.7% |
| Immigrants | Iraq | 4.4 /100 | #231 | Tragic 5.7% |
| Immigrants | Laos | 4.4 /100 | #232 | Tragic 5.7% |
| Immigrants | Colombia | 3.7 /100 | #233 | Tragic 5.7% |
| Immigrants | Uruguay | 3.7 /100 | #234 | Tragic 5.7% |
| Immigrants | Sudan | 3.5 /100 | #235 | Tragic 5.7% |
| Ghanaians | 3.3 /100 | #236 | Tragic 5.7% |