Guatemalan vs Belizean Married-Couple Family Poverty
COMPARE
Guatemalan
Belizean
Married-Couple Family Poverty
Married-Couple Family Poverty Comparison
Guatemalans
Belizeans
7.0%
MARRIED-COUPLE FAMILY POVERTY
0.0/ 100
METRIC RATING
307th/ 347
METRIC RANK
6.5%
MARRIED-COUPLE FAMILY POVERTY
0.0/ 100
METRIC RATING
291st/ 347
METRIC RANK
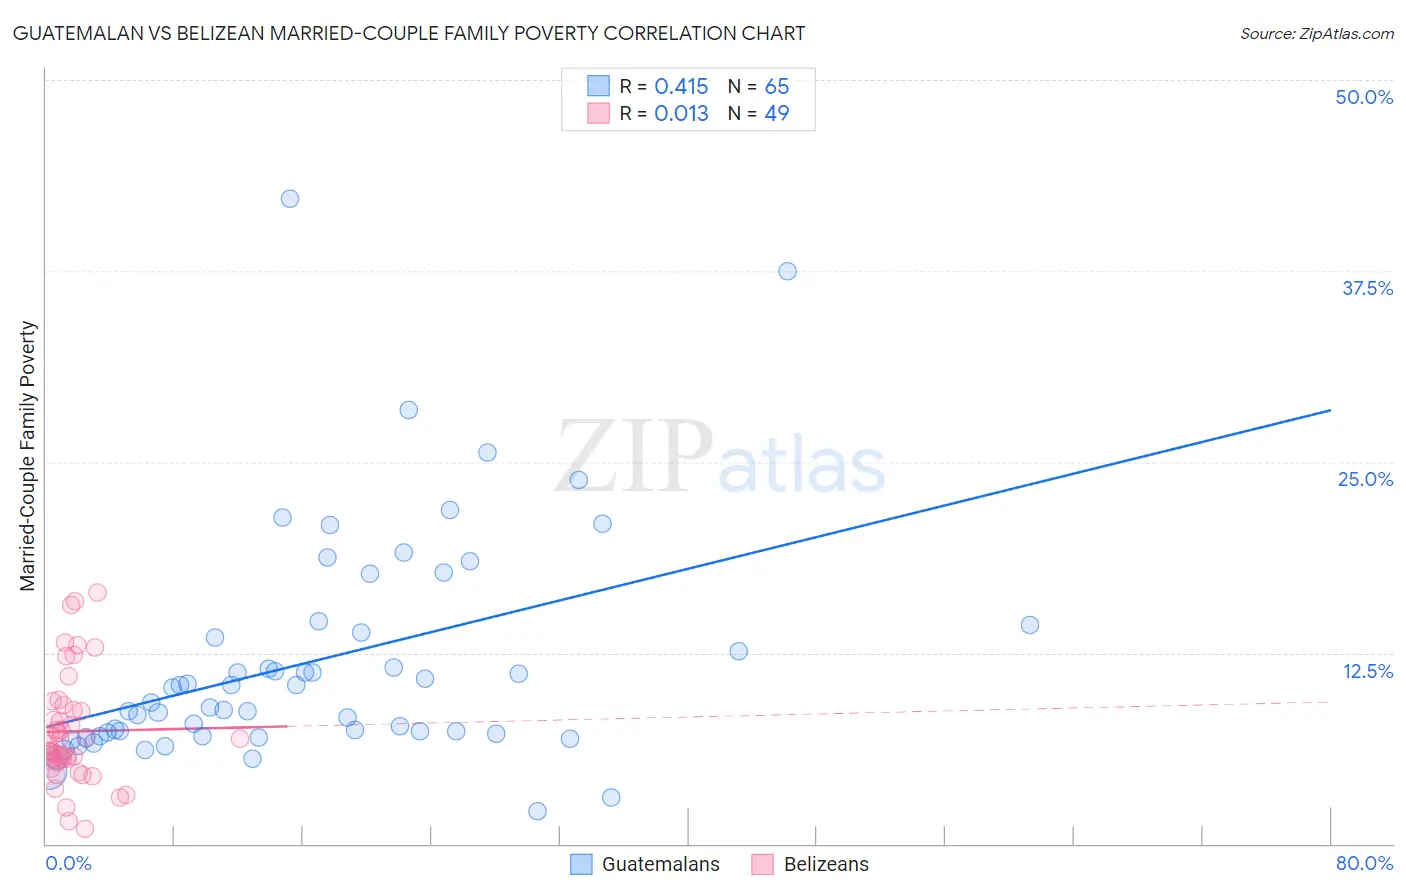
Guatemalan vs Belizean Married-Couple Family Poverty Correlation Chart
The statistical analysis conducted on geographies consisting of 406,520,979 people shows a moderate positive correlation between the proportion of Guatemalans and poverty level among married-couple families in the United States with a correlation coefficient (R) of 0.415 and weighted average of 7.0%. Similarly, the statistical analysis conducted on geographies consisting of 143,932,988 people shows no correlation between the proportion of Belizeans and poverty level among married-couple families in the United States with a correlation coefficient (R) of 0.013 and weighted average of 6.5%, a difference of 7.4%.
Married-Couple Family Poverty Correlation Summary
| Measurement | Guatemalan | Belizean |
| Minimum | 2.1% | 0.96% |
| Maximum | 42.2% | 16.5% |
| Range | 40.1% | 15.5% |
| Mean | 11.9% | 7.4% |
| Median | 9.3% | 6.5% |
| Interquartile 25% (IQ1) | 7.1% | 5.4% |
| Interquartile 75% (IQ3) | 14.1% | 8.9% |
| Interquartile Range (IQR) | 7.0% | 3.5% |
| Standard Deviation (Sample) | 7.5% | 3.6% |
| Standard Deviation (Population) | 7.5% | 3.6% |
Demographics Similar to Guatemalans and Belizeans by Married-Couple Family Poverty
In terms of married-couple family poverty, the demographic groups most similar to Guatemalans are Spanish American Indian (7.1%, a difference of 0.18%), Hopi (7.1%, a difference of 0.78%), Immigrants from Haiti (7.0%, a difference of 1.1%), Haitian (6.8%, a difference of 3.4%), and Cuban (6.8%, a difference of 3.5%). Similarly, the demographic groups most similar to Belizeans are Immigrants from Barbados (6.5%, a difference of 0.040%), Immigrants from Lebanon (6.6%, a difference of 0.17%), Nepalese (6.5%, a difference of 0.26%), Arapaho (6.6%, a difference of 0.26%), and Bahamian (6.6%, a difference of 1.1%).
| Demographics | Rating | Rank | Married-Couple Family Poverty |
| Nepalese | 0.0 /100 | #289 | Tragic 6.5% |
| Immigrants | Barbados | 0.0 /100 | #290 | Tragic 6.5% |
| Belizeans | 0.0 /100 | #291 | Tragic 6.5% |
| Immigrants | Lebanon | 0.0 /100 | #292 | Tragic 6.6% |
| Arapaho | 0.0 /100 | #293 | Tragic 6.6% |
| Bahamians | 0.0 /100 | #294 | Tragic 6.6% |
| Immigrants | Uzbekistan | 0.0 /100 | #295 | Tragic 6.6% |
| U.S. Virgin Islanders | 0.0 /100 | #296 | Tragic 6.6% |
| Kiowa | 0.0 /100 | #297 | Tragic 6.6% |
| Immigrants | Guyana | 0.0 /100 | #298 | Tragic 6.7% |
| Nicaraguans | 0.0 /100 | #299 | Tragic 6.7% |
| Immigrants | Belize | 0.0 /100 | #300 | Tragic 6.7% |
| Central Americans | 0.0 /100 | #301 | Tragic 6.7% |
| Immigrants | Ecuador | 0.0 /100 | #302 | Tragic 6.7% |
| Immigrants | El Salvador | 0.0 /100 | #303 | Tragic 6.8% |
| Cubans | 0.0 /100 | #304 | Tragic 6.8% |
| Haitians | 0.0 /100 | #305 | Tragic 6.8% |
| Immigrants | Haiti | 0.0 /100 | #306 | Tragic 7.0% |
| Guatemalans | 0.0 /100 | #307 | Tragic 7.0% |
| Spanish American Indians | 0.0 /100 | #308 | Tragic 7.1% |
| Hopi | 0.0 /100 | #309 | Tragic 7.1% |