Delaware vs Celtic Married-Couple Family Poverty
COMPARE
Delaware
Celtic
Married-Couple Family Poverty
Married-Couple Family Poverty Comparison
Delaware
Celtics
5.1%
MARRIED-COUPLE FAMILY POVERTY
73.7/ 100
METRIC RATING
154th/ 347
METRIC RANK
4.8%
MARRIED-COUPLE FAMILY POVERTY
94.8/ 100
METRIC RATING
116th/ 347
METRIC RANK
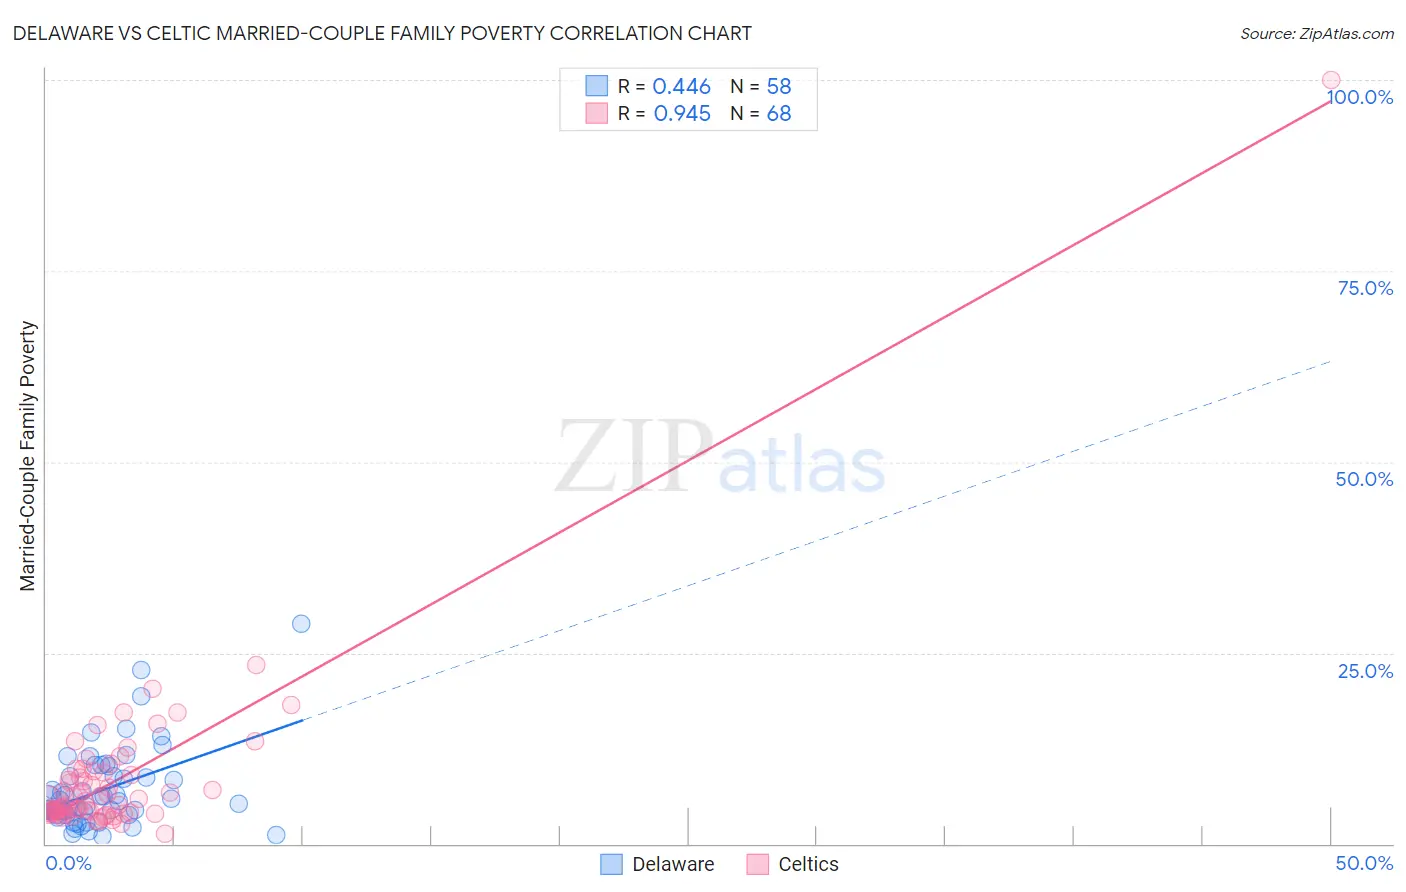
Delaware vs Celtic Married-Couple Family Poverty Correlation Chart
The statistical analysis conducted on geographies consisting of 95,946,385 people shows a moderate positive correlation between the proportion of Delaware and poverty level among married-couple families in the United States with a correlation coefficient (R) of 0.446 and weighted average of 5.1%. Similarly, the statistical analysis conducted on geographies consisting of 167,973,280 people shows a near-perfect positive correlation between the proportion of Celtics and poverty level among married-couple families in the United States with a correlation coefficient (R) of 0.945 and weighted average of 4.8%, a difference of 6.0%.
Married-Couple Family Poverty Correlation Summary
| Measurement | Delaware | Celtic |
| Minimum | 0.94% | 1.3% |
| Maximum | 28.8% | 100.0% |
| Range | 27.9% | 98.7% |
| Mean | 7.1% | 8.7% |
| Median | 5.6% | 5.4% |
| Interquartile 25% (IQ1) | 3.8% | 4.1% |
| Interquartile 75% (IQ3) | 8.9% | 9.4% |
| Interquartile Range (IQR) | 5.1% | 5.4% |
| Standard Deviation (Sample) | 5.3% | 12.2% |
| Standard Deviation (Population) | 5.3% | 12.1% |
Similar Demographics by Married-Couple Family Poverty
Demographics Similar to Delaware by Married-Couple Family Poverty
In terms of married-couple family poverty, the demographic groups most similar to Delaware are Immigrants from Ethiopia (5.1%, a difference of 0.19%), Sri Lankan (5.1%, a difference of 0.23%), Immigrants from Kuwait (5.0%, a difference of 0.43%), Argentinean (5.1%, a difference of 0.45%), and Immigrants from South Eastern Asia (5.1%, a difference of 0.49%).
| Demographics | Rating | Rank | Married-Couple Family Poverty |
| Syrians | 78.7 /100 | #147 | Good 5.0% |
| Immigrants | Russia | 78.7 /100 | #148 | Good 5.0% |
| Immigrants | Oceania | 78.6 /100 | #149 | Good 5.0% |
| Brazilians | 78.3 /100 | #150 | Good 5.0% |
| Immigrants | Cameroon | 77.3 /100 | #151 | Good 5.0% |
| Albanians | 77.2 /100 | #152 | Good 5.0% |
| Immigrants | Kuwait | 76.3 /100 | #153 | Good 5.0% |
| Delaware | 73.7 /100 | #154 | Good 5.1% |
| Immigrants | Ethiopia | 72.4 /100 | #155 | Good 5.1% |
| Sri Lankans | 72.2 /100 | #156 | Good 5.1% |
| Argentineans | 70.7 /100 | #157 | Good 5.1% |
| Immigrants | South Eastern Asia | 70.4 /100 | #158 | Good 5.1% |
| Immigrants | Saudi Arabia | 70.3 /100 | #159 | Good 5.1% |
| Pennsylvania Germans | 68.5 /100 | #160 | Good 5.1% |
| Ethiopians | 68.1 /100 | #161 | Good 5.1% |
Demographics Similar to Celtics by Married-Couple Family Poverty
In terms of married-couple family poverty, the demographic groups most similar to Celtics are Taiwanese (4.8%, a difference of 0.010%), Kenyan (4.8%, a difference of 0.10%), Immigrants from Philippines (4.8%, a difference of 0.12%), Immigrants from Indonesia (4.8%, a difference of 0.16%), and Immigrants from Eastern Asia (4.8%, a difference of 0.48%).
| Demographics | Rating | Rank | Married-Couple Family Poverty |
| Immigrants | Hong Kong | 96.4 /100 | #109 | Exceptional 4.7% |
| Immigrants | Bolivia | 96.2 /100 | #110 | Exceptional 4.7% |
| Pakistanis | 96.2 /100 | #111 | Exceptional 4.7% |
| Tongans | 95.9 /100 | #112 | Exceptional 4.7% |
| Immigrants | Nepal | 95.9 /100 | #113 | Exceptional 4.7% |
| Immigrants | Indonesia | 95.1 /100 | #114 | Exceptional 4.8% |
| Taiwanese | 94.8 /100 | #115 | Exceptional 4.8% |
| Celtics | 94.8 /100 | #116 | Exceptional 4.8% |
| Kenyans | 94.7 /100 | #117 | Exceptional 4.8% |
| Immigrants | Philippines | 94.6 /100 | #118 | Exceptional 4.8% |
| Immigrants | Eastern Asia | 94.0 /100 | #119 | Exceptional 4.8% |
| Immigrants | Southern Europe | 93.4 /100 | #120 | Exceptional 4.8% |
| Indians (Asian) | 93.2 /100 | #121 | Exceptional 4.8% |
| Whites/Caucasians | 93.1 /100 | #122 | Exceptional 4.8% |
| Jordanians | 93.1 /100 | #123 | Exceptional 4.8% |