Delaware Disability Age 5 to 17
COMPARE
Delaware
Select to Compare
Disability Age 5 to 17
Delaware Disability Age 5 to 17
6.5%
DISABILITY | AGE 5 TO 17
0.0/ 100
METRIC RATING
319th/ 347
METRIC RANK
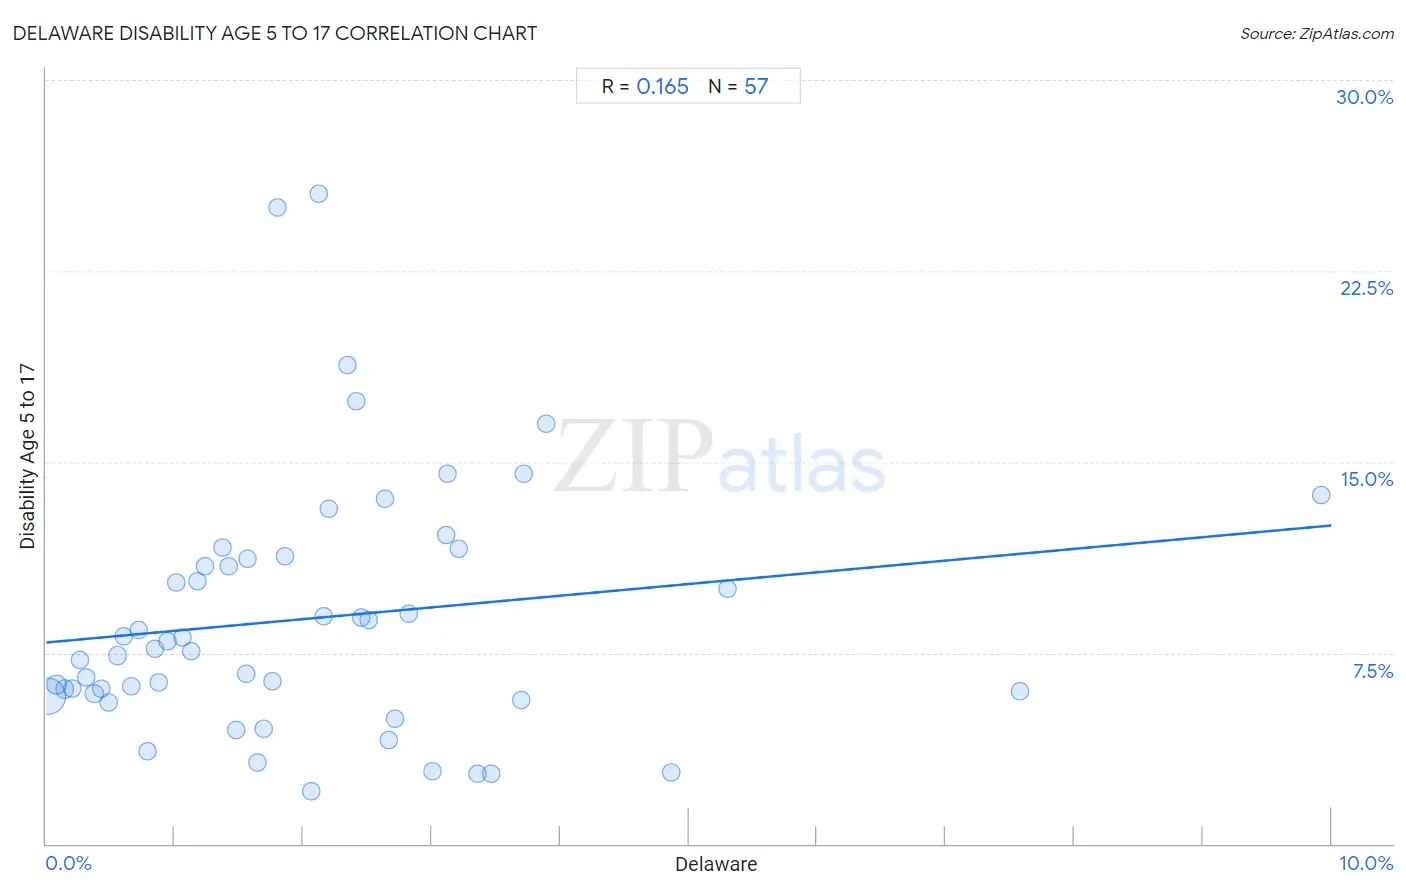
Delaware Disability Age 5 to 17 Correlation Chart
The statistical analysis conducted on geographies consisting of 95,994,789 people shows a poor positive correlation between the proportion of Delaware and percentage of population with a disability between the ages 5 and 17 in the United States with a correlation coefficient (R) of 0.165 and weighted average of 6.5%. On average, for every 1% (one percent) increase in Delaware within a typical geography, there is an increase of 0.46% in percentage of population with a disability between the ages 5 and 17.
It is essential to understand that the correlation between the percentage of Delaware and percentage of population with a disability between the ages 5 and 17 does not imply a direct cause-and-effect relationship. It remains uncertain whether the presence of Delaware influences an upward or downward trend in the level of percentage of population with a disability between the ages 5 and 17 within an area, or if Delaware simply ended up residing in those areas with higher or lower levels of percentage of population with a disability between the ages 5 and 17 due to other factors.
Demographics Similar to Delaware by Disability Age 5 to 17
In terms of disability age 5 to 17, the demographic groups most similar to Delaware are African (6.5%, a difference of 0.19%), Tohono O'odham (6.5%, a difference of 0.54%), Comanche (6.4%, a difference of 0.55%), Slovak (6.5%, a difference of 0.56%), and Kiowa (6.4%, a difference of 0.58%).
| Demographics | Rating | Rank | Disability Age 5 to 17 |
| Bermudans | 0.0 /100 | #312 | Tragic 6.4% |
| Apache | 0.0 /100 | #313 | Tragic 6.4% |
| French | 0.0 /100 | #314 | Tragic 6.4% |
| Immigrants from Portugal | 0.0 /100 | #315 | Tragic 6.4% |
| Immigrants from Dominican Republic | 0.0 /100 | #316 | Tragic 6.4% |
| Kiowa | 0.0 /100 | #317 | Tragic 6.4% |
| Comanche | 0.0 /100 | #318 | Tragic 6.4% |
| Delaware | 0.0 /100 | #319 | Tragic 6.5% |
| Africans | 0.0 /100 | #320 | Tragic 6.5% |
| Tohono O'odham | 0.0 /100 | #321 | Tragic 6.5% |
| Slovaks | 0.0 /100 | #322 | Tragic 6.5% |
| Osage | 0.0 /100 | #323 | Tragic 6.5% |
| Dominicans | 0.0 /100 | #324 | Tragic 6.5% |
| Americans | 0.0 /100 | #325 | Tragic 6.5% |
| Potawatomi | 0.0 /100 | #326 | Tragic 6.5% |
Delaware Disability Age 5 to 17 Correlation Summary
| Measurement | Delaware Data | Disability Age 5 to 17 Data |
| Minimum | 0.012% | 2.1% |
| Maximum | 9.9% | 25.5% |
| Range | 9.9% | 23.4% |
| Mean | 2.1% | 8.9% |
| Median | 1.7% | 7.7% |
| Interquartile 25% (IQ1) | 0.82% | 5.8% |
| Interquartile 75% (IQ3) | 2.8% | 11.3% |
| Interquartile Range (IQR) | 2.0% | 5.4% |
| Standard Deviation (Sample) | 1.8% | 5.0% |
| Standard Deviation (Population) | 1.8% | 4.9% |
Correlation Details
| Delaware Percentile | Sample Size | Disability Age 5 to 17 |
[ 0.0% - 0.5% ] 0.012% | 80,474,727 | 5.8% |
[ 0.0% - 0.5% ] 0.079% | 8,415,014 | 6.3% |
[ 0.0% - 0.5% ] 0.14% | 2,667,709 | 6.1% |
[ 0.0% - 0.5% ] 0.20% | 1,572,734 | 6.1% |
[ 0.0% - 0.5% ] 0.26% | 709,000 | 7.2% |
[ 0.0% - 0.5% ] 0.31% | 467,424 | 6.5% |
[ 0.0% - 0.5% ] 0.37% | 391,650 | 5.9% |
[ 0.0% - 0.5% ] 0.43% | 292,153 | 6.1% |
[ 0.0% - 0.5% ] 0.49% | 182,229 | 5.5% |
[ 0.5% - 1.0% ] 0.55% | 189,834 | 7.4% |
[ 0.5% - 1.0% ] 0.61% | 133,921 | 8.1% |
[ 0.5% - 1.0% ] 0.66% | 64,950 | 6.2% |
[ 0.5% - 1.0% ] 0.72% | 84,522 | 8.4% |
[ 0.5% - 1.0% ] 0.79% | 55,165 | 3.6% |
[ 0.5% - 1.0% ] 0.84% | 13,520 | 7.7% |
[ 0.5% - 1.0% ] 0.88% | 19,187 | 6.3% |
[ 0.5% - 1.0% ] 0.94% | 17,047 | 8.0% |
[ 1.0% - 1.5% ] 1.01% | 10,419 | 10.3% |
[ 1.0% - 1.5% ] 1.06% | 48,923 | 8.1% |
[ 1.0% - 1.5% ] 1.13% | 11,146 | 7.6% |
[ 1.0% - 1.5% ] 1.18% | 39,732 | 10.3% |
[ 1.0% - 1.5% ] 1.23% | 22,822 | 10.9% |
[ 1.0% - 1.5% ] 1.37% | 1,164 | 11.7% |
[ 1.0% - 1.5% ] 1.42% | 3,379 | 10.9% |
[ 1.0% - 1.5% ] 1.48% | 7,085 | 4.5% |
[ 1.5% - 2.0% ] 1.56% | 1,541 | 6.7% |
[ 1.5% - 2.0% ] 1.57% | 1,275 | 11.2% |
[ 1.5% - 2.0% ] 1.64% | 33,043 | 3.2% |
[ 1.5% - 2.0% ] 1.69% | 1,658 | 4.5% |
[ 1.5% - 2.0% ] 1.76% | 5,802 | 6.4% |
[ 1.5% - 2.0% ] 1.80% | 388 | 25.0% |
[ 1.5% - 2.0% ] 1.86% | 3,601 | 11.3% |
[ 2.0% - 2.5% ] 2.06% | 1,599 | 2.1% |
[ 2.0% - 2.5% ] 2.12% | 2,450 | 25.5% |
[ 2.0% - 2.5% ] 2.16% | 2,917 | 8.9% |
[ 2.0% - 2.5% ] 2.20% | 12,277 | 13.2% |
[ 2.0% - 2.5% ] 2.34% | 3,034 | 18.8% |
[ 2.0% - 2.5% ] 2.42% | 207 | 17.4% |
[ 2.0% - 2.5% ] 2.45% | 4,077 | 8.9% |
[ 2.5% - 3.0% ] 2.51% | 478 | 8.8% |
[ 2.5% - 3.0% ] 2.63% | 1,216 | 13.5% |
[ 2.5% - 3.0% ] 2.67% | 375 | 4.1% |
[ 2.5% - 3.0% ] 2.72% | 1,177 | 4.9% |
[ 2.5% - 3.0% ] 2.82% | 3,194 | 9.0% |
[ 3.0% - 3.5% ] 3.00% | 1,499 | 2.8% |
[ 3.0% - 3.5% ] 3.11% | 2,315 | 12.1% |
[ 3.0% - 3.5% ] 3.12% | 2,528 | 14.5% |
[ 3.0% - 3.5% ] 3.21% | 436 | 11.6% |
[ 3.0% - 3.5% ] 3.36% | 1,460 | 2.7% |
[ 3.0% - 3.5% ] 3.46% | 4,475 | 2.8% |
[ 3.5% - 4.0% ] 3.70% | 460 | 5.7% |
[ 3.5% - 4.0% ] 3.72% | 1,938 | 14.5% |
[ 3.5% - 4.0% ] 3.89% | 822 | 16.5% |
[ 4.5% - 5.0% ] 4.86% | 2,303 | 2.8% |
[ 5.0% - 5.5% ] 5.30% | 132 | 10.0% |
[ 7.5% - 8.0% ] 7.58% | 132 | 6.0% |
[ 9.5% - 10.0% ] 9.92% | 524 | 13.7% |