Delaware Receiving Food Stamps
COMPARE
Delaware
Select to Compare
Receiving Food Stamps
Delaware Receiving Food Stamps
12.2%
PUBLIC INCOME | FOOD STAMPS
26.1/ 100
METRIC RATING
197th/ 347
METRIC RANK
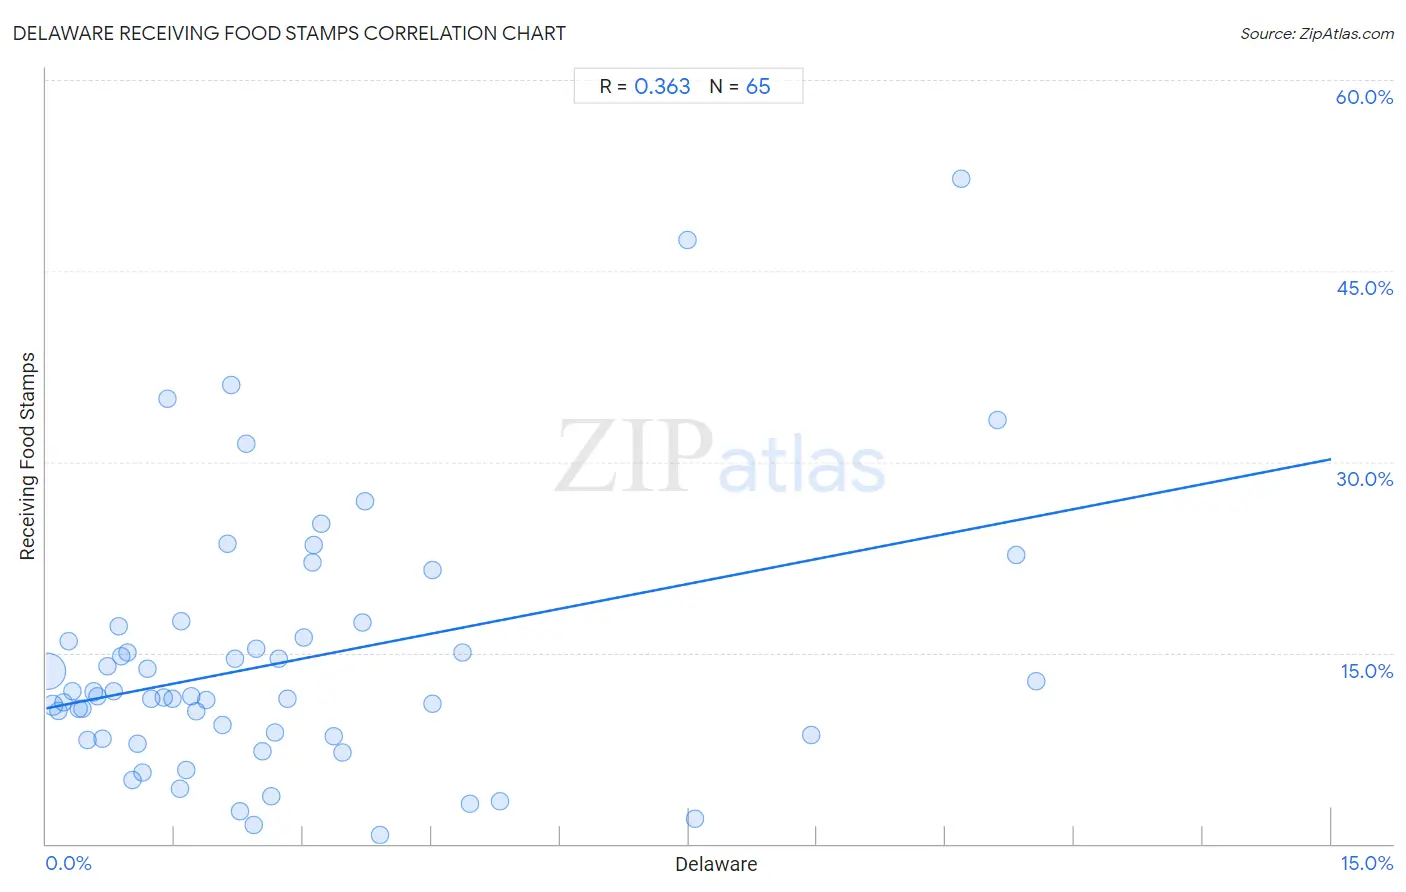
Delaware Receiving Food Stamps Correlation Chart
The statistical analysis conducted on geographies consisting of 96,117,712 people shows a mild positive correlation between the proportion of Delaware and percentage of population receiving government assistance and/or food stamps in the United States with a correlation coefficient (R) of 0.363 and weighted average of 12.2%. On average, for every 1% (one percent) increase in Delaware within a typical geography, there is an increase of 1.3% in percentage of population receiving government assistance and/or food stamps.
It is essential to understand that the correlation between the percentage of Delaware and percentage of population receiving government assistance and/or food stamps does not imply a direct cause-and-effect relationship. It remains uncertain whether the presence of Delaware influences an upward or downward trend in the level of percentage of population receiving government assistance and/or food stamps within an area, or if Delaware simply ended up residing in those areas with higher or lower levels of percentage of population receiving government assistance and/or food stamps due to other factors.
Demographics Similar to Delaware by Receiving Food Stamps
In terms of receiving food stamps, the demographic groups most similar to Delaware are Iraqi (12.2%, a difference of 0.080%), American (12.2%, a difference of 0.11%), Immigrants from Costa Rica (12.2%, a difference of 0.13%), Immigrants from Sudan (12.1%, a difference of 0.17%), and Portuguese (12.2%, a difference of 0.18%).
| Demographics | Rating | Rank | Receiving Food Stamps |
| Immigrants from Peru | 32.2 /100 | #190 | Fair 12.0% |
| Venezuelans | 32.1 /100 | #191 | Fair 12.0% |
| Samoans | 31.0 /100 | #192 | Fair 12.1% |
| Immigrants from Fiji | 27.8 /100 | #193 | Fair 12.1% |
| Immigrants from Sudan | 27.1 /100 | #194 | Fair 12.1% |
| Americans | 26.7 /100 | #195 | Fair 12.2% |
| Iraqis | 26.6 /100 | #196 | Fair 12.2% |
| Delaware | 26.1 /100 | #197 | Fair 12.2% |
| Immigrants from Costa Rica | 25.4 /100 | #198 | Fair 12.2% |
| Portuguese | 25.1 /100 | #199 | Fair 12.2% |
| Sierra Leoneans | 23.6 /100 | #200 | Fair 12.2% |
| Ugandans | 22.5 /100 | #201 | Fair 12.2% |
| Immigrants from Venezuela | 20.1 /100 | #202 | Fair 12.3% |
| Shoshone | 17.7 /100 | #203 | Poor 12.4% |
| Nonimmigrants | 17.6 /100 | #204 | Poor 12.4% |
Delaware Receiving Food Stamps Correlation Summary
| Measurement | Delaware Data | Receiving Food Stamps Data |
| Minimum | 0.012% | 0.70% |
| Maximum | 11.6% | 52.2% |
| Range | 11.5% | 51.5% |
| Mean | 2.8% | 14.3% |
| Median | 2.1% | 11.6% |
| Interquartile 25% (IQ1) | 0.91% | 8.4% |
| Interquartile 75% (IQ3) | 3.4% | 16.7% |
| Interquartile Range (IQR) | 2.5% | 8.3% |
| Standard Deviation (Sample) | 2.8% | 10.1% |
| Standard Deviation (Population) | 2.8% | 10.1% |
Correlation Details
| Delaware Percentile | Sample Size | Receiving Food Stamps |
[ 0.0% - 0.5% ] 0.012% | 80,443,018 | 13.5% |
[ 0.0% - 0.5% ] 0.079% | 8,445,652 | 10.9% |
[ 0.0% - 0.5% ] 0.14% | 2,680,532 | 10.5% |
[ 0.0% - 0.5% ] 0.20% | 1,565,372 | 11.1% |
[ 0.0% - 0.5% ] 0.26% | 713,753 | 15.9% |
[ 0.0% - 0.5% ] 0.31% | 473,580 | 12.0% |
[ 0.0% - 0.5% ] 0.37% | 411,610 | 10.6% |
[ 0.0% - 0.5% ] 0.43% | 293,341 | 10.6% |
[ 0.0% - 0.5% ] 0.49% | 189,758 | 8.2% |
[ 0.5% - 1.0% ] 0.55% | 190,770 | 11.9% |
[ 0.5% - 1.0% ] 0.60% | 155,173 | 11.6% |
[ 0.5% - 1.0% ] 0.66% | 68,530 | 8.3% |
[ 0.5% - 1.0% ] 0.72% | 91,561 | 13.9% |
[ 0.5% - 1.0% ] 0.79% | 60,100 | 12.0% |
[ 0.5% - 1.0% ] 0.84% | 14,976 | 17.1% |
[ 0.5% - 1.0% ] 0.88% | 19,518 | 14.7% |
[ 0.5% - 1.0% ] 0.94% | 21,424 | 15.0% |
[ 1.0% - 1.5% ] 1.01% | 16,457 | 5.0% |
[ 1.0% - 1.5% ] 1.06% | 49,209 | 7.8% |
[ 1.0% - 1.5% ] 1.13% | 11,869 | 5.6% |
[ 1.0% - 1.5% ] 1.18% | 39,987 | 13.8% |
[ 1.0% - 1.5% ] 1.23% | 23,772 | 11.4% |
[ 1.0% - 1.5% ] 1.38% | 5,818 | 11.5% |
[ 1.0% - 1.5% ] 1.42% | 3,379 | 35.0% |
[ 1.0% - 1.5% ] 1.48% | 8,780 | 11.4% |
[ 1.5% - 2.0% ] 1.56% | 1,541 | 4.3% |
[ 1.5% - 2.0% ] 1.57% | 1,525 | 17.4% |
[ 1.5% - 2.0% ] 1.64% | 35,349 | 5.8% |
[ 1.5% - 2.0% ] 1.70% | 2,239 | 11.6% |
[ 1.5% - 2.0% ] 1.76% | 6,031 | 10.4% |
[ 1.5% - 2.0% ] 1.87% | 9,024 | 11.3% |
[ 2.0% - 2.5% ] 2.06% | 2,135 | 9.3% |
[ 2.0% - 2.5% ] 2.12% | 2,450 | 23.6% |
[ 2.0% - 2.5% ] 2.16% | 2,917 | 36.0% |
[ 2.0% - 2.5% ] 2.20% | 12,277 | 14.5% |
[ 2.0% - 2.5% ] 2.26% | 1,373 | 2.6% |
[ 2.0% - 2.5% ] 2.34% | 3,034 | 31.5% |
[ 2.0% - 2.5% ] 2.42% | 207 | 1.5% |
[ 2.0% - 2.5% ] 2.45% | 4,238 | 15.3% |
[ 2.5% - 3.0% ] 2.53% | 3,914 | 7.3% |
[ 2.5% - 3.0% ] 2.63% | 1,216 | 3.7% |
[ 2.5% - 3.0% ] 2.67% | 375 | 8.7% |
[ 2.5% - 3.0% ] 2.72% | 1,177 | 14.5% |
[ 2.5% - 3.0% ] 2.82% | 3,194 | 11.4% |
[ 3.0% - 3.5% ] 3.00% | 1,499 | 16.2% |
[ 3.0% - 3.5% ] 3.11% | 2,315 | 22.1% |
[ 3.0% - 3.5% ] 3.12% | 2,528 | 23.5% |
[ 3.0% - 3.5% ] 3.21% | 436 | 25.1% |
[ 3.0% - 3.5% ] 3.36% | 2,114 | 8.5% |
[ 3.0% - 3.5% ] 3.46% | 4,475 | 7.1% |
[ 3.5% - 4.0% ] 3.69% | 1,057 | 17.3% |
[ 3.5% - 4.0% ] 3.72% | 1,938 | 26.9% |
[ 3.5% - 4.0% ] 3.89% | 822 | 0.70% |
[ 4.5% - 5.0% ] 4.50% | 222 | 21.5% |
[ 4.5% - 5.0% ] 4.51% | 532 | 11.0% |
[ 4.5% - 5.0% ] 4.86% | 2,303 | 15.1% |
[ 4.5% - 5.0% ] 4.94% | 587 | 3.1% |
[ 5.0% - 5.5% ] 5.30% | 132 | 3.3% |
[ 7.0% - 7.5% ] 7.49% | 2,002 | 47.4% |
[ 7.5% - 8.0% ] 7.58% | 132 | 2.0% |
[ 8.5% - 9.0% ] 8.93% | 929 | 8.5% |
[ 10.5% - 11.0% ] 10.68% | 702 | 52.2% |
[ 11.0% - 11.5% ] 11.11% | 18 | 33.3% |
[ 11.0% - 11.5% ] 11.32% | 468 | 22.7% |
[ 11.5% - 12.0% ] 11.56% | 346 | 12.8% |