Delaware Disability Age Under 5
COMPARE
Delaware
Select to Compare
Disability Age Under 5
Delaware Disability Age Under 5
1.5%
DISABILITY | AGE UNDER 5
0.0/ 100
METRIC RATING
283rd/ 347
METRIC RANK
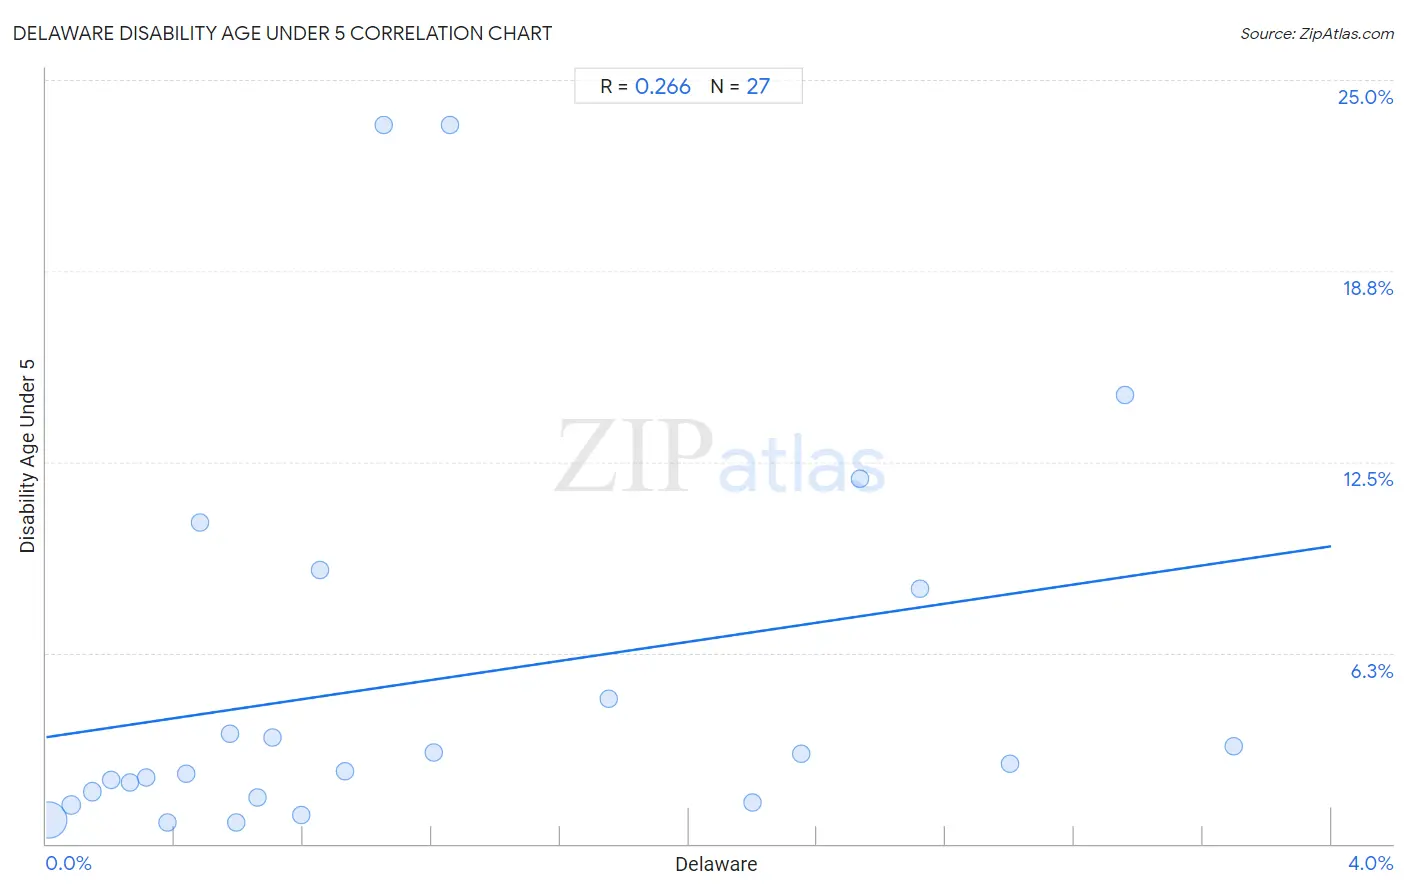
Delaware Disability Age Under 5 Correlation Chart
The statistical analysis conducted on geographies consisting of 72,236,656 people shows a weak positive correlation between the proportion of Delaware and percentage of population with a disability under the age of 5 in the United States with a correlation coefficient (R) of 0.266 and weighted average of 1.5%. On average, for every 1% (one percent) increase in Delaware within a typical geography, there is an increase of 1.6% in percentage of population with a disability under the age of 5.
It is essential to understand that the correlation between the percentage of Delaware and percentage of population with a disability under the age of 5 does not imply a direct cause-and-effect relationship. It remains uncertain whether the presence of Delaware influences an upward or downward trend in the level of percentage of population with a disability under the age of 5 within an area, or if Delaware simply ended up residing in those areas with higher or lower levels of percentage of population with a disability under the age of 5 due to other factors.
Demographics Similar to Delaware by Disability Age Under 5
In terms of disability age under 5, the demographic groups most similar to Delaware are European (1.5%, a difference of 0.050%), Cheyenne (1.5%, a difference of 0.19%), Czechoslovakian (1.5%, a difference of 0.54%), Croatian (1.5%, a difference of 1.2%), and Tlingit-Haida (1.5%, a difference of 1.5%).
| Demographics | Rating | Rank | Disability Age Under 5 |
| Greeks | 0.0 /100 | #276 | Tragic 1.5% |
| Canadians | 0.0 /100 | #277 | Tragic 1.5% |
| Kiowa | 0.0 /100 | #278 | Tragic 1.5% |
| Danes | 0.0 /100 | #279 | Tragic 1.5% |
| British | 0.0 /100 | #280 | Tragic 1.5% |
| Czechoslovakians | 0.0 /100 | #281 | Tragic 1.5% |
| Cheyenne | 0.0 /100 | #282 | Tragic 1.5% |
| Delaware | 0.0 /100 | #283 | Tragic 1.5% |
| Europeans | 0.0 /100 | #284 | Tragic 1.5% |
| Croatians | 0.0 /100 | #285 | Tragic 1.5% |
| Tlingit-Haida | 0.0 /100 | #286 | Tragic 1.5% |
| Scandinavians | 0.0 /100 | #287 | Tragic 1.5% |
| Estonians | 0.0 /100 | #288 | Tragic 1.5% |
| Hungarians | 0.0 /100 | #289 | Tragic 1.5% |
| Czechs | 0.0 /100 | #290 | Tragic 1.5% |
Delaware Disability Age Under 5 Correlation Summary
| Measurement | Delaware Data | Disability Age Under 5 Data |
| Minimum | 0.0088% | 0.70% |
| Maximum | 3.7% | 23.5% |
| Range | 3.7% | 22.8% |
| Mean | 1.2% | 5.4% |
| Median | 0.79% | 2.6% |
| Interquartile 25% (IQ1) | 0.38% | 1.5% |
| Interquartile 75% (IQ3) | 2.2% | 8.3% |
| Interquartile Range (IQR) | 1.8% | 6.8% |
| Standard Deviation (Sample) | 1.1% | 6.4% |
| Standard Deviation (Population) | 1.1% | 6.3% |
Correlation Details
| Delaware Percentile | Sample Size | Disability Age Under 5 |
[ 0.0% - 0.5% ] 0.0088% | 65,072,691 | 0.79% |
[ 0.0% - 0.5% ] 0.078% | 4,406,953 | 1.3% |
[ 0.0% - 0.5% ] 0.14% | 1,225,500 | 1.7% |
[ 0.0% - 0.5% ] 0.20% | 633,150 | 2.1% |
[ 0.0% - 0.5% ] 0.26% | 269,521 | 2.0% |
[ 0.0% - 0.5% ] 0.31% | 172,200 | 2.2% |
[ 0.0% - 0.5% ] 0.38% | 93,251 | 0.70% |
[ 0.0% - 0.5% ] 0.44% | 111,144 | 2.3% |
[ 0.0% - 0.5% ] 0.48% | 6,699 | 10.5% |
[ 0.5% - 1.0% ] 0.57% | 47,633 | 3.6% |
[ 0.5% - 1.0% ] 0.59% | 52,245 | 0.70% |
[ 0.5% - 1.0% ] 0.66% | 46,167 | 1.5% |
[ 0.5% - 1.0% ] 0.70% | 34,634 | 3.5% |
[ 0.5% - 1.0% ] 0.79% | 28,787 | 0.95% |
[ 0.5% - 1.0% ] 0.85% | 3,642 | 9.0% |
[ 0.5% - 1.0% ] 0.93% | 7,622 | 2.4% |
[ 1.0% - 1.5% ] 1.05% | 286 | 23.5% |
[ 1.0% - 1.5% ] 1.21% | 2,900 | 3.0% |
[ 1.0% - 1.5% ] 1.26% | 239 | 23.5% |
[ 1.5% - 2.0% ] 1.75% | 800 | 4.8% |
[ 2.0% - 2.5% ] 2.20% | 12,277 | 1.4% |
[ 2.0% - 2.5% ] 2.35% | 1,914 | 2.9% |
[ 2.5% - 3.0% ] 2.53% | 3,436 | 11.9% |
[ 2.5% - 3.0% ] 2.72% | 478 | 8.3% |
[ 2.5% - 3.0% ] 3.00% | 567 | 2.6% |
[ 3.0% - 3.5% ] 3.36% | 1,460 | 14.7% |
[ 3.5% - 4.0% ] 3.70% | 460 | 3.2% |