Delaware Wage/Income Gap

COMPARE

Delaware
Race
Ancestry
AfghanAfricanAlaska NativeAlaskan AthabascanAlbanianAleutAlsatianAmericanApacheArabArapahoArgentineanArmenianAssyrian/Chaldean/SyriacAustralianAustrianBahamianBangladeshiBarbadianBasqueBelgianBelizeanBermudanBhutaneseBlackfeetBolivianBrazilianBritishBritish West IndianBulgarianBurmeseCajunCambodianCanadianCape VerdeanCarpatho RusynCelticCentral AmericanCentral American IndianCherokeeCheyenneChickasawChileanChineseChippewaChoctawColombianColvilleComancheCosta RicanCreeCreekCroatianCrowCubanCypriotCzechCzechoslovakianDanishDelawareDominicanDutchDutch West IndianEastern EuropeanEcuadorianEgyptianEnglishEstonianEthiopianEuropeanFijianFilipinoFinnishFrenchFrench American IndianFrench CanadianGermanGerman RussianGhanaianGreekGuamanian/ChamorroGuatemalanGuyaneseHaitianHmongHonduranHopiHoumaHungarianIcelanderIndian (Asian)IndonesianInupiatIranianIraqiIrishIroquoisIsraeliItalianJamaicanJapaneseJordanianKenyanKiowaKoreanLaotianLatvianLebaneseLiberianLithuanianLumbeeLuxembourgerMacedonianMalaysianMalteseMarshalleseMenomineeMexicanMexican American IndianMongolianMoroccanNative HawaiianNavajoNepaleseNew ZealanderNicaraguanNigerianNorthern EuropeanNorwegianOkinawanOsageOttawaPaiutePakistaniPalestinianPanamanianParaguayanPennsylvania GermanPeruvianPimaPolishPortuguesePotawatomiPuebloPuerto RicanPuget Sound SalishRomanianRussianSalvadoranSamoanScandinavianScotch-IrishScottishSeminoleSenegaleseSerbianShoshoneSierra LeoneanSiouxSlavicSlovakSloveneSomaliSouth AfricanSouth AmericanSouth American IndianSoviet UnionSpaniardSpanishSpanish AmericanSpanish American IndianSri LankanSubsaharan AfricanSudaneseSwedishSwissSyrianTaiwaneseThaiTlingit-HaidaTohono O'OdhamTonganTrinidadian and TobagonianTsimshianTurkishU.S. Virgin IslanderUgandanUkrainianUruguayanUteVenezuelanVietnameseWelshWest IndianYakamaYaquiYugoslavianYumanYup'ikZimbabwean
Immigration
NonimmigrantsImmigrantsAfghanistanAfricaAlbaniaArgentinaArmeniaAsiaAustraliaAustriaBahamasBangladeshBarbadosBelarusBelgiumBelizeBoliviaBosnia and HerzegovinaBrazilBulgariaBurma/MyanmarCabo VerdeCambodiaCameroonCanadaCaribbeanCentral AmericaChileChinaColombiaCongoCosta RicaCroatiaCubaCzechoslovakiaDenmarkDominicaDominican RepublicEastern AfricaEastern AsiaEastern EuropeEcuadorEgyptEl SalvadorEnglandEritreaEthiopiaEuropeFijiFranceGermanyGhanaGreeceGrenadaGuatemalaGuyanaHaitiHondurasHong KongHungaryIndiaIndonesiaIranIraqIrelandIsraelItalyJamaicaJapanJordanKazakhstanKenyaKoreaKuwaitLaosLatin AmericaLatviaLebanonLiberiaLithuaniaMalaysiaMexicoMicronesiaMiddle AfricaMoldovaMoroccoNepalNetherlandsNicaraguaNigeriaNorth AmericaNorth MacedoniaNorthern AfricaNorthern EuropeNorwayOceaniaPakistanPanamaPeruPhilippinesPolandPortugalRomaniaRussiaSaudi ArabiaScotlandSenegalSerbiaSierra LeoneSingaporeSomaliaSouth AfricaSouth AmericaSouth Central AsiaSouth Eastern AsiaSouthern EuropeSpainSri LankaSt. Vincent and the GrenadinesSudanSwedenSwitzerlandSyriaTaiwanThailandTrinidad and TobagoTurkeyUgandaUkraineUruguayUzbekistanVenezuelaVietnamWest IndiesWestern AfricaWestern AsiaWestern EuropeYemenZaireZimbabweAzores
Select to Compare
Race
Ancestry
AfghanAfricanAlaska NativeAlaskan AthabascanAlbanianAleutAlsatianAmericanApacheArabArapahoArgentineanArmenianAssyrian/Chaldean/SyriacAustralianAustrianBahamianBangladeshiBarbadianBasqueBelgianBelizeanBermudanBhutaneseBlackfeetBolivianBrazilianBritishBritish West IndianBulgarianBurmeseCajunCambodianCanadianCape VerdeanCarpatho RusynCelticCentral AmericanCentral American IndianCherokeeCheyenneChickasawChileanChineseChippewaChoctawColombianColvilleComancheCosta RicanCreeCreekCroatianCrowCubanCypriotCzechCzechoslovakianDanishDominicanDutchDutch West IndianEastern EuropeanEcuadorianEgyptianEnglishEstonianEthiopianEuropeanFijianFilipinoFinnishFrenchFrench American IndianFrench CanadianGermanGerman RussianGhanaianGreekGuamanian/ChamorroGuatemalanGuyaneseHaitianHmongHonduranHopiHoumaHungarianIcelanderIndian (Asian)IndonesianInupiatIranianIraqiIrishIroquoisIsraeliItalianJamaicanJapaneseJordanianKenyanKiowaKoreanLaotianLatvianLebaneseLiberianLithuanianLumbeeLuxembourgerMacedonianMalaysianMalteseMarshalleseMenomineeMexicanMexican American IndianMongolianMoroccanNative HawaiianNavajoNepaleseNew ZealanderNicaraguanNigerianNorthern EuropeanNorwegianOkinawanOsageOttawaPaiutePakistaniPalestinianPanamanianParaguayanPennsylvania GermanPeruvianPimaPolishPortuguesePotawatomiPuebloPuerto RicanPuget Sound SalishRomanianRussianSalvadoranSamoanScandinavianScotch-IrishScottishSeminoleSenegaleseSerbianShoshoneSierra LeoneanSiouxSlavicSlovakSloveneSomaliSouth AfricanSouth AmericanSouth American IndianSoviet UnionSpaniardSpanishSpanish AmericanSpanish American IndianSri LankanSubsaharan AfricanSudaneseSwedishSwissSyrianTaiwaneseThaiTlingit-HaidaTohono O'OdhamTonganTrinidadian and TobagonianTsimshianTurkishU.S. Virgin IslanderUgandanUkrainianUruguayanUteVenezuelanVietnameseWelshWest IndianYakamaYaquiYugoslavianYumanYup'ikZimbabwean
Immigration
NonimmigrantsImmigrantsAfghanistanAfricaAlbaniaArgentinaArmeniaAsiaAustraliaAustriaBahamasBangladeshBarbadosBelarusBelgiumBelizeBoliviaBosnia and HerzegovinaBrazilBulgariaBurma/MyanmarCabo VerdeCambodiaCameroonCanadaCaribbeanCentral AmericaChileChinaColombiaCongoCosta RicaCroatiaCubaCzechoslovakiaDenmarkDominicaDominican RepublicEastern AfricaEastern AsiaEastern EuropeEcuadorEgyptEl SalvadorEnglandEritreaEthiopiaEuropeFijiFranceGermanyGhanaGreeceGrenadaGuatemalaGuyanaHaitiHondurasHong KongHungaryIndiaIndonesiaIranIraqIrelandIsraelItalyJamaicaJapanJordanKazakhstanKenyaKoreaKuwaitLaosLatin AmericaLatviaLebanonLiberiaLithuaniaMalaysiaMexicoMicronesiaMiddle AfricaMoldovaMoroccoNepalNetherlandsNicaraguaNigeriaNorth AmericaNorth MacedoniaNorthern AfricaNorthern EuropeNorwayOceaniaPakistanPanamaPeruPhilippinesPolandPortugalRomaniaRussiaSaudi ArabiaScotlandSenegalSerbiaSierra LeoneSingaporeSomaliaSouth AfricaSouth AmericaSouth Central AsiaSouth Eastern AsiaSouthern EuropeSpainSri LankaSt. Vincent and the GrenadinesSudanSwedenSwitzerlandSyriaTaiwanThailandTrinidad and TobagoTurkeyUgandaUkraineUruguayUzbekistanVenezuelaVietnamWest IndiesWestern AfricaWestern AsiaWestern EuropeYemenZaireZimbabweAzores
Wage/Income Gap
Income
Poverty
Unemployment
Labor Participation
Family Structure
Vehicle Availability
Education Level
Disability

Delaware Wage/Income Gap
Fair

26.3%
WAGE/INCOME GAP
20.9/ 100
METRIC RATING
200th/ 347
METRIC RANK

Delaware Wage/Income Gap Correlation Chart

The statistical analysis conducted on geographies consisting of 96,192,604 people shows a poor positive correlation between the proportion of Delaware and wage/income gap percentage in the United States with a correlation coefficient (R) of 0.105 and weighted average of 26.3%. On average, for every 1% (one percent) increase in Delaware within a typical geography, there is an increase of 0.74% in wage/income gap percentage.
Delaware Wage/Income Gap
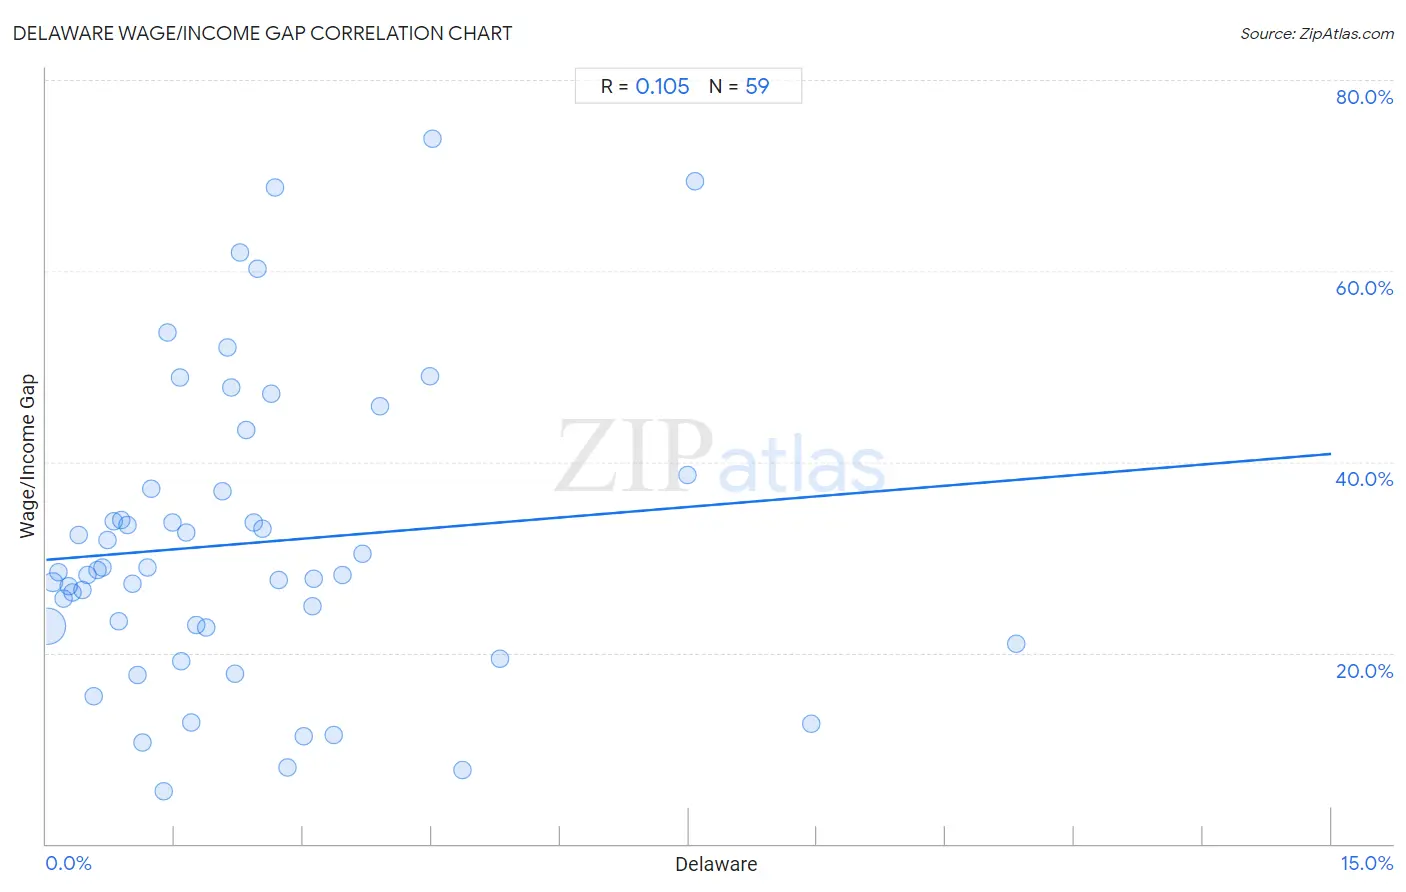
It is essential to understand that the correlation between the percentage of Delaware and wage/income gap percentage does not imply a direct cause-and-effect relationship. It remains uncertain whether the presence of Delaware influences an upward or downward trend in the level of wage/income gap percentage within an area, or if Delaware simply ended up residing in those areas with higher or lower levels of wage/income gap percentage due to other factors.

Demographics Similar to Delaware by Wage/Income Gap

In terms of wage/income gap, the demographic groups most similar to Delaware are Dutch West Indian (26.3%, a difference of 0.010%), Venezuelan (26.3%, a difference of 0.050%), Zimbabwean (26.3%, a difference of 0.070%), Immigrants from Western Asia (26.3%, a difference of 0.080%), and Immigrants from Malaysia (26.3%, a difference of 0.12%).
DemographicsRating | RankWage/Income Gap
Immigrants from Jordan
22.4
/100
|
#193
Fair
26.3%
Chileans
22.3
/100
|
#194
Fair
26.3%
Immigrants from Malaysia
22.2
/100
|
#195
Fair
26.3%
Immigrants from Western Asia
21.7
/100
|
#196
Fair
26.3%
Zimbabweans
21.6
/100
|
#197
Fair
26.3%
Venezuelans
21.5
/100
|
#198
Fair
26.3%
Dutch West Indians
21.0
/100
|
#199
Fair
26.3%
Delaware
20.9
/100
|
#200
Fair
26.3%
Immigrants from Syria
19.3
/100
|
#201
Poor
26.4%
Laotians
19.2
/100
|
#202
Poor
26.4%
Immigrants from Eastern Europe
19.2
/100
|
#203
Poor
26.4%
Immigrants from Russia
19.0
/100
|
#204
Poor
26.4%
Immigrants from Southern Europe
17.3
/100
|
#205
Poor
26.4%
Indians (Asian)
16.5
/100
|
#206
Poor
26.4%
Immigrants from Italy
15.8
/100
|
#207
Poor
26.5%

Delaware Wage/Income Gap Correlation Summary

MeasurementDelaware DataWage/Income Gap Data
Minimum0.012%5.5%
Maximum11.3%73.9%
Range11.3%68.4%
Mean2.3%31.5%
Median1.8%28.4%
Interquartile 25% (IQ1)0.84%22.7%
Interquartile 75% (IQ3)3.0%37.2%
Interquartile Range (IQR)2.2%14.5%
Standard Deviation (Sample)2.2%15.7%
Standard Deviation (Population)2.2%15.5%

Correlation Details

Delaware PercentileSample SizeWage/Income Gap
[
0.0%
-
0.5%
]
0.012%
80,511,82422.8%
[
0.0%
-
0.5%
]
0.079%
8,451,35527.4%
[
0.0%
-
0.5%
]
0.14%
2,676,41228.4%
[
0.0%
-
0.5%
]
0.20%
1,580,62825.6%
[
0.0%
-
0.5%
]
0.26%
716,20926.9%
[
0.0%
-
0.5%
]
0.31%
480,25726.3%
[
0.0%
-
0.5%
]
0.37%
406,06332.3%
[
0.0%
-
0.5%
]
0.43%
292,84826.6%
[
0.0%
-
0.5%
]
0.49%
189,75828.1%
[
0.5%
-
1.0%
]
0.55%
190,95015.5%
[
0.5%
-
1.0%
]
0.60%
151,94528.7%
[
0.5%
-
1.0%
]
0.66%
68,53028.9%
[
0.5%
-
1.0%
]
0.72%
91,72531.8%
[
0.5%
-
1.0%
]
0.79%
63,90133.8%
[
0.5%
-
1.0%
]
0.84%
15,71623.3%
[
0.5%
-
1.0%
]
0.88%
19,28933.9%
[
0.5%
-
1.0%
]
0.94%
21,42433.4%
[
1.0%
-
1.5%
]
1.01%
15,44127.3%
[
1.0%
-
1.5%
]
1.06%
48,35817.7%
[
1.0%
-
1.5%
]
1.13%
11,86910.6%
[
1.0%
-
1.5%
]
1.18%
39,98728.9%
[
1.0%
-
1.5%
]
1.23%
22,97937.2%
[
1.0%
-
1.5%
]
1.38%
5,8185.5%
[
1.0%
-
1.5%
]
1.42%
3,37953.5%
[
1.0%
-
1.5%
]
1.48%
8,78033.7%
[
1.5%
-
2.0%
]
1.56%
1,54148.8%
[
1.5%
-
2.0%
]
1.57%
1,52519.1%
[
1.5%
-
2.0%
]
1.64%
33,65832.6%
[
1.5%
-
2.0%
]
1.69%
1,95012.7%
[
1.5%
-
2.0%
]
1.75%
4,91222.9%
[
1.5%
-
2.0%
]
1.87%
9,02422.7%
[
2.0%
-
2.5%
]
2.06%
2,13537.0%
[
2.0%
-
2.5%
]
2.12%
2,45052.0%
[
2.0%
-
2.5%
]
2.16%
2,91747.8%
[
2.0%
-
2.5%
]
2.20%
12,27717.9%
[
2.0%
-
2.5%
]
2.26%
1,37361.9%
[
2.0%
-
2.5%
]
2.34%
3,03443.3%
[
2.0%
-
2.5%
]
2.42%
20733.6%
[
2.0%
-
2.5%
]
2.47%
1,94660.2%
[
2.5%
-
3.0%
]
2.53%
3,91433.0%
[
2.5%
-
3.0%
]
2.63%
1,21647.1%
[
2.5%
-
3.0%
]
2.67%
37568.7%
[
2.5%
-
3.0%
]
2.72%
1,17727.6%
[
2.5%
-
3.0%
]
2.82%
3,1947.9%
[
3.0%
-
3.5%
]
3.00%
1,49911.3%
[
3.0%
-
3.5%
]
3.11%
2,31524.9%
[
3.0%
-
3.5%
]
3.12%
22427.8%
[
3.0%
-
3.5%
]
3.36%
1,46011.4%
[
3.0%
-
3.5%
]
3.46%
4,47528.1%
[
3.5%
-
4.0%
]
3.70%
46030.4%
[
3.5%
-
4.0%
]
3.89%
82245.8%
[
4.0%
-
4.5%
]
4.48%
58149.0%
[
4.5%
-
5.0%
]
4.51%
53273.9%
[
4.5%
-
5.0%
]
4.86%
2,3037.8%
[
5.0%
-
5.5%
]
5.30%
13219.3%
[
7.0%
-
7.5%
]
7.49%
2,00238.6%
[
7.5%
-
8.0%
]
7.58%
13269.4%
[
8.5%
-
9.0%
]
8.93%
92912.6%
[
11.0%
-
11.5%
]
11.32%
46820.9%