Huntington, OR Map & Demographics
Huntington Map
Huntington Overview
$24,235
PER CAPITA INCOME
$40,000
AVG FAMILY INCOME
$33,000
AVG HOUSEHOLD INCOME
67.8%
WAGE / INCOME GAP [ % ]
32.2¢/ $1
WAGE / INCOME GAP [ $ ]
0.53
INEQUALITY / GINI INDEX
682
TOTAL POPULATION
387
MALE POPULATION
295
FEMALE POPULATION
131.19
MALES / 100 FEMALES
76.23
FEMALES / 100 MALES
50.2
MEDIAN AGE
3.3
AVG FAMILY SIZE
2.5
AVG HOUSEHOLD SIZE
230
LABOR FORCE [ PEOPLE ]
38.9%
PERCENT IN LABOR FORCE
7.0%
UNEMPLOYMENT RATE
Huntington Zip Codes
Huntington Area Codes
Income in Huntington
Income Overview in Huntington
Per Capita Income in Huntington is $24,235, while median incomes of families and households are $40,000 and $33,000 respectively.
| Characteristic | Number | Measure |
| Per Capita Income | 682 | $24,235 |
| Median Family Income | 148 | $40,000 |
| Mean Family Income | 148 | $73,975 |
| Median Household Income | 270 | $33,000 |
| Mean Household Income | 270 | $57,096 |
| Income Deficit | 148 | $0 |
| Wage / Income Gap (%) | 682 | 67.77% |
| Wage / Income Gap ($) | 682 | 32.23¢ per $1 |
| Gini / Inequality Index | 682 | 0.53 |
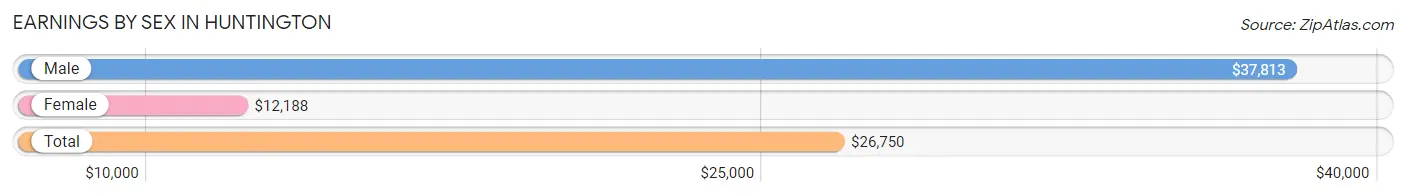
Earnings by Sex in Huntington
Average Earnings in Huntington are $26,750, $37,813 for men and $12,188 for women, a difference of 67.8%.
| Sex | Number | Average Earnings |
| Male | 122 (51.5%) | $37,813 |
| Female | 115 (48.5%) | $12,188 |
| Total | 237 (100.0%) | $26,750 |
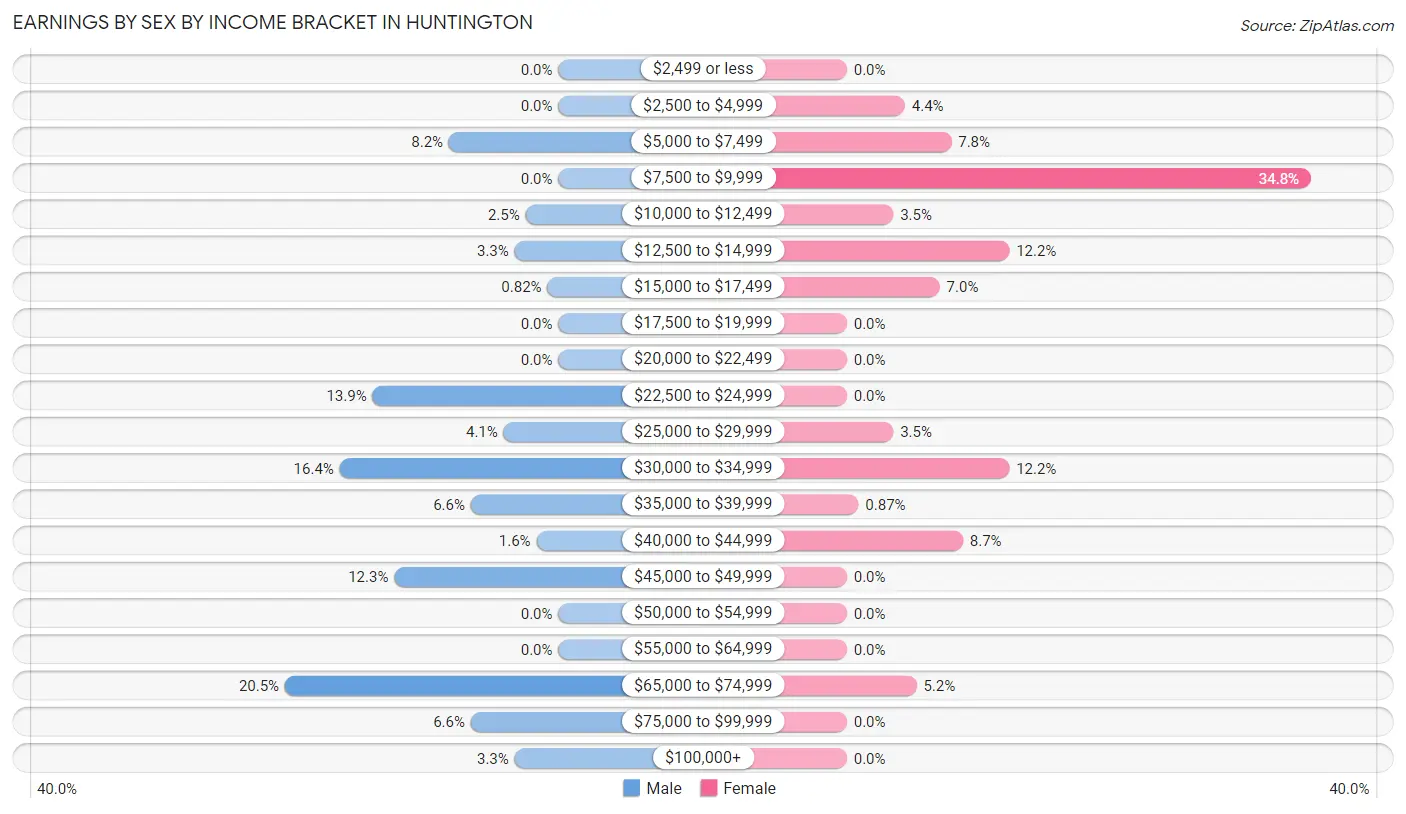
Earnings by Sex by Income Bracket in Huntington
The most common earnings brackets in Huntington are $65,000 to $74,999 for men (25 | 20.5%) and $7,500 to $9,999 for women (40 | 34.8%).
| Income | Male | Female |
| $2,499 or less | 0 (0.0%) | 0 (0.0%) |
| $2,500 to $4,999 | 0 (0.0%) | 5 (4.3%) |
| $5,000 to $7,499 | 10 (8.2%) | 9 (7.8%) |
| $7,500 to $9,999 | 0 (0.0%) | 40 (34.8%) |
| $10,000 to $12,499 | 3 (2.5%) | 4 (3.5%) |
| $12,500 to $14,999 | 4 (3.3%) | 14 (12.2%) |
| $15,000 to $17,499 | 1 (0.8%) | 8 (7.0%) |
| $17,500 to $19,999 | 0 (0.0%) | 0 (0.0%) |
| $20,000 to $22,499 | 0 (0.0%) | 0 (0.0%) |
| $22,500 to $24,999 | 17 (13.9%) | 0 (0.0%) |
| $25,000 to $29,999 | 5 (4.1%) | 4 (3.5%) |
| $30,000 to $34,999 | 20 (16.4%) | 14 (12.2%) |
| $35,000 to $39,999 | 8 (6.6%) | 1 (0.9%) |
| $40,000 to $44,999 | 2 (1.6%) | 10 (8.7%) |
| $45,000 to $49,999 | 15 (12.3%) | 0 (0.0%) |
| $50,000 to $54,999 | 0 (0.0%) | 0 (0.0%) |
| $55,000 to $64,999 | 0 (0.0%) | 0 (0.0%) |
| $65,000 to $74,999 | 25 (20.5%) | 6 (5.2%) |
| $75,000 to $99,999 | 8 (6.6%) | 0 (0.0%) |
| $100,000+ | 4 (3.3%) | 0 (0.0%) |
| Total | 122 (100.0%) | 115 (100.0%) |
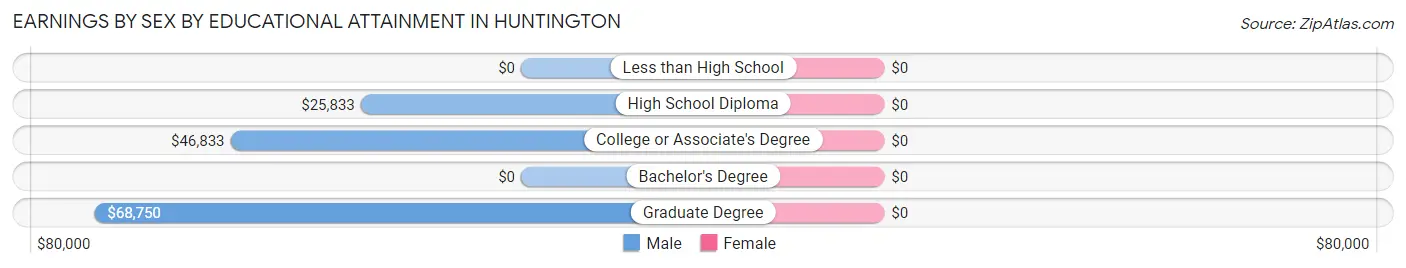
Earnings by Sex by Educational Attainment in Huntington
| Educational Attainment | Male Income | Female Income |
| Less than High School | - | - |
| High School Diploma | $25,833 | $0 |
| College or Associate's Degree | $46,833 | $0 |
| Bachelor's Degree | - | - |
| Graduate Degree | $68,750 | $0 |
| Total | $33,438 | $12,946 |
Family Income in Huntington
Family Income Brackets in Huntington
According to the Huntington family income data, there are 54 families falling into the $25,000 to $34,999 income range, which is the most common income bracket and makes up 36.5% of all families.
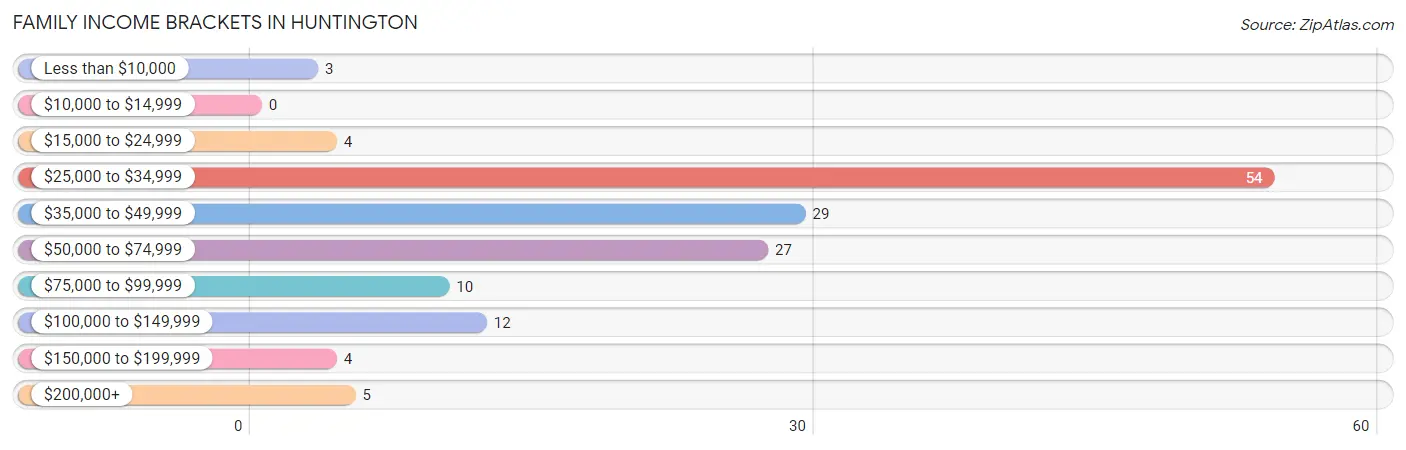
| Income Bracket | # Families | % Families |
| Less than $10,000 | 3 | 2.0% |
| $10,000 to $14,999 | 0 | 0.0% |
| $15,000 to $24,999 | 4 | 2.7% |
| $25,000 to $34,999 | 54 | 36.5% |
| $35,000 to $49,999 | 29 | 19.6% |
| $50,000 to $74,999 | 27 | 18.2% |
| $75,000 to $99,999 | 10 | 6.8% |
| $100,000 to $149,999 | 12 | 8.1% |
| $150,000 to $199,999 | 4 | 2.7% |
| $200,000+ | 5 | 3.4% |
Family Income by Famaliy Size in Huntington
4-person families (32 | 21.6%) account for the highest median family income in Huntington with $47,222 per family, while 2-person families (88 | 59.5%) have the highest median income of $14,939 per family member.
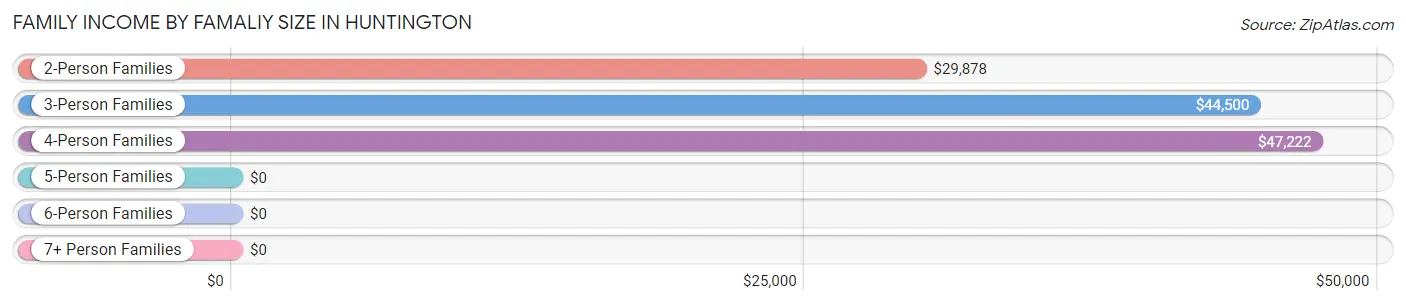
| Income Bracket | # Families | Median Income |
| 2-Person Families | 88 (59.5%) | $29,878 |
| 3-Person Families | 20 (13.5%) | $44,500 |
| 4-Person Families | 32 (21.6%) | $47,222 |
| 5-Person Families | 7 (4.7%) | $0 |
| 6-Person Families | 0 (0.0%) | $0 |
| 7+ Person Families | 1 (0.7%) | $0 |
| Total | 148 (100.0%) | $40,000 |
Family Income by Number of Earners in Huntington
The median family income in Huntington is $40,000, with families comprising 3+ earners (10) having the highest median family income of $143,214, while families with no earners (75) have the lowest median family income of $29,299, accounting for 6.8% and 50.7% of families, respectively.
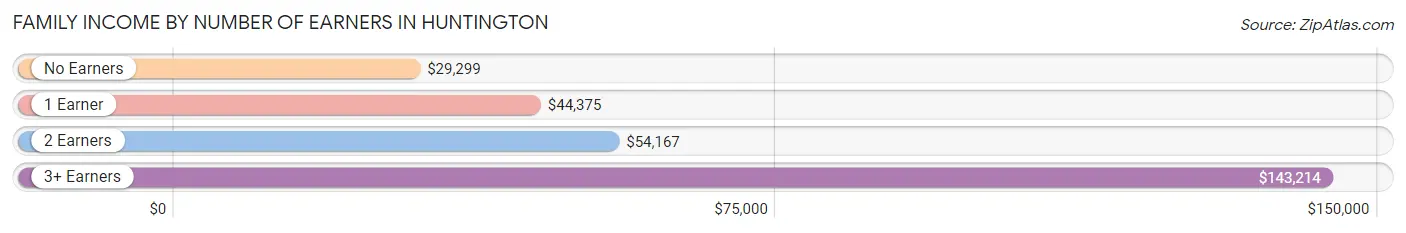
| Number of Earners | # Families | Median Income |
| No Earners | 75 (50.7%) | $29,299 |
| 1 Earner | 35 (23.6%) | $44,375 |
| 2 Earners | 28 (18.9%) | $54,167 |
| 3+ Earners | 10 (6.8%) | $143,214 |
| Total | 148 (100.0%) | $40,000 |
Household Income in Huntington
Household Income Brackets in Huntington
With 75 households falling in the category, the $25,000 to $34,999 income range is the most frequent in Huntington, accounting for 27.8% of all households. In contrast, only 4 households (1.5%) fall into the $150,000 to $199,999 income bracket, making it the least populous group.
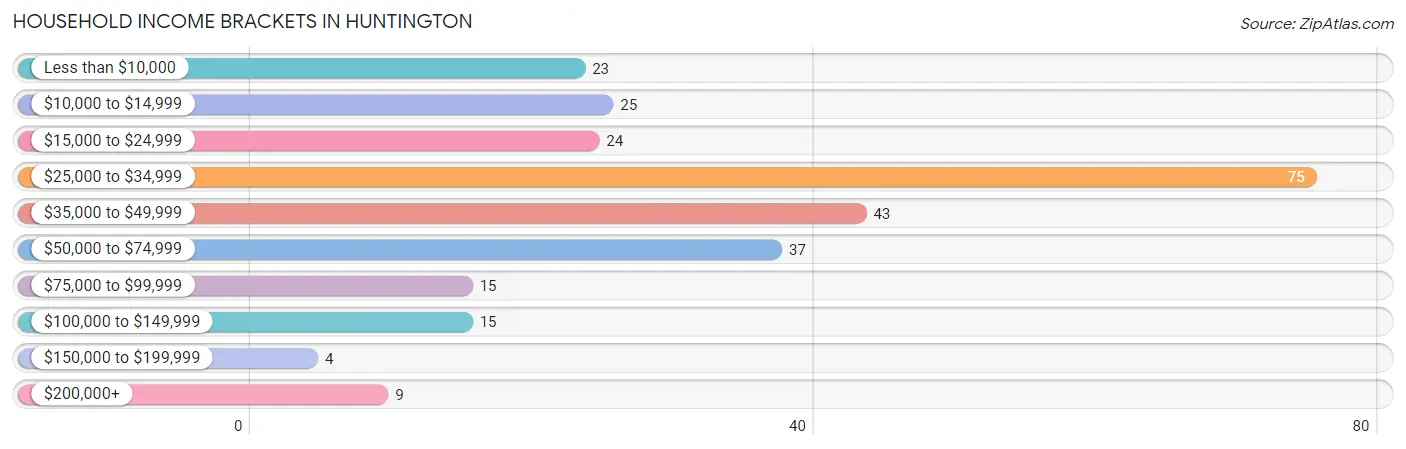
| Income Bracket | # Households | % Households |
| Less than $10,000 | 23 | 8.5% |
| $10,000 to $14,999 | 25 | 9.3% |
| $15,000 to $24,999 | 24 | 8.9% |
| $25,000 to $34,999 | 75 | 27.8% |
| $35,000 to $49,999 | 43 | 15.9% |
| $50,000 to $74,999 | 37 | 13.7% |
| $75,000 to $99,999 | 15 | 5.6% |
| $100,000 to $149,999 | 15 | 5.6% |
| $150,000 to $199,999 | 4 | 1.5% |
| $200,000+ | 9 | 3.3% |
Household Income by Householder Age in Huntington
The median household income in Huntington is $33,000, with the highest median household income of $47,813 found in the 25 to 44 years age bracket for the primary householder. A total of 58 households (21.5%) fall into this category. Meanwhile, the 15 to 24 years age bracket for the primary householder has the lowest median household income of $0, with 2 households (0.7%) in this group.
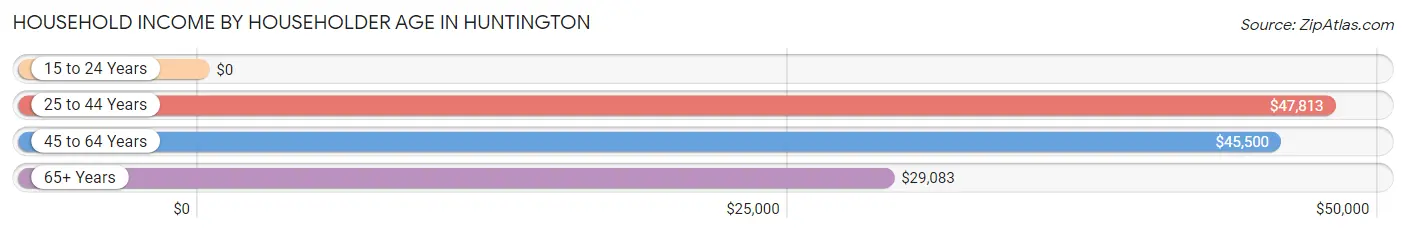
| Income Bracket | # Households | Median Income |
| 15 to 24 Years | 2 (0.7%) | $0 |
| 25 to 44 Years | 58 (21.5%) | $47,813 |
| 45 to 64 Years | 82 (30.4%) | $45,500 |
| 65+ Years | 128 (47.4%) | $29,083 |
| Total | 270 (100.0%) | $33,000 |
Poverty in Huntington
Income Below Poverty by Sex and Age in Huntington
With 11.6% poverty level for males and 16.7% for females among the residents of Huntington, 55 to 64 year old males and 15 year old females are the most vulnerable to poverty, with 13 males (36.1%) and 2 females (100.0%) in their respective age groups living below the poverty level.
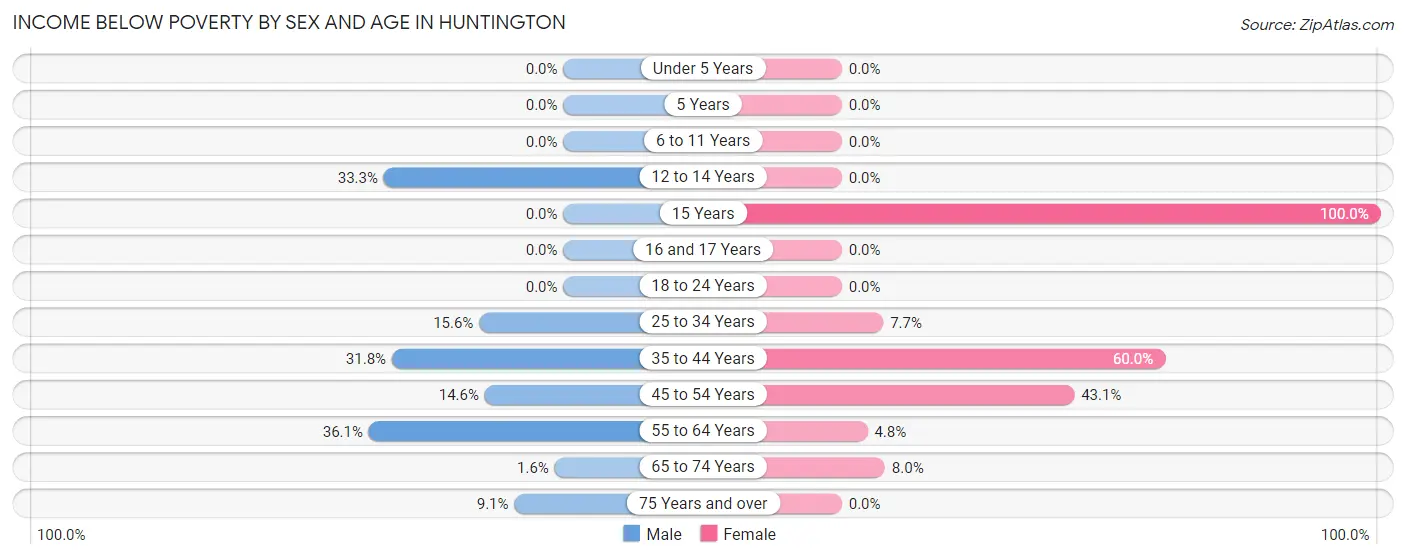
| Age Bracket | Male | Female |
| Under 5 Years | 0 (0.0%) | 0 (0.0%) |
| 5 Years | 0 (0.0%) | 0 (0.0%) |
| 6 to 11 Years | 0 (0.0%) | 0 (0.0%) |
| 12 to 14 Years | 2 (33.3%) | 0 (0.0%) |
| 15 Years | 0 (0.0%) | 2 (100.0%) |
| 16 and 17 Years | 0 (0.0%) | 0 (0.0%) |
| 18 to 24 Years | 0 (0.0%) | 0 (0.0%) |
| 25 to 34 Years | 10 (15.6%) | 3 (7.7%) |
| 35 to 44 Years | 7 (31.8%) | 12 (60.0%) |
| 45 to 54 Years | 7 (14.6%) | 22 (43.1%) |
| 55 to 64 Years | 13 (36.1%) | 1 (4.8%) |
| 65 to 74 Years | 1 (1.6%) | 8 (8.0%) |
| 75 Years and over | 4 (9.1%) | 0 (0.0%) |
| Total | 44 (11.6%) | 48 (16.7%) |
Income Above Poverty by Sex and Age in Huntington
According to the poverty statistics in Huntington, males aged under 5 years and females aged under 5 years are the age groups that are most secure financially, with 100.0% of males and 100.0% of females in these age groups living above the poverty line.
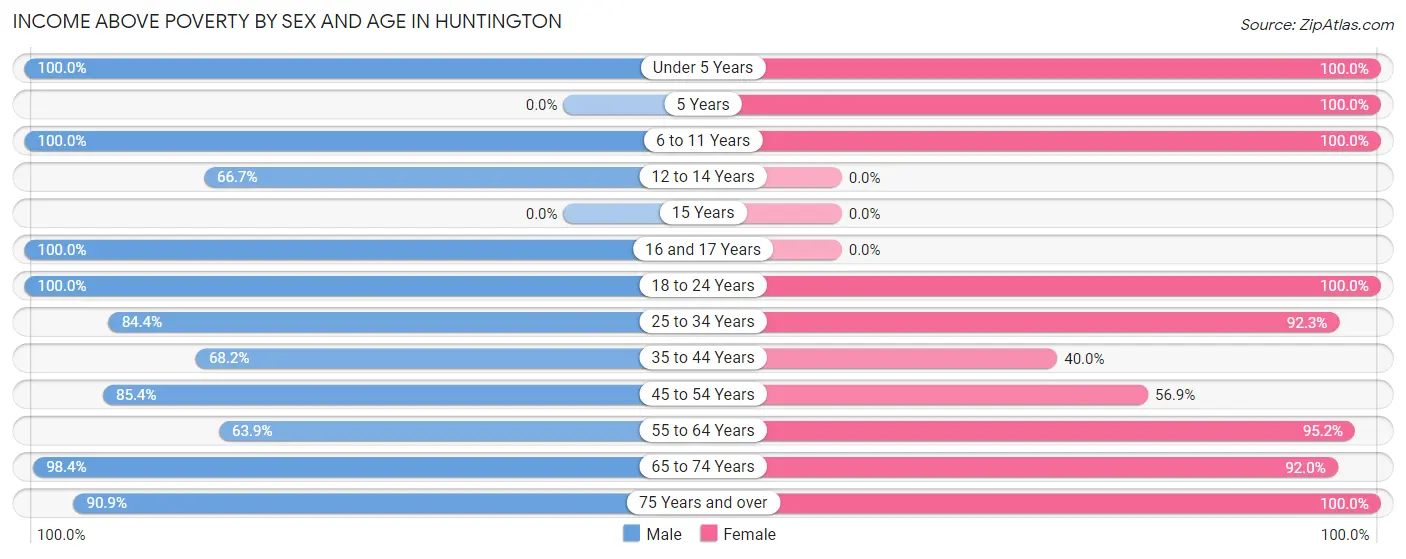
| Age Bracket | Male | Female |
| Under 5 Years | 2 (100.0%) | 16 (100.0%) |
| 5 Years | 0 (0.0%) | 5 (100.0%) |
| 6 to 11 Years | 40 (100.0%) | 4 (100.0%) |
| 12 to 14 Years | 4 (66.7%) | 0 (0.0%) |
| 15 Years | 0 (0.0%) | 0 (0.0%) |
| 16 and 17 Years | 1 (100.0%) | 0 (0.0%) |
| 18 to 24 Years | 54 (100.0%) | 14 (100.0%) |
| 25 to 34 Years | 54 (84.4%) | 36 (92.3%) |
| 35 to 44 Years | 15 (68.2%) | 8 (40.0%) |
| 45 to 54 Years | 41 (85.4%) | 29 (56.9%) |
| 55 to 64 Years | 23 (63.9%) | 20 (95.2%) |
| 65 to 74 Years | 61 (98.4%) | 92 (92.0%) |
| 75 Years and over | 40 (90.9%) | 16 (100.0%) |
| Total | 335 (88.4%) | 240 (83.3%) |
Income Below Poverty Among Married-Couple Families in Huntington
The poverty statistics for married-couple families in Huntington show that 0.9% or 1 of the total 107 families live below the poverty line. Families with no children have the highest poverty rate of 1.2%, comprising of 1 families. On the other hand, families with 1 or 2 children have the lowest poverty rate of 0.0%, which includes 0 families.
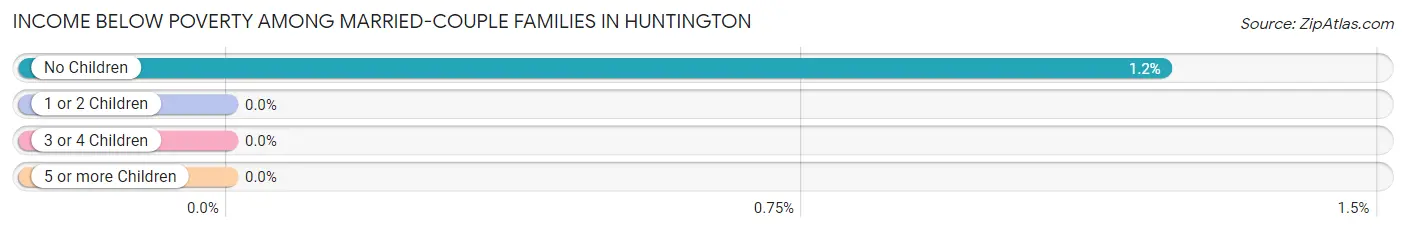
| Children | Above Poverty | Below Poverty |
| No Children | 81 (98.8%) | 1 (1.2%) |
| 1 or 2 Children | 25 (100.0%) | 0 (0.0%) |
| 3 or 4 Children | 0 (0.0%) | 0 (0.0%) |
| 5 or more Children | 0 (0.0%) | 0 (0.0%) |
| Total | 106 (99.1%) | 1 (0.9%) |
Income Below Poverty Among Single-Parent Households in Huntington
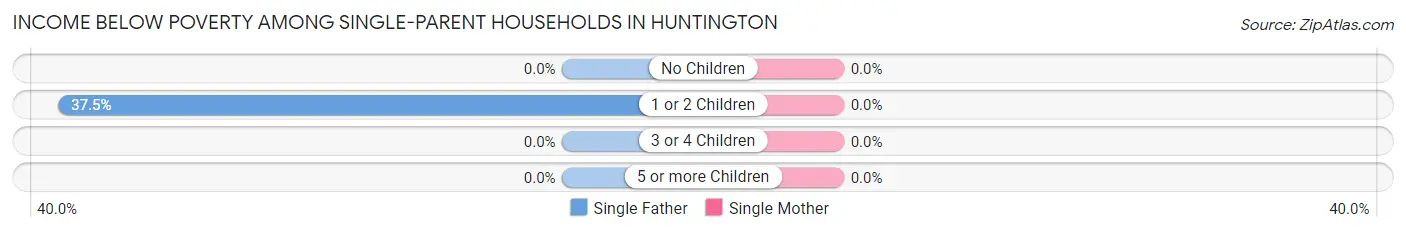
| Children | Single Father | Single Mother |
| No Children | 0 (0.0%) | 0 (0.0%) |
| 1 or 2 Children | 3 (37.5%) | 0 (0.0%) |
| 3 or 4 Children | 0 (0.0%) | 0 (0.0%) |
| 5 or more Children | 0 (0.0%) | 0 (0.0%) |
| Total | 3 (10.3%) | 0 (0.0%) |
Income Below Poverty Among Married-Couple vs Single-Parent Households in Huntington
The poverty data for Huntington shows that 1 of the married-couple family households (0.9%) and 3 of the single-parent households (7.3%) are living below the poverty level. Within the married-couple family households, those with no children have the highest poverty rate, with 1 households (1.2%) falling below the poverty line. Among the single-parent households, those with 1 or 2 children have the highest poverty rate, with 3 household (25.0%) living below poverty.
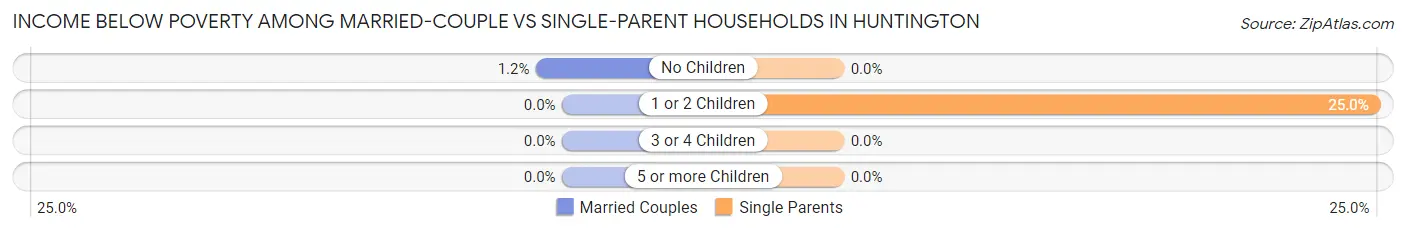
| Children | Married-Couple Families | Single-Parent Households |
| No Children | 1 (1.2%) | 0 (0.0%) |
| 1 or 2 Children | 0 (0.0%) | 3 (25.0%) |
| 3 or 4 Children | 0 (0.0%) | 0 (0.0%) |
| 5 or more Children | 0 (0.0%) | 0 (0.0%) |
| Total | 1 (0.9%) | 3 (7.3%) |
Race in Huntington
The most populous races in Huntington are White / Caucasian (638 | 93.5%), Native / Alaskan (19 | 2.8%), and Two or more Races (14 | 2.1%).
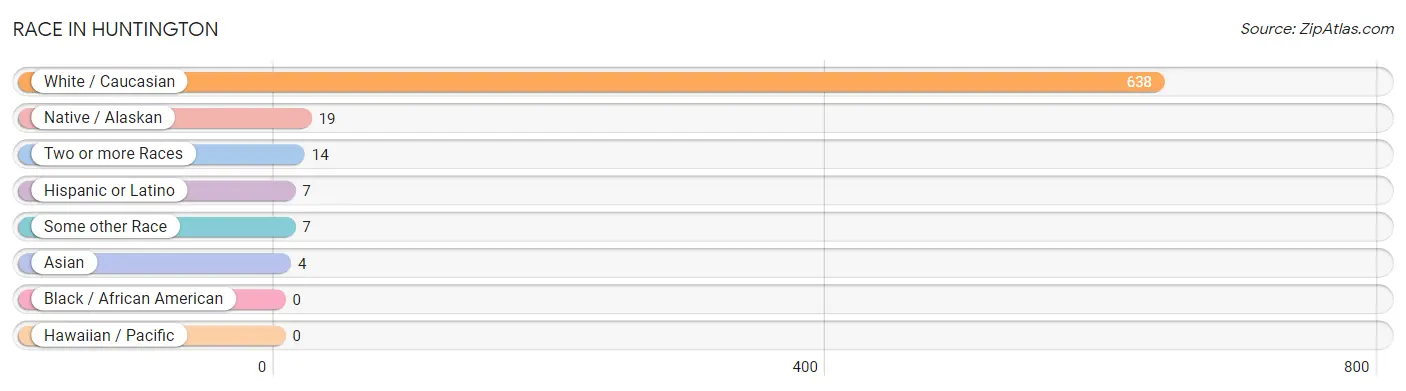
| Race | # Population | % Population |
| Asian | 4 | 0.6% |
| Black / African American | 0 | 0.0% |
| Hawaiian / Pacific | 0 | 0.0% |
| Hispanic or Latino | 7 | 1.0% |
| Native / Alaskan | 19 | 2.8% |
| White / Caucasian | 638 | 93.5% |
| Two or more Races | 14 | 2.1% |
| Some other Race | 7 | 1.0% |
| Total | 682 | 100.0% |
Ancestry in Huntington
The most populous ancestries reported in Huntington are English (115 | 16.9%), Irish (83 | 12.2%), German (73 | 10.7%), Scottish (67 | 9.8%), and American (50 | 7.3%), together accounting for 56.9% of all Huntington residents.
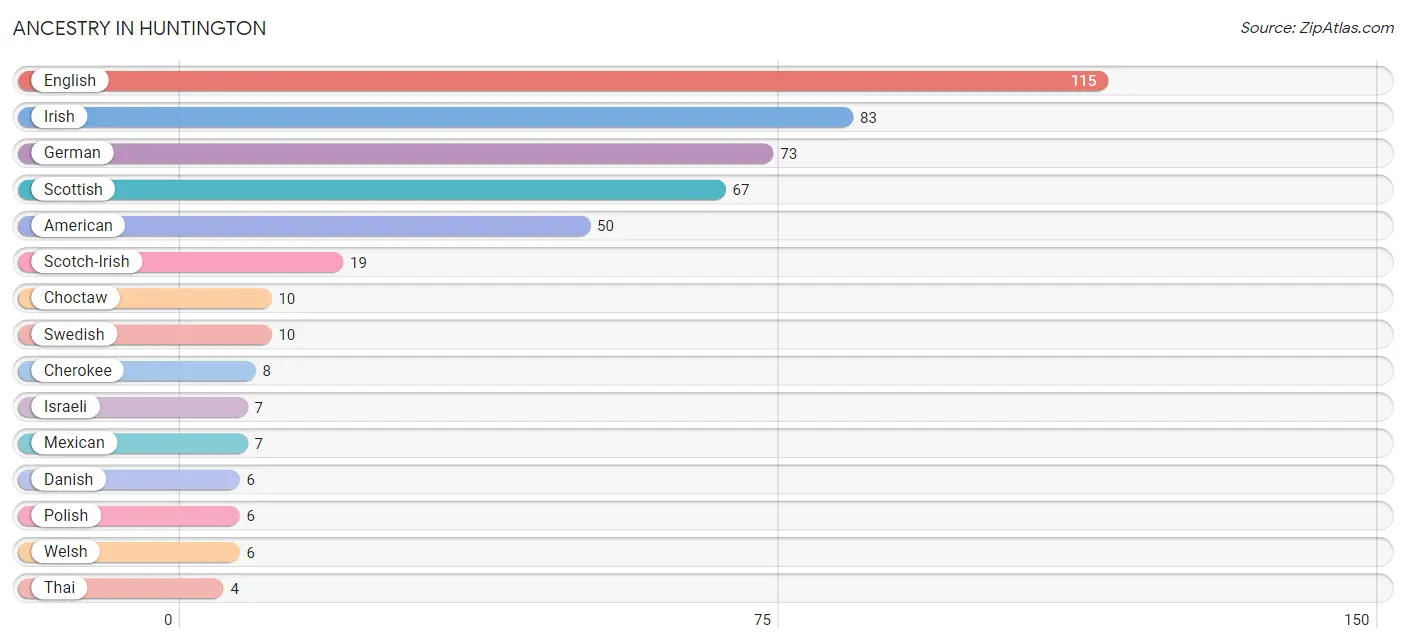
| Ancestry | # Population | % Population |
| American | 50 | 7.3% |
| Cherokee | 8 | 1.2% |
| Choctaw | 10 | 1.5% |
| Danish | 6 | 0.9% |
| English | 115 | 16.9% |
| French | 3 | 0.4% |
| French Canadian | 3 | 0.4% |
| German | 73 | 10.7% |
| Irish | 83 | 12.2% |
| Israeli | 7 | 1.0% |
| Italian | 2 | 0.3% |
| Mexican | 7 | 1.0% |
| Norwegian | 3 | 0.4% |
| Polish | 6 | 0.9% |
| Portuguese | 2 | 0.3% |
| Scotch-Irish | 19 | 2.8% |
| Scottish | 67 | 9.8% |
| Swedish | 10 | 1.5% |
| Thai | 4 | 0.6% |
| Ukrainian | 2 | 0.3% |
| Welsh | 6 | 0.9% |
| Yuman | 4 | 0.6% | View All 22 Rows |
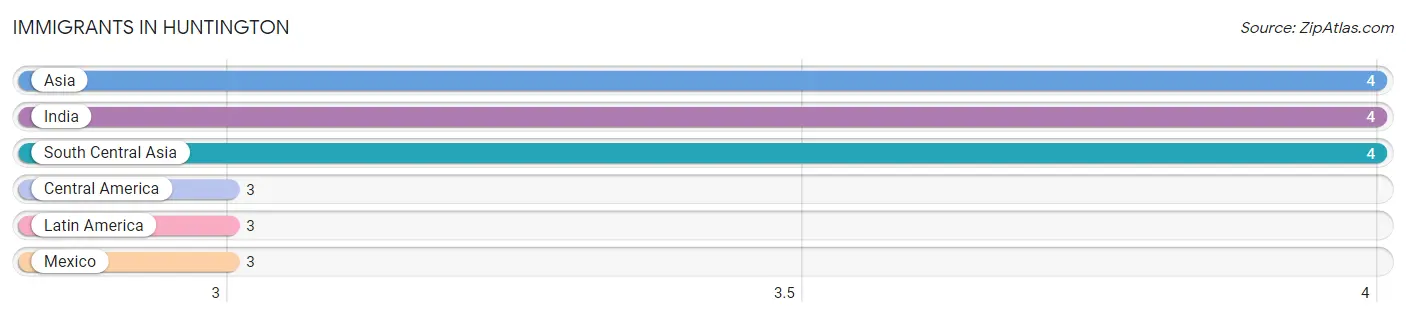
Immigrants in Huntington
The most numerous immigrant groups reported in Huntington came from Asia (4 | 0.6%), India (4 | 0.6%), South Central Asia (4 | 0.6%), Central America (3 | 0.4%), and Latin America (3 | 0.4%), together accounting for 2.7% of all Huntington residents.
| Immigration Origin | # Population | % Population |
| Asia | 4 | 0.6% |
| Central America | 3 | 0.4% |
| India | 4 | 0.6% |
| Latin America | 3 | 0.4% |
| Mexico | 3 | 0.4% |
| South Central Asia | 4 | 0.6% | View All 6 Rows |
Sex and Age in Huntington
Sex and Age in Huntington
The most populous age groups in Huntington are 20 to 24 Years (54 | 14.0%) for men and 65 to 69 Years (71 | 24.1%) for women.
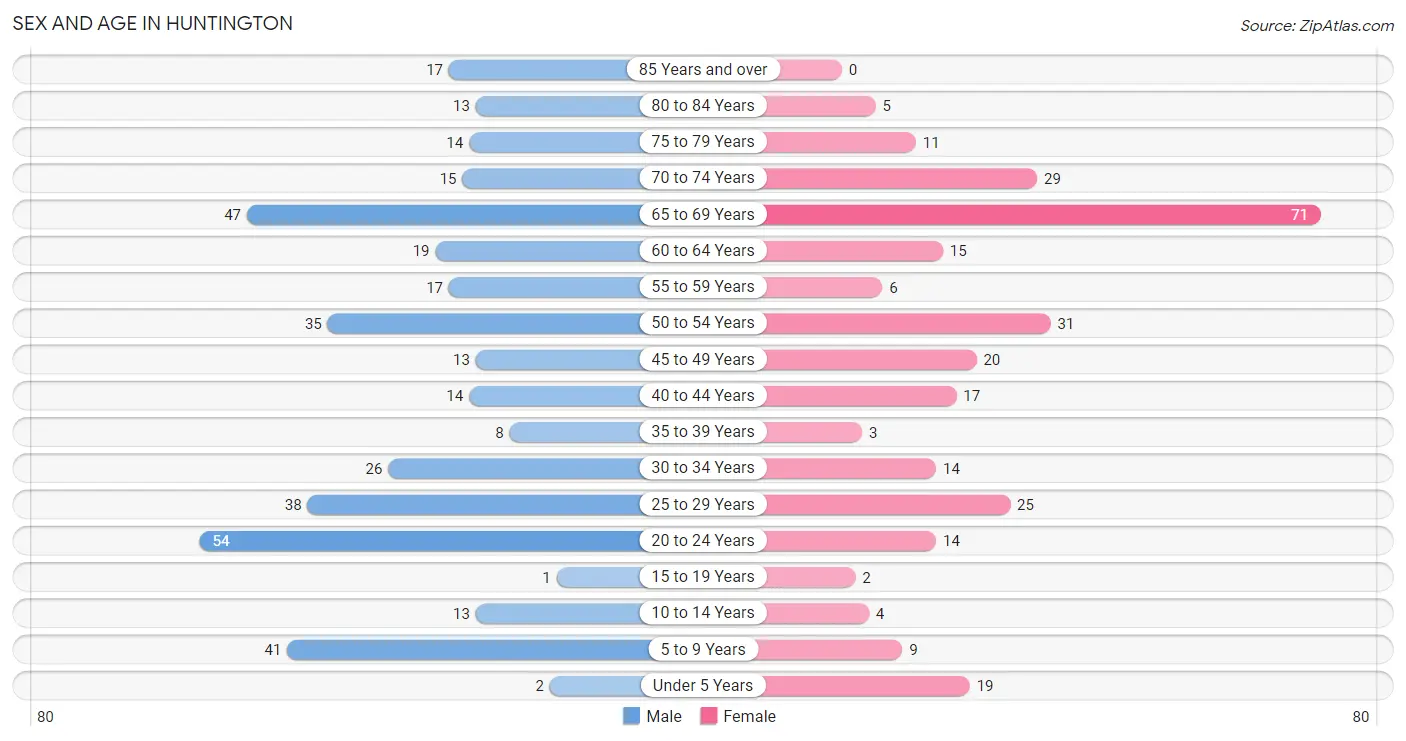
| Age Bracket | Male | Female |
| Under 5 Years | 2 (0.5%) | 19 (6.4%) |
| 5 to 9 Years | 41 (10.6%) | 9 (3.0%) |
| 10 to 14 Years | 13 (3.4%) | 4 (1.4%) |
| 15 to 19 Years | 1 (0.3%) | 2 (0.7%) |
| 20 to 24 Years | 54 (14.0%) | 14 (4.8%) |
| 25 to 29 Years | 38 (9.8%) | 25 (8.5%) |
| 30 to 34 Years | 26 (6.7%) | 14 (4.8%) |
| 35 to 39 Years | 8 (2.1%) | 3 (1.0%) |
| 40 to 44 Years | 14 (3.6%) | 17 (5.8%) |
| 45 to 49 Years | 13 (3.4%) | 20 (6.8%) |
| 50 to 54 Years | 35 (9.0%) | 31 (10.5%) |
| 55 to 59 Years | 17 (4.4%) | 6 (2.0%) |
| 60 to 64 Years | 19 (4.9%) | 15 (5.1%) |
| 65 to 69 Years | 47 (12.1%) | 71 (24.1%) |
| 70 to 74 Years | 15 (3.9%) | 29 (9.8%) |
| 75 to 79 Years | 14 (3.6%) | 11 (3.7%) |
| 80 to 84 Years | 13 (3.4%) | 5 (1.7%) |
| 85 Years and over | 17 (4.4%) | 0 (0.0%) |
| Total | 387 (100.0%) | 295 (100.0%) |
Families and Households in Huntington
Median Family Size in Huntington
The median family size in Huntington is 3.28 persons per family, with married-couple families (107 | 72.3%) accounting for the largest median family size of 3.44 persons per family. On the other hand, single male/father families (29 | 19.6%) represent the smallest median family size with 2.69 persons per family.
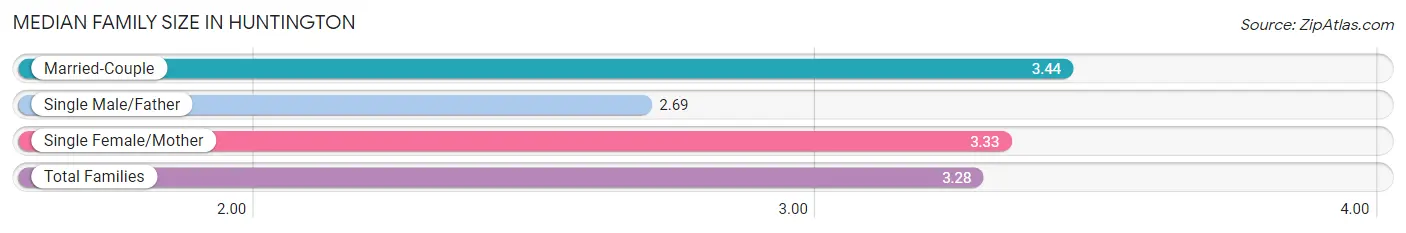
| Family Type | # Families | Family Size |
| Married-Couple | 107 (72.3%) | 3.44 |
| Single Male/Father | 29 (19.6%) | 2.69 |
| Single Female/Mother | 12 (8.1%) | 3.33 |
| Total Families | 148 (100.0%) | 3.28 |
Median Household Size in Huntington
The median household size in Huntington is 2.53 persons per household, with single female/mother households (12 | 4.4%) accounting for the largest median household size of 3.92 persons per household. non-family households (122 | 45.2%) represent the smallest median household size with 1.25 persons per household.
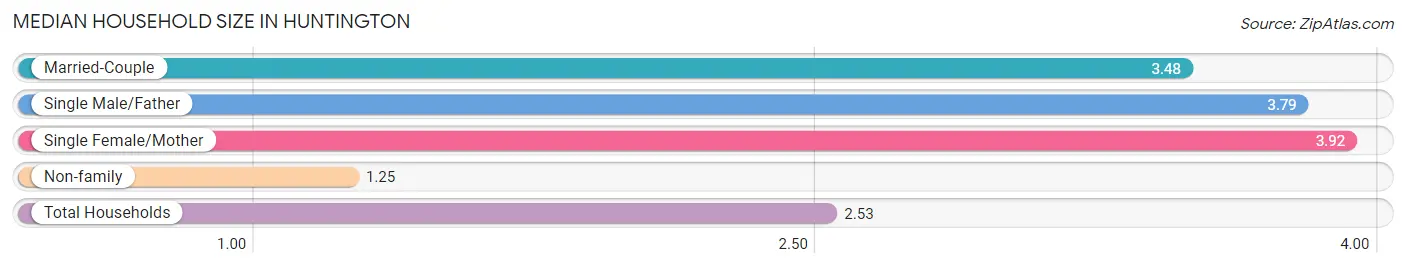
| Household Type | # Households | Household Size |
| Married-Couple | 107 (39.6%) | 3.48 |
| Single Male/Father | 29 (10.7%) | 3.79 |
| Single Female/Mother | 12 (4.4%) | 3.92 |
| Non-family | 122 (45.2%) | 1.25 |
| Total Households | 270 (100.0%) | 2.53 |
Household Size by Marriage Status in Huntington
Out of a total of 270 households in Huntington, 148 (54.8%) are family households, while 122 (45.2%) are nonfamily households. The most numerous type of family households are 2-person households, comprising 79, and the most common type of nonfamily households are 1-person households, comprising 104.
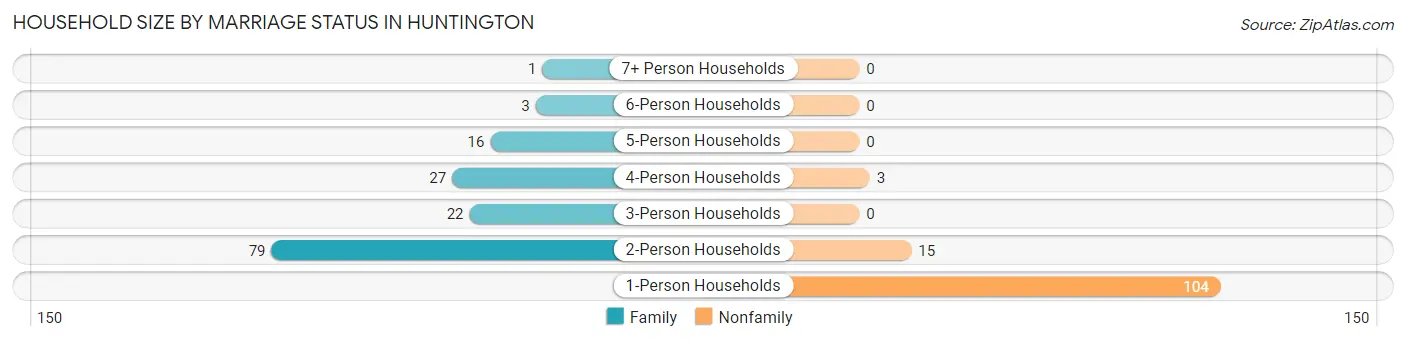
| Household Size | Family Households | Nonfamily Households |
| 1-Person Households | - | 104 (38.5%) |
| 2-Person Households | 79 (29.3%) | 15 (5.6%) |
| 3-Person Households | 22 (8.2%) | 0 (0.0%) |
| 4-Person Households | 27 (10.0%) | 3 (1.1%) |
| 5-Person Households | 16 (5.9%) | 0 (0.0%) |
| 6-Person Households | 3 (1.1%) | 0 (0.0%) |
| 7+ Person Households | 1 (0.4%) | 0 (0.0%) |
| Total | 148 (54.8%) | 122 (45.2%) |
Female Fertility in Huntington
Fertility by Age in Huntington
Average fertility rate in Huntington is 114.0 births per 1,000 women. Women in the age bracket of 20 to 34 years have the highest fertility rate with 226.0 births per 1,000 women. Women in the age bracket of 20 to 34 years acount for 100.0% of all women with births.
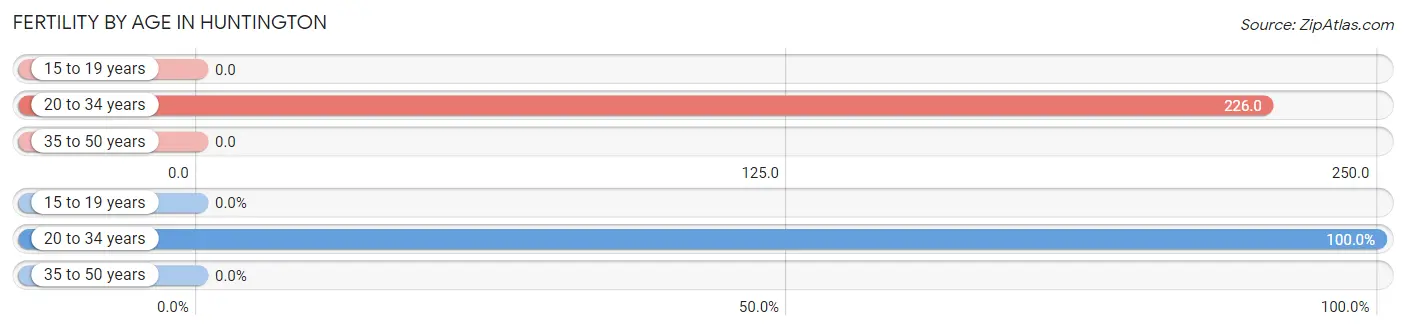
| Age Bracket | Women with Births | Births / 1,000 Women |
| 15 to 19 years | 0 (0.0%) | 0.0 |
| 20 to 34 years | 12 (100.0%) | 226.0 |
| 35 to 50 years | 0 (0.0%) | 0.0 |
| Total | 12 (100.0%) | 114.0 |
Fertility by Age by Marriage Status in Huntington
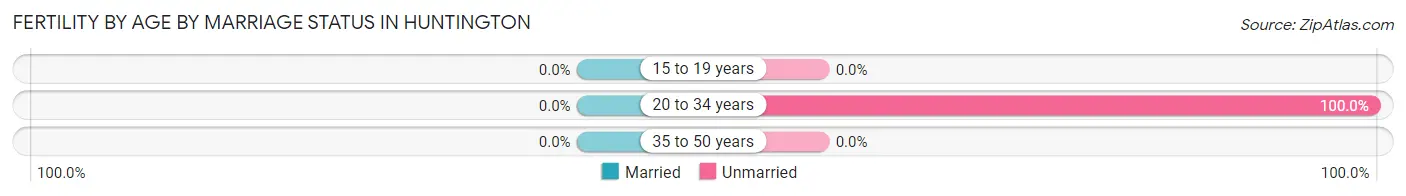
| Age Bracket | Married | Unmarried |
| 15 to 19 years | 0 (0.0%) | 0 (0.0%) |
| 20 to 34 years | 0 (0.0%) | 12 (100.0%) |
| 35 to 50 years | 0 (0.0%) | 0 (0.0%) |
| Total | 0 (0.0%) | 12 (100.0%) |
Fertility by Education in Huntington
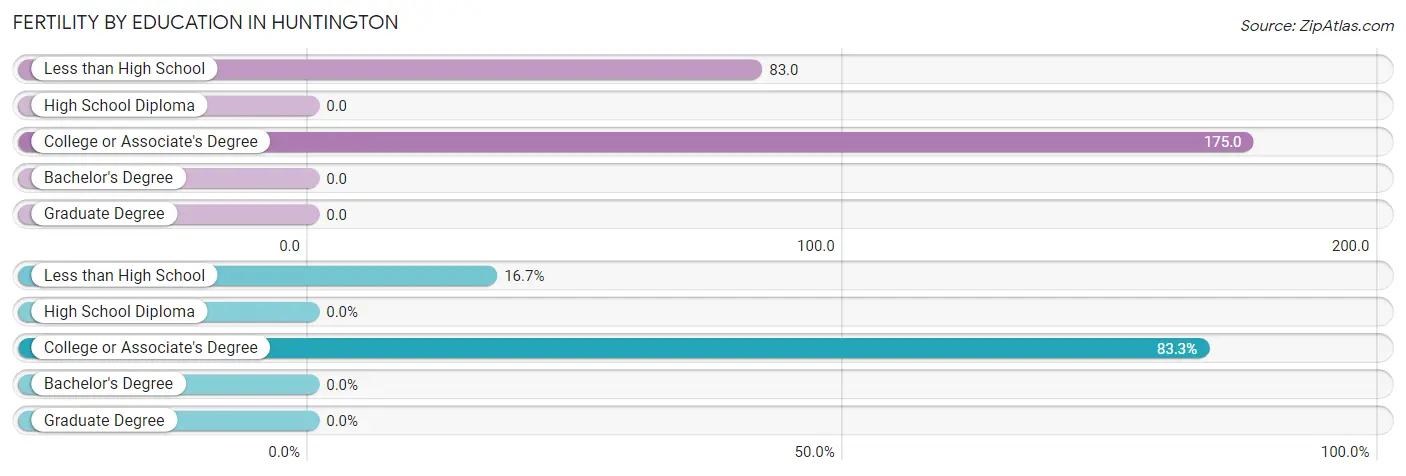
| Educational Attainment | Women with Births | Births / 1,000 Women |
| Less than High School | 2 (16.7%) | 83.0 |
| High School Diploma | 0 (0.0%) | 0.0 |
| College or Associate's Degree | 10 (83.3%) | 175.0 |
| Bachelor's Degree | 0 (0.0%) | 0.0 |
| Graduate Degree | 0 (0.0%) | 0.0 |
| Total | 12 (100.0%) | 114.0 |
Fertility by Education by Marriage Status in Huntington
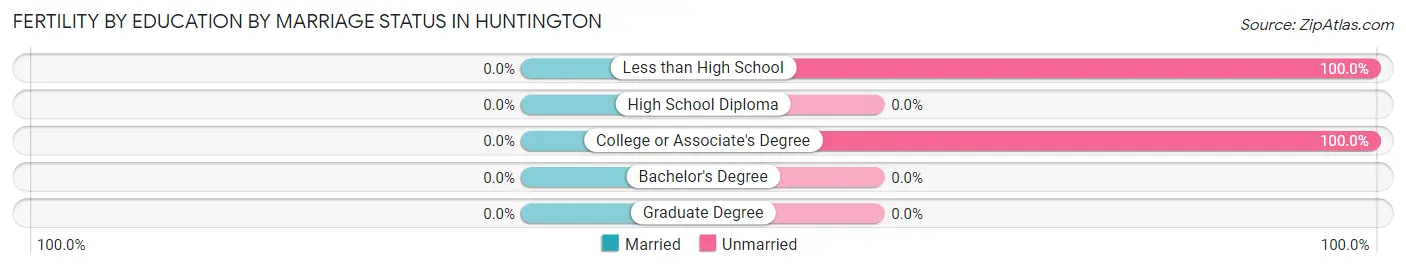
| Educational Attainment | Married | Unmarried |
| Less than High School | 0 (0.0%) | 2 (100.0%) |
| High School Diploma | 0 (0.0%) | 0 (0.0%) |
| College or Associate's Degree | 0 (0.0%) | 10 (100.0%) |
| Bachelor's Degree | 0 (0.0%) | 0 (0.0%) |
| Graduate Degree | 0 (0.0%) | 0 (0.0%) |
| Total | 0 (0.0%) | 12 (100.0%) |
Employment Characteristics in Huntington
Employment by Class of Employer in Huntington
Among the 214 employed individuals in Huntington, private company employees (152 | 71.0%), state government employees (27 | 12.6%), and local government employees (13 | 6.1%) make up the most common classes of employment.
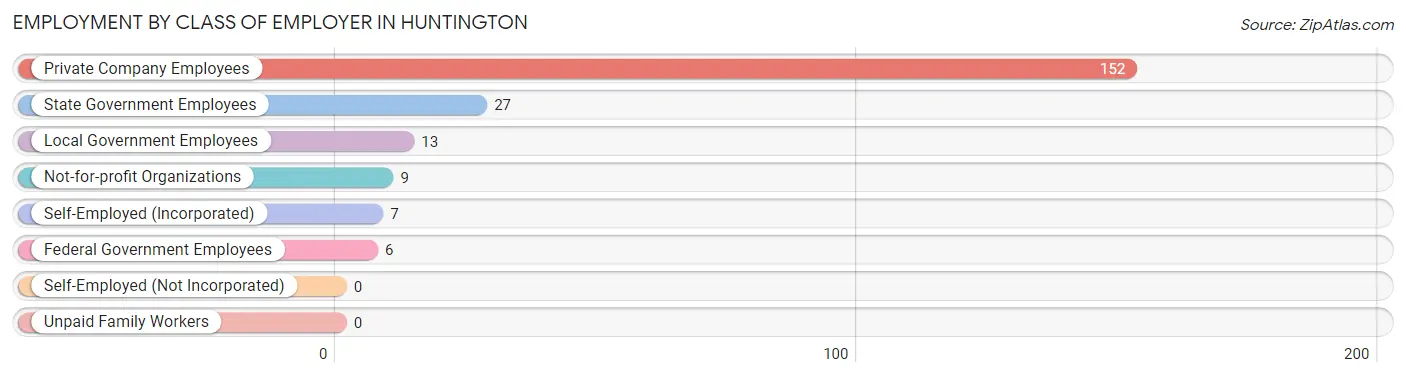
| Employer Class | # Employees | % Employees |
| Private Company Employees | 152 | 71.0% |
| Self-Employed (Incorporated) | 7 | 3.3% |
| Self-Employed (Not Incorporated) | 0 | 0.0% |
| Not-for-profit Organizations | 9 | 4.2% |
| Local Government Employees | 13 | 6.1% |
| State Government Employees | 27 | 12.6% |
| Federal Government Employees | 6 | 2.8% |
| Unpaid Family Workers | 0 | 0.0% |
| Total | 214 | 100.0% |
Employment Status by Age in Huntington
According to the labor force statistics for Huntington, out of the total population over 16 years of age (592), 38.9% or 230 individuals are in the labor force, with 7.0% or 16 of them unemployed. The age group with the highest labor force participation rate is 25 to 29 years, with 100.0% or 63 individuals in the labor force. Within the labor force, the 35 to 44 years age range has the highest percentage of unemployed individuals, with 24.3% or 9 of them being unemployed.
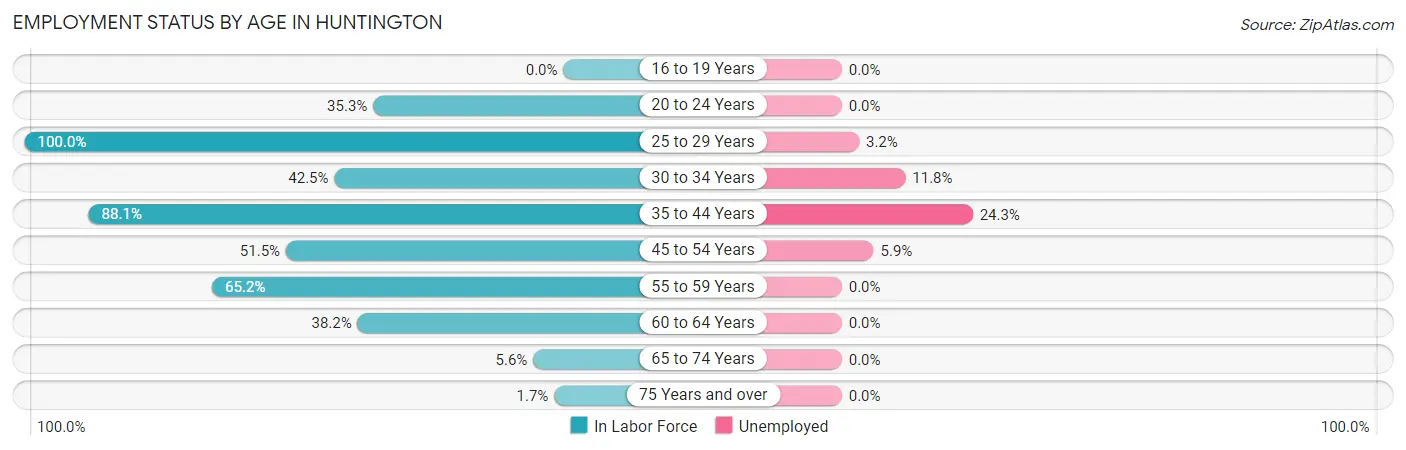
| Age Bracket | In Labor Force | Unemployed |
| 16 to 19 Years | 0 (0.0%) | 0 (0.0%) |
| 20 to 24 Years | 24 (35.3%) | 0 (0.0%) |
| 25 to 29 Years | 63 (100.0%) | 2 (3.2%) |
| 30 to 34 Years | 17 (42.5%) | 2 (11.8%) |
| 35 to 44 Years | 37 (88.1%) | 9 (24.3%) |
| 45 to 54 Years | 51 (51.5%) | 3 (5.9%) |
| 55 to 59 Years | 15 (65.2%) | 0 (0.0%) |
| 60 to 64 Years | 13 (38.2%) | 0 (0.0%) |
| 65 to 74 Years | 9 (5.6%) | 0 (0.0%) |
| 75 Years and over | 1 (1.7%) | 0 (0.0%) |
| Total | 230 (38.9%) | 16 (7.0%) |
Employment Status by Educational Attainment in Huntington
According to labor force statistics for Huntington, 65.1% of individuals (196) out of the total population between 25 and 64 years of age (301) are in the labor force, with 8.2% or 16 of them being unemployed. The group with the highest labor force participation rate are those with the educational attainment of bachelor's degree or higher, with 89.5% or 17 individuals in the labor force. Within the labor force, individuals with less than high school education have the highest percentage of unemployment, with 35.5% or 11 of them being unemployed.

| Educational Attainment | In Labor Force | Unemployed |
| Less than High School | 31 (58.5%) | 19 (35.5%) |
| High School Diploma | 66 (55.0%) | 9 (7.6%) |
| College / Associate Degree | 82 (75.2%) | 0 (0.0%) |
| Bachelor's Degree or higher | 17 (89.5%) | 0 (0.0%) |
| Total | 196 (65.1%) | 25 (8.2%) |
Employment Occupations by Sex in Huntington
Management, Business, Science and Arts Occupations
The most common Management, Business, Science and Arts occupations in Huntington are Community & Social Service (6 | 2.8%), Health Diagnosing & Treating (5 | 2.3%), Health Technologists (5 | 2.3%), Computers, Engineering & Science (4 | 1.9%), and Architecture & Engineering (4 | 1.9%).
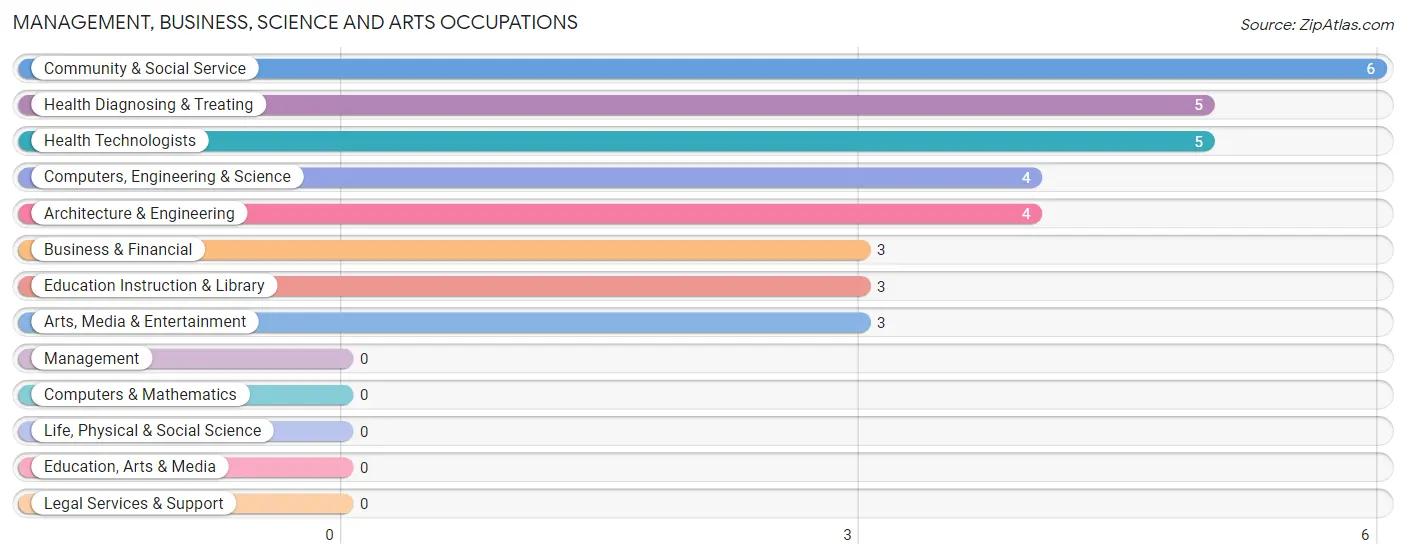
Management, Business, Science and Arts Occupations by Sex
Within the Management, Business, Science and Arts occupations in Huntington, the most male-oriented occupations are Computers, Engineering & Science (100.0%), Architecture & Engineering (100.0%), and Arts, Media & Entertainment (100.0%), while the most female-oriented occupations are Business & Financial (100.0%), Education Instruction & Library (100.0%), and Community & Social Service (50.0%).
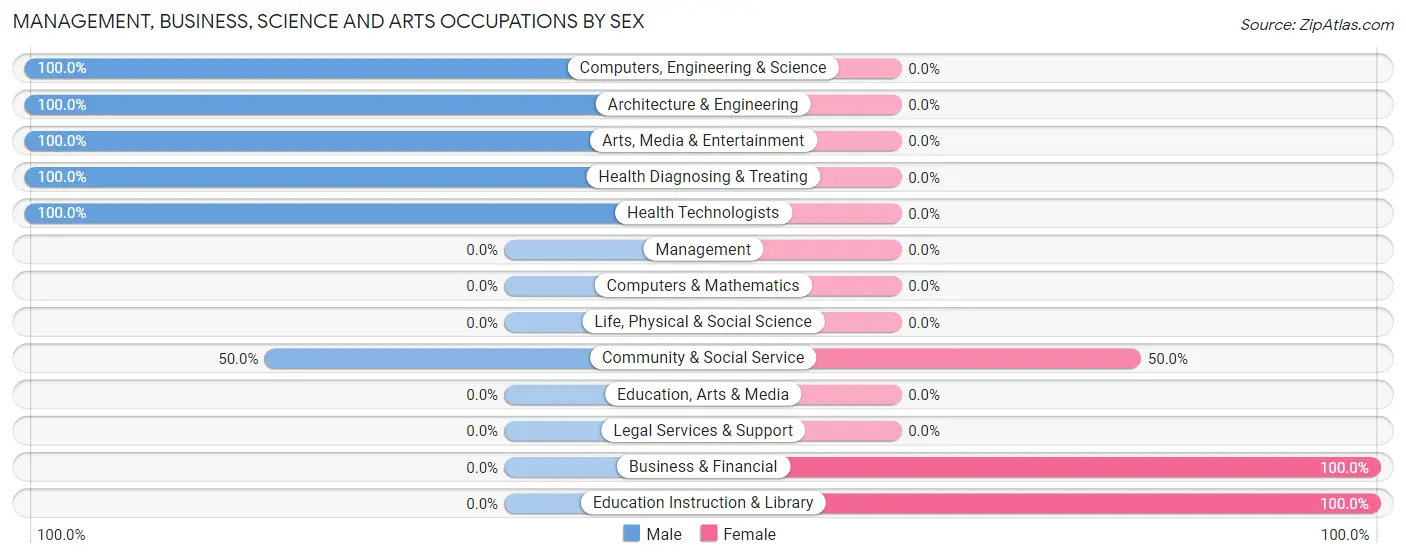
| Occupation | Male | Female |
| Management | 0 (0.0%) | 0 (0.0%) |
| Business & Financial | 0 (0.0%) | 3 (100.0%) |
| Computers, Engineering & Science | 4 (100.0%) | 0 (0.0%) |
| Computers & Mathematics | 0 (0.0%) | 0 (0.0%) |
| Architecture & Engineering | 4 (100.0%) | 0 (0.0%) |
| Life, Physical & Social Science | 0 (0.0%) | 0 (0.0%) |
| Community & Social Service | 3 (50.0%) | 3 (50.0%) |
| Education, Arts & Media | 0 (0.0%) | 0 (0.0%) |
| Legal Services & Support | 0 (0.0%) | 0 (0.0%) |
| Education Instruction & Library | 0 (0.0%) | 3 (100.0%) |
| Arts, Media & Entertainment | 3 (100.0%) | 0 (0.0%) |
| Health Diagnosing & Treating | 5 (100.0%) | 0 (0.0%) |
| Health Technologists | 5 (100.0%) | 0 (0.0%) |
| Total (Category) | 12 (66.7%) | 6 (33.3%) |
| Total (Overall) | 115 (53.7%) | 99 (46.3%) |
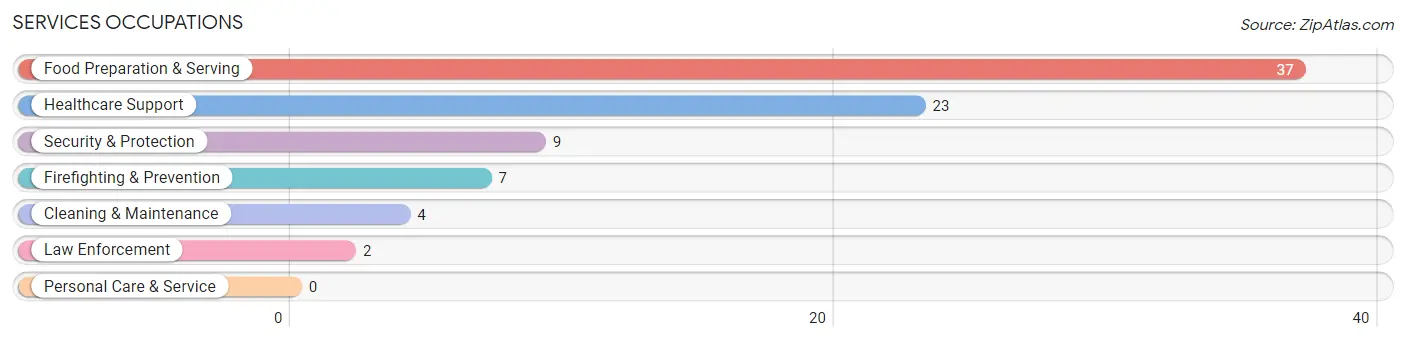
Services Occupations
The most common Services occupations in Huntington are Food Preparation & Serving (37 | 17.3%), Healthcare Support (23 | 10.7%), Security & Protection (9 | 4.2%), Firefighting & Prevention (7 | 3.3%), and Cleaning & Maintenance (4 | 1.9%).
Services Occupations by Sex
Within the Services occupations in Huntington, the most male-oriented occupations are Cleaning & Maintenance (100.0%), Healthcare Support (78.3%), and Firefighting & Prevention (42.9%), while the most female-oriented occupations are Law Enforcement (100.0%), Food Preparation & Serving (91.9%), and Security & Protection (66.7%).
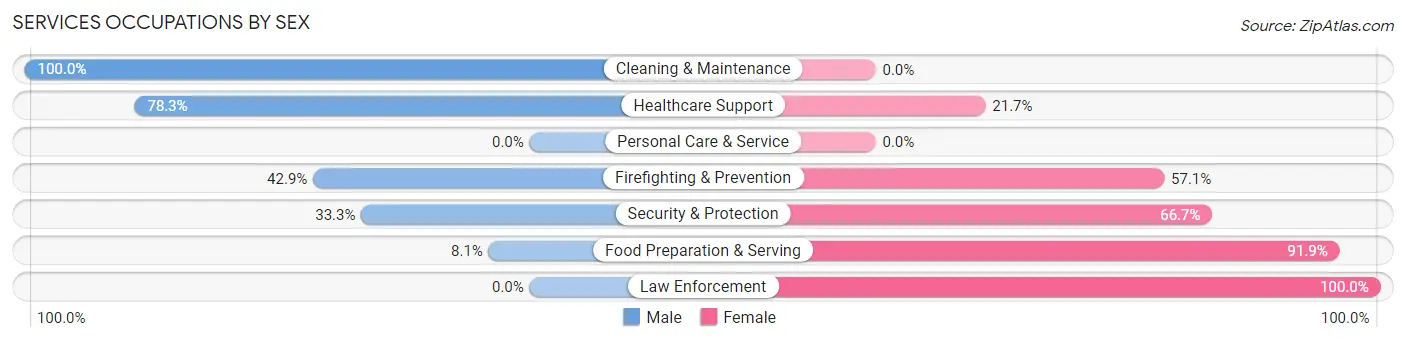
| Occupation | Male | Female |
| Healthcare Support | 18 (78.3%) | 5 (21.7%) |
| Security & Protection | 3 (33.3%) | 6 (66.7%) |
| Firefighting & Prevention | 3 (42.9%) | 4 (57.1%) |
| Law Enforcement | 0 (0.0%) | 2 (100.0%) |
| Food Preparation & Serving | 3 (8.1%) | 34 (91.9%) |
| Cleaning & Maintenance | 4 (100.0%) | 0 (0.0%) |
| Personal Care & Service | 0 (0.0%) | 0 (0.0%) |
| Total (Category) | 28 (38.4%) | 45 (61.6%) |
| Total (Overall) | 115 (53.7%) | 99 (46.3%) |
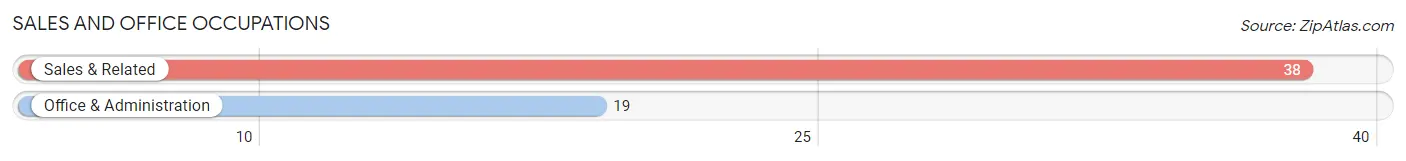
Sales and Office Occupations
The most common Sales and Office occupations in Huntington are Sales & Related (38 | 17.8%), and Office & Administration (19 | 8.9%).
Sales and Office Occupations by Sex
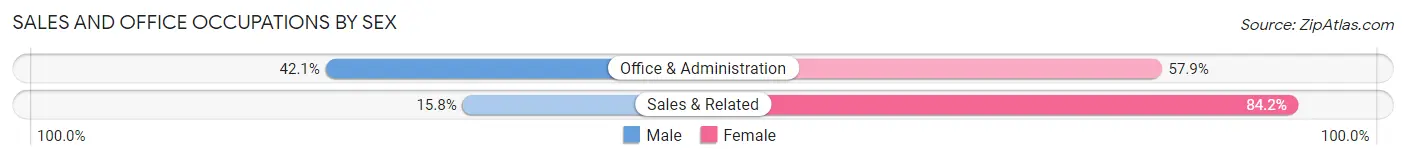
| Occupation | Male | Female |
| Sales & Related | 6 (15.8%) | 32 (84.2%) |
| Office & Administration | 8 (42.1%) | 11 (57.9%) |
| Total (Category) | 14 (24.6%) | 43 (75.4%) |
| Total (Overall) | 115 (53.7%) | 99 (46.3%) |
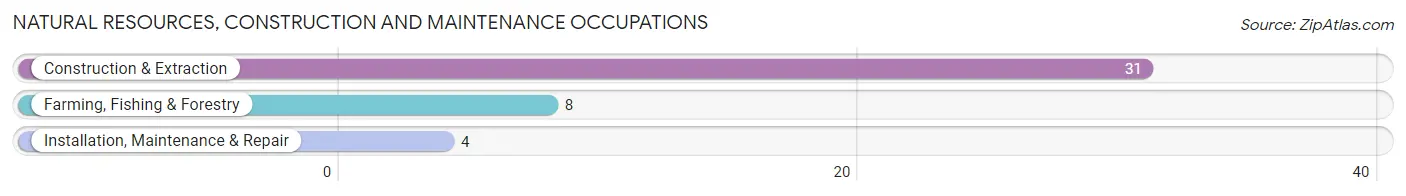
Natural Resources, Construction and Maintenance Occupations
The most common Natural Resources, Construction and Maintenance occupations in Huntington are Construction & Extraction (31 | 14.5%), Farming, Fishing & Forestry (8 | 3.7%), and Installation, Maintenance & Repair (4 | 1.9%).
Natural Resources, Construction and Maintenance Occupations by Sex
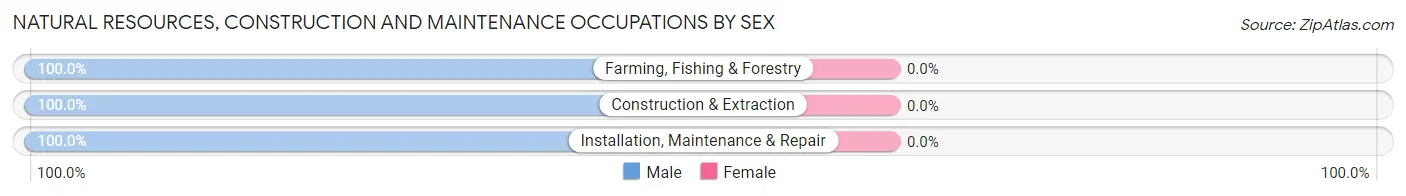
| Occupation | Male | Female |
| Farming, Fishing & Forestry | 8 (100.0%) | 0 (0.0%) |
| Construction & Extraction | 31 (100.0%) | 0 (0.0%) |
| Installation, Maintenance & Repair | 4 (100.0%) | 0 (0.0%) |
| Total (Category) | 43 (100.0%) | 0 (0.0%) |
| Total (Overall) | 115 (53.7%) | 99 (46.3%) |
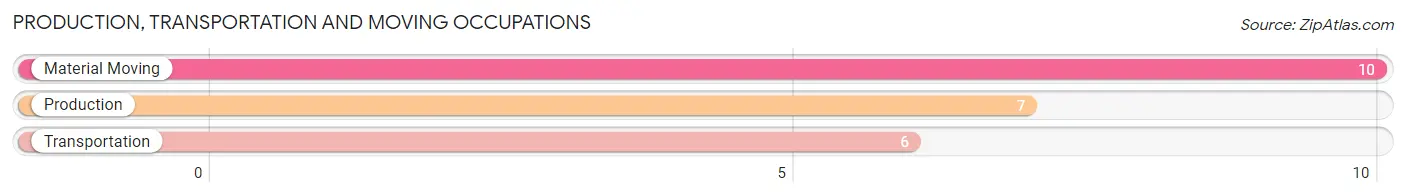
Production, Transportation and Moving Occupations
The most common Production, Transportation and Moving occupations in Huntington are Material Moving (10 | 4.7%), Production (7 | 3.3%), and Transportation (6 | 2.8%).
Production, Transportation and Moving Occupations by Sex
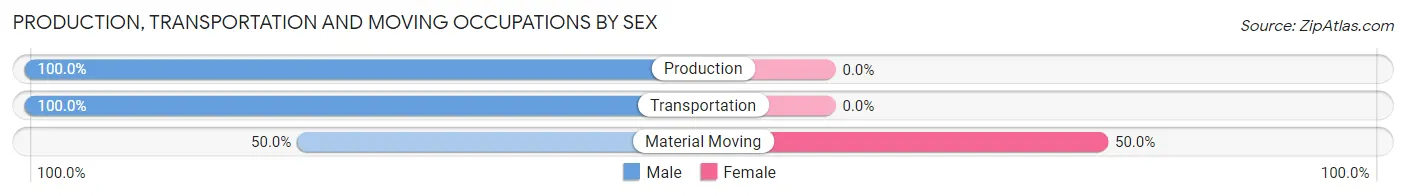
| Occupation | Male | Female |
| Production | 7 (100.0%) | 0 (0.0%) |
| Transportation | 6 (100.0%) | 0 (0.0%) |
| Material Moving | 5 (50.0%) | 5 (50.0%) |
| Total (Category) | 18 (78.3%) | 5 (21.7%) |
| Total (Overall) | 115 (53.7%) | 99 (46.3%) |
Employment Industries by Sex in Huntington
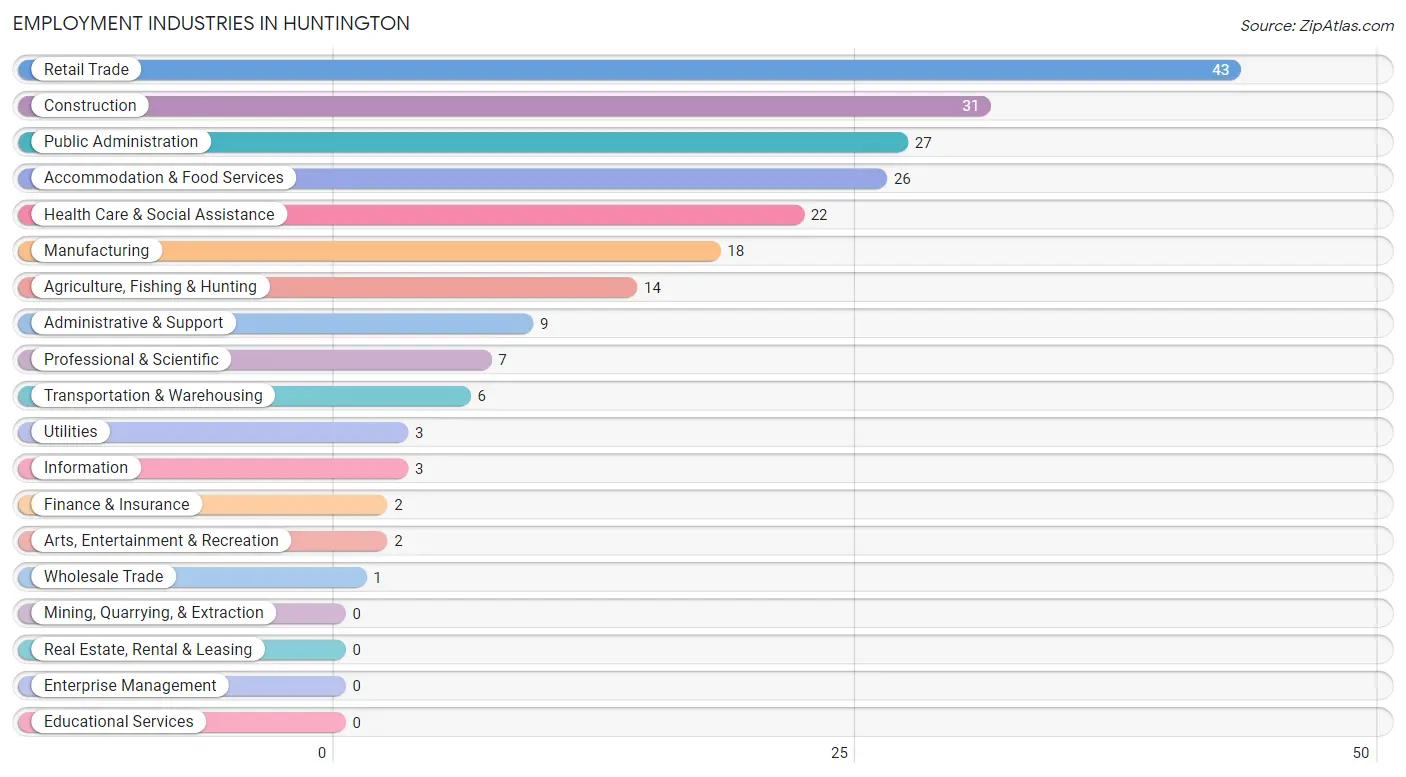
Employment Industries in Huntington
The major employment industries in Huntington include Retail Trade (43 | 20.1%), Construction (31 | 14.5%), Public Administration (27 | 12.6%), Accommodation & Food Services (26 | 12.1%), and Health Care & Social Assistance (22 | 10.3%).
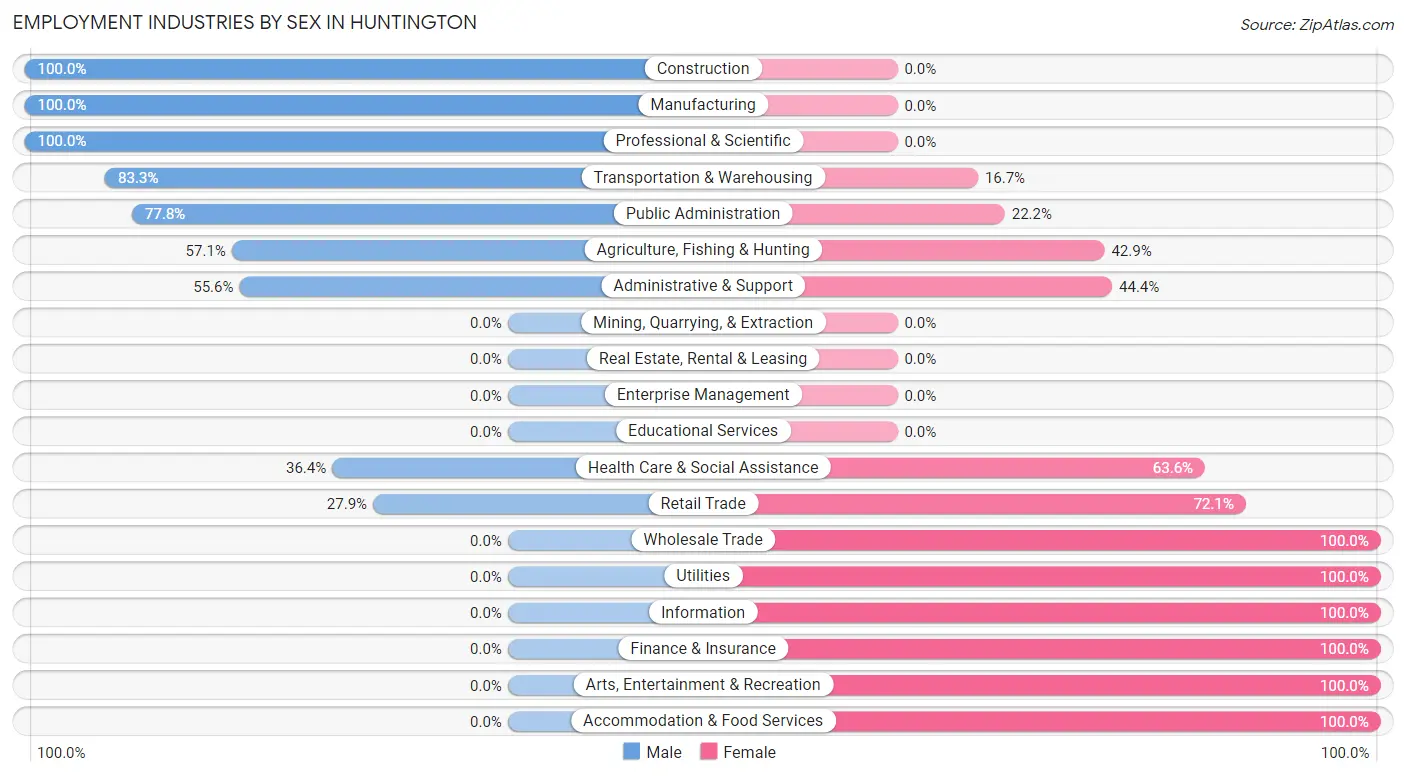
Employment Industries by Sex in Huntington
The Huntington industries that see more men than women are Construction (100.0%), Manufacturing (100.0%), and Professional & Scientific (100.0%), whereas the industries that tend to have a higher number of women are Wholesale Trade (100.0%), Utilities (100.0%), and Information (100.0%).
| Industry | Male | Female |
| Agriculture, Fishing & Hunting | 8 (57.1%) | 6 (42.9%) |
| Mining, Quarrying, & Extraction | 0 (0.0%) | 0 (0.0%) |
| Construction | 31 (100.0%) | 0 (0.0%) |
| Manufacturing | 18 (100.0%) | 0 (0.0%) |
| Wholesale Trade | 0 (0.0%) | 1 (100.0%) |
| Retail Trade | 12 (27.9%) | 31 (72.1%) |
| Transportation & Warehousing | 5 (83.3%) | 1 (16.7%) |
| Utilities | 0 (0.0%) | 3 (100.0%) |
| Information | 0 (0.0%) | 3 (100.0%) |
| Finance & Insurance | 0 (0.0%) | 2 (100.0%) |
| Real Estate, Rental & Leasing | 0 (0.0%) | 0 (0.0%) |
| Professional & Scientific | 7 (100.0%) | 0 (0.0%) |
| Enterprise Management | 0 (0.0%) | 0 (0.0%) |
| Administrative & Support | 5 (55.6%) | 4 (44.4%) |
| Educational Services | 0 (0.0%) | 0 (0.0%) |
| Health Care & Social Assistance | 8 (36.4%) | 14 (63.6%) |
| Arts, Entertainment & Recreation | 0 (0.0%) | 2 (100.0%) |
| Accommodation & Food Services | 0 (0.0%) | 26 (100.0%) |
| Public Administration | 21 (77.8%) | 6 (22.2%) |
| Total | 115 (53.7%) | 99 (46.3%) |
Education in Huntington
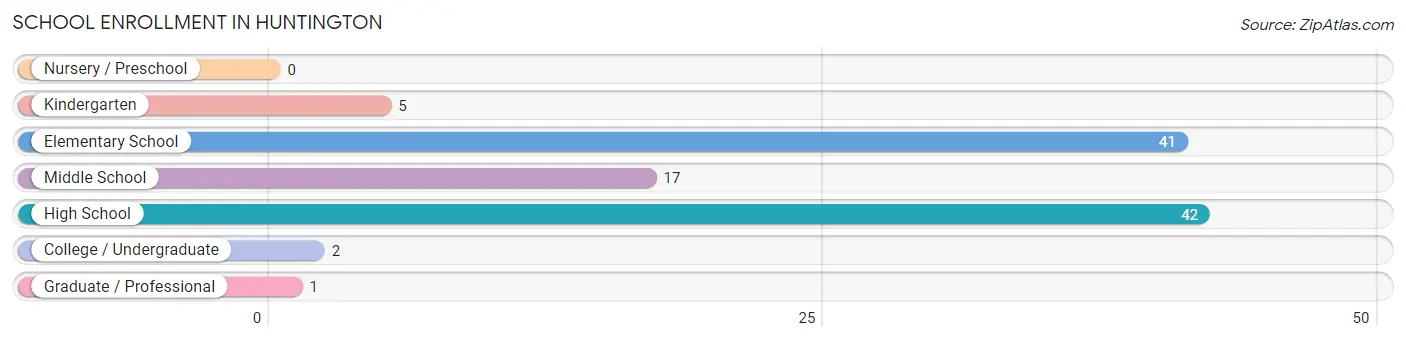
School Enrollment in Huntington
The most common levels of schooling among the 108 students in Huntington are high school (42 | 38.9%), elementary school (41 | 38.0%), and middle school (17 | 15.7%).
| School Level | # Students | % Students |
| Nursery / Preschool | 0 | 0.0% |
| Kindergarten | 5 | 4.6% |
| Elementary School | 41 | 38.0% |
| Middle School | 17 | 15.7% |
| High School | 42 | 38.9% |
| College / Undergraduate | 2 | 1.8% |
| Graduate / Professional | 1 | 0.9% |
| Total | 108 | 100.0% |
School Enrollment by Age by Funding Source in Huntington
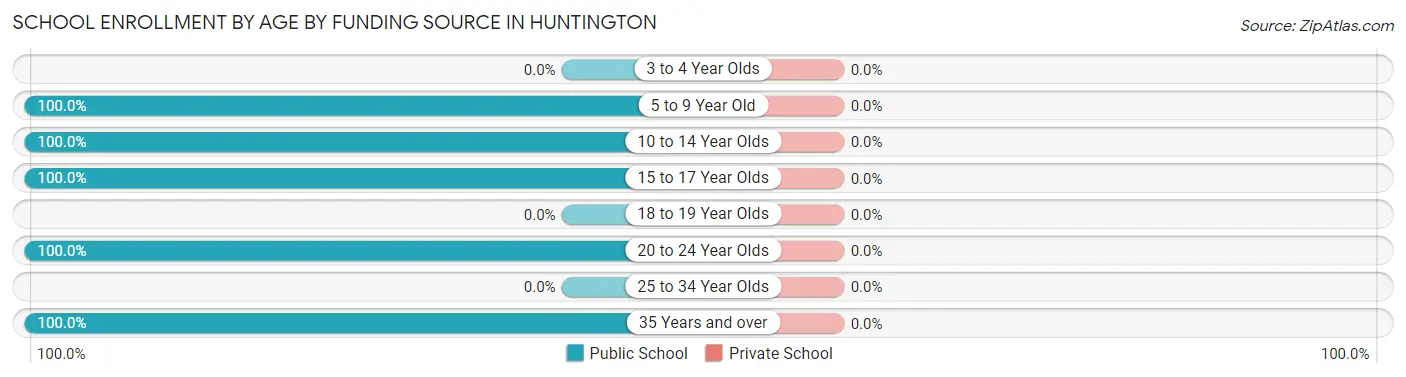
| Age Bracket | Public School | Private School |
| 3 to 4 Year Olds | 0 (0.0%) | 0 (0.0%) |
| 5 to 9 Year Old | 46 (100.0%) | 0 (0.0%) |
| 10 to 14 Year Olds | 17 (100.0%) | 0 (0.0%) |
| 15 to 17 Year Olds | 3 (100.0%) | 0 (0.0%) |
| 18 to 19 Year Olds | 0 (0.0%) | 0 (0.0%) |
| 20 to 24 Year Olds | 41 (100.0%) | 0 (0.0%) |
| 25 to 34 Year Olds | 0 (0.0%) | 0 (0.0%) |
| 35 Years and over | 1 (100.0%) | 0 (0.0%) |
| Total | 108 (100.0%) | 0 (0.0%) |
Educational Attainment by Field of Study in Huntington
Psychology (12 | 19.7%), liberal arts & history (11 | 18.0%), bio, nature & agricultural (7 | 11.5%), business (7 | 11.5%), and physical & health sciences (6 | 9.8%) are the most common fields of study among 61 individuals in Huntington who have obtained a bachelor's degree or higher.
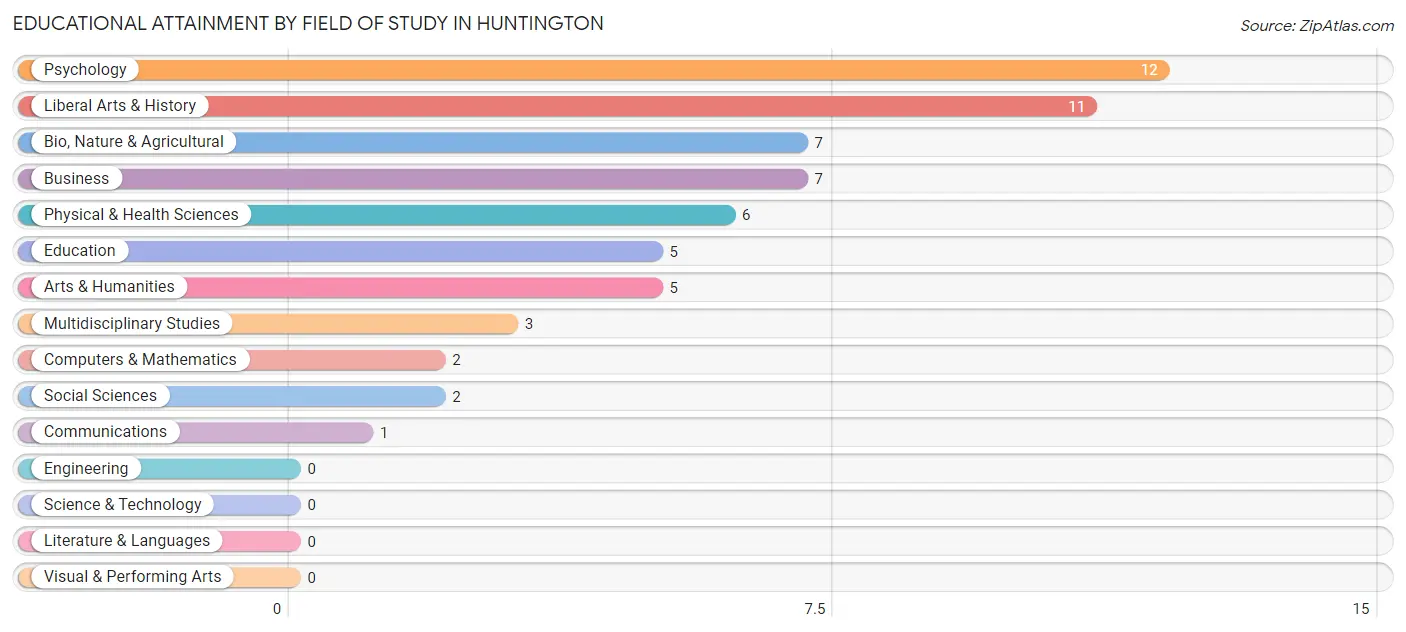
| Field of Study | # Graduates | % Graduates |
| Computers & Mathematics | 2 | 3.3% |
| Bio, Nature & Agricultural | 7 | 11.5% |
| Physical & Health Sciences | 6 | 9.8% |
| Psychology | 12 | 19.7% |
| Social Sciences | 2 | 3.3% |
| Engineering | 0 | 0.0% |
| Multidisciplinary Studies | 3 | 4.9% |
| Science & Technology | 0 | 0.0% |
| Business | 7 | 11.5% |
| Education | 5 | 8.2% |
| Literature & Languages | 0 | 0.0% |
| Liberal Arts & History | 11 | 18.0% |
| Visual & Performing Arts | 0 | 0.0% |
| Communications | 1 | 1.6% |
| Arts & Humanities | 5 | 8.2% |
| Total | 61 | 100.0% |
Transportation & Commute in Huntington
Vehicle Availability by Sex in Huntington
The most prevalent vehicle ownership categories in Huntington are males with 2 vehicles (41, accounting for 35.6%) and females with 2 vehicles (27, making up 41.4%).
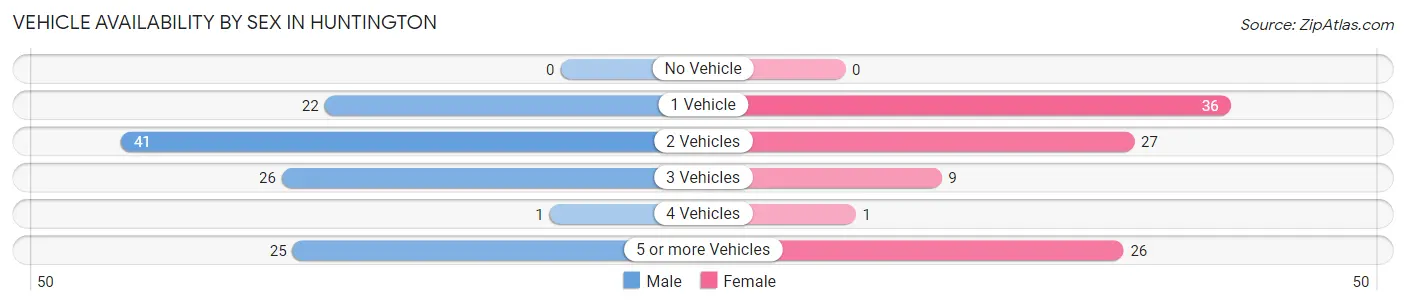
| Vehicles Available | Male | Female |
| No Vehicle | 0 (0.0%) | 0 (0.0%) |
| 1 Vehicle | 22 (19.1%) | 36 (36.4%) |
| 2 Vehicles | 41 (35.6%) | 27 (27.3%) |
| 3 Vehicles | 26 (22.6%) | 9 (9.1%) |
| 4 Vehicles | 1 (0.9%) | 1 (1.0%) |
| 5 or more Vehicles | 25 (21.7%) | 26 (26.3%) |
| Total | 115 (100.0%) | 99 (100.0%) |
Commute Time in Huntington
The most frequently occuring commute durations in Huntington are 5 to 9 minutes (42 commuters, 22.3%), 30 to 34 minutes (39 commuters, 20.7%), and less than 5 minutes (28 commuters, 14.9%).
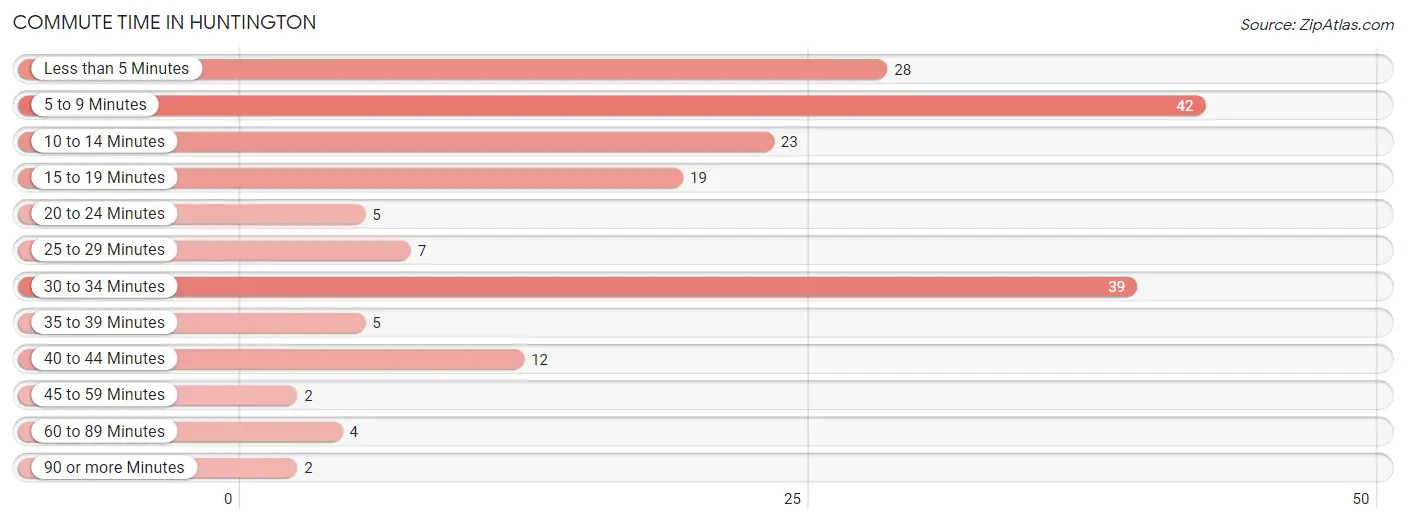
| Commute Time | # Commuters | % Commuters |
| Less than 5 Minutes | 28 | 14.9% |
| 5 to 9 Minutes | 42 | 22.3% |
| 10 to 14 Minutes | 23 | 12.2% |
| 15 to 19 Minutes | 19 | 10.1% |
| 20 to 24 Minutes | 5 | 2.7% |
| 25 to 29 Minutes | 7 | 3.7% |
| 30 to 34 Minutes | 39 | 20.7% |
| 35 to 39 Minutes | 5 | 2.7% |
| 40 to 44 Minutes | 12 | 6.4% |
| 45 to 59 Minutes | 2 | 1.1% |
| 60 to 89 Minutes | 4 | 2.1% |
| 90 or more Minutes | 2 | 1.1% |
Commute Time by Sex in Huntington
The most common commute times in Huntington are 5 to 9 minutes (24 commuters, 26.4%) for males and 10 to 14 minutes (23 commuters, 23.7%) for females.
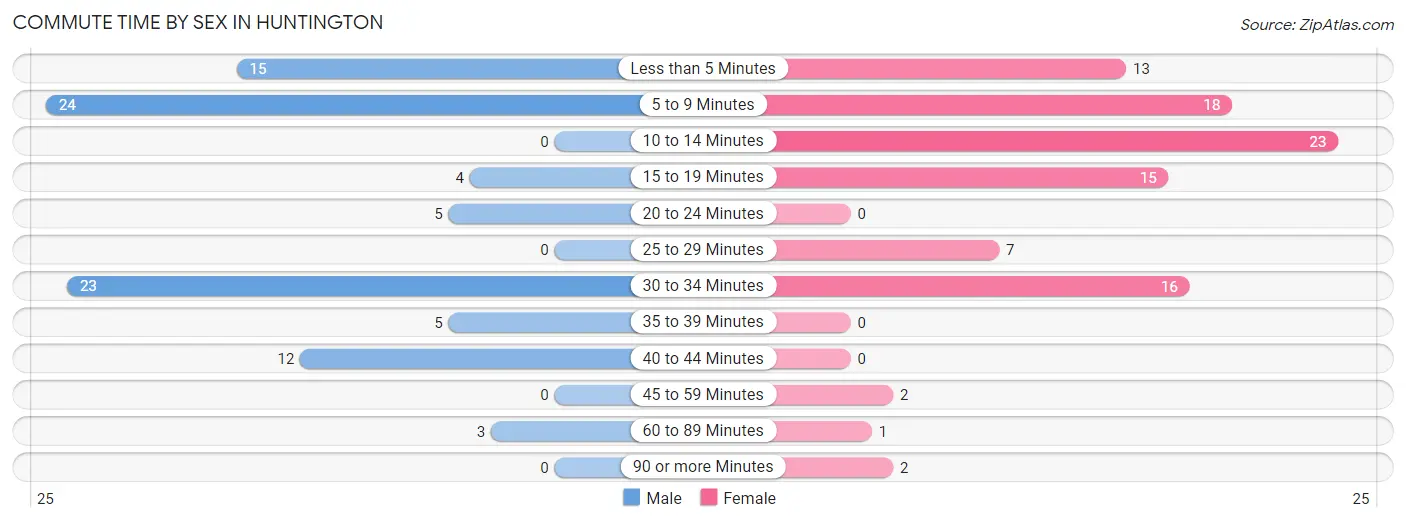
| Commute Time | Male | Female |
| Less than 5 Minutes | 15 (16.5%) | 13 (13.4%) |
| 5 to 9 Minutes | 24 (26.4%) | 18 (18.6%) |
| 10 to 14 Minutes | 0 (0.0%) | 23 (23.7%) |
| 15 to 19 Minutes | 4 (4.4%) | 15 (15.5%) |
| 20 to 24 Minutes | 5 (5.5%) | 0 (0.0%) |
| 25 to 29 Minutes | 0 (0.0%) | 7 (7.2%) |
| 30 to 34 Minutes | 23 (25.3%) | 16 (16.5%) |
| 35 to 39 Minutes | 5 (5.5%) | 0 (0.0%) |
| 40 to 44 Minutes | 12 (13.2%) | 0 (0.0%) |
| 45 to 59 Minutes | 0 (0.0%) | 2 (2.1%) |
| 60 to 89 Minutes | 3 (3.3%) | 1 (1.0%) |
| 90 or more Minutes | 0 (0.0%) | 2 (2.1%) |
Time of Departure to Work by Sex in Huntington
The most frequent times of departure to work in Huntington are 12:00 AM to 4:59 AM (32, 35.2%) for males and 7:00 AM to 7:29 AM (35, 36.1%) for females.
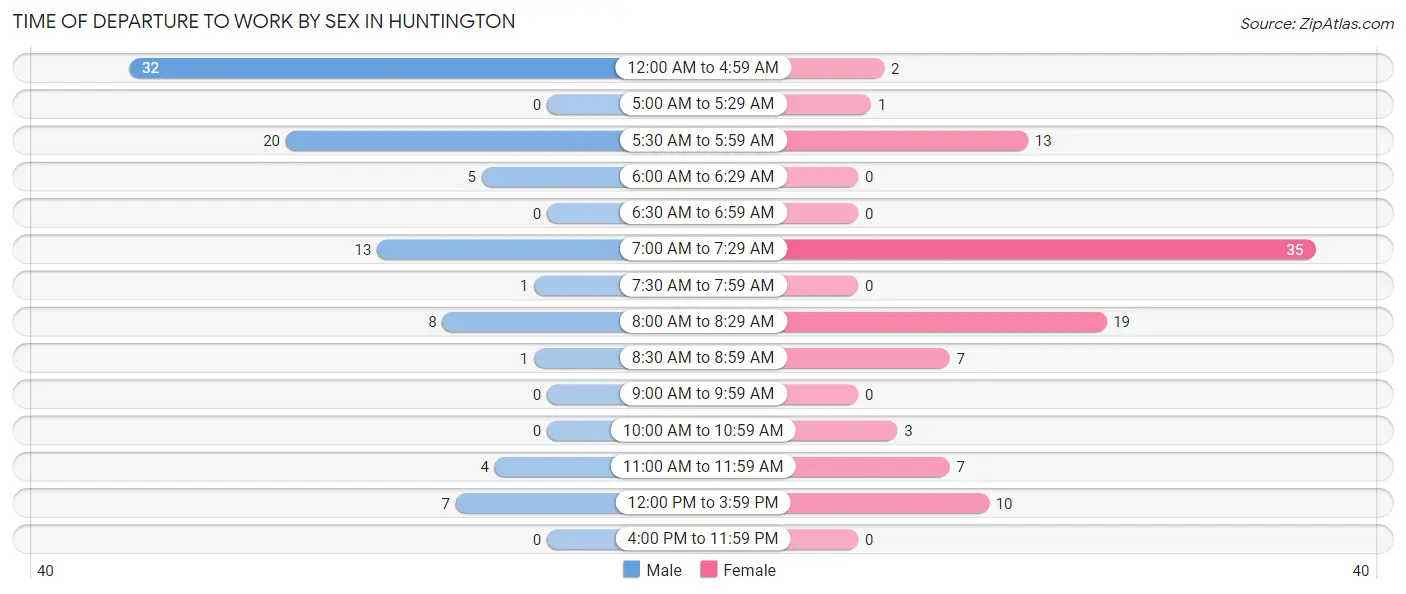
| Time of Departure | Male | Female |
| 12:00 AM to 4:59 AM | 32 (35.2%) | 2 (2.1%) |
| 5:00 AM to 5:29 AM | 0 (0.0%) | 1 (1.0%) |
| 5:30 AM to 5:59 AM | 20 (22.0%) | 13 (13.4%) |
| 6:00 AM to 6:29 AM | 5 (5.5%) | 0 (0.0%) |
| 6:30 AM to 6:59 AM | 0 (0.0%) | 0 (0.0%) |
| 7:00 AM to 7:29 AM | 13 (14.3%) | 35 (36.1%) |
| 7:30 AM to 7:59 AM | 1 (1.1%) | 0 (0.0%) |
| 8:00 AM to 8:29 AM | 8 (8.8%) | 19 (19.6%) |
| 8:30 AM to 8:59 AM | 1 (1.1%) | 7 (7.2%) |
| 9:00 AM to 9:59 AM | 0 (0.0%) | 0 (0.0%) |
| 10:00 AM to 10:59 AM | 0 (0.0%) | 3 (3.1%) |
| 11:00 AM to 11:59 AM | 4 (4.4%) | 7 (7.2%) |
| 12:00 PM to 3:59 PM | 7 (7.7%) | 10 (10.3%) |
| 4:00 PM to 11:59 PM | 0 (0.0%) | 0 (0.0%) |
| Total | 91 (100.0%) | 97 (100.0%) |
Housing Occupancy in Huntington
Occupancy by Ownership in Huntington
Of the total 270 dwellings in Huntington, owner-occupied units account for 174 (64.4%), while renter-occupied units make up 96 (35.6%).
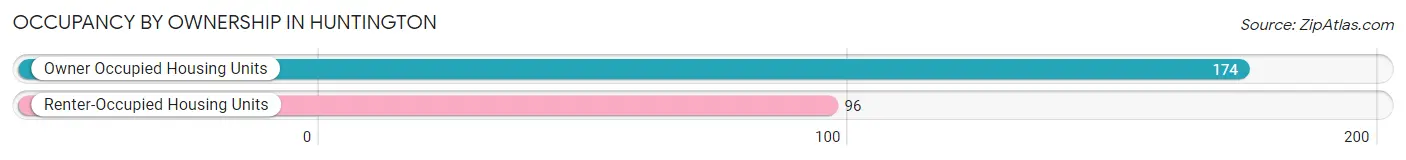
| Occupancy | # Housing Units | % Housing Units |
| Owner Occupied Housing Units | 174 | 64.4% |
| Renter-Occupied Housing Units | 96 | 35.6% |
| Total Occupied Housing Units | 270 | 100.0% |
Occupancy by Household Size in Huntington
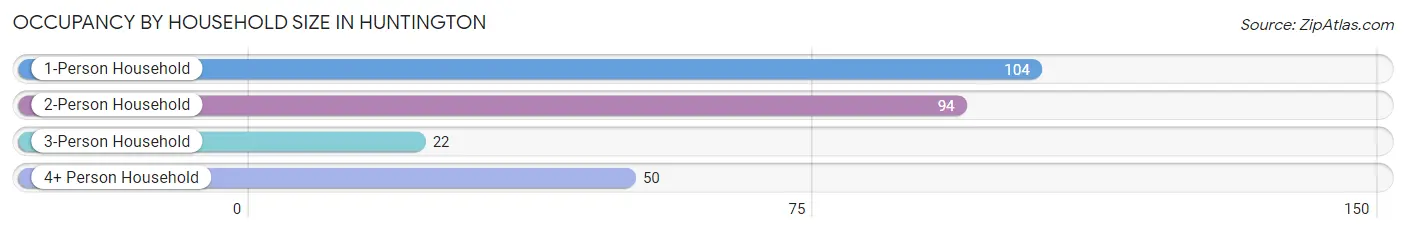
| Household Size | # Housing Units | % Housing Units |
| 1-Person Household | 104 | 38.5% |
| 2-Person Household | 94 | 34.8% |
| 3-Person Household | 22 | 8.2% |
| 4+ Person Household | 50 | 18.5% |
| Total Housing Units | 270 | 100.0% |
Occupancy by Ownership by Household Size in Huntington
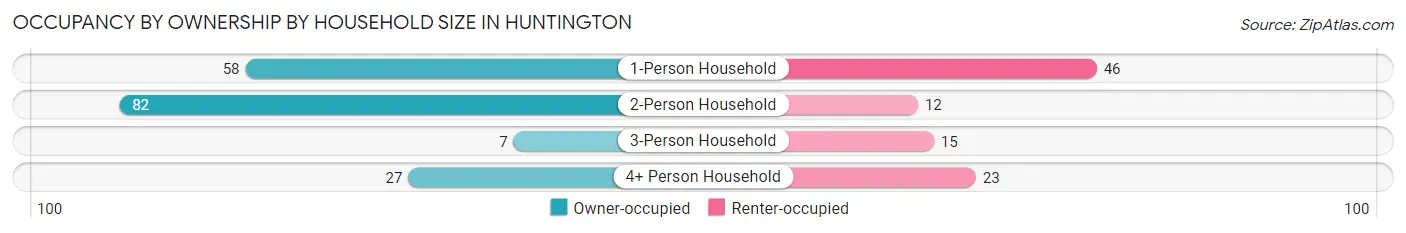
| Household Size | Owner-occupied | Renter-occupied |
| 1-Person Household | 58 (55.8%) | 46 (44.2%) |
| 2-Person Household | 82 (87.2%) | 12 (12.8%) |
| 3-Person Household | 7 (31.8%) | 15 (68.2%) |
| 4+ Person Household | 27 (54.0%) | 23 (46.0%) |
| Total Housing Units | 174 (64.4%) | 96 (35.6%) |
Occupancy by Educational Attainment in Huntington
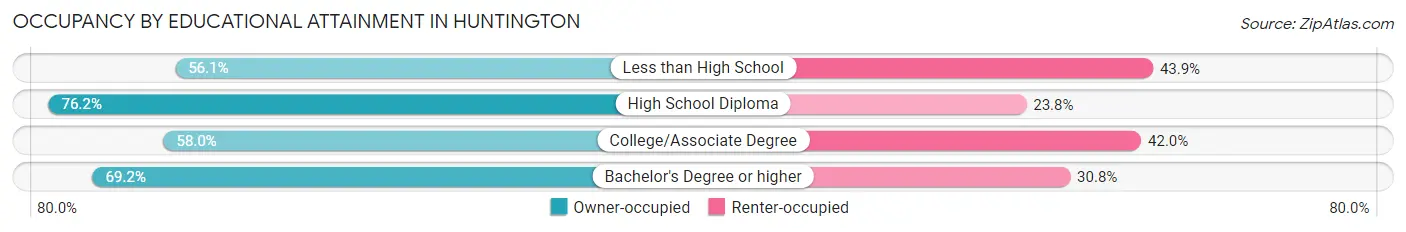
| Household Size | Owner-occupied | Renter-occupied |
| Less than High School | 23 (56.1%) | 18 (43.9%) |
| High School Diploma | 64 (76.2%) | 20 (23.8%) |
| College/Associate Degree | 69 (58.0%) | 50 (42.0%) |
| Bachelor's Degree or higher | 18 (69.2%) | 8 (30.8%) |
Occupancy by Age of Householder in Huntington
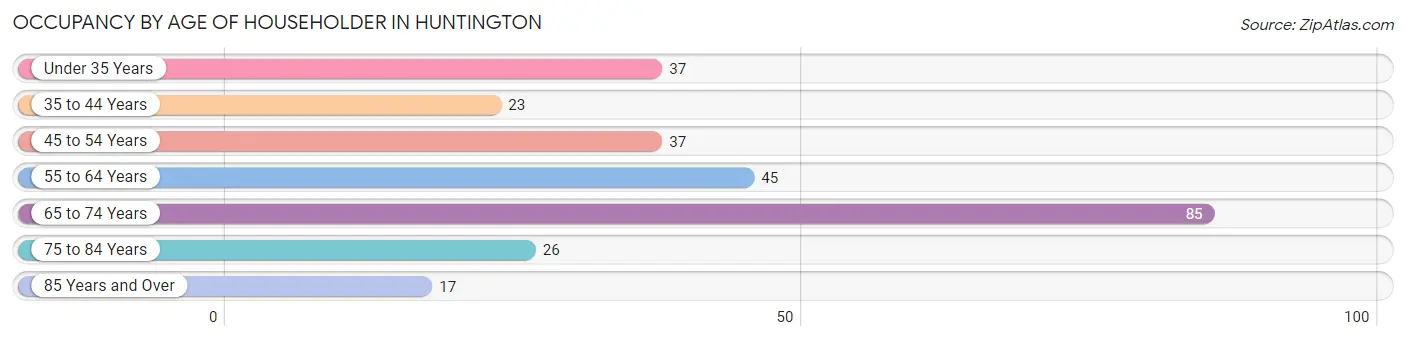
| Age Bracket | # Households | % Households |
| Under 35 Years | 37 | 13.7% |
| 35 to 44 Years | 23 | 8.5% |
| 45 to 54 Years | 37 | 13.7% |
| 55 to 64 Years | 45 | 16.7% |
| 65 to 74 Years | 85 | 31.5% |
| 75 to 84 Years | 26 | 9.6% |
| 85 Years and Over | 17 | 6.3% |
| Total | 270 | 100.0% |
Housing Finances in Huntington
Median Income by Occupancy in Huntington
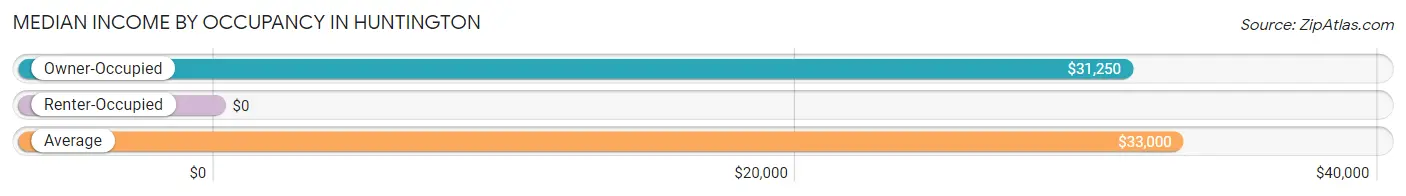
| Occupancy Type | # Households | Median Income |
| Owner-Occupied | 174 (64.4%) | $31,250 |
| Renter-Occupied | 96 (35.6%) | $0 |
| Average | 270 (100.0%) | $33,000 |
Occupancy by Householder Income Bracket in Huntington
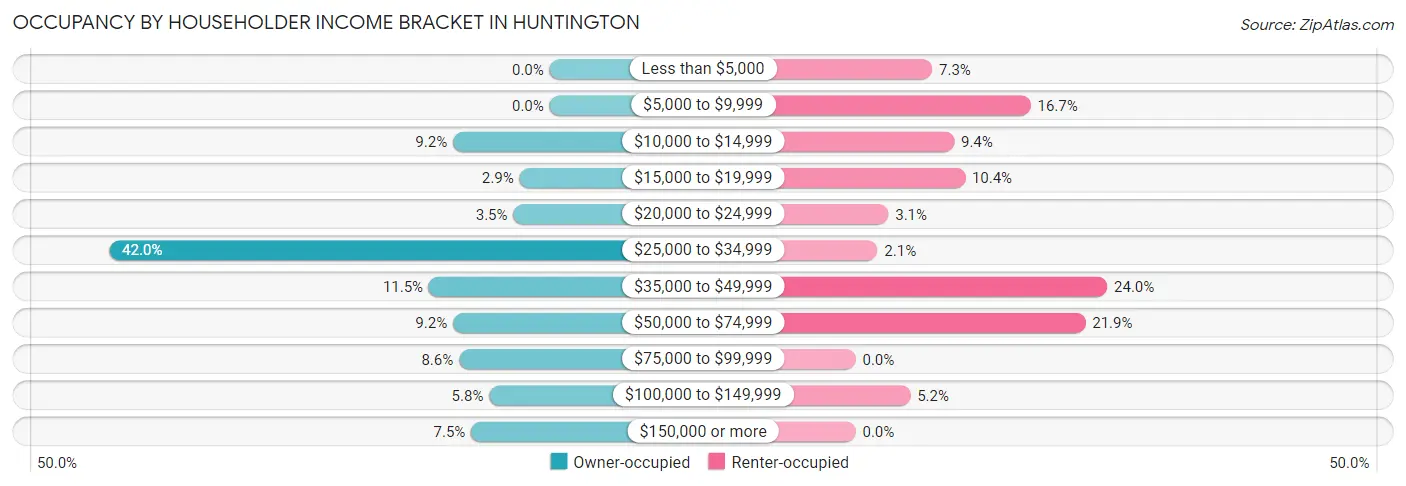
| Income Bracket | Owner-occupied | Renter-occupied |
| Less than $5,000 | 0 (0.0%) | 7 (7.3%) |
| $5,000 to $9,999 | 0 (0.0%) | 16 (16.7%) |
| $10,000 to $14,999 | 16 (9.2%) | 9 (9.4%) |
| $15,000 to $19,999 | 5 (2.9%) | 10 (10.4%) |
| $20,000 to $24,999 | 6 (3.5%) | 3 (3.1%) |
| $25,000 to $34,999 | 73 (41.9%) | 2 (2.1%) |
| $35,000 to $49,999 | 20 (11.5%) | 23 (24.0%) |
| $50,000 to $74,999 | 16 (9.2%) | 21 (21.9%) |
| $75,000 to $99,999 | 15 (8.6%) | 0 (0.0%) |
| $100,000 to $149,999 | 10 (5.8%) | 5 (5.2%) |
| $150,000 or more | 13 (7.5%) | 0 (0.0%) |
| Total | 174 (100.0%) | 96 (100.0%) |
Monthly Housing Cost Tiers in Huntington
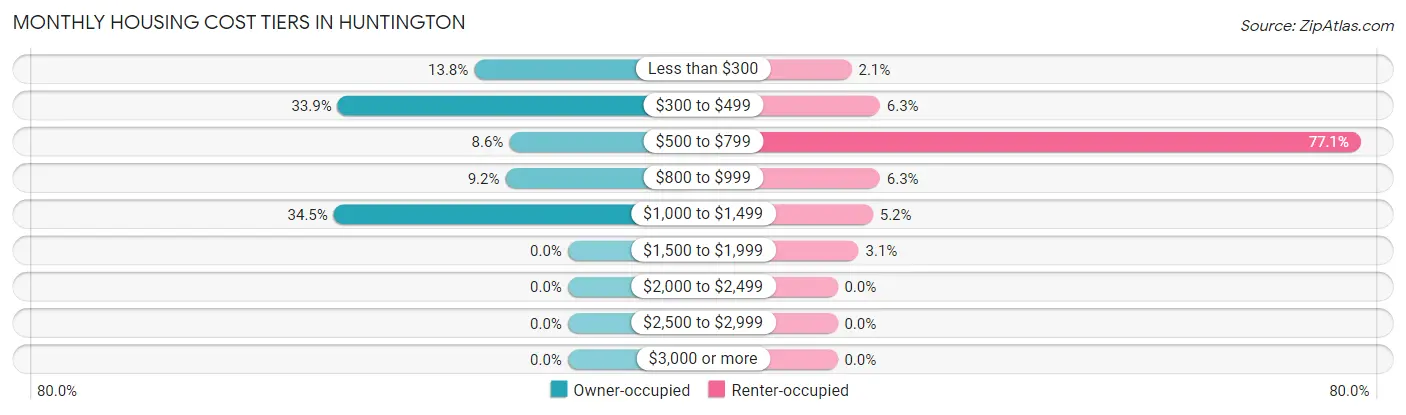
| Monthly Cost | Owner-occupied | Renter-occupied |
| Less than $300 | 24 (13.8%) | 2 (2.1%) |
| $300 to $499 | 59 (33.9%) | 6 (6.2%) |
| $500 to $799 | 15 (8.6%) | 74 (77.1%) |
| $800 to $999 | 16 (9.2%) | 6 (6.2%) |
| $1,000 to $1,499 | 60 (34.5%) | 5 (5.2%) |
| $1,500 to $1,999 | 0 (0.0%) | 3 (3.1%) |
| $2,000 to $2,499 | 0 (0.0%) | 0 (0.0%) |
| $2,500 to $2,999 | 0 (0.0%) | 0 (0.0%) |
| $3,000 or more | 0 (0.0%) | 0 (0.0%) |
| Total | 174 (100.0%) | 96 (100.0%) |
Physical Housing Characteristics in Huntington
Housing Structures in Huntington
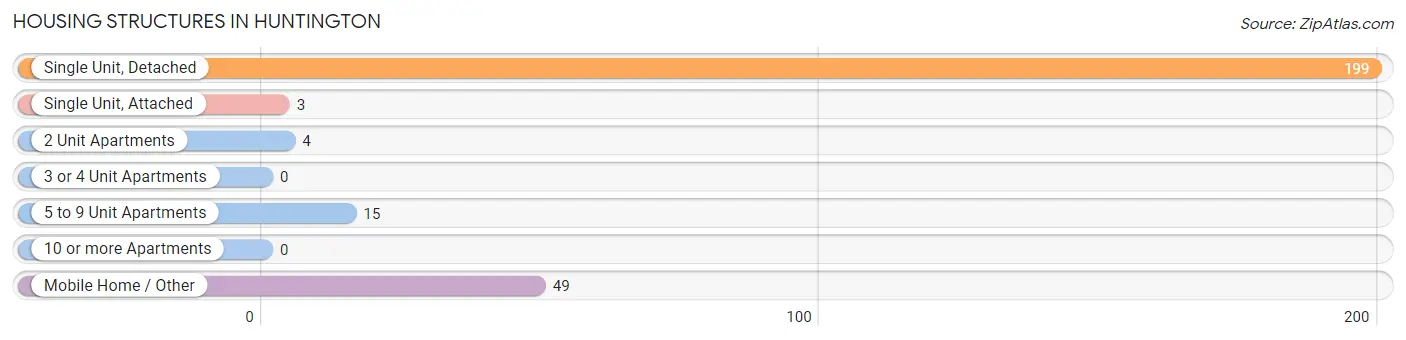
| Structure Type | # Housing Units | % Housing Units |
| Single Unit, Detached | 199 | 73.7% |
| Single Unit, Attached | 3 | 1.1% |
| 2 Unit Apartments | 4 | 1.5% |
| 3 or 4 Unit Apartments | 0 | 0.0% |
| 5 to 9 Unit Apartments | 15 | 5.6% |
| 10 or more Apartments | 0 | 0.0% |
| Mobile Home / Other | 49 | 18.1% |
| Total | 270 | 100.0% |
Housing Structures by Occupancy in Huntington
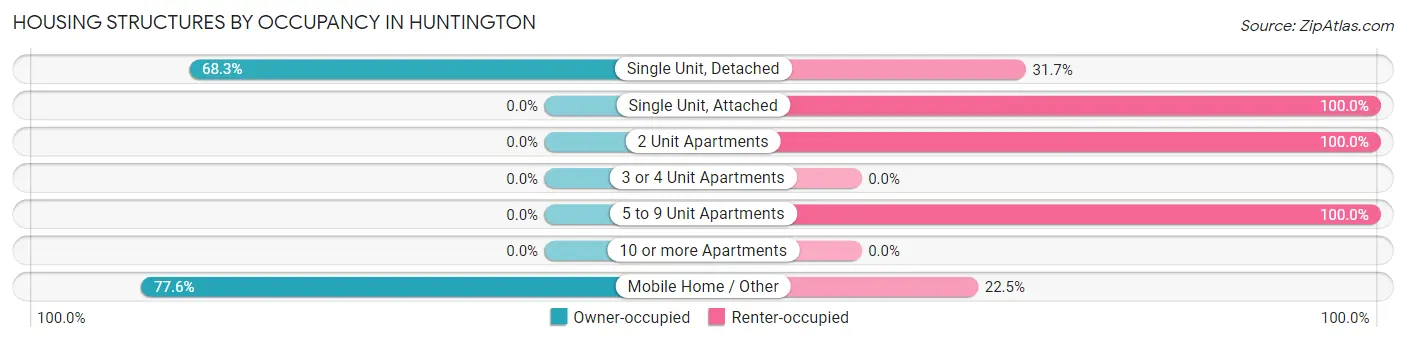
| Structure Type | Owner-occupied | Renter-occupied |
| Single Unit, Detached | 136 (68.3%) | 63 (31.7%) |
| Single Unit, Attached | 0 (0.0%) | 3 (100.0%) |
| 2 Unit Apartments | 0 (0.0%) | 4 (100.0%) |
| 3 or 4 Unit Apartments | 0 (0.0%) | 0 (0.0%) |
| 5 to 9 Unit Apartments | 0 (0.0%) | 15 (100.0%) |
| 10 or more Apartments | 0 (0.0%) | 0 (0.0%) |
| Mobile Home / Other | 38 (77.5%) | 11 (22.5%) |
| Total | 174 (64.4%) | 96 (35.6%) |
Housing Structures by Number of Rooms in Huntington
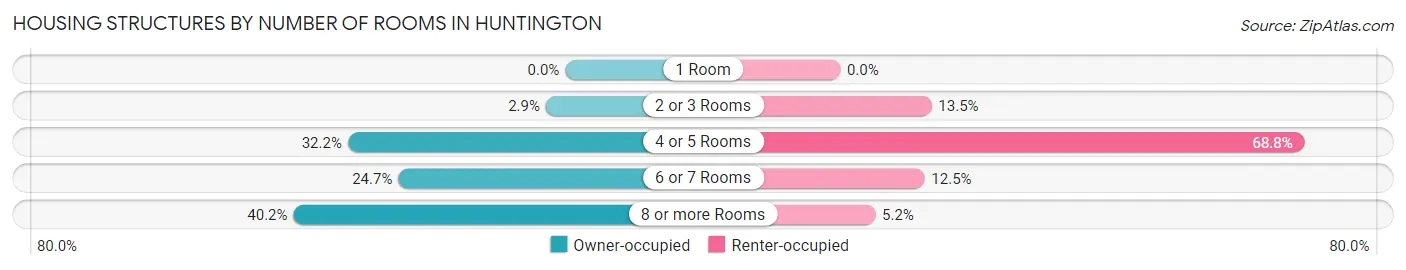
| Number of Rooms | Owner-occupied | Renter-occupied |
| 1 Room | 0 (0.0%) | 0 (0.0%) |
| 2 or 3 Rooms | 5 (2.9%) | 13 (13.5%) |
| 4 or 5 Rooms | 56 (32.2%) | 66 (68.8%) |
| 6 or 7 Rooms | 43 (24.7%) | 12 (12.5%) |
| 8 or more Rooms | 70 (40.2%) | 5 (5.2%) |
| Total | 174 (100.0%) | 96 (100.0%) |
Housing Structure by Heating Type in Huntington
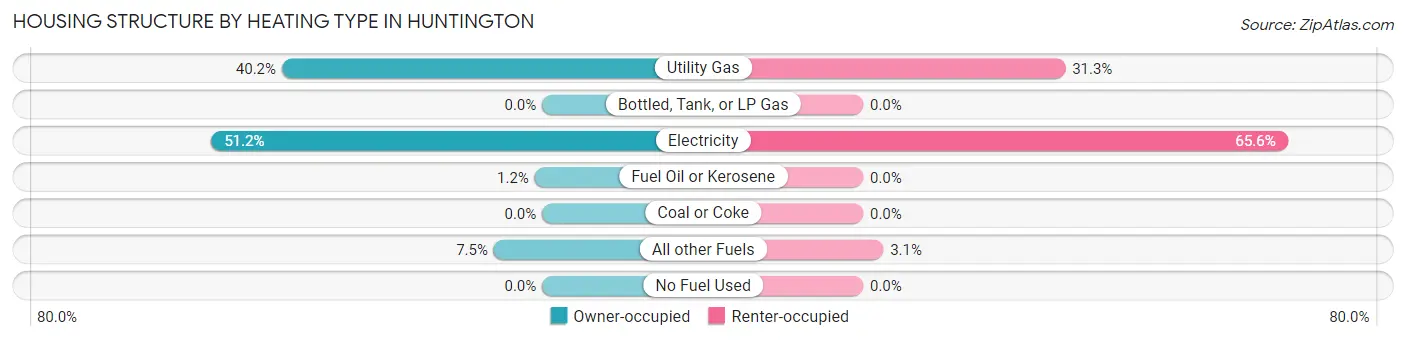
| Heating Type | Owner-occupied | Renter-occupied |
| Utility Gas | 70 (40.2%) | 30 (31.2%) |
| Bottled, Tank, or LP Gas | 0 (0.0%) | 0 (0.0%) |
| Electricity | 89 (51.1%) | 63 (65.6%) |
| Fuel Oil or Kerosene | 2 (1.1%) | 0 (0.0%) |
| Coal or Coke | 0 (0.0%) | 0 (0.0%) |
| All other Fuels | 13 (7.5%) | 3 (3.1%) |
| No Fuel Used | 0 (0.0%) | 0 (0.0%) |
| Total | 174 (100.0%) | 96 (100.0%) |
Household Vehicle Usage in Huntington
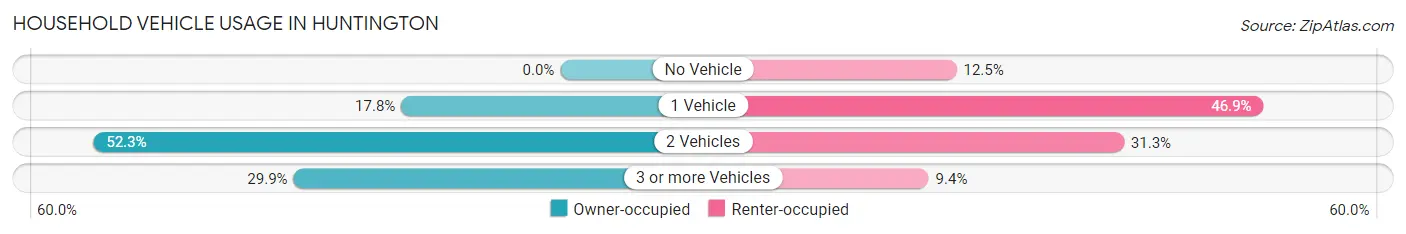
| Vehicles per Household | Owner-occupied | Renter-occupied |
| No Vehicle | 0 (0.0%) | 12 (12.5%) |
| 1 Vehicle | 31 (17.8%) | 45 (46.9%) |
| 2 Vehicles | 91 (52.3%) | 30 (31.2%) |
| 3 or more Vehicles | 52 (29.9%) | 9 (9.4%) |
| Total | 174 (100.0%) | 96 (100.0%) |
Real Estate & Mortgages in Huntington
Real Estate and Mortgage Overview in Huntington
| Characteristic | Without Mortgage | With Mortgage |
| Housing Units | 98 | 76 |
| Median Property Value | $102,300 | $113,500 |
| Median Household Income | $43,333 | $4 |
| Monthly Housing Costs | $387 | $0 |
| Real Estate Taxes | $1,131 | $0 |
Property Value by Mortgage Status in Huntington
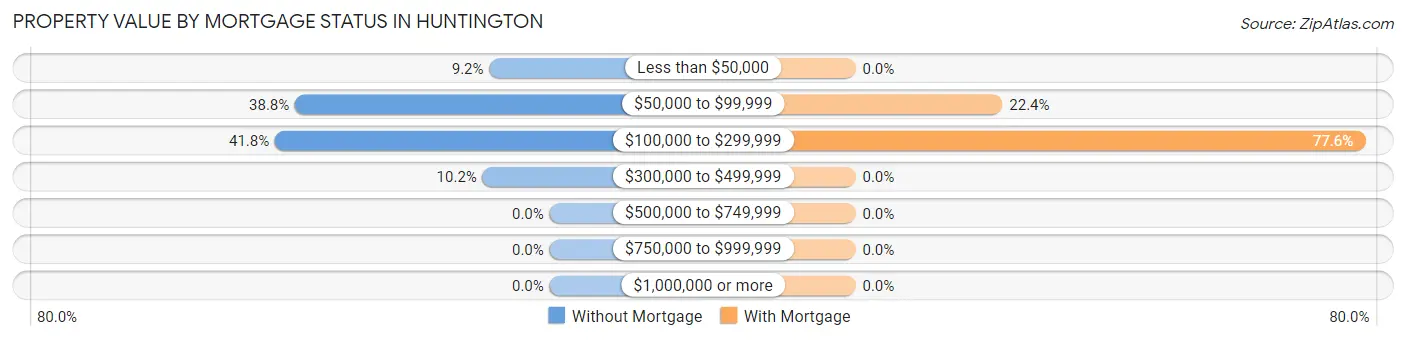
| Property Value | Without Mortgage | With Mortgage |
| Less than $50,000 | 9 (9.2%) | 0 (0.0%) |
| $50,000 to $99,999 | 38 (38.8%) | 17 (22.4%) |
| $100,000 to $299,999 | 41 (41.8%) | 59 (77.6%) |
| $300,000 to $499,999 | 10 (10.2%) | 0 (0.0%) |
| $500,000 to $749,999 | 0 (0.0%) | 0 (0.0%) |
| $750,000 to $999,999 | 0 (0.0%) | 0 (0.0%) |
| $1,000,000 or more | 0 (0.0%) | 0 (0.0%) |
| Total | 98 (100.0%) | 76 (100.0%) |
Household Income by Mortgage Status in Huntington
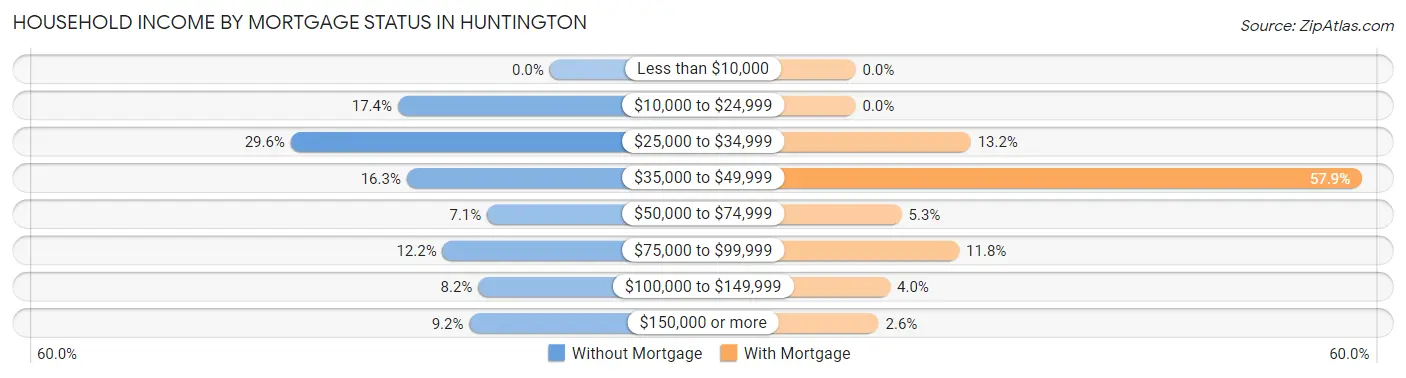
| Household Income | Without Mortgage | With Mortgage |
| Less than $10,000 | 0 (0.0%) | 0 (0.0%) |
| $10,000 to $24,999 | 17 (17.3%) | 0 (0.0%) |
| $25,000 to $34,999 | 29 (29.6%) | 10 (13.2%) |
| $35,000 to $49,999 | 16 (16.3%) | 44 (57.9%) |
| $50,000 to $74,999 | 7 (7.1%) | 4 (5.3%) |
| $75,000 to $99,999 | 12 (12.2%) | 9 (11.8%) |
| $100,000 to $149,999 | 8 (8.2%) | 3 (4.0%) |
| $150,000 or more | 9 (9.2%) | 2 (2.6%) |
| Total | 98 (100.0%) | 76 (100.0%) |
Property Value to Household Income Ratio in Huntington
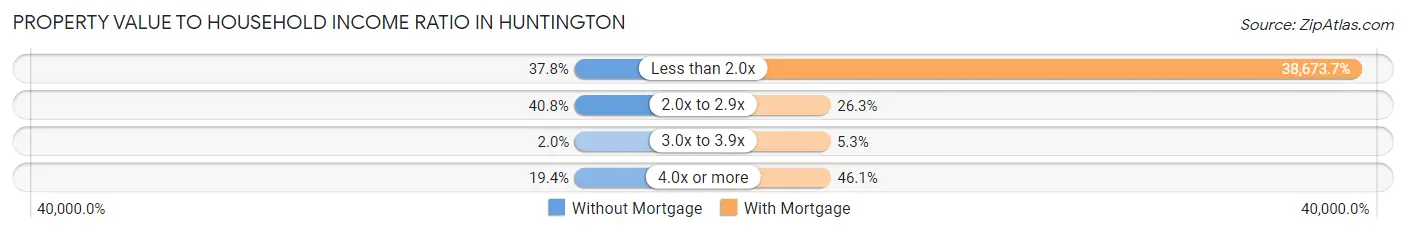
| Value-to-Income Ratio | Without Mortgage | With Mortgage |
| Less than 2.0x | 37 (37.8%) | 29,392 (38,673.7%) |
| 2.0x to 2.9x | 40 (40.8%) | 20 (26.3%) |
| 3.0x to 3.9x | 2 (2.0%) | 4 (5.3%) |
| 4.0x or more | 19 (19.4%) | 35 (46.1%) |
| Total | 98 (100.0%) | 76 (100.0%) |
Real Estate Taxes by Mortgage Status in Huntington
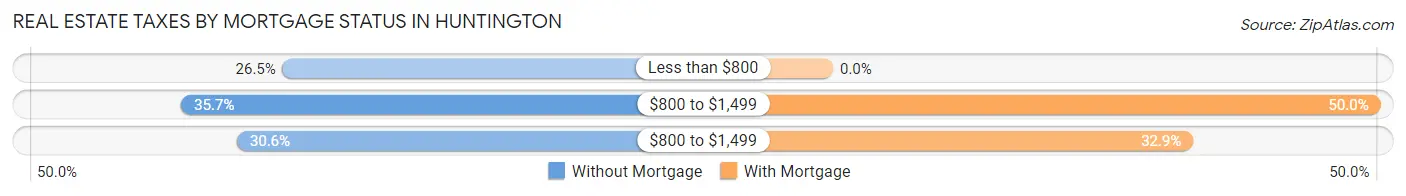
| Property Taxes | Without Mortgage | With Mortgage |
| Less than $800 | 26 (26.5%) | 0 (0.0%) |
| $800 to $1,499 | 35 (35.7%) | 38 (50.0%) |
| $800 to $1,499 | 30 (30.6%) | 25 (32.9%) |
| Total | 98 (100.0%) | 76 (100.0%) |
Health & Disability in Huntington
Health Insurance Coverage by Age in Huntington
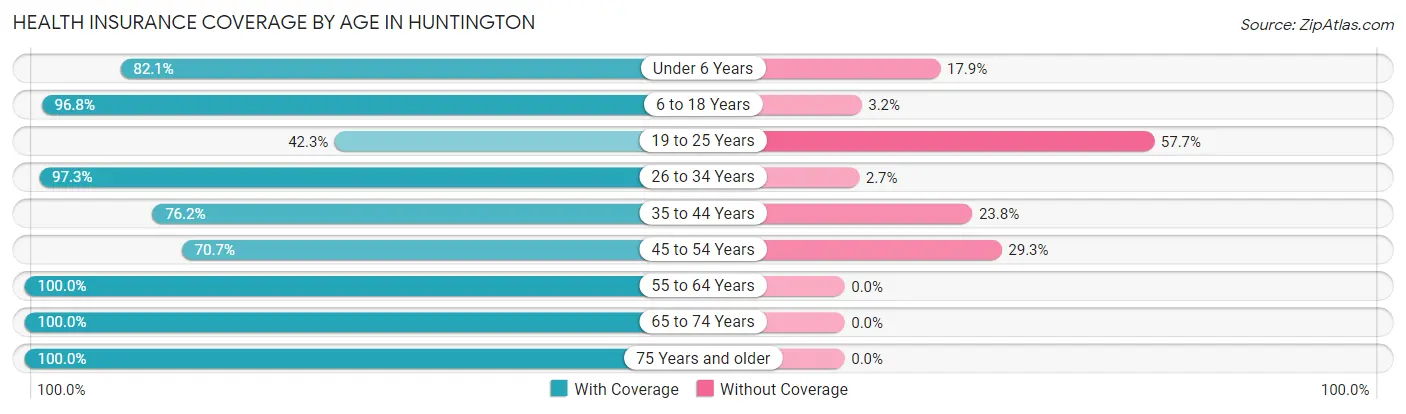
| Age Bracket | With Coverage | Without Coverage |
| Under 6 Years | 23 (82.1%) | 5 (17.9%) |
| 6 to 18 Years | 61 (96.8%) | 2 (3.2%) |
| 19 to 25 Years | 41 (42.3%) | 56 (57.7%) |
| 26 to 34 Years | 72 (97.3%) | 2 (2.7%) |
| 35 to 44 Years | 32 (76.2%) | 10 (23.8%) |
| 45 to 54 Years | 70 (70.7%) | 29 (29.3%) |
| 55 to 64 Years | 57 (100.0%) | 0 (0.0%) |
| 65 to 74 Years | 162 (100.0%) | 0 (0.0%) |
| 75 Years and older | 60 (100.0%) | 0 (0.0%) |
| Total | 578 (84.8%) | 104 (15.2%) |
Health Insurance Coverage by Citizenship Status in Huntington
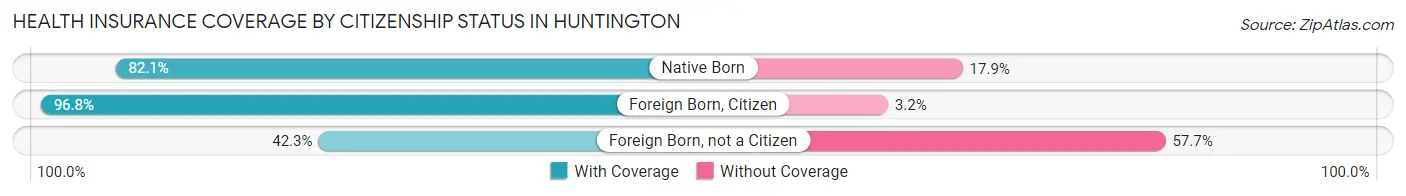
| Citizenship Status | With Coverage | Without Coverage |
| Native Born | 23 (82.1%) | 5 (17.9%) |
| Foreign Born, Citizen | 61 (96.8%) | 2 (3.2%) |
| Foreign Born, not a Citizen | 41 (42.3%) | 56 (57.7%) |
Health Insurance Coverage by Household Income in Huntington
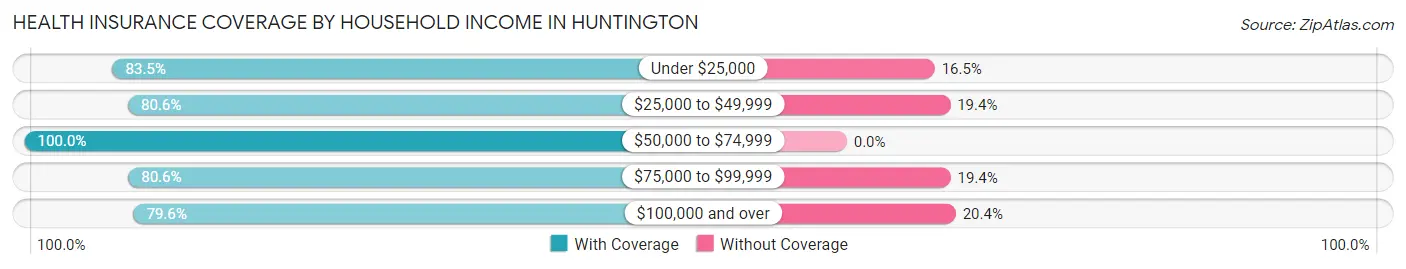
| Household Income | With Coverage | Without Coverage |
| Under $25,000 | 71 (83.5%) | 14 (16.5%) |
| $25,000 to $49,999 | 262 (80.6%) | 63 (19.4%) |
| $50,000 to $74,999 | 138 (100.0%) | 0 (0.0%) |
| $75,000 to $99,999 | 29 (80.6%) | 7 (19.4%) |
| $100,000 and over | 78 (79.6%) | 20 (20.4%) |
Public vs Private Health Insurance Coverage by Age in Huntington
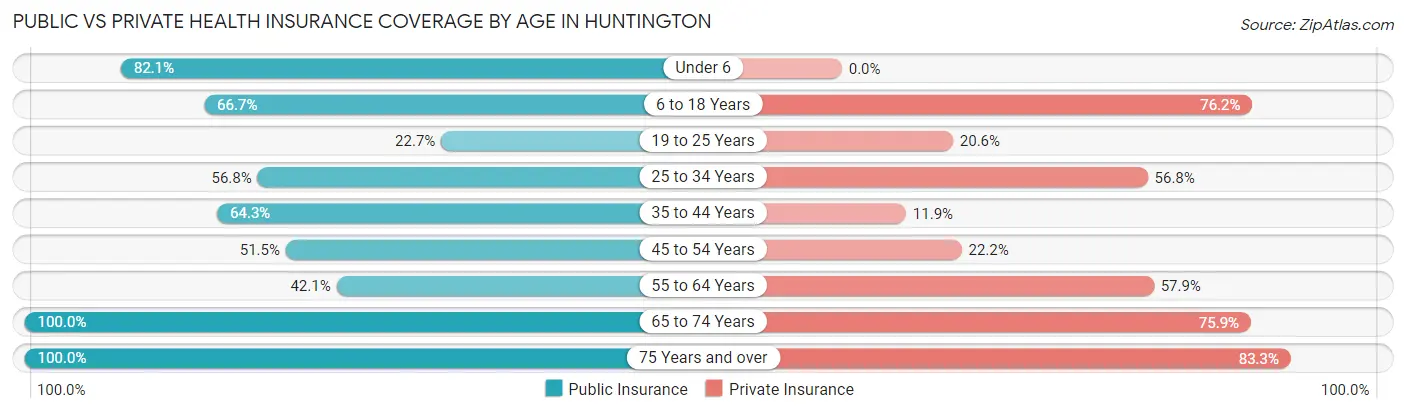
| Age Bracket | Public Insurance | Private Insurance |
| Under 6 | 23 (82.1%) | 0 (0.0%) |
| 6 to 18 Years | 42 (66.7%) | 48 (76.2%) |
| 19 to 25 Years | 22 (22.7%) | 20 (20.6%) |
| 25 to 34 Years | 42 (56.8%) | 42 (56.8%) |
| 35 to 44 Years | 27 (64.3%) | 5 (11.9%) |
| 45 to 54 Years | 51 (51.5%) | 22 (22.2%) |
| 55 to 64 Years | 24 (42.1%) | 33 (57.9%) |
| 65 to 74 Years | 162 (100.0%) | 123 (75.9%) |
| 75 Years and over | 60 (100.0%) | 50 (83.3%) |
| Total | 453 (66.4%) | 343 (50.3%) |
Disability Status by Sex by Age in Huntington
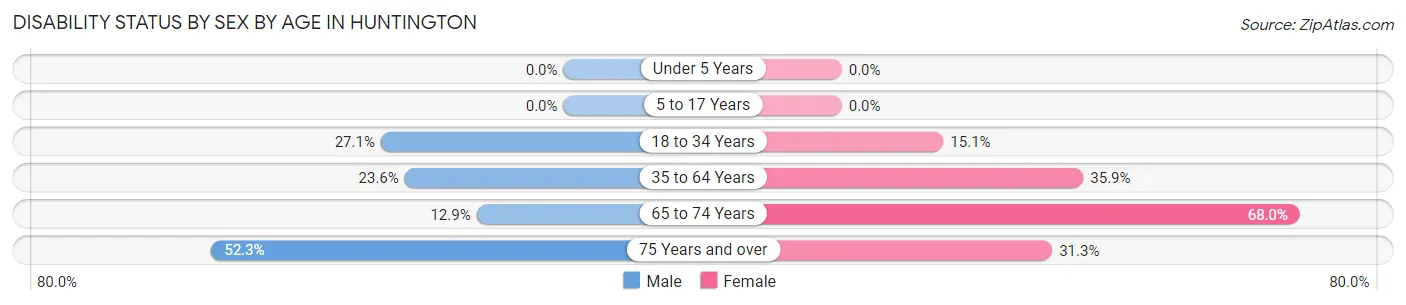
| Age Bracket | Male | Female |
| Under 5 Years | 0 (0.0%) | 0 (0.0%) |
| 5 to 17 Years | 0 (0.0%) | 0 (0.0%) |
| 18 to 34 Years | 32 (27.1%) | 8 (15.1%) |
| 35 to 64 Years | 25 (23.6%) | 33 (35.9%) |
| 65 to 74 Years | 8 (12.9%) | 68 (68.0%) |
| 75 Years and over | 23 (52.3%) | 5 (31.2%) |
Disability Class by Sex by Age in Huntington
Disability Class: Hearing Difficulty
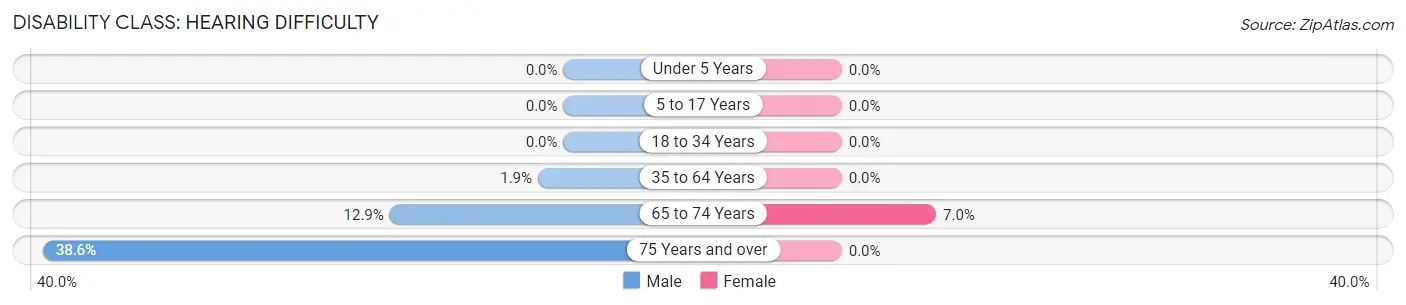
| Age Bracket | Male | Female |
| Under 5 Years | 0 (0.0%) | 0 (0.0%) |
| 5 to 17 Years | 0 (0.0%) | 0 (0.0%) |
| 18 to 34 Years | 0 (0.0%) | 0 (0.0%) |
| 35 to 64 Years | 2 (1.9%) | 0 (0.0%) |
| 65 to 74 Years | 8 (12.9%) | 7 (7.0%) |
| 75 Years and over | 17 (38.6%) | 0 (0.0%) |
Disability Class: Vision Difficulty
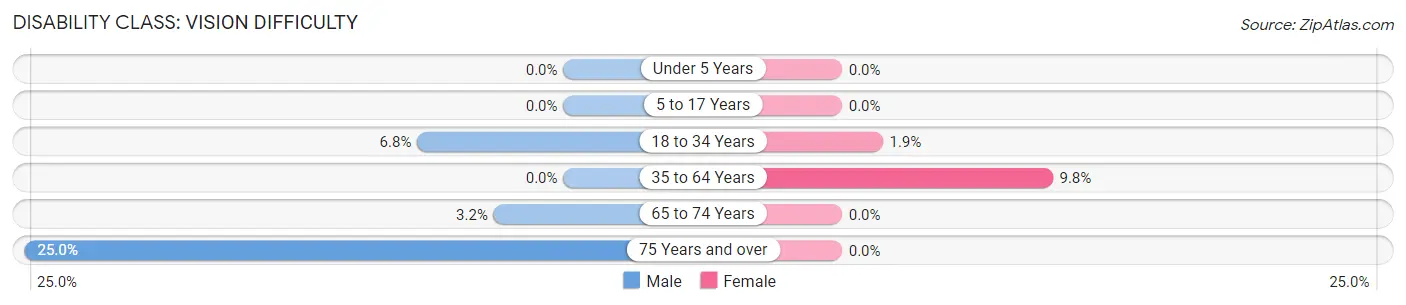
| Age Bracket | Male | Female |
| Under 5 Years | 0 (0.0%) | 0 (0.0%) |
| 5 to 17 Years | 0 (0.0%) | 0 (0.0%) |
| 18 to 34 Years | 8 (6.8%) | 1 (1.9%) |
| 35 to 64 Years | 0 (0.0%) | 9 (9.8%) |
| 65 to 74 Years | 2 (3.2%) | 0 (0.0%) |
| 75 Years and over | 11 (25.0%) | 0 (0.0%) |
Disability Class: Cognitive Difficulty
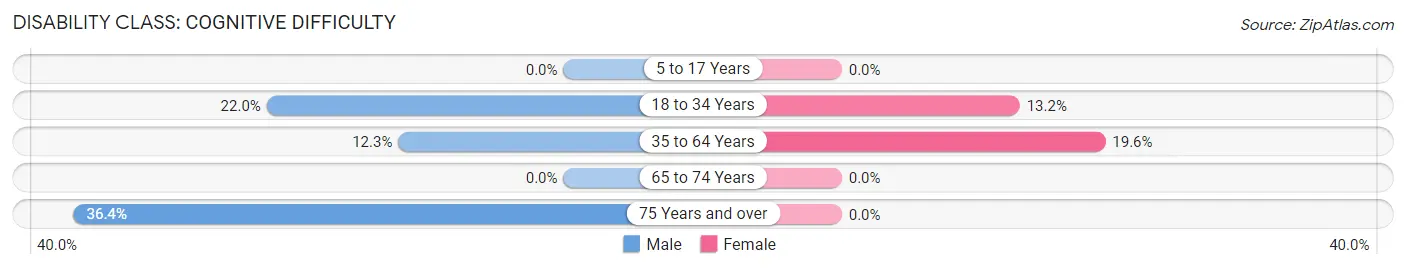
| Age Bracket | Male | Female |
| 5 to 17 Years | 0 (0.0%) | 0 (0.0%) |
| 18 to 34 Years | 26 (22.0%) | 7 (13.2%) |
| 35 to 64 Years | 13 (12.3%) | 18 (19.6%) |
| 65 to 74 Years | 0 (0.0%) | 0 (0.0%) |
| 75 Years and over | 16 (36.4%) | 0 (0.0%) |
Disability Class: Ambulatory Difficulty
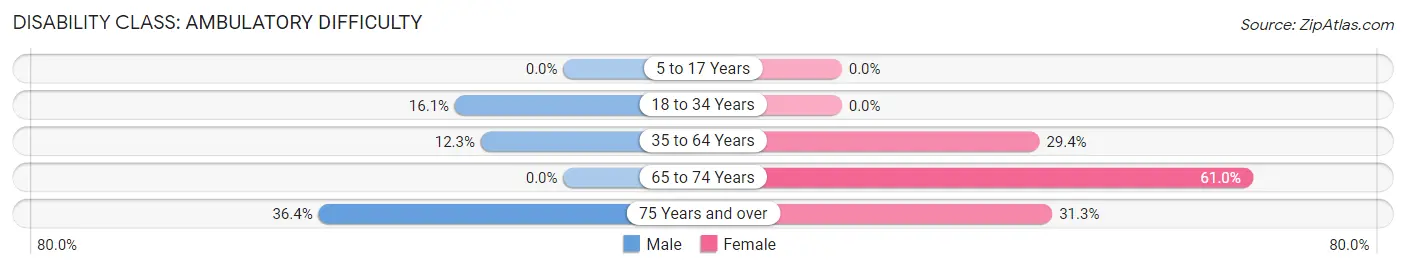
| Age Bracket | Male | Female |
| 5 to 17 Years | 0 (0.0%) | 0 (0.0%) |
| 18 to 34 Years | 19 (16.1%) | 0 (0.0%) |
| 35 to 64 Years | 13 (12.3%) | 27 (29.3%) |
| 65 to 74 Years | 0 (0.0%) | 61 (61.0%) |
| 75 Years and over | 16 (36.4%) | 5 (31.2%) |
Disability Class: Self-Care Difficulty
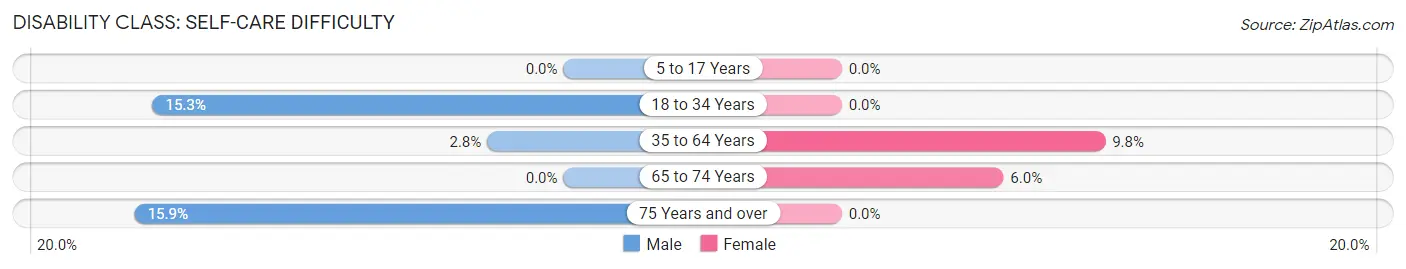
| Age Bracket | Male | Female |
| 5 to 17 Years | 0 (0.0%) | 0 (0.0%) |
| 18 to 34 Years | 18 (15.2%) | 0 (0.0%) |
| 35 to 64 Years | 3 (2.8%) | 9 (9.8%) |
| 65 to 74 Years | 0 (0.0%) | 6 (6.0%) |
| 75 Years and over | 7 (15.9%) | 0 (0.0%) |
Technology Access in Huntington
Computing Device Access in Huntington
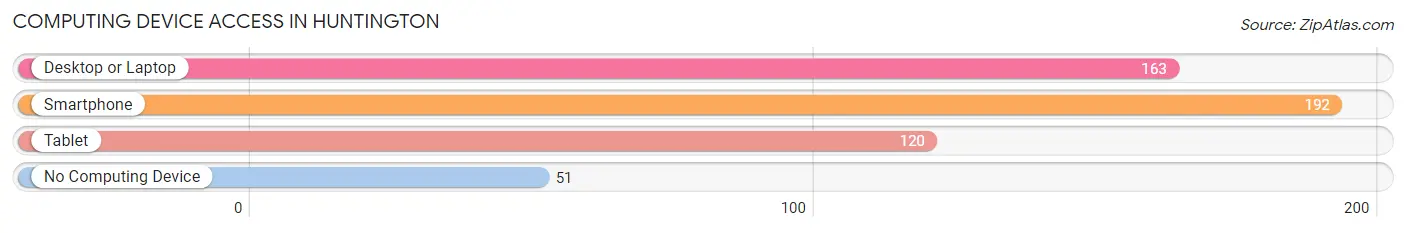
| Device Type | # Households | % Households |
| Desktop or Laptop | 163 | 60.4% |
| Smartphone | 192 | 71.1% |
| Tablet | 120 | 44.4% |
| No Computing Device | 51 | 18.9% |
| Total | 270 | 100.0% |
Internet Access in Huntington
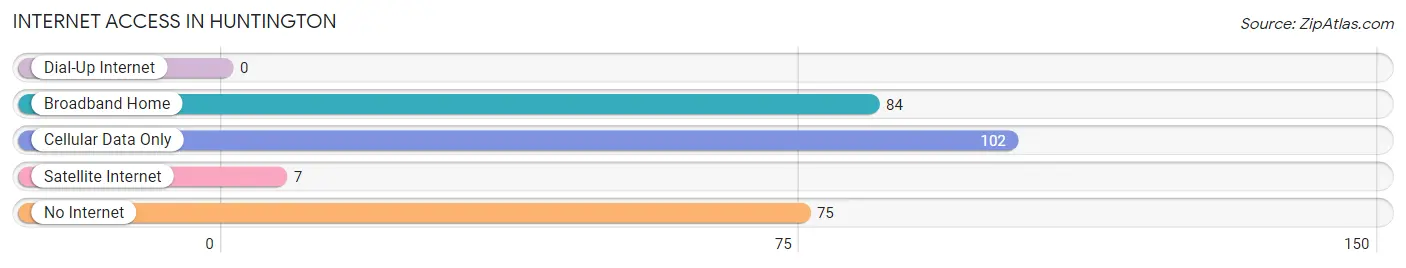
| Internet Type | # Households | % Households |
| Dial-Up Internet | 0 | 0.0% |
| Broadband Home | 84 | 31.1% |
| Cellular Data Only | 102 | 37.8% |
| Satellite Internet | 7 | 2.6% |
| No Internet | 75 | 27.8% |
| Total | 270 | 100.0% |
Huntington Summary
Huntington is a small city located in the Umatilla County of Oregon, United States. It is situated on the banks of the Umatilla River, and is part of the Pendleton-Hermiston Micropolitan Statistical Area. The city has a population of 1,845 as of the 2010 census.
History
The area that is now Huntington was originally inhabited by the Cayuse and Umatilla tribes. The first white settlers arrived in the area in the late 1860s, and the town was officially founded in 1871. The town was named after the Huntington family, who were among the first settlers.
The town grew slowly, and by the early 1900s, it had become a center for agriculture and ranching. The town was also home to a number of businesses, including a flour mill, a creamery, and a sawmill.
In the 1920s, the town began to experience a period of growth, as the nearby Umatilla Army Depot was established. The depot provided jobs for many of the town’s residents, and the population grew to over 1,000 by the 1940s.
Geography
Huntington is located in the Umatilla Valley, at an elevation of 1,845 feet (562 m). The city is situated on the banks of the Umatilla River, and is surrounded by rolling hills and grasslands. The city covers an area of 1.3 square miles (3.4 km2), and has a population density of 1,400 people per square mile (540/km2).
The climate in Huntington is semi-arid, with hot summers and cold winters. The average annual temperature is 54°F (12°C), and the average annual precipitation is 11.5 inches (292 mm).
Economy
The economy of Huntington is largely based on agriculture and ranching. The city is home to a number of farms and ranches, and the surrounding area is known for its production of wheat, barley, and hay.
The city is also home to a number of businesses, including a flour mill, a creamery, and a sawmill. The Umatilla Army Depot is also located nearby, and provides jobs for many of the town’s residents.
Demographics
As of the 2010 census, there were 1,845 people, 717 households, and 486 families residing in the city. The population density was 1,400 people per square mile (540/km2). There were 790 housing units at an average density of 602 per square mile (232/km2).
The racial makeup of the city was 91.2% White, 0.2% African American, 1.2% Native American, 0.4% Asian, 0.1% Pacific Islander, 4.2% from other races, and 2.7% from two or more races. Hispanic or Latino of any race were 8.2% of the population.
There were 717 households, out of which 33.2% had children under the age of 18 living with them, 51.2% were married couples living together, 11.2% had a female householder with no husband present, and 32.7% were non-families. 28.2% of all households were made up of individuals, and 14.2% had someone living alone who was 65 years of age or older. The average household size was 2.56 and the average family size was 3.14.
In the city, the population was spread out, with 28.2% under the age of 18, 8.2% from 18 to 24, 25.2% from 25 to 44, 22.2% from 45 to 64, and 16.2% who were 65 years of age or older. The median age was 36 years. For every 100 females, there were 97.2 males. For every 100 females age 18 and over, there were 92.2 males.
The median income for a household in the city was $30,938, and the median income for a family was $36,250. Males had a median income of $30,000 versus $20,000 for females. The per capita income for the city was $14,945. About 11.2% of families and 14.2% of the population were below the poverty line, including 19.2% of those under age 18 and 8.2% of those age 65 or over.
Common Questions
What is Per Capita Income in Huntington?
Per Capita income in Huntington is $24,235.
What is the Median Family Income in Huntington?
Median Family Income in Huntington is $40,000.
What is the Median Household income in Huntington?
Median Household Income in Huntington is $33,000.
What is Income or Wage Gap in Huntington?
Income or Wage Gap in Huntington is 67.8%.
Women in Huntington earn 32.2 cents for every dollar earned by a man.
What is Inequality or Gini Index in Huntington?
Inequality or Gini Index in Huntington is 0.53.
What is the Total Population of Huntington?
Total Population of Huntington is 682.
What is the Total Male Population of Huntington?
Total Male Population of Huntington is 387.
What is the Total Female Population of Huntington?
Total Female Population of Huntington is 295.
What is the Ratio of Males per 100 Females in Huntington?
There are 131.19 Males per 100 Females in Huntington.
What is the Ratio of Females per 100 Males in Huntington?
There are 76.23 Females per 100 Males in Huntington.
What is the Median Population Age in Huntington?
Median Population Age in Huntington is 50.2 Years.
What is the Average Family Size in Huntington
Average Family Size in Huntington is 3.3 People.
What is the Average Household Size in Huntington
Average Household Size in Huntington is 2.5 People.
How Large is the Labor Force in Huntington?
There are 230 People in the Labor Forcein in Huntington.
What is the Percentage of People in the Labor Force in Huntington?
38.9% of People are in the Labor Force in Huntington.
What is the Unemployment Rate in Huntington?
Unemployment Rate in Huntington is 7.0%.