Zip Codes with the Highest Percentage of Population Employed in Food Preparation & Serving in Oregon
RELATED REPORTS & OPTIONS
Food Preparation & Serving
Oregon
Compare Zip Codes
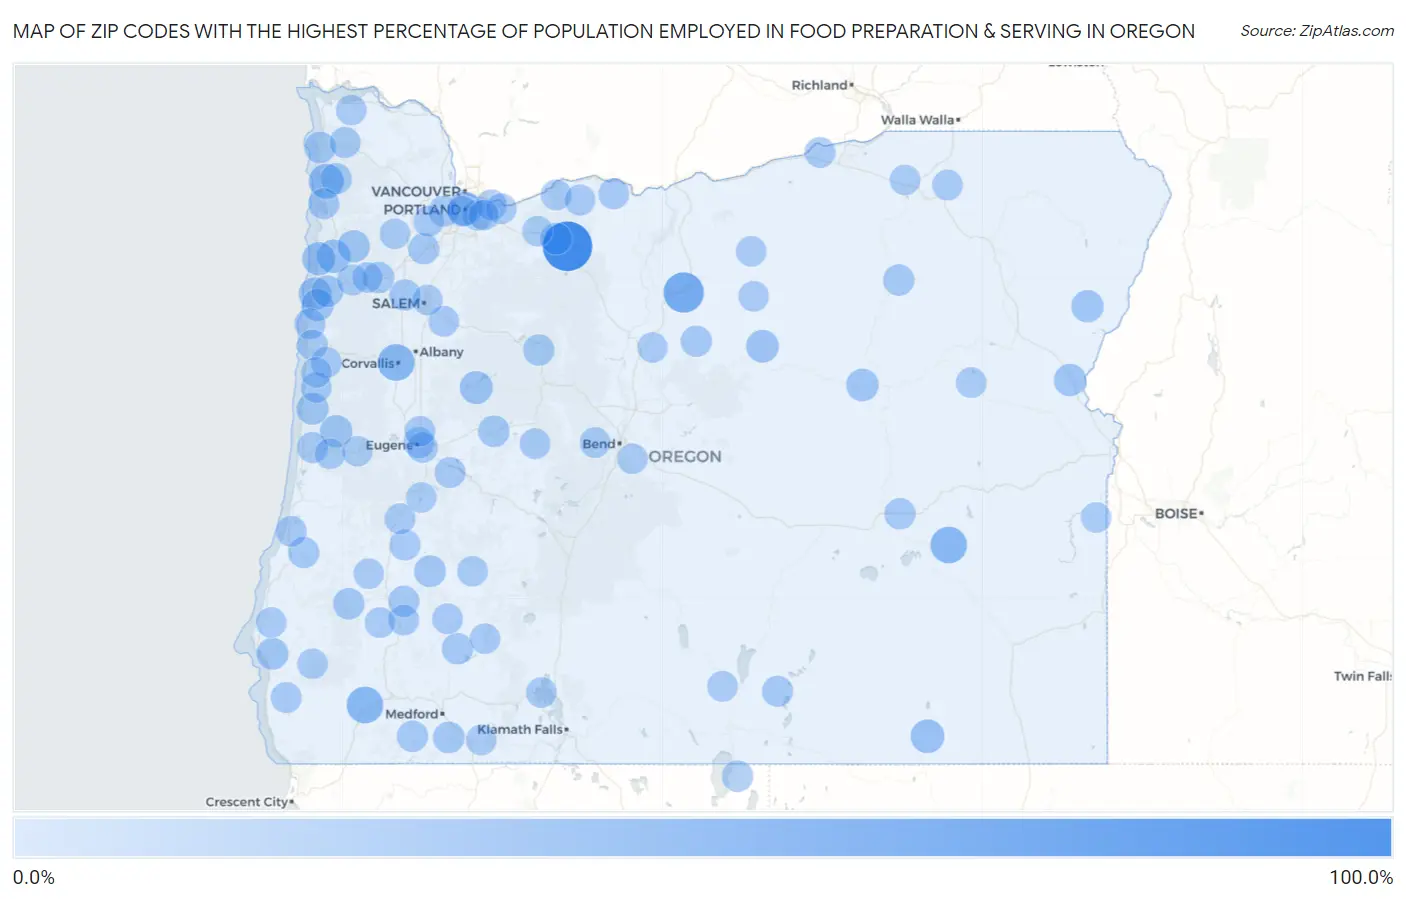
Map of Zip Codes with the Highest Percentage of Population Employed in Food Preparation & Serving in Oregon
0.0%
100.0%
Zip Codes with the Highest Percentage of Population Employed in Food Preparation & Serving in Oregon
| Zip Code | % Employed | vs State | vs National | |
| 1. | 97028 | 91.5% | 5.9%(+85.6)#1 | 5.3%(+86.2)#14 |
| 2. | 97057 | 50.0% | 5.9%(+44.1)#2 | 5.3%(+44.7)#60 |
| 3. | 97331 | 34.7% | 5.9%(+28.7)#3 | 5.3%(+29.4)#154 |
| 4. | 97543 | 34.3% | 5.9%(+28.3)#4 | 5.3%(+29.0)#158 |
| 5. | 97732 | 33.8% | 5.9%(+27.8)#5 | 5.3%(+28.5)#164 |
| 6. | 97147 | 26.1% | 5.9%(+20.2)#6 | 5.3%(+20.8)#284 |
| 7. | 97204 | 21.8% | 5.9%(+15.9)#7 | 5.3%(+16.5)#427 |
| 8. | 97710 | 21.4% | 5.9%(+15.5)#8 | 5.3%(+16.1)#440 |
| 9. | 97112 | 21.1% | 5.9%(+15.2)#9 | 5.3%(+15.8)#454 |
| 10. | 97135 | 19.7% | 5.9%(+13.8)#10 | 5.3%(+14.4)#522 |
| 11. | 97345 | 17.9% | 5.9%(+12.0)#11 | 5.3%(+12.6)#667 |
| 12. | 97750 | 17.3% | 5.9%(+11.4)#12 | 5.3%(+12.0)#719 |
| 13. | 97364 | 17.1% | 5.9%(+11.2)#13 | 5.3%(+11.8)#736 |
| 14. | 97865 | 16.6% | 5.9%(+10.6)#14 | 5.3%(+11.3)#791 |
| 15. | 97480 | 15.7% | 5.9%(+9.74)#15 | 5.3%(+10.4)#897 |
| 16. | 97907 | 15.3% | 5.9%(+9.37)#16 | 5.3%(+10.0)#946 |
| 17. | 97834 | 15.2% | 5.9%(+9.32)#17 | 5.3%(+9.96)#953 |
| 18. | 97108 | 15.0% | 5.9%(+9.07)#18 | 5.3%(+9.71)#981 |
| 19. | 97498 | 14.4% | 5.9%(+8.49)#19 | 5.3%(+9.13)#1,075 |
| 20. | 97367 | 14.3% | 5.9%(+8.33)#20 | 5.3%(+8.97)#1,110 |
| 21. | 97465 | 13.5% | 5.9%(+7.55)#21 | 5.3%(+8.19)#1,284 |
| 22. | 97049 | 13.4% | 5.9%(+7.42)#22 | 5.3%(+8.07)#1,299 |
| 23. | 97443 | 13.3% | 5.9%(+7.33)#23 | 5.3%(+7.97)#1,327 |
| 24. | 97110 | 12.9% | 5.9%(+6.94)#24 | 5.3%(+7.58)#1,423 |
| 25. | 97368 | 12.7% | 5.9%(+6.80)#25 | 5.3%(+7.45)#1,459 |
| 26. | 97540 | 12.5% | 5.9%(+6.57)#26 | 5.3%(+7.21)#1,510 |
| 27. | 97488 | 12.3% | 5.9%(+6.37)#27 | 5.3%(+7.01)#1,568 |
| 28. | 97416 | 11.8% | 5.9%(+5.91)#28 | 5.3%(+6.55)#1,724 |
| 29. | 97371 | 11.8% | 5.9%(+5.89)#29 | 5.3%(+6.53)#1,732 |
| 30. | 97880 | 11.5% | 5.9%(+5.55)#30 | 5.3%(+6.19)#1,852 |
| 31. | 97530 | 11.4% | 5.9%(+5.50)#31 | 5.3%(+6.14)#1,868 |
| 32. | 97541 | 11.4% | 5.9%(+5.46)#32 | 5.3%(+6.10)#1,881 |
| 33. | 97635 | 11.3% | 5.9%(+5.41)#33 | 5.3%(+6.05)#1,903 |
| 34. | 97131 | 11.2% | 5.9%(+5.26)#34 | 5.3%(+5.90)#1,965 |
| 35. | 97711 | 11.1% | 5.9%(+5.18)#35 | 5.3%(+5.83)#2,009 |
| 36. | 97378 | 11.1% | 5.9%(+5.13)#36 | 5.3%(+5.77)#2,033 |
| 37. | 97720 | 11.1% | 5.9%(+5.13)#37 | 5.3%(+5.77)#2,034 |
| 38. | 97350 | 10.9% | 5.9%(+4.98)#38 | 5.3%(+5.62)#2,099 |
| 39. | 97420 | 10.7% | 5.9%(+4.78)#39 | 5.3%(+5.42)#2,206 |
| 40. | 97115 | 10.5% | 5.9%(+4.55)#40 | 5.3%(+5.19)#2,335 |
| 41. | 97457 | 10.4% | 5.9%(+4.46)#41 | 5.3%(+5.10)#2,382 |
| 42. | 97637 | 10.1% | 5.9%(+4.22)#42 | 5.3%(+4.86)#2,526 |
| 43. | 97118 | 10.1% | 5.9%(+4.17)#43 | 5.3%(+4.81)#2,558 |
| 44. | 97138 | 10.0% | 5.9%(+4.08)#44 | 5.3%(+4.72)#2,625 |
| 45. | 97266 | 10.0% | 5.9%(+4.05)#45 | 5.3%(+4.69)#2,652 |
| 46. | 97401 | 10.0% | 5.9%(+4.04)#46 | 5.3%(+4.69)#2,657 |
| 47. | 97479 | 9.9% | 5.9%(+4.00)#47 | 5.3%(+4.64)#2,684 |
| 48. | 97439 | 9.9% | 5.9%(+3.97)#48 | 5.3%(+4.61)#2,708 |
| 49. | 97431 | 9.8% | 5.9%(+3.85)#49 | 5.3%(+4.49)#2,814 |
| 50. | 97024 | 9.6% | 5.9%(+3.67)#50 | 5.3%(+4.31)#2,969 |
| 51. | 97444 | 9.6% | 5.9%(+3.65)#51 | 5.3%(+4.29)#2,998 |
| 52. | 97014 | 9.5% | 5.9%(+3.60)#52 | 5.3%(+4.24)#3,027 |
| 53. | 97031 | 9.5% | 5.9%(+3.59)#53 | 5.3%(+4.23)#3,047 |
| 54. | 97347 | 9.5% | 5.9%(+3.57)#54 | 5.3%(+4.21)#3,058 |
| 55. | 97341 | 9.5% | 5.9%(+3.56)#55 | 5.3%(+4.20)#3,068 |
| 56. | 97040 | 9.5% | 5.9%(+3.55)#56 | 5.3%(+4.19)#3,075 |
| 57. | 97391 | 9.4% | 5.9%(+3.42)#57 | 5.3%(+4.06)#3,188 |
| 58. | 97499 | 9.3% | 5.9%(+3.41)#58 | 5.3%(+4.05)#3,213 |
| 59. | 97060 | 9.2% | 5.9%(+3.27)#59 | 5.3%(+3.91)#3,324 |
| 60. | 97484 | 9.2% | 5.9%(+3.27)#60 | 5.3%(+3.91)#3,329 |
| 61. | 97003 | 9.1% | 5.9%(+3.17)#61 | 5.3%(+3.81)#3,414 |
| 62. | 97844 | 9.0% | 5.9%(+3.09)#62 | 5.3%(+3.73)#3,511 |
| 63. | 97417 | 9.0% | 5.9%(+3.02)#63 | 5.3%(+3.66)#3,574 |
| 64. | 97123 | 8.9% | 5.9%(+2.96)#64 | 5.3%(+3.60)#3,628 |
| 65. | 97810 | 8.8% | 5.9%(+2.91)#65 | 5.3%(+3.56)#3,673 |
| 66. | 97413 | 8.8% | 5.9%(+2.90)#66 | 5.3%(+3.54)#3,698 |
| 67. | 97459 | 8.8% | 5.9%(+2.82)#67 | 5.3%(+3.47)#3,781 |
| 68. | 97394 | 8.7% | 5.9%(+2.79)#68 | 5.3%(+3.43)#3,833 |
| 69. | 97201 | 8.7% | 5.9%(+2.77)#69 | 5.3%(+3.41)#3,845 |
| 70. | 97403 | 8.6% | 5.9%(+2.69)#70 | 5.3%(+3.33)#3,943 |
| 71. | 97447 | 8.6% | 5.9%(+2.64)#71 | 5.3%(+3.29)#3,999 |
| 72. | 97325 | 8.5% | 5.9%(+2.59)#72 | 5.3%(+3.24)#4,047 |
| 73. | 97408 | 8.5% | 5.9%(+2.59)#73 | 5.3%(+3.23)#4,052 |
| 74. | 97365 | 8.5% | 5.9%(+2.58)#74 | 5.3%(+3.22)#4,065 |
| 75. | 97011 | 8.4% | 5.9%(+2.51)#75 | 5.3%(+3.15)#4,131 |
| 76. | 97601 | 8.3% | 5.9%(+2.34)#76 | 5.3%(+2.98)#4,354 |
| 77. | 97469 | 8.3% | 5.9%(+2.33)#77 | 5.3%(+2.97)#4,370 |
| 78. | 97536 | 8.3% | 5.9%(+2.32)#78 | 5.3%(+2.96)#4,377 |
| 79. | 97301 | 8.2% | 5.9%(+2.31)#79 | 5.3%(+2.95)#4,391 |
| 80. | 97630 | 8.2% | 5.9%(+2.30)#80 | 5.3%(+2.94)#4,404 |
| 81. | 97703 | 8.2% | 5.9%(+2.27)#81 | 5.3%(+2.91)#4,438 |
| 82. | 97823 | 8.2% | 5.9%(+2.24)#82 | 5.3%(+2.88)#4,484 |
| 83. | 97406 | 8.1% | 5.9%(+2.20)#83 | 5.3%(+2.84)#4,538 |
| 84. | 97830 | 8.1% | 5.9%(+2.18)#84 | 5.3%(+2.82)#4,560 |
| 85. | 97702 | 8.1% | 5.9%(+2.13)#85 | 5.3%(+2.77)#4,646 |
| 86. | 97801 | 8.0% | 5.9%(+2.12)#86 | 5.3%(+2.76)#4,664 |
| 87. | 97884 | 8.0% | 5.9%(+2.07)#87 | 5.3%(+2.71)#4,730 |
| 88. | 97520 | 8.0% | 5.9%(+2.06)#88 | 5.3%(+2.70)#4,746 |
| 89. | 97450 | 8.0% | 5.9%(+2.04)#89 | 5.3%(+2.68)#4,772 |
| 90. | 97236 | 8.0% | 5.9%(+2.03)#90 | 5.3%(+2.67)#4,793 |
| 91. | 97148 | 7.9% | 5.9%(+2.02)#91 | 5.3%(+2.66)#4,819 |
| 92. | 97376 | 7.9% | 5.9%(+1.96)#92 | 5.3%(+2.60)#4,901 |
| 93. | 97103 | 7.9% | 5.9%(+1.95)#93 | 5.3%(+2.59)#4,922 |
| 94. | 97453 | 7.8% | 5.9%(+1.90)#94 | 5.3%(+2.54)#4,994 |
| 95. | 97396 | 7.8% | 5.9%(+1.88)#95 | 5.3%(+2.52)#5,038 |
| 96. | 97490 | 7.7% | 5.9%(+1.77)#96 | 5.3%(+2.41)#5,218 |
| 97. | 97471 | 7.7% | 5.9%(+1.75)#97 | 5.3%(+2.39)#5,252 |
| 98. | 97901 | 7.6% | 5.9%(+1.65)#98 | 5.3%(+2.30)#5,404 |
| 99. | 97741 | 7.6% | 5.9%(+1.65)#99 | 5.3%(+2.29)#5,427 |
| 100. | 97424 | 7.6% | 5.9%(+1.63)#100 | 5.3%(+2.27)#5,445 |
Common Questions
What are the Top 10 Zip Codes with the Highest Percentage of Population Employed in Food Preparation & Serving in Oregon?
Top 10 Zip Codes with the Highest Percentage of Population Employed in Food Preparation & Serving in Oregon are:
What zip code has the Highest Percentage of Population Employed in Food Preparation & Serving in Oregon?
97028 has the Highest Percentage of Population Employed in Food Preparation & Serving in Oregon with 91.5%.
What is the Percentage of Population Employed in Food Preparation & Serving in the State of Oregon?
Percentage of Population Employed in Food Preparation & Serving in Oregon is 5.9%.
What is the Percentage of Population Employed in Food Preparation & Serving in the United States?
Percentage of Population Employed in Food Preparation & Serving in the United States is 5.3%.