Fossil, OR Map & Demographics
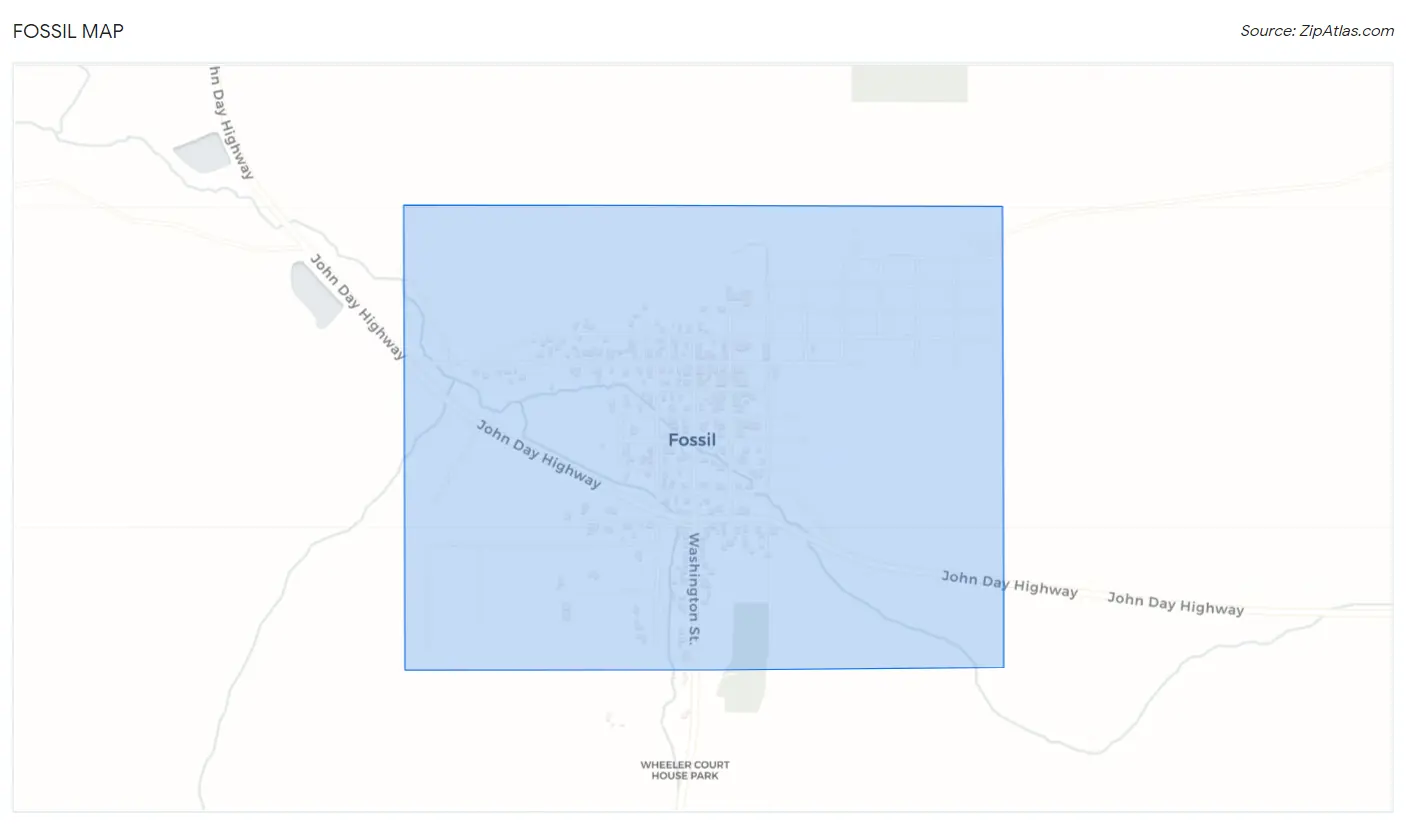
Fossil Map
Fossil Overview
$31,017
PER CAPITA INCOME
$83,958
AVG FAMILY INCOME
$50,938
AVG HOUSEHOLD INCOME
5.3%
WAGE / INCOME GAP [ % ]
94.7¢/ $1
WAGE / INCOME GAP [ $ ]
0.37
INEQUALITY / GINI INDEX
485
TOTAL POPULATION
232
MALE POPULATION
253
FEMALE POPULATION
91.70
MALES / 100 FEMALES
109.05
FEMALES / 100 MALES
62.1
MEDIAN AGE
2.8
AVG FAMILY SIZE
2.0
AVG HOUSEHOLD SIZE
184
LABOR FORCE [ PEOPLE ]
41.3%
PERCENT IN LABOR FORCE
6.5%
UNEMPLOYMENT RATE
Fossil Zip Codes
Fossil Area Codes
Income in Fossil
Income Overview in Fossil
Per Capita Income in Fossil is $31,017, while median incomes of families and households are $83,958 and $50,938 respectively.
| Characteristic | Number | Measure |
| Per Capita Income | 485 | $31,017 |
| Median Family Income | 131 | $83,958 |
| Mean Family Income | 131 | $84,082 |
| Median Household Income | 242 | $50,938 |
| Mean Household Income | 242 | $64,101 |
| Income Deficit | 131 | $0 |
| Wage / Income Gap (%) | 485 | 5.31% |
| Wage / Income Gap ($) | 485 | 94.69¢ per $1 |
| Gini / Inequality Index | 485 | 0.37 |
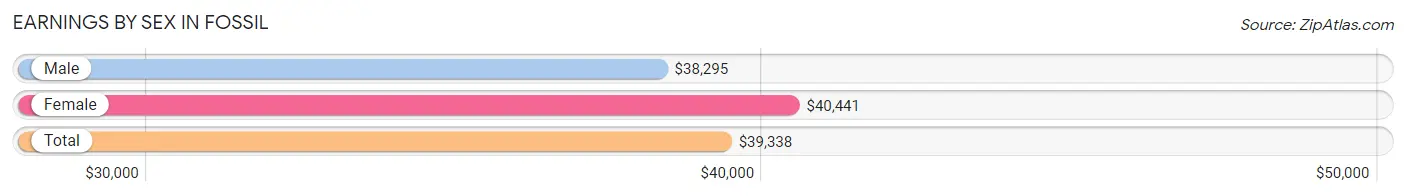
Earnings by Sex in Fossil
Average Earnings in Fossil are $39,338, $38,295 for men and $40,441 for women, a difference of 5.3%.
| Sex | Number | Average Earnings |
| Male | 111 (50.2%) | $38,295 |
| Female | 110 (49.8%) | $40,441 |
| Total | 221 (100.0%) | $39,338 |
Earnings by Sex by Income Bracket in Fossil
The most common earnings brackets in Fossil are $65,000 to $74,999 for men (23 | 20.7%) and $65,000 to $74,999 for women (35 | 31.8%).
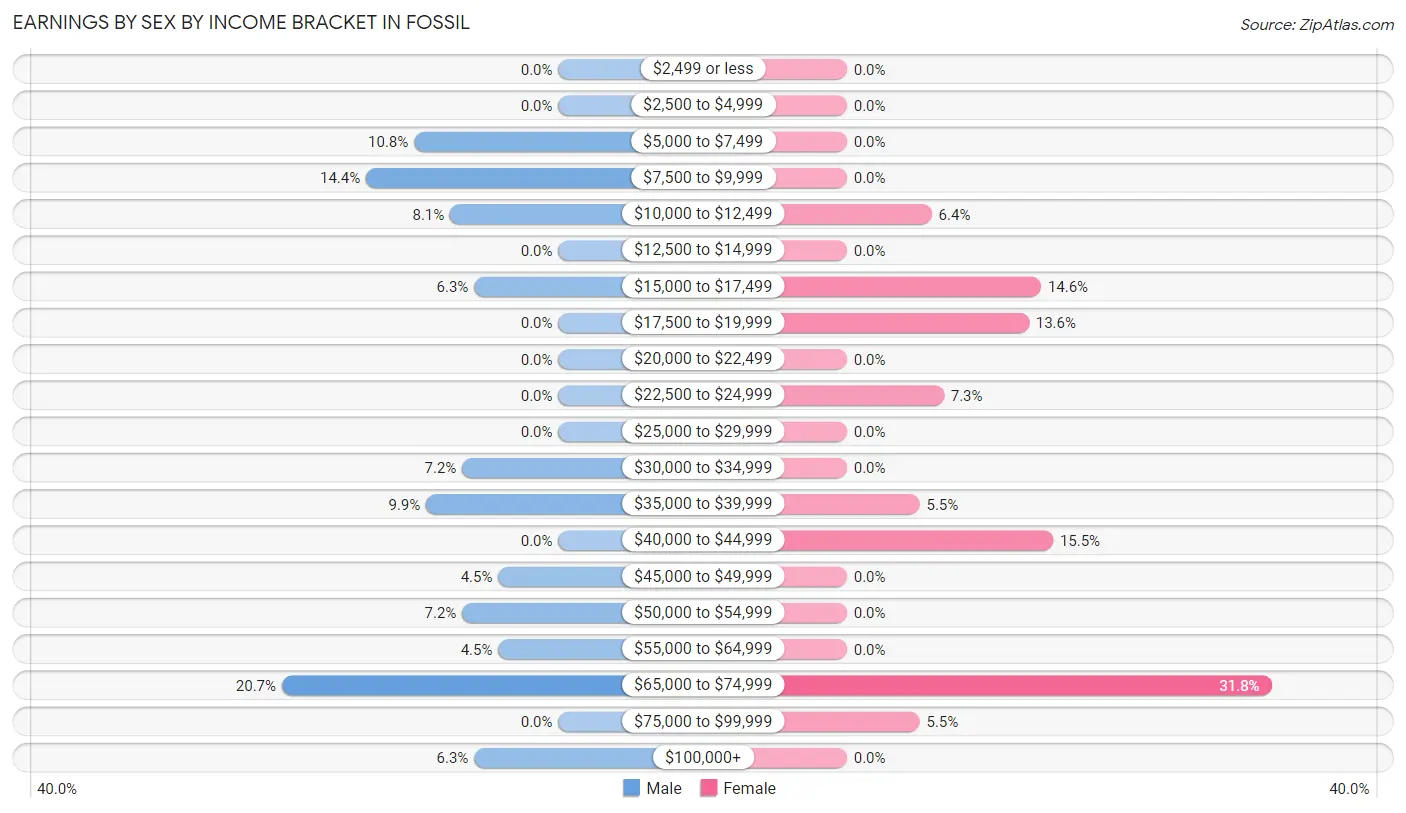
| Income | Male | Female |
| $2,499 or less | 0 (0.0%) | 0 (0.0%) |
| $2,500 to $4,999 | 0 (0.0%) | 0 (0.0%) |
| $5,000 to $7,499 | 12 (10.8%) | 0 (0.0%) |
| $7,500 to $9,999 | 16 (14.4%) | 0 (0.0%) |
| $10,000 to $12,499 | 9 (8.1%) | 7 (6.4%) |
| $12,500 to $14,999 | 0 (0.0%) | 0 (0.0%) |
| $15,000 to $17,499 | 7 (6.3%) | 16 (14.5%) |
| $17,500 to $19,999 | 0 (0.0%) | 15 (13.6%) |
| $20,000 to $22,499 | 0 (0.0%) | 0 (0.0%) |
| $22,500 to $24,999 | 0 (0.0%) | 8 (7.3%) |
| $25,000 to $29,999 | 0 (0.0%) | 0 (0.0%) |
| $30,000 to $34,999 | 8 (7.2%) | 0 (0.0%) |
| $35,000 to $39,999 | 11 (9.9%) | 6 (5.4%) |
| $40,000 to $44,999 | 0 (0.0%) | 17 (15.4%) |
| $45,000 to $49,999 | 5 (4.5%) | 0 (0.0%) |
| $50,000 to $54,999 | 8 (7.2%) | 0 (0.0%) |
| $55,000 to $64,999 | 5 (4.5%) | 0 (0.0%) |
| $65,000 to $74,999 | 23 (20.7%) | 35 (31.8%) |
| $75,000 to $99,999 | 0 (0.0%) | 6 (5.4%) |
| $100,000+ | 7 (6.3%) | 0 (0.0%) |
| Total | 111 (100.0%) | 110 (100.0%) |
Earnings by Sex by Educational Attainment in Fossil
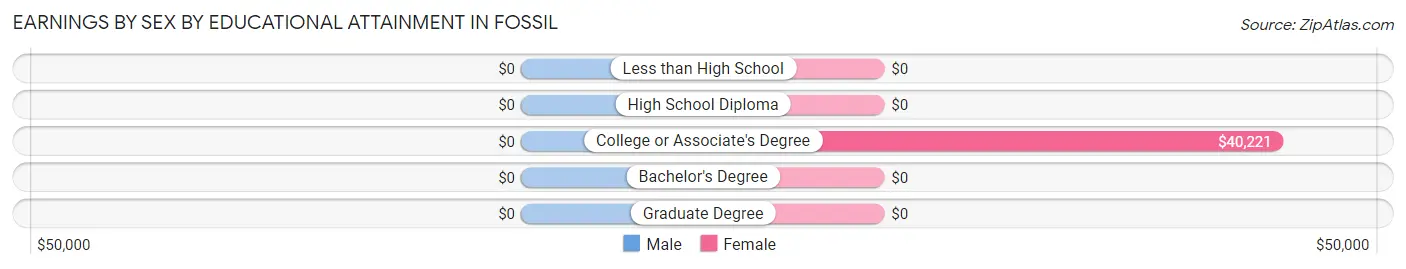
| Educational Attainment | Male Income | Female Income |
| Less than High School | - | - |
| High School Diploma | - | - |
| College or Associate's Degree | - | - |
| Bachelor's Degree | - | - |
| Graduate Degree | - | - |
| Total | $38,864 | $41,029 |
Family Income in Fossil
Family Income Brackets in Fossil
According to the Fossil family income data, there are 56 families falling into the $100,000 to $149,999 income range, which is the most common income bracket and makes up 42.7% of all families.
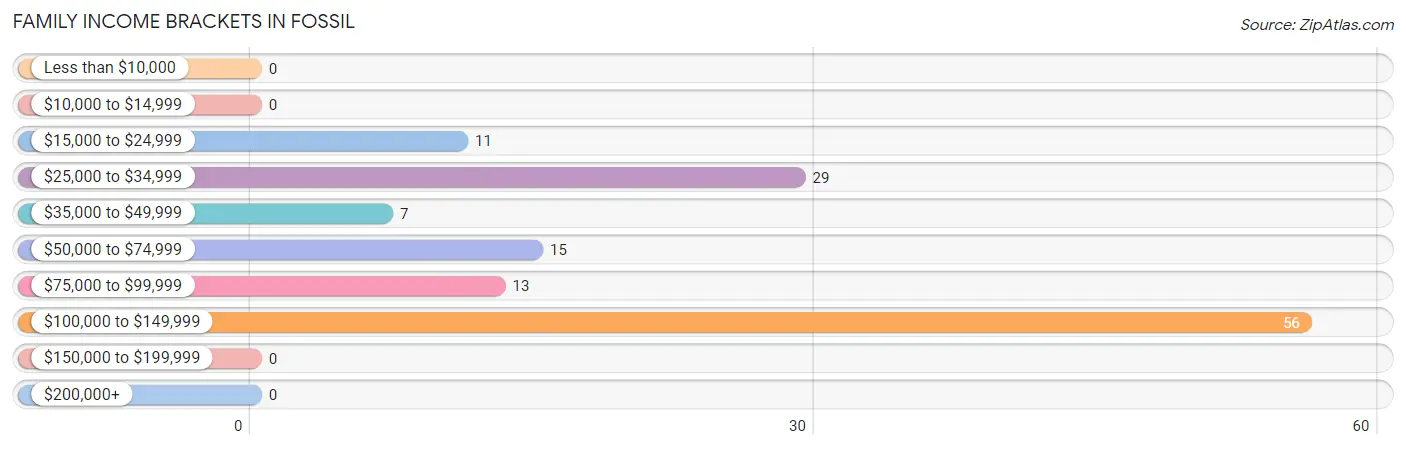
| Income Bracket | # Families | % Families |
| Less than $10,000 | 0 | 0.0% |
| $10,000 to $14,999 | 0 | 0.0% |
| $15,000 to $24,999 | 11 | 8.4% |
| $25,000 to $34,999 | 29 | 22.1% |
| $35,000 to $49,999 | 7 | 5.3% |
| $50,000 to $74,999 | 15 | 11.5% |
| $75,000 to $99,999 | 13 | 9.9% |
| $100,000 to $149,999 | 56 | 42.7% |
| $150,000 to $199,999 | 0 | 0.0% |
| $200,000+ | 0 | 0.0% |
Family Income by Famaliy Size in Fossil
3-person families (65 | 49.6%) account for the highest median family income in Fossil with $135,179 per family, while 3-person families (65 | 49.6%) have the highest median income of $45,060 per family member.
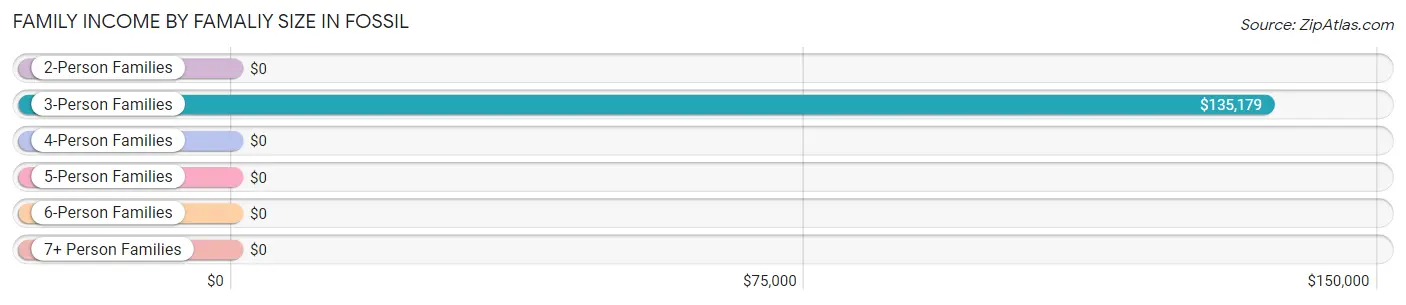
| Income Bracket | # Families | Median Income |
| 2-Person Families | 56 (42.7%) | $0 |
| 3-Person Families | 65 (49.6%) | $135,179 |
| 4-Person Families | 8 (6.1%) | $0 |
| 5-Person Families | 2 (1.5%) | $0 |
| 6-Person Families | 0 (0.0%) | $0 |
| 7+ Person Families | 0 (0.0%) | $0 |
| Total | 131 (100.0%) | $83,958 |
Family Income by Number of Earners in Fossil
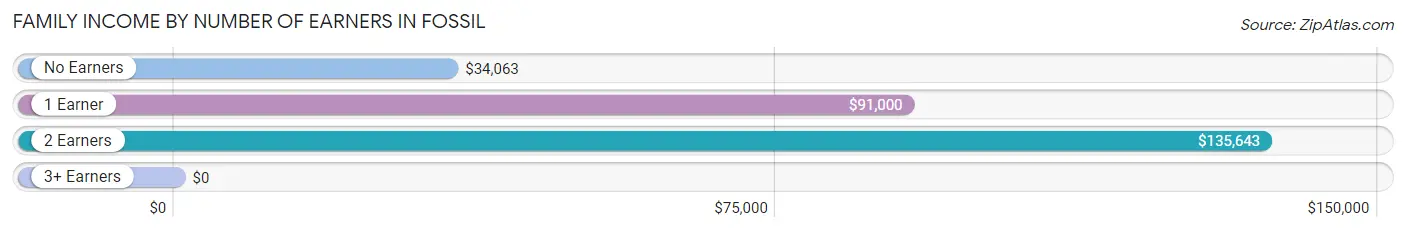
| Number of Earners | # Families | Median Income |
| No Earners | 37 (28.2%) | $34,063 |
| 1 Earner | 34 (26.0%) | $91,000 |
| 2 Earners | 52 (39.7%) | $135,643 |
| 3+ Earners | 8 (6.1%) | $0 |
| Total | 131 (100.0%) | $83,958 |
Household Income in Fossil
Household Income Brackets in Fossil
With 63 households falling in the category, the $100,000 to $149,999 income range is the most frequent in Fossil, accounting for 26.0% of all households.
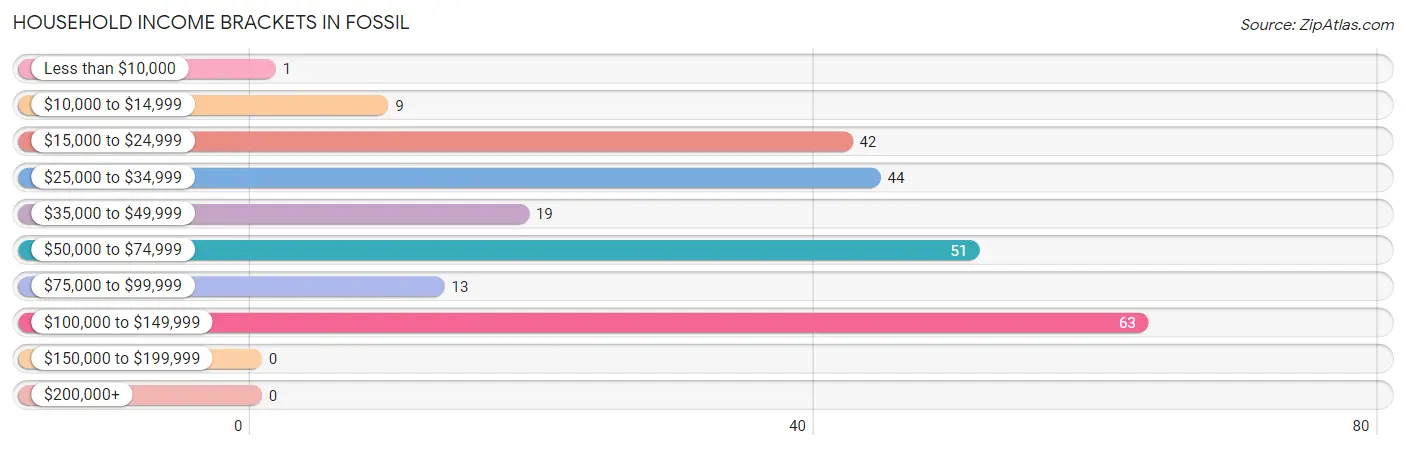
| Income Bracket | # Households | % Households |
| Less than $10,000 | 1 | 0.4% |
| $10,000 to $14,999 | 9 | 3.7% |
| $15,000 to $24,999 | 42 | 17.4% |
| $25,000 to $34,999 | 44 | 18.2% |
| $35,000 to $49,999 | 19 | 7.9% |
| $50,000 to $74,999 | 51 | 21.1% |
| $75,000 to $99,999 | 13 | 5.4% |
| $100,000 to $149,999 | 63 | 26.0% |
| $150,000 to $199,999 | 0 | 0.0% |
| $200,000+ | 0 | 0.0% |
Household Income by Householder Age in Fossil
The median household income in Fossil is $50,938, with the highest median household income of $135,500 found in the 25 to 44 years age bracket for the primary householder. A total of 56 households (23.1%) fall into this category. Meanwhile, the 15 to 24 years age bracket for the primary householder has the lowest median household income of $0, with 13 households (5.4%) in this group.
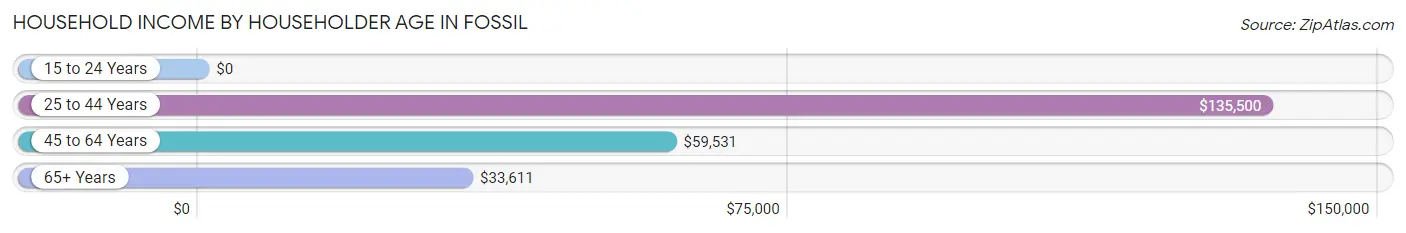
| Income Bracket | # Households | Median Income |
| 15 to 24 Years | 13 (5.4%) | $0 |
| 25 to 44 Years | 56 (23.1%) | $135,500 |
| 45 to 64 Years | 59 (24.4%) | $59,531 |
| 65+ Years | 114 (47.1%) | $33,611 |
| Total | 242 (100.0%) | $50,938 |
Poverty in Fossil
Income Below Poverty by Sex and Age in Fossil
With 11.2% poverty level for males and 4.7% for females among the residents of Fossil, 12 to 14 year old males and 55 to 64 year old females are the most vulnerable to poverty, with 11 males (100.0%) and 7 females (14.0%) in their respective age groups living below the poverty level.
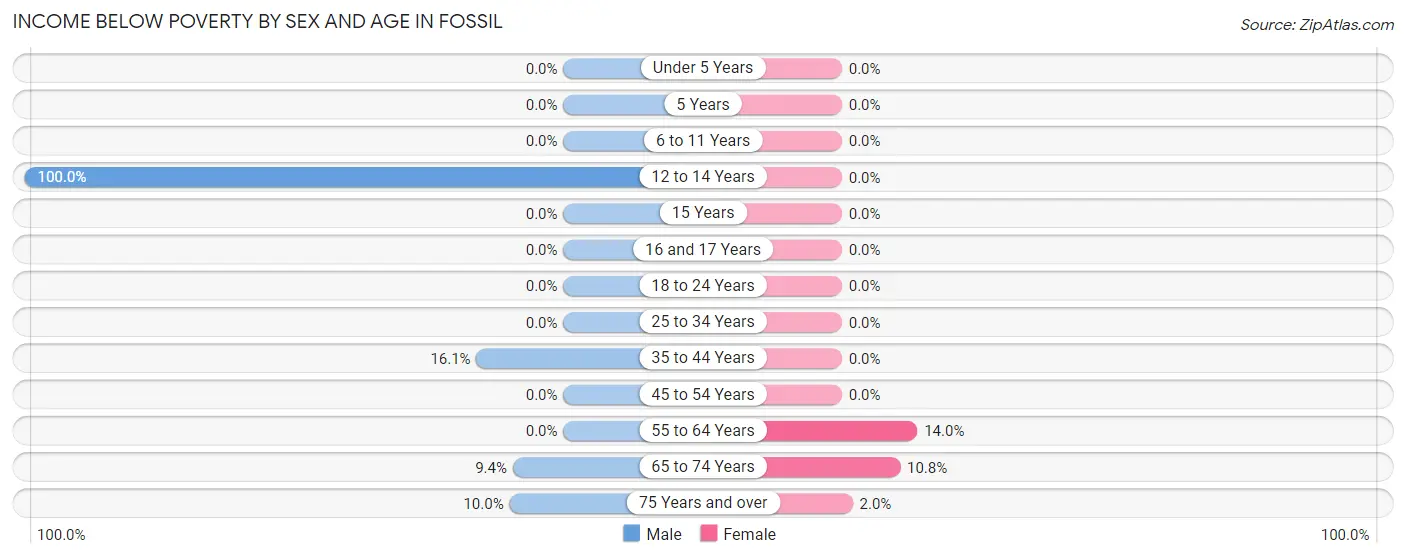
| Age Bracket | Male | Female |
| Under 5 Years | 0 (0.0%) | 0 (0.0%) |
| 5 Years | 0 (0.0%) | 0 (0.0%) |
| 6 to 11 Years | 0 (0.0%) | 0 (0.0%) |
| 12 to 14 Years | 11 (100.0%) | 0 (0.0%) |
| 15 Years | 0 (0.0%) | 0 (0.0%) |
| 16 and 17 Years | 0 (0.0%) | 0 (0.0%) |
| 18 to 24 Years | 0 (0.0%) | 0 (0.0%) |
| 25 to 34 Years | 0 (0.0%) | 0 (0.0%) |
| 35 to 44 Years | 5 (16.1%) | 0 (0.0%) |
| 45 to 54 Years | 0 (0.0%) | 0 (0.0%) |
| 55 to 64 Years | 0 (0.0%) | 7 (14.0%) |
| 65 to 74 Years | 6 (9.4%) | 4 (10.8%) |
| 75 Years and over | 4 (10.0%) | 1 (2.0%) |
| Total | 26 (11.2%) | 12 (4.7%) |
Income Above Poverty by Sex and Age in Fossil
According to the poverty statistics in Fossil, males aged 6 to 11 years and females aged under 5 years are the age groups that are most secure financially, with 100.0% of males and 100.0% of females in these age groups living above the poverty line.
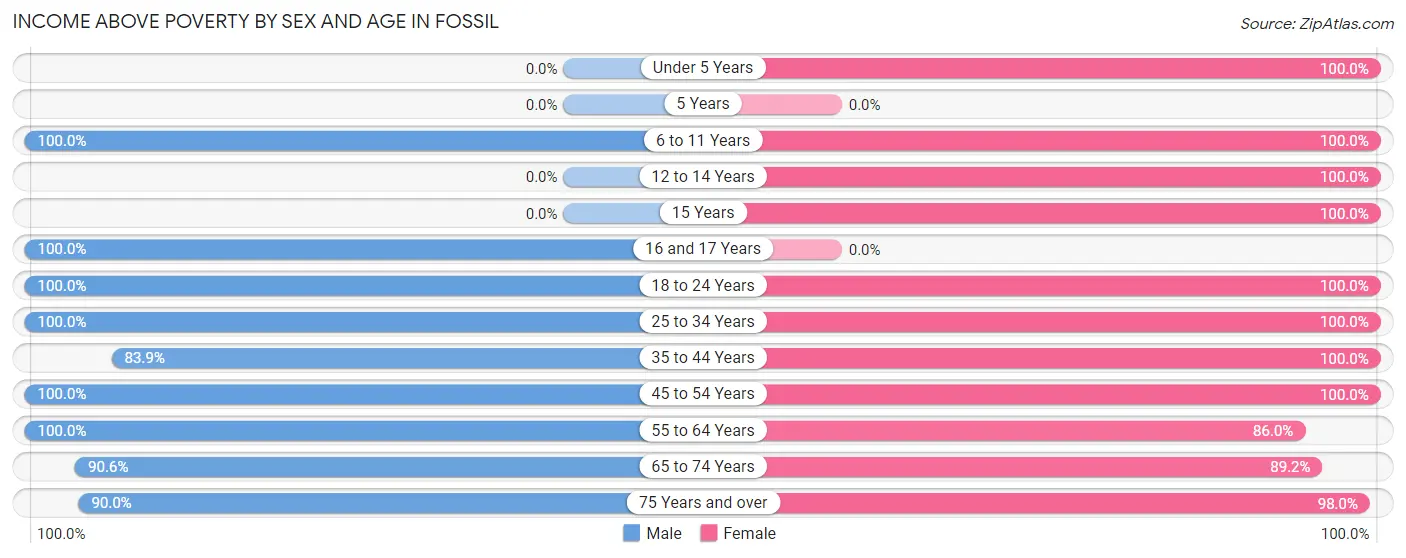
| Age Bracket | Male | Female |
| Under 5 Years | 0 (0.0%) | 6 (100.0%) |
| 5 Years | 0 (0.0%) | 0 (0.0%) |
| 6 to 11 Years | 3 (100.0%) | 9 (100.0%) |
| 12 to 14 Years | 0 (0.0%) | 9 (100.0%) |
| 15 Years | 0 (0.0%) | 1 (100.0%) |
| 16 and 17 Years | 6 (100.0%) | 0 (0.0%) |
| 18 to 24 Years | 15 (100.0%) | 8 (100.0%) |
| 25 to 34 Years | 21 (100.0%) | 46 (100.0%) |
| 35 to 44 Years | 26 (83.9%) | 18 (100.0%) |
| 45 to 54 Years | 31 (100.0%) | 19 (100.0%) |
| 55 to 64 Years | 10 (100.0%) | 43 (86.0%) |
| 65 to 74 Years | 58 (90.6%) | 33 (89.2%) |
| 75 Years and over | 36 (90.0%) | 49 (98.0%) |
| Total | 206 (88.8%) | 241 (95.3%) |
Income Below Poverty Among Married-Couple Families in Fossil
The poverty statistics for married-couple families in Fossil show that 9.8% or 11 of the total 112 families live below the poverty line. Families with no children have the highest poverty rate of 12.5%, comprising of 7 families. On the other hand, families with 1 or 2 children have the lowest poverty rate of 7.1%, which includes 4 families.
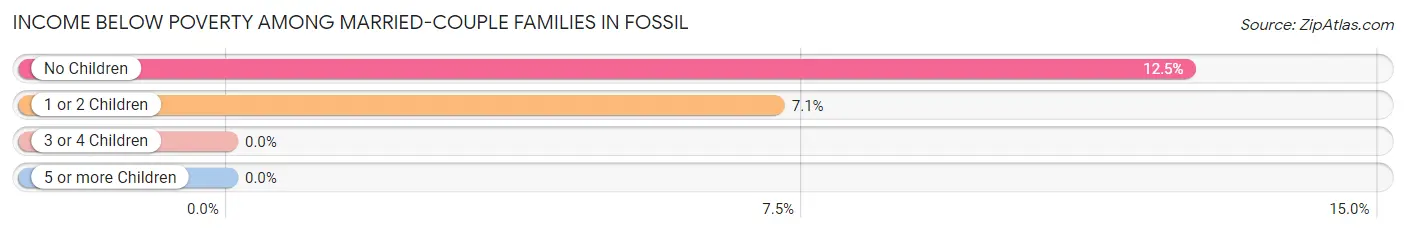
| Children | Above Poverty | Below Poverty |
| No Children | 49 (87.5%) | 7 (12.5%) |
| 1 or 2 Children | 52 (92.9%) | 4 (7.1%) |
| 3 or 4 Children | 0 (0.0%) | 0 (0.0%) |
| 5 or more Children | 0 (0.0%) | 0 (0.0%) |
| Total | 101 (90.2%) | 11 (9.8%) |
Income Below Poverty Among Single-Parent Households in Fossil
| Children | Single Father | Single Mother |
| No Children | 0 (0.0%) | 0 (0.0%) |
| 1 or 2 Children | 0 (0.0%) | 0 (0.0%) |
| 3 or 4 Children | 0 (0.0%) | 0 (0.0%) |
| 5 or more Children | 0 (0.0%) | 0 (0.0%) |
| Total | 0 (0.0%) | 0 (0.0%) |
Income Below Poverty Among Married-Couple vs Single-Parent Households in Fossil
| Children | Married-Couple Families | Single-Parent Households |
| No Children | 7 (12.5%) | 0 (0.0%) |
| 1 or 2 Children | 4 (7.1%) | 0 (0.0%) |
| 3 or 4 Children | 0 (0.0%) | 0 (0.0%) |
| 5 or more Children | 0 (0.0%) | 0 (0.0%) |
| Total | 11 (9.8%) | 0 (0.0%) |
Race in Fossil
The most populous races in Fossil are White / Caucasian (446 | 92.0%), Two or more Races (30 | 6.2%), and Hispanic or Latino (26 | 5.4%).
| Race | # Population | % Population |
| Asian | 0 | 0.0% |
| Black / African American | 0 | 0.0% |
| Hawaiian / Pacific | 0 | 0.0% |
| Hispanic or Latino | 26 | 5.4% |
| Native / Alaskan | 0 | 0.0% |
| White / Caucasian | 446 | 92.0% |
| Two or more Races | 30 | 6.2% |
| Some other Race | 9 | 1.9% |
| Total | 485 | 100.0% |
Ancestry in Fossil
The most populous ancestries reported in Fossil are English (140 | 28.9%), Irish (101 | 20.8%), German (82 | 16.9%), American (62 | 12.8%), and Scottish (33 | 6.8%), together accounting for 86.2% of all Fossil residents.
| Ancestry | # Population | % Population |
| American | 62 | 12.8% |
| Canadian | 7 | 1.4% |
| Cherokee | 19 | 3.9% |
| Danish | 8 | 1.7% |
| Dutch | 7 | 1.4% |
| English | 140 | 28.9% |
| European | 17 | 3.5% |
| French | 13 | 2.7% |
| French American Indian | 4 | 0.8% |
| German | 82 | 16.9% |
| Irish | 101 | 20.8% |
| Iroquois | 4 | 0.8% |
| Mexican | 8 | 1.7% |
| Scotch-Irish | 15 | 3.1% |
| Scottish | 33 | 6.8% |
| Shoshone | 15 | 3.1% |
| Swedish | 12 | 2.5% |
| Swiss | 7 | 1.4% |
| Welsh | 11 | 2.3% | View All 19 Rows |
Immigrants in Fossil

| Immigration Origin | # Population | % Population | View All 0 Rows |
Sex and Age in Fossil
Sex and Age in Fossil
The most populous age groups in Fossil are 65 to 69 Years (36 | 15.5%) for men and 60 to 64 Years (44 | 17.4%) for women.
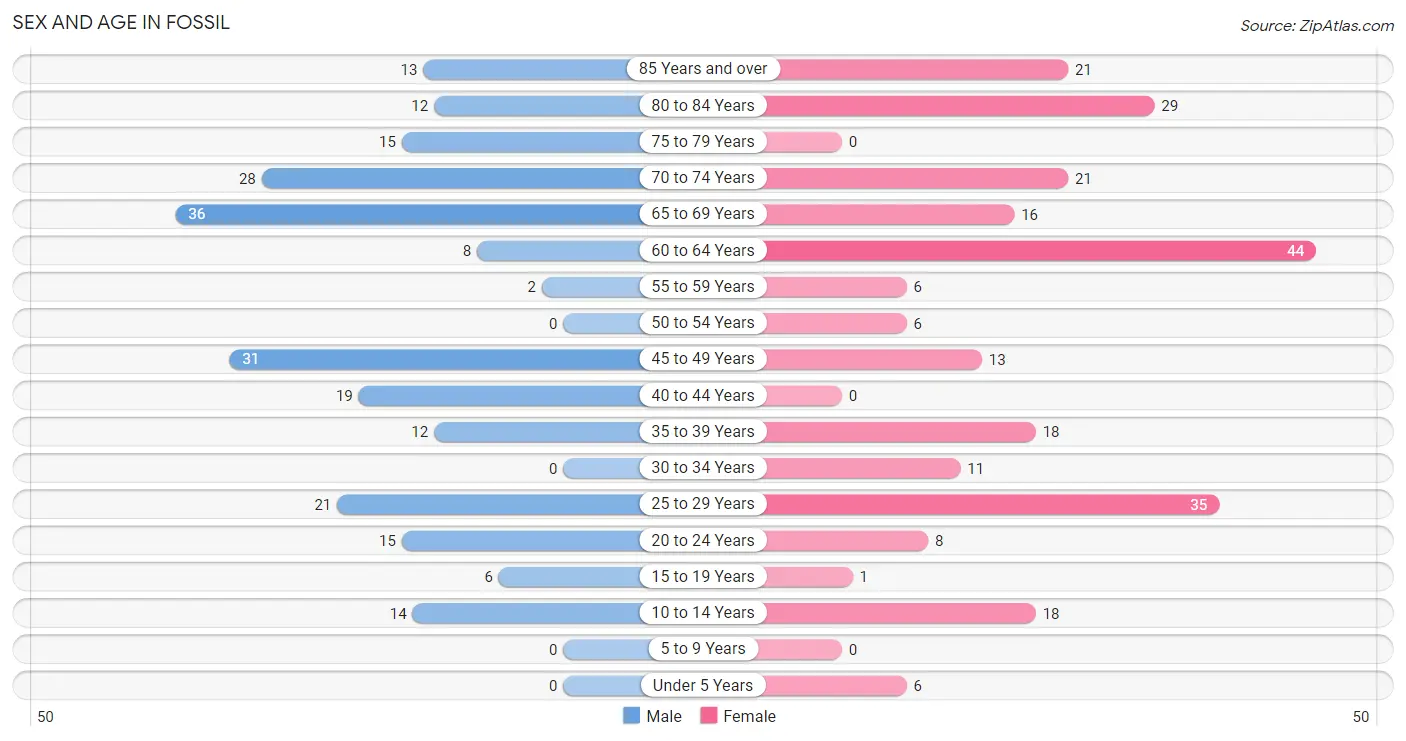
| Age Bracket | Male | Female |
| Under 5 Years | 0 (0.0%) | 6 (2.4%) |
| 5 to 9 Years | 0 (0.0%) | 0 (0.0%) |
| 10 to 14 Years | 14 (6.0%) | 18 (7.1%) |
| 15 to 19 Years | 6 (2.6%) | 1 (0.4%) |
| 20 to 24 Years | 15 (6.5%) | 8 (3.2%) |
| 25 to 29 Years | 21 (9.0%) | 35 (13.8%) |
| 30 to 34 Years | 0 (0.0%) | 11 (4.3%) |
| 35 to 39 Years | 12 (5.2%) | 18 (7.1%) |
| 40 to 44 Years | 19 (8.2%) | 0 (0.0%) |
| 45 to 49 Years | 31 (13.4%) | 13 (5.1%) |
| 50 to 54 Years | 0 (0.0%) | 6 (2.4%) |
| 55 to 59 Years | 2 (0.9%) | 6 (2.4%) |
| 60 to 64 Years | 8 (3.5%) | 44 (17.4%) |
| 65 to 69 Years | 36 (15.5%) | 16 (6.3%) |
| 70 to 74 Years | 28 (12.1%) | 21 (8.3%) |
| 75 to 79 Years | 15 (6.5%) | 0 (0.0%) |
| 80 to 84 Years | 12 (5.2%) | 29 (11.5%) |
| 85 Years and over | 13 (5.6%) | 21 (8.3%) |
| Total | 232 (100.0%) | 253 (100.0%) |
Families and Households in Fossil
Median Family Size in Fossil
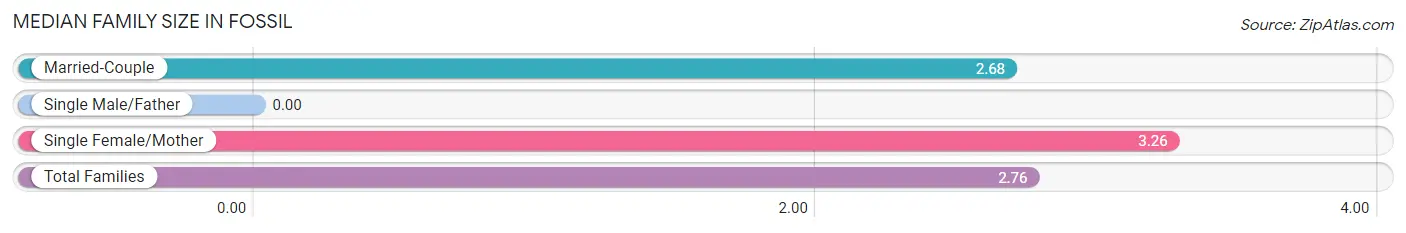
| Family Type | # Families | Family Size |
| Married-Couple | 112 (85.5%) | 2.68 |
| Single Male/Father | 0 (0.0%) | - |
| Single Female/Mother | 19 (14.5%) | 3.26 |
| Total Families | 131 (100.0%) | 2.76 |
Median Household Size in Fossil
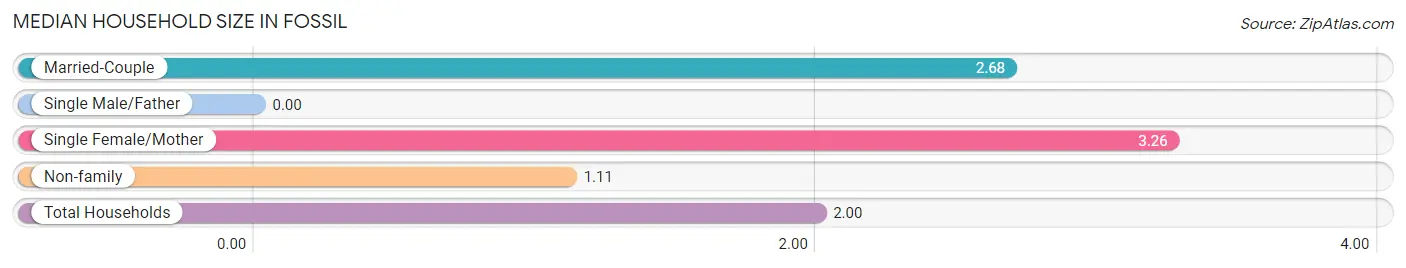
| Household Type | # Households | Household Size |
| Married-Couple | 112 (46.3%) | 2.68 |
| Single Male/Father | 0 (0.0%) | - |
| Single Female/Mother | 19 (7.9%) | 3.26 |
| Non-family | 111 (45.9%) | 1.11 |
| Total Households | 242 (100.0%) | 2.00 |
Household Size by Marriage Status in Fossil
Out of a total of 242 households in Fossil, 131 (54.1%) are family households, while 111 (45.9%) are nonfamily households. The most numerous type of family households are 3-person households, comprising 65, and the most common type of nonfamily households are 1-person households, comprising 96.
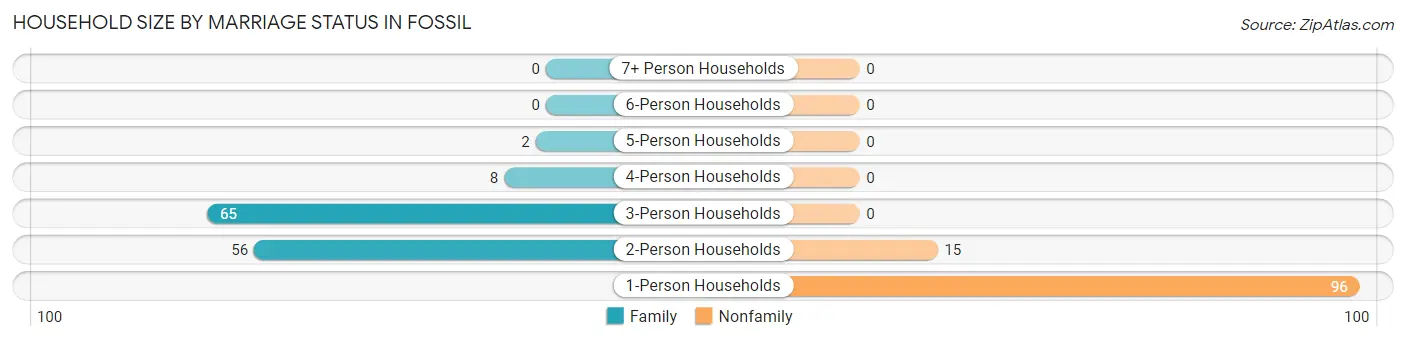
| Household Size | Family Households | Nonfamily Households |
| 1-Person Households | - | 96 (39.7%) |
| 2-Person Households | 56 (23.1%) | 15 (6.2%) |
| 3-Person Households | 65 (26.9%) | 0 (0.0%) |
| 4-Person Households | 8 (3.3%) | 0 (0.0%) |
| 5-Person Households | 2 (0.8%) | 0 (0.0%) |
| 6-Person Households | 0 (0.0%) | 0 (0.0%) |
| 7+ Person Households | 0 (0.0%) | 0 (0.0%) |
| Total | 131 (54.1%) | 111 (45.9%) |
Female Fertility in Fossil
Fertility by Age in Fossil
| Age Bracket | Women with Births | Births / 1,000 Women |
| 15 to 19 years | 0 (0.0%) | 0.0 |
| 20 to 34 years | 0 (0.0%) | 0.0 |
| 35 to 50 years | 0 (0.0%) | 0.0 |
| Total | 0 (0.0%) | 0.0 |
Fertility by Age by Marriage Status in Fossil
| Age Bracket | Married | Unmarried |
| 15 to 19 years | 0 (0.0%) | 0 (0.0%) |
| 20 to 34 years | 0 (0.0%) | 0 (0.0%) |
| 35 to 50 years | 0 (0.0%) | 0 (0.0%) |
| Total | 0 (0.0%) | 0 (0.0%) |
Fertility by Education in Fossil
| Educational Attainment | Women with Births | Births / 1,000 Women |
| Less than High School | 0 (0.0%) | 0.0 |
| High School Diploma | 0 (0.0%) | 0.0 |
| College or Associate's Degree | 0 (0.0%) | 0.0 |
| Bachelor's Degree | 0 (0.0%) | 0.0 |
| Graduate Degree | 0 (0.0%) | 0.0 |
| Total | 0 (0.0%) | 0.0 |
Fertility by Education by Marriage Status in Fossil
| Educational Attainment | Married | Unmarried |
| Less than High School | 0 (0.0%) | 0 (0.0%) |
| High School Diploma | 0 (0.0%) | 0 (0.0%) |
| College or Associate's Degree | 0 (0.0%) | 0 (0.0%) |
| Bachelor's Degree | 0 (0.0%) | 0 (0.0%) |
| Graduate Degree | 0 (0.0%) | 0 (0.0%) |
| Total | 0 (0.0%) | 0 (0.0%) |
Employment Characteristics in Fossil
Employment by Class of Employer in Fossil
Among the 172 employed individuals in Fossil, private company employees (59 | 34.3%), not-for-profit organizations (48 | 27.9%), and state government employees (26 | 15.1%) make up the most common classes of employment.
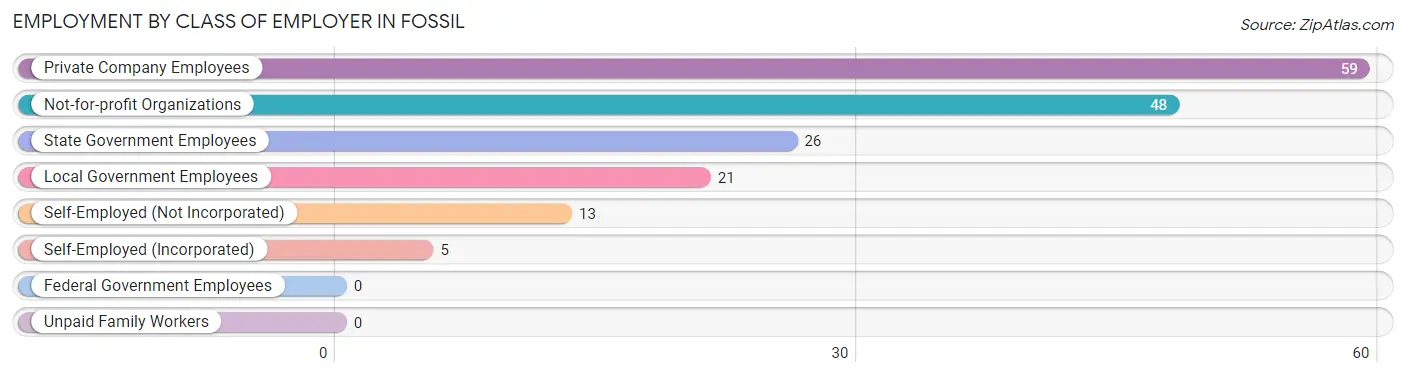
| Employer Class | # Employees | % Employees |
| Private Company Employees | 59 | 34.3% |
| Self-Employed (Incorporated) | 5 | 2.9% |
| Self-Employed (Not Incorporated) | 13 | 7.6% |
| Not-for-profit Organizations | 48 | 27.9% |
| Local Government Employees | 21 | 12.2% |
| State Government Employees | 26 | 15.1% |
| Federal Government Employees | 0 | 0.0% |
| Unpaid Family Workers | 0 | 0.0% |
| Total | 172 | 100.0% |
Employment Status by Age in Fossil
According to the labor force statistics for Fossil, out of the total population over 16 years of age (446), 41.3% or 184 individuals are in the labor force, with 6.5% or 12 of them unemployed. The age group with the highest labor force participation rate is 20 to 24 years, with 100.0% or 23 individuals in the labor force. Within the labor force, the 35 to 44 years age range has the highest percentage of unemployed individuals, with 25.0% or 5 of them being unemployed.
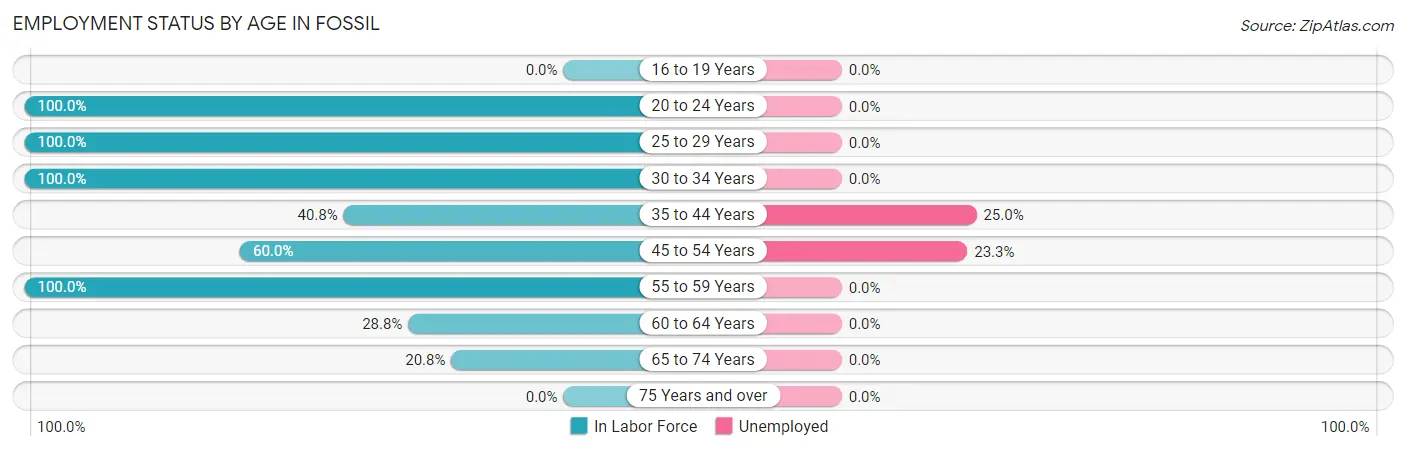
| Age Bracket | In Labor Force | Unemployed |
| 16 to 19 Years | 0 (0.0%) | 0 (0.0%) |
| 20 to 24 Years | 23 (100.0%) | 0 (0.0%) |
| 25 to 29 Years | 56 (100.0%) | 0 (0.0%) |
| 30 to 34 Years | 11 (100.0%) | 0 (0.0%) |
| 35 to 44 Years | 20 (40.8%) | 5 (25.0%) |
| 45 to 54 Years | 30 (60.0%) | 7 (23.3%) |
| 55 to 59 Years | 8 (100.0%) | 0 (0.0%) |
| 60 to 64 Years | 15 (28.8%) | 0 (0.0%) |
| 65 to 74 Years | 21 (20.8%) | 0 (0.0%) |
| 75 Years and over | 0 (0.0%) | 0 (0.0%) |
| Total | 184 (41.3%) | 12 (6.5%) |
Employment Status by Educational Attainment in Fossil
According to labor force statistics for Fossil, 61.9% of individuals (140) out of the total population between 25 and 64 years of age (226) are in the labor force, with 8.6% or 12 of them being unemployed. The group with the highest labor force participation rate are those with the educational attainment of bachelor's degree or higher, with 87.7% or 57 individuals in the labor force. Within the labor force, individuals with high school diploma education have the highest percentage of unemployment, with 19.2% or 5 of them being unemployed.
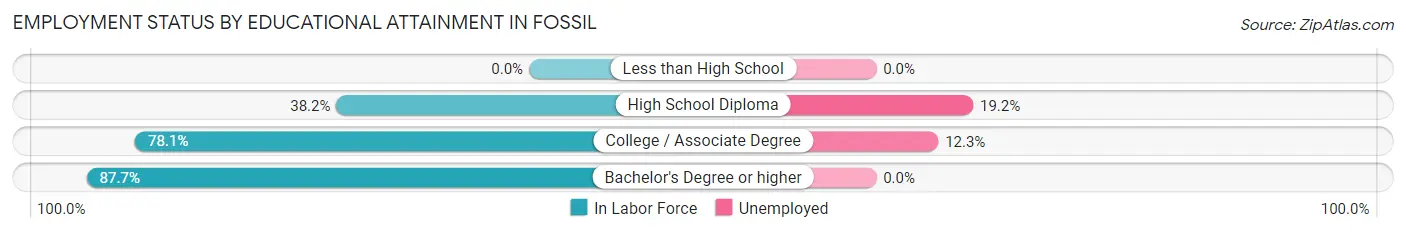
| Educational Attainment | In Labor Force | Unemployed |
| Less than High School | 0 (0.0%) | 0 (0.0%) |
| High School Diploma | 26 (38.2%) | 13 (19.2%) |
| College / Associate Degree | 57 (78.1%) | 9 (12.3%) |
| Bachelor's Degree or higher | 57 (87.7%) | 0 (0.0%) |
| Total | 140 (61.9%) | 19 (8.6%) |
Employment Occupations by Sex in Fossil
Management, Business, Science and Arts Occupations
The most common Management, Business, Science and Arts occupations in Fossil are Business & Financial (35 | 20.3%), Management (16 | 9.3%), Computers, Engineering & Science (8 | 4.6%), Life, Physical & Social Science (8 | 4.6%), and Community & Social Service (7 | 4.1%).
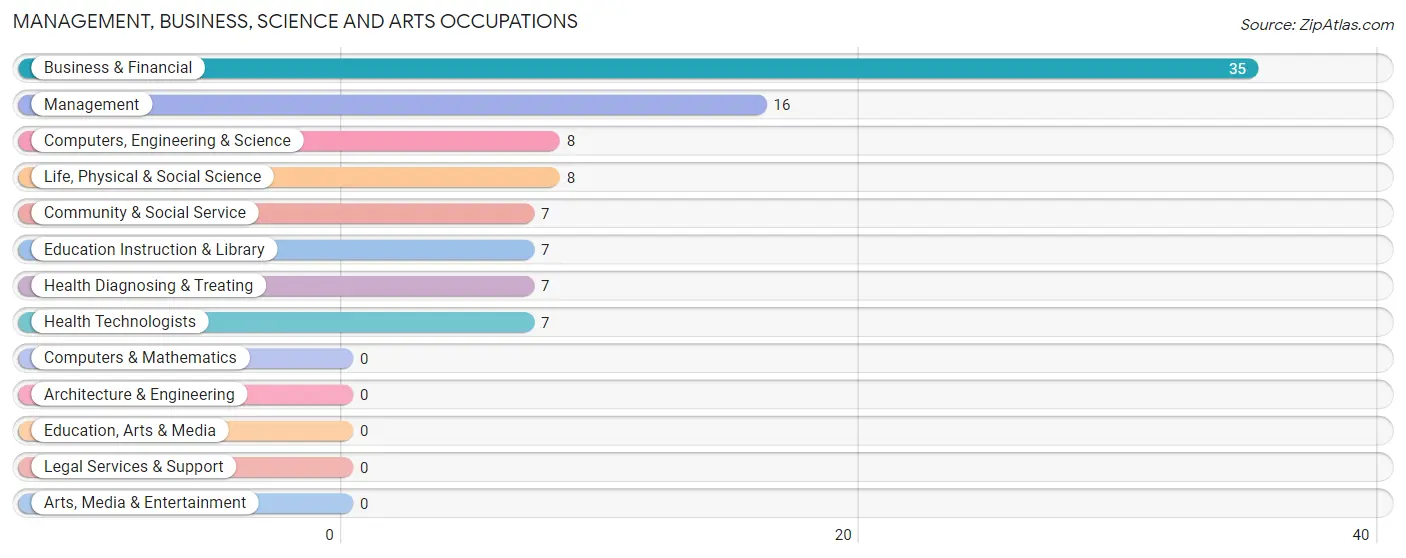
Management, Business, Science and Arts Occupations by Sex
Within the Management, Business, Science and Arts occupations in Fossil, the most male-oriented occupations are Management (100.0%), Computers, Engineering & Science (100.0%), and Life, Physical & Social Science (100.0%), while the most female-oriented occupations are Business & Financial (100.0%), Community & Social Service (100.0%), and Education Instruction & Library (100.0%).
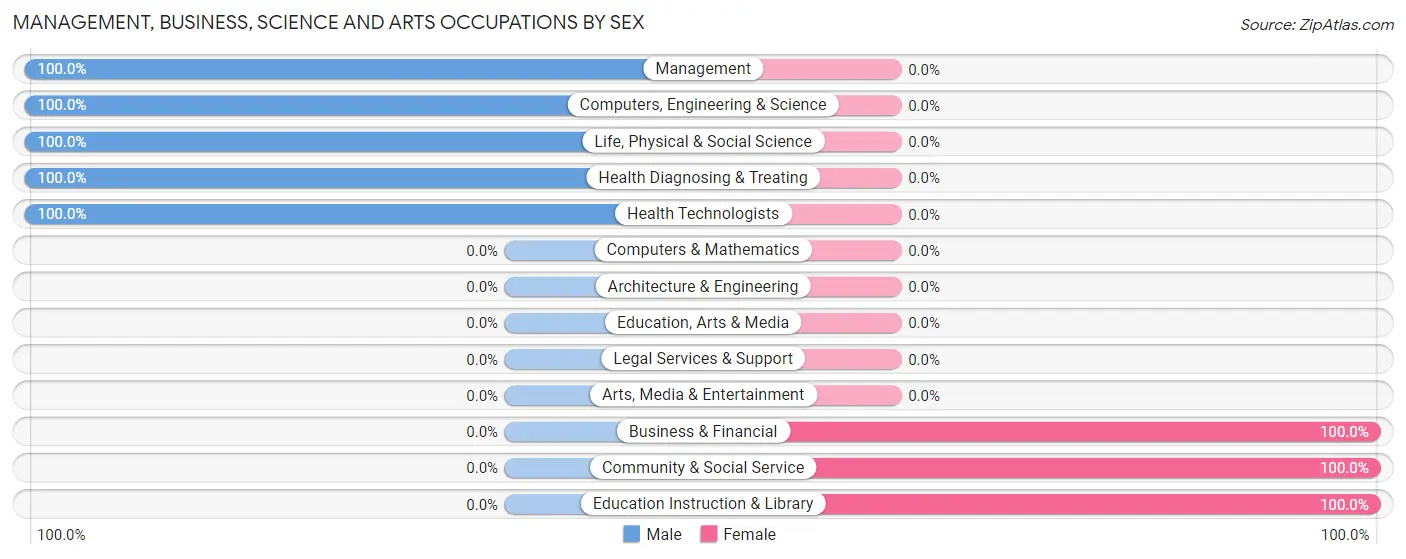
| Occupation | Male | Female |
| Management | 16 (100.0%) | 0 (0.0%) |
| Business & Financial | 0 (0.0%) | 35 (100.0%) |
| Computers, Engineering & Science | 8 (100.0%) | 0 (0.0%) |
| Computers & Mathematics | 0 (0.0%) | 0 (0.0%) |
| Architecture & Engineering | 0 (0.0%) | 0 (0.0%) |
| Life, Physical & Social Science | 8 (100.0%) | 0 (0.0%) |
| Community & Social Service | 0 (0.0%) | 7 (100.0%) |
| Education, Arts & Media | 0 (0.0%) | 0 (0.0%) |
| Legal Services & Support | 0 (0.0%) | 0 (0.0%) |
| Education Instruction & Library | 0 (0.0%) | 7 (100.0%) |
| Arts, Media & Entertainment | 0 (0.0%) | 0 (0.0%) |
| Health Diagnosing & Treating | 7 (100.0%) | 0 (0.0%) |
| Health Technologists | 7 (100.0%) | 0 (0.0%) |
| Total (Category) | 31 (42.5%) | 42 (57.5%) |
| Total (Overall) | 88 (51.2%) | 84 (48.8%) |
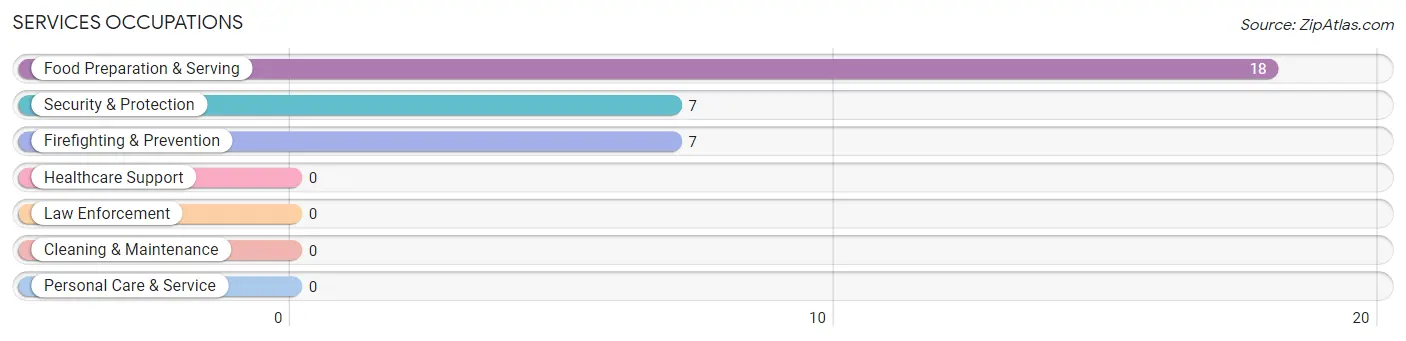
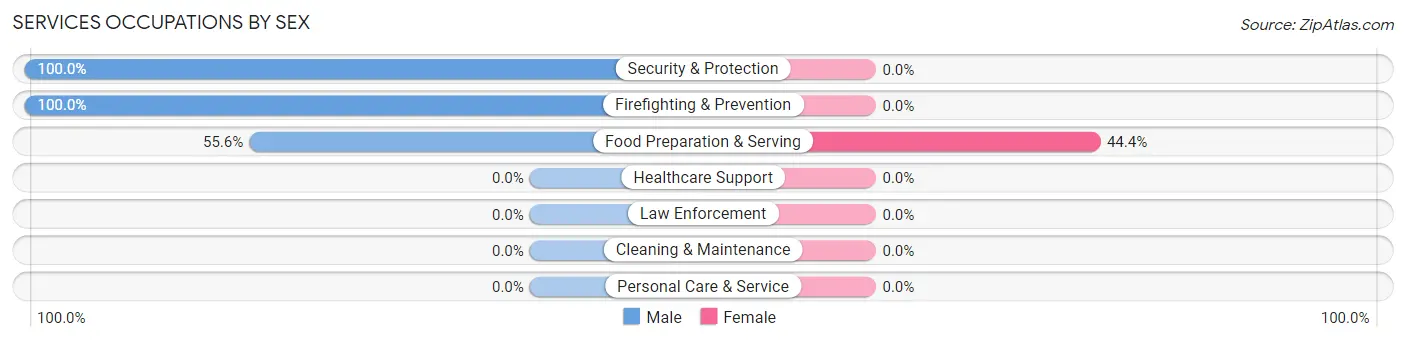
Services Occupations
The most common Services occupations in Fossil are Food Preparation & Serving (18 | 10.5%), Security & Protection (7 | 4.1%), and Firefighting & Prevention (7 | 4.1%).
Services Occupations by Sex
| Occupation | Male | Female |
| Healthcare Support | 0 (0.0%) | 0 (0.0%) |
| Security & Protection | 7 (100.0%) | 0 (0.0%) |
| Firefighting & Prevention | 7 (100.0%) | 0 (0.0%) |
| Law Enforcement | 0 (0.0%) | 0 (0.0%) |
| Food Preparation & Serving | 10 (55.6%) | 8 (44.4%) |
| Cleaning & Maintenance | 0 (0.0%) | 0 (0.0%) |
| Personal Care & Service | 0 (0.0%) | 0 (0.0%) |
| Total (Category) | 17 (68.0%) | 8 (32.0%) |
| Total (Overall) | 88 (51.2%) | 84 (48.8%) |
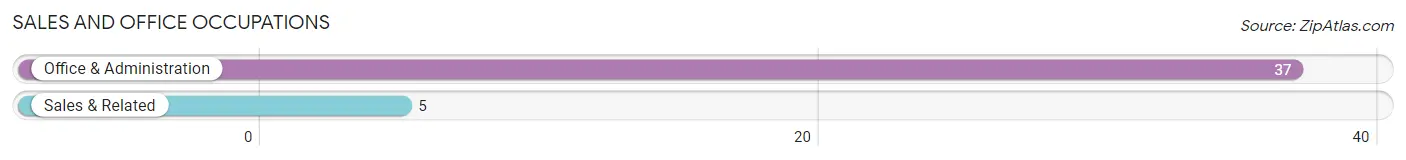
Sales and Office Occupations
The most common Sales and Office occupations in Fossil are Office & Administration (37 | 21.5%), and Sales & Related (5 | 2.9%).
Sales and Office Occupations by Sex

| Occupation | Male | Female |
| Sales & Related | 0 (0.0%) | 5 (100.0%) |
| Office & Administration | 8 (21.6%) | 29 (78.4%) |
| Total (Category) | 8 (19.1%) | 34 (80.9%) |
| Total (Overall) | 88 (51.2%) | 84 (48.8%) |
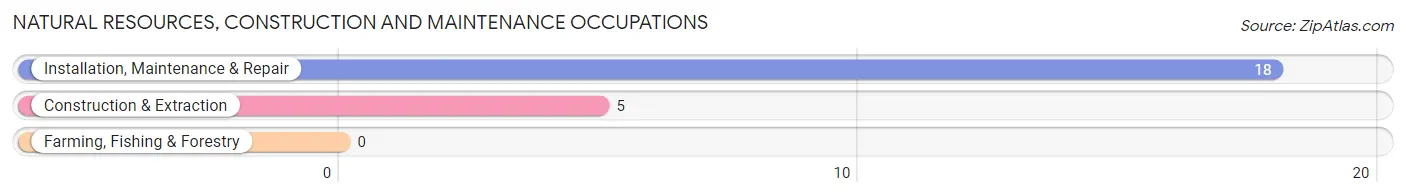
Natural Resources, Construction and Maintenance Occupations
The most common Natural Resources, Construction and Maintenance occupations in Fossil are Installation, Maintenance & Repair (18 | 10.5%), and Construction & Extraction (5 | 2.9%).
Natural Resources, Construction and Maintenance Occupations by Sex
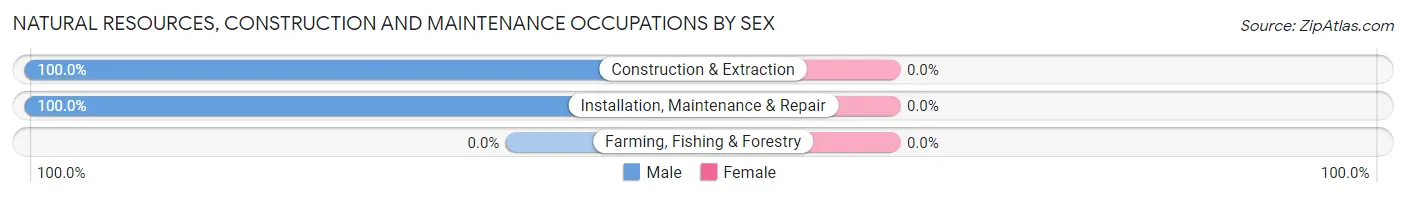
| Occupation | Male | Female |
| Farming, Fishing & Forestry | 0 (0.0%) | 0 (0.0%) |
| Construction & Extraction | 5 (100.0%) | 0 (0.0%) |
| Installation, Maintenance & Repair | 18 (100.0%) | 0 (0.0%) |
| Total (Category) | 23 (100.0%) | 0 (0.0%) |
| Total (Overall) | 88 (51.2%) | 84 (48.8%) |
Production, Transportation and Moving Occupations
The most common Production, Transportation and Moving occupations in Fossil are , and Production (9 | 5.2%).
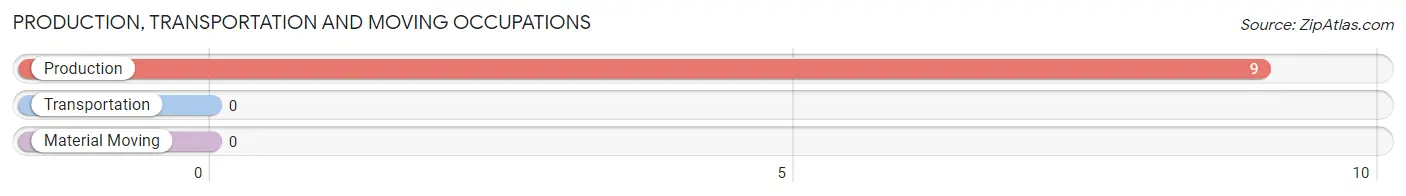
Production, Transportation and Moving Occupations by Sex
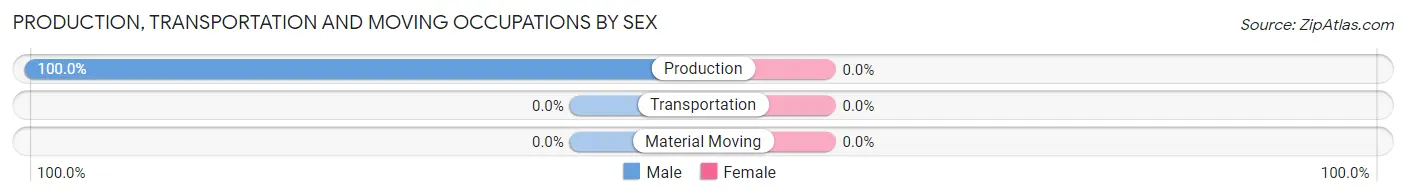
| Occupation | Male | Female |
| Production | 9 (100.0%) | 0 (0.0%) |
| Transportation | 0 (0.0%) | 0 (0.0%) |
| Material Moving | 0 (0.0%) | 0 (0.0%) |
| Total (Category) | 9 (100.0%) | 0 (0.0%) |
| Total (Overall) | 88 (51.2%) | 84 (48.8%) |
Employment Industries by Sex in Fossil
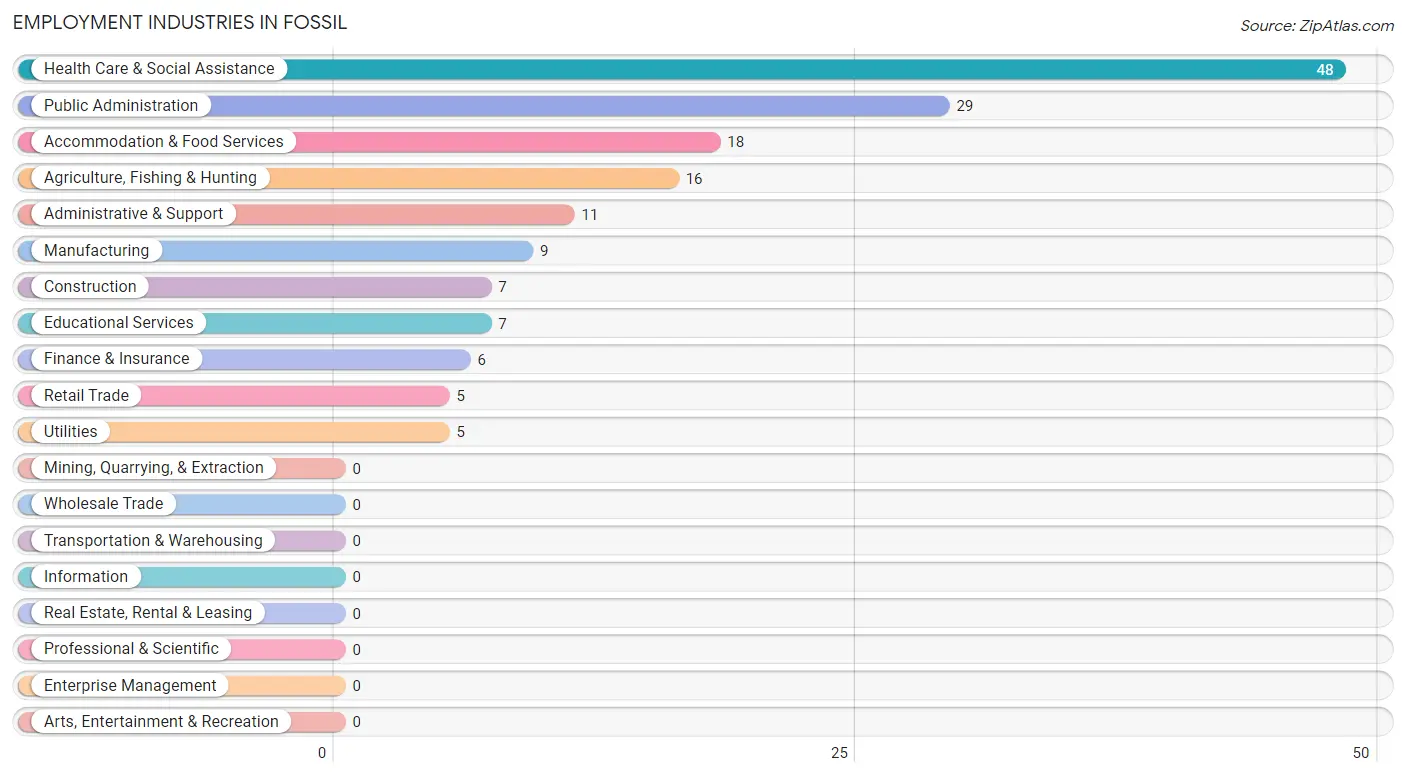
Employment Industries in Fossil
The major employment industries in Fossil include Health Care & Social Assistance (48 | 27.9%), Public Administration (29 | 16.9%), Accommodation & Food Services (18 | 10.5%), Agriculture, Fishing & Hunting (16 | 9.3%), and Administrative & Support (11 | 6.4%).
Employment Industries by Sex in Fossil
The Fossil industries that see more men than women are Agriculture, Fishing & Hunting (100.0%), Construction (100.0%), and Manufacturing (100.0%), whereas the industries that tend to have a higher number of women are Retail Trade (100.0%), Finance & Insurance (100.0%), and Administrative & Support (100.0%).
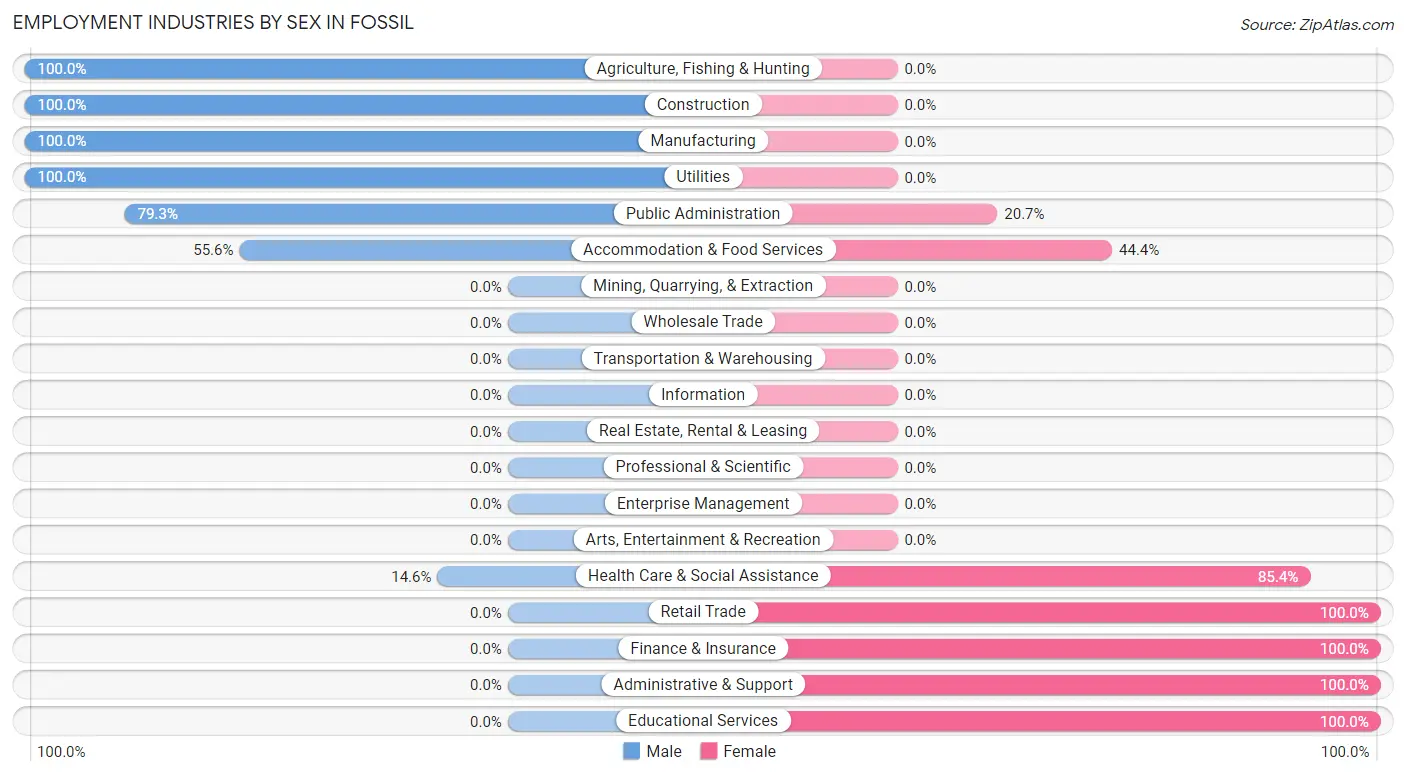
| Industry | Male | Female |
| Agriculture, Fishing & Hunting | 16 (100.0%) | 0 (0.0%) |
| Mining, Quarrying, & Extraction | 0 (0.0%) | 0 (0.0%) |
| Construction | 7 (100.0%) | 0 (0.0%) |
| Manufacturing | 9 (100.0%) | 0 (0.0%) |
| Wholesale Trade | 0 (0.0%) | 0 (0.0%) |
| Retail Trade | 0 (0.0%) | 5 (100.0%) |
| Transportation & Warehousing | 0 (0.0%) | 0 (0.0%) |
| Utilities | 5 (100.0%) | 0 (0.0%) |
| Information | 0 (0.0%) | 0 (0.0%) |
| Finance & Insurance | 0 (0.0%) | 6 (100.0%) |
| Real Estate, Rental & Leasing | 0 (0.0%) | 0 (0.0%) |
| Professional & Scientific | 0 (0.0%) | 0 (0.0%) |
| Enterprise Management | 0 (0.0%) | 0 (0.0%) |
| Administrative & Support | 0 (0.0%) | 11 (100.0%) |
| Educational Services | 0 (0.0%) | 7 (100.0%) |
| Health Care & Social Assistance | 7 (14.6%) | 41 (85.4%) |
| Arts, Entertainment & Recreation | 0 (0.0%) | 0 (0.0%) |
| Accommodation & Food Services | 10 (55.6%) | 8 (44.4%) |
| Public Administration | 23 (79.3%) | 6 (20.7%) |
| Total | 88 (51.2%) | 84 (48.8%) |
Education in Fossil
School Enrollment in Fossil
The most common levels of schooling among the 47 students in Fossil are middle school (21 | 44.7%), elementary school (12 | 25.5%), and college / undergraduate (8 | 17.0%).
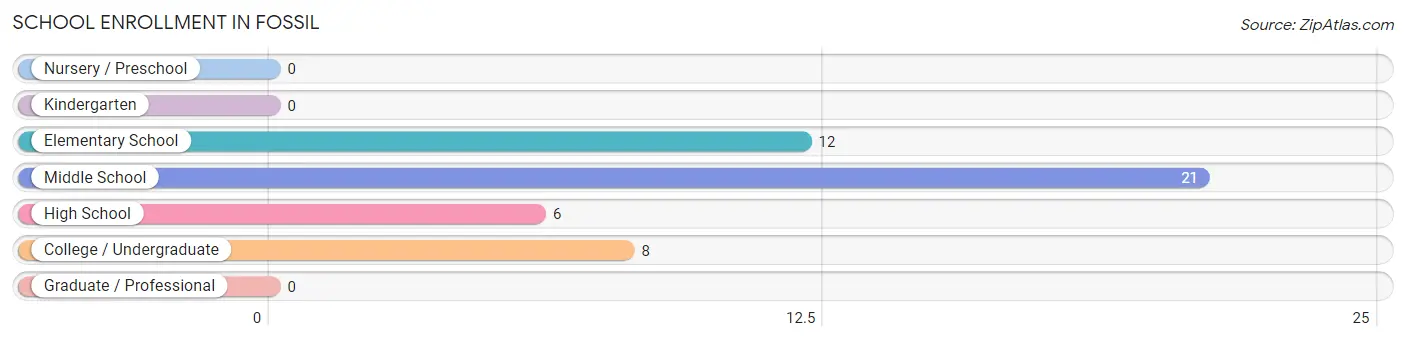
| School Level | # Students | % Students |
| Nursery / Preschool | 0 | 0.0% |
| Kindergarten | 0 | 0.0% |
| Elementary School | 12 | 25.5% |
| Middle School | 21 | 44.7% |
| High School | 6 | 12.8% |
| College / Undergraduate | 8 | 17.0% |
| Graduate / Professional | 0 | 0.0% |
| Total | 47 | 100.0% |
School Enrollment by Age by Funding Source in Fossil
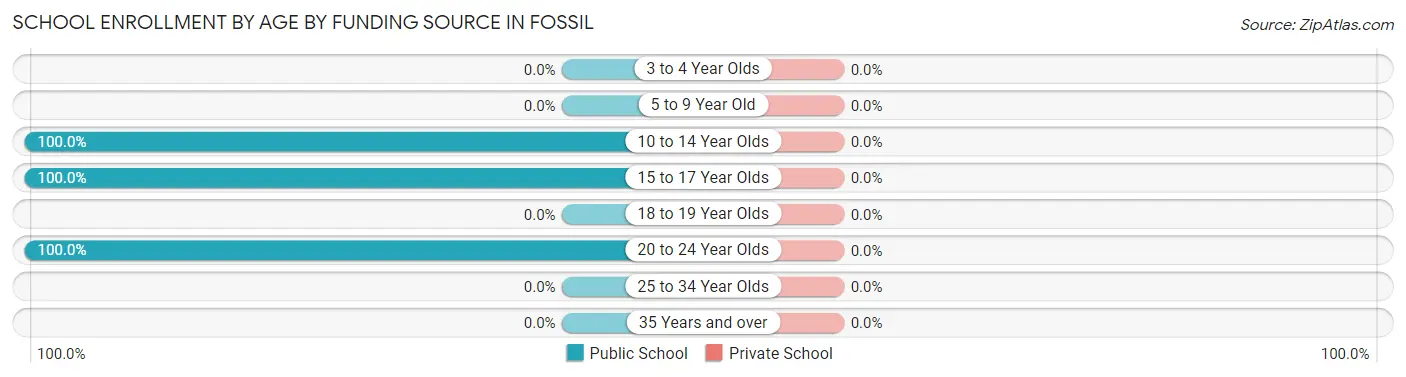
| Age Bracket | Public School | Private School |
| 3 to 4 Year Olds | 0 (0.0%) | 0 (0.0%) |
| 5 to 9 Year Old | 0 (0.0%) | 0 (0.0%) |
| 10 to 14 Year Olds | 32 (100.0%) | 0 (0.0%) |
| 15 to 17 Year Olds | 7 (100.0%) | 0 (0.0%) |
| 18 to 19 Year Olds | 0 (0.0%) | 0 (0.0%) |
| 20 to 24 Year Olds | 8 (100.0%) | 0 (0.0%) |
| 25 to 34 Year Olds | 0 (0.0%) | 0 (0.0%) |
| 35 Years and over | 0 (0.0%) | 0 (0.0%) |
| Total | 47 (100.0%) | 0 (0.0%) |
Educational Attainment by Field of Study in Fossil
Business (58 | 57.4%), physical & health sciences (16 | 15.8%), engineering (8 | 7.9%), education (7 | 6.9%), and arts & humanities (7 | 6.9%) are the most common fields of study among 101 individuals in Fossil who have obtained a bachelor's degree or higher.
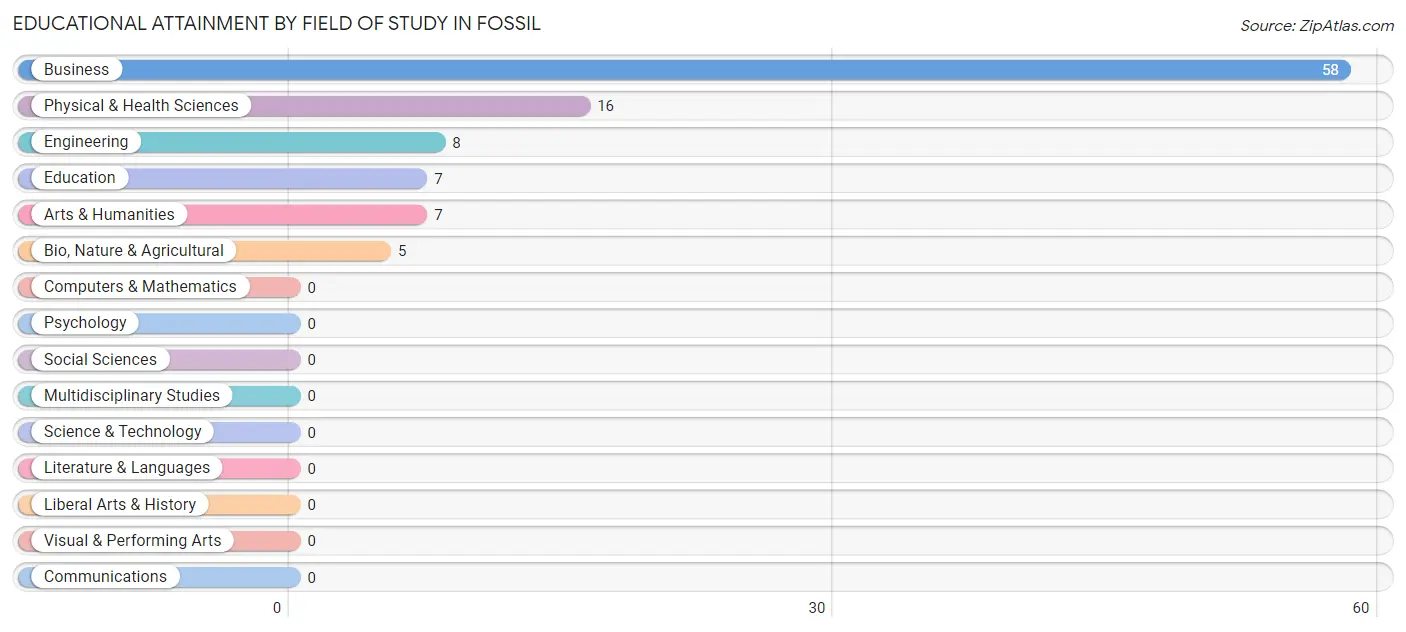
| Field of Study | # Graduates | % Graduates |
| Computers & Mathematics | 0 | 0.0% |
| Bio, Nature & Agricultural | 5 | 5.0% |
| Physical & Health Sciences | 16 | 15.8% |
| Psychology | 0 | 0.0% |
| Social Sciences | 0 | 0.0% |
| Engineering | 8 | 7.9% |
| Multidisciplinary Studies | 0 | 0.0% |
| Science & Technology | 0 | 0.0% |
| Business | 58 | 57.4% |
| Education | 7 | 6.9% |
| Literature & Languages | 0 | 0.0% |
| Liberal Arts & History | 0 | 0.0% |
| Visual & Performing Arts | 0 | 0.0% |
| Communications | 0 | 0.0% |
| Arts & Humanities | 7 | 6.9% |
| Total | 101 | 100.0% |
Transportation & Commute in Fossil
Vehicle Availability by Sex in Fossil
The most prevalent vehicle ownership categories in Fossil are males with 2 vehicles (50, accounting for 56.8%) and females with 2 vehicles (54, making up 59.5%).
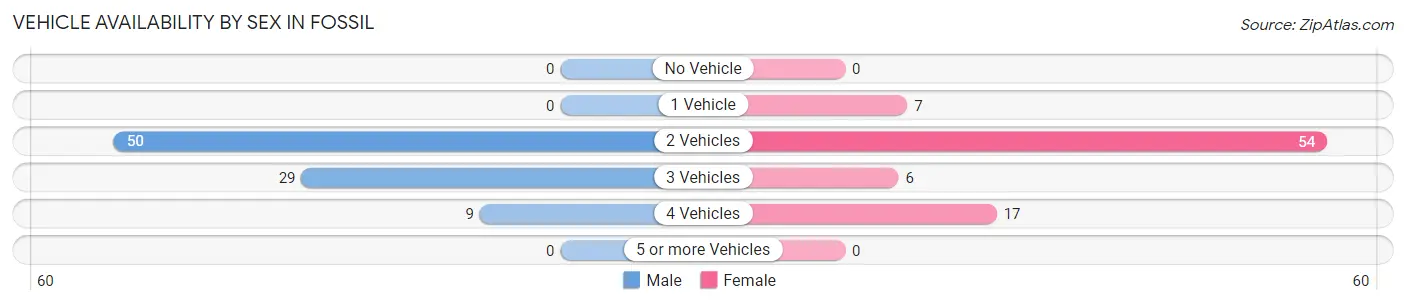
| Vehicles Available | Male | Female |
| No Vehicle | 0 (0.0%) | 0 (0.0%) |
| 1 Vehicle | 0 (0.0%) | 7 (8.3%) |
| 2 Vehicles | 50 (56.8%) | 54 (64.3%) |
| 3 Vehicles | 29 (33.0%) | 6 (7.1%) |
| 4 Vehicles | 9 (10.2%) | 17 (20.2%) |
| 5 or more Vehicles | 0 (0.0%) | 0 (0.0%) |
| Total | 88 (100.0%) | 84 (100.0%) |
Commute Time in Fossil
The most frequently occuring commute durations in Fossil are 5 to 9 minutes (75 commuters, 46.6%), 30 to 34 minutes (24 commuters, 14.9%), and 15 to 19 minutes (21 commuters, 13.0%).
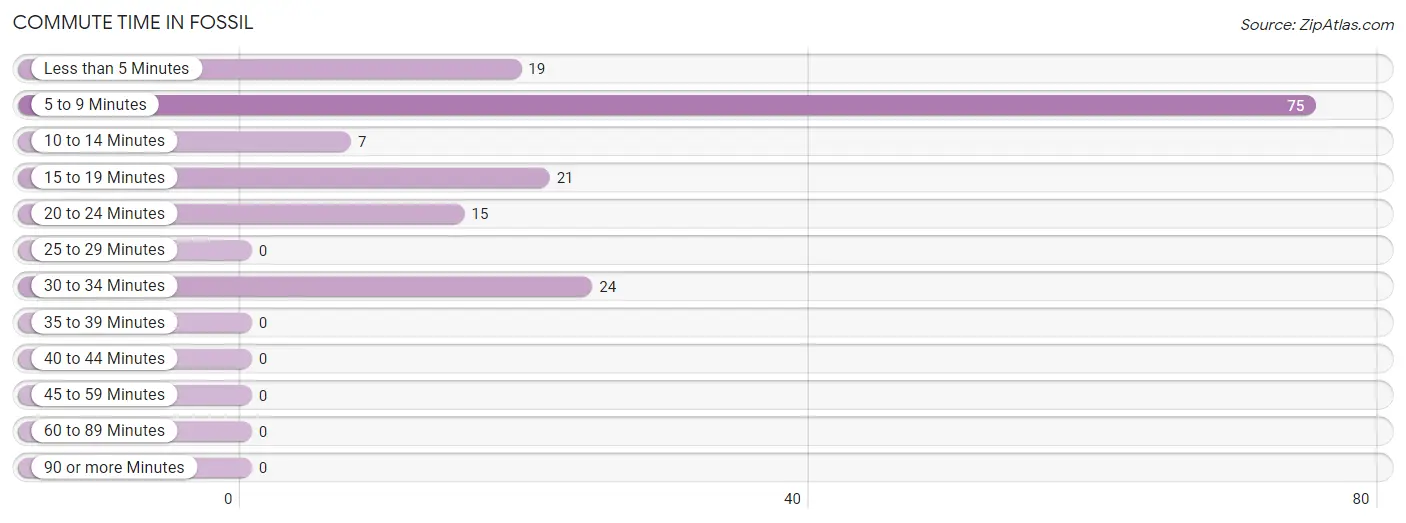
| Commute Time | # Commuters | % Commuters |
| Less than 5 Minutes | 19 | 11.8% |
| 5 to 9 Minutes | 75 | 46.6% |
| 10 to 14 Minutes | 7 | 4.3% |
| 15 to 19 Minutes | 21 | 13.0% |
| 20 to 24 Minutes | 15 | 9.3% |
| 25 to 29 Minutes | 0 | 0.0% |
| 30 to 34 Minutes | 24 | 14.9% |
| 35 to 39 Minutes | 0 | 0.0% |
| 40 to 44 Minutes | 0 | 0.0% |
| 45 to 59 Minutes | 0 | 0.0% |
| 60 to 89 Minutes | 0 | 0.0% |
| 90 or more Minutes | 0 | 0.0% |
Commute Time by Sex in Fossil
The most common commute times in Fossil are 5 to 9 minutes (23 commuters, 29.9%) for males and 5 to 9 minutes (52 commuters, 61.9%) for females.
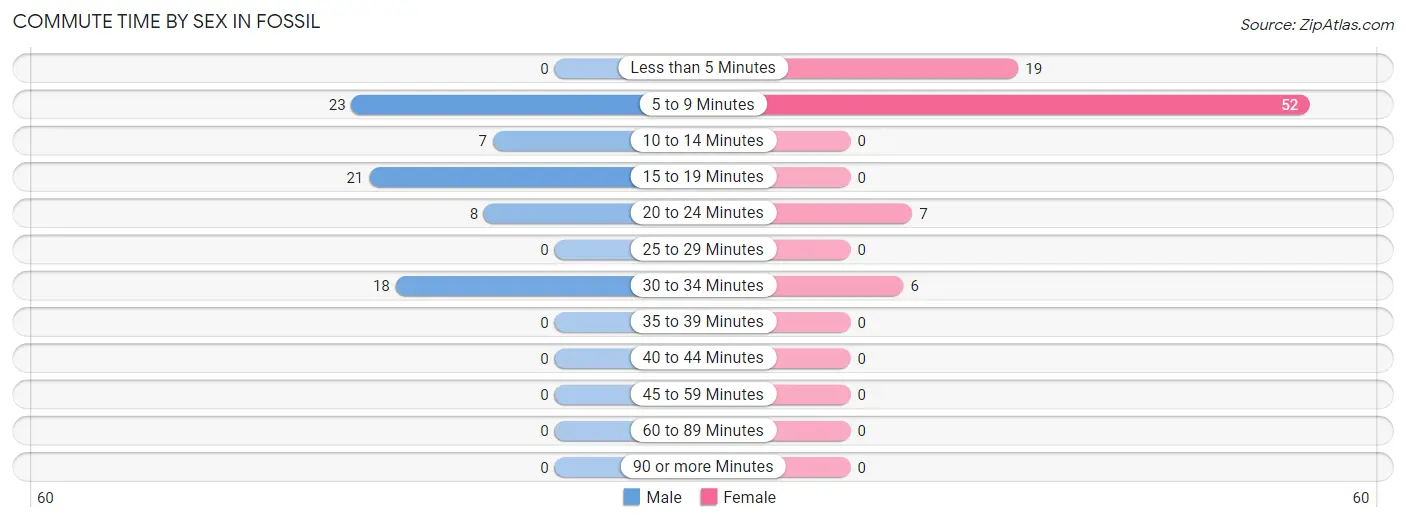
| Commute Time | Male | Female |
| Less than 5 Minutes | 0 (0.0%) | 19 (22.6%) |
| 5 to 9 Minutes | 23 (29.9%) | 52 (61.9%) |
| 10 to 14 Minutes | 7 (9.1%) | 0 (0.0%) |
| 15 to 19 Minutes | 21 (27.3%) | 0 (0.0%) |
| 20 to 24 Minutes | 8 (10.4%) | 7 (8.3%) |
| 25 to 29 Minutes | 0 (0.0%) | 0 (0.0%) |
| 30 to 34 Minutes | 18 (23.4%) | 6 (7.1%) |
| 35 to 39 Minutes | 0 (0.0%) | 0 (0.0%) |
| 40 to 44 Minutes | 0 (0.0%) | 0 (0.0%) |
| 45 to 59 Minutes | 0 (0.0%) | 0 (0.0%) |
| 60 to 89 Minutes | 0 (0.0%) | 0 (0.0%) |
| 90 or more Minutes | 0 (0.0%) | 0 (0.0%) |
Time of Departure to Work by Sex in Fossil
The most frequent times of departure to work in Fossil are 7:30 AM to 7:59 AM (23, 29.9%) for males and 7:30 AM to 7:59 AM (58, 69.1%) for females.
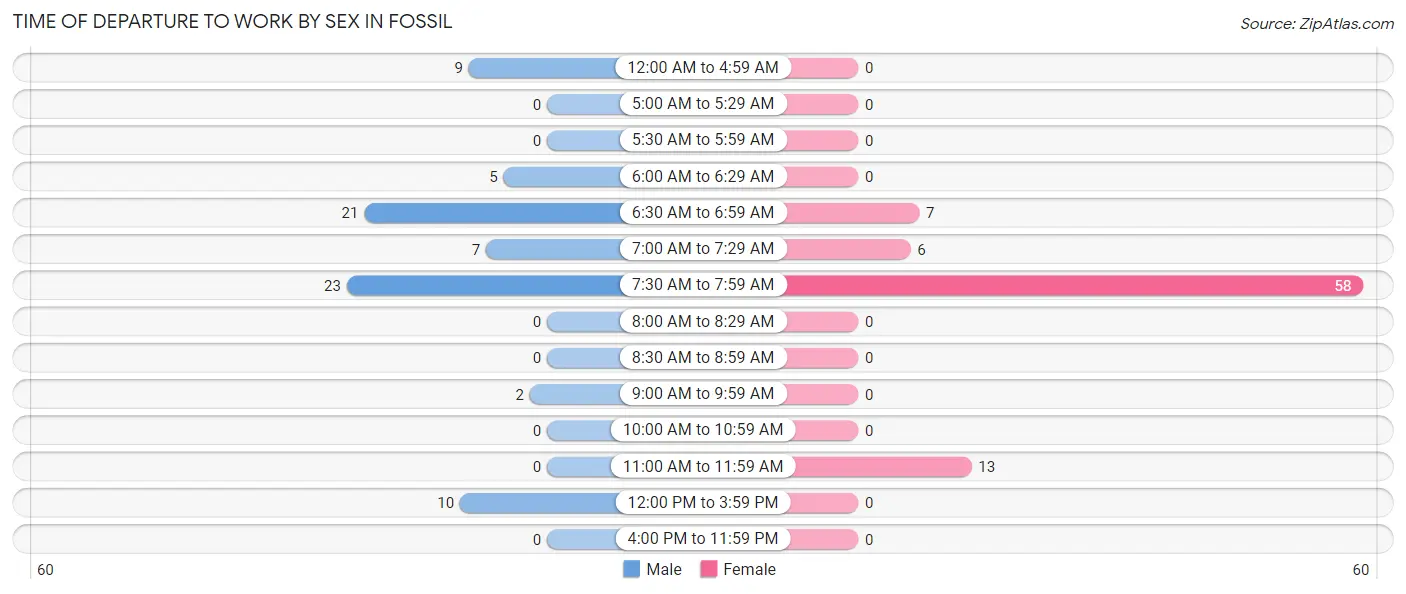
| Time of Departure | Male | Female |
| 12:00 AM to 4:59 AM | 9 (11.7%) | 0 (0.0%) |
| 5:00 AM to 5:29 AM | 0 (0.0%) | 0 (0.0%) |
| 5:30 AM to 5:59 AM | 0 (0.0%) | 0 (0.0%) |
| 6:00 AM to 6:29 AM | 5 (6.5%) | 0 (0.0%) |
| 6:30 AM to 6:59 AM | 21 (27.3%) | 7 (8.3%) |
| 7:00 AM to 7:29 AM | 7 (9.1%) | 6 (7.1%) |
| 7:30 AM to 7:59 AM | 23 (29.9%) | 58 (69.1%) |
| 8:00 AM to 8:29 AM | 0 (0.0%) | 0 (0.0%) |
| 8:30 AM to 8:59 AM | 0 (0.0%) | 0 (0.0%) |
| 9:00 AM to 9:59 AM | 2 (2.6%) | 0 (0.0%) |
| 10:00 AM to 10:59 AM | 0 (0.0%) | 0 (0.0%) |
| 11:00 AM to 11:59 AM | 0 (0.0%) | 13 (15.5%) |
| 12:00 PM to 3:59 PM | 10 (13.0%) | 0 (0.0%) |
| 4:00 PM to 11:59 PM | 0 (0.0%) | 0 (0.0%) |
| Total | 77 (100.0%) | 84 (100.0%) |
Housing Occupancy in Fossil
Occupancy by Ownership in Fossil
Of the total 242 dwellings in Fossil, owner-occupied units account for 192 (79.3%), while renter-occupied units make up 50 (20.7%).
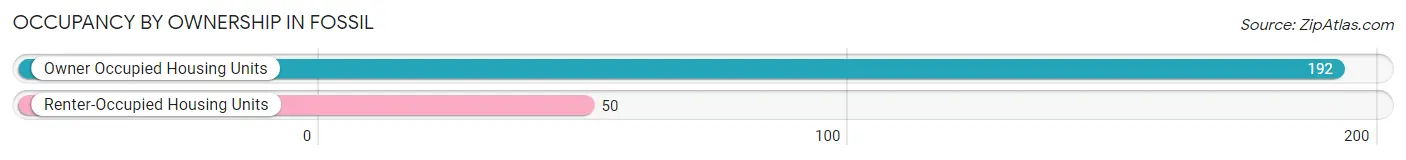
| Occupancy | # Housing Units | % Housing Units |
| Owner Occupied Housing Units | 192 | 79.3% |
| Renter-Occupied Housing Units | 50 | 20.7% |
| Total Occupied Housing Units | 242 | 100.0% |
Occupancy by Household Size in Fossil
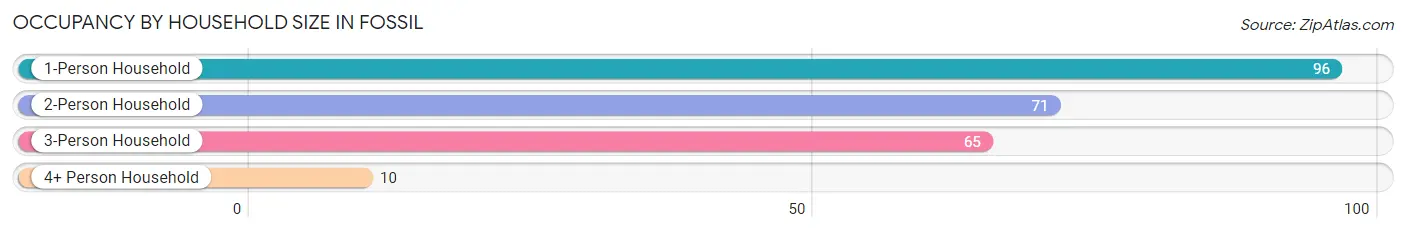
| Household Size | # Housing Units | % Housing Units |
| 1-Person Household | 96 | 39.7% |
| 2-Person Household | 71 | 29.3% |
| 3-Person Household | 65 | 26.9% |
| 4+ Person Household | 10 | 4.1% |
| Total Housing Units | 242 | 100.0% |
Occupancy by Ownership by Household Size in Fossil
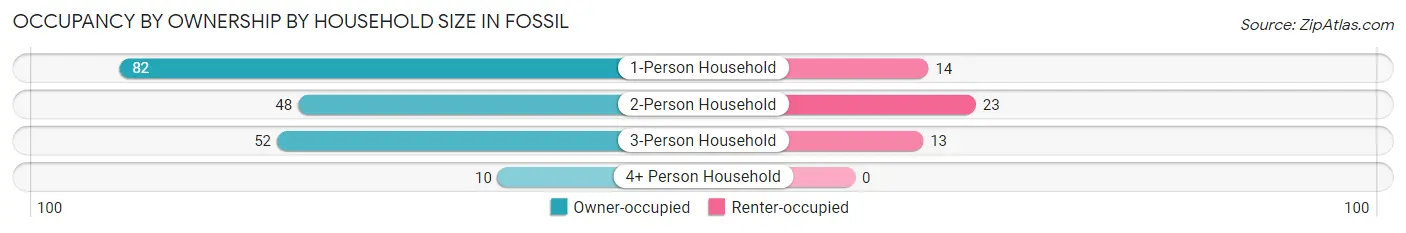
| Household Size | Owner-occupied | Renter-occupied |
| 1-Person Household | 82 (85.4%) | 14 (14.6%) |
| 2-Person Household | 48 (67.6%) | 23 (32.4%) |
| 3-Person Household | 52 (80.0%) | 13 (20.0%) |
| 4+ Person Household | 10 (100.0%) | 0 (0.0%) |
| Total Housing Units | 192 (79.3%) | 50 (20.7%) |
Occupancy by Educational Attainment in Fossil
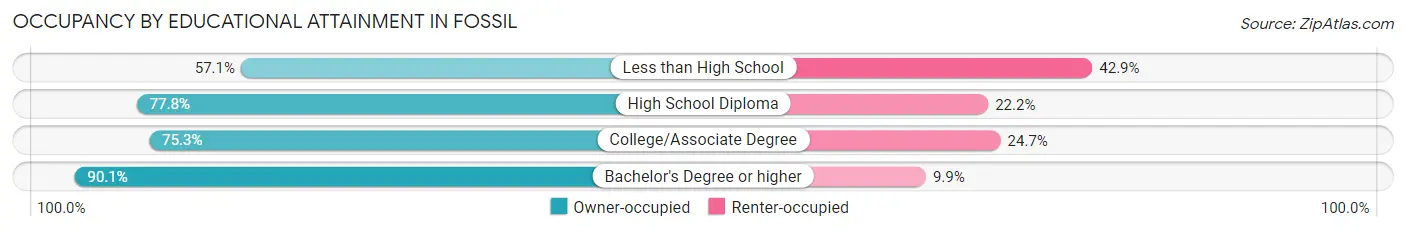
| Household Size | Owner-occupied | Renter-occupied |
| Less than High School | 12 (57.1%) | 9 (42.9%) |
| High School Diploma | 49 (77.8%) | 14 (22.2%) |
| College/Associate Degree | 58 (75.3%) | 19 (24.7%) |
| Bachelor's Degree or higher | 73 (90.1%) | 8 (9.9%) |
Occupancy by Age of Householder in Fossil
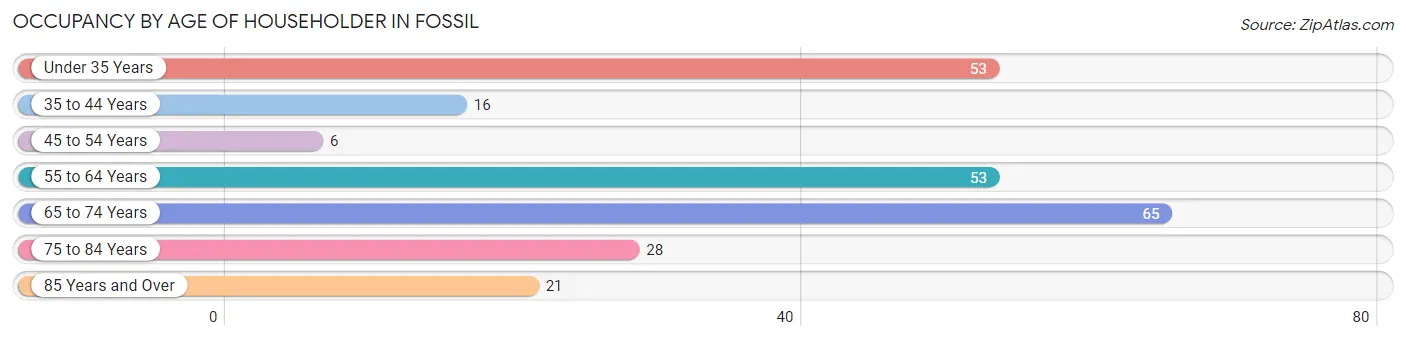
| Age Bracket | # Households | % Households |
| Under 35 Years | 53 | 21.9% |
| 35 to 44 Years | 16 | 6.6% |
| 45 to 54 Years | 6 | 2.5% |
| 55 to 64 Years | 53 | 21.9% |
| 65 to 74 Years | 65 | 26.9% |
| 75 to 84 Years | 28 | 11.6% |
| 85 Years and Over | 21 | 8.7% |
| Total | 242 | 100.0% |
Housing Finances in Fossil
Median Income by Occupancy in Fossil
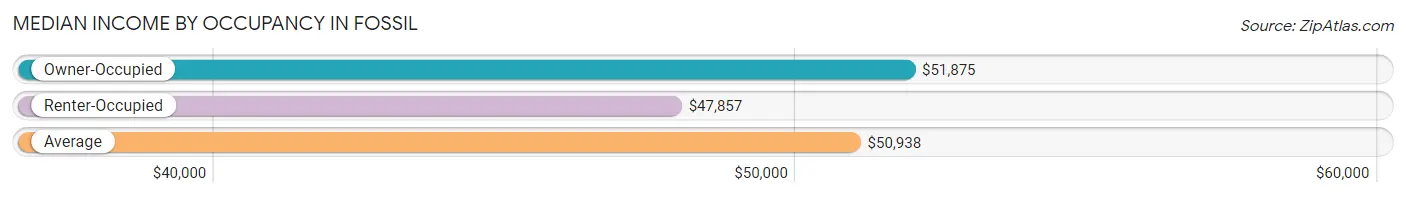
| Occupancy Type | # Households | Median Income |
| Owner-Occupied | 192 (79.3%) | $51,875 |
| Renter-Occupied | 50 (20.7%) | $47,857 |
| Average | 242 (100.0%) | $50,938 |
Occupancy by Householder Income Bracket in Fossil
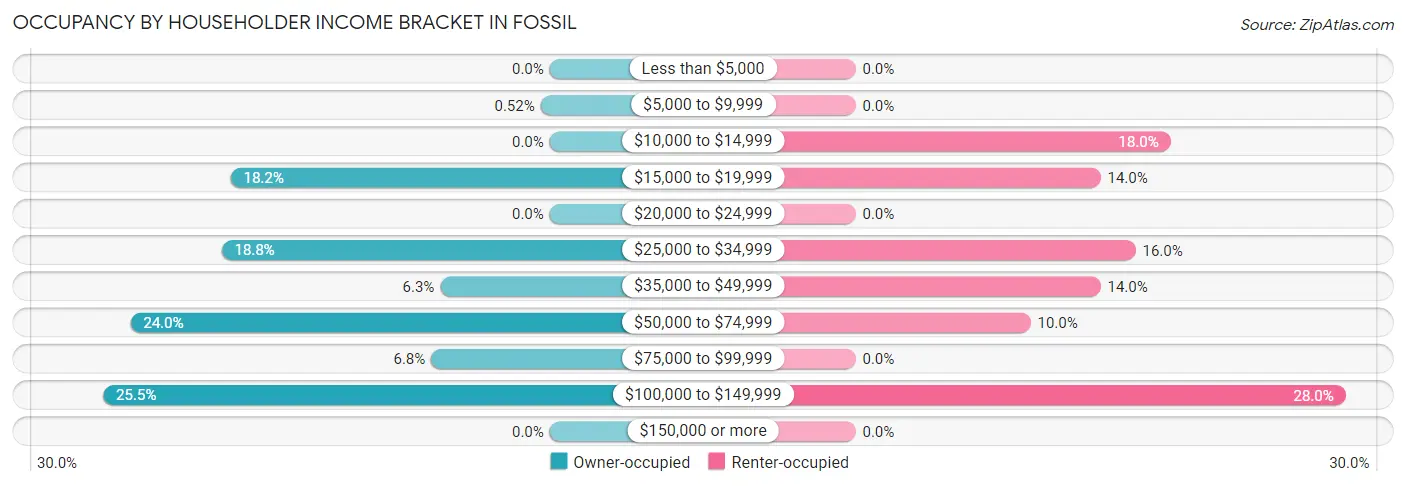
| Income Bracket | Owner-occupied | Renter-occupied |
| Less than $5,000 | 0 (0.0%) | 0 (0.0%) |
| $5,000 to $9,999 | 1 (0.5%) | 0 (0.0%) |
| $10,000 to $14,999 | 0 (0.0%) | 9 (18.0%) |
| $15,000 to $19,999 | 35 (18.2%) | 7 (14.0%) |
| $20,000 to $24,999 | 0 (0.0%) | 0 (0.0%) |
| $25,000 to $34,999 | 36 (18.8%) | 8 (16.0%) |
| $35,000 to $49,999 | 12 (6.2%) | 7 (14.0%) |
| $50,000 to $74,999 | 46 (24.0%) | 5 (10.0%) |
| $75,000 to $99,999 | 13 (6.8%) | 0 (0.0%) |
| $100,000 to $149,999 | 49 (25.5%) | 14 (28.0%) |
| $150,000 or more | 0 (0.0%) | 0 (0.0%) |
| Total | 192 (100.0%) | 50 (100.0%) |
Monthly Housing Cost Tiers in Fossil
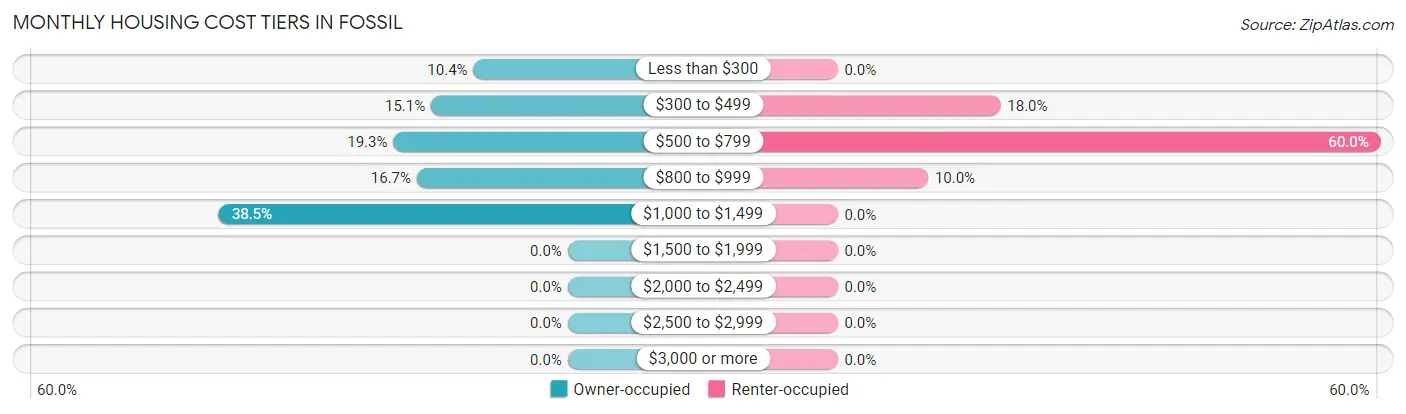
| Monthly Cost | Owner-occupied | Renter-occupied |
| Less than $300 | 20 (10.4%) | 0 (0.0%) |
| $300 to $499 | 29 (15.1%) | 9 (18.0%) |
| $500 to $799 | 37 (19.3%) | 30 (60.0%) |
| $800 to $999 | 32 (16.7%) | 5 (10.0%) |
| $1,000 to $1,499 | 74 (38.5%) | 0 (0.0%) |
| $1,500 to $1,999 | 0 (0.0%) | 0 (0.0%) |
| $2,000 to $2,499 | 0 (0.0%) | 0 (0.0%) |
| $2,500 to $2,999 | 0 (0.0%) | 0 (0.0%) |
| $3,000 or more | 0 (0.0%) | 0 (0.0%) |
| Total | 192 (100.0%) | 50 (100.0%) |
Physical Housing Characteristics in Fossil
Housing Structures in Fossil
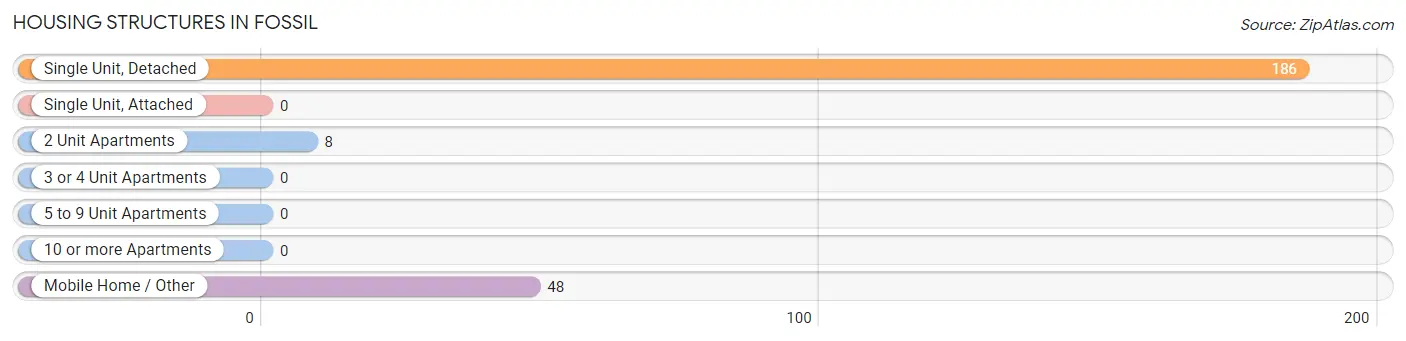
| Structure Type | # Housing Units | % Housing Units |
| Single Unit, Detached | 186 | 76.9% |
| Single Unit, Attached | 0 | 0.0% |
| 2 Unit Apartments | 8 | 3.3% |
| 3 or 4 Unit Apartments | 0 | 0.0% |
| 5 to 9 Unit Apartments | 0 | 0.0% |
| 10 or more Apartments | 0 | 0.0% |
| Mobile Home / Other | 48 | 19.8% |
| Total | 242 | 100.0% |
Housing Structures by Occupancy in Fossil
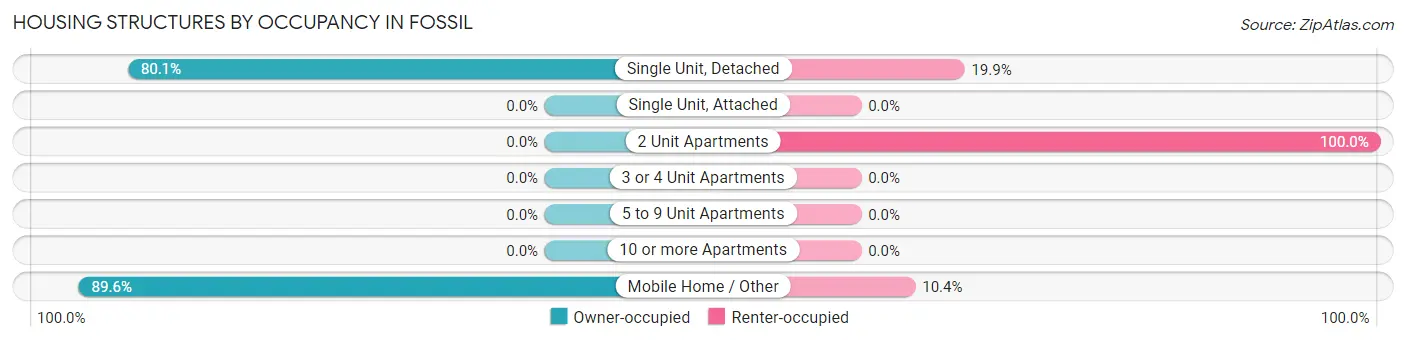
| Structure Type | Owner-occupied | Renter-occupied |
| Single Unit, Detached | 149 (80.1%) | 37 (19.9%) |
| Single Unit, Attached | 0 (0.0%) | 0 (0.0%) |
| 2 Unit Apartments | 0 (0.0%) | 8 (100.0%) |
| 3 or 4 Unit Apartments | 0 (0.0%) | 0 (0.0%) |
| 5 to 9 Unit Apartments | 0 (0.0%) | 0 (0.0%) |
| 10 or more Apartments | 0 (0.0%) | 0 (0.0%) |
| Mobile Home / Other | 43 (89.6%) | 5 (10.4%) |
| Total | 192 (79.3%) | 50 (20.7%) |
Housing Structures by Number of Rooms in Fossil
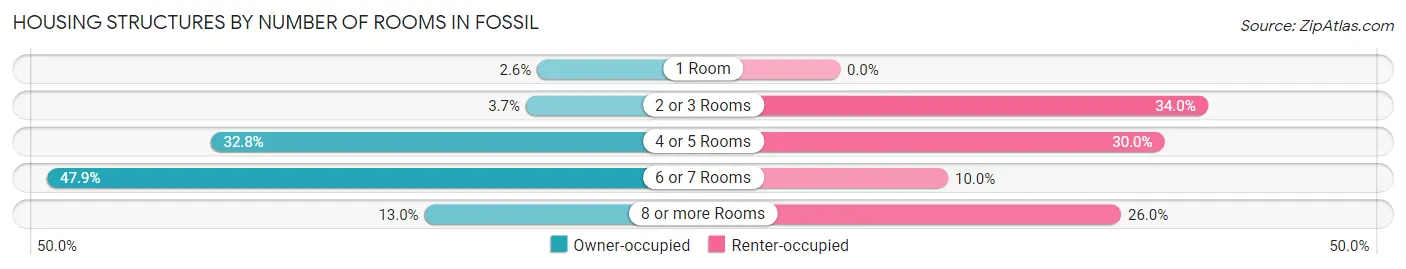
| Number of Rooms | Owner-occupied | Renter-occupied |
| 1 Room | 5 (2.6%) | 0 (0.0%) |
| 2 or 3 Rooms | 7 (3.6%) | 17 (34.0%) |
| 4 or 5 Rooms | 63 (32.8%) | 15 (30.0%) |
| 6 or 7 Rooms | 92 (47.9%) | 5 (10.0%) |
| 8 or more Rooms | 25 (13.0%) | 13 (26.0%) |
| Total | 192 (100.0%) | 50 (100.0%) |
Housing Structure by Heating Type in Fossil
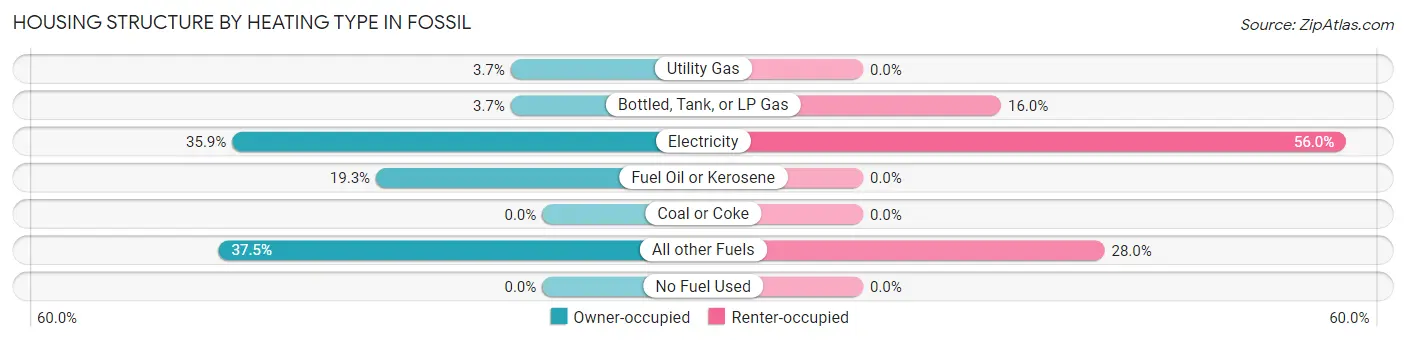
| Heating Type | Owner-occupied | Renter-occupied |
| Utility Gas | 7 (3.6%) | 0 (0.0%) |
| Bottled, Tank, or LP Gas | 7 (3.6%) | 8 (16.0%) |
| Electricity | 69 (35.9%) | 28 (56.0%) |
| Fuel Oil or Kerosene | 37 (19.3%) | 0 (0.0%) |
| Coal or Coke | 0 (0.0%) | 0 (0.0%) |
| All other Fuels | 72 (37.5%) | 14 (28.0%) |
| No Fuel Used | 0 (0.0%) | 0 (0.0%) |
| Total | 192 (100.0%) | 50 (100.0%) |
Household Vehicle Usage in Fossil
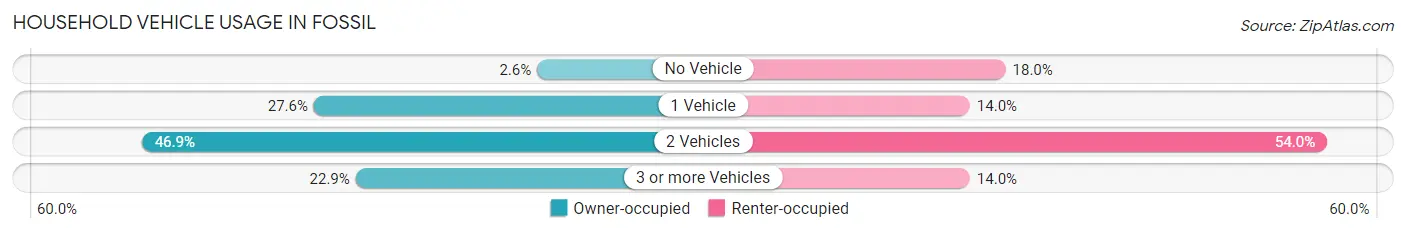
| Vehicles per Household | Owner-occupied | Renter-occupied |
| No Vehicle | 5 (2.6%) | 9 (18.0%) |
| 1 Vehicle | 53 (27.6%) | 7 (14.0%) |
| 2 Vehicles | 90 (46.9%) | 27 (54.0%) |
| 3 or more Vehicles | 44 (22.9%) | 7 (14.0%) |
| Total | 192 (100.0%) | 50 (100.0%) |
Real Estate & Mortgages in Fossil
Real Estate and Mortgage Overview in Fossil
| Characteristic | Without Mortgage | With Mortgage |
| Housing Units | 93 | 99 |
| Median Property Value | $107,300 | $183,500 |
| Median Household Income | $33,417 | $0 |
| Monthly Housing Costs | $390 | $0 |
| Real Estate Taxes | $1,045 | $0 |
Property Value by Mortgage Status in Fossil
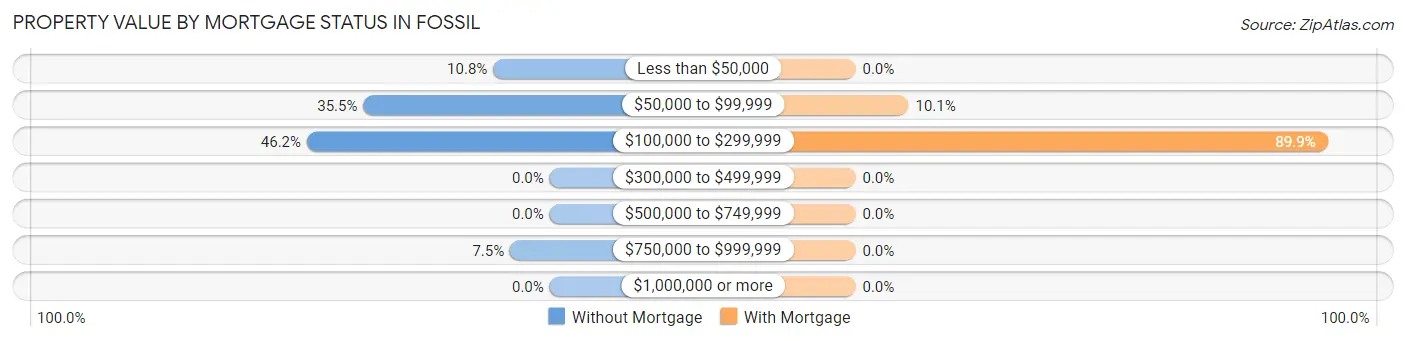
| Property Value | Without Mortgage | With Mortgage |
| Less than $50,000 | 10 (10.7%) | 0 (0.0%) |
| $50,000 to $99,999 | 33 (35.5%) | 10 (10.1%) |
| $100,000 to $299,999 | 43 (46.2%) | 89 (89.9%) |
| $300,000 to $499,999 | 0 (0.0%) | 0 (0.0%) |
| $500,000 to $749,999 | 0 (0.0%) | 0 (0.0%) |
| $750,000 to $999,999 | 7 (7.5%) | 0 (0.0%) |
| $1,000,000 or more | 0 (0.0%) | 0 (0.0%) |
| Total | 93 (100.0%) | 99 (100.0%) |
Household Income by Mortgage Status in Fossil
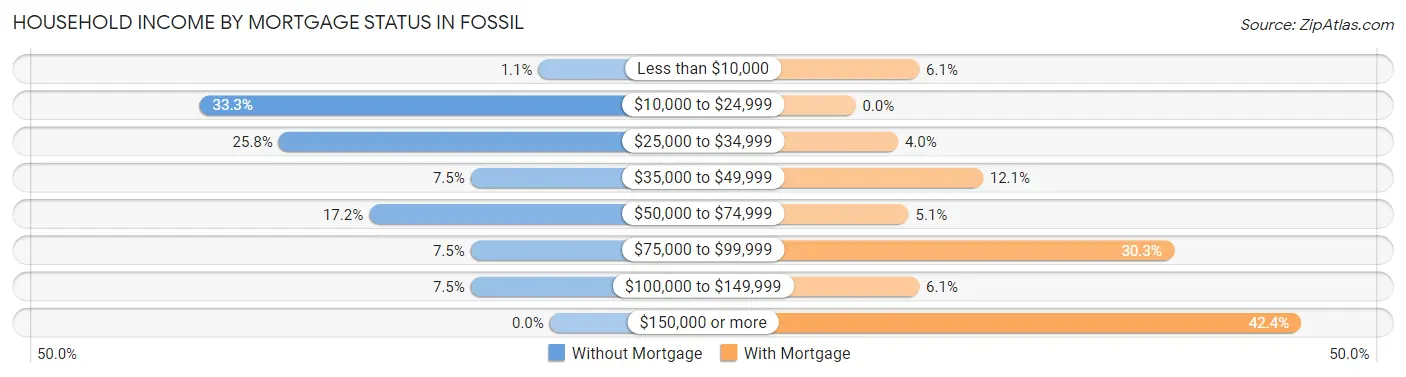
| Household Income | Without Mortgage | With Mortgage |
| Less than $10,000 | 1 (1.1%) | 6 (6.1%) |
| $10,000 to $24,999 | 31 (33.3%) | 0 (0.0%) |
| $25,000 to $34,999 | 24 (25.8%) | 4 (4.0%) |
| $35,000 to $49,999 | 7 (7.5%) | 12 (12.1%) |
| $50,000 to $74,999 | 16 (17.2%) | 5 (5.1%) |
| $75,000 to $99,999 | 7 (7.5%) | 30 (30.3%) |
| $100,000 to $149,999 | 7 (7.5%) | 6 (6.1%) |
| $150,000 or more | 0 (0.0%) | 42 (42.4%) |
| Total | 93 (100.0%) | 99 (100.0%) |
Property Value to Household Income Ratio in Fossil
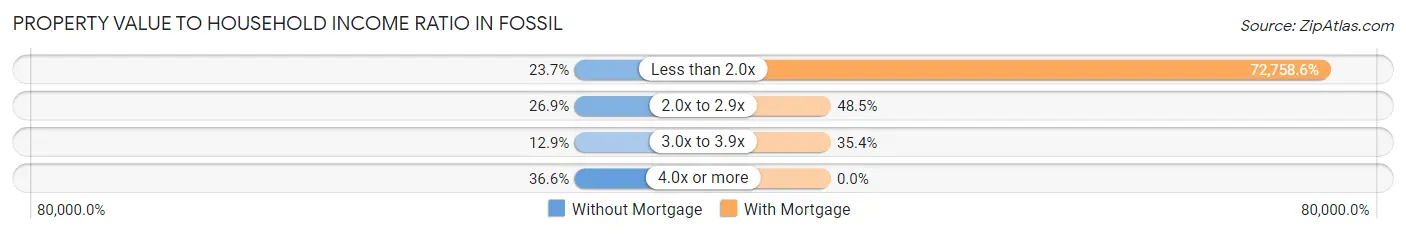
| Value-to-Income Ratio | Without Mortgage | With Mortgage |
| Less than 2.0x | 22 (23.7%) | 72,031 (72,758.6%) |
| 2.0x to 2.9x | 25 (26.9%) | 48 (48.5%) |
| 3.0x to 3.9x | 12 (12.9%) | 35 (35.3%) |
| 4.0x or more | 34 (36.6%) | 0 (0.0%) |
| Total | 93 (100.0%) | 99 (100.0%) |
Real Estate Taxes by Mortgage Status in Fossil
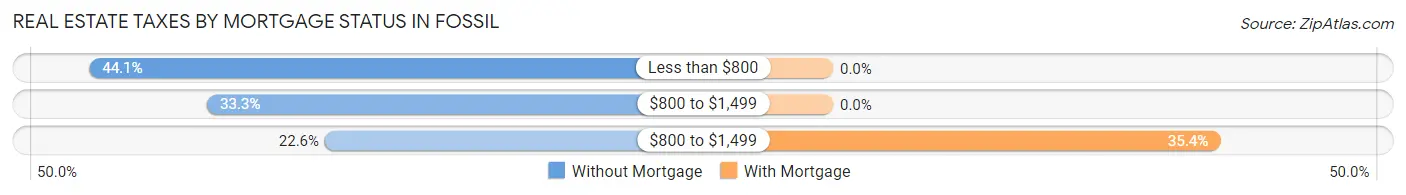
| Property Taxes | Without Mortgage | With Mortgage |
| Less than $800 | 41 (44.1%) | 0 (0.0%) |
| $800 to $1,499 | 31 (33.3%) | 0 (0.0%) |
| $800 to $1,499 | 21 (22.6%) | 35 (35.3%) |
| Total | 93 (100.0%) | 99 (100.0%) |
Health & Disability in Fossil
Health Insurance Coverage by Age in Fossil
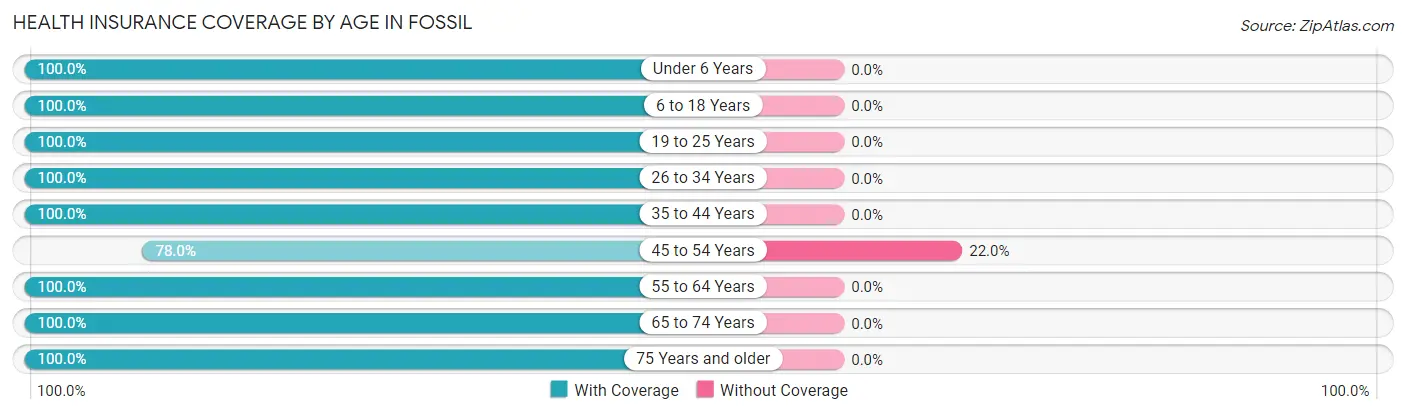
| Age Bracket | With Coverage | Without Coverage |
| Under 6 Years | 6 (100.0%) | 0 (0.0%) |
| 6 to 18 Years | 39 (100.0%) | 0 (0.0%) |
| 19 to 25 Years | 23 (100.0%) | 0 (0.0%) |
| 26 to 34 Years | 67 (100.0%) | 0 (0.0%) |
| 35 to 44 Years | 49 (100.0%) | 0 (0.0%) |
| 45 to 54 Years | 39 (78.0%) | 11 (22.0%) |
| 55 to 64 Years | 60 (100.0%) | 0 (0.0%) |
| 65 to 74 Years | 101 (100.0%) | 0 (0.0%) |
| 75 Years and older | 90 (100.0%) | 0 (0.0%) |
| Total | 474 (97.7%) | 11 (2.3%) |
Health Insurance Coverage by Citizenship Status in Fossil
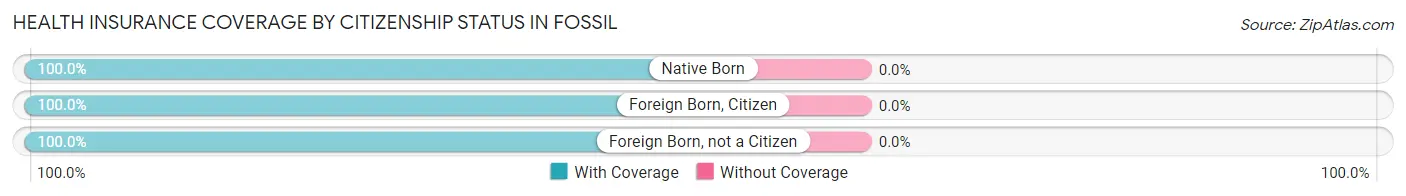
| Citizenship Status | With Coverage | Without Coverage |
| Native Born | 6 (100.0%) | 0 (0.0%) |
| Foreign Born, Citizen | 39 (100.0%) | 0 (0.0%) |
| Foreign Born, not a Citizen | 23 (100.0%) | 0 (0.0%) |
Health Insurance Coverage by Household Income in Fossil
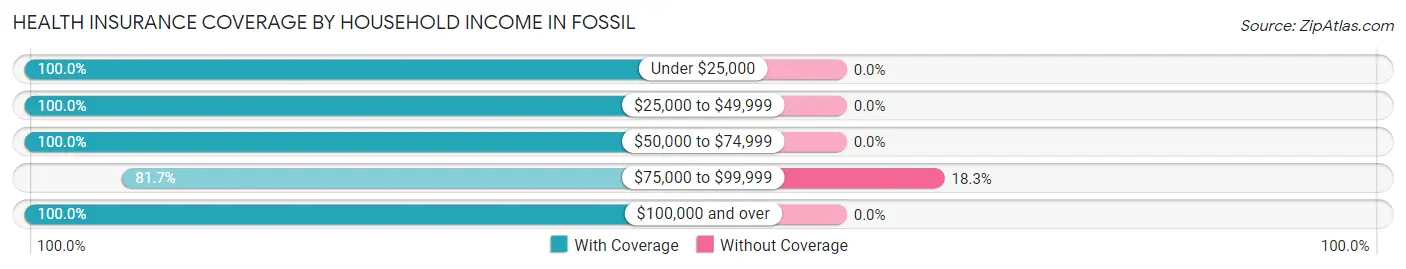
| Household Income | With Coverage | Without Coverage |
| Under $25,000 | 73 (100.0%) | 0 (0.0%) |
| $25,000 to $49,999 | 136 (100.0%) | 0 (0.0%) |
| $50,000 to $74,999 | 84 (100.0%) | 0 (0.0%) |
| $75,000 to $99,999 | 49 (81.7%) | 11 (18.3%) |
| $100,000 and over | 132 (100.0%) | 0 (0.0%) |
Public vs Private Health Insurance Coverage by Age in Fossil
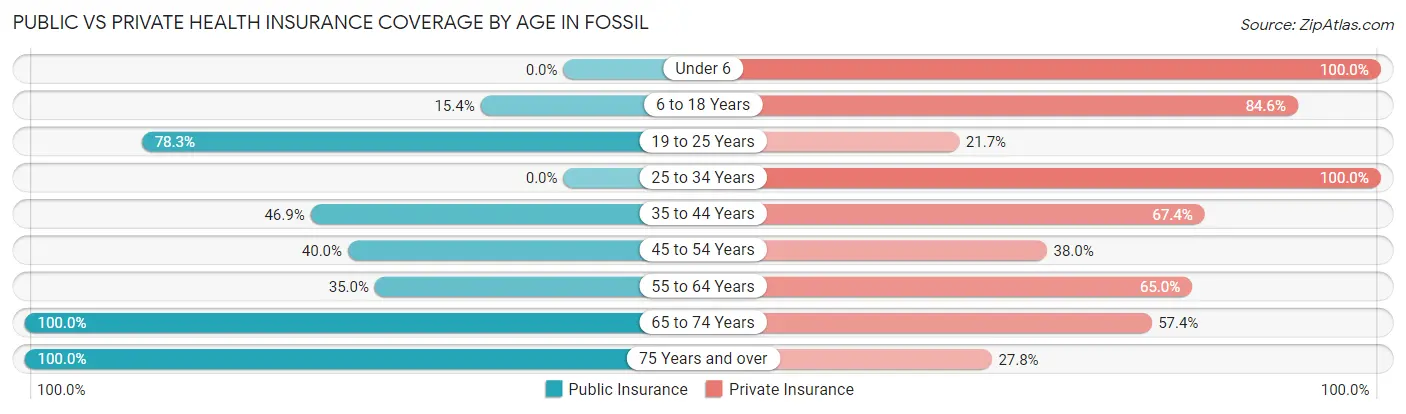
| Age Bracket | Public Insurance | Private Insurance |
| Under 6 | 0 (0.0%) | 6 (100.0%) |
| 6 to 18 Years | 6 (15.4%) | 33 (84.6%) |
| 19 to 25 Years | 18 (78.3%) | 5 (21.7%) |
| 25 to 34 Years | 0 (0.0%) | 67 (100.0%) |
| 35 to 44 Years | 23 (46.9%) | 33 (67.3%) |
| 45 to 54 Years | 20 (40.0%) | 19 (38.0%) |
| 55 to 64 Years | 21 (35.0%) | 39 (65.0%) |
| 65 to 74 Years | 101 (100.0%) | 58 (57.4%) |
| 75 Years and over | 90 (100.0%) | 25 (27.8%) |
| Total | 279 (57.5%) | 285 (58.8%) |
Disability Status by Sex by Age in Fossil
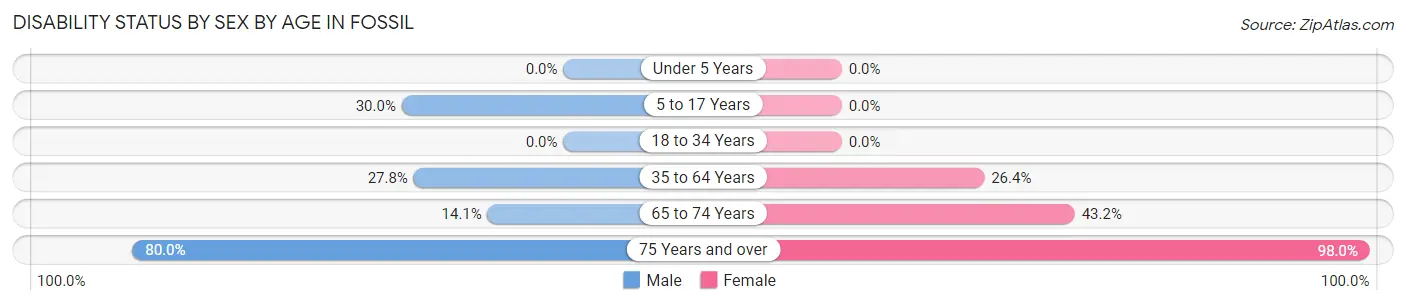
| Age Bracket | Male | Female |
| Under 5 Years | 0 (0.0%) | 0 (0.0%) |
| 5 to 17 Years | 6 (30.0%) | 0 (0.0%) |
| 18 to 34 Years | 0 (0.0%) | 0 (0.0%) |
| 35 to 64 Years | 20 (27.8%) | 23 (26.4%) |
| 65 to 74 Years | 9 (14.1%) | 16 (43.2%) |
| 75 Years and over | 32 (80.0%) | 49 (98.0%) |
Disability Class by Sex by Age in Fossil
Disability Class: Hearing Difficulty
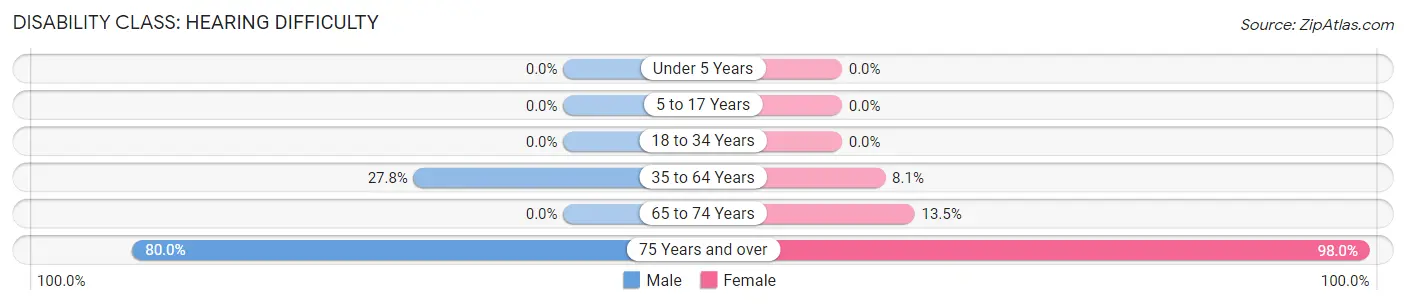
| Age Bracket | Male | Female |
| Under 5 Years | 0 (0.0%) | 0 (0.0%) |
| 5 to 17 Years | 0 (0.0%) | 0 (0.0%) |
| 18 to 34 Years | 0 (0.0%) | 0 (0.0%) |
| 35 to 64 Years | 20 (27.8%) | 7 (8.1%) |
| 65 to 74 Years | 0 (0.0%) | 5 (13.5%) |
| 75 Years and over | 32 (80.0%) | 49 (98.0%) |
Disability Class: Vision Difficulty
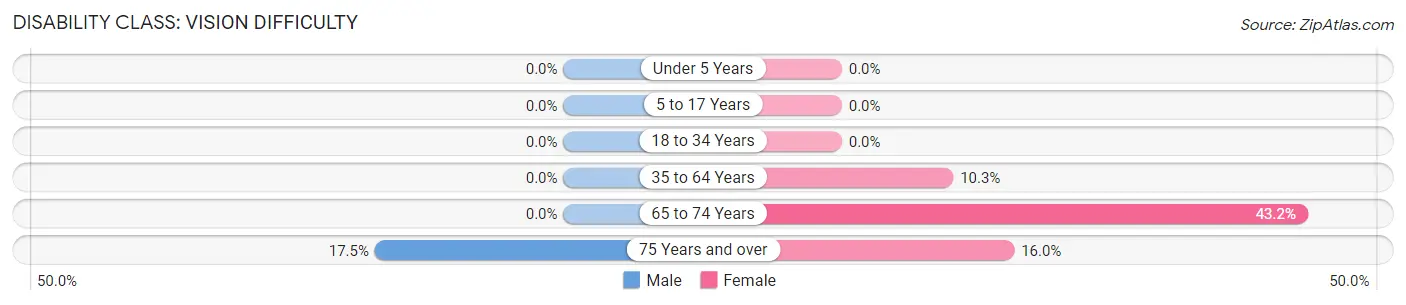
| Age Bracket | Male | Female |
| Under 5 Years | 0 (0.0%) | 0 (0.0%) |
| 5 to 17 Years | 0 (0.0%) | 0 (0.0%) |
| 18 to 34 Years | 0 (0.0%) | 0 (0.0%) |
| 35 to 64 Years | 0 (0.0%) | 9 (10.3%) |
| 65 to 74 Years | 0 (0.0%) | 16 (43.2%) |
| 75 Years and over | 7 (17.5%) | 8 (16.0%) |
Disability Class: Cognitive Difficulty
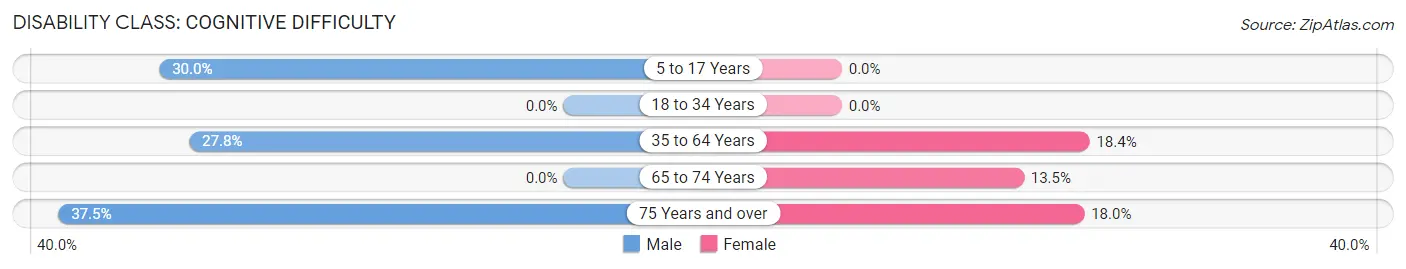
| Age Bracket | Male | Female |
| 5 to 17 Years | 6 (30.0%) | 0 (0.0%) |
| 18 to 34 Years | 0 (0.0%) | 0 (0.0%) |
| 35 to 64 Years | 20 (27.8%) | 16 (18.4%) |
| 65 to 74 Years | 0 (0.0%) | 5 (13.5%) |
| 75 Years and over | 15 (37.5%) | 9 (18.0%) |
Disability Class: Ambulatory Difficulty
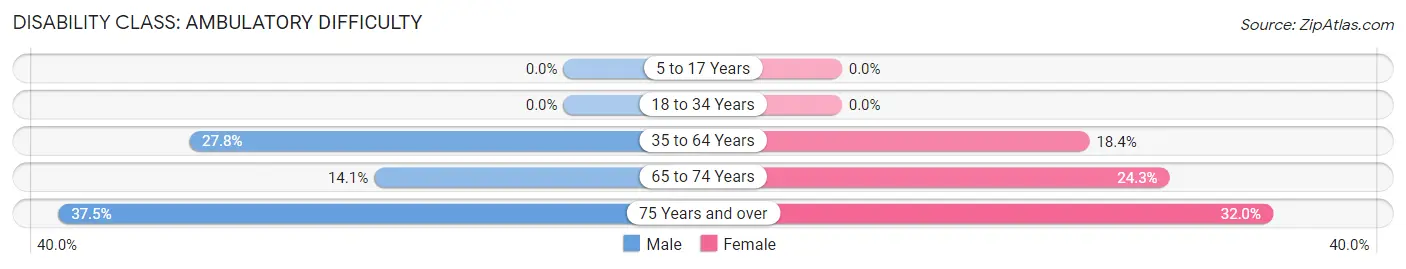
| Age Bracket | Male | Female |
| 5 to 17 Years | 0 (0.0%) | 0 (0.0%) |
| 18 to 34 Years | 0 (0.0%) | 0 (0.0%) |
| 35 to 64 Years | 20 (27.8%) | 16 (18.4%) |
| 65 to 74 Years | 9 (14.1%) | 9 (24.3%) |
| 75 Years and over | 15 (37.5%) | 16 (32.0%) |
Disability Class: Self-Care Difficulty
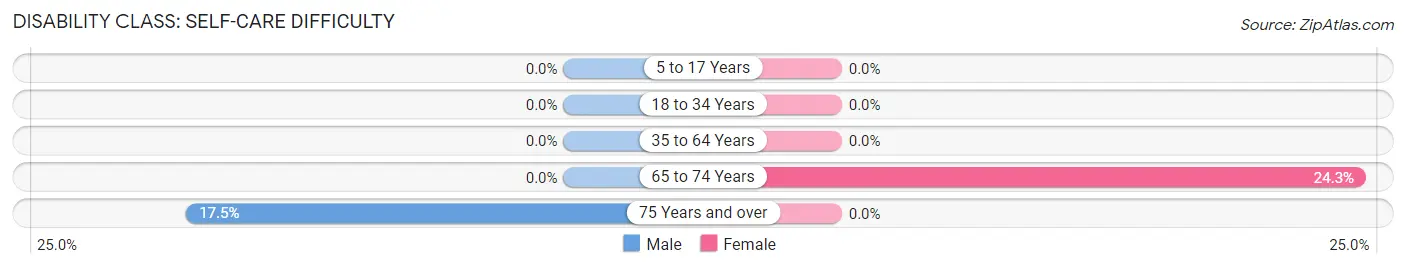
| Age Bracket | Male | Female |
| 5 to 17 Years | 0 (0.0%) | 0 (0.0%) |
| 18 to 34 Years | 0 (0.0%) | 0 (0.0%) |
| 35 to 64 Years | 0 (0.0%) | 0 (0.0%) |
| 65 to 74 Years | 0 (0.0%) | 9 (24.3%) |
| 75 Years and over | 7 (17.5%) | 0 (0.0%) |
Technology Access in Fossil
Computing Device Access in Fossil
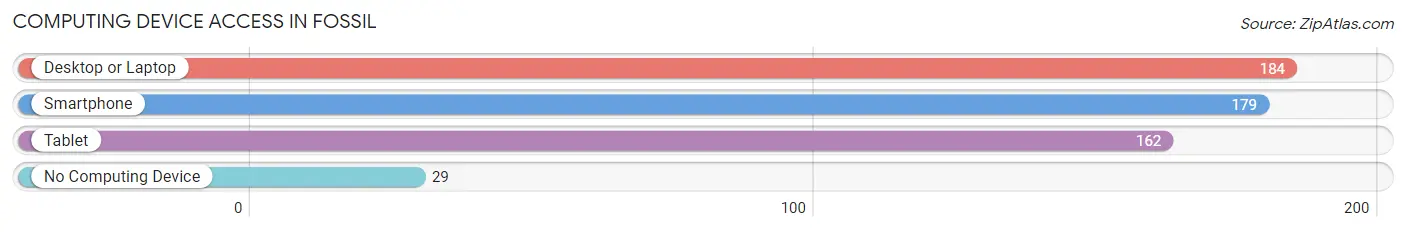
| Device Type | # Households | % Households |
| Desktop or Laptop | 184 | 76.0% |
| Smartphone | 179 | 74.0% |
| Tablet | 162 | 66.9% |
| No Computing Device | 29 | 12.0% |
| Total | 242 | 100.0% |
Internet Access in Fossil
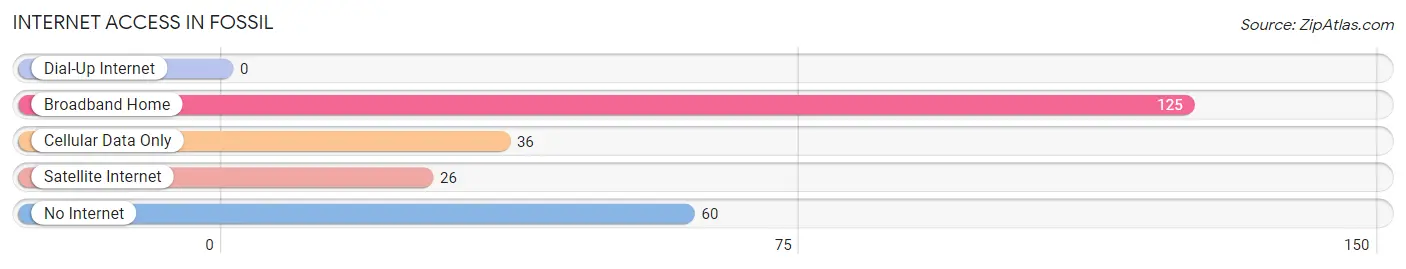
| Internet Type | # Households | % Households |
| Dial-Up Internet | 0 | 0.0% |
| Broadband Home | 125 | 51.6% |
| Cellular Data Only | 36 | 14.9% |
| Satellite Internet | 26 | 10.7% |
| No Internet | 60 | 24.8% |
| Total | 242 | 100.0% |
Fossil Summary
Fossil is a small city located in Wheeler County, Oregon, United States. It is situated in the foothills of the Blue Mountains, approximately 50 miles east of the city of Pendleton. The population of Fossil was 545 at the 2010 census.
History
Fossil was founded in 1876 by a group of settlers from the nearby town of Condon. The town was named after the nearby fossil beds, which were discovered by the settlers. The fossils found in the area were mostly of extinct animals, such as mammoths and mastodons.
The town was originally a farming and ranching community, but in the early 1900s, the discovery of coal in the area led to the development of a coal mining industry. The coal mines provided jobs for many of the town's residents, and the town grew rapidly.
In the 1950s, the coal industry began to decline, and the town's population began to decline as well. In the 1970s, the town was revitalized by the development of a new industry: tourism. The nearby John Day Fossil Beds National Monument, which was established in 1975, brought many visitors to the area.
Geography
Fossil is located in the foothills of the Blue Mountains, at an elevation of 2,845 feet (867 m). The city is situated in a valley, surrounded by hills and mountains. The John Day River flows through the city, and the nearby John Day Fossil Beds National Monument is located just to the east.
The climate in Fossil is semi-arid, with hot summers and cold winters. The average annual precipitation is 11.5 inches (292 mm).
Economy
The economy of Fossil is largely based on tourism. The nearby John Day Fossil Beds National Monument is a major tourist attraction, and the town also has several restaurants, hotels, and other businesses catering to visitors.
The town also has a small manufacturing sector, with several small businesses producing wood products, metal products, and other goods.
Demographics
As of the 2010 census, the population of Fossil was 545. The racial makeup of the town was 95.3% White, 0.2% African American, 0.7% Native American, 0.2% Asian, 0.2% Pacific Islander, 0.7% from other races, and 2.7% from two or more races. Hispanic or Latino of any race were 2.7% of the population.
The median household income in Fossil was $31,250, and the median family income was $37,500. The per capita income was $17,818. About 16.7% of families and 20.2% of the population were below the poverty line, including 28.3% of those under age 18 and 10.3% of those age 65 or over.
Common Questions
What is Per Capita Income in Fossil?
Per Capita income in Fossil is $31,017.
What is the Median Family Income in Fossil?
Median Family Income in Fossil is $83,958.
What is the Median Household income in Fossil?
Median Household Income in Fossil is $50,938.
What is Income or Wage Gap in Fossil?
Income or Wage Gap in Fossil is 5.3%.
Women in Fossil earn 94.7 cents for every dollar earned by a man.
What is Inequality or Gini Index in Fossil?
Inequality or Gini Index in Fossil is 0.37.
What is the Total Population of Fossil?
Total Population of Fossil is 485.
What is the Total Male Population of Fossil?
Total Male Population of Fossil is 232.
What is the Total Female Population of Fossil?
Total Female Population of Fossil is 253.
What is the Ratio of Males per 100 Females in Fossil?
There are 91.70 Males per 100 Females in Fossil.
What is the Ratio of Females per 100 Males in Fossil?
There are 109.05 Females per 100 Males in Fossil.
What is the Median Population Age in Fossil?
Median Population Age in Fossil is 62.1 Years.
What is the Average Family Size in Fossil
Average Family Size in Fossil is 2.8 People.
What is the Average Household Size in Fossil
Average Household Size in Fossil is 2.0 People.
How Large is the Labor Force in Fossil?
There are 184 People in the Labor Forcein in Fossil.
What is the Percentage of People in the Labor Force in Fossil?
41.3% of People are in the Labor Force in Fossil.
What is the Unemployment Rate in Fossil?
Unemployment Rate in Fossil is 6.5%.