Cities with the Highest Percentage of Hungarian Population in Oregon
RELATED REPORTS & OPTIONS
Hungarian
Oregon
Compare Cities
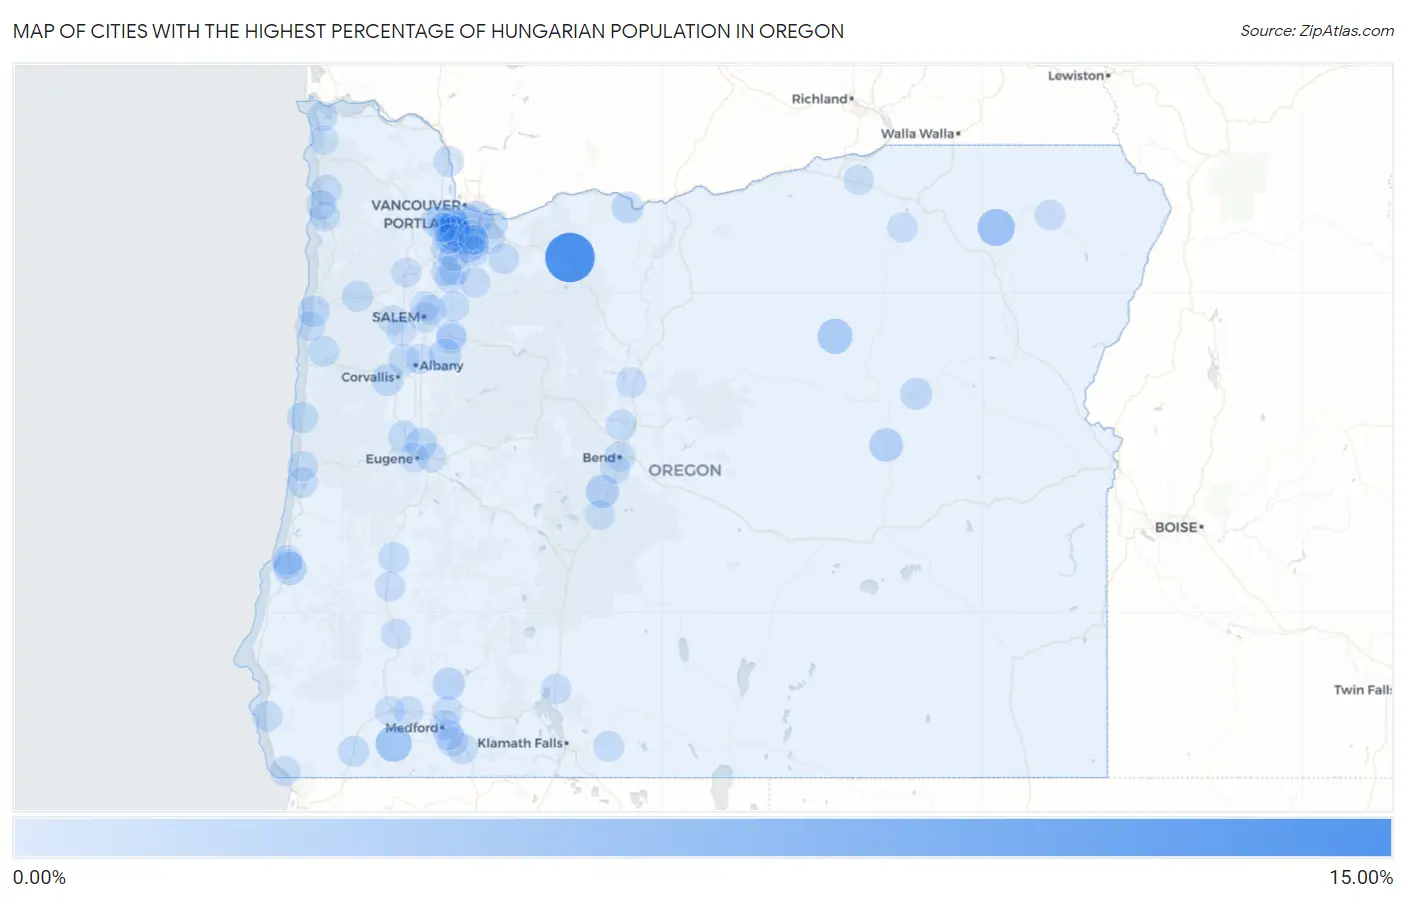
Map of Cities with the Highest Percentage of Hungarian Population in Oregon
0.00%
15.00%
Cities with the Highest Percentage of Hungarian Population in Oregon
| City | Hungarian | vs State | vs National | |
| 1. | Government Camp | 12.87% | 0.34%(+12.5)#1 | 0.39%(+12.5)#53 |
| 2. | Summerville | 4.62% | 0.34%(+4.28)#2 | 0.39%(+4.22)#339 |
| 3. | Williams | 4.01% | 0.34%(+3.67)#3 | 0.39%(+3.62)#428 |
| 4. | Metzger | 3.26% | 0.34%(+2.92)#4 | 0.39%(+2.86)#587 |
| 5. | Monument | 3.25% | 0.34%(+2.91)#5 | 0.39%(+2.86)#589 |
| 6. | Seneca | 2.40% | 0.34%(+2.05)#6 | 0.39%(+2.00)#949 |
| 7. | Three Rivers | 2.18% | 0.34%(+1.84)#7 | 0.39%(+1.79)#1,075 |
| 8. | Bunker Hill | 2.00% | 0.34%(+1.66)#8 | 0.39%(+1.61)#1,210 |
| 9. | Maywood Park | 1.92% | 0.34%(+1.58)#9 | 0.39%(+1.53)#1,290 |
| 10. | Cherry Grove | 1.84% | 0.34%(+1.50)#10 | 0.39%(+1.45)#1,375 |
| 11. | Shady Cove | 1.75% | 0.34%(+1.41)#11 | 0.39%(+1.36)#1,461 |
| 12. | Scio | 1.74% | 0.34%(+1.40)#12 | 0.39%(+1.35)#1,470 |
| 13. | Prairie City | 1.39% | 0.34%(+1.05)#13 | 0.39%(+1.00)#1,910 |
| 14. | Chenoweth | 1.28% | 0.34%(+0.941)#14 | 0.39%(+0.890)#2,104 |
| 15. | Philomath | 1.27% | 0.34%(+0.931)#15 | 0.39%(+0.880)#2,119 |
| 16. | Coburg | 1.17% | 0.34%(+0.829)#16 | 0.39%(+0.779)#2,343 |
| 17. | Lincoln City | 1.16% | 0.34%(+0.824)#17 | 0.39%(+0.774)#2,356 |
| 18. | Raleigh Hills | 1.14% | 0.34%(+0.803)#18 | 0.39%(+0.752)#2,403 |
| 19. | Junction City | 1.05% | 0.34%(+0.714)#19 | 0.39%(+0.663)#2,644 |
| 20. | Oak Grove | 1.02% | 0.34%(+0.675)#20 | 0.39%(+0.624)#2,741 |
| 21. | Siletz | 0.97% | 0.34%(+0.630)#21 | 0.39%(+0.579)#2,872 |
| 22. | Grand Ronde | 0.92% | 0.34%(+0.582)#22 | 0.39%(+0.531)#3,016 |
| 23. | Yachats | 0.91% | 0.34%(+0.566)#23 | 0.39%(+0.516)#3,067 |
| 24. | Adair Village | 0.84% | 0.34%(+0.504)#24 | 0.39%(+0.453)#3,268 |
| 25. | Cave Junction | 0.79% | 0.34%(+0.445)#25 | 0.39%(+0.394)#3,506 |
| 26. | Oakland | 0.78% | 0.34%(+0.436)#26 | 0.39%(+0.386)#3,538 |
| 27. | Gladstone | 0.78% | 0.34%(+0.435)#27 | 0.39%(+0.384)#3,544 |
| 28. | Aurora | 0.76% | 0.34%(+0.418)#28 | 0.39%(+0.367)#3,615 |
| 29. | Nehalem | 0.74% | 0.34%(+0.403)#29 | 0.39%(+0.353)#3,663 |
| 30. | Bonanza | 0.73% | 0.34%(+0.394)#30 | 0.39%(+0.343)#3,700 |
| 31. | West Slope | 0.72% | 0.34%(+0.380)#31 | 0.39%(+0.330)#3,763 |
| 32. | Bend | 0.72% | 0.34%(+0.378)#32 | 0.39%(+0.327)#3,772 |
| 33. | West Linn | 0.68% | 0.34%(+0.344)#33 | 0.39%(+0.294)#3,900 |
| 34. | Ashland | 0.68% | 0.34%(+0.337)#34 | 0.39%(+0.287)#3,929 |
| 35. | Columbia City | 0.68% | 0.34%(+0.336)#35 | 0.39%(+0.286)#3,932 |
| 36. | Marlene | 0.66% | 0.34%(+0.322)#36 | 0.39%(+0.271)#4,003 |
| 37. | Dunes City | 0.65% | 0.34%(+0.314)#37 | 0.39%(+0.263)#4,051 |
| 38. | Cedar Mill | 0.65% | 0.34%(+0.312)#38 | 0.39%(+0.262)#4,059 |
| 39. | Damascus | 0.64% | 0.34%(+0.304)#39 | 0.39%(+0.253)#4,104 |
| 40. | Talent | 0.61% | 0.34%(+0.267)#40 | 0.39%(+0.217)#4,280 |
| 41. | Estacada | 0.61% | 0.34%(+0.266)#41 | 0.39%(+0.215)#4,293 |
| 42. | Gold Beach | 0.59% | 0.34%(+0.252)#42 | 0.39%(+0.201)#4,372 |
| 43. | Eagle Crest | 0.59% | 0.34%(+0.245)#43 | 0.39%(+0.195)#4,409 |
| 44. | Silverton | 0.57% | 0.34%(+0.234)#44 | 0.39%(+0.184)#4,469 |
| 45. | Sherwood | 0.56% | 0.34%(+0.222)#45 | 0.39%(+0.171)#4,569 |
| 46. | Wallowa | 0.55% | 0.34%(+0.212)#46 | 0.39%(+0.162)#4,624 |
| 47. | Lake Oswego | 0.54% | 0.34%(+0.201)#47 | 0.39%(+0.150)#4,687 |
| 48. | Hubbard | 0.53% | 0.34%(+0.185)#48 | 0.39%(+0.134)#4,806 |
| 49. | Donald | 0.52% | 0.34%(+0.181)#49 | 0.39%(+0.130)#4,828 |
| 50. | Medford | 0.52% | 0.34%(+0.175)#50 | 0.39%(+0.125)#4,863 |
| 51. | Canyonville | 0.51% | 0.34%(+0.173)#51 | 0.39%(+0.122)#4,882 |
| 52. | West Haven Sylvan | 0.50% | 0.34%(+0.161)#52 | 0.39%(+0.111)#4,957 |
| 53. | Stayton | 0.49% | 0.34%(+0.147)#53 | 0.39%(+0.096)#5,076 |
| 54. | Oregon City | 0.49% | 0.34%(+0.146)#54 | 0.39%(+0.096)#5,082 |
| 55. | Portland | 0.47% | 0.34%(+0.132)#55 | 0.39%(+0.082)#5,192 |
| 56. | Pilot Rock | 0.47% | 0.34%(+0.132)#56 | 0.39%(+0.081)#5,194 |
| 57. | Molalla | 0.46% | 0.34%(+0.123)#57 | 0.39%(+0.072)#5,261 |
| 58. | North Bend | 0.46% | 0.34%(+0.118)#58 | 0.39%(+0.068)#5,286 |
| 59. | Florence | 0.45% | 0.34%(+0.107)#59 | 0.39%(+0.057)#5,384 |
| 60. | Rockcreek | 0.43% | 0.34%(+0.093)#60 | 0.39%(+0.042)#5,499 |
| 61. | Phoenix | 0.43% | 0.34%(+0.093)#61 | 0.39%(+0.042)#5,502 |
| 62. | Eugene | 0.43% | 0.34%(+0.091)#62 | 0.39%(+0.041)#5,513 |
| 63. | Chiloquin | 0.43% | 0.34%(+0.091)#63 | 0.39%(+0.040)#5,521 |
| 64. | Garibaldi | 0.42% | 0.34%(+0.079)#64 | 0.39%(+0.028)#5,618 |
| 65. | Beaverton | 0.42% | 0.34%(+0.076)#65 | 0.39%(+0.025)#5,644 |
| 66. | Culver | 0.41% | 0.34%(+0.074)#66 | 0.39%(+0.023)#5,660 |
| 67. | Roseburg | 0.41% | 0.34%(+0.065)#67 | 0.39%(+0.015)#5,736 |
| 68. | Harbor | 0.40% | 0.34%(+0.059)#68 | 0.39%(+0.009)#5,792 |
| 69. | Gresham | 0.38% | 0.34%(+0.037)#69 | 0.39%(-0.014)#6,008 |
| 70. | Heceta Beach | 0.38% | 0.34%(+0.037)#70 | 0.39%(-0.014)#6,009 |
| 71. | Stanfield | 0.38% | 0.34%(+0.036)#71 | 0.39%(-0.015)#6,020 |
| 72. | Salem | 0.37% | 0.34%(+0.031)#72 | 0.39%(-0.019)#6,045 |
| 73. | Millersburg | 0.37% | 0.34%(+0.031)#73 | 0.39%(-0.020)#6,051 |
| 74. | Rockaway Beach | 0.36% | 0.34%(+0.019)#74 | 0.39%(-0.032)#6,152 |
| 75. | Mcminnville | 0.35% | 0.34%(+0.014)#75 | 0.39%(-0.037)#6,190 |
| 76. | Warrenton | 0.35% | 0.34%(+0.011)#76 | 0.39%(-0.039)#6,220 |
| 77. | Rogue River | 0.35% | 0.34%(+0.010)#77 | 0.39%(-0.040)#6,233 |
| 78. | Bull Mountain | 0.34% | 0.34%(+0.003)#78 | 0.39%(-0.047)#6,298 |
| 79. | Deschutes River Woods | 0.34% | 0.34%(-0.001)#79 | 0.39%(-0.051)#6,341 |
| 80. | Sublimity | 0.34% | 0.34%(-0.001)#80 | 0.39%(-0.051)#6,342 |
| 81. | Garden Home Whitford | 0.32% | 0.34%(-0.016)#81 | 0.39%(-0.066)#6,482 |
| 82. | Lincoln Beach | 0.32% | 0.34%(-0.016)#82 | 0.39%(-0.067)#6,491 |
| 83. | Hillsboro | 0.31% | 0.34%(-0.032)#83 | 0.39%(-0.082)#6,620 |
| 84. | Grants Pass | 0.30% | 0.34%(-0.036)#84 | 0.39%(-0.087)#6,695 |
| 85. | Milwaukie | 0.30% | 0.34%(-0.038)#85 | 0.39%(-0.089)#6,719 |
| 86. | Wilsonville | 0.30% | 0.34%(-0.044)#86 | 0.39%(-0.095)#6,788 |
| 87. | La Pine | 0.28% | 0.34%(-0.058)#87 | 0.39%(-0.109)#6,940 |
| 88. | Juniper Canyon | 0.28% | 0.34%(-0.060)#88 | 0.39%(-0.110)#6,968 |
| 89. | Dallas | 0.27% | 0.34%(-0.069)#89 | 0.39%(-0.119)#7,078 |
| 90. | Hayesville | 0.26% | 0.34%(-0.079)#90 | 0.39%(-0.130)#7,187 |
| 91. | Tigard | 0.26% | 0.34%(-0.079)#91 | 0.39%(-0.130)#7,191 |
| 92. | White City | 0.26% | 0.34%(-0.080)#92 | 0.39%(-0.130)#7,194 |
| 93. | Oatfield | 0.26% | 0.34%(-0.080)#93 | 0.39%(-0.131)#7,199 |
| 94. | Coos Bay | 0.26% | 0.34%(-0.083)#94 | 0.39%(-0.134)#7,229 |
| 95. | Aloha | 0.26% | 0.34%(-0.084)#95 | 0.39%(-0.135)#7,246 |
| 96. | River Road | 0.25% | 0.34%(-0.087)#96 | 0.39%(-0.137)#7,269 |
| 97. | Springfield | 0.25% | 0.34%(-0.088)#97 | 0.39%(-0.138)#7,282 |
| 98. | Keizer | 0.25% | 0.34%(-0.092)#98 | 0.39%(-0.143)#7,335 |
| 99. | Monmouth | 0.24% | 0.34%(-0.096)#99 | 0.39%(-0.147)#7,377 |
| 100. | Gearhart | 0.24% | 0.34%(-0.098)#100 | 0.39%(-0.148)#7,403 |
Common Questions
What are the Top 10 Cities with the Highest Percentage of Hungarian Population in Oregon?
Top 10 Cities with the Highest Percentage of Hungarian Population in Oregon are:
#1
12.87%
#2
4.62%
#3
4.01%
#4
3.26%
#5
3.25%
#6
2.40%
#7
2.18%
#8
2.00%
#9
1.92%
#10
1.75%
What city has the Highest Percentage of Hungarian Population in Oregon?
Government Camp has the Highest Percentage of Hungarian Population in Oregon with 12.87%.
What is the Percentage of Hungarian Population in the State of Oregon?
Percentage of Hungarian Population in Oregon is 0.34%.
What is the Percentage of Hungarian Population in the United States?
Percentage of Hungarian Population in the United States is 0.39%.