Mitchell, OR Map & Demographics
Mitchell Map
Mitchell Overview
$18,295
PER CAPITA INCOME
$42,250
AVG FAMILY INCOME
$41,833
AVG HOUSEHOLD INCOME
65.9%
WAGE / INCOME GAP [ % ]
34.1¢/ $1
WAGE / INCOME GAP [ $ ]
0.40
INEQUALITY / GINI INDEX
202
TOTAL POPULATION
102
MALE POPULATION
100
FEMALE POPULATION
102.00
MALES / 100 FEMALES
98.04
FEMALES / 100 MALES
24.5
MEDIAN AGE
4.3
AVG FAMILY SIZE
3.5
AVG HOUSEHOLD SIZE
82
LABOR FORCE [ PEOPLE ]
59.9%
PERCENT IN LABOR FORCE
12.2%
UNEMPLOYMENT RATE
Mitchell Zip Codes
Mitchell Area Codes
Income in Mitchell
Income Overview in Mitchell
Per Capita Income in Mitchell is $18,295, while median incomes of families and households are $42,250 and $41,833 respectively.
| Characteristic | Number | Measure |
| Per Capita Income | 202 | $18,295 |
| Median Family Income | 39 | $42,250 |
| Mean Family Income | 39 | $72,615 |
| Median Household Income | 58 | $41,833 |
| Mean Household Income | 58 | $58,229 |
| Income Deficit | 39 | $0 |
| Wage / Income Gap (%) | 202 | 65.87% |
| Wage / Income Gap ($) | 202 | 34.13¢ per $1 |
| Gini / Inequality Index | 202 | 0.40 |
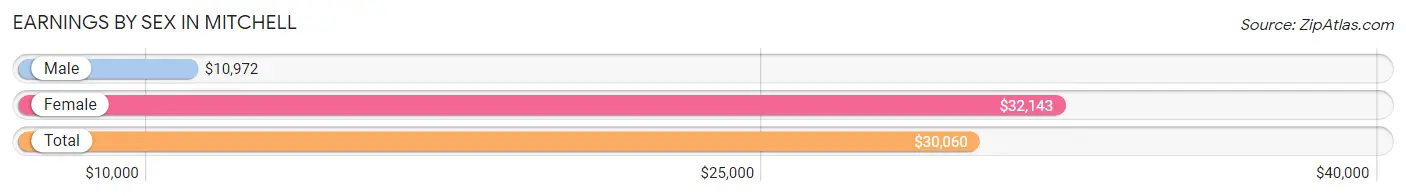
Earnings by Sex in Mitchell
Average Earnings in Mitchell are $30,060, $10,972 for men and $32,143 for women, a difference of 65.9%.
| Sex | Number | Average Earnings |
| Male | 55 (54.5%) | $10,972 |
| Female | 46 (45.5%) | $32,143 |
| Total | 101 (100.0%) | $30,060 |
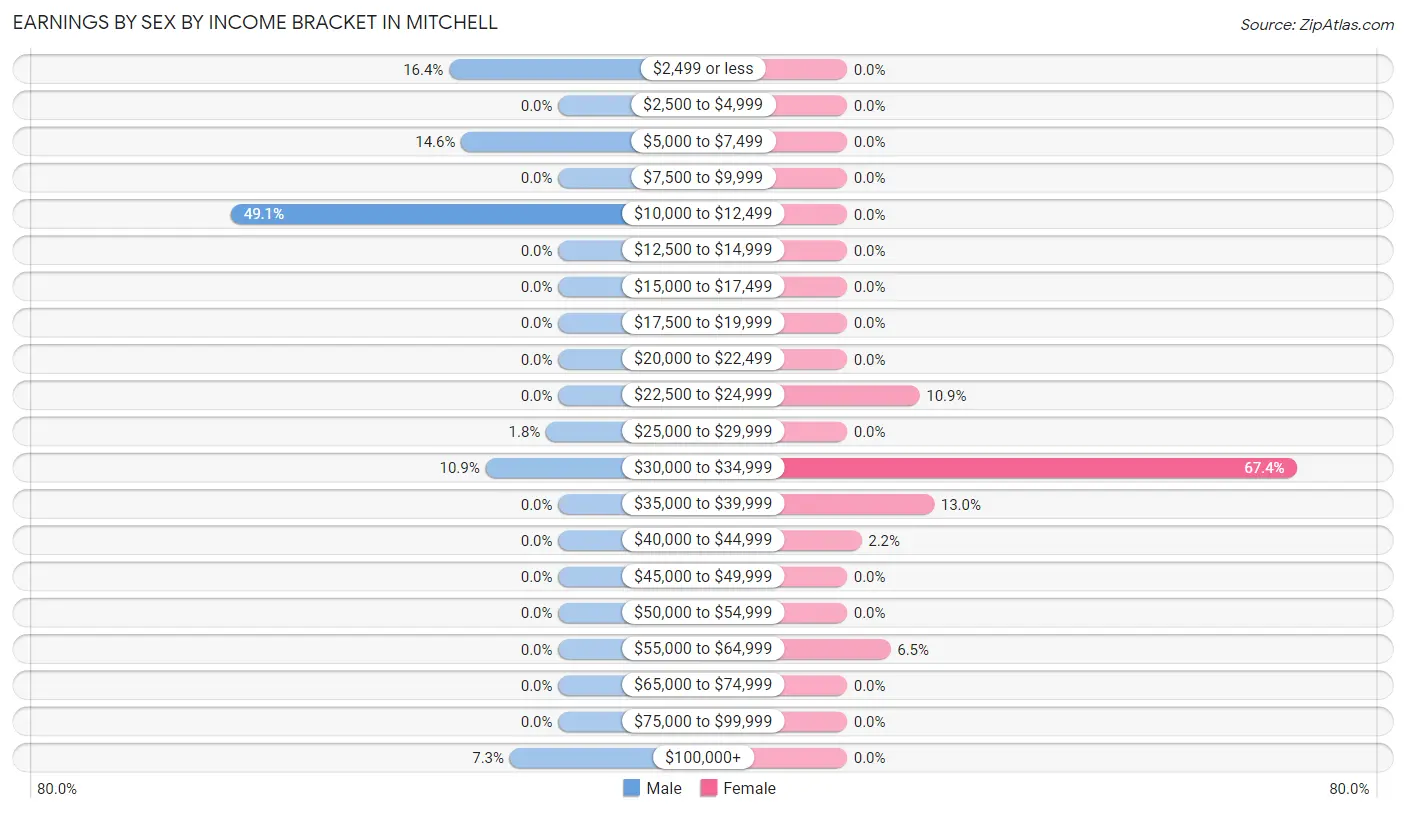
Earnings by Sex by Income Bracket in Mitchell
The most common earnings brackets in Mitchell are $10,000 to $12,499 for men (27 | 49.1%) and $30,000 to $34,999 for women (31 | 67.4%).
| Income | Male | Female |
| $2,499 or less | 9 (16.4%) | 0 (0.0%) |
| $2,500 to $4,999 | 0 (0.0%) | 0 (0.0%) |
| $5,000 to $7,499 | 8 (14.5%) | 0 (0.0%) |
| $7,500 to $9,999 | 0 (0.0%) | 0 (0.0%) |
| $10,000 to $12,499 | 27 (49.1%) | 0 (0.0%) |
| $12,500 to $14,999 | 0 (0.0%) | 0 (0.0%) |
| $15,000 to $17,499 | 0 (0.0%) | 0 (0.0%) |
| $17,500 to $19,999 | 0 (0.0%) | 0 (0.0%) |
| $20,000 to $22,499 | 0 (0.0%) | 0 (0.0%) |
| $22,500 to $24,999 | 0 (0.0%) | 5 (10.9%) |
| $25,000 to $29,999 | 1 (1.8%) | 0 (0.0%) |
| $30,000 to $34,999 | 6 (10.9%) | 31 (67.4%) |
| $35,000 to $39,999 | 0 (0.0%) | 6 (13.0%) |
| $40,000 to $44,999 | 0 (0.0%) | 1 (2.2%) |
| $45,000 to $49,999 | 0 (0.0%) | 0 (0.0%) |
| $50,000 to $54,999 | 0 (0.0%) | 0 (0.0%) |
| $55,000 to $64,999 | 0 (0.0%) | 3 (6.5%) |
| $65,000 to $74,999 | 0 (0.0%) | 0 (0.0%) |
| $75,000 to $99,999 | 0 (0.0%) | 0 (0.0%) |
| $100,000+ | 4 (7.3%) | 0 (0.0%) |
| Total | 55 (100.0%) | 46 (100.0%) |
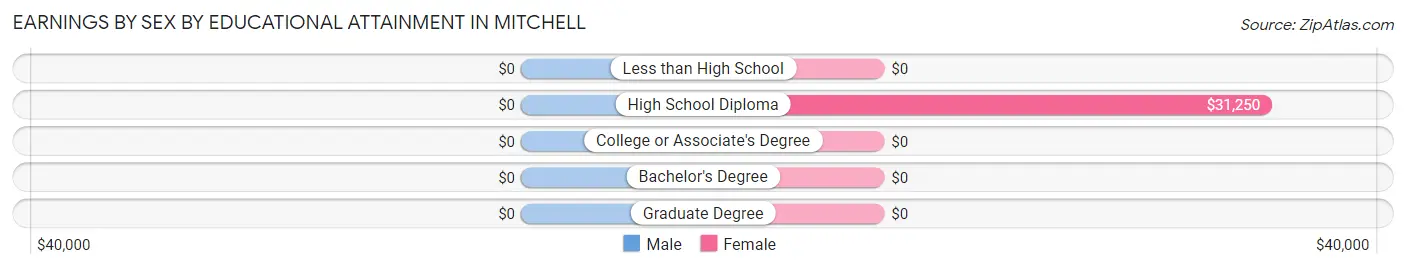
Earnings by Sex by Educational Attainment in Mitchell
| Educational Attainment | Male Income | Female Income |
| Less than High School | - | - |
| High School Diploma | - | - |
| College or Associate's Degree | - | - |
| Bachelor's Degree | - | - |
| Graduate Degree | - | - |
| Total | - | - |
Family Income in Mitchell
Family Income Brackets in Mitchell
According to the Mitchell family income data, there are 22 families falling into the $35,000 to $49,999 income range, which is the most common income bracket and makes up 56.4% of all families.
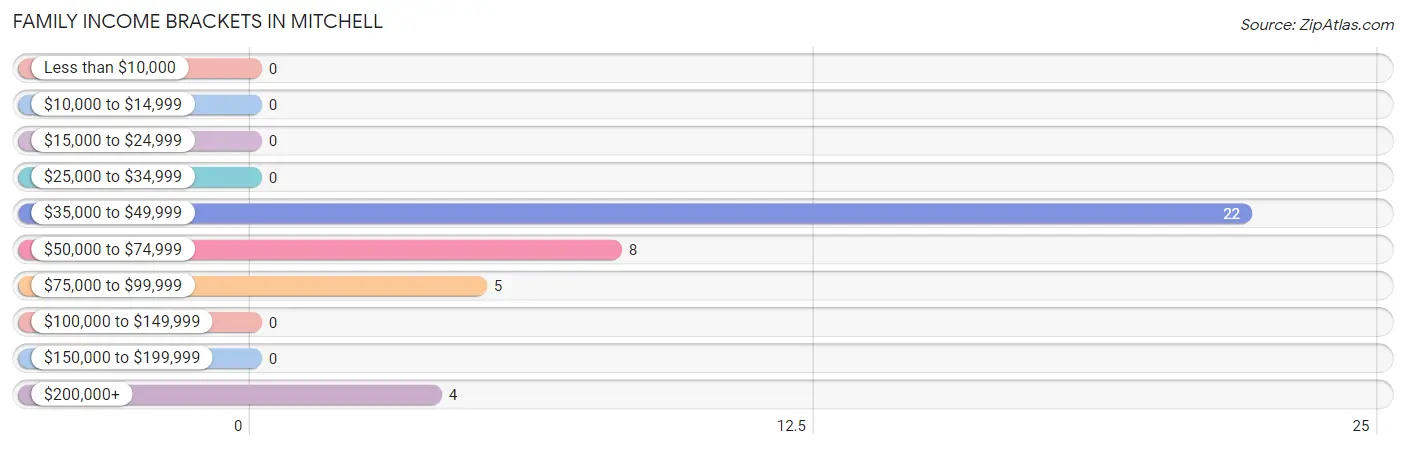
| Income Bracket | # Families | % Families |
| Less than $10,000 | 0 | 0.0% |
| $10,000 to $14,999 | 0 | 0.0% |
| $15,000 to $24,999 | 0 | 0.0% |
| $25,000 to $34,999 | 0 | 0.0% |
| $35,000 to $49,999 | 22 | 56.4% |
| $50,000 to $74,999 | 8 | 20.5% |
| $75,000 to $99,999 | 5 | 12.8% |
| $100,000 to $149,999 | 0 | 0.0% |
| $150,000 to $199,999 | 0 | 0.0% |
| $200,000+ | 4 | 10.3% |
Family Income by Famaliy Size in Mitchell
5-person families (17 | 43.6%) account for the highest median family income in Mitchell with $41,042 per family, while 5-person families (17 | 43.6%) have the highest median income of $8,208 per family member.
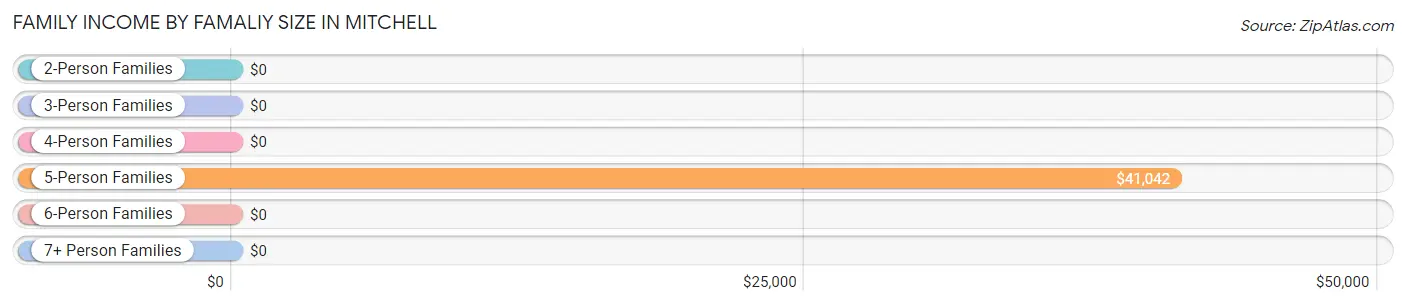
| Income Bracket | # Families | Median Income |
| 2-Person Families | 8 (20.5%) | $0 |
| 3-Person Families | 9 (23.1%) | $0 |
| 4-Person Families | 5 (12.8%) | $0 |
| 5-Person Families | 17 (43.6%) | $41,042 |
| 6-Person Families | 0 (0.0%) | $0 |
| 7+ Person Families | 0 (0.0%) | $0 |
| Total | 39 (100.0%) | $42,250 |
Family Income by Number of Earners in Mitchell
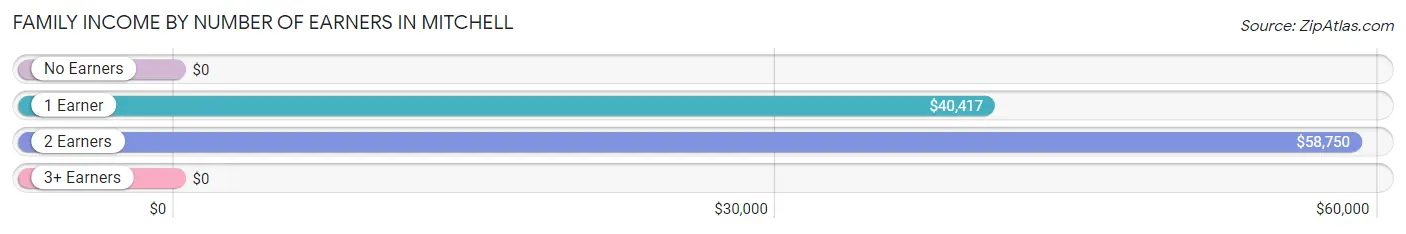
| Number of Earners | # Families | Median Income |
| No Earners | 0 (0.0%) | $0 |
| 1 Earner | 14 (35.9%) | $40,417 |
| 2 Earners | 20 (51.3%) | $58,750 |
| 3+ Earners | 5 (12.8%) | $0 |
| Total | 39 (100.0%) | $42,250 |
Household Income in Mitchell
Household Income Brackets in Mitchell
With 16 households falling in the category, the $35,000 to $49,999 income range is the most frequent in Mitchell, accounting for 27.6% of all households.
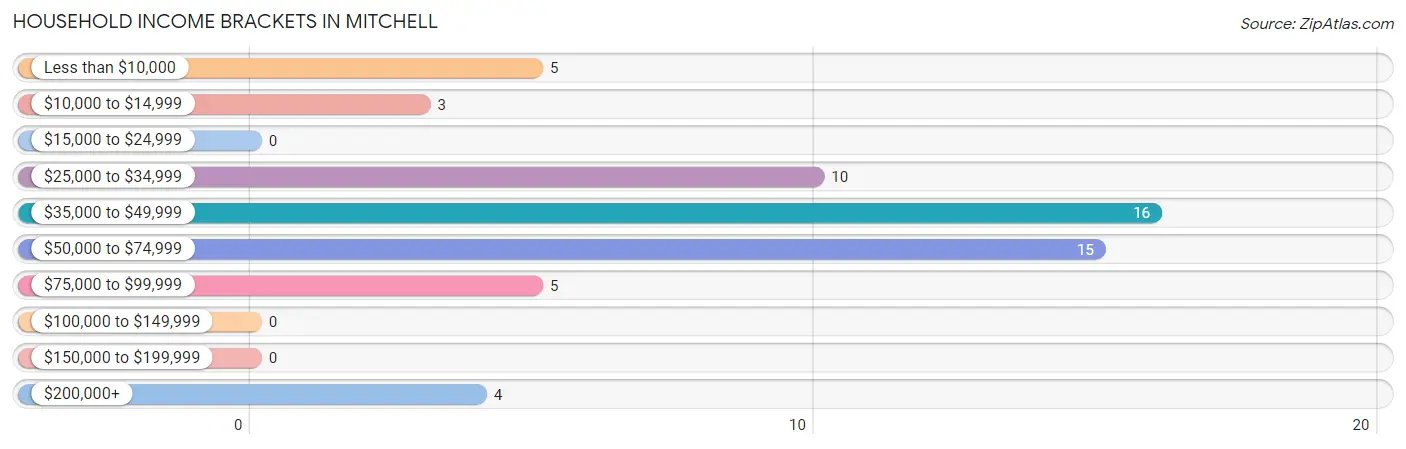
| Income Bracket | # Households | % Households |
| Less than $10,000 | 5 | 8.6% |
| $10,000 to $14,999 | 3 | 5.2% |
| $15,000 to $24,999 | 0 | 0.0% |
| $25,000 to $34,999 | 10 | 17.2% |
| $35,000 to $49,999 | 16 | 27.6% |
| $50,000 to $74,999 | 15 | 25.9% |
| $75,000 to $99,999 | 5 | 8.6% |
| $100,000 to $149,999 | 0 | 0.0% |
| $150,000 to $199,999 | 0 | 0.0% |
| $200,000+ | 4 | 6.9% |
Household Income by Householder Age in Mitchell
The median household income in Mitchell is $41,833, with the highest median household income of $51,042 found in the 25 to 44 years age bracket for the primary householder. A total of 17 households (29.3%) fall into this category.
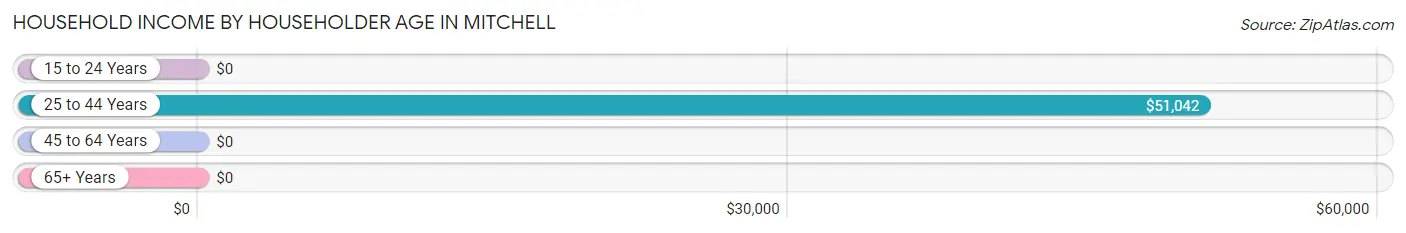
| Income Bracket | # Households | Median Income |
| 15 to 24 Years | 0 (0.0%) | $0 |
| 25 to 44 Years | 17 (29.3%) | $51,042 |
| 45 to 64 Years | 27 (46.6%) | $0 |
| 65+ Years | 14 (24.1%) | $0 |
| Total | 58 (100.0%) | $41,833 |
Poverty in Mitchell
Income Below Poverty by Sex and Age in Mitchell
With 13.7% poverty level for males and 8.0% for females among the residents of Mitchell, 55 to 64 year old males and 65 to 74 year old females are the most vulnerable to poverty, with 10 males (47.6%) and 8 females (100.0%) in their respective age groups living below the poverty level.
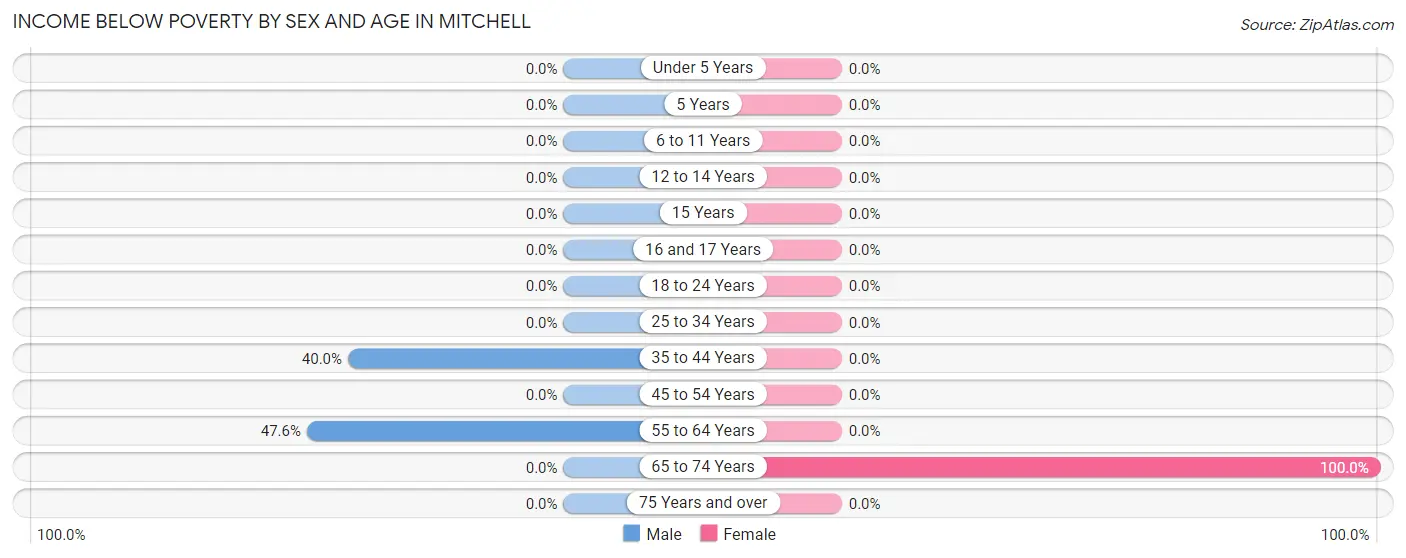
| Age Bracket | Male | Female |
| Under 5 Years | 0 (0.0%) | 0 (0.0%) |
| 5 Years | 0 (0.0%) | 0 (0.0%) |
| 6 to 11 Years | 0 (0.0%) | 0 (0.0%) |
| 12 to 14 Years | 0 (0.0%) | 0 (0.0%) |
| 15 Years | 0 (0.0%) | 0 (0.0%) |
| 16 and 17 Years | 0 (0.0%) | 0 (0.0%) |
| 18 to 24 Years | 0 (0.0%) | 0 (0.0%) |
| 25 to 34 Years | 0 (0.0%) | 0 (0.0%) |
| 35 to 44 Years | 4 (40.0%) | 0 (0.0%) |
| 45 to 54 Years | 0 (0.0%) | 0 (0.0%) |
| 55 to 64 Years | 10 (47.6%) | 0 (0.0%) |
| 65 to 74 Years | 0 (0.0%) | 8 (100.0%) |
| 75 Years and over | 0 (0.0%) | 0 (0.0%) |
| Total | 14 (13.7%) | 8 (8.0%) |
Income Above Poverty by Sex and Age in Mitchell
According to the poverty statistics in Mitchell, males aged under 5 years and females aged under 5 years are the age groups that are most secure financially, with 100.0% of males and 100.0% of females in these age groups living above the poverty line.
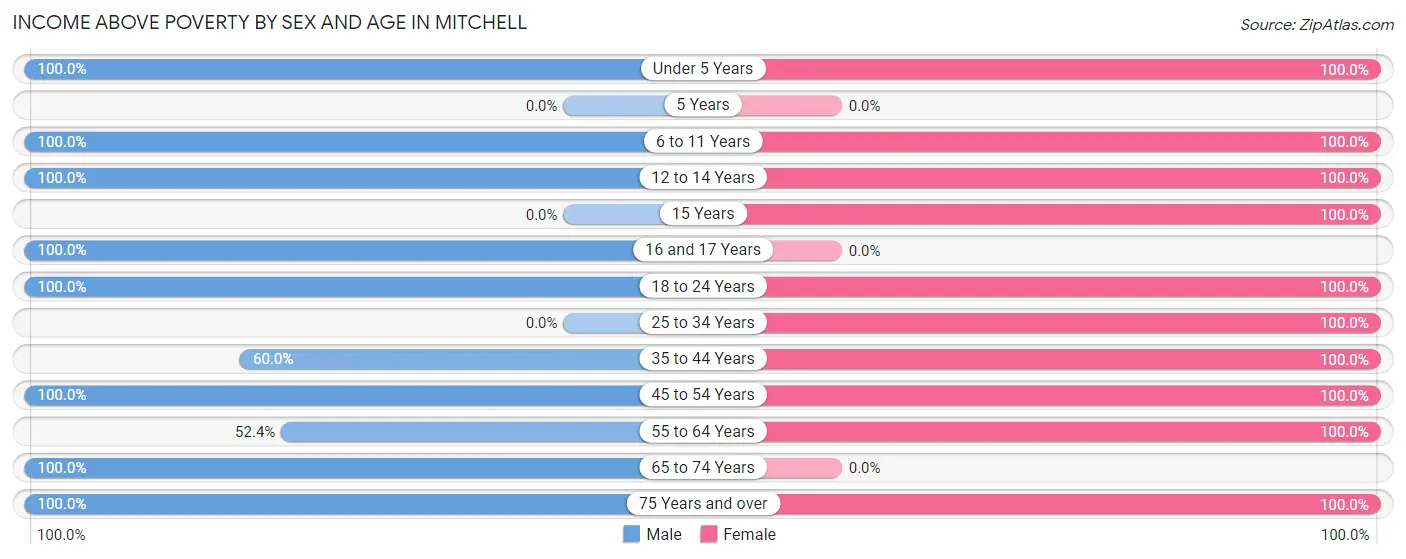
| Age Bracket | Male | Female |
| Under 5 Years | 25 (100.0%) | 14 (100.0%) |
| 5 Years | 0 (0.0%) | 0 (0.0%) |
| 6 to 11 Years | 6 (100.0%) | 5 (100.0%) |
| 12 to 14 Years | 4 (100.0%) | 7 (100.0%) |
| 15 Years | 0 (0.0%) | 4 (100.0%) |
| 16 and 17 Years | 5 (100.0%) | 0 (0.0%) |
| 18 to 24 Years | 19 (100.0%) | 12 (100.0%) |
| 25 to 34 Years | 0 (0.0%) | 11 (100.0%) |
| 35 to 44 Years | 6 (60.0%) | 9 (100.0%) |
| 45 to 54 Years | 6 (100.0%) | 11 (100.0%) |
| 55 to 64 Years | 11 (52.4%) | 17 (100.0%) |
| 65 to 74 Years | 1 (100.0%) | 0 (0.0%) |
| 75 Years and over | 5 (100.0%) | 2 (100.0%) |
| Total | 88 (86.3%) | 92 (92.0%) |
Income Below Poverty Among Married-Couple Families in Mitchell
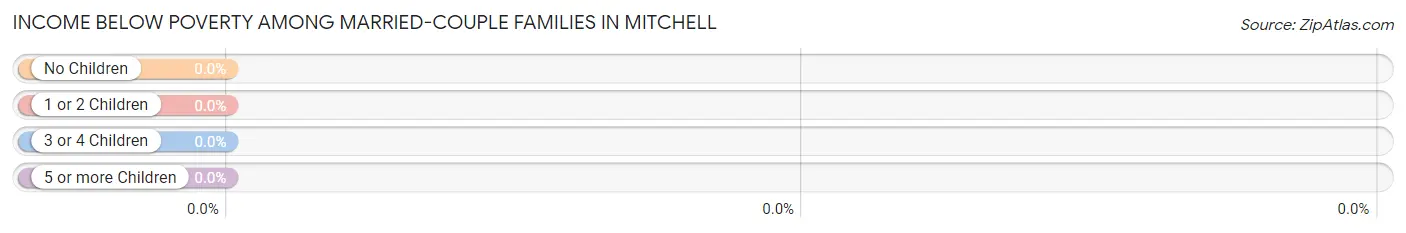
| Children | Above Poverty | Below Poverty |
| No Children | 11 (100.0%) | 0 (0.0%) |
| 1 or 2 Children | 9 (100.0%) | 0 (0.0%) |
| 3 or 4 Children | 6 (100.0%) | 0 (0.0%) |
| 5 or more Children | 0 (0.0%) | 0 (0.0%) |
| Total | 26 (100.0%) | 0 (0.0%) |
Income Below Poverty Among Single-Parent Households in Mitchell
| Children | Single Father | Single Mother |
| No Children | 0 (0.0%) | 0 (0.0%) |
| 1 or 2 Children | 0 (0.0%) | 0 (0.0%) |
| 3 or 4 Children | 0 (0.0%) | 0 (0.0%) |
| 5 or more Children | 0 (0.0%) | 0 (0.0%) |
| Total | 0 (0.0%) | 0 (0.0%) |
Income Below Poverty Among Married-Couple vs Single-Parent Households in Mitchell
| Children | Married-Couple Families | Single-Parent Households |
| No Children | 0 (0.0%) | 0 (0.0%) |
| 1 or 2 Children | 0 (0.0%) | 0 (0.0%) |
| 3 or 4 Children | 0 (0.0%) | 0 (0.0%) |
| 5 or more Children | 0 (0.0%) | 0 (0.0%) |
| Total | 0 (0.0%) | 0 (0.0%) |
Race in Mitchell
The most populous races in Mitchell are White / Caucasian (166 | 82.2%), Hispanic or Latino (32 | 15.8%), and Some other Race (32 | 15.8%).
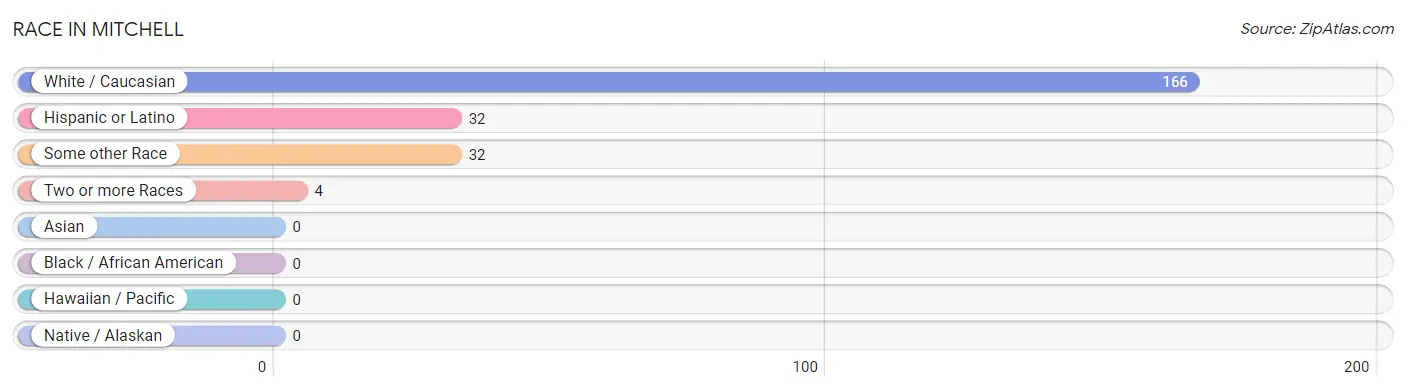
| Race | # Population | % Population |
| Asian | 0 | 0.0% |
| Black / African American | 0 | 0.0% |
| Hawaiian / Pacific | 0 | 0.0% |
| Hispanic or Latino | 32 | 15.8% |
| Native / Alaskan | 0 | 0.0% |
| White / Caucasian | 166 | 82.2% |
| Two or more Races | 4 | 2.0% |
| Some other Race | 32 | 15.8% |
| Total | 202 | 100.0% |
Ancestry in Mitchell
The most populous ancestries reported in Mitchell are English (49 | 24.3%), Irish (39 | 19.3%), Pennsylvania German (38 | 18.8%), American (33 | 16.3%), and Mexican (32 | 15.8%), together accounting for 94.6% of all Mitchell residents.
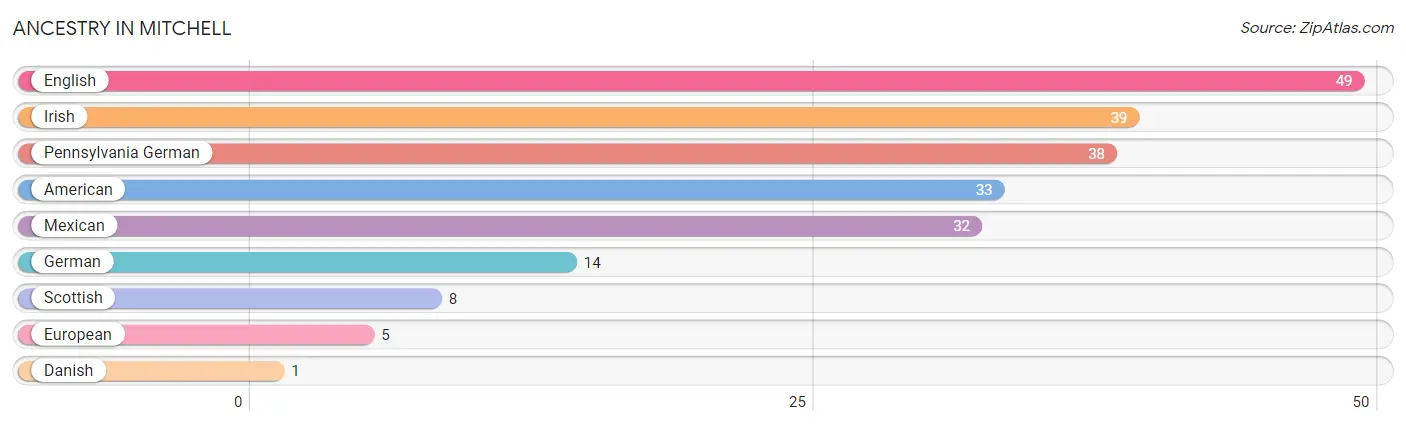
| Ancestry | # Population | % Population |
| American | 33 | 16.3% |
| Danish | 1 | 0.5% |
| English | 49 | 24.3% |
| European | 5 | 2.5% |
| German | 14 | 6.9% |
| Irish | 39 | 19.3% |
| Mexican | 32 | 15.8% |
| Pennsylvania German | 38 | 18.8% |
| Scottish | 8 | 4.0% | View All 9 Rows |
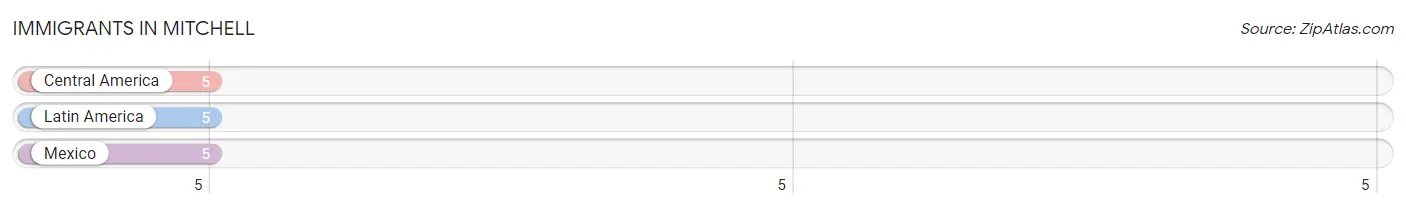
Immigrants in Mitchell
The most numerous immigrant groups reported in Mitchell came from Central America (5 | 2.5%), Latin America (5 | 2.5%), and Mexico (5 | 2.5%), together accounting for 7.4% of all Mitchell residents.
| Immigration Origin | # Population | % Population |
| Central America | 5 | 2.5% |
| Latin America | 5 | 2.5% |
| Mexico | 5 | 2.5% | View All 3 Rows |
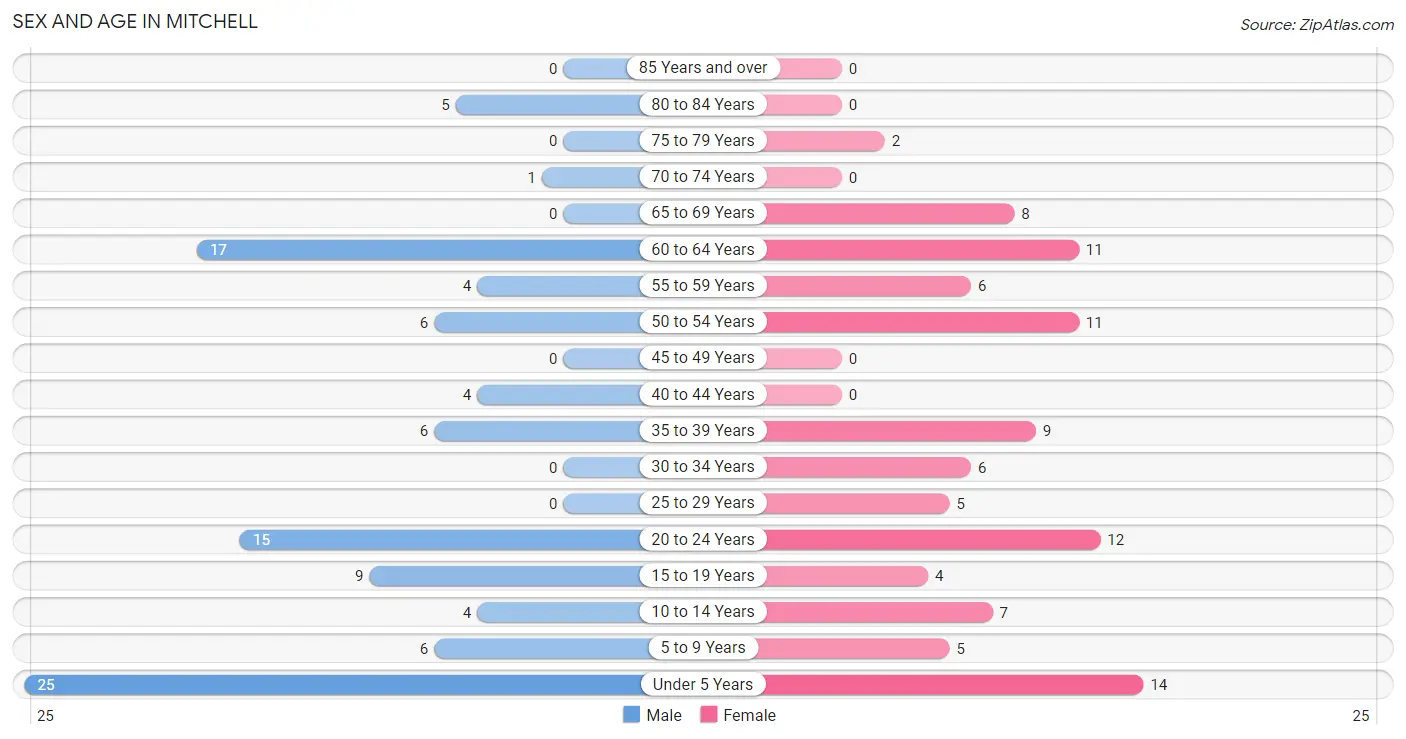
Sex and Age in Mitchell
Sex and Age in Mitchell
The most populous age groups in Mitchell are Under 5 Years (25 | 24.5%) for men and Under 5 Years (14 | 14.0%) for women.
| Age Bracket | Male | Female |
| Under 5 Years | 25 (24.5%) | 14 (14.0%) |
| 5 to 9 Years | 6 (5.9%) | 5 (5.0%) |
| 10 to 14 Years | 4 (3.9%) | 7 (7.0%) |
| 15 to 19 Years | 9 (8.8%) | 4 (4.0%) |
| 20 to 24 Years | 15 (14.7%) | 12 (12.0%) |
| 25 to 29 Years | 0 (0.0%) | 5 (5.0%) |
| 30 to 34 Years | 0 (0.0%) | 6 (6.0%) |
| 35 to 39 Years | 6 (5.9%) | 9 (9.0%) |
| 40 to 44 Years | 4 (3.9%) | 0 (0.0%) |
| 45 to 49 Years | 0 (0.0%) | 0 (0.0%) |
| 50 to 54 Years | 6 (5.9%) | 11 (11.0%) |
| 55 to 59 Years | 4 (3.9%) | 6 (6.0%) |
| 60 to 64 Years | 17 (16.7%) | 11 (11.0%) |
| 65 to 69 Years | 0 (0.0%) | 8 (8.0%) |
| 70 to 74 Years | 1 (1.0%) | 0 (0.0%) |
| 75 to 79 Years | 0 (0.0%) | 2 (2.0%) |
| 80 to 84 Years | 5 (4.9%) | 0 (0.0%) |
| 85 Years and over | 0 (0.0%) | 0 (0.0%) |
| Total | 102 (100.0%) | 100 (100.0%) |
Families and Households in Mitchell
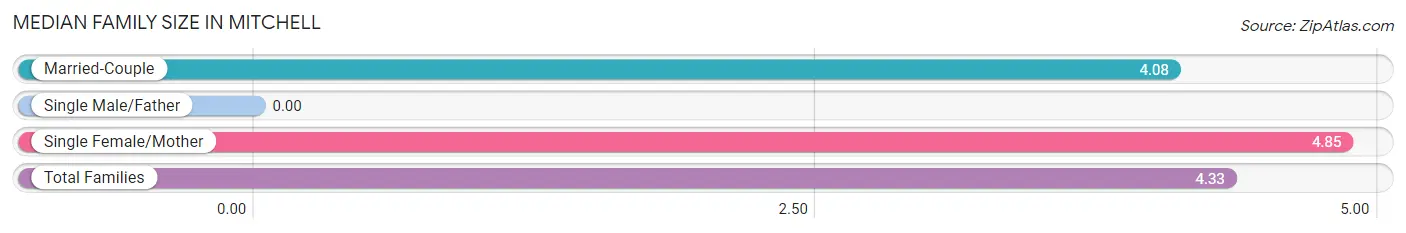
Median Family Size in Mitchell
| Family Type | # Families | Family Size |
| Married-Couple | 26 (66.7%) | 4.08 |
| Single Male/Father | 0 (0.0%) | - |
| Single Female/Mother | 13 (33.3%) | 4.85 |
| Total Families | 39 (100.0%) | 4.33 |
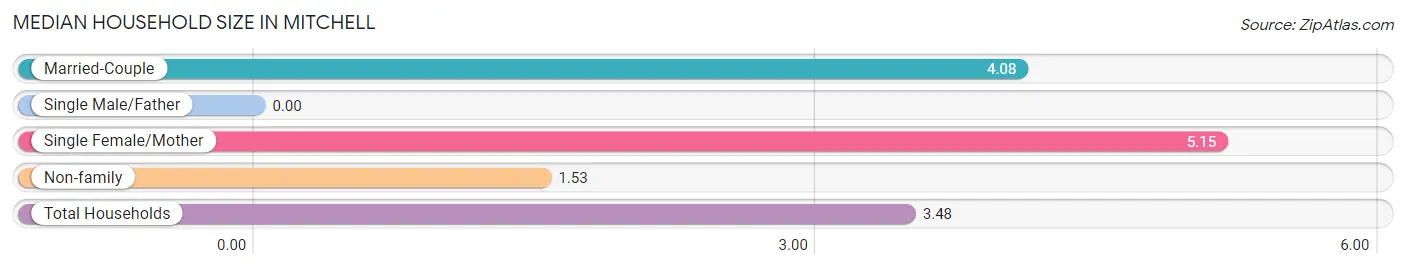
Median Household Size in Mitchell
| Household Type | # Households | Household Size |
| Married-Couple | 26 (44.8%) | 4.08 |
| Single Male/Father | 0 (0.0%) | - |
| Single Female/Mother | 13 (22.4%) | 5.15 |
| Non-family | 19 (32.8%) | 1.53 |
| Total Households | 58 (100.0%) | 3.48 |
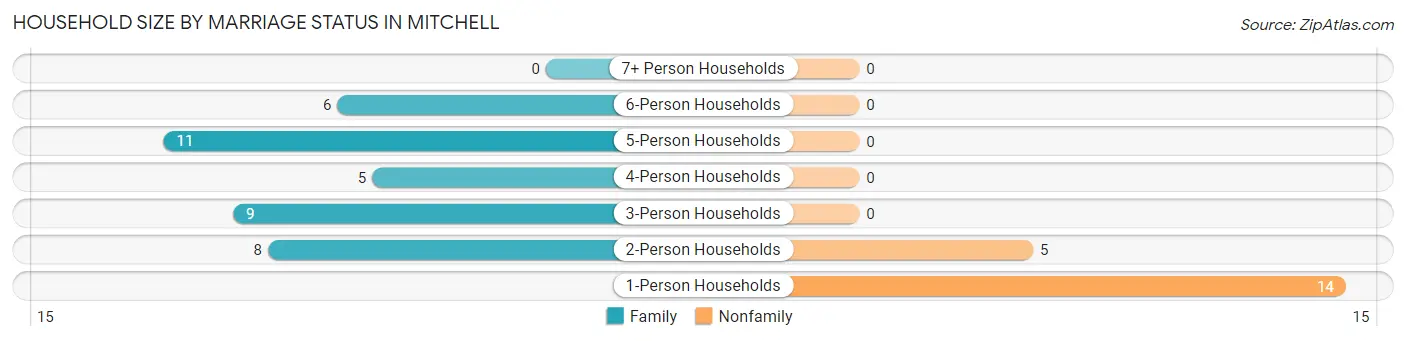
Household Size by Marriage Status in Mitchell
Out of a total of 58 households in Mitchell, 39 (67.2%) are family households, while 19 (32.8%) are nonfamily households. The most numerous type of family households are 5-person households, comprising 11, and the most common type of nonfamily households are 1-person households, comprising 14.
| Household Size | Family Households | Nonfamily Households |
| 1-Person Households | - | 14 (24.1%) |
| 2-Person Households | 8 (13.8%) | 5 (8.6%) |
| 3-Person Households | 9 (15.5%) | 0 (0.0%) |
| 4-Person Households | 5 (8.6%) | 0 (0.0%) |
| 5-Person Households | 11 (19.0%) | 0 (0.0%) |
| 6-Person Households | 6 (10.3%) | 0 (0.0%) |
| 7+ Person Households | 0 (0.0%) | 0 (0.0%) |
| Total | 39 (67.2%) | 19 (32.8%) |
Female Fertility in Mitchell
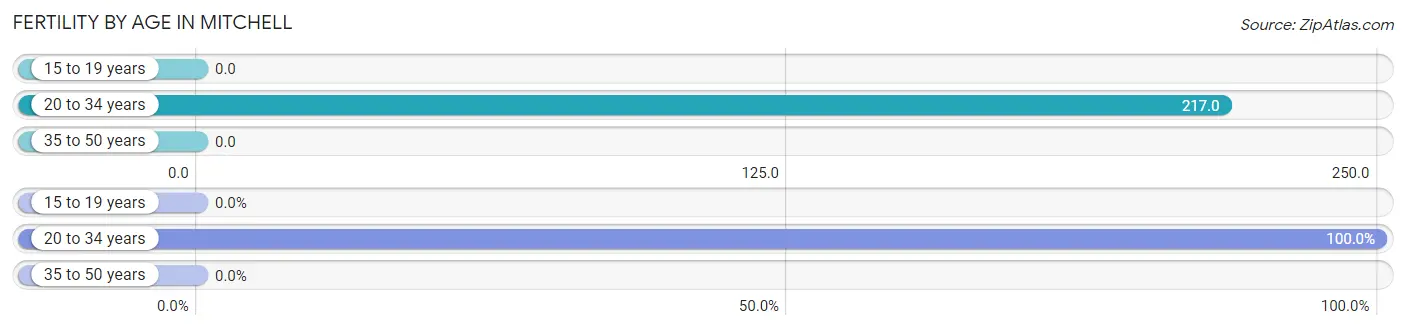
Fertility by Age in Mitchell
Average fertility rate in Mitchell is 139.0 births per 1,000 women. Women in the age bracket of 20 to 34 years have the highest fertility rate with 217.0 births per 1,000 women. Women in the age bracket of 20 to 34 years acount for 100.0% of all women with births.
| Age Bracket | Women with Births | Births / 1,000 Women |
| 15 to 19 years | 0 (0.0%) | 0.0 |
| 20 to 34 years | 5 (100.0%) | 217.0 |
| 35 to 50 years | 0 (0.0%) | 0.0 |
| Total | 5 (100.0%) | 139.0 |
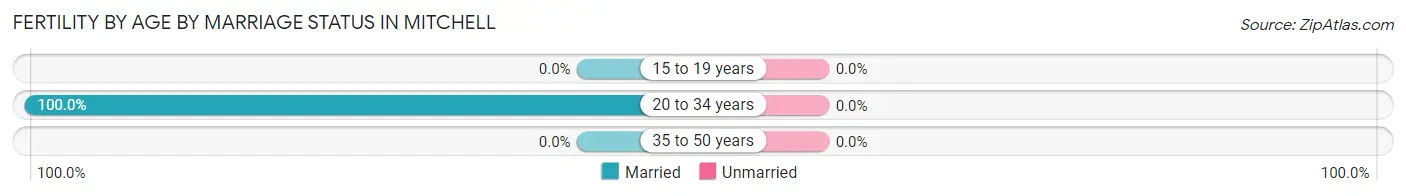
Fertility by Age by Marriage Status in Mitchell
| Age Bracket | Married | Unmarried |
| 15 to 19 years | 0 (0.0%) | 0 (0.0%) |
| 20 to 34 years | 5 (100.0%) | 0 (0.0%) |
| 35 to 50 years | 0 (0.0%) | 0 (0.0%) |
| Total | 5 (100.0%) | 0 (0.0%) |
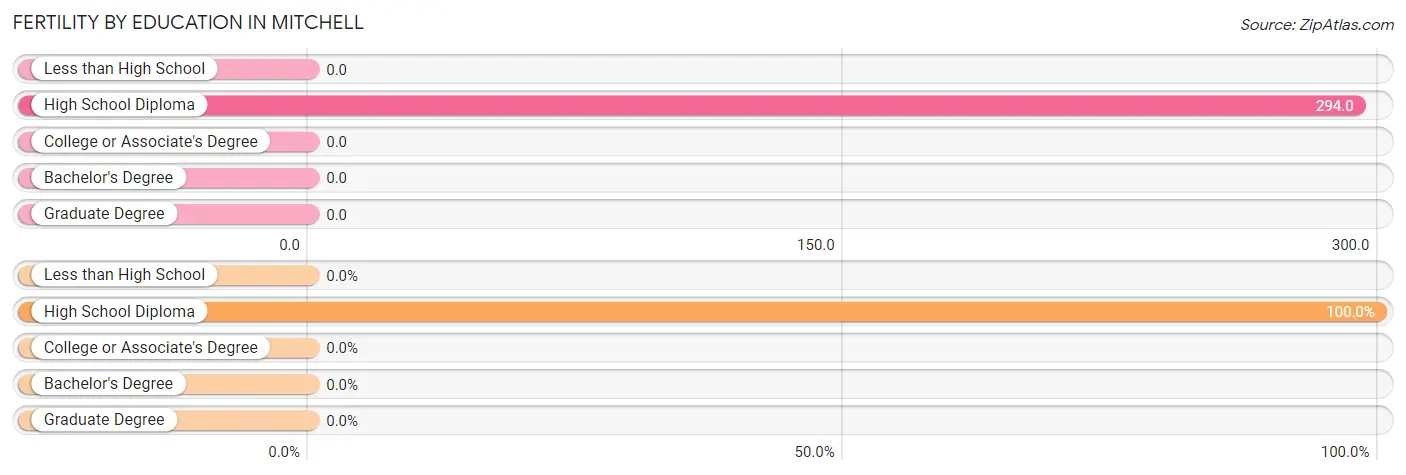
Fertility by Education in Mitchell
| Educational Attainment | Women with Births | Births / 1,000 Women |
| Less than High School | 0 (0.0%) | 0.0 |
| High School Diploma | 5 (100.0%) | 294.0 |
| College or Associate's Degree | 0 (0.0%) | 0.0 |
| Bachelor's Degree | 0 (0.0%) | 0.0 |
| Graduate Degree | 0 (0.0%) | 0.0 |
| Total | 5 (100.0%) | 139.0 |
Fertility by Education by Marriage Status in Mitchell
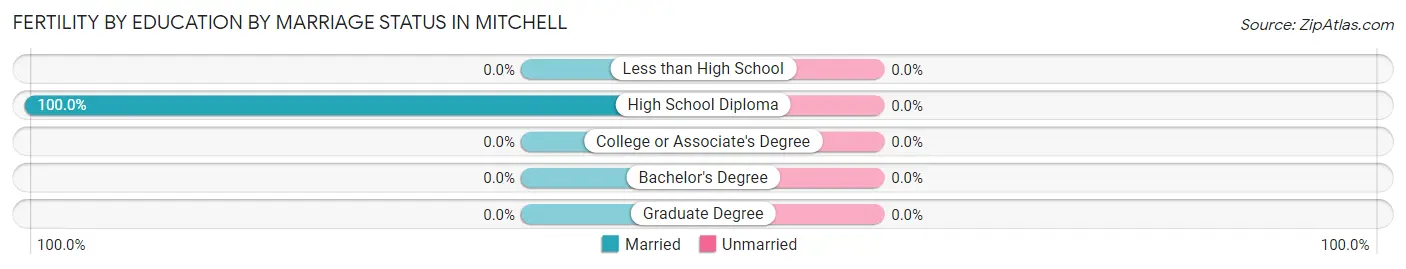
| Educational Attainment | Married | Unmarried |
| Less than High School | 0 (0.0%) | 0 (0.0%) |
| High School Diploma | 5 (100.0%) | 0 (0.0%) |
| College or Associate's Degree | 0 (0.0%) | 0 (0.0%) |
| Bachelor's Degree | 0 (0.0%) | 0 (0.0%) |
| Graduate Degree | 0 (0.0%) | 0 (0.0%) |
| Total | 5 (100.0%) | 0 (0.0%) |
Employment Characteristics in Mitchell
Employment by Class of Employer in Mitchell
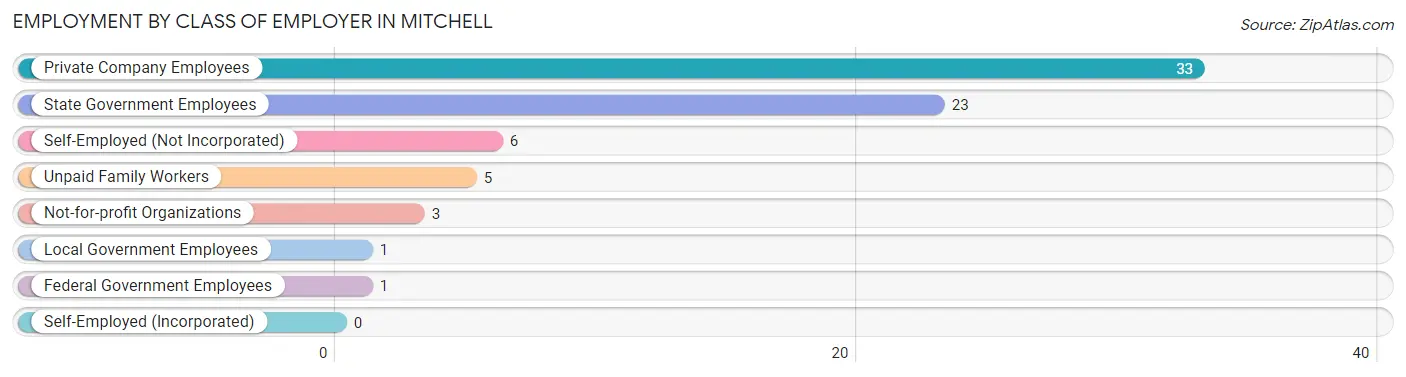
Among the 72 employed individuals in Mitchell, private company employees (33 | 45.8%), state government employees (23 | 31.9%), and self-employed (not incorporated) (6 | 8.3%) make up the most common classes of employment.
| Employer Class | # Employees | % Employees |
| Private Company Employees | 33 | 45.8% |
| Self-Employed (Incorporated) | 0 | 0.0% |
| Self-Employed (Not Incorporated) | 6 | 8.3% |
| Not-for-profit Organizations | 3 | 4.2% |
| Local Government Employees | 1 | 1.4% |
| State Government Employees | 23 | 31.9% |
| Federal Government Employees | 1 | 1.4% |
| Unpaid Family Workers | 5 | 6.9% |
| Total | 72 | 100.0% |
Employment Status by Age in Mitchell
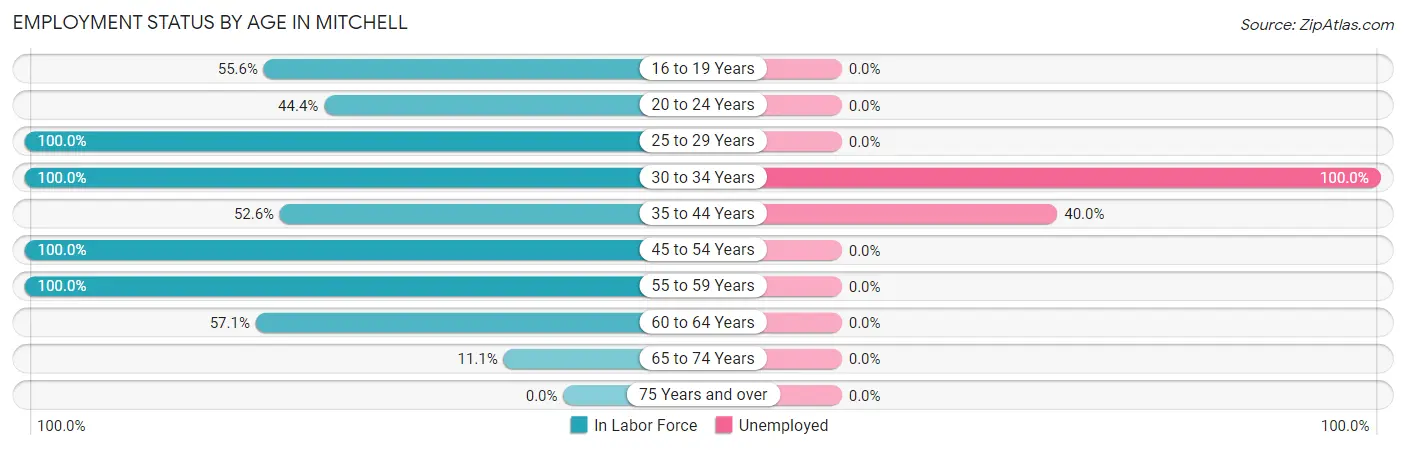
According to the labor force statistics for Mitchell, out of the total population over 16 years of age (137), 59.9% or 82 individuals are in the labor force, with 12.2% or 10 of them unemployed. The age group with the highest labor force participation rate is 25 to 29 years, with 100.0% or 5 individuals in the labor force. Within the labor force, the 30 to 34 years age range has the highest percentage of unemployed individuals, with 100.0% or 6 of them being unemployed.
| Age Bracket | In Labor Force | Unemployed |
| 16 to 19 Years | 5 (55.6%) | 0 (0.0%) |
| 20 to 24 Years | 12 (44.4%) | 0 (0.0%) |
| 25 to 29 Years | 5 (100.0%) | 0 (0.0%) |
| 30 to 34 Years | 6 (100.0%) | 6 (100.0%) |
| 35 to 44 Years | 10 (52.6%) | 4 (40.0%) |
| 45 to 54 Years | 17 (100.0%) | 0 (0.0%) |
| 55 to 59 Years | 10 (100.0%) | 0 (0.0%) |
| 60 to 64 Years | 16 (57.1%) | 0 (0.0%) |
| 65 to 74 Years | 1 (11.1%) | 0 (0.0%) |
| 75 Years and over | 0 (0.0%) | 0 (0.0%) |
| Total | 82 (59.9%) | 10 (12.2%) |
Employment Status by Educational Attainment in Mitchell
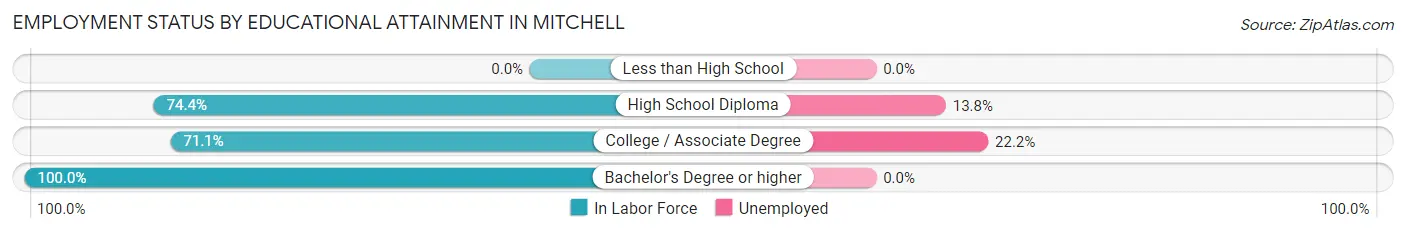
According to labor force statistics for Mitchell, 75.3% of individuals (64) out of the total population between 25 and 64 years of age (85) are in the labor force, with 15.6% or 10 of them being unemployed. The group with the highest labor force participation rate are those with the educational attainment of bachelor's degree or higher, with 100.0% or 8 individuals in the labor force. Within the labor force, individuals with college / associate degree education have the highest percentage of unemployment, with 22.2% or 6 of them being unemployed.
| Educational Attainment | In Labor Force | Unemployed |
| Less than High School | 0 (0.0%) | 0 (0.0%) |
| High School Diploma | 29 (74.4%) | 5 (13.8%) |
| College / Associate Degree | 27 (71.1%) | 8 (22.2%) |
| Bachelor's Degree or higher | 8 (100.0%) | 0 (0.0%) |
| Total | 64 (75.3%) | 13 (15.6%) |
Employment Occupations by Sex in Mitchell
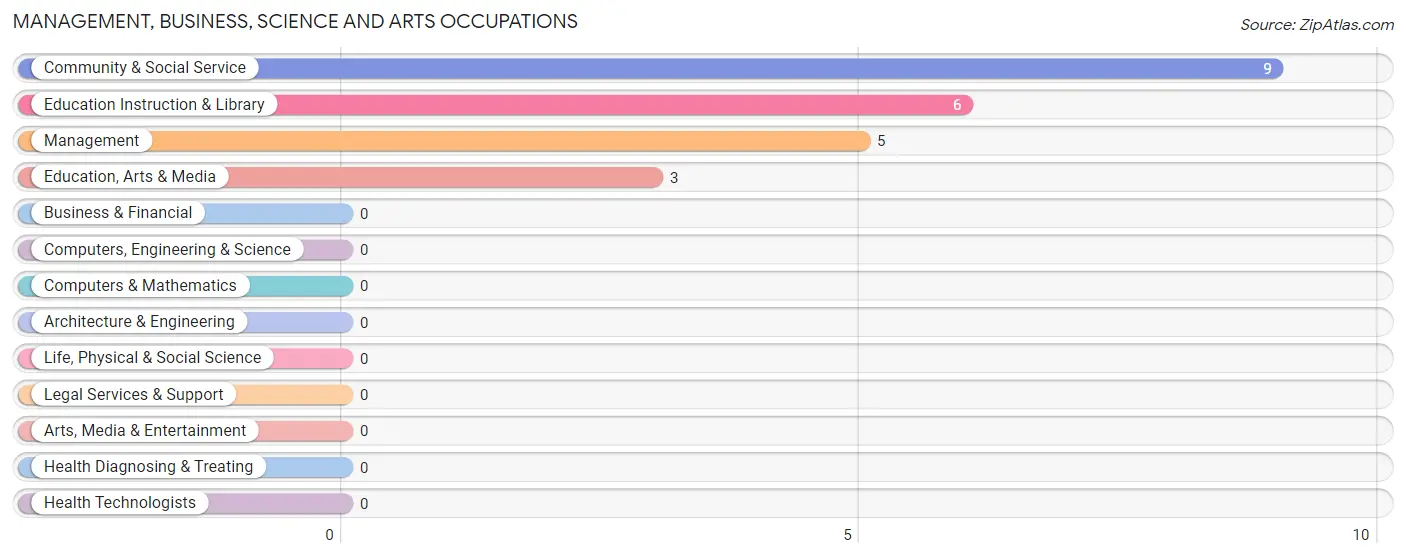
Management, Business, Science and Arts Occupations
The most common Management, Business, Science and Arts occupations in Mitchell are Community & Social Service (9 | 12.5%), Education Instruction & Library (6 | 8.3%), Management (5 | 6.9%), and Education, Arts & Media (3 | 4.2%).
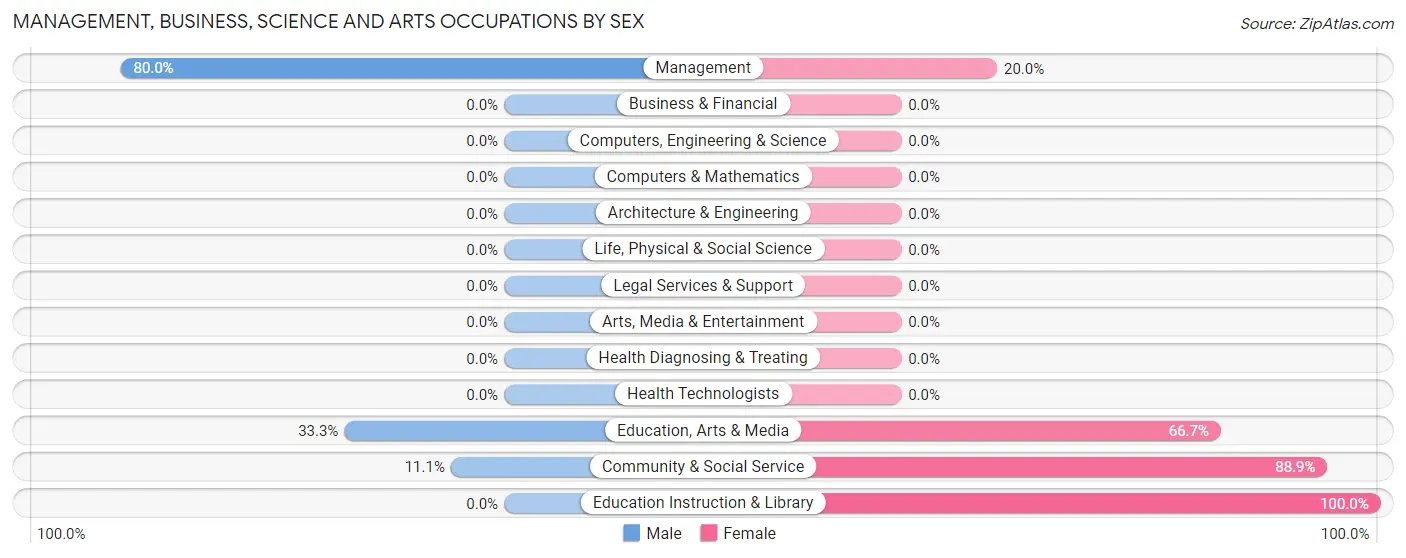
Management, Business, Science and Arts Occupations by Sex
Within the Management, Business, Science and Arts occupations in Mitchell, the most male-oriented occupations are Management (80.0%), Education, Arts & Media (33.3%), and Community & Social Service (11.1%), while the most female-oriented occupations are Education Instruction & Library (100.0%), Community & Social Service (88.9%), and Education, Arts & Media (66.7%).
| Occupation | Male | Female |
| Management | 4 (80.0%) | 1 (20.0%) |
| Business & Financial | 0 (0.0%) | 0 (0.0%) |
| Computers, Engineering & Science | 0 (0.0%) | 0 (0.0%) |
| Computers & Mathematics | 0 (0.0%) | 0 (0.0%) |
| Architecture & Engineering | 0 (0.0%) | 0 (0.0%) |
| Life, Physical & Social Science | 0 (0.0%) | 0 (0.0%) |
| Community & Social Service | 1 (11.1%) | 8 (88.9%) |
| Education, Arts & Media | 1 (33.3%) | 2 (66.7%) |
| Legal Services & Support | 0 (0.0%) | 0 (0.0%) |
| Education Instruction & Library | 0 (0.0%) | 6 (100.0%) |
| Arts, Media & Entertainment | 0 (0.0%) | 0 (0.0%) |
| Health Diagnosing & Treating | 0 (0.0%) | 0 (0.0%) |
| Health Technologists | 0 (0.0%) | 0 (0.0%) |
| Total (Category) | 5 (35.7%) | 9 (64.3%) |
| Total (Overall) | 32 (44.4%) | 40 (55.6%) |
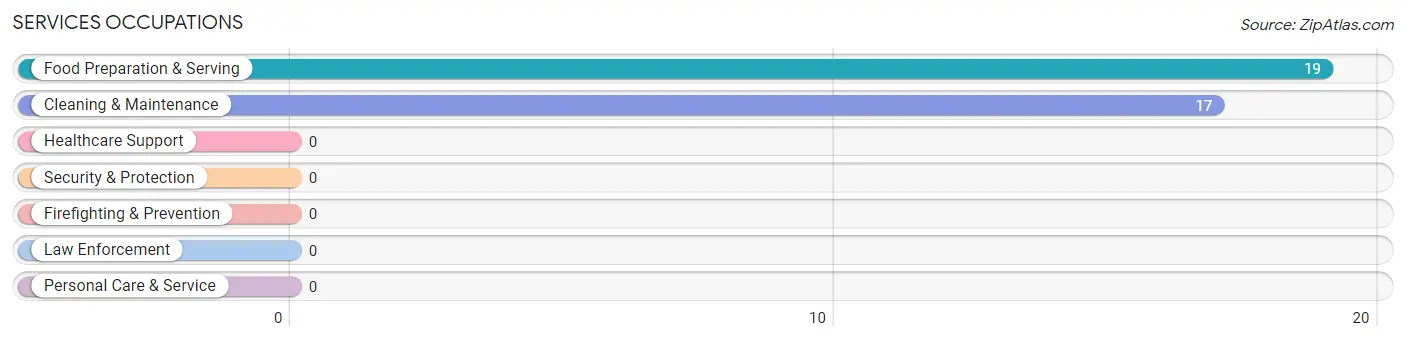
Services Occupations
The most common Services occupations in Mitchell are Food Preparation & Serving (19 | 26.4%), and Cleaning & Maintenance (17 | 23.6%).
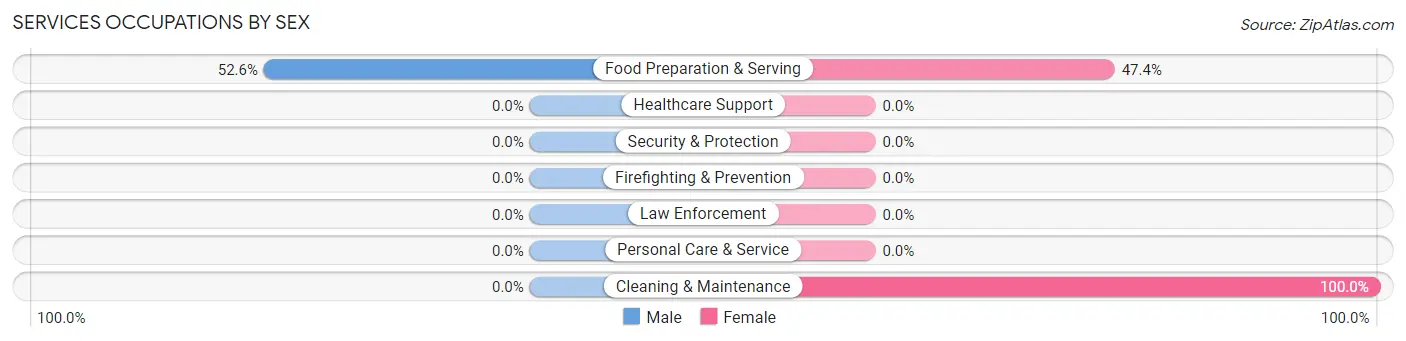
Services Occupations by Sex
| Occupation | Male | Female |
| Healthcare Support | 0 (0.0%) | 0 (0.0%) |
| Security & Protection | 0 (0.0%) | 0 (0.0%) |
| Firefighting & Prevention | 0 (0.0%) | 0 (0.0%) |
| Law Enforcement | 0 (0.0%) | 0 (0.0%) |
| Food Preparation & Serving | 10 (52.6%) | 9 (47.4%) |
| Cleaning & Maintenance | 0 (0.0%) | 17 (100.0%) |
| Personal Care & Service | 0 (0.0%) | 0 (0.0%) |
| Total (Category) | 10 (27.8%) | 26 (72.2%) |
| Total (Overall) | 32 (44.4%) | 40 (55.6%) |
Sales and Office Occupations
The most common Sales and Office occupations in Mitchell are Sales & Related (6 | 8.3%), and Office & Administration (5 | 6.9%).
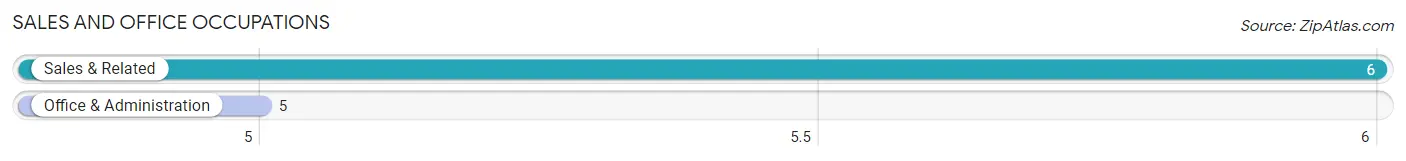
Sales and Office Occupations by Sex

| Occupation | Male | Female |
| Sales & Related | 6 (100.0%) | 0 (0.0%) |
| Office & Administration | 0 (0.0%) | 5 (100.0%) |
| Total (Category) | 6 (54.5%) | 5 (45.5%) |
| Total (Overall) | 32 (44.4%) | 40 (55.6%) |
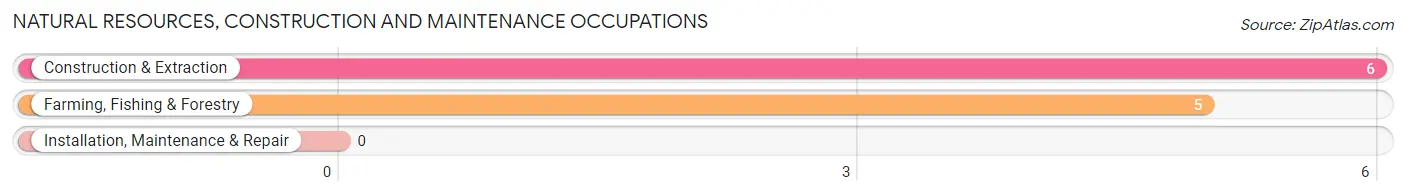
Natural Resources, Construction and Maintenance Occupations
The most common Natural Resources, Construction and Maintenance occupations in Mitchell are Construction & Extraction (6 | 8.3%), and Farming, Fishing & Forestry (5 | 6.9%).
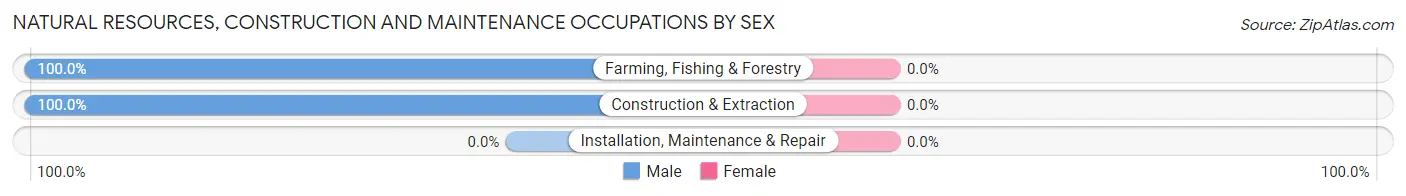
Natural Resources, Construction and Maintenance Occupations by Sex
| Occupation | Male | Female |
| Farming, Fishing & Forestry | 5 (100.0%) | 0 (0.0%) |
| Construction & Extraction | 6 (100.0%) | 0 (0.0%) |
| Installation, Maintenance & Repair | 0 (0.0%) | 0 (0.0%) |
| Total (Category) | 11 (100.0%) | 0 (0.0%) |
| Total (Overall) | 32 (44.4%) | 40 (55.6%) |
Production, Transportation and Moving Occupations
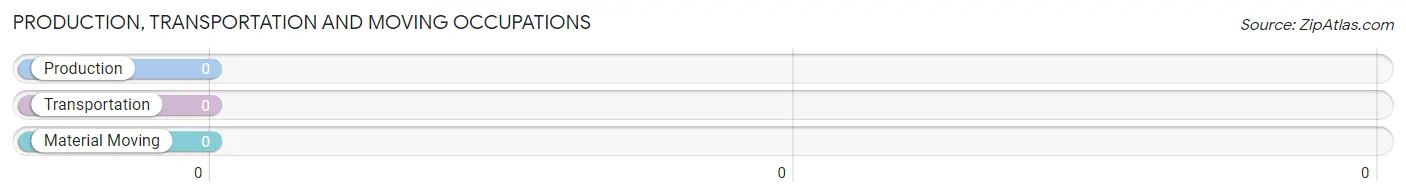
Production, Transportation and Moving Occupations by Sex
| Occupation | Male | Female |
| Production | 0 (0.0%) | 0 (0.0%) |
| Transportation | 0 (0.0%) | 0 (0.0%) |
| Material Moving | 0 (0.0%) | 0 (0.0%) |
| Total (Category) | 0 (0.0%) | 0 (0.0%) |
| Total (Overall) | 32 (44.4%) | 40 (55.6%) |
Employment Industries by Sex in Mitchell
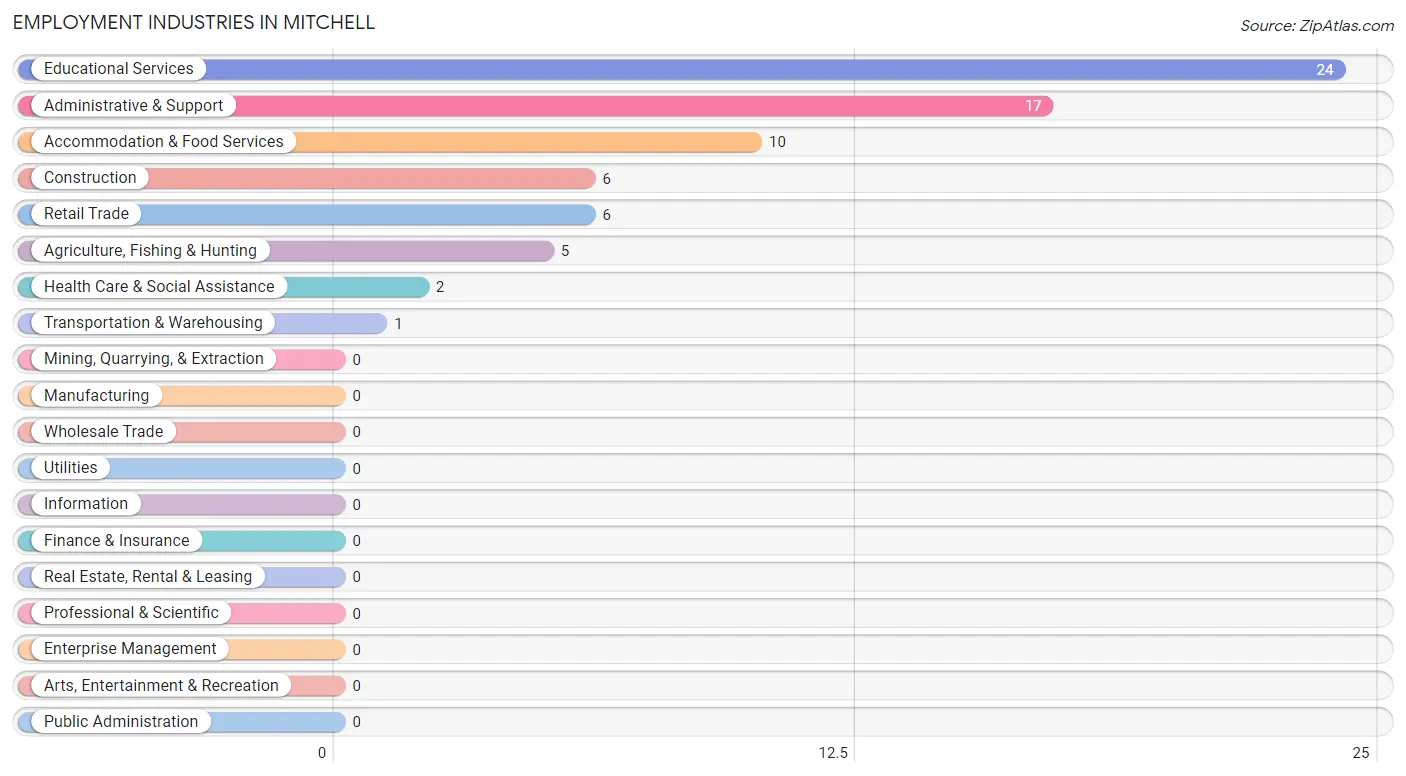
Employment Industries in Mitchell
The major employment industries in Mitchell include Educational Services (24 | 33.3%), Administrative & Support (17 | 23.6%), Accommodation & Food Services (10 | 13.9%), Construction (6 | 8.3%), and Retail Trade (6 | 8.3%).
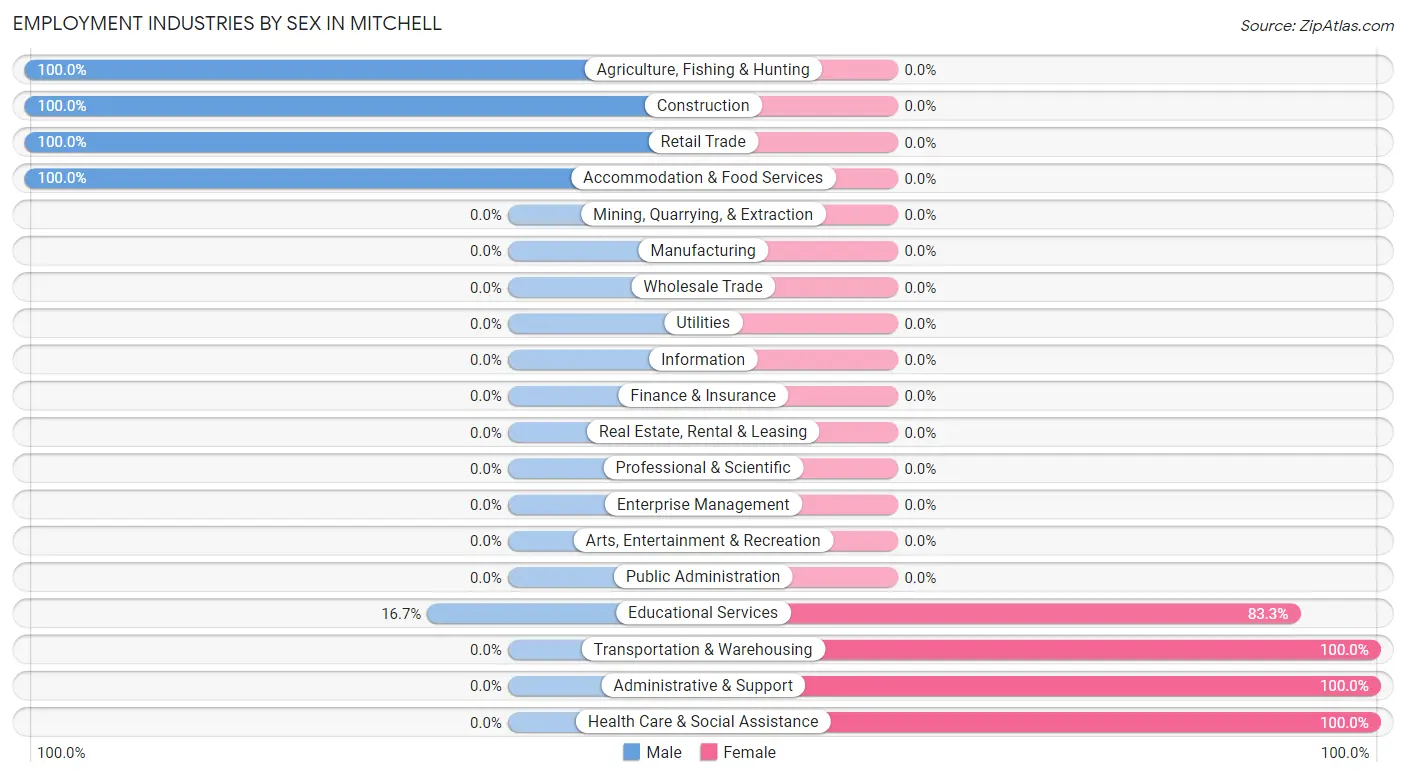
Employment Industries by Sex in Mitchell
The Mitchell industries that see more men than women are Agriculture, Fishing & Hunting (100.0%), Construction (100.0%), and Retail Trade (100.0%), whereas the industries that tend to have a higher number of women are Transportation & Warehousing (100.0%), Administrative & Support (100.0%), and Health Care & Social Assistance (100.0%).
| Industry | Male | Female |
| Agriculture, Fishing & Hunting | 5 (100.0%) | 0 (0.0%) |
| Mining, Quarrying, & Extraction | 0 (0.0%) | 0 (0.0%) |
| Construction | 6 (100.0%) | 0 (0.0%) |
| Manufacturing | 0 (0.0%) | 0 (0.0%) |
| Wholesale Trade | 0 (0.0%) | 0 (0.0%) |
| Retail Trade | 6 (100.0%) | 0 (0.0%) |
| Transportation & Warehousing | 0 (0.0%) | 1 (100.0%) |
| Utilities | 0 (0.0%) | 0 (0.0%) |
| Information | 0 (0.0%) | 0 (0.0%) |
| Finance & Insurance | 0 (0.0%) | 0 (0.0%) |
| Real Estate, Rental & Leasing | 0 (0.0%) | 0 (0.0%) |
| Professional & Scientific | 0 (0.0%) | 0 (0.0%) |
| Enterprise Management | 0 (0.0%) | 0 (0.0%) |
| Administrative & Support | 0 (0.0%) | 17 (100.0%) |
| Educational Services | 4 (16.7%) | 20 (83.3%) |
| Health Care & Social Assistance | 0 (0.0%) | 2 (100.0%) |
| Arts, Entertainment & Recreation | 0 (0.0%) | 0 (0.0%) |
| Accommodation & Food Services | 10 (100.0%) | 0 (0.0%) |
| Public Administration | 0 (0.0%) | 0 (0.0%) |
| Total | 32 (44.4%) | 40 (55.6%) |
Education in Mitchell
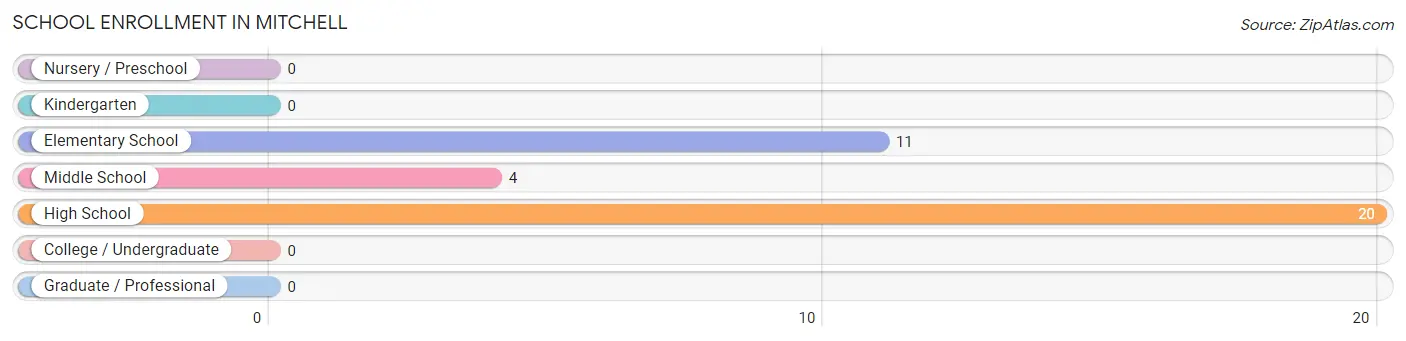
School Enrollment in Mitchell
The most common levels of schooling among the 35 students in Mitchell are high school (20 | 57.1%), elementary school (11 | 31.4%), and middle school (4 | 11.4%).
| School Level | # Students | % Students |
| Nursery / Preschool | 0 | 0.0% |
| Kindergarten | 0 | 0.0% |
| Elementary School | 11 | 31.4% |
| Middle School | 4 | 11.4% |
| High School | 20 | 57.1% |
| College / Undergraduate | 0 | 0.0% |
| Graduate / Professional | 0 | 0.0% |
| Total | 35 | 100.0% |
School Enrollment by Age by Funding Source in Mitchell
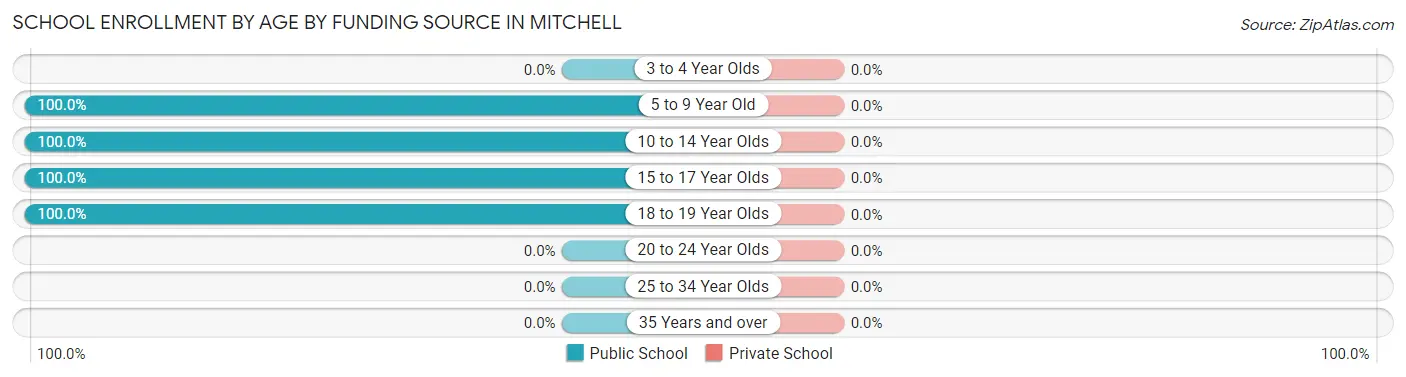
| Age Bracket | Public School | Private School |
| 3 to 4 Year Olds | 0 (0.0%) | 0 (0.0%) |
| 5 to 9 Year Old | 11 (100.0%) | 0 (0.0%) |
| 10 to 14 Year Olds | 11 (100.0%) | 0 (0.0%) |
| 15 to 17 Year Olds | 9 (100.0%) | 0 (0.0%) |
| 18 to 19 Year Olds | 4 (100.0%) | 0 (0.0%) |
| 20 to 24 Year Olds | 0 (0.0%) | 0 (0.0%) |
| 25 to 34 Year Olds | 0 (0.0%) | 0 (0.0%) |
| 35 Years and over | 0 (0.0%) | 0 (0.0%) |
| Total | 35 (100.0%) | 0 (0.0%) |
Educational Attainment by Field of Study in Mitchell
Education (6 | 66.7%), psychology (2 | 22.2%), and literature & languages (1 | 11.1%) are the most common fields of study among 9 individuals in Mitchell who have obtained a bachelor's degree or higher.
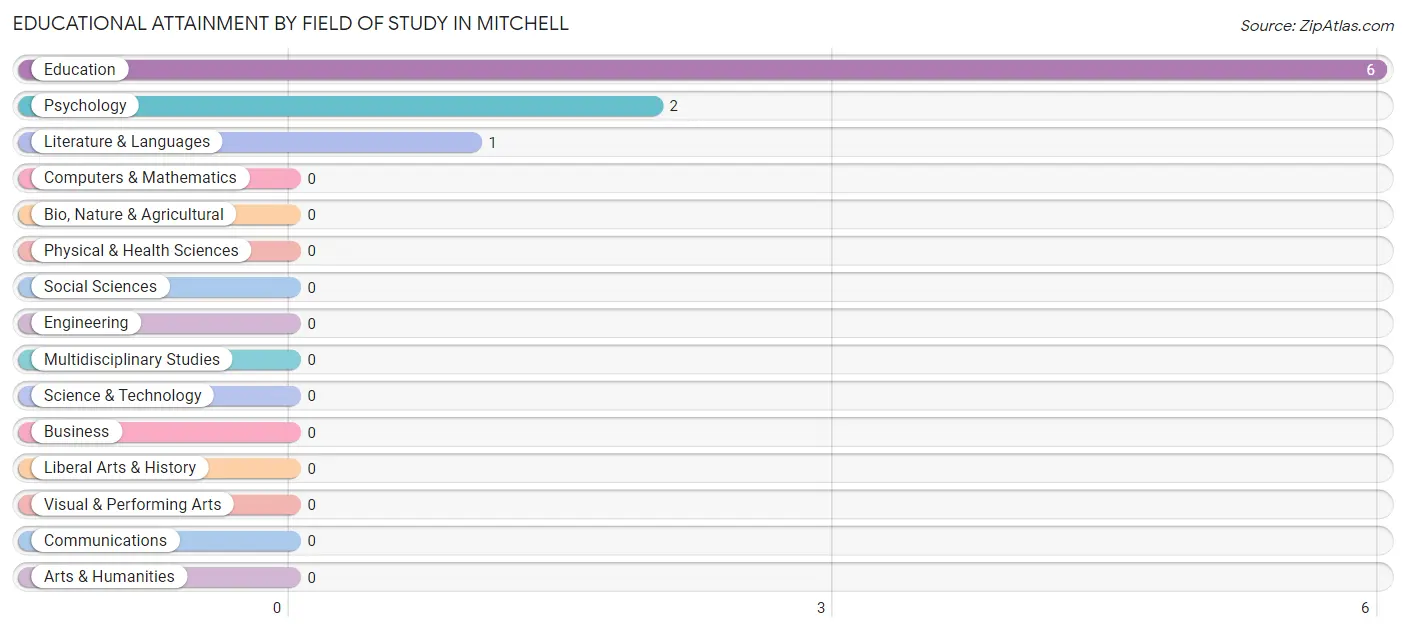
| Field of Study | # Graduates | % Graduates |
| Computers & Mathematics | 0 | 0.0% |
| Bio, Nature & Agricultural | 0 | 0.0% |
| Physical & Health Sciences | 0 | 0.0% |
| Psychology | 2 | 22.2% |
| Social Sciences | 0 | 0.0% |
| Engineering | 0 | 0.0% |
| Multidisciplinary Studies | 0 | 0.0% |
| Science & Technology | 0 | 0.0% |
| Business | 0 | 0.0% |
| Education | 6 | 66.7% |
| Literature & Languages | 1 | 11.1% |
| Liberal Arts & History | 0 | 0.0% |
| Visual & Performing Arts | 0 | 0.0% |
| Communications | 0 | 0.0% |
| Arts & Humanities | 0 | 0.0% |
| Total | 9 | 100.0% |
Transportation & Commute in Mitchell
Vehicle Availability by Sex in Mitchell
The most prevalent vehicle ownership categories in Mitchell are males with 5 or more vehicles (16, accounting for 50.0%) and females with 5 or more vehicles (9, making up 40.0%).
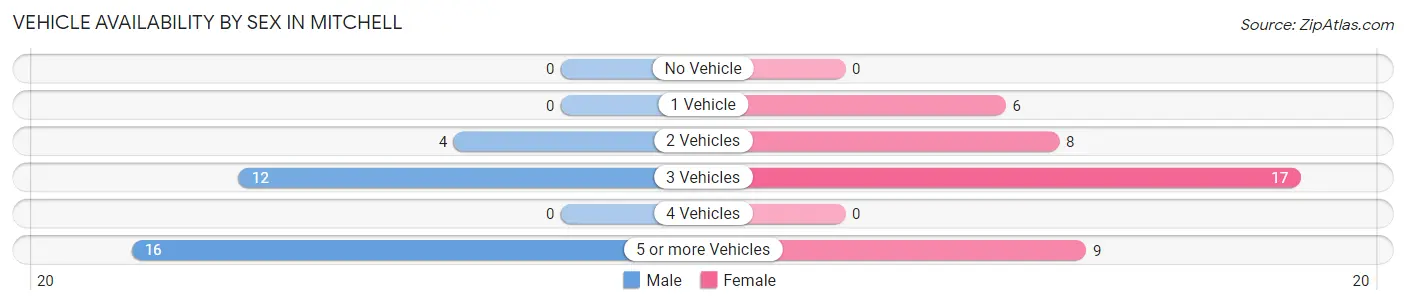
| Vehicles Available | Male | Female |
| No Vehicle | 0 (0.0%) | 0 (0.0%) |
| 1 Vehicle | 0 (0.0%) | 6 (15.0%) |
| 2 Vehicles | 4 (12.5%) | 8 (20.0%) |
| 3 Vehicles | 12 (37.5%) | 17 (42.5%) |
| 4 Vehicles | 0 (0.0%) | 0 (0.0%) |
| 5 or more Vehicles | 16 (50.0%) | 9 (22.5%) |
| Total | 32 (100.0%) | 40 (100.0%) |
Commute Time in Mitchell
The most frequently occuring commute durations in Mitchell are less than 5 minutes (22 commuters, 31.0%), 90 or more minutes (17 commuters, 23.9%), and 45 to 59 minutes (11 commuters, 15.5%).
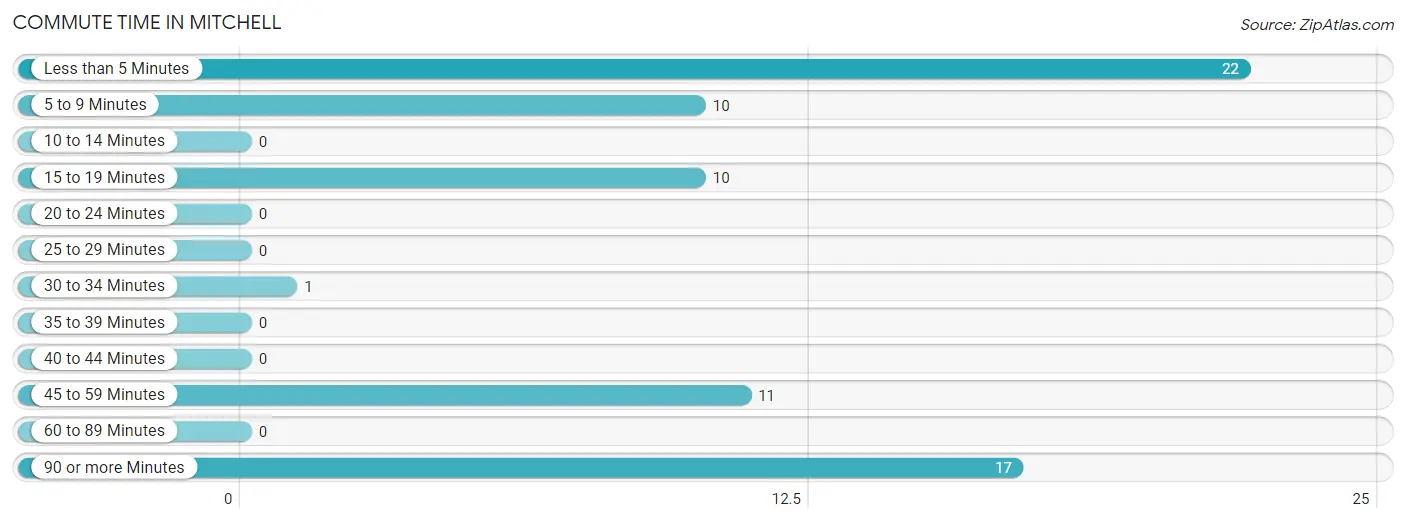
| Commute Time | # Commuters | % Commuters |
| Less than 5 Minutes | 22 | 31.0% |
| 5 to 9 Minutes | 10 | 14.1% |
| 10 to 14 Minutes | 0 | 0.0% |
| 15 to 19 Minutes | 10 | 14.1% |
| 20 to 24 Minutes | 0 | 0.0% |
| 25 to 29 Minutes | 0 | 0.0% |
| 30 to 34 Minutes | 1 | 1.4% |
| 35 to 39 Minutes | 0 | 0.0% |
| 40 to 44 Minutes | 0 | 0.0% |
| 45 to 59 Minutes | 11 | 15.5% |
| 60 to 89 Minutes | 0 | 0.0% |
| 90 or more Minutes | 17 | 23.9% |
Commute Time by Sex in Mitchell
The most common commute times in Mitchell are 45 to 59 minutes (11 commuters, 34.4%) for males and 90 or more minutes (17 commuters, 43.6%) for females.
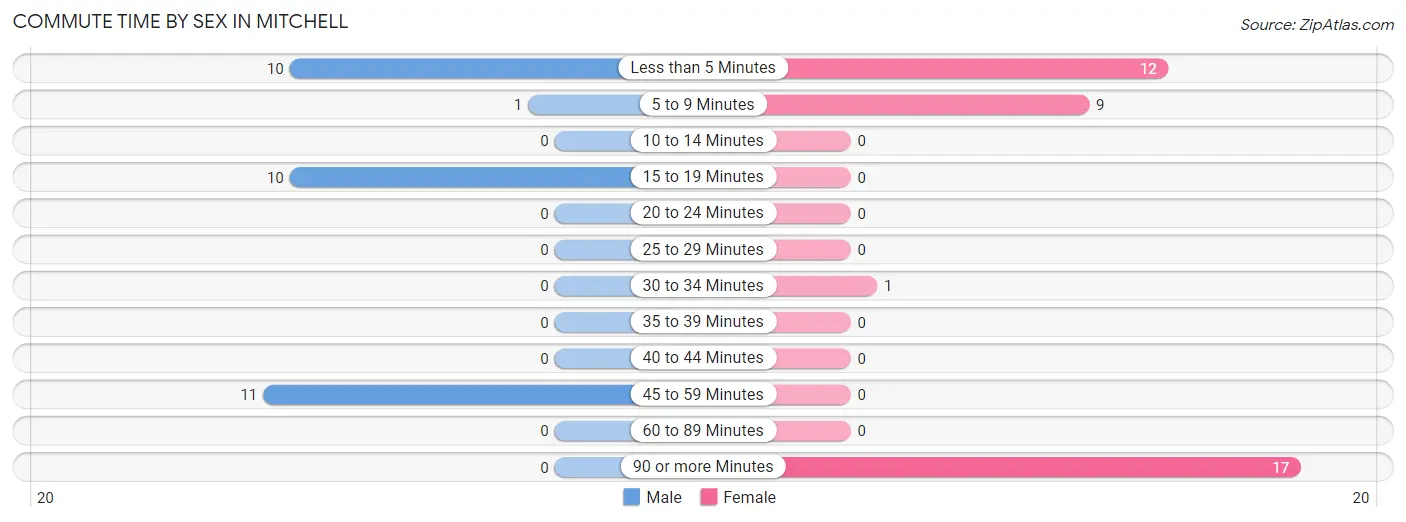
| Commute Time | Male | Female |
| Less than 5 Minutes | 10 (31.2%) | 12 (30.8%) |
| 5 to 9 Minutes | 1 (3.1%) | 9 (23.1%) |
| 10 to 14 Minutes | 0 (0.0%) | 0 (0.0%) |
| 15 to 19 Minutes | 10 (31.2%) | 0 (0.0%) |
| 20 to 24 Minutes | 0 (0.0%) | 0 (0.0%) |
| 25 to 29 Minutes | 0 (0.0%) | 0 (0.0%) |
| 30 to 34 Minutes | 0 (0.0%) | 1 (2.6%) |
| 35 to 39 Minutes | 0 (0.0%) | 0 (0.0%) |
| 40 to 44 Minutes | 0 (0.0%) | 0 (0.0%) |
| 45 to 59 Minutes | 11 (34.4%) | 0 (0.0%) |
| 60 to 89 Minutes | 0 (0.0%) | 0 (0.0%) |
| 90 or more Minutes | 0 (0.0%) | 17 (43.6%) |
Time of Departure to Work by Sex in Mitchell
The most frequent times of departure to work in Mitchell are 5:30 AM to 5:59 AM (16, 50.0%) for males and 5:00 AM to 5:29 AM (17, 43.6%) for females.
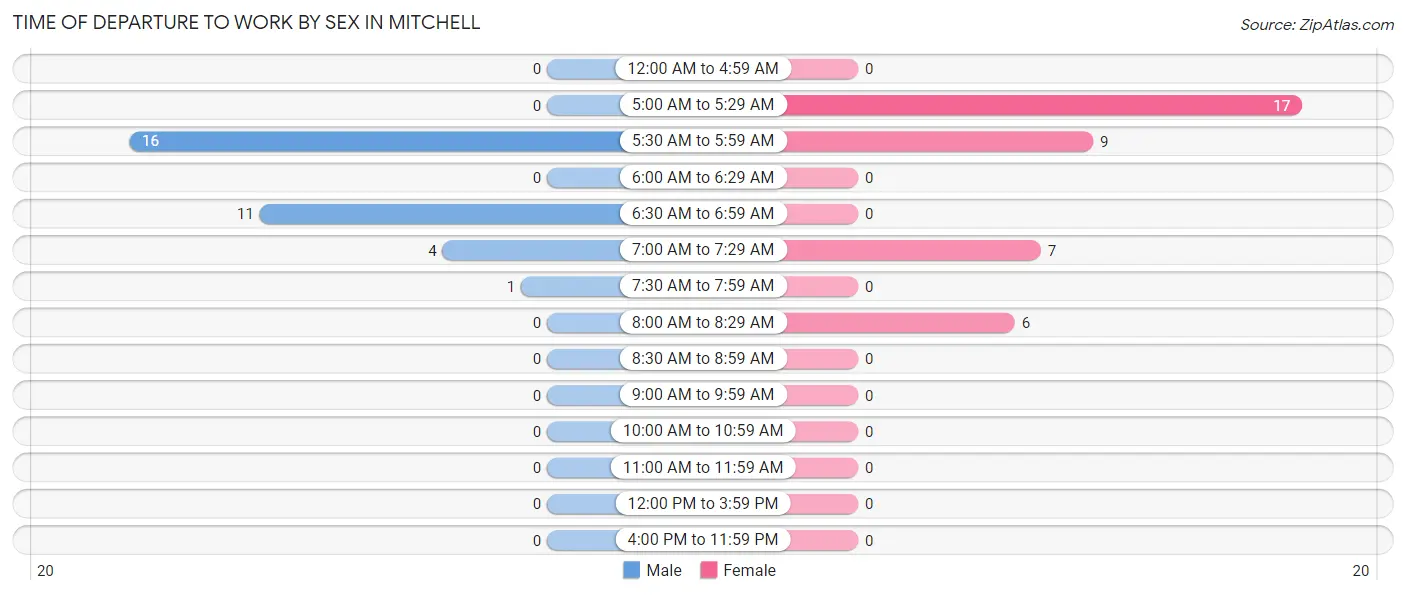
| Time of Departure | Male | Female |
| 12:00 AM to 4:59 AM | 0 (0.0%) | 0 (0.0%) |
| 5:00 AM to 5:29 AM | 0 (0.0%) | 17 (43.6%) |
| 5:30 AM to 5:59 AM | 16 (50.0%) | 9 (23.1%) |
| 6:00 AM to 6:29 AM | 0 (0.0%) | 0 (0.0%) |
| 6:30 AM to 6:59 AM | 11 (34.4%) | 0 (0.0%) |
| 7:00 AM to 7:29 AM | 4 (12.5%) | 7 (17.9%) |
| 7:30 AM to 7:59 AM | 1 (3.1%) | 0 (0.0%) |
| 8:00 AM to 8:29 AM | 0 (0.0%) | 6 (15.4%) |
| 8:30 AM to 8:59 AM | 0 (0.0%) | 0 (0.0%) |
| 9:00 AM to 9:59 AM | 0 (0.0%) | 0 (0.0%) |
| 10:00 AM to 10:59 AM | 0 (0.0%) | 0 (0.0%) |
| 11:00 AM to 11:59 AM | 0 (0.0%) | 0 (0.0%) |
| 12:00 PM to 3:59 PM | 0 (0.0%) | 0 (0.0%) |
| 4:00 PM to 11:59 PM | 0 (0.0%) | 0 (0.0%) |
| Total | 32 (100.0%) | 39 (100.0%) |
Housing Occupancy in Mitchell
Occupancy by Ownership in Mitchell
Of the total 58 dwellings in Mitchell, owner-occupied units account for 32 (55.2%), while renter-occupied units make up 26 (44.8%).
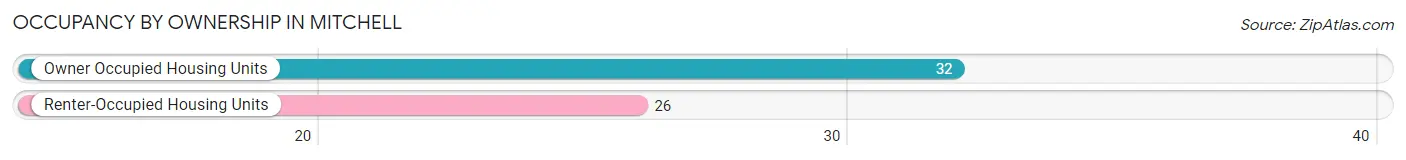
| Occupancy | # Housing Units | % Housing Units |
| Owner Occupied Housing Units | 32 | 55.2% |
| Renter-Occupied Housing Units | 26 | 44.8% |
| Total Occupied Housing Units | 58 | 100.0% |
Occupancy by Household Size in Mitchell
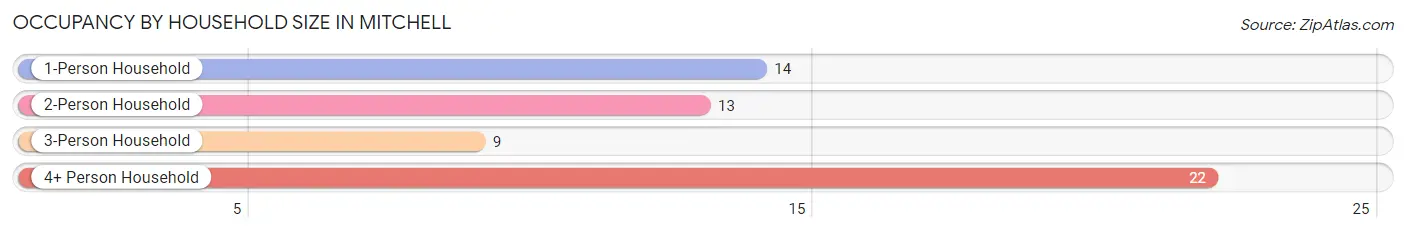
| Household Size | # Housing Units | % Housing Units |
| 1-Person Household | 14 | 24.1% |
| 2-Person Household | 13 | 22.4% |
| 3-Person Household | 9 | 15.5% |
| 4+ Person Household | 22 | 37.9% |
| Total Housing Units | 58 | 100.0% |
Occupancy by Ownership by Household Size in Mitchell
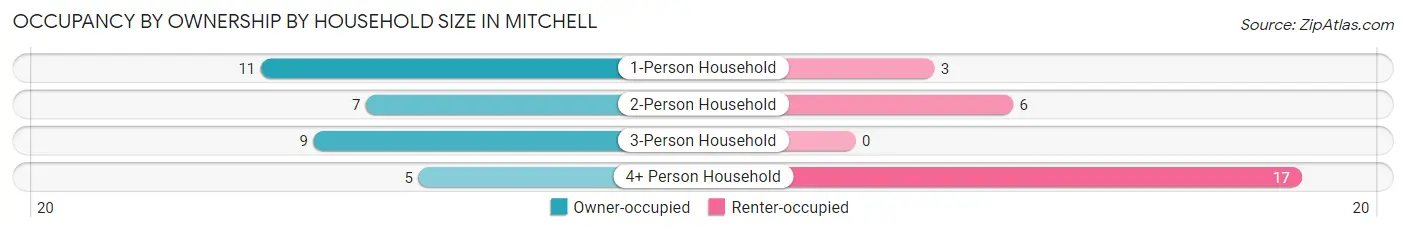
| Household Size | Owner-occupied | Renter-occupied |
| 1-Person Household | 11 (78.6%) | 3 (21.4%) |
| 2-Person Household | 7 (53.8%) | 6 (46.2%) |
| 3-Person Household | 9 (100.0%) | 0 (0.0%) |
| 4+ Person Household | 5 (22.7%) | 17 (77.3%) |
| Total Housing Units | 32 (55.2%) | 26 (44.8%) |
Occupancy by Educational Attainment in Mitchell
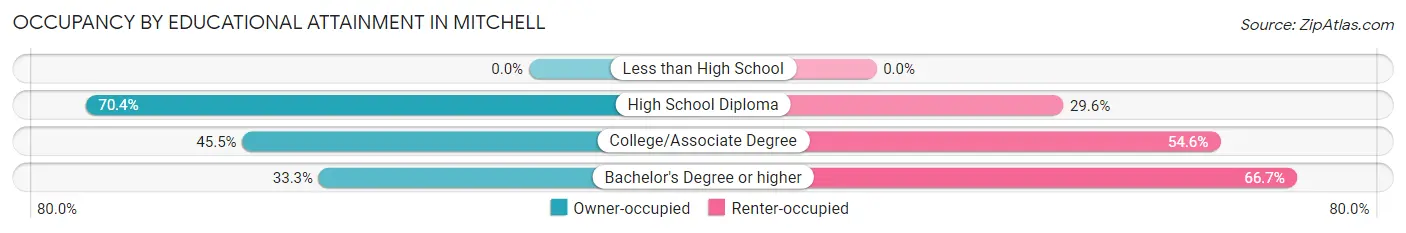
| Household Size | Owner-occupied | Renter-occupied |
| Less than High School | 0 (0.0%) | 0 (0.0%) |
| High School Diploma | 19 (70.4%) | 8 (29.6%) |
| College/Associate Degree | 10 (45.5%) | 12 (54.5%) |
| Bachelor's Degree or higher | 3 (33.3%) | 6 (66.7%) |
Occupancy by Age of Householder in Mitchell
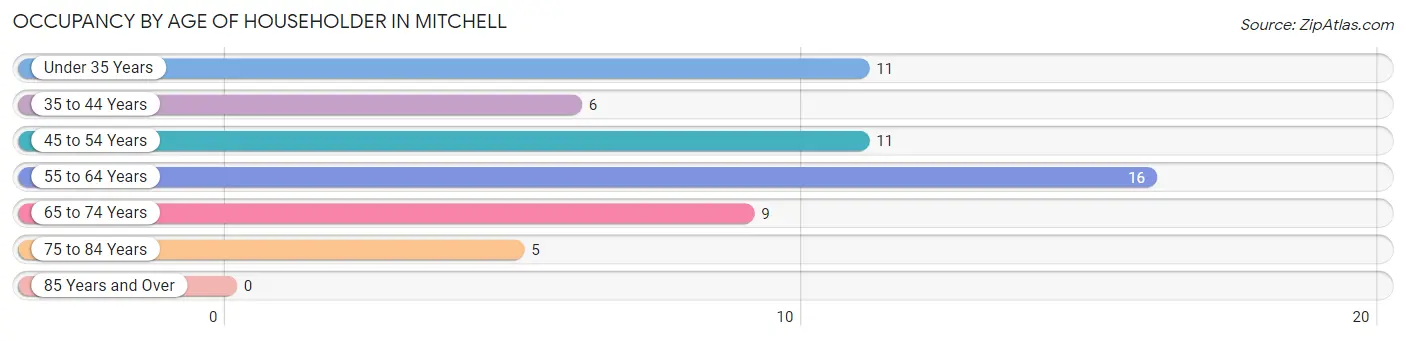
| Age Bracket | # Households | % Households |
| Under 35 Years | 11 | 19.0% |
| 35 to 44 Years | 6 | 10.3% |
| 45 to 54 Years | 11 | 19.0% |
| 55 to 64 Years | 16 | 27.6% |
| 65 to 74 Years | 9 | 15.5% |
| 75 to 84 Years | 5 | 8.6% |
| 85 Years and Over | 0 | 0.0% |
| Total | 58 | 100.0% |
Housing Finances in Mitchell
Median Income by Occupancy in Mitchell
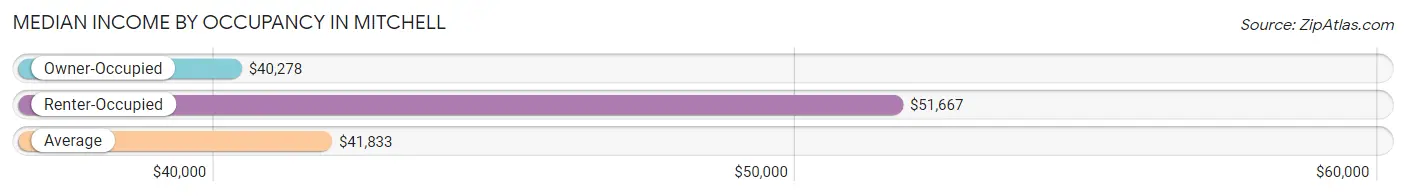
| Occupancy Type | # Households | Median Income |
| Owner-Occupied | 32 (55.2%) | $40,278 |
| Renter-Occupied | 26 (44.8%) | $51,667 |
| Average | 58 (100.0%) | $41,833 |
Occupancy by Householder Income Bracket in Mitchell
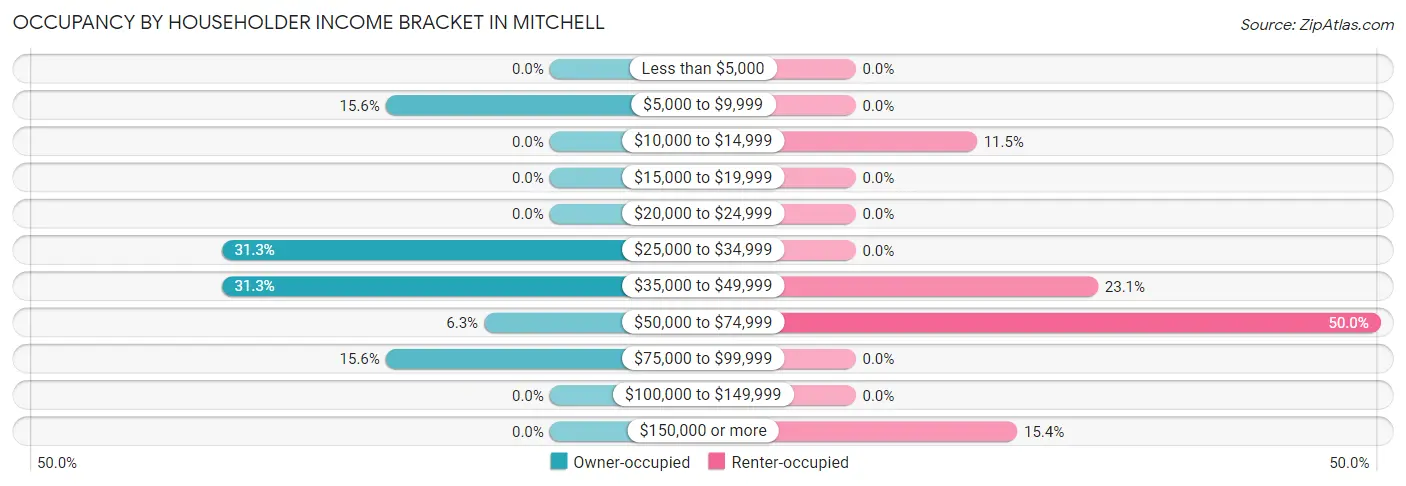
| Income Bracket | Owner-occupied | Renter-occupied |
| Less than $5,000 | 0 (0.0%) | 0 (0.0%) |
| $5,000 to $9,999 | 5 (15.6%) | 0 (0.0%) |
| $10,000 to $14,999 | 0 (0.0%) | 3 (11.5%) |
| $15,000 to $19,999 | 0 (0.0%) | 0 (0.0%) |
| $20,000 to $24,999 | 0 (0.0%) | 0 (0.0%) |
| $25,000 to $34,999 | 10 (31.2%) | 0 (0.0%) |
| $35,000 to $49,999 | 10 (31.2%) | 6 (23.1%) |
| $50,000 to $74,999 | 2 (6.2%) | 13 (50.0%) |
| $75,000 to $99,999 | 5 (15.6%) | 0 (0.0%) |
| $100,000 to $149,999 | 0 (0.0%) | 0 (0.0%) |
| $150,000 or more | 0 (0.0%) | 4 (15.4%) |
| Total | 32 (100.0%) | 26 (100.0%) |
Monthly Housing Cost Tiers in Mitchell
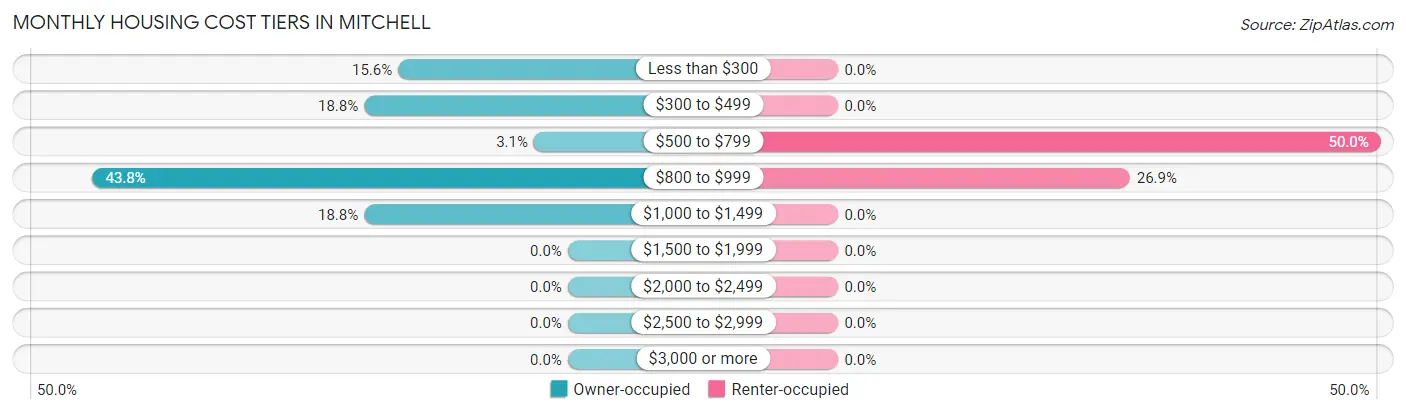
| Monthly Cost | Owner-occupied | Renter-occupied |
| Less than $300 | 5 (15.6%) | 0 (0.0%) |
| $300 to $499 | 6 (18.8%) | 0 (0.0%) |
| $500 to $799 | 1 (3.1%) | 13 (50.0%) |
| $800 to $999 | 14 (43.8%) | 7 (26.9%) |
| $1,000 to $1,499 | 6 (18.8%) | 0 (0.0%) |
| $1,500 to $1,999 | 0 (0.0%) | 0 (0.0%) |
| $2,000 to $2,499 | 0 (0.0%) | 0 (0.0%) |
| $2,500 to $2,999 | 0 (0.0%) | 0 (0.0%) |
| $3,000 or more | 0 (0.0%) | 0 (0.0%) |
| Total | 32 (100.0%) | 26 (100.0%) |
Physical Housing Characteristics in Mitchell
Housing Structures in Mitchell
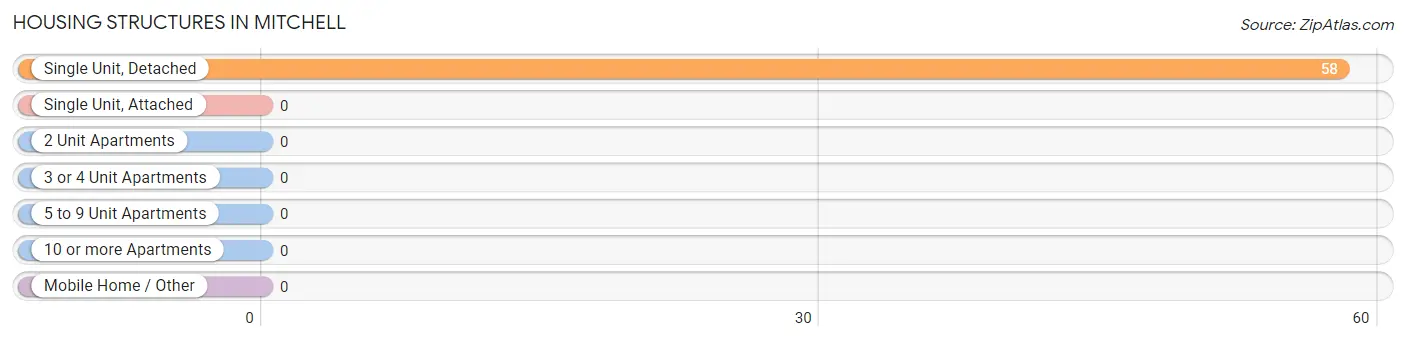
| Structure Type | # Housing Units | % Housing Units |
| Single Unit, Detached | 58 | 100.0% |
| Single Unit, Attached | 0 | 0.0% |
| 2 Unit Apartments | 0 | 0.0% |
| 3 or 4 Unit Apartments | 0 | 0.0% |
| 5 to 9 Unit Apartments | 0 | 0.0% |
| 10 or more Apartments | 0 | 0.0% |
| Mobile Home / Other | 0 | 0.0% |
| Total | 58 | 100.0% |
Housing Structures by Occupancy in Mitchell
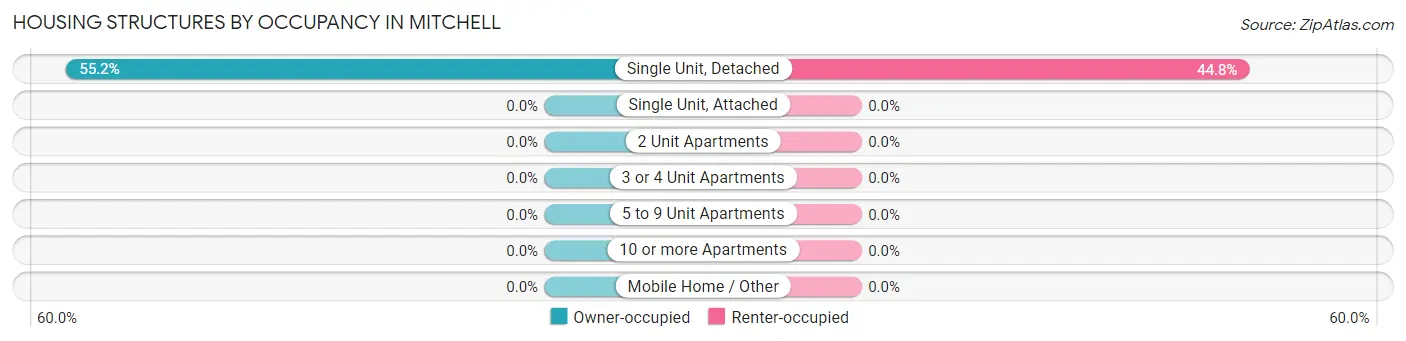
| Structure Type | Owner-occupied | Renter-occupied |
| Single Unit, Detached | 32 (55.2%) | 26 (44.8%) |
| Single Unit, Attached | 0 (0.0%) | 0 (0.0%) |
| 2 Unit Apartments | 0 (0.0%) | 0 (0.0%) |
| 3 or 4 Unit Apartments | 0 (0.0%) | 0 (0.0%) |
| 5 to 9 Unit Apartments | 0 (0.0%) | 0 (0.0%) |
| 10 or more Apartments | 0 (0.0%) | 0 (0.0%) |
| Mobile Home / Other | 0 (0.0%) | 0 (0.0%) |
| Total | 32 (55.2%) | 26 (44.8%) |
Housing Structures by Number of Rooms in Mitchell
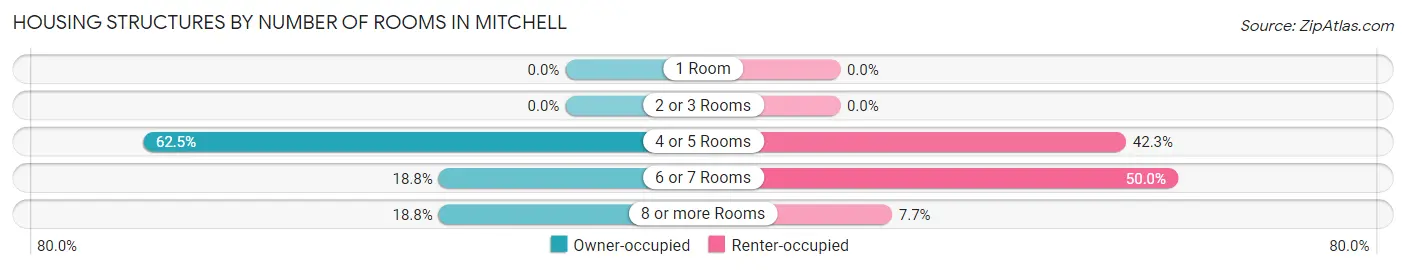
| Number of Rooms | Owner-occupied | Renter-occupied |
| 1 Room | 0 (0.0%) | 0 (0.0%) |
| 2 or 3 Rooms | 0 (0.0%) | 0 (0.0%) |
| 4 or 5 Rooms | 20 (62.5%) | 11 (42.3%) |
| 6 or 7 Rooms | 6 (18.8%) | 13 (50.0%) |
| 8 or more Rooms | 6 (18.8%) | 2 (7.7%) |
| Total | 32 (100.0%) | 26 (100.0%) |
Housing Structure by Heating Type in Mitchell
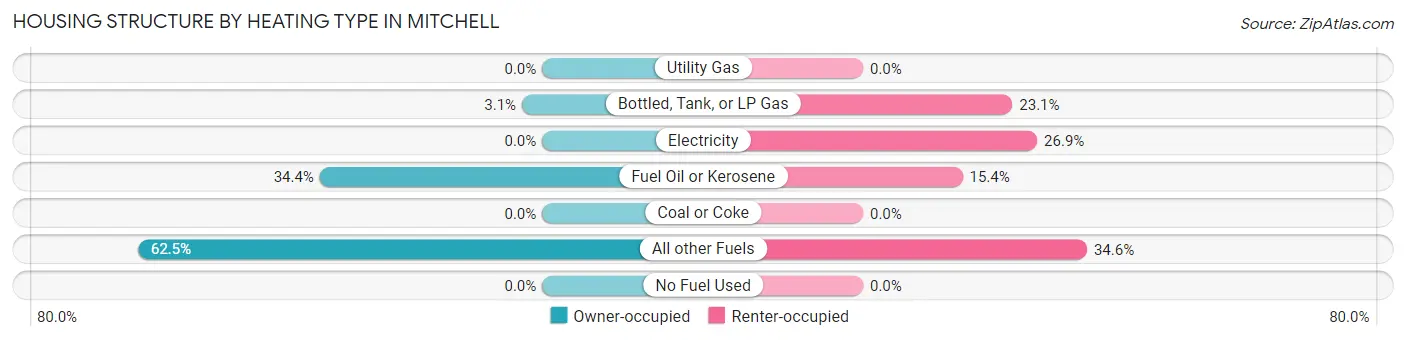
| Heating Type | Owner-occupied | Renter-occupied |
| Utility Gas | 0 (0.0%) | 0 (0.0%) |
| Bottled, Tank, or LP Gas | 1 (3.1%) | 6 (23.1%) |
| Electricity | 0 (0.0%) | 7 (26.9%) |
| Fuel Oil or Kerosene | 11 (34.4%) | 4 (15.4%) |
| Coal or Coke | 0 (0.0%) | 0 (0.0%) |
| All other Fuels | 20 (62.5%) | 9 (34.6%) |
| No Fuel Used | 0 (0.0%) | 0 (0.0%) |
| Total | 32 (100.0%) | 26 (100.0%) |
Household Vehicle Usage in Mitchell
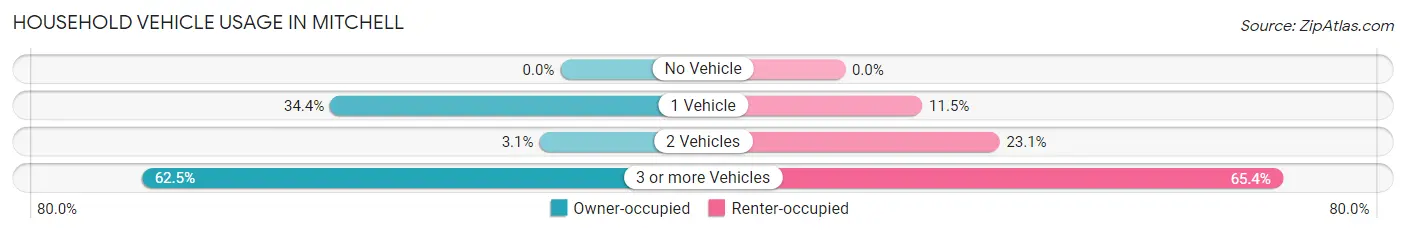
| Vehicles per Household | Owner-occupied | Renter-occupied |
| No Vehicle | 0 (0.0%) | 0 (0.0%) |
| 1 Vehicle | 11 (34.4%) | 3 (11.5%) |
| 2 Vehicles | 1 (3.1%) | 6 (23.1%) |
| 3 or more Vehicles | 20 (62.5%) | 17 (65.4%) |
| Total | 32 (100.0%) | 26 (100.0%) |
Real Estate & Mortgages in Mitchell
Real Estate and Mortgage Overview in Mitchell
| Characteristic | Without Mortgage | With Mortgage |
| Housing Units | 11 | 21 |
| Median Property Value | $127,500 | $158,000 |
| Median Household Income | - | - |
| Monthly Housing Costs | $305 | $0 |
| Real Estate Taxes | $510 | $0 |
Property Value by Mortgage Status in Mitchell
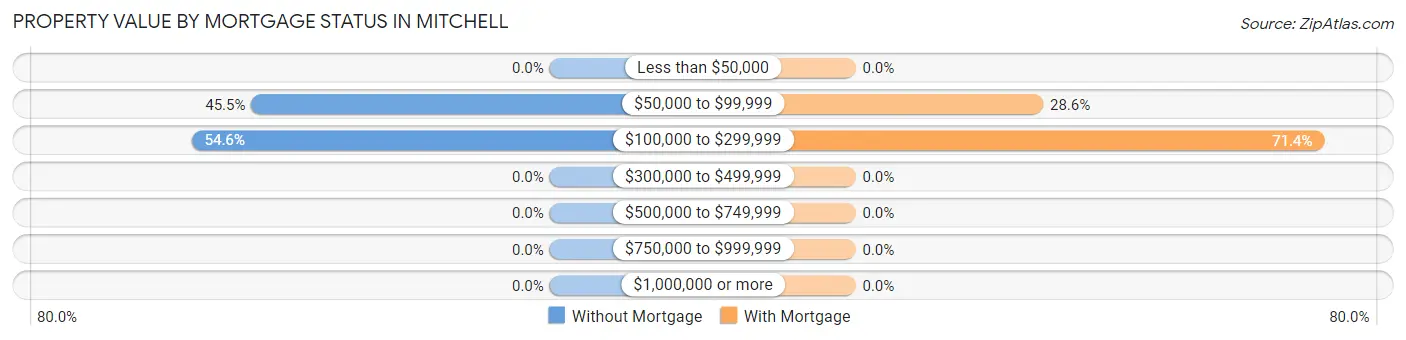
| Property Value | Without Mortgage | With Mortgage |
| Less than $50,000 | 0 (0.0%) | 0 (0.0%) |
| $50,000 to $99,999 | 5 (45.5%) | 6 (28.6%) |
| $100,000 to $299,999 | 6 (54.5%) | 15 (71.4%) |
| $300,000 to $499,999 | 0 (0.0%) | 0 (0.0%) |
| $500,000 to $749,999 | 0 (0.0%) | 0 (0.0%) |
| $750,000 to $999,999 | 0 (0.0%) | 0 (0.0%) |
| $1,000,000 or more | 0 (0.0%) | 0 (0.0%) |
| Total | 11 (100.0%) | 21 (100.0%) |
Household Income by Mortgage Status in Mitchell
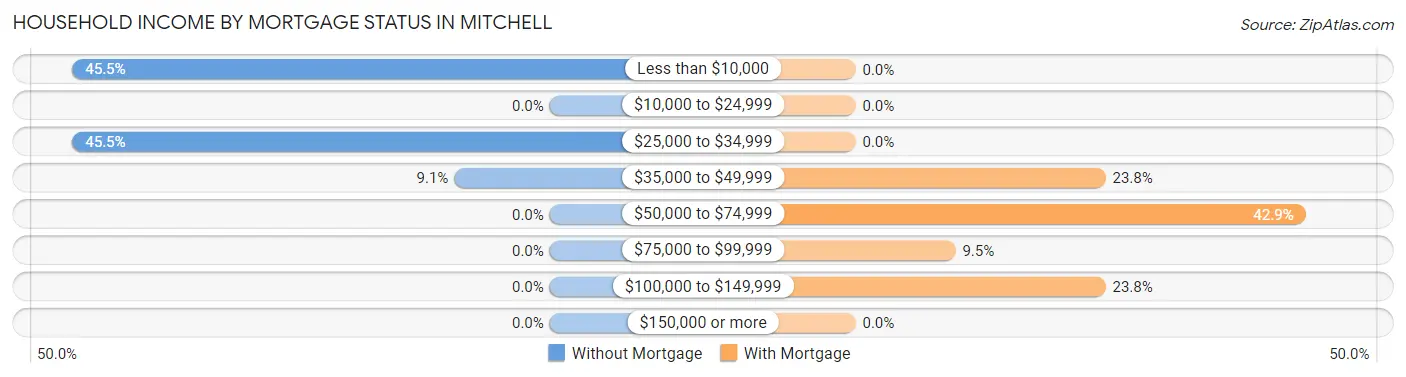
| Household Income | Without Mortgage | With Mortgage |
| Less than $10,000 | 5 (45.5%) | 0 (0.0%) |
| $10,000 to $24,999 | 0 (0.0%) | 0 (0.0%) |
| $25,000 to $34,999 | 5 (45.5%) | 0 (0.0%) |
| $35,000 to $49,999 | 1 (9.1%) | 5 (23.8%) |
| $50,000 to $74,999 | 0 (0.0%) | 9 (42.9%) |
| $75,000 to $99,999 | 0 (0.0%) | 2 (9.5%) |
| $100,000 to $149,999 | 0 (0.0%) | 5 (23.8%) |
| $150,000 or more | 0 (0.0%) | 0 (0.0%) |
| Total | 11 (100.0%) | 21 (100.0%) |
Property Value to Household Income Ratio in Mitchell
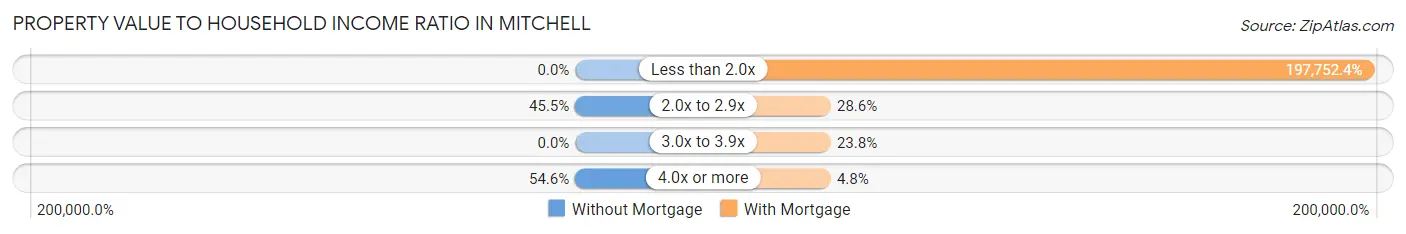
| Value-to-Income Ratio | Without Mortgage | With Mortgage |
| Less than 2.0x | 0 (0.0%) | 41,528 (197,752.4%) |
| 2.0x to 2.9x | 5 (45.5%) | 6 (28.6%) |
| 3.0x to 3.9x | 0 (0.0%) | 5 (23.8%) |
| 4.0x or more | 6 (54.5%) | 1 (4.8%) |
| Total | 11 (100.0%) | 21 (100.0%) |
Real Estate Taxes by Mortgage Status in Mitchell
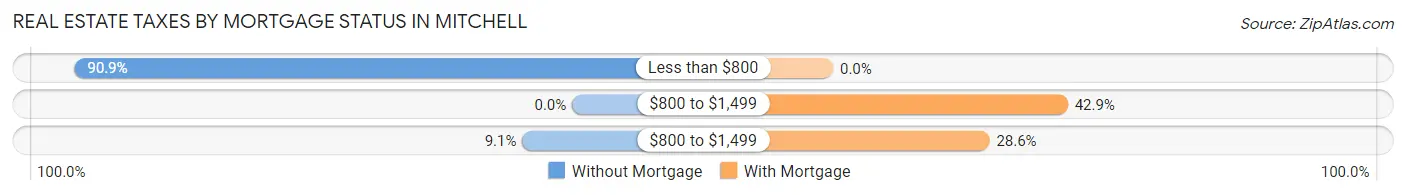
| Property Taxes | Without Mortgage | With Mortgage |
| Less than $800 | 10 (90.9%) | 0 (0.0%) |
| $800 to $1,499 | 0 (0.0%) | 9 (42.9%) |
| $800 to $1,499 | 1 (9.1%) | 6 (28.6%) |
| Total | 11 (100.0%) | 21 (100.0%) |
Health & Disability in Mitchell
Health Insurance Coverage by Age in Mitchell
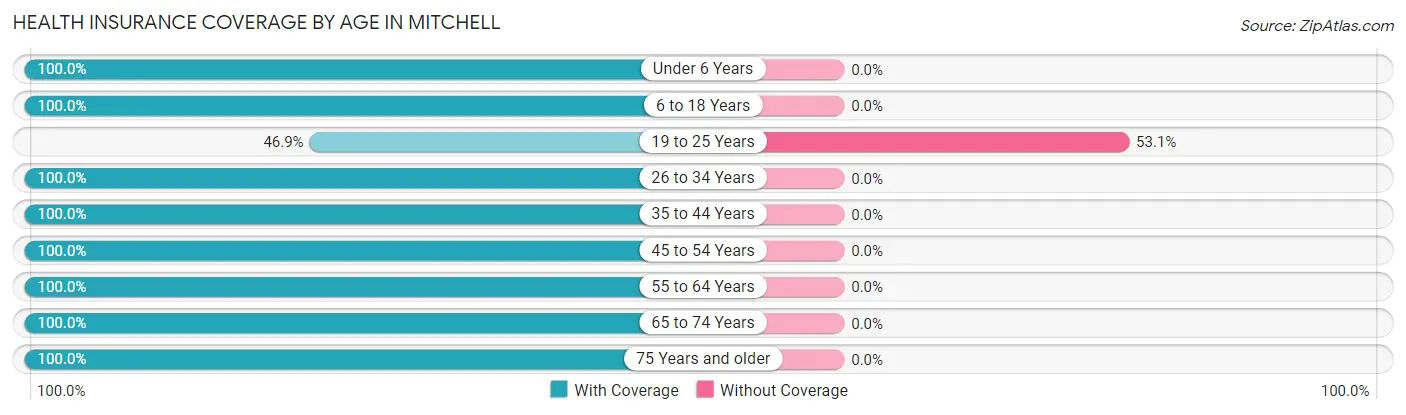
| Age Bracket | With Coverage | Without Coverage |
| Under 6 Years | 39 (100.0%) | 0 (0.0%) |
| 6 to 18 Years | 35 (100.0%) | 0 (0.0%) |
| 19 to 25 Years | 15 (46.9%) | 17 (53.1%) |
| 26 to 34 Years | 6 (100.0%) | 0 (0.0%) |
| 35 to 44 Years | 19 (100.0%) | 0 (0.0%) |
| 45 to 54 Years | 17 (100.0%) | 0 (0.0%) |
| 55 to 64 Years | 38 (100.0%) | 0 (0.0%) |
| 65 to 74 Years | 9 (100.0%) | 0 (0.0%) |
| 75 Years and older | 7 (100.0%) | 0 (0.0%) |
| Total | 185 (91.6%) | 17 (8.4%) |
Health Insurance Coverage by Citizenship Status in Mitchell
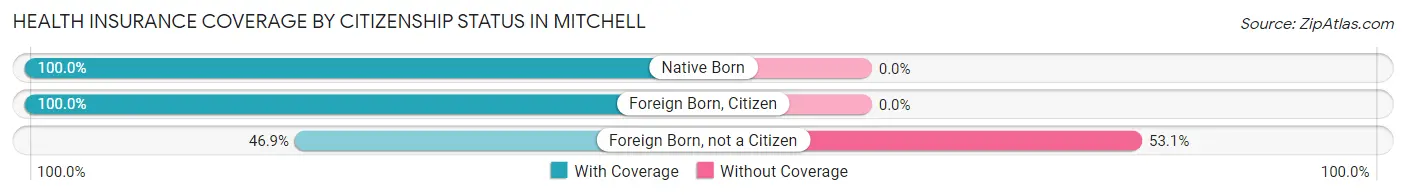
| Citizenship Status | With Coverage | Without Coverage |
| Native Born | 39 (100.0%) | 0 (0.0%) |
| Foreign Born, Citizen | 35 (100.0%) | 0 (0.0%) |
| Foreign Born, not a Citizen | 15 (46.9%) | 17 (53.1%) |
Health Insurance Coverage by Household Income in Mitchell
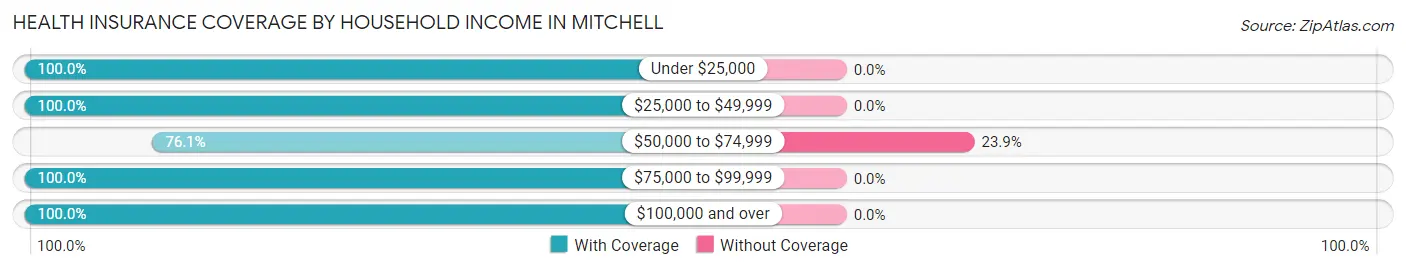
| Household Income | With Coverage | Without Coverage |
| Under $25,000 | 8 (100.0%) | 0 (0.0%) |
| $25,000 to $49,999 | 89 (100.0%) | 0 (0.0%) |
| $50,000 to $74,999 | 54 (76.1%) | 17 (23.9%) |
| $75,000 to $99,999 | 25 (100.0%) | 0 (0.0%) |
| $100,000 and over | 9 (100.0%) | 0 (0.0%) |
Public vs Private Health Insurance Coverage by Age in Mitchell
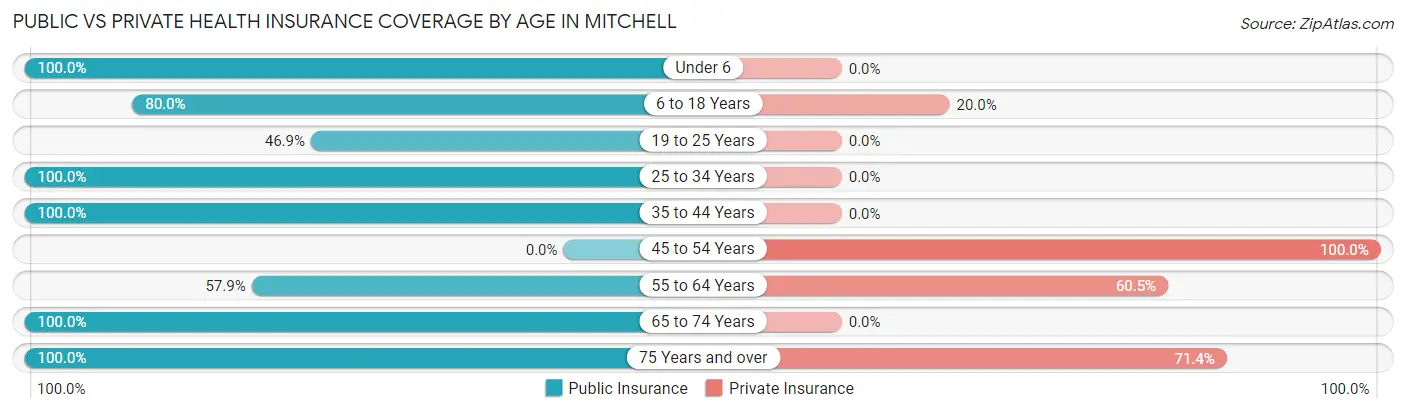
| Age Bracket | Public Insurance | Private Insurance |
| Under 6 | 39 (100.0%) | 0 (0.0%) |
| 6 to 18 Years | 28 (80.0%) | 7 (20.0%) |
| 19 to 25 Years | 15 (46.9%) | 0 (0.0%) |
| 25 to 34 Years | 6 (100.0%) | 0 (0.0%) |
| 35 to 44 Years | 19 (100.0%) | 0 (0.0%) |
| 45 to 54 Years | 0 (0.0%) | 17 (100.0%) |
| 55 to 64 Years | 22 (57.9%) | 23 (60.5%) |
| 65 to 74 Years | 9 (100.0%) | 0 (0.0%) |
| 75 Years and over | 7 (100.0%) | 5 (71.4%) |
| Total | 145 (71.8%) | 52 (25.7%) |
Disability Status by Sex by Age in Mitchell
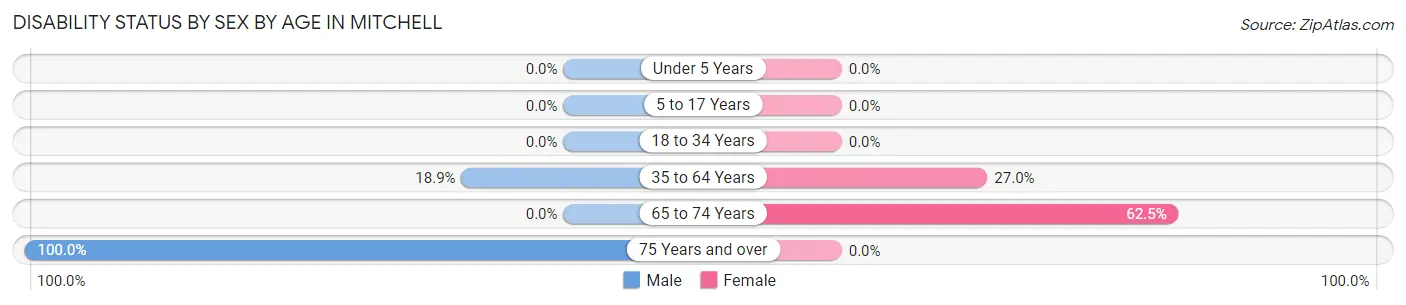
| Age Bracket | Male | Female |
| Under 5 Years | 0 (0.0%) | 0 (0.0%) |
| 5 to 17 Years | 0 (0.0%) | 0 (0.0%) |
| 18 to 34 Years | 0 (0.0%) | 0 (0.0%) |
| 35 to 64 Years | 7 (18.9%) | 10 (27.0%) |
| 65 to 74 Years | 0 (0.0%) | 5 (62.5%) |
| 75 Years and over | 5 (100.0%) | 0 (0.0%) |
Disability Class by Sex by Age in Mitchell
Disability Class: Hearing Difficulty
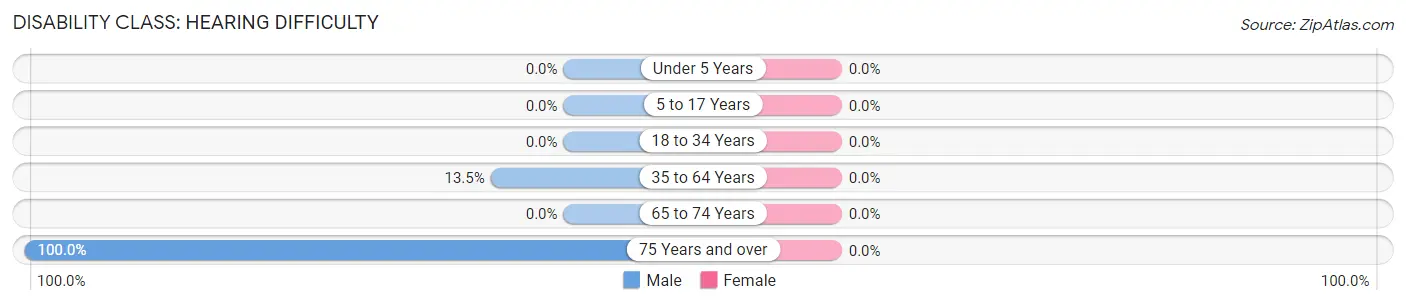
| Age Bracket | Male | Female |
| Under 5 Years | 0 (0.0%) | 0 (0.0%) |
| 5 to 17 Years | 0 (0.0%) | 0 (0.0%) |
| 18 to 34 Years | 0 (0.0%) | 0 (0.0%) |
| 35 to 64 Years | 5 (13.5%) | 0 (0.0%) |
| 65 to 74 Years | 0 (0.0%) | 0 (0.0%) |
| 75 Years and over | 5 (100.0%) | 0 (0.0%) |
Disability Class: Vision Difficulty
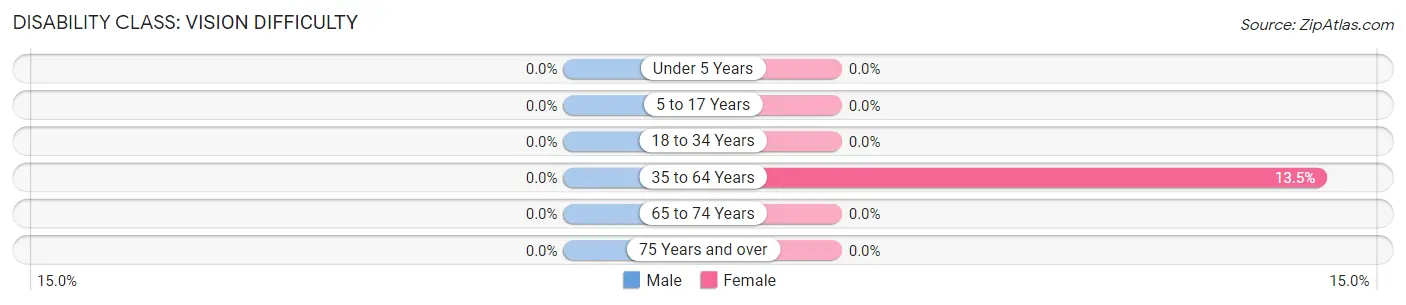
| Age Bracket | Male | Female |
| Under 5 Years | 0 (0.0%) | 0 (0.0%) |
| 5 to 17 Years | 0 (0.0%) | 0 (0.0%) |
| 18 to 34 Years | 0 (0.0%) | 0 (0.0%) |
| 35 to 64 Years | 0 (0.0%) | 5 (13.5%) |
| 65 to 74 Years | 0 (0.0%) | 0 (0.0%) |
| 75 Years and over | 0 (0.0%) | 0 (0.0%) |
Disability Class: Cognitive Difficulty
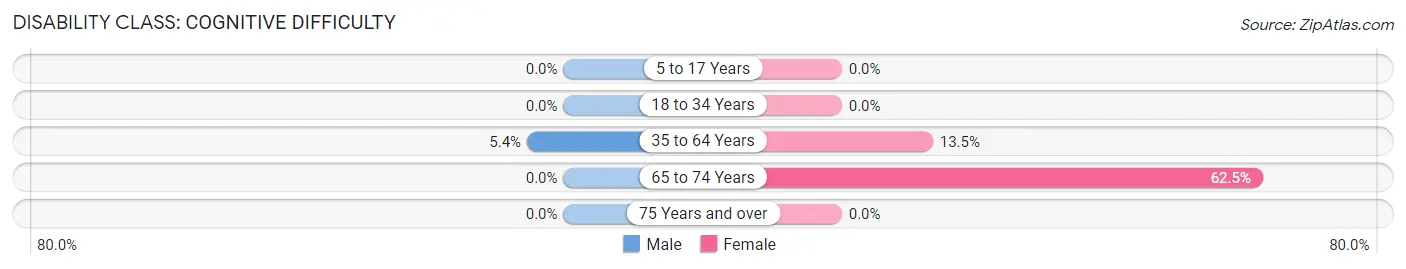
| Age Bracket | Male | Female |
| 5 to 17 Years | 0 (0.0%) | 0 (0.0%) |
| 18 to 34 Years | 0 (0.0%) | 0 (0.0%) |
| 35 to 64 Years | 2 (5.4%) | 5 (13.5%) |
| 65 to 74 Years | 0 (0.0%) | 5 (62.5%) |
| 75 Years and over | 0 (0.0%) | 0 (0.0%) |
Disability Class: Ambulatory Difficulty
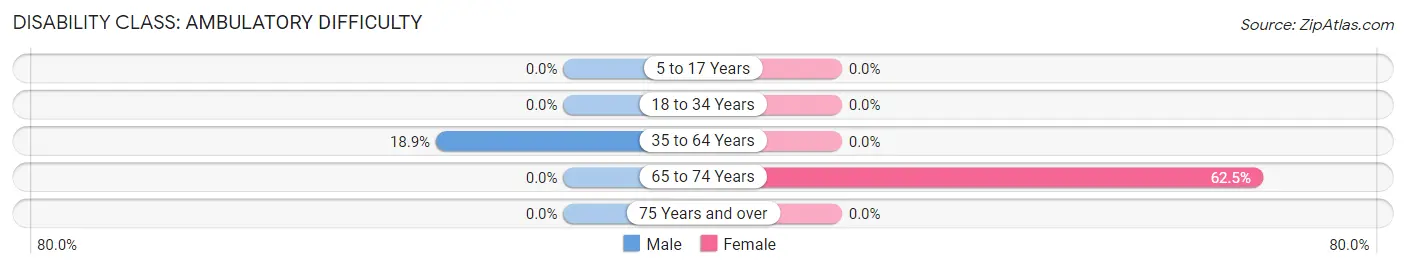
| Age Bracket | Male | Female |
| 5 to 17 Years | 0 (0.0%) | 0 (0.0%) |
| 18 to 34 Years | 0 (0.0%) | 0 (0.0%) |
| 35 to 64 Years | 7 (18.9%) | 0 (0.0%) |
| 65 to 74 Years | 0 (0.0%) | 5 (62.5%) |
| 75 Years and over | 0 (0.0%) | 0 (0.0%) |
Disability Class: Self-Care Difficulty
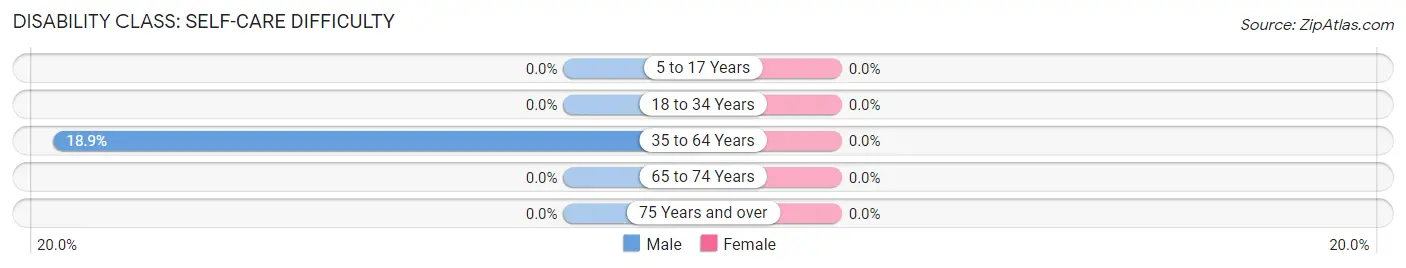
| Age Bracket | Male | Female |
| 5 to 17 Years | 0 (0.0%) | 0 (0.0%) |
| 18 to 34 Years | 0 (0.0%) | 0 (0.0%) |
| 35 to 64 Years | 7 (18.9%) | 0 (0.0%) |
| 65 to 74 Years | 0 (0.0%) | 0 (0.0%) |
| 75 Years and over | 0 (0.0%) | 0 (0.0%) |
Technology Access in Mitchell
Computing Device Access in Mitchell
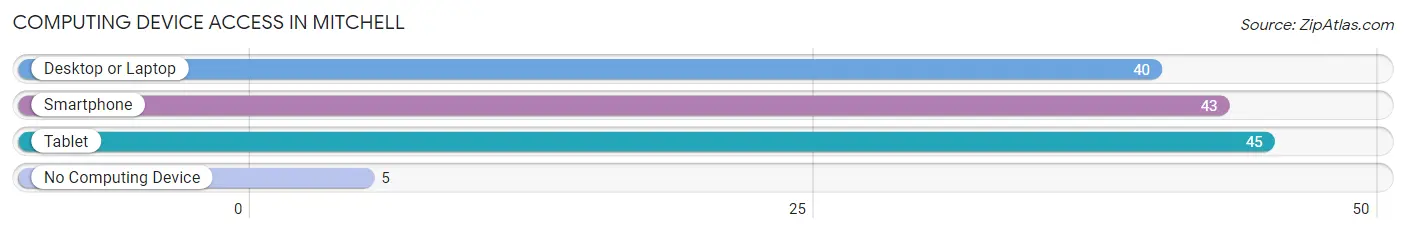
| Device Type | # Households | % Households |
| Desktop or Laptop | 40 | 69.0% |
| Smartphone | 43 | 74.1% |
| Tablet | 45 | 77.6% |
| No Computing Device | 5 | 8.6% |
| Total | 58 | 100.0% |
Internet Access in Mitchell
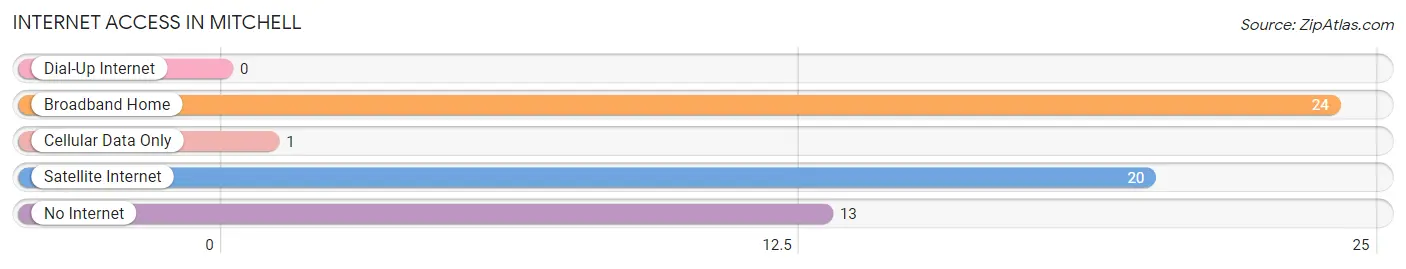
| Internet Type | # Households | % Households |
| Dial-Up Internet | 0 | 0.0% |
| Broadband Home | 24 | 41.4% |
| Cellular Data Only | 1 | 1.7% |
| Satellite Internet | 20 | 34.5% |
| No Internet | 13 | 22.4% |
| Total | 58 | 100.0% |
Mitchell Summary
Mitchell is a small city located in Wheeler County, Oregon. It is situated in the foothills of the Blue Mountains, about 30 miles east of the city of Prineville. The city has a population of about 500 people and is the county seat of Wheeler County.
History
The area around Mitchell was first settled in the late 1800s by homesteaders. The town was named after a local rancher, John Mitchell, who was one of the first settlers in the area. The town was officially incorporated in 1910.
In the early 1900s, Mitchell was a thriving agricultural community. The town was home to several grain elevators, a flour mill, and a creamery. The town also had a hotel, a bank, and several stores.
In the 1950s, the town began to decline as the agricultural industry shifted away from the area. The town’s population decreased and many of the businesses closed.
In the late 1970s, the town began to experience a resurgence. The town was designated as the county seat of Wheeler County in 1978 and the county courthouse was built in the town. The courthouse brought new jobs and businesses to the area.
Geography
Mitchell is located in the foothills of the Blue Mountains in eastern Oregon. The city is situated at an elevation of 2,890 feet and is surrounded by rolling hills and grasslands. The city is located about 30 miles east of the city of Prineville and about 50 miles south of the city of Bend.
The climate in Mitchell is semi-arid, with hot summers and cold winters. The average annual temperature is about 50 degrees Fahrenheit. The average annual precipitation is about 12 inches.
Economy
The economy of Mitchell is largely based on agriculture and tourism. The town is home to several farms and ranches that produce hay, wheat, and other crops. The town is also home to several tourist attractions, including the Wheeler County Courthouse, the Mitchell Museum, and the Mitchell Wildlife Refuge.
The town is also home to several small businesses, including restaurants, shops, and a grocery store. The town is also home to a branch of the Oregon State University Extension Service, which provides educational and research services to the local community.
Demographics
As of the 2010 census, the population of Mitchell was 498 people. The racial makeup of the town was 95.2% White, 0.2% African American, 0.4% Native American, 0.2% Asian, 0.2% Pacific Islander, 0.4% from other races, and 3.6% from two or more races. Hispanic or Latino of any race were 1.2% of the population.
The median household income in Mitchell was $35,625, and the median family income was $41,250. The per capita income for the town was $17,845. About 11.2% of the population was below the poverty line.
Common Questions
What is Per Capita Income in Mitchell?
Per Capita income in Mitchell is $18,295.
What is the Median Family Income in Mitchell?
Median Family Income in Mitchell is $42,250.
What is the Median Household income in Mitchell?
Median Household Income in Mitchell is $41,833.
What is Income or Wage Gap in Mitchell?
Income or Wage Gap in Mitchell is 65.9%.
Women in Mitchell earn 34.1 cents for every dollar earned by a man.
What is Inequality or Gini Index in Mitchell?
Inequality or Gini Index in Mitchell is 0.40.
What is the Total Population of Mitchell?
Total Population of Mitchell is 202.
What is the Total Male Population of Mitchell?
Total Male Population of Mitchell is 102.
What is the Total Female Population of Mitchell?
Total Female Population of Mitchell is 100.
What is the Ratio of Males per 100 Females in Mitchell?
There are 102.00 Males per 100 Females in Mitchell.
What is the Ratio of Females per 100 Males in Mitchell?
There are 98.04 Females per 100 Males in Mitchell.
What is the Median Population Age in Mitchell?
Median Population Age in Mitchell is 24.5 Years.
What is the Average Family Size in Mitchell
Average Family Size in Mitchell is 4.3 People.
What is the Average Household Size in Mitchell
Average Household Size in Mitchell is 3.5 People.
How Large is the Labor Force in Mitchell?
There are 82 People in the Labor Forcein in Mitchell.
What is the Percentage of People in the Labor Force in Mitchell?
59.9% of People are in the Labor Force in Mitchell.
What is the Unemployment Rate in Mitchell?
Unemployment Rate in Mitchell is 12.2%.