Coos Bay, OR Map & Demographics
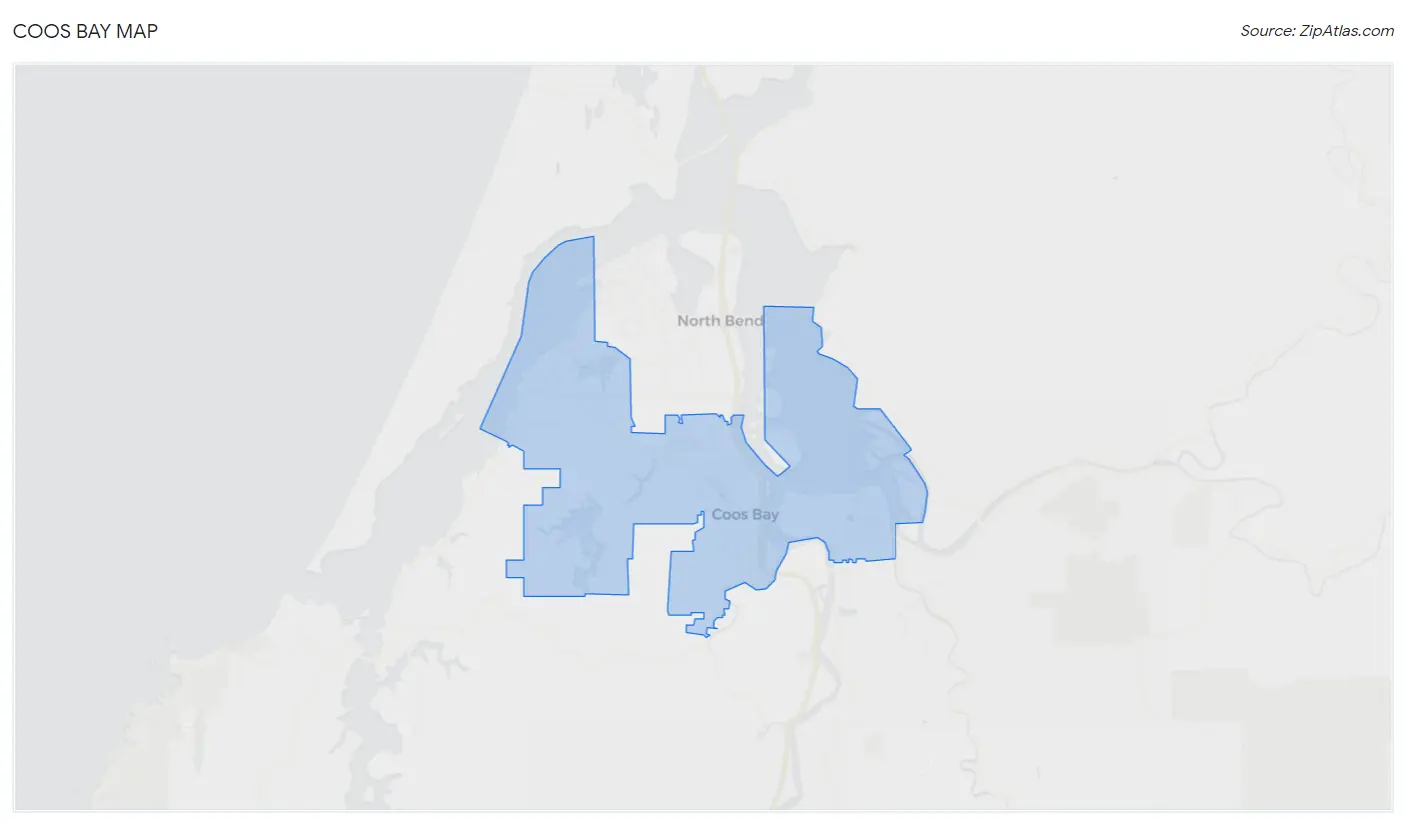
Coos Bay Map
Coos Bay Overview
$32,165
PER CAPITA INCOME
$79,327
AVG FAMILY INCOME
$53,331
AVG HOUSEHOLD INCOME
29.6%
WAGE / INCOME GAP [ % ]
70.4¢/ $1
WAGE / INCOME GAP [ $ ]
0.44
INEQUALITY / GINI INDEX
15,949
TOTAL POPULATION
7,650
MALE POPULATION
8,299
FEMALE POPULATION
92.18
MALES / 100 FEMALES
108.48
FEMALES / 100 MALES
42.8
MEDIAN AGE
2.8
AVG FAMILY SIZE
2.2
AVG HOUSEHOLD SIZE
7,670
LABOR FORCE [ PEOPLE ]
57.6%
PERCENT IN LABOR FORCE
4.8%
UNEMPLOYMENT RATE
Coos Bay Zip Codes
Coos Bay Area Codes
Income in Coos Bay
Income Overview in Coos Bay
Per Capita Income in Coos Bay is $32,165, while median incomes of families and households are $79,327 and $53,331 respectively.
| Characteristic | Number | Measure |
| Per Capita Income | 15,949 | $32,165 |
| Median Family Income | 3,825 | $79,327 |
| Mean Family Income | 3,825 | $88,721 |
| Median Household Income | 7,257 | $53,331 |
| Mean Household Income | 7,257 | $69,873 |
| Income Deficit | 3,825 | $0 |
| Wage / Income Gap (%) | 15,949 | 29.59% |
| Wage / Income Gap ($) | 15,949 | 70.41¢ per $1 |
| Gini / Inequality Index | 15,949 | 0.44 |
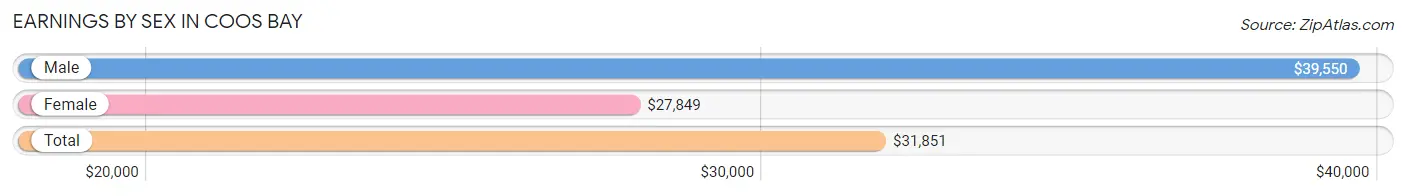
Earnings by Sex in Coos Bay
Average Earnings in Coos Bay are $31,851, $39,550 for men and $27,849 for women, a difference of 29.6%.
| Sex | Number | Average Earnings |
| Male | 4,041 (50.3%) | $39,550 |
| Female | 3,991 (49.7%) | $27,849 |
| Total | 8,032 (100.0%) | $31,851 |
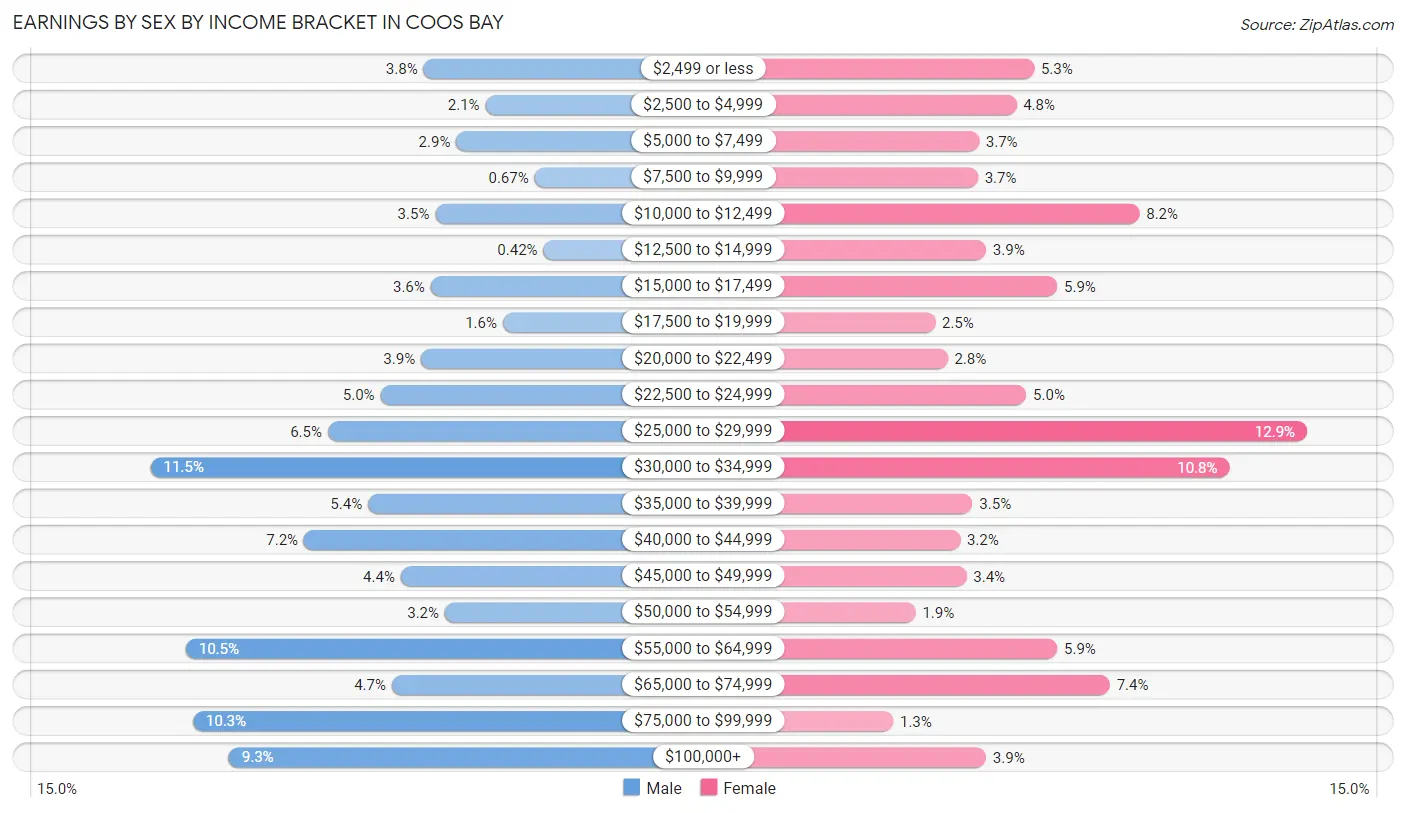
Earnings by Sex by Income Bracket in Coos Bay
The most common earnings brackets in Coos Bay are $30,000 to $34,999 for men (463 | 11.5%) and $25,000 to $29,999 for women (516 | 12.9%).
| Income | Male | Female |
| $2,499 or less | 153 (3.8%) | 210 (5.3%) |
| $2,500 to $4,999 | 83 (2.1%) | 190 (4.8%) |
| $5,000 to $7,499 | 116 (2.9%) | 148 (3.7%) |
| $7,500 to $9,999 | 27 (0.7%) | 147 (3.7%) |
| $10,000 to $12,499 | 140 (3.5%) | 328 (8.2%) |
| $12,500 to $14,999 | 17 (0.4%) | 156 (3.9%) |
| $15,000 to $17,499 | 145 (3.6%) | 236 (5.9%) |
| $17,500 to $19,999 | 63 (1.6%) | 99 (2.5%) |
| $20,000 to $22,499 | 156 (3.9%) | 113 (2.8%) |
| $22,500 to $24,999 | 202 (5.0%) | 201 (5.0%) |
| $25,000 to $29,999 | 262 (6.5%) | 516 (12.9%) |
| $30,000 to $34,999 | 463 (11.5%) | 429 (10.7%) |
| $35,000 to $39,999 | 216 (5.3%) | 141 (3.5%) |
| $40,000 to $44,999 | 289 (7.1%) | 127 (3.2%) |
| $45,000 to $49,999 | 179 (4.4%) | 134 (3.4%) |
| $50,000 to $54,999 | 129 (3.2%) | 77 (1.9%) |
| $55,000 to $64,999 | 423 (10.5%) | 236 (5.9%) |
| $65,000 to $74,999 | 189 (4.7%) | 295 (7.4%) |
| $75,000 to $99,999 | 415 (10.3%) | 52 (1.3%) |
| $100,000+ | 374 (9.3%) | 156 (3.9%) |
| Total | 4,041 (100.0%) | 3,991 (100.0%) |
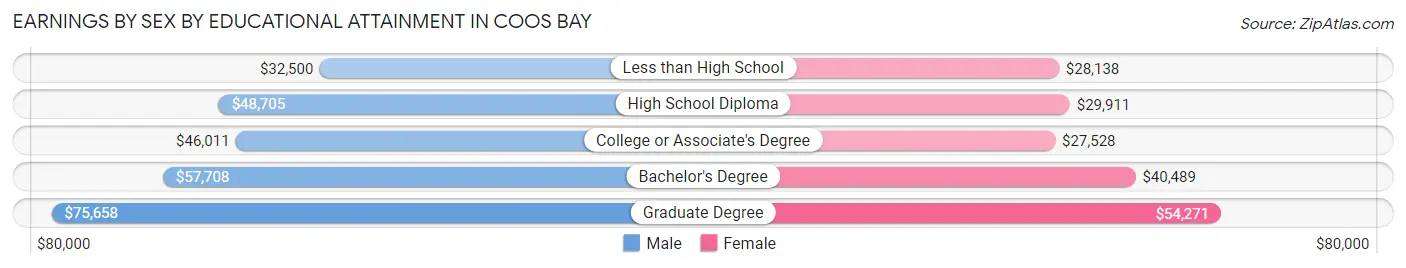
Earnings by Sex by Educational Attainment in Coos Bay
Average earnings in Coos Bay are $46,365 for men and $29,300 for women, a difference of 36.8%. Men with an educational attainment of graduate degree enjoy the highest average annual earnings of $75,658, while those with less than high school education earn the least with $32,500. Women with an educational attainment of graduate degree earn the most with the average annual earnings of $54,271, while those with college or associate's degree education have the smallest earnings of $27,528.
| Educational Attainment | Male Income | Female Income |
| Less than High School | $32,500 | $28,138 |
| High School Diploma | $48,705 | $29,911 |
| College or Associate's Degree | $46,011 | $27,528 |
| Bachelor's Degree | $57,708 | $40,489 |
| Graduate Degree | $75,658 | $54,271 |
| Total | $46,365 | $29,300 |
Family Income in Coos Bay
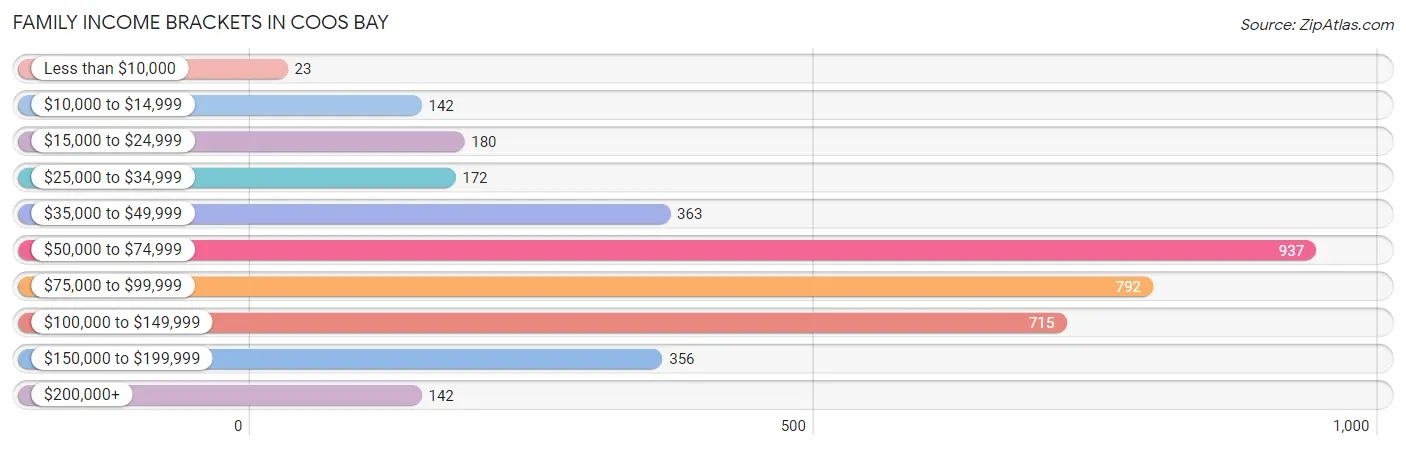
Family Income Brackets in Coos Bay
According to the Coos Bay family income data, there are 937 families falling into the $50,000 to $74,999 income range, which is the most common income bracket and makes up 24.5% of all families. Conversely, the less than $10,000 income bracket is the least frequent group with only 23 families (0.6%) belonging to this category.
| Income Bracket | # Families | % Families |
| Less than $10,000 | 23 | 0.6% |
| $10,000 to $14,999 | 142 | 3.7% |
| $15,000 to $24,999 | 180 | 4.7% |
| $25,000 to $34,999 | 172 | 4.5% |
| $35,000 to $49,999 | 363 | 9.5% |
| $50,000 to $74,999 | 937 | 24.5% |
| $75,000 to $99,999 | 792 | 20.7% |
| $100,000 to $149,999 | 715 | 18.7% |
| $150,000 to $199,999 | 356 | 9.3% |
| $200,000+ | 142 | 3.7% |
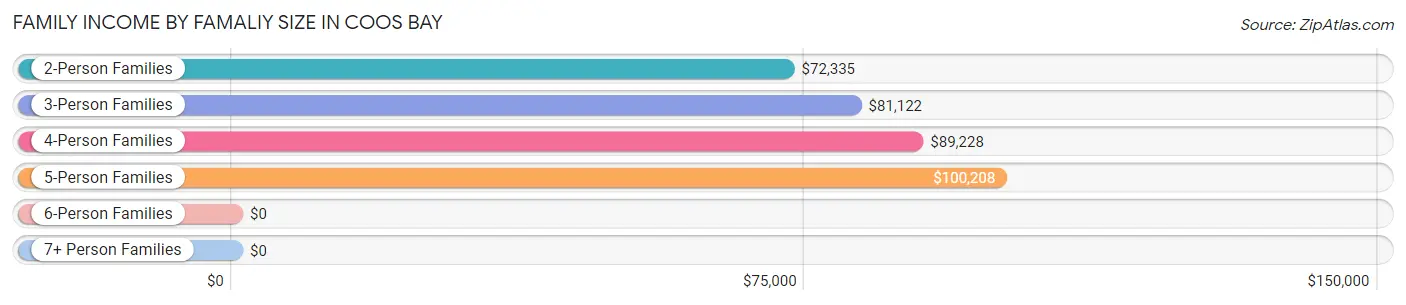
Family Income by Famaliy Size in Coos Bay
5-person families (177 | 4.6%) account for the highest median family income in Coos Bay with $100,208 per family, while 2-person families (2,173 | 56.8%) have the highest median income of $36,168 per family member.
| Income Bracket | # Families | Median Income |
| 2-Person Families | 2,173 (56.8%) | $72,335 |
| 3-Person Families | 946 (24.7%) | $81,122 |
| 4-Person Families | 437 (11.4%) | $89,228 |
| 5-Person Families | 177 (4.6%) | $100,208 |
| 6-Person Families | 73 (1.9%) | $0 |
| 7+ Person Families | 19 (0.5%) | $0 |
| Total | 3,825 (100.0%) | $79,327 |
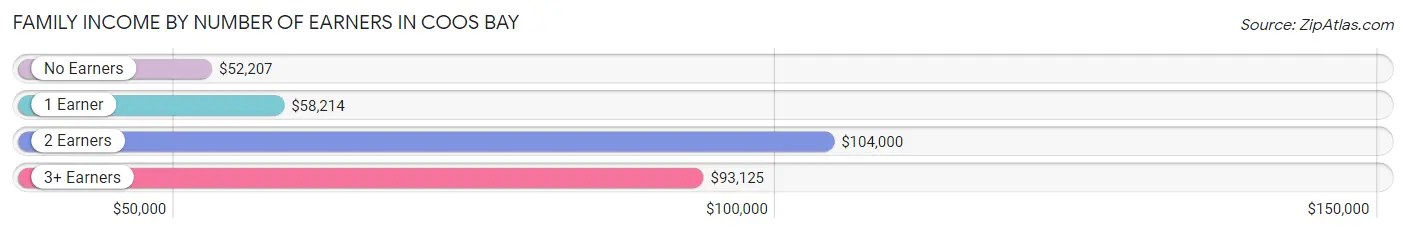
Family Income by Number of Earners in Coos Bay
The median family income in Coos Bay is $79,327, with families comprising 2 earners (1,342) having the highest median family income of $104,000, while families with no earners (906) have the lowest median family income of $52,207, accounting for 35.1% and 23.7% of families, respectively.
| Number of Earners | # Families | Median Income |
| No Earners | 906 (23.7%) | $52,207 |
| 1 Earner | 1,202 (31.4%) | $58,214 |
| 2 Earners | 1,342 (35.1%) | $104,000 |
| 3+ Earners | 375 (9.8%) | $93,125 |
| Total | 3,825 (100.0%) | $79,327 |
Household Income in Coos Bay
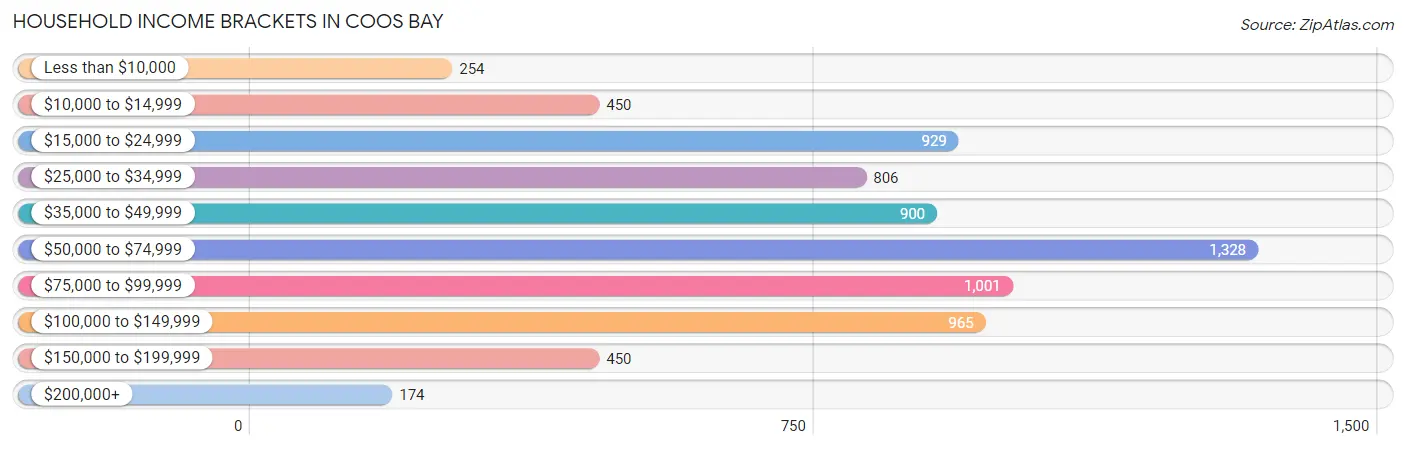
Household Income Brackets in Coos Bay
With 1,328 households falling in the category, the $50,000 to $74,999 income range is the most frequent in Coos Bay, accounting for 18.3% of all households. In contrast, only 174 households (2.4%) fall into the $200,000+ income bracket, making it the least populous group.
| Income Bracket | # Households | % Households |
| Less than $10,000 | 254 | 3.5% |
| $10,000 to $14,999 | 450 | 6.2% |
| $15,000 to $24,999 | 929 | 12.8% |
| $25,000 to $34,999 | 806 | 11.1% |
| $35,000 to $49,999 | 900 | 12.4% |
| $50,000 to $74,999 | 1,328 | 18.3% |
| $75,000 to $99,999 | 1,001 | 13.8% |
| $100,000 to $149,999 | 965 | 13.3% |
| $150,000 to $199,999 | 450 | 6.2% |
| $200,000+ | 174 | 2.4% |
Household Income by Householder Age in Coos Bay
The median household income in Coos Bay is $53,331, with the highest median household income of $68,621 found in the 45 to 64 years age bracket for the primary householder. A total of 2,106 households (29.0%) fall into this category. Meanwhile, the 65+ years age bracket for the primary householder has the lowest median household income of $42,757, with 2,723 households (37.5%) in this group.
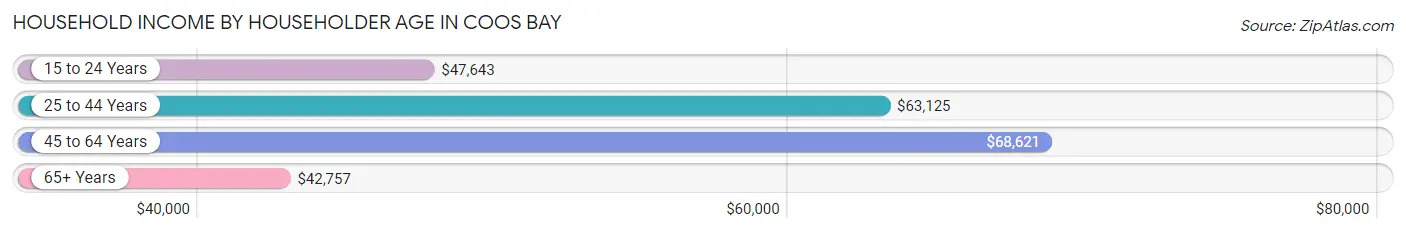
| Income Bracket | # Households | Median Income |
| 15 to 24 Years | 416 (5.7%) | $47,643 |
| 25 to 44 Years | 2,012 (27.7%) | $63,125 |
| 45 to 64 Years | 2,106 (29.0%) | $68,621 |
| 65+ Years | 2,723 (37.5%) | $42,757 |
| Total | 7,257 (100.0%) | $53,331 |
Poverty in Coos Bay
Income Below Poverty by Sex and Age in Coos Bay
With 11.9% poverty level for males and 17.1% for females among the residents of Coos Bay, 6 to 11 year old males and 5 year old females are the most vulnerable to poverty, with 131 males (24.4%) and 20 females (100.0%) in their respective age groups living below the poverty level.
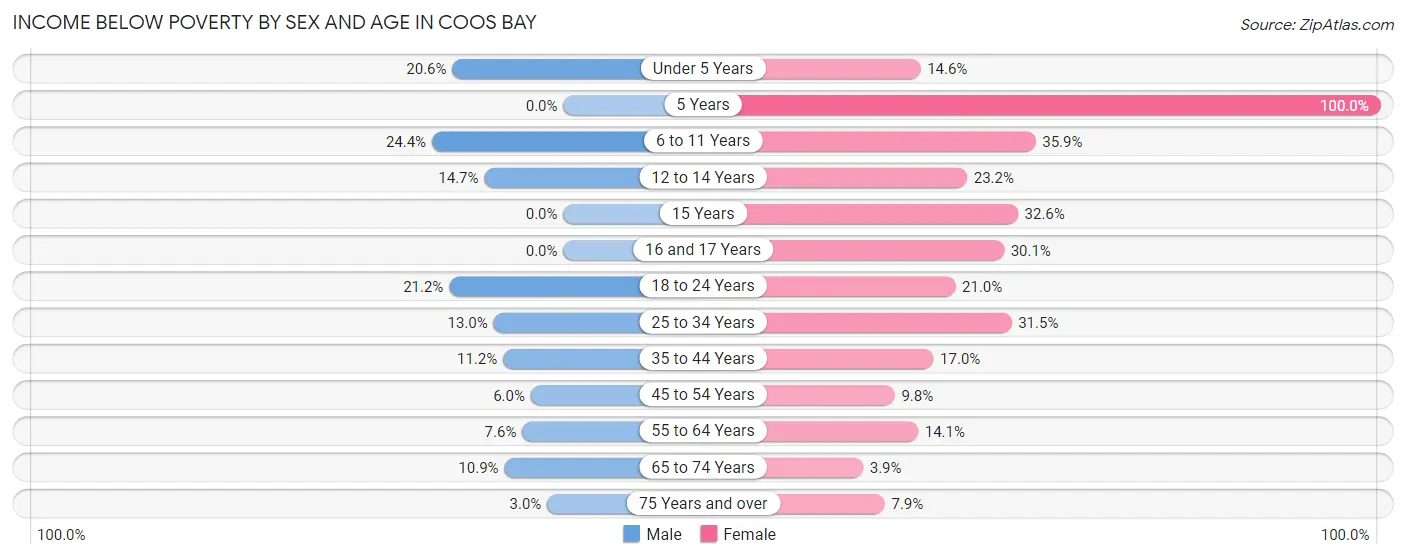
| Age Bracket | Male | Female |
| Under 5 Years | 76 (20.6%) | 88 (14.5%) |
| 5 Years | 0 (0.0%) | 20 (100.0%) |
| 6 to 11 Years | 131 (24.4%) | 176 (35.9%) |
| 12 to 14 Years | 17 (14.7%) | 84 (23.2%) |
| 15 Years | 0 (0.0%) | 31 (32.6%) |
| 16 and 17 Years | 0 (0.0%) | 61 (30.0%) |
| 18 to 24 Years | 168 (21.2%) | 147 (21.0%) |
| 25 to 34 Years | 150 (13.0%) | 307 (31.5%) |
| 35 to 44 Years | 97 (11.2%) | 147 (17.0%) |
| 45 to 54 Years | 51 (6.0%) | 70 (9.8%) |
| 55 to 64 Years | 79 (7.6%) | 149 (14.1%) |
| 65 to 74 Years | 111 (10.9%) | 44 (3.9%) |
| 75 Years and over | 21 (3.0%) | 78 (7.9%) |
| Total | 901 (11.9%) | 1,402 (17.1%) |
Income Above Poverty by Sex and Age in Coos Bay
According to the poverty statistics in Coos Bay, males aged 5 years and females aged 65 to 74 years are the age groups that are most secure financially, with 100.0% of males and 96.1% of females in these age groups living above the poverty line.
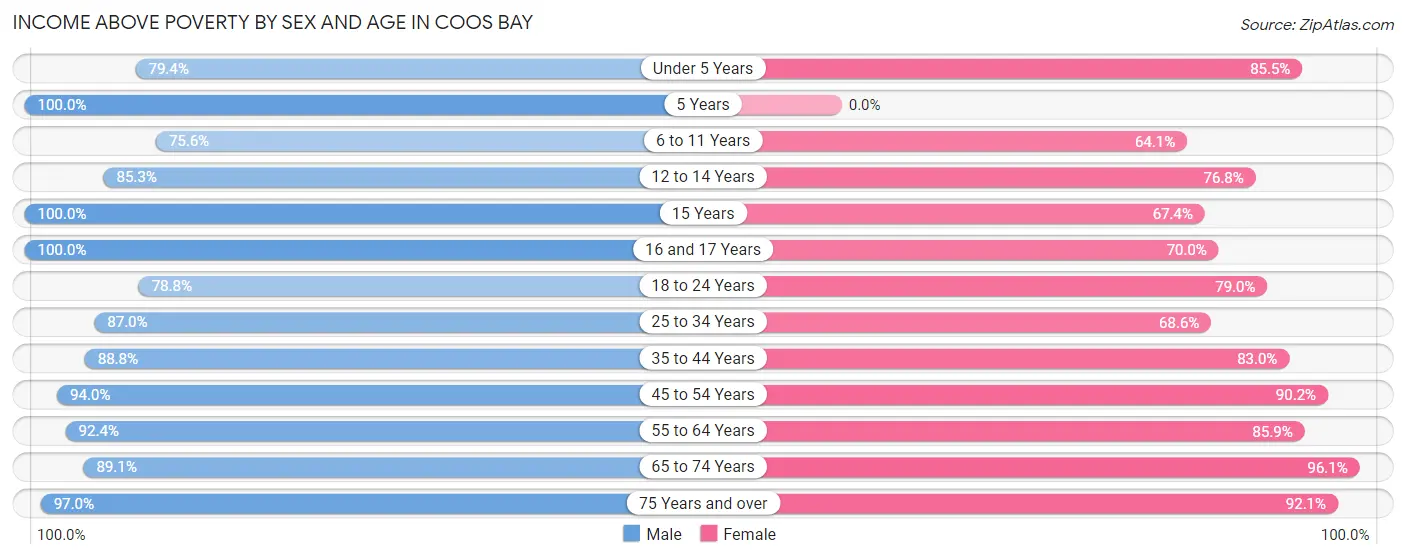
| Age Bracket | Male | Female |
| Under 5 Years | 293 (79.4%) | 517 (85.5%) |
| 5 Years | 8 (100.0%) | 0 (0.0%) |
| 6 to 11 Years | 406 (75.6%) | 314 (64.1%) |
| 12 to 14 Years | 99 (85.3%) | 278 (76.8%) |
| 15 Years | 31 (100.0%) | 64 (67.4%) |
| 16 and 17 Years | 115 (100.0%) | 142 (70.0%) |
| 18 to 24 Years | 625 (78.8%) | 552 (79.0%) |
| 25 to 34 Years | 1,007 (87.0%) | 669 (68.5%) |
| 35 to 44 Years | 771 (88.8%) | 720 (83.0%) |
| 45 to 54 Years | 793 (94.0%) | 646 (90.2%) |
| 55 to 64 Years | 957 (92.4%) | 908 (85.9%) |
| 65 to 74 Years | 904 (89.1%) | 1,085 (96.1%) |
| 75 Years and over | 678 (97.0%) | 906 (92.1%) |
| Total | 6,687 (88.1%) | 6,801 (82.9%) |
Income Below Poverty Among Married-Couple Families in Coos Bay
The poverty statistics for married-couple families in Coos Bay show that 2.5% or 61 of the total 2,441 families live below the poverty line. Families with 1 or 2 children have the highest poverty rate of 6.2%, comprising of 34 families. On the other hand, families with 3 or 4 children have the lowest poverty rate of 0.0%, which includes 0 families.
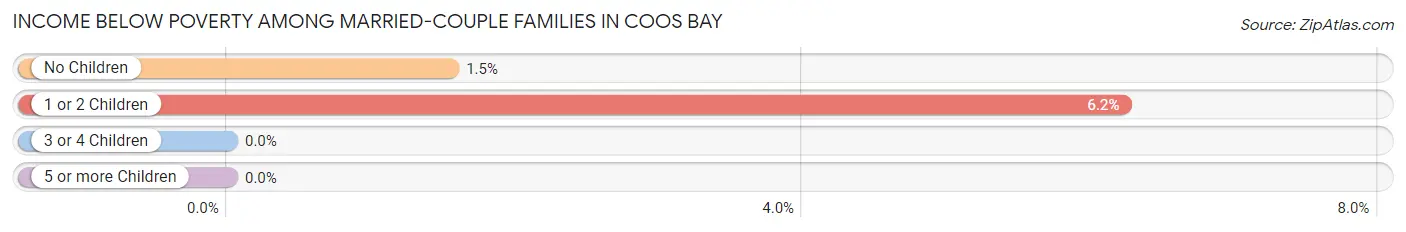
| Children | Above Poverty | Below Poverty |
| No Children | 1,722 (98.5%) | 27 (1.5%) |
| 1 or 2 Children | 513 (93.8%) | 34 (6.2%) |
| 3 or 4 Children | 145 (100.0%) | 0 (0.0%) |
| 5 or more Children | 0 (0.0%) | 0 (0.0%) |
| Total | 2,380 (97.5%) | 61 (2.5%) |
Income Below Poverty Among Single-Parent Households in Coos Bay
According to the poverty data in Coos Bay, 6.2% or 32 single-father households and 26.6% or 232 single-mother households are living below the poverty line. Among single-father households, those with no children have the highest poverty rate, with 12 households (7.9%) experiencing poverty. Likewise, among single-mother households, those with 3 or 4 children have the highest poverty rate, with 39 households (100.0%) falling below the poverty line.
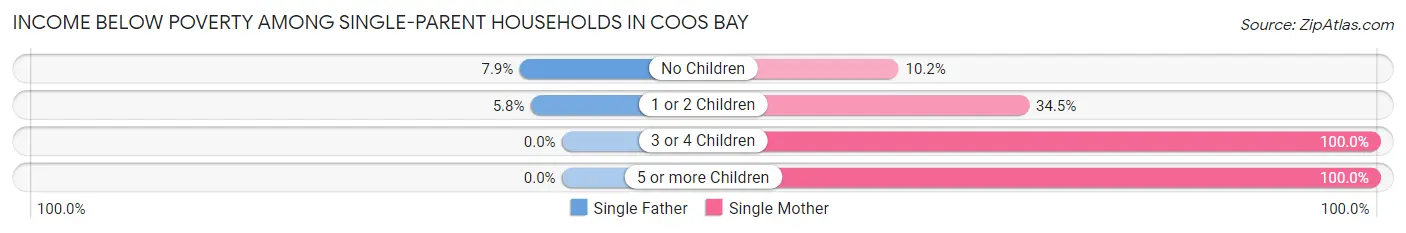
| Children | Single Father | Single Mother |
| No Children | 12 (7.9%) | 52 (10.2%) |
| 1 or 2 Children | 20 (5.8%) | 96 (34.5%) |
| 3 or 4 Children | 0 (0.0%) | 39 (100.0%) |
| 5 or more Children | 0 (0.0%) | 45 (100.0%) |
| Total | 32 (6.2%) | 232 (26.6%) |
Income Below Poverty Among Married-Couple vs Single-Parent Households in Coos Bay
The poverty data for Coos Bay shows that 61 of the married-couple family households (2.5%) and 264 of the single-parent households (19.1%) are living below the poverty level. Within the married-couple family households, those with 1 or 2 children have the highest poverty rate, with 34 households (6.2%) falling below the poverty line. Among the single-parent households, those with 5 or more children have the highest poverty rate, with 45 household (100.0%) living below poverty.
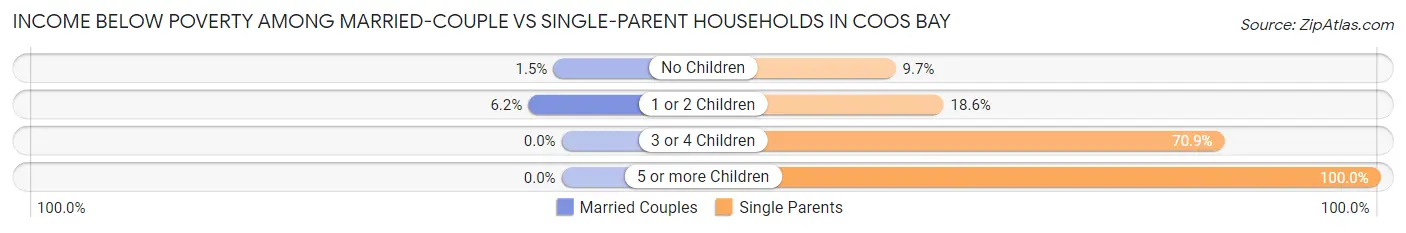
| Children | Married-Couple Families | Single-Parent Households |
| No Children | 27 (1.5%) | 64 (9.7%) |
| 1 or 2 Children | 34 (6.2%) | 116 (18.6%) |
| 3 or 4 Children | 0 (0.0%) | 39 (70.9%) |
| 5 or more Children | 0 (0.0%) | 45 (100.0%) |
| Total | 61 (2.5%) | 264 (19.1%) |
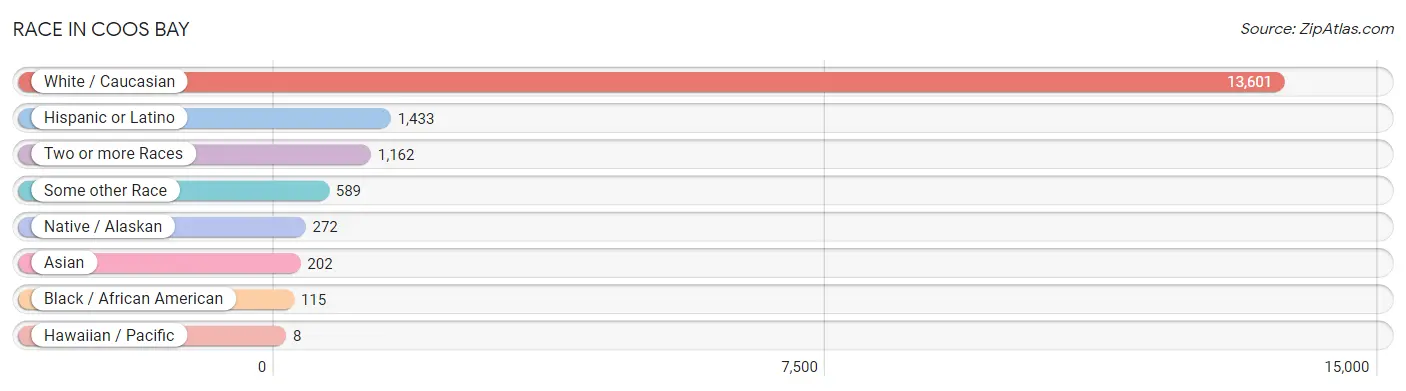
Race in Coos Bay
The most populous races in Coos Bay are White / Caucasian (13,601 | 85.3%), Hispanic or Latino (1,433 | 9.0%), and Two or more Races (1,162 | 7.3%).
| Race | # Population | % Population |
| Asian | 202 | 1.3% |
| Black / African American | 115 | 0.7% |
| Hawaiian / Pacific | 8 | 0.1% |
| Hispanic or Latino | 1,433 | 9.0% |
| Native / Alaskan | 272 | 1.7% |
| White / Caucasian | 13,601 | 85.3% |
| Two or more Races | 1,162 | 7.3% |
| Some other Race | 589 | 3.7% |
| Total | 15,949 | 100.0% |
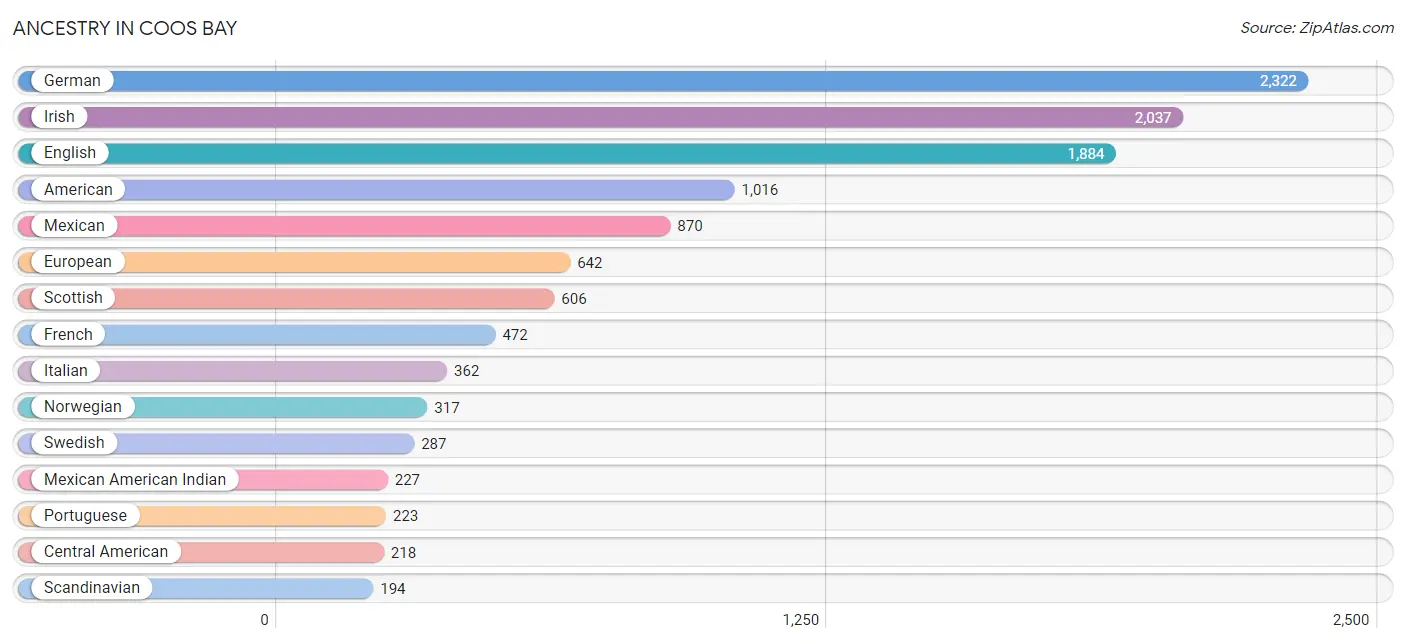
Ancestry in Coos Bay
The most populous ancestries reported in Coos Bay are German (2,322 | 14.6%), Irish (2,037 | 12.8%), English (1,884 | 11.8%), American (1,016 | 6.4%), and Mexican (870 | 5.4%), together accounting for 51.0% of all Coos Bay residents.
| Ancestry | # Population | % Population |
| African | 18 | 0.1% |
| American | 1,016 | 6.4% |
| Arab | 90 | 0.6% |
| Austrian | 8 | 0.1% |
| Basque | 50 | 0.3% |
| Belgian | 43 | 0.3% |
| Bhutanese | 55 | 0.3% |
| British | 161 | 1.0% |
| Burmese | 16 | 0.1% |
| Canadian | 23 | 0.1% |
| Central American | 218 | 1.4% |
| Cherokee | 120 | 0.7% |
| Chickasaw | 26 | 0.2% |
| Chippewa | 36 | 0.2% |
| Choctaw | 49 | 0.3% |
| Colombian | 9 | 0.1% |
| Cuban | 92 | 0.6% |
| Czech | 54 | 0.3% |
| Danish | 140 | 0.9% |
| Dutch | 168 | 1.1% |
| English | 1,884 | 11.8% |
| European | 642 | 4.0% |
| Finnish | 82 | 0.5% |
| French | 472 | 3.0% |
| French American Indian | 44 | 0.3% |
| French Canadian | 22 | 0.1% |
| German | 2,322 | 14.6% |
| Greek | 44 | 0.3% |
| Guatemalan | 160 | 1.0% |
| Honduran | 58 | 0.4% |
| Hungarian | 41 | 0.3% |
| Indian (Asian) | 39 | 0.2% |
| Irish | 2,037 | 12.8% |
| Italian | 362 | 2.3% |
| Jamaican | 11 | 0.1% |
| Korean | 100 | 0.6% |
| Latvian | 7 | 0.0% |
| Lebanese | 90 | 0.6% |
| Malaysian | 3 | 0.0% |
| Mexican | 870 | 5.4% |
| Mexican American Indian | 227 | 1.4% |
| Native Hawaiian | 42 | 0.3% |
| Navajo | 14 | 0.1% |
| Northern European | 17 | 0.1% |
| Norwegian | 317 | 2.0% |
| Pakistani | 34 | 0.2% |
| Paraguayan | 24 | 0.2% |
| Polish | 175 | 1.1% |
| Portuguese | 223 | 1.4% |
| Puerto Rican | 13 | 0.1% |
| Russian | 38 | 0.2% |
| Scandinavian | 194 | 1.2% |
| Scotch-Irish | 128 | 0.8% |
| Scottish | 606 | 3.8% |
| Seminole | 21 | 0.1% |
| Serbian | 10 | 0.1% |
| Sioux | 59 | 0.4% |
| Slavic | 9 | 0.1% |
| South American | 33 | 0.2% |
| Spaniard | 194 | 1.2% |
| Spanish | 13 | 0.1% |
| Sri Lankan | 76 | 0.5% |
| Subsaharan African | 18 | 0.1% |
| Swedish | 287 | 1.8% |
| Swiss | 51 | 0.3% |
| Thai | 120 | 0.7% |
| Tlingit-Haida | 10 | 0.1% |
| Trinidadian and Tobagonian | 25 | 0.2% |
| Ukrainian | 16 | 0.1% |
| Welsh | 115 | 0.7% |
| Yaqui | 11 | 0.1% | View All 71 Rows |
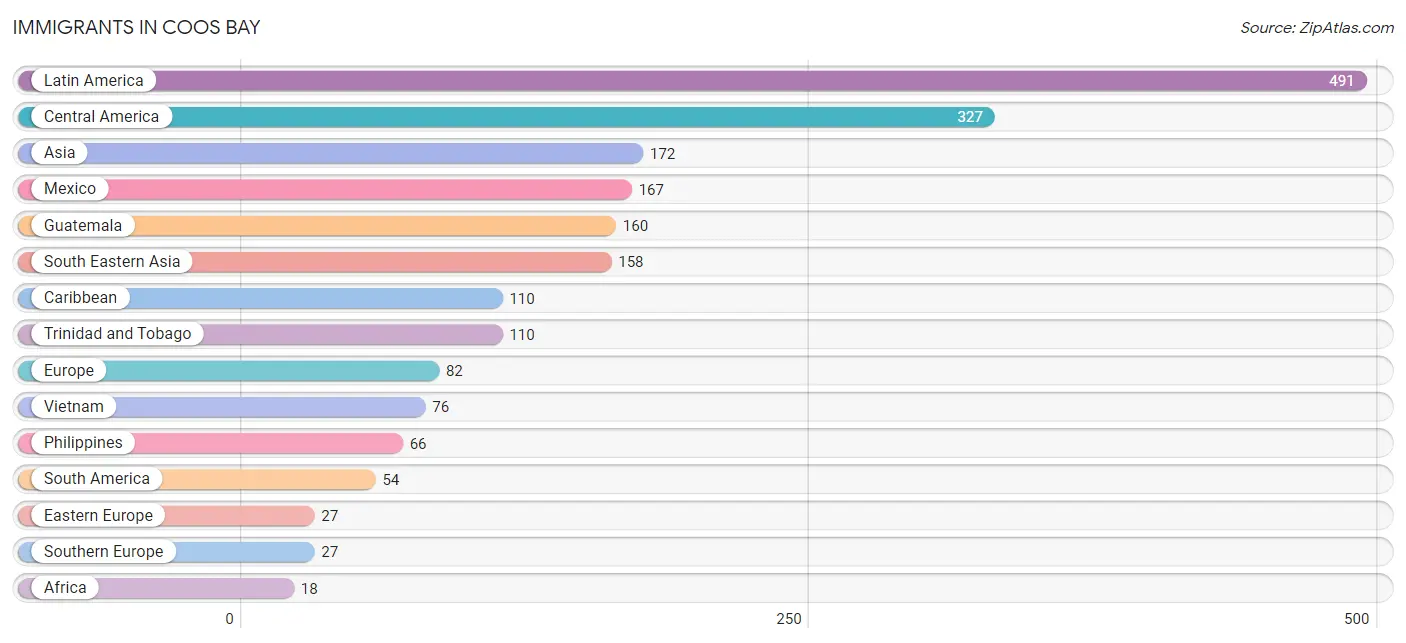
Immigrants in Coos Bay
The most numerous immigrant groups reported in Coos Bay came from Latin America (491 | 3.1%), Central America (327 | 2.1%), Asia (172 | 1.1%), Mexico (167 | 1.1%), and Guatemala (160 | 1.0%), together accounting for 8.3% of all Coos Bay residents.
| Immigration Origin | # Population | % Population |
| Africa | 18 | 0.1% |
| Argentina | 17 | 0.1% |
| Asia | 172 | 1.1% |
| Caribbean | 110 | 0.7% |
| Central America | 327 | 2.1% |
| Colombia | 9 | 0.1% |
| Eastern Africa | 18 | 0.1% |
| Eastern Asia | 14 | 0.1% |
| Eastern Europe | 27 | 0.2% |
| Ecuador | 4 | 0.0% |
| Europe | 82 | 0.5% |
| Germany | 12 | 0.1% |
| Greece | 15 | 0.1% |
| Guatemala | 160 | 1.0% |
| Italy | 12 | 0.1% |
| Korea | 14 | 0.1% |
| Laos | 3 | 0.0% |
| Latin America | 491 | 3.1% |
| Mexico | 167 | 1.1% |
| Northern Europe | 16 | 0.1% |
| Philippines | 66 | 0.4% |
| Russia | 11 | 0.1% |
| South America | 54 | 0.3% |
| South Eastern Asia | 158 | 1.0% |
| Southern Europe | 27 | 0.2% |
| Thailand | 13 | 0.1% |
| Trinidad and Tobago | 110 | 0.7% |
| Ukraine | 16 | 0.1% |
| Vietnam | 76 | 0.5% |
| Western Europe | 12 | 0.1% |
| Zimbabwe | 18 | 0.1% | View All 31 Rows |
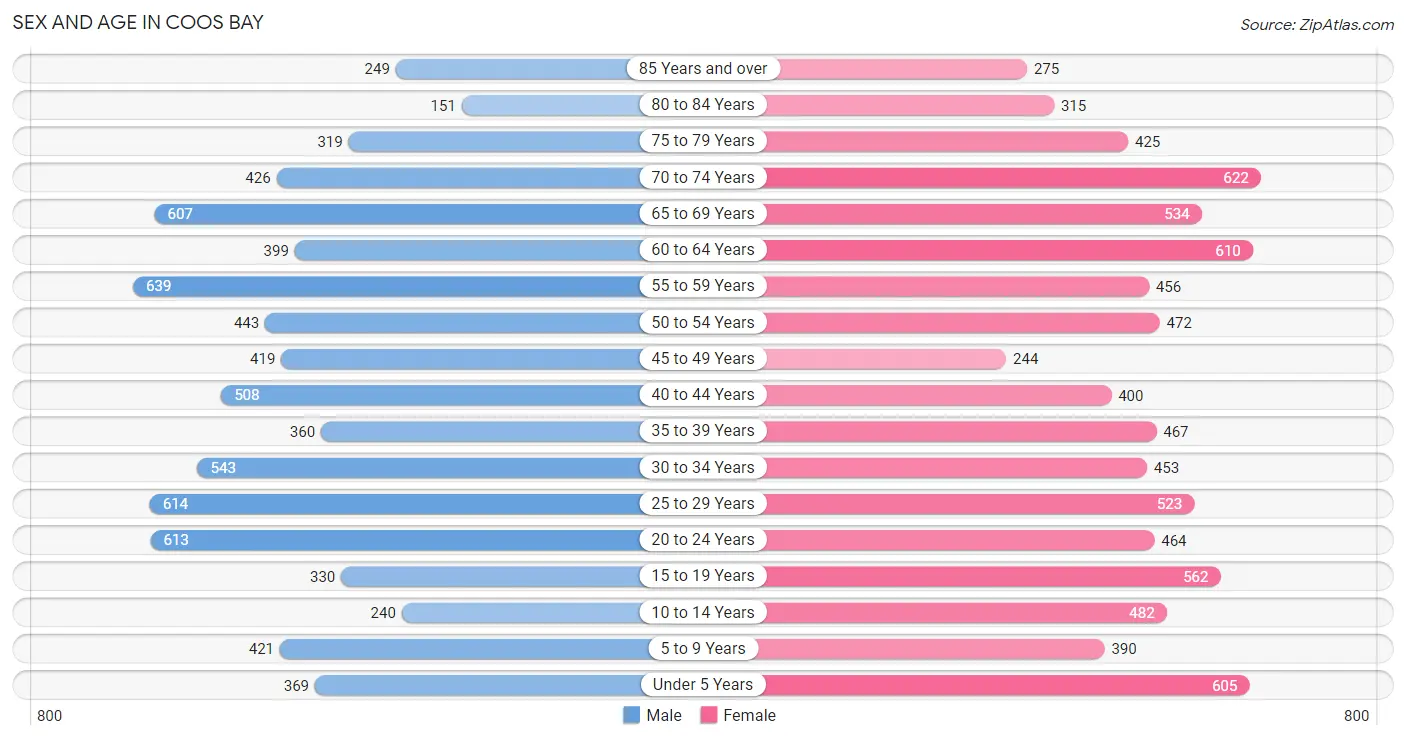
Sex and Age in Coos Bay
Sex and Age in Coos Bay
The most populous age groups in Coos Bay are 55 to 59 Years (639 | 8.4%) for men and 70 to 74 Years (622 | 7.5%) for women.
| Age Bracket | Male | Female |
| Under 5 Years | 369 (4.8%) | 605 (7.3%) |
| 5 to 9 Years | 421 (5.5%) | 390 (4.7%) |
| 10 to 14 Years | 240 (3.1%) | 482 (5.8%) |
| 15 to 19 Years | 330 (4.3%) | 562 (6.8%) |
| 20 to 24 Years | 613 (8.0%) | 464 (5.6%) |
| 25 to 29 Years | 614 (8.0%) | 523 (6.3%) |
| 30 to 34 Years | 543 (7.1%) | 453 (5.5%) |
| 35 to 39 Years | 360 (4.7%) | 467 (5.6%) |
| 40 to 44 Years | 508 (6.6%) | 400 (4.8%) |
| 45 to 49 Years | 419 (5.5%) | 244 (2.9%) |
| 50 to 54 Years | 443 (5.8%) | 472 (5.7%) |
| 55 to 59 Years | 639 (8.4%) | 456 (5.5%) |
| 60 to 64 Years | 399 (5.2%) | 610 (7.3%) |
| 65 to 69 Years | 607 (7.9%) | 534 (6.4%) |
| 70 to 74 Years | 426 (5.6%) | 622 (7.5%) |
| 75 to 79 Years | 319 (4.2%) | 425 (5.1%) |
| 80 to 84 Years | 151 (2.0%) | 315 (3.8%) |
| 85 Years and over | 249 (3.3%) | 275 (3.3%) |
| Total | 7,650 (100.0%) | 8,299 (100.0%) |
Families and Households in Coos Bay
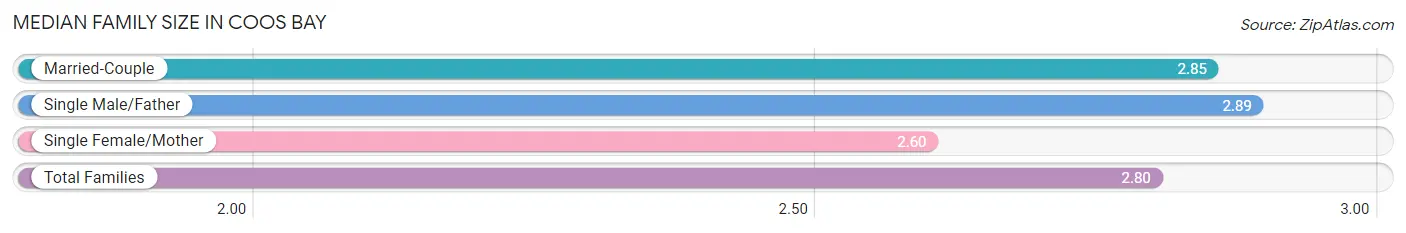
Median Family Size in Coos Bay
The median family size in Coos Bay is 2.80 persons per family, with single male/father families (513 | 13.4%) accounting for the largest median family size of 2.89 persons per family. On the other hand, single female/mother families (871 | 22.8%) represent the smallest median family size with 2.60 persons per family.
| Family Type | # Families | Family Size |
| Married-Couple | 2,441 (63.8%) | 2.85 |
| Single Male/Father | 513 (13.4%) | 2.89 |
| Single Female/Mother | 871 (22.8%) | 2.60 |
| Total Families | 3,825 (100.0%) | 2.80 |
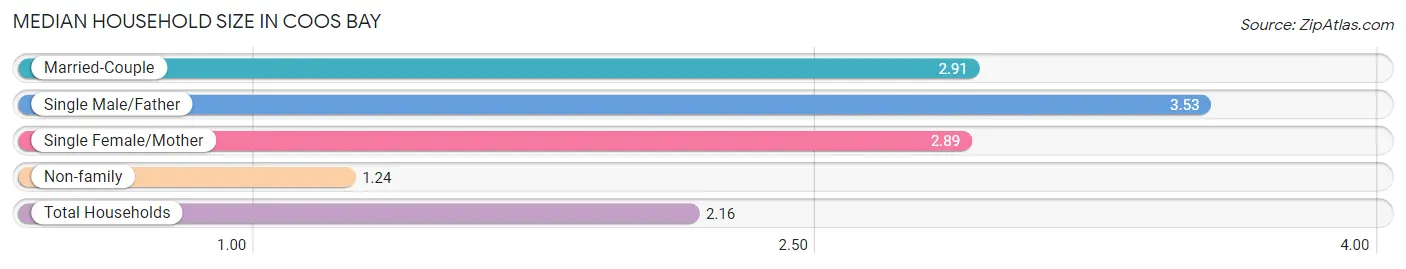
Median Household Size in Coos Bay
The median household size in Coos Bay is 2.16 persons per household, with single male/father households (513 | 7.1%) accounting for the largest median household size of 3.53 persons per household. non-family households (3,432 | 47.3%) represent the smallest median household size with 1.24 persons per household.
| Household Type | # Households | Household Size |
| Married-Couple | 2,441 (33.6%) | 2.91 |
| Single Male/Father | 513 (7.1%) | 3.53 |
| Single Female/Mother | 871 (12.0%) | 2.89 |
| Non-family | 3,432 (47.3%) | 1.24 |
| Total Households | 7,257 (100.0%) | 2.16 |
Household Size by Marriage Status in Coos Bay
Out of a total of 7,257 households in Coos Bay, 3,825 (52.7%) are family households, while 3,432 (47.3%) are nonfamily households. The most numerous type of family households are 2-person households, comprising 1,914, and the most common type of nonfamily households are 1-person households, comprising 2,646.
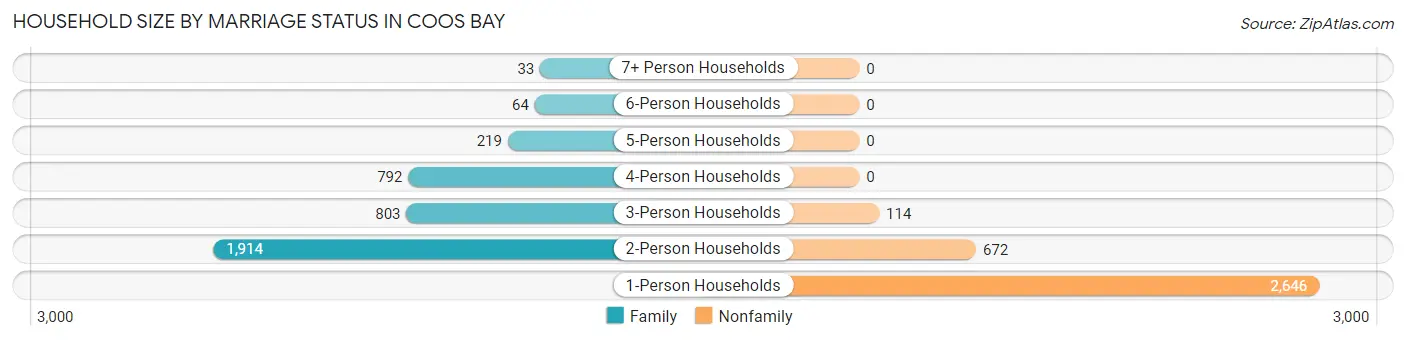
| Household Size | Family Households | Nonfamily Households |
| 1-Person Households | - | 2,646 (36.5%) |
| 2-Person Households | 1,914 (26.4%) | 672 (9.3%) |
| 3-Person Households | 803 (11.1%) | 114 (1.6%) |
| 4-Person Households | 792 (10.9%) | 0 (0.0%) |
| 5-Person Households | 219 (3.0%) | 0 (0.0%) |
| 6-Person Households | 64 (0.9%) | 0 (0.0%) |
| 7+ Person Households | 33 (0.4%) | 0 (0.0%) |
| Total | 3,825 (52.7%) | 3,432 (47.3%) |
Female Fertility in Coos Bay
Fertility by Age in Coos Bay
Average fertility rate in Coos Bay is 32.0 births per 1,000 women. Women in the age bracket of 20 to 34 years have the highest fertility rate with 69.0 births per 1,000 women. Women in the age bracket of 20 to 34 years acount for 100.0% of all women with births.
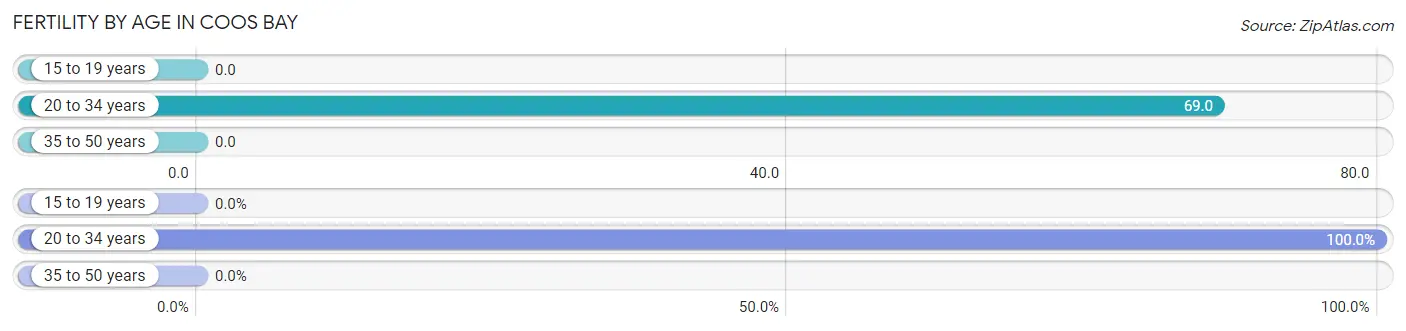
| Age Bracket | Women with Births | Births / 1,000 Women |
| 15 to 19 years | 0 (0.0%) | 0.0 |
| 20 to 34 years | 100 (100.0%) | 69.0 |
| 35 to 50 years | 0 (0.0%) | 0.0 |
| Total | 100 (100.0%) | 32.0 |
Fertility by Age by Marriage Status in Coos Bay
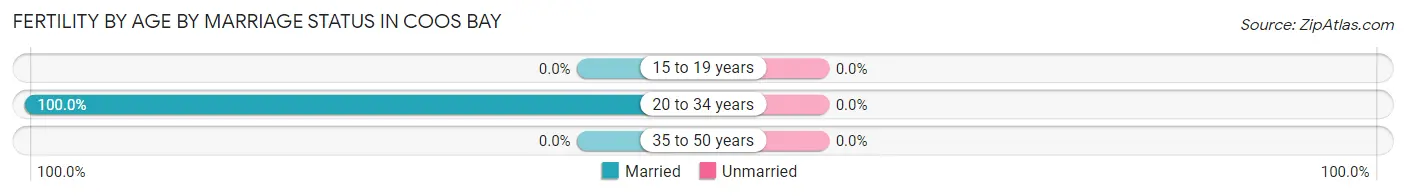
| Age Bracket | Married | Unmarried |
| 15 to 19 years | 0 (0.0%) | 0 (0.0%) |
| 20 to 34 years | 100 (100.0%) | 0 (0.0%) |
| 35 to 50 years | 0 (0.0%) | 0 (0.0%) |
| Total | 100 (100.0%) | 0 (0.0%) |
Fertility by Education in Coos Bay
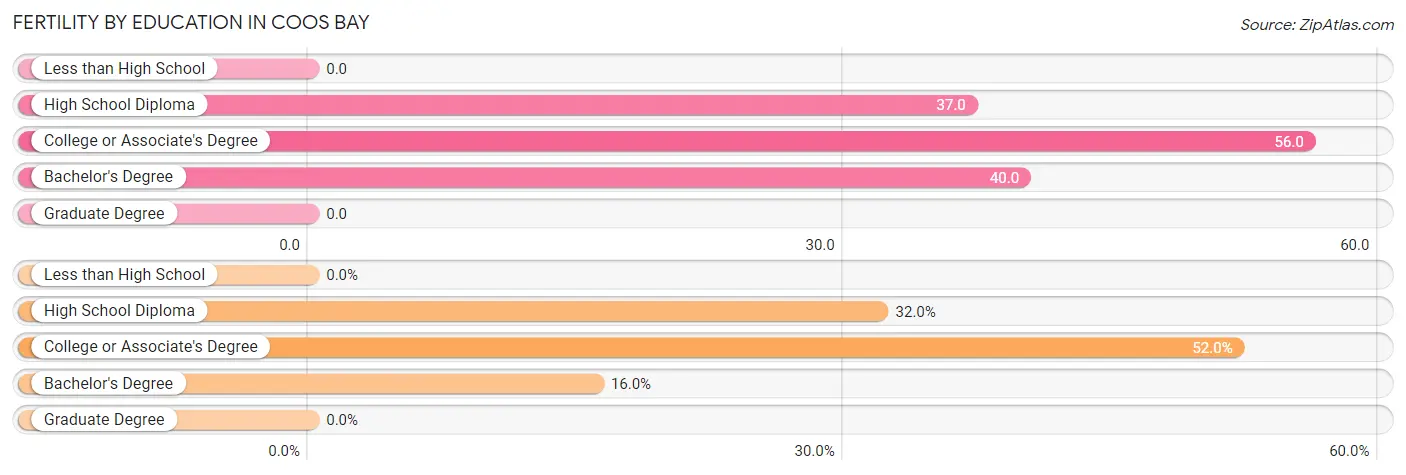
| Educational Attainment | Women with Births | Births / 1,000 Women |
| Less than High School | 0 (0.0%) | 0.0 |
| High School Diploma | 32 (32.0%) | 37.0 |
| College or Associate's Degree | 52 (52.0%) | 56.0 |
| Bachelor's Degree | 16 (16.0%) | 40.0 |
| Graduate Degree | 0 (0.0%) | 0.0 |
| Total | 100 (100.0%) | 32.0 |
Fertility by Education by Marriage Status in Coos Bay
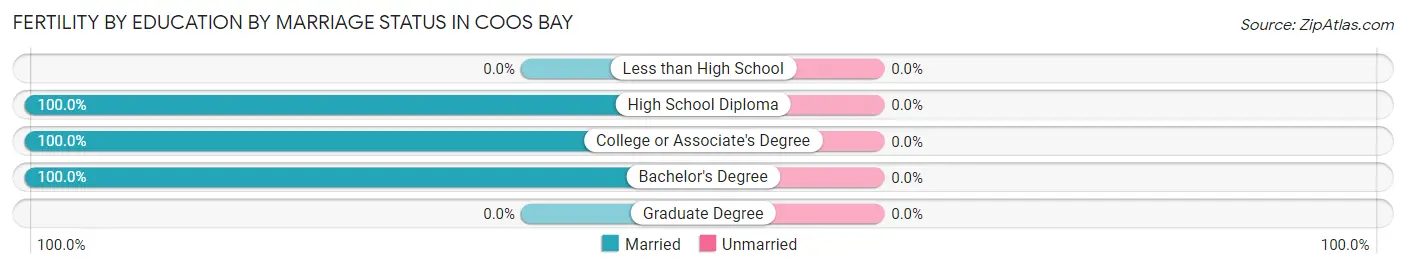
| Educational Attainment | Married | Unmarried |
| Less than High School | 0 (0.0%) | 0 (0.0%) |
| High School Diploma | 32 (100.0%) | 0 (0.0%) |
| College or Associate's Degree | 52 (100.0%) | 0 (0.0%) |
| Bachelor's Degree | 16 (100.0%) | 0 (0.0%) |
| Graduate Degree | 0 (0.0%) | 0 (0.0%) |
| Total | 100 (100.0%) | 0 (0.0%) |
Employment Characteristics in Coos Bay
Employment by Class of Employer in Coos Bay
Among the 7,172 employed individuals in Coos Bay, private company employees (4,635 | 64.6%), local government employees (621 | 8.7%), and not-for-profit organizations (573 | 8.0%) make up the most common classes of employment.
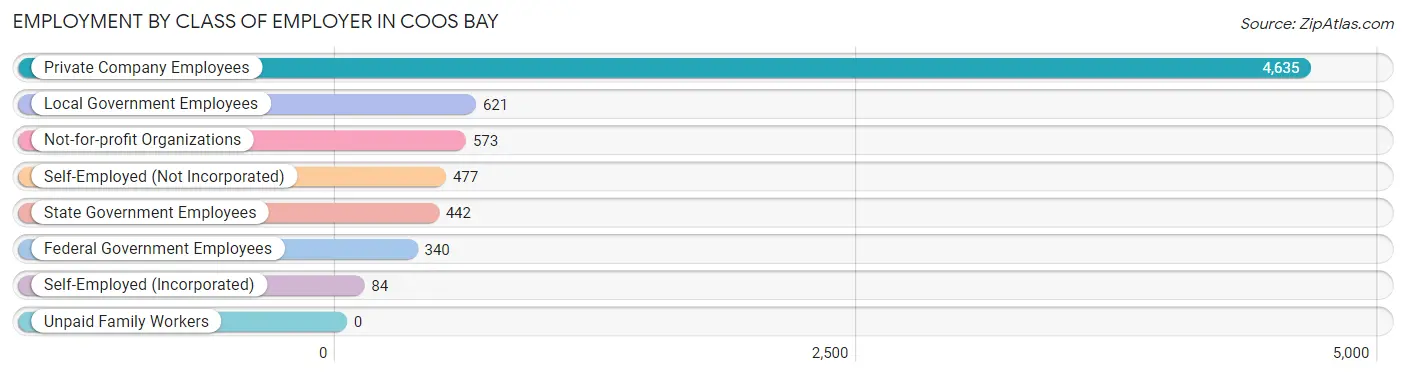
| Employer Class | # Employees | % Employees |
| Private Company Employees | 4,635 | 64.6% |
| Self-Employed (Incorporated) | 84 | 1.2% |
| Self-Employed (Not Incorporated) | 477 | 6.7% |
| Not-for-profit Organizations | 573 | 8.0% |
| Local Government Employees | 621 | 8.7% |
| State Government Employees | 442 | 6.2% |
| Federal Government Employees | 340 | 4.7% |
| Unpaid Family Workers | 0 | 0.0% |
| Total | 7,172 | 100.0% |
Employment Status by Age in Coos Bay
According to the labor force statistics for Coos Bay, out of the total population over 16 years of age (13,316), 57.6% or 7,670 individuals are in the labor force, with 4.8% or 368 of them unemployed. The age group with the highest labor force participation rate is 25 to 29 years, with 88.6% or 1,007 individuals in the labor force. Within the labor force, the 75 years and over age range has the highest percentage of unemployed individuals, with 64.5% or 128 of them being unemployed.
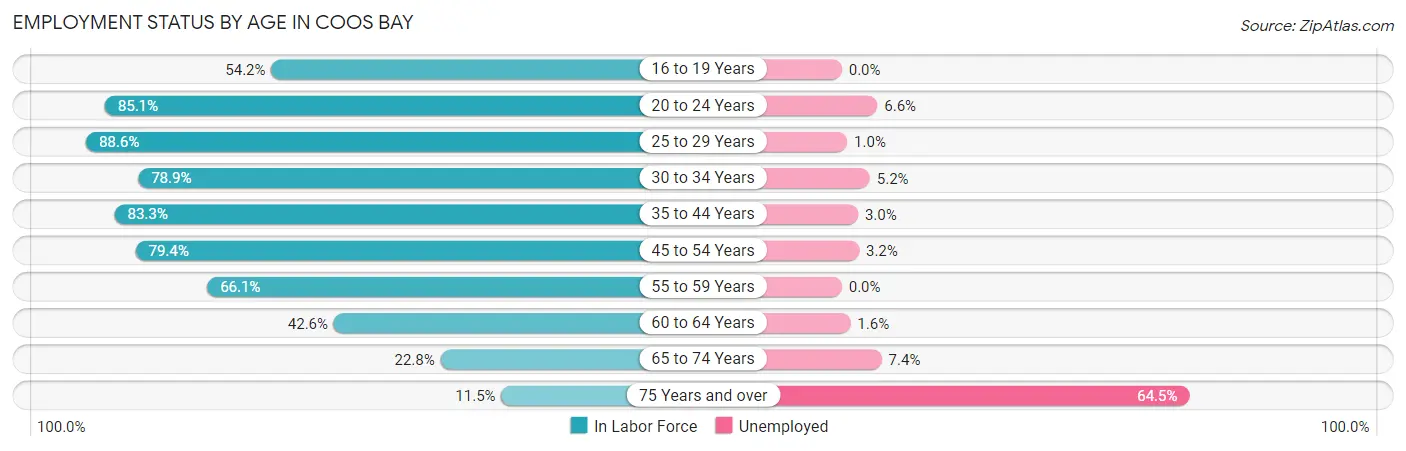
| Age Bracket | In Labor Force | Unemployed |
| 16 to 19 Years | 415 (54.2%) | 0 (0.0%) |
| 20 to 24 Years | 917 (85.1%) | 61 (6.6%) |
| 25 to 29 Years | 1,007 (88.6%) | 10 (1.0%) |
| 30 to 34 Years | 786 (78.9%) | 41 (5.2%) |
| 35 to 44 Years | 1,445 (83.3%) | 43 (3.0%) |
| 45 to 54 Years | 1,253 (79.4%) | 40 (3.2%) |
| 55 to 59 Years | 724 (66.1%) | 0 (0.0%) |
| 60 to 64 Years | 430 (42.6%) | 7 (1.6%) |
| 65 to 74 Years | 499 (22.8%) | 37 (7.4%) |
| 75 Years and over | 199 (11.5%) | 128 (64.5%) |
| Total | 7,670 (57.6%) | 368 (4.8%) |
Employment Status by Educational Attainment in Coos Bay
According to labor force statistics for Coos Bay, 74.8% of individuals (5,647) out of the total population between 25 and 64 years of age (7,550) are in the labor force, with 2.5% or 141 of them being unemployed. The group with the highest labor force participation rate are those with the educational attainment of bachelor's degree or higher, with 81.5% or 1,223 individuals in the labor force. Within the labor force, individuals with college / associate degree education have the highest percentage of unemployment, with 4.7% or 94 of them being unemployed.
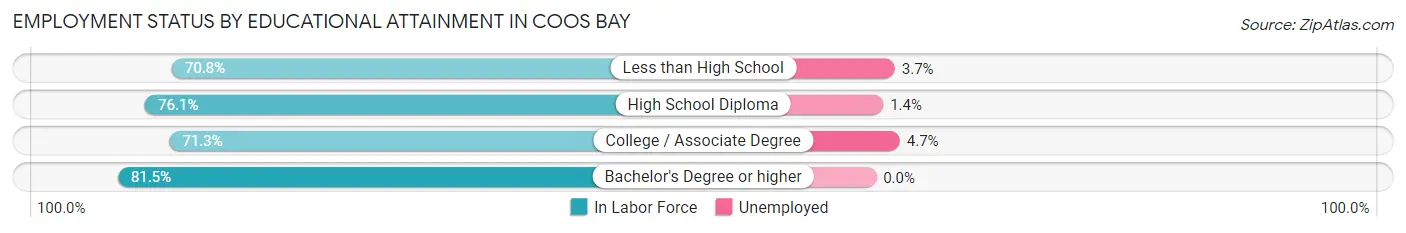
| Educational Attainment | In Labor Force | Unemployed |
| Less than High School | 599 (70.8%) | 31 (3.7%) |
| High School Diploma | 1,823 (76.1%) | 34 (1.4%) |
| College / Associate Degree | 2,001 (71.3%) | 132 (4.7%) |
| Bachelor's Degree or higher | 1,223 (81.5%) | 0 (0.0%) |
| Total | 5,647 (74.8%) | 189 (2.5%) |
Employment Occupations by Sex in Coos Bay
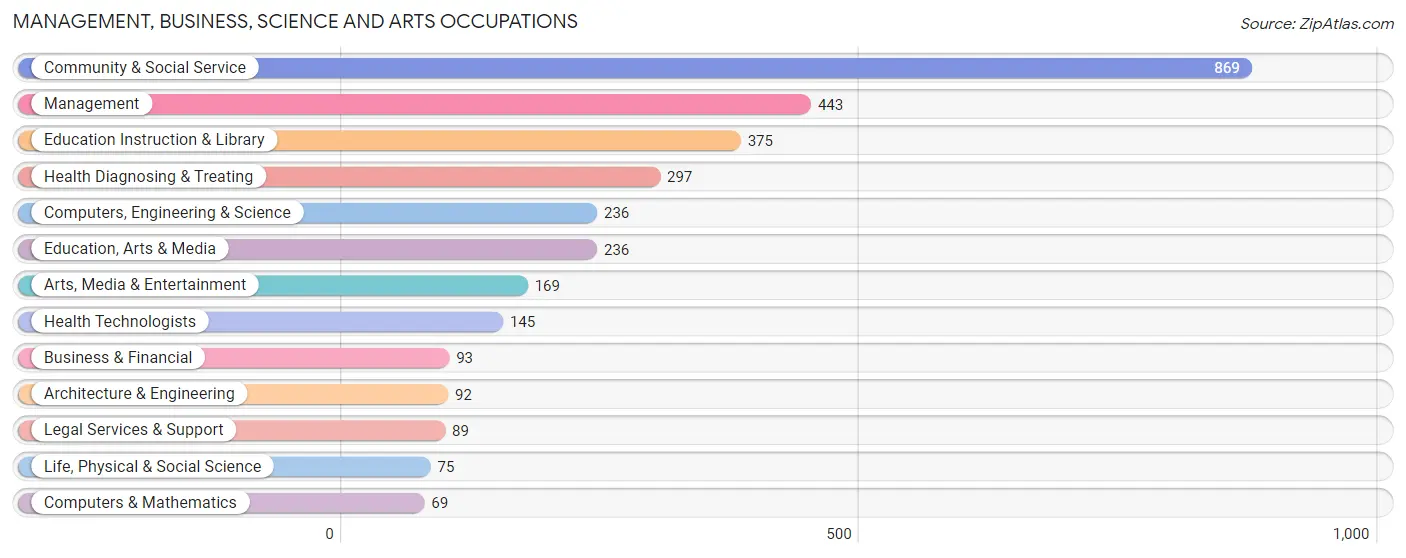
Management, Business, Science and Arts Occupations
The most common Management, Business, Science and Arts occupations in Coos Bay are Community & Social Service (869 | 12.0%), Management (443 | 6.1%), Education Instruction & Library (375 | 5.2%), Health Diagnosing & Treating (297 | 4.1%), and Computers, Engineering & Science (236 | 3.3%).
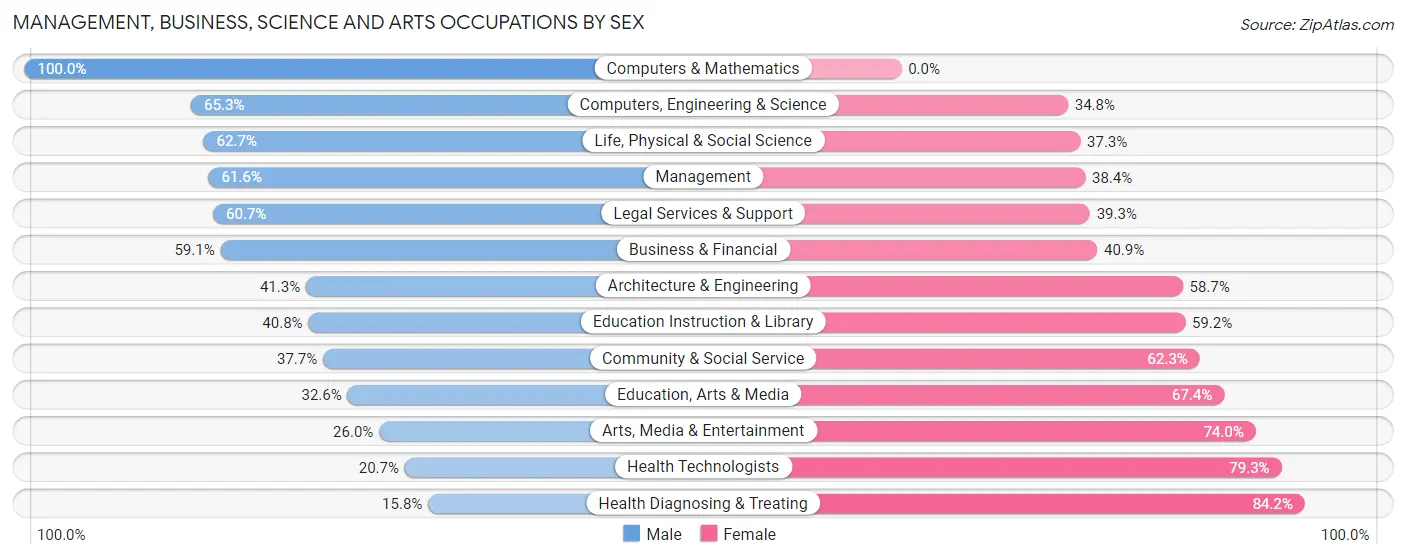
Management, Business, Science and Arts Occupations by Sex
Within the Management, Business, Science and Arts occupations in Coos Bay, the most male-oriented occupations are Computers & Mathematics (100.0%), Computers, Engineering & Science (65.2%), and Life, Physical & Social Science (62.7%), while the most female-oriented occupations are Health Diagnosing & Treating (84.2%), Health Technologists (79.3%), and Arts, Media & Entertainment (74.0%).
| Occupation | Male | Female |
| Management | 273 (61.6%) | 170 (38.4%) |
| Business & Financial | 55 (59.1%) | 38 (40.9%) |
| Computers, Engineering & Science | 154 (65.2%) | 82 (34.7%) |
| Computers & Mathematics | 69 (100.0%) | 0 (0.0%) |
| Architecture & Engineering | 38 (41.3%) | 54 (58.7%) |
| Life, Physical & Social Science | 47 (62.7%) | 28 (37.3%) |
| Community & Social Service | 328 (37.7%) | 541 (62.3%) |
| Education, Arts & Media | 77 (32.6%) | 159 (67.4%) |
| Legal Services & Support | 54 (60.7%) | 35 (39.3%) |
| Education Instruction & Library | 153 (40.8%) | 222 (59.2%) |
| Arts, Media & Entertainment | 44 (26.0%) | 125 (74.0%) |
| Health Diagnosing & Treating | 47 (15.8%) | 250 (84.2%) |
| Health Technologists | 30 (20.7%) | 115 (79.3%) |
| Total (Category) | 857 (44.2%) | 1,081 (55.8%) |
| Total (Overall) | 3,752 (51.8%) | 3,493 (48.2%) |
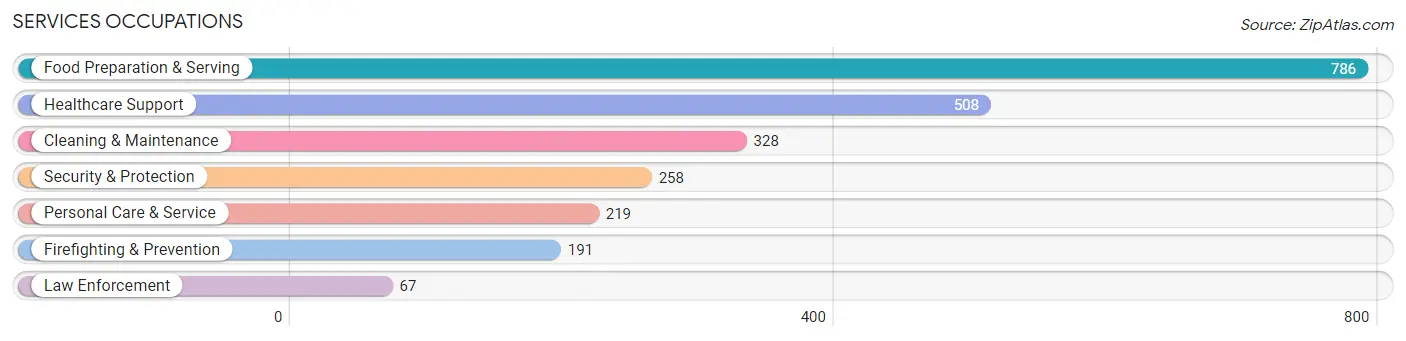
Services Occupations
The most common Services occupations in Coos Bay are Food Preparation & Serving (786 | 10.8%), Healthcare Support (508 | 7.0%), Cleaning & Maintenance (328 | 4.5%), Security & Protection (258 | 3.6%), and Personal Care & Service (219 | 3.0%).
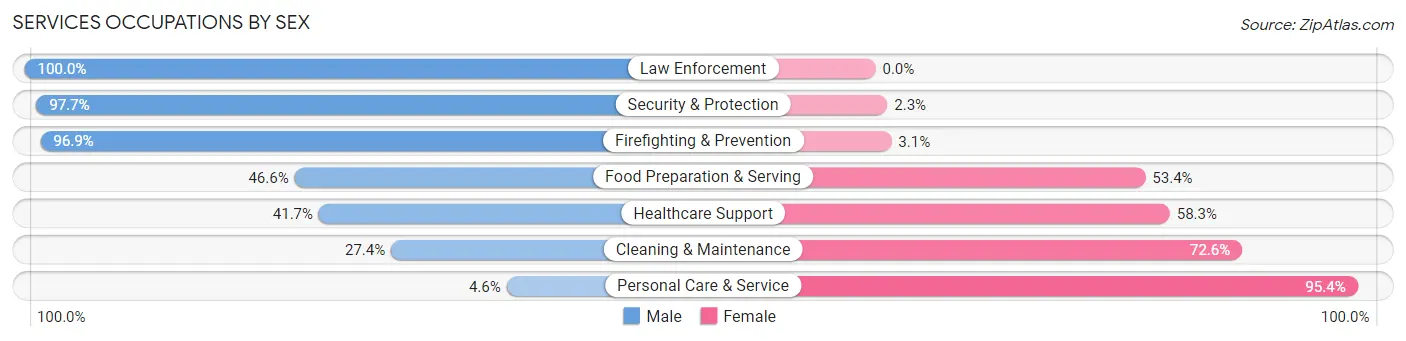
Services Occupations by Sex
Within the Services occupations in Coos Bay, the most male-oriented occupations are Law Enforcement (100.0%), Security & Protection (97.7%), and Firefighting & Prevention (96.9%), while the most female-oriented occupations are Personal Care & Service (95.4%), Cleaning & Maintenance (72.6%), and Healthcare Support (58.3%).
| Occupation | Male | Female |
| Healthcare Support | 212 (41.7%) | 296 (58.3%) |
| Security & Protection | 252 (97.7%) | 6 (2.3%) |
| Firefighting & Prevention | 185 (96.9%) | 6 (3.1%) |
| Law Enforcement | 67 (100.0%) | 0 (0.0%) |
| Food Preparation & Serving | 366 (46.6%) | 420 (53.4%) |
| Cleaning & Maintenance | 90 (27.4%) | 238 (72.6%) |
| Personal Care & Service | 10 (4.6%) | 209 (95.4%) |
| Total (Category) | 930 (44.3%) | 1,169 (55.7%) |
| Total (Overall) | 3,752 (51.8%) | 3,493 (48.2%) |
Sales and Office Occupations
The most common Sales and Office occupations in Coos Bay are Office & Administration (918 | 12.7%), and Sales & Related (636 | 8.8%).
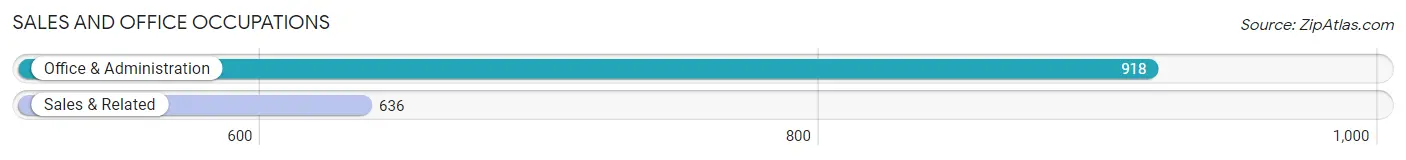
Sales and Office Occupations by Sex
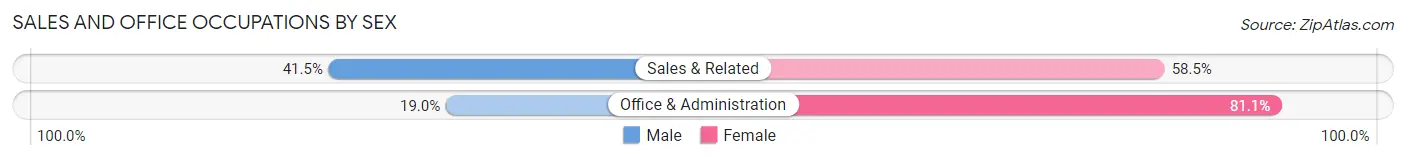
| Occupation | Male | Female |
| Sales & Related | 264 (41.5%) | 372 (58.5%) |
| Office & Administration | 174 (19.0%) | 744 (81.0%) |
| Total (Category) | 438 (28.2%) | 1,116 (71.8%) |
| Total (Overall) | 3,752 (51.8%) | 3,493 (48.2%) |
Natural Resources, Construction and Maintenance Occupations
The most common Natural Resources, Construction and Maintenance occupations in Coos Bay are Farming, Fishing & Forestry (254 | 3.5%), Construction & Extraction (220 | 3.0%), and Installation, Maintenance & Repair (187 | 2.6%).
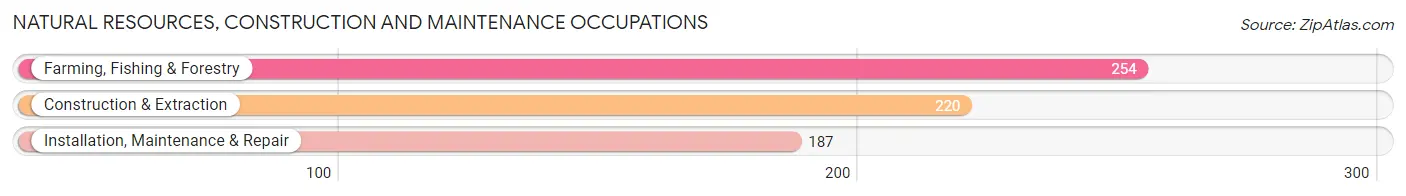
Natural Resources, Construction and Maintenance Occupations by Sex
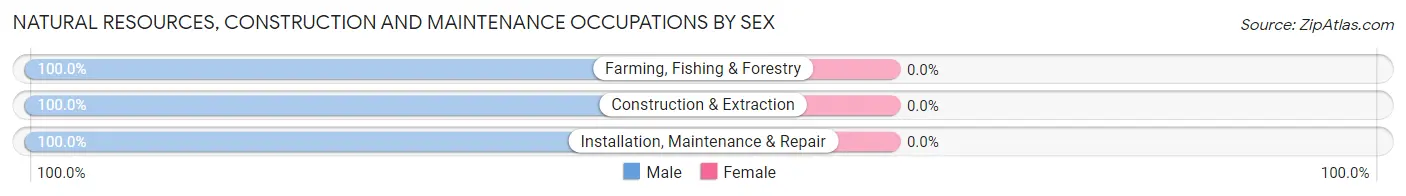
| Occupation | Male | Female |
| Farming, Fishing & Forestry | 254 (100.0%) | 0 (0.0%) |
| Construction & Extraction | 220 (100.0%) | 0 (0.0%) |
| Installation, Maintenance & Repair | 187 (100.0%) | 0 (0.0%) |
| Total (Category) | 661 (100.0%) | 0 (0.0%) |
| Total (Overall) | 3,752 (51.8%) | 3,493 (48.2%) |
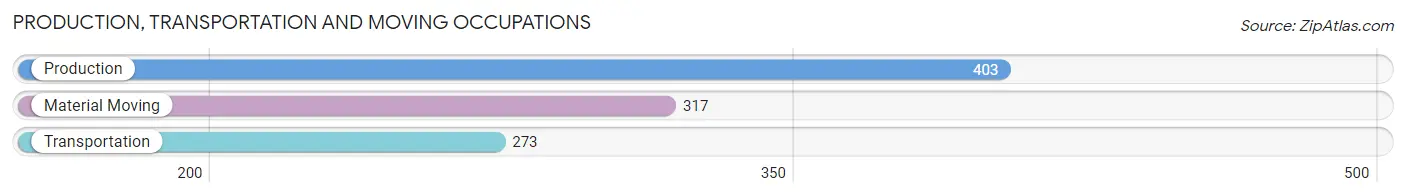
Production, Transportation and Moving Occupations
The most common Production, Transportation and Moving occupations in Coos Bay are Production (403 | 5.6%), Material Moving (317 | 4.4%), and Transportation (273 | 3.8%).
Production, Transportation and Moving Occupations by Sex
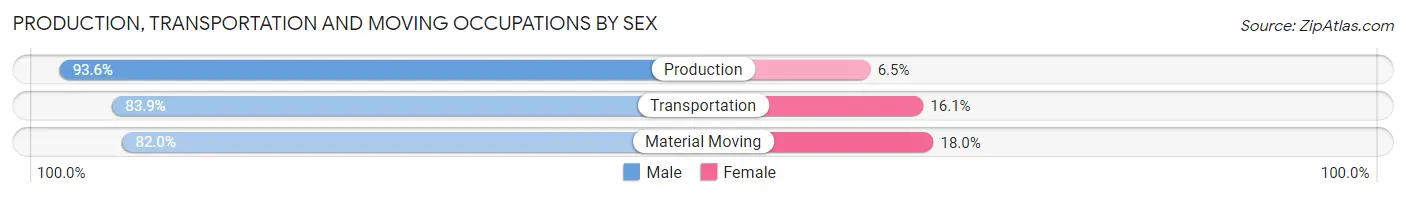
| Occupation | Male | Female |
| Production | 377 (93.5%) | 26 (6.5%) |
| Transportation | 229 (83.9%) | 44 (16.1%) |
| Material Moving | 260 (82.0%) | 57 (18.0%) |
| Total (Category) | 866 (87.2%) | 127 (12.8%) |
| Total (Overall) | 3,752 (51.8%) | 3,493 (48.2%) |
Employment Industries by Sex in Coos Bay
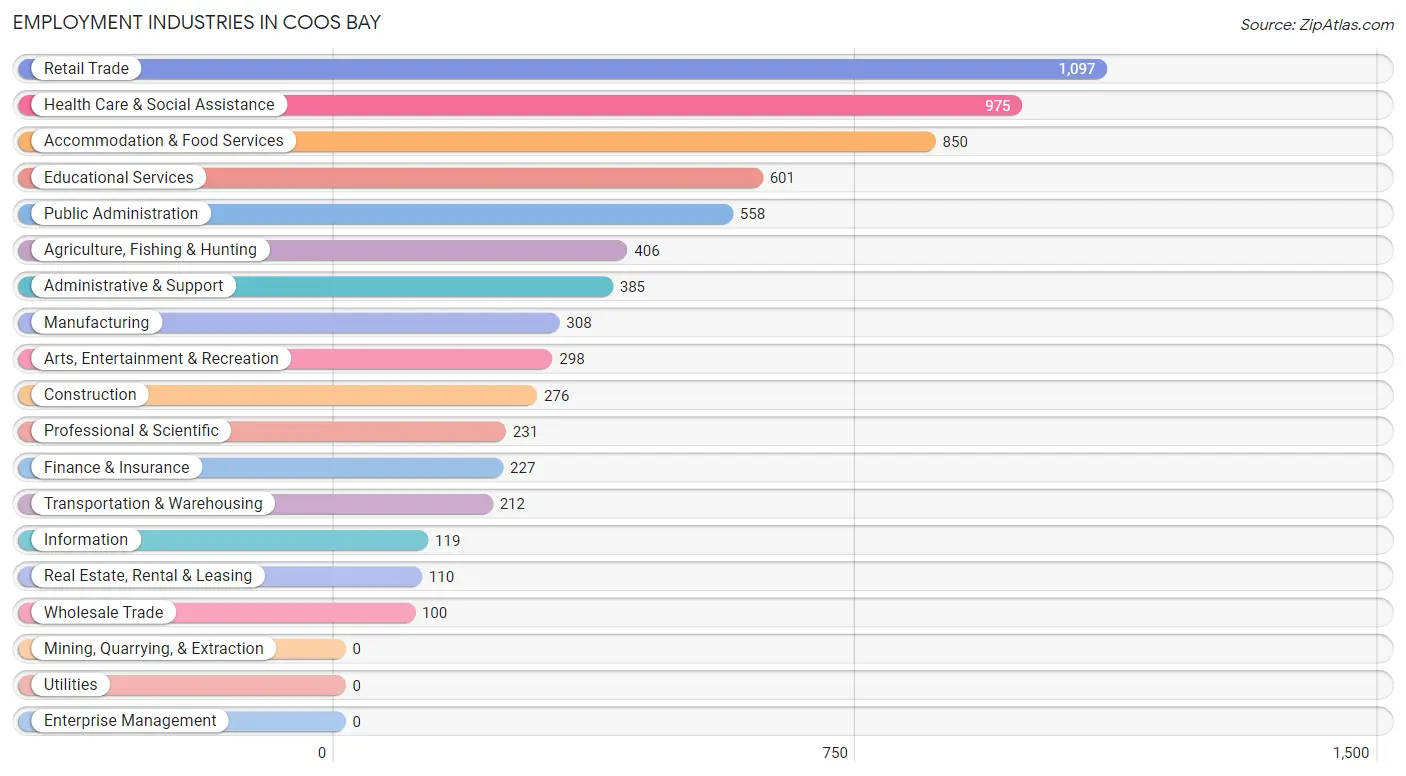
Employment Industries in Coos Bay
The major employment industries in Coos Bay include Retail Trade (1,097 | 15.1%), Health Care & Social Assistance (975 | 13.5%), Accommodation & Food Services (850 | 11.7%), Educational Services (601 | 8.3%), and Public Administration (558 | 7.7%).
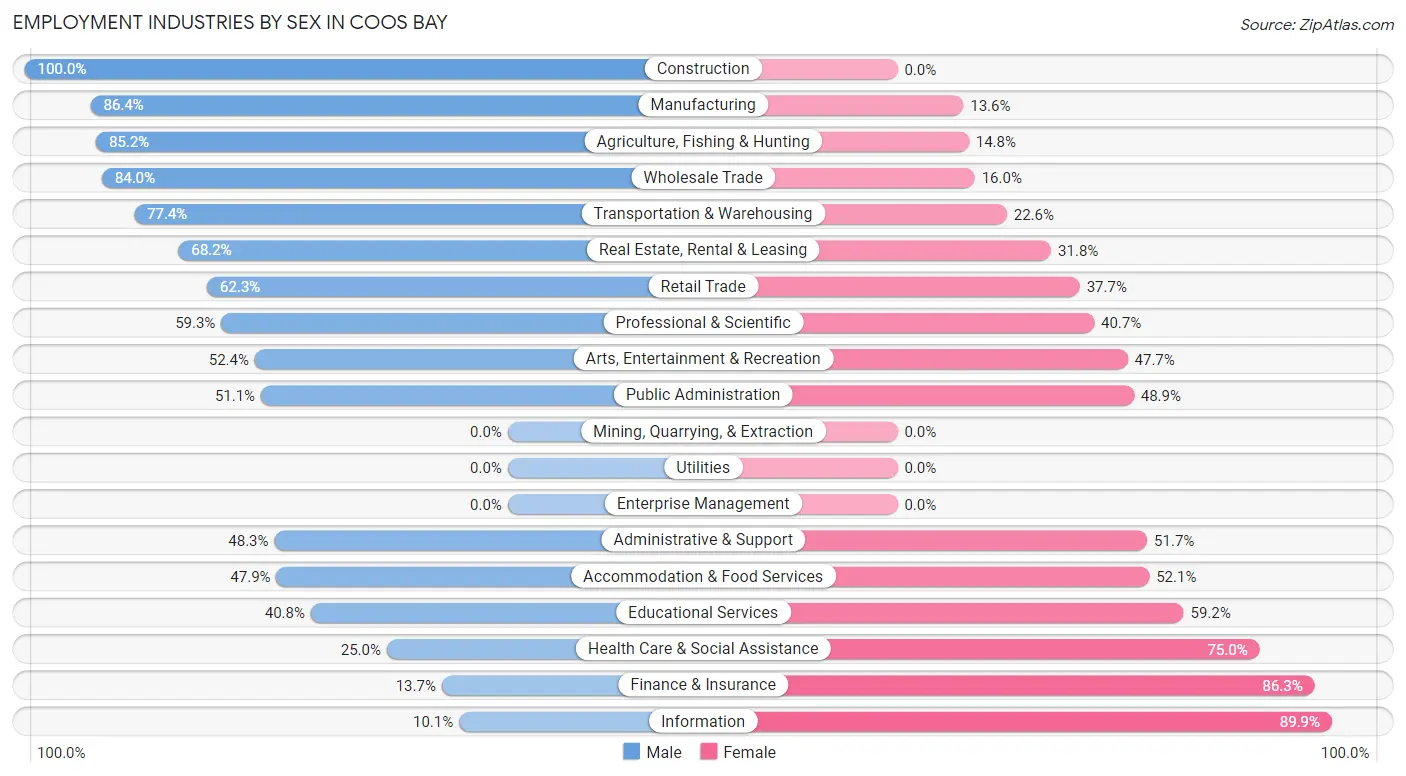
Employment Industries by Sex in Coos Bay
The Coos Bay industries that see more men than women are Construction (100.0%), Manufacturing (86.4%), and Agriculture, Fishing & Hunting (85.2%), whereas the industries that tend to have a higher number of women are Information (89.9%), Finance & Insurance (86.3%), and Health Care & Social Assistance (75.0%).
| Industry | Male | Female |
| Agriculture, Fishing & Hunting | 346 (85.2%) | 60 (14.8%) |
| Mining, Quarrying, & Extraction | 0 (0.0%) | 0 (0.0%) |
| Construction | 276 (100.0%) | 0 (0.0%) |
| Manufacturing | 266 (86.4%) | 42 (13.6%) |
| Wholesale Trade | 84 (84.0%) | 16 (16.0%) |
| Retail Trade | 683 (62.3%) | 414 (37.7%) |
| Transportation & Warehousing | 164 (77.4%) | 48 (22.6%) |
| Utilities | 0 (0.0%) | 0 (0.0%) |
| Information | 12 (10.1%) | 107 (89.9%) |
| Finance & Insurance | 31 (13.7%) | 196 (86.3%) |
| Real Estate, Rental & Leasing | 75 (68.2%) | 35 (31.8%) |
| Professional & Scientific | 137 (59.3%) | 94 (40.7%) |
| Enterprise Management | 0 (0.0%) | 0 (0.0%) |
| Administrative & Support | 186 (48.3%) | 199 (51.7%) |
| Educational Services | 245 (40.8%) | 356 (59.2%) |
| Health Care & Social Assistance | 244 (25.0%) | 731 (75.0%) |
| Arts, Entertainment & Recreation | 156 (52.3%) | 142 (47.6%) |
| Accommodation & Food Services | 407 (47.9%) | 443 (52.1%) |
| Public Administration | 285 (51.1%) | 273 (48.9%) |
| Total | 3,752 (51.8%) | 3,493 (48.2%) |
Education in Coos Bay
School Enrollment in Coos Bay
The most common levels of schooling among the 2,913 students in Coos Bay are elementary school (713 | 24.5%), high school (677 | 23.2%), and middle school (618 | 21.2%).
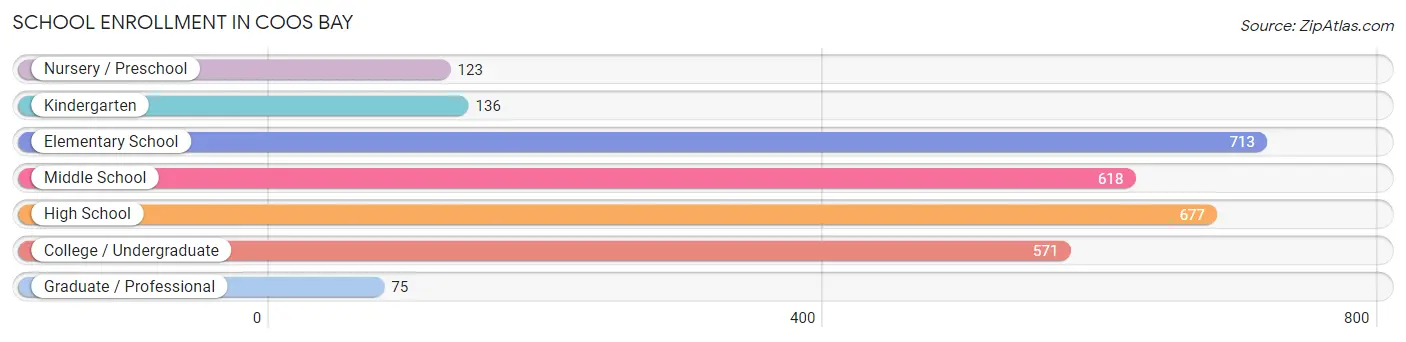
| School Level | # Students | % Students |
| Nursery / Preschool | 123 | 4.2% |
| Kindergarten | 136 | 4.7% |
| Elementary School | 713 | 24.5% |
| Middle School | 618 | 21.2% |
| High School | 677 | 23.2% |
| College / Undergraduate | 571 | 19.6% |
| Graduate / Professional | 75 | 2.6% |
| Total | 2,913 | 100.0% |
School Enrollment by Age by Funding Source in Coos Bay
Out of a total of 2,913 students who are enrolled in schools in Coos Bay, 268 (9.2%) attend a private institution, while the remaining 2,645 (90.8%) are enrolled in public schools. The age group of 25 to 34 year olds has the highest likelihood of being enrolled in private schools, with 42 (31.1% in the age bracket) enrolled. Conversely, the age group of 15 to 17 year olds has the lowest likelihood of being enrolled in a private school, with 405 (100.0% in the age bracket) attending a public institution.
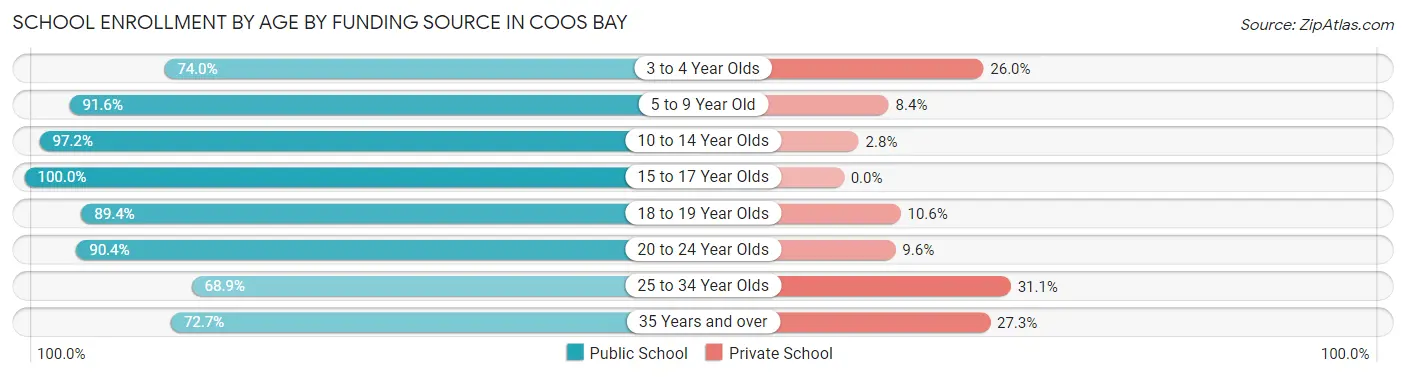
| Age Bracket | Public School | Private School |
| 3 to 4 Year Olds | 91 (74.0%) | 32 (26.0%) |
| 5 to 9 Year Old | 743 (91.6%) | 68 (8.4%) |
| 10 to 14 Year Olds | 697 (97.2%) | 20 (2.8%) |
| 15 to 17 Year Olds | 405 (100.0%) | 0 (0.0%) |
| 18 to 19 Year Olds | 228 (89.4%) | 27 (10.6%) |
| 20 to 24 Year Olds | 253 (90.4%) | 27 (9.6%) |
| 25 to 34 Year Olds | 93 (68.9%) | 42 (31.1%) |
| 35 Years and over | 136 (72.7%) | 51 (27.3%) |
| Total | 2,645 (90.8%) | 268 (9.2%) |
Educational Attainment by Field of Study in Coos Bay
Science & technology (344 | 13.8%), social sciences (330 | 13.2%), education (312 | 12.5%), business (259 | 10.4%), and bio, nature & agricultural (235 | 9.4%) are the most common fields of study among 2,495 individuals in Coos Bay who have obtained a bachelor's degree or higher.
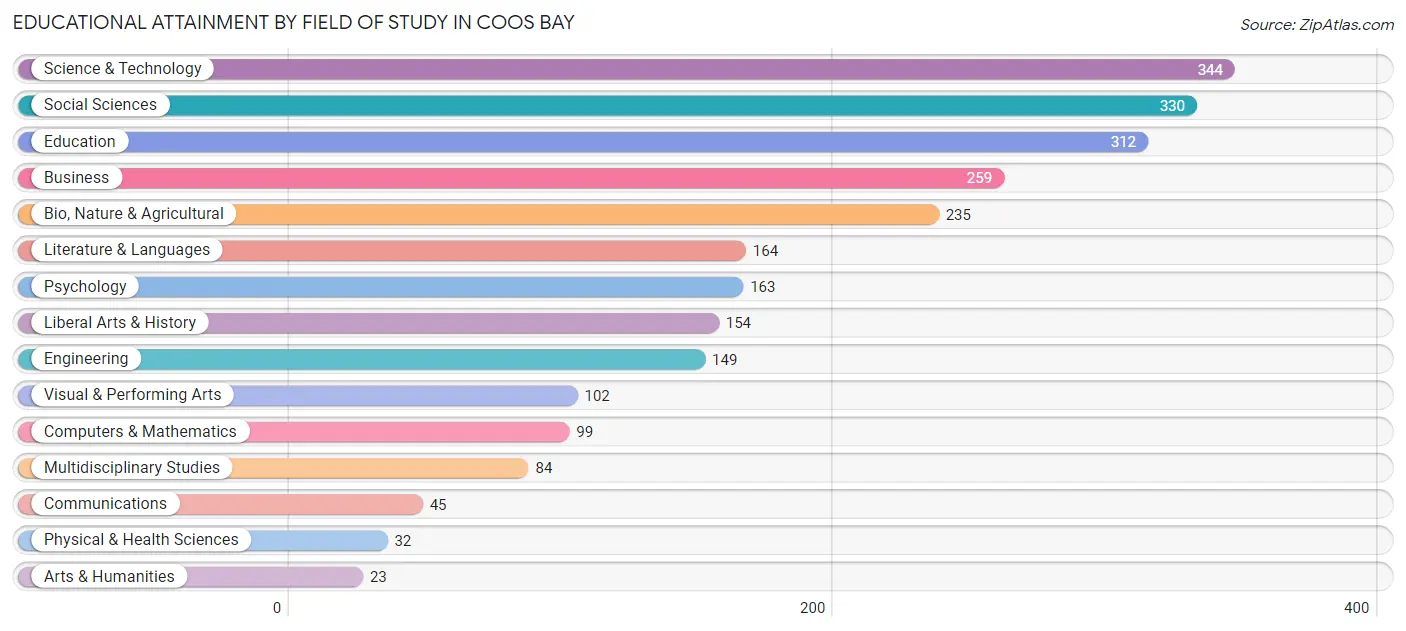
| Field of Study | # Graduates | % Graduates |
| Computers & Mathematics | 99 | 4.0% |
| Bio, Nature & Agricultural | 235 | 9.4% |
| Physical & Health Sciences | 32 | 1.3% |
| Psychology | 163 | 6.5% |
| Social Sciences | 330 | 13.2% |
| Engineering | 149 | 6.0% |
| Multidisciplinary Studies | 84 | 3.4% |
| Science & Technology | 344 | 13.8% |
| Business | 259 | 10.4% |
| Education | 312 | 12.5% |
| Literature & Languages | 164 | 6.6% |
| Liberal Arts & History | 154 | 6.2% |
| Visual & Performing Arts | 102 | 4.1% |
| Communications | 45 | 1.8% |
| Arts & Humanities | 23 | 0.9% |
| Total | 2,495 | 100.0% |
Transportation & Commute in Coos Bay
Vehicle Availability by Sex in Coos Bay
The most prevalent vehicle ownership categories in Coos Bay are males with 2 vehicles (1,598, accounting for 43.7%) and females with 2 vehicles (1,646, making up 45.8%).
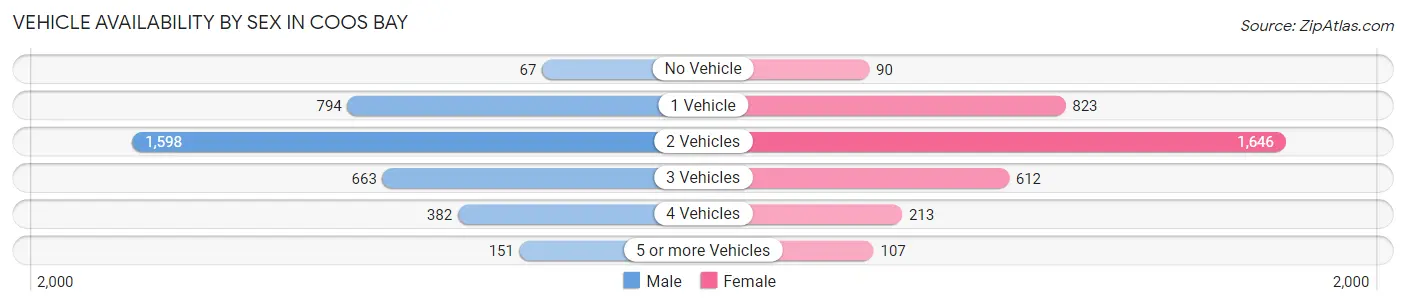
| Vehicles Available | Male | Female |
| No Vehicle | 67 (1.8%) | 90 (2.6%) |
| 1 Vehicle | 794 (21.7%) | 823 (23.6%) |
| 2 Vehicles | 1,598 (43.7%) | 1,646 (47.1%) |
| 3 Vehicles | 663 (18.1%) | 612 (17.5%) |
| 4 Vehicles | 382 (10.4%) | 213 (6.1%) |
| 5 or more Vehicles | 151 (4.1%) | 107 (3.1%) |
| Total | 3,655 (100.0%) | 3,491 (100.0%) |
Commute Time in Coos Bay
The most frequently occuring commute durations in Coos Bay are 5 to 9 minutes (2,150 commuters, 31.5%), 10 to 14 minutes (1,448 commuters, 21.2%), and 15 to 19 minutes (1,193 commuters, 17.5%).
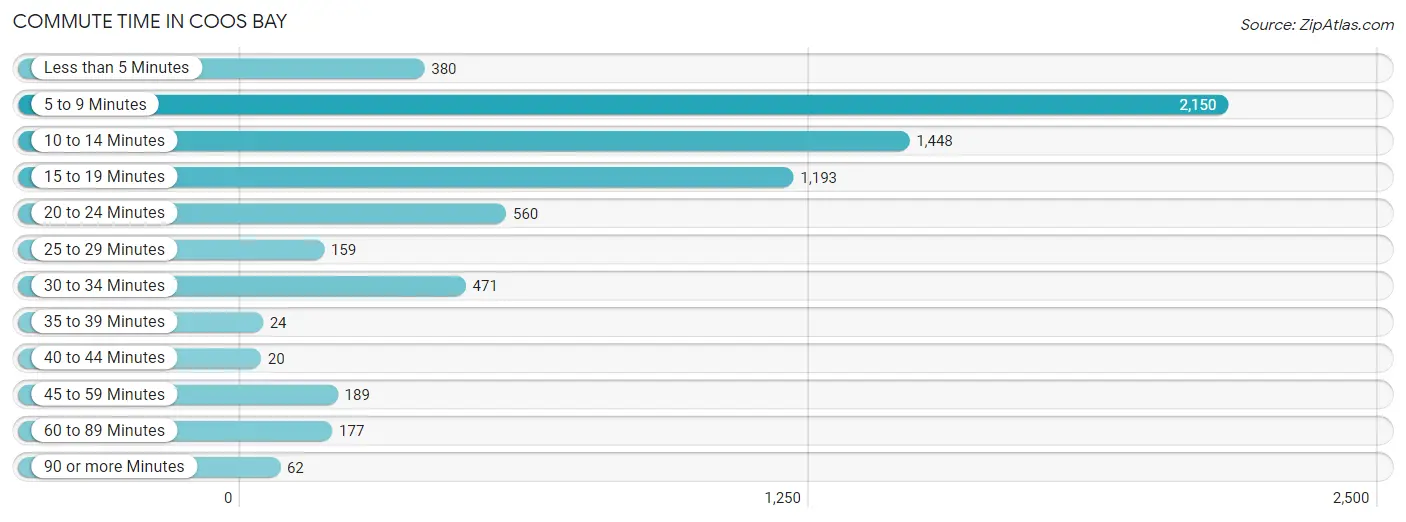
| Commute Time | # Commuters | % Commuters |
| Less than 5 Minutes | 380 | 5.6% |
| 5 to 9 Minutes | 2,150 | 31.5% |
| 10 to 14 Minutes | 1,448 | 21.2% |
| 15 to 19 Minutes | 1,193 | 17.5% |
| 20 to 24 Minutes | 560 | 8.2% |
| 25 to 29 Minutes | 159 | 2.3% |
| 30 to 34 Minutes | 471 | 6.9% |
| 35 to 39 Minutes | 24 | 0.4% |
| 40 to 44 Minutes | 20 | 0.3% |
| 45 to 59 Minutes | 189 | 2.8% |
| 60 to 89 Minutes | 177 | 2.6% |
| 90 or more Minutes | 62 | 0.9% |
Commute Time by Sex in Coos Bay
The most common commute times in Coos Bay are 5 to 9 minutes (1,027 commuters, 29.2%) for males and 5 to 9 minutes (1,123 commuters, 33.9%) for females.
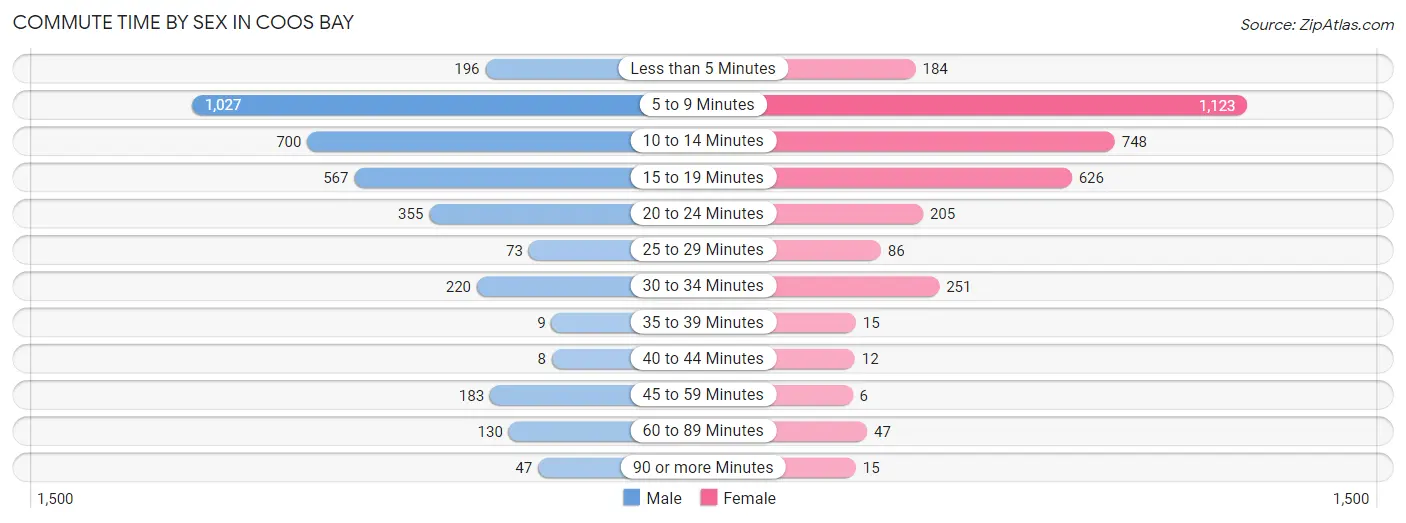
| Commute Time | Male | Female |
| Less than 5 Minutes | 196 (5.6%) | 184 (5.6%) |
| 5 to 9 Minutes | 1,027 (29.2%) | 1,123 (33.9%) |
| 10 to 14 Minutes | 700 (19.9%) | 748 (22.5%) |
| 15 to 19 Minutes | 567 (16.1%) | 626 (18.9%) |
| 20 to 24 Minutes | 355 (10.1%) | 205 (6.2%) |
| 25 to 29 Minutes | 73 (2.1%) | 86 (2.6%) |
| 30 to 34 Minutes | 220 (6.3%) | 251 (7.6%) |
| 35 to 39 Minutes | 9 (0.3%) | 15 (0.4%) |
| 40 to 44 Minutes | 8 (0.2%) | 12 (0.4%) |
| 45 to 59 Minutes | 183 (5.2%) | 6 (0.2%) |
| 60 to 89 Minutes | 130 (3.7%) | 47 (1.4%) |
| 90 or more Minutes | 47 (1.3%) | 15 (0.4%) |
Time of Departure to Work by Sex in Coos Bay
The most frequent times of departure to work in Coos Bay are 7:00 AM to 7:29 AM (560, 15.9%) for males and 7:30 AM to 7:59 AM (684, 20.6%) for females.
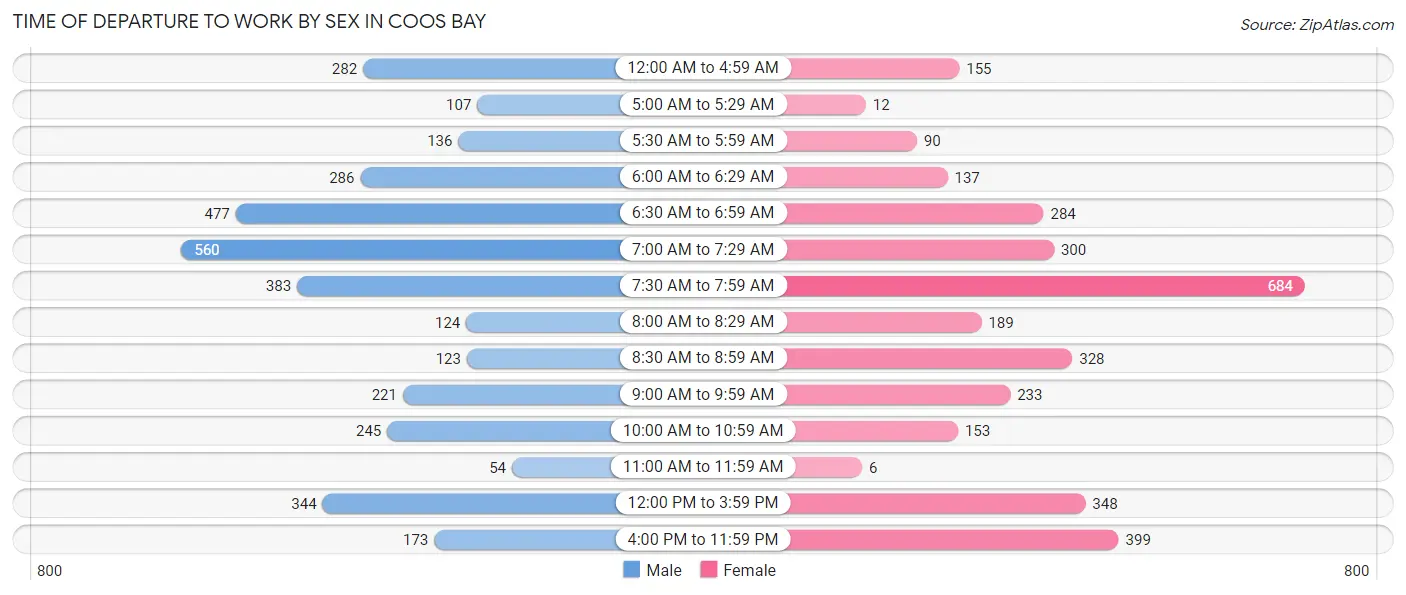
| Time of Departure | Male | Female |
| 12:00 AM to 4:59 AM | 282 (8.0%) | 155 (4.7%) |
| 5:00 AM to 5:29 AM | 107 (3.0%) | 12 (0.4%) |
| 5:30 AM to 5:59 AM | 136 (3.9%) | 90 (2.7%) |
| 6:00 AM to 6:29 AM | 286 (8.1%) | 137 (4.1%) |
| 6:30 AM to 6:59 AM | 477 (13.6%) | 284 (8.6%) |
| 7:00 AM to 7:29 AM | 560 (15.9%) | 300 (9.0%) |
| 7:30 AM to 7:59 AM | 383 (10.9%) | 684 (20.6%) |
| 8:00 AM to 8:29 AM | 124 (3.5%) | 189 (5.7%) |
| 8:30 AM to 8:59 AM | 123 (3.5%) | 328 (9.9%) |
| 9:00 AM to 9:59 AM | 221 (6.3%) | 233 (7.0%) |
| 10:00 AM to 10:59 AM | 245 (7.0%) | 153 (4.6%) |
| 11:00 AM to 11:59 AM | 54 (1.5%) | 6 (0.2%) |
| 12:00 PM to 3:59 PM | 344 (9.8%) | 348 (10.5%) |
| 4:00 PM to 11:59 PM | 173 (4.9%) | 399 (12.0%) |
| Total | 3,515 (100.0%) | 3,318 (100.0%) |
Housing Occupancy in Coos Bay
Occupancy by Ownership in Coos Bay
Of the total 7,257 dwellings in Coos Bay, owner-occupied units account for 4,361 (60.1%), while renter-occupied units make up 2,896 (39.9%).
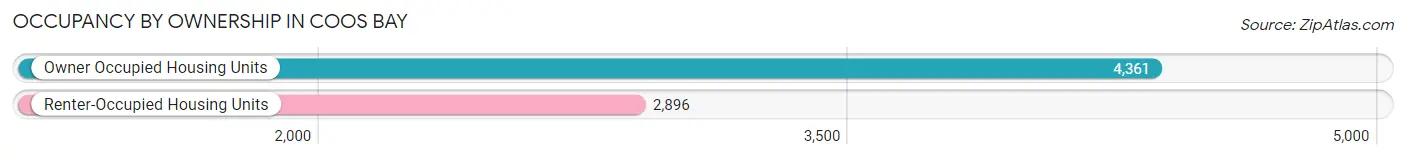
| Occupancy | # Housing Units | % Housing Units |
| Owner Occupied Housing Units | 4,361 | 60.1% |
| Renter-Occupied Housing Units | 2,896 | 39.9% |
| Total Occupied Housing Units | 7,257 | 100.0% |
Occupancy by Household Size in Coos Bay
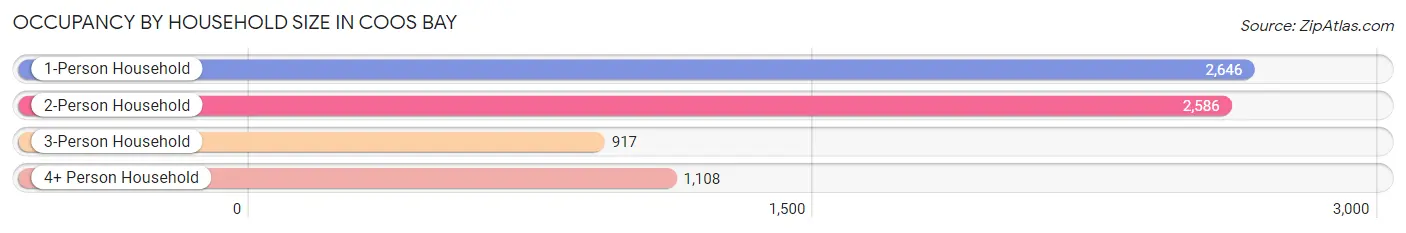
| Household Size | # Housing Units | % Housing Units |
| 1-Person Household | 2,646 | 36.5% |
| 2-Person Household | 2,586 | 35.6% |
| 3-Person Household | 917 | 12.6% |
| 4+ Person Household | 1,108 | 15.3% |
| Total Housing Units | 7,257 | 100.0% |
Occupancy by Ownership by Household Size in Coos Bay
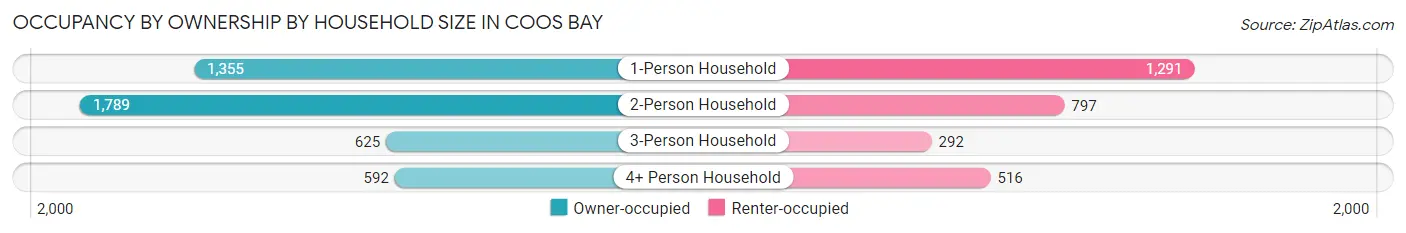
| Household Size | Owner-occupied | Renter-occupied |
| 1-Person Household | 1,355 (51.2%) | 1,291 (48.8%) |
| 2-Person Household | 1,789 (69.2%) | 797 (30.8%) |
| 3-Person Household | 625 (68.2%) | 292 (31.8%) |
| 4+ Person Household | 592 (53.4%) | 516 (46.6%) |
| Total Housing Units | 4,361 (60.1%) | 2,896 (39.9%) |
Occupancy by Educational Attainment in Coos Bay
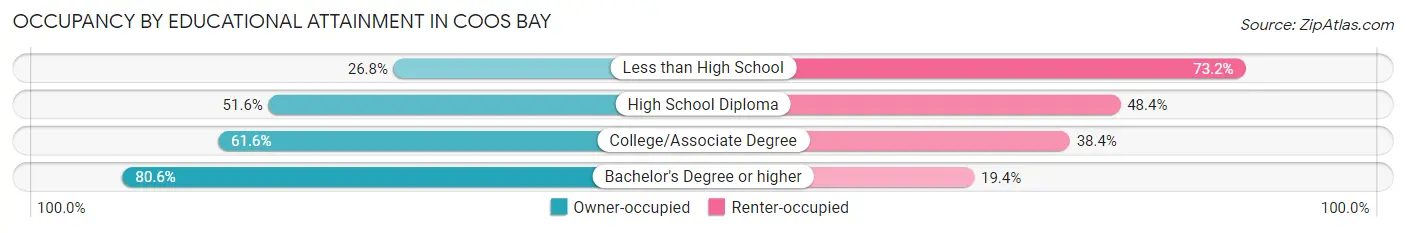
| Household Size | Owner-occupied | Renter-occupied |
| Less than High School | 171 (26.8%) | 467 (73.2%) |
| High School Diploma | 996 (51.6%) | 934 (48.4%) |
| College/Associate Degree | 1,902 (61.6%) | 1,184 (38.4%) |
| Bachelor's Degree or higher | 1,292 (80.6%) | 311 (19.4%) |
Occupancy by Age of Householder in Coos Bay
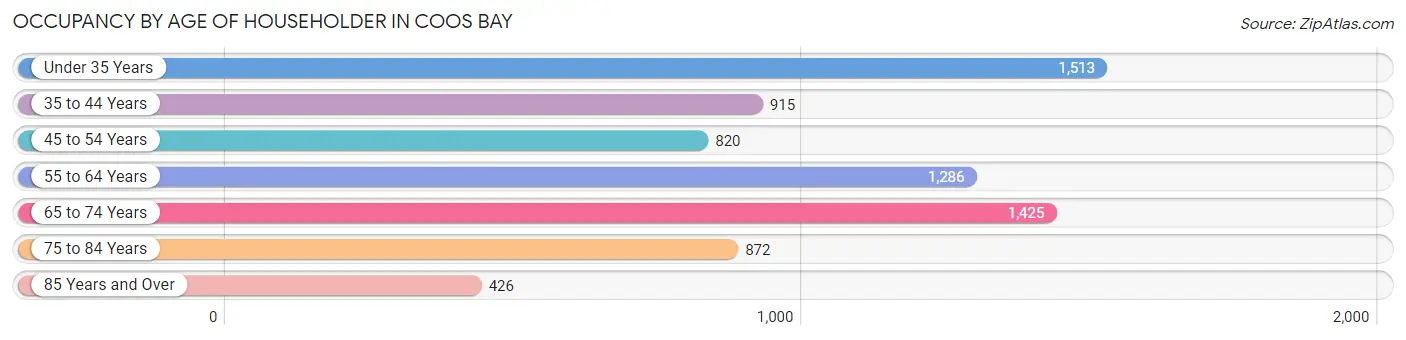
| Age Bracket | # Households | % Households |
| Under 35 Years | 1,513 | 20.8% |
| 35 to 44 Years | 915 | 12.6% |
| 45 to 54 Years | 820 | 11.3% |
| 55 to 64 Years | 1,286 | 17.7% |
| 65 to 74 Years | 1,425 | 19.6% |
| 75 to 84 Years | 872 | 12.0% |
| 85 Years and Over | 426 | 5.9% |
| Total | 7,257 | 100.0% |
Housing Finances in Coos Bay
Median Income by Occupancy in Coos Bay
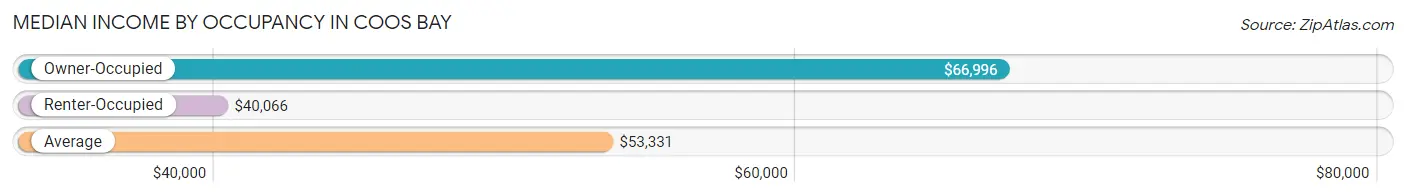
| Occupancy Type | # Households | Median Income |
| Owner-Occupied | 4,361 (60.1%) | $66,996 |
| Renter-Occupied | 2,896 (39.9%) | $40,066 |
| Average | 7,257 (100.0%) | $53,331 |
Occupancy by Householder Income Bracket in Coos Bay
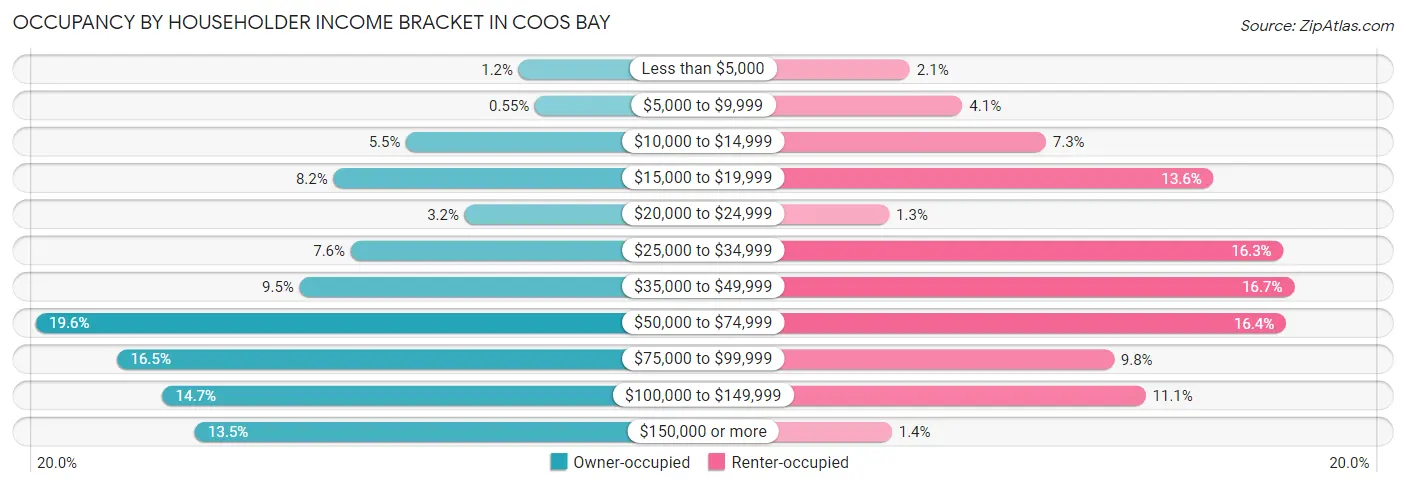
| Income Bracket | Owner-occupied | Renter-occupied |
| Less than $5,000 | 51 (1.2%) | 60 (2.1%) |
| $5,000 to $9,999 | 24 (0.5%) | 118 (4.1%) |
| $10,000 to $14,999 | 238 (5.5%) | 210 (7.2%) |
| $15,000 to $19,999 | 359 (8.2%) | 395 (13.6%) |
| $20,000 to $24,999 | 141 (3.2%) | 37 (1.3%) |
| $25,000 to $34,999 | 330 (7.6%) | 472 (16.3%) |
| $35,000 to $49,999 | 415 (9.5%) | 484 (16.7%) |
| $50,000 to $74,999 | 853 (19.6%) | 475 (16.4%) |
| $75,000 to $99,999 | 718 (16.5%) | 285 (9.8%) |
| $100,000 to $149,999 | 643 (14.7%) | 320 (11.1%) |
| $150,000 or more | 589 (13.5%) | 40 (1.4%) |
| Total | 4,361 (100.0%) | 2,896 (100.0%) |
Monthly Housing Cost Tiers in Coos Bay
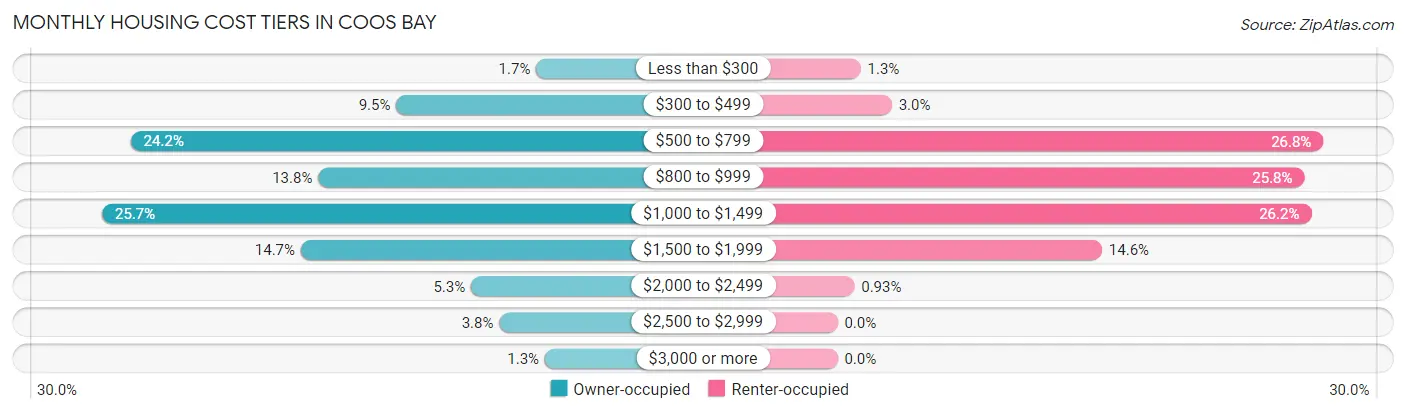
| Monthly Cost | Owner-occupied | Renter-occupied |
| Less than $300 | 76 (1.7%) | 37 (1.3%) |
| $300 to $499 | 413 (9.5%) | 87 (3.0%) |
| $500 to $799 | 1,053 (24.1%) | 777 (26.8%) |
| $800 to $999 | 601 (13.8%) | 747 (25.8%) |
| $1,000 to $1,499 | 1,122 (25.7%) | 758 (26.2%) |
| $1,500 to $1,999 | 643 (14.7%) | 423 (14.6%) |
| $2,000 to $2,499 | 233 (5.3%) | 27 (0.9%) |
| $2,500 to $2,999 | 165 (3.8%) | 0 (0.0%) |
| $3,000 or more | 55 (1.3%) | 0 (0.0%) |
| Total | 4,361 (100.0%) | 2,896 (100.0%) |
Physical Housing Characteristics in Coos Bay
Housing Structures in Coos Bay
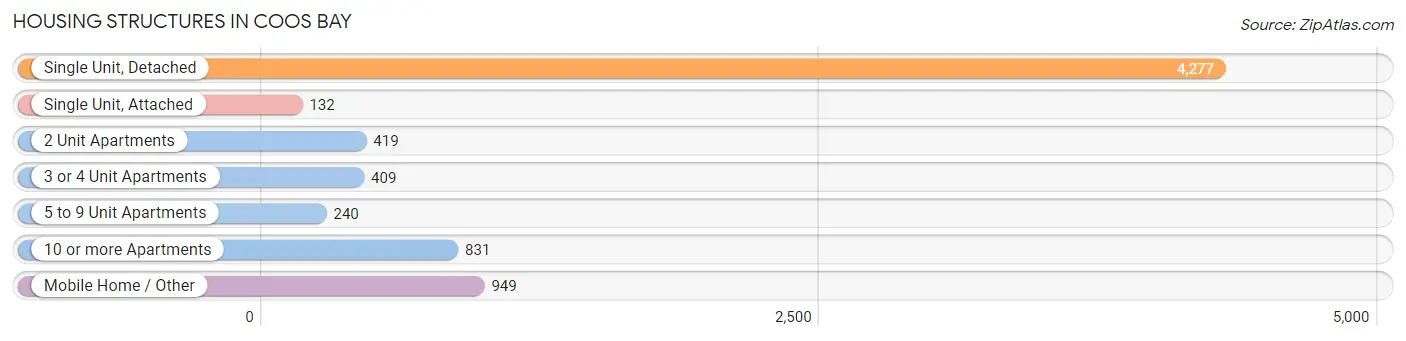
| Structure Type | # Housing Units | % Housing Units |
| Single Unit, Detached | 4,277 | 58.9% |
| Single Unit, Attached | 132 | 1.8% |
| 2 Unit Apartments | 419 | 5.8% |
| 3 or 4 Unit Apartments | 409 | 5.6% |
| 5 to 9 Unit Apartments | 240 | 3.3% |
| 10 or more Apartments | 831 | 11.5% |
| Mobile Home / Other | 949 | 13.1% |
| Total | 7,257 | 100.0% |
Housing Structures by Occupancy in Coos Bay
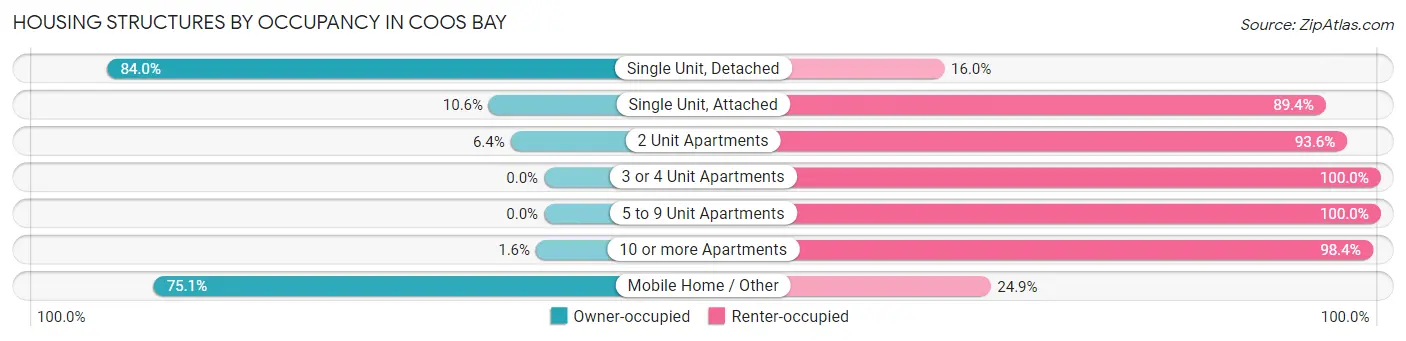
| Structure Type | Owner-occupied | Renter-occupied |
| Single Unit, Detached | 3,594 (84.0%) | 683 (16.0%) |
| Single Unit, Attached | 14 (10.6%) | 118 (89.4%) |
| 2 Unit Apartments | 27 (6.4%) | 392 (93.6%) |
| 3 or 4 Unit Apartments | 0 (0.0%) | 409 (100.0%) |
| 5 to 9 Unit Apartments | 0 (0.0%) | 240 (100.0%) |
| 10 or more Apartments | 13 (1.6%) | 818 (98.4%) |
| Mobile Home / Other | 713 (75.1%) | 236 (24.9%) |
| Total | 4,361 (60.1%) | 2,896 (39.9%) |
Housing Structures by Number of Rooms in Coos Bay
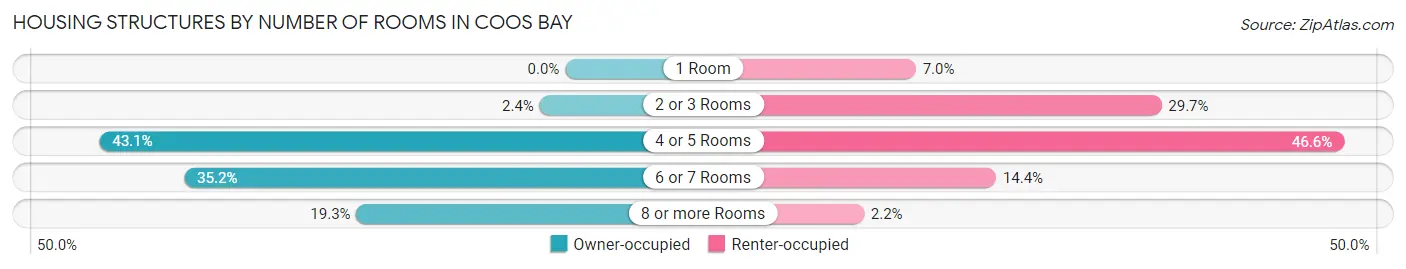
| Number of Rooms | Owner-occupied | Renter-occupied |
| 1 Room | 0 (0.0%) | 203 (7.0%) |
| 2 or 3 Rooms | 103 (2.4%) | 861 (29.7%) |
| 4 or 5 Rooms | 1,879 (43.1%) | 1,350 (46.6%) |
| 6 or 7 Rooms | 1,537 (35.2%) | 418 (14.4%) |
| 8 or more Rooms | 842 (19.3%) | 64 (2.2%) |
| Total | 4,361 (100.0%) | 2,896 (100.0%) |
Housing Structure by Heating Type in Coos Bay
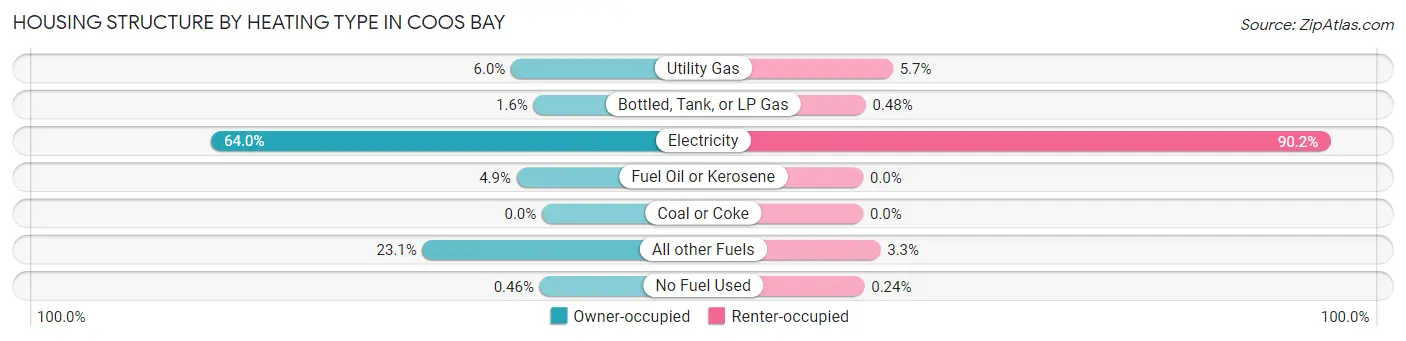
| Heating Type | Owner-occupied | Renter-occupied |
| Utility Gas | 261 (6.0%) | 166 (5.7%) |
| Bottled, Tank, or LP Gas | 71 (1.6%) | 14 (0.5%) |
| Electricity | 2,789 (63.9%) | 2,613 (90.2%) |
| Fuel Oil or Kerosene | 213 (4.9%) | 0 (0.0%) |
| Coal or Coke | 0 (0.0%) | 0 (0.0%) |
| All other Fuels | 1,007 (23.1%) | 96 (3.3%) |
| No Fuel Used | 20 (0.5%) | 7 (0.2%) |
| Total | 4,361 (100.0%) | 2,896 (100.0%) |
Household Vehicle Usage in Coos Bay
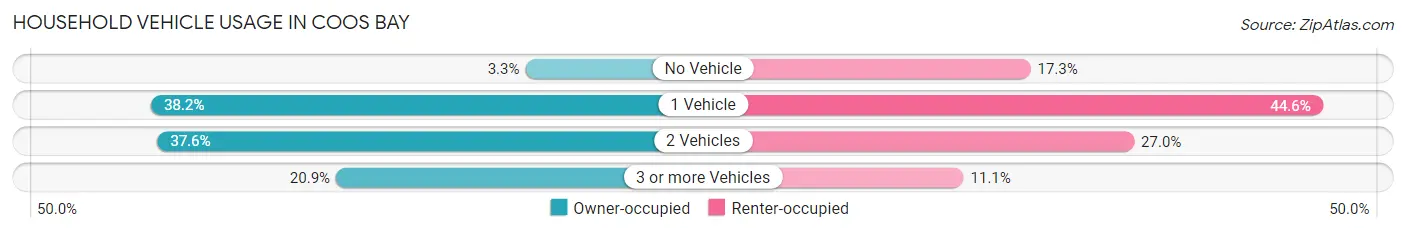
| Vehicles per Household | Owner-occupied | Renter-occupied |
| No Vehicle | 142 (3.3%) | 502 (17.3%) |
| 1 Vehicle | 1,666 (38.2%) | 1,291 (44.6%) |
| 2 Vehicles | 1,640 (37.6%) | 782 (27.0%) |
| 3 or more Vehicles | 913 (20.9%) | 321 (11.1%) |
| Total | 4,361 (100.0%) | 2,896 (100.0%) |
Real Estate & Mortgages in Coos Bay
Real Estate and Mortgage Overview in Coos Bay
| Characteristic | Without Mortgage | With Mortgage |
| Housing Units | 1,748 | 2,613 |
| Median Property Value | $170,200 | $273,000 |
| Median Household Income | $42,022 | $469 |
| Monthly Housing Costs | $616 | $55 |
| Real Estate Taxes | $1,949 | $129 |
Property Value by Mortgage Status in Coos Bay
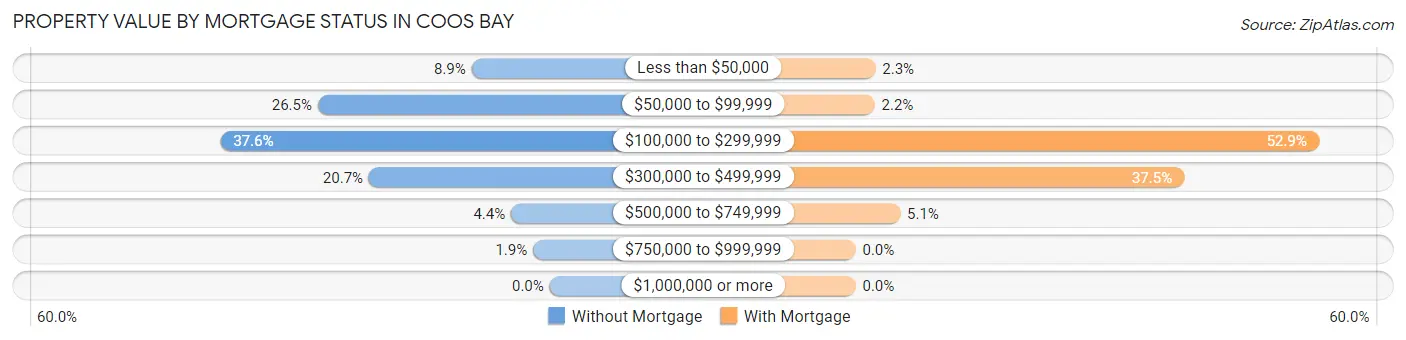
| Property Value | Without Mortgage | With Mortgage |
| Less than $50,000 | 156 (8.9%) | 59 (2.3%) |
| $50,000 to $99,999 | 463 (26.5%) | 57 (2.2%) |
| $100,000 to $299,999 | 658 (37.6%) | 1,383 (52.9%) |
| $300,000 to $499,999 | 361 (20.6%) | 981 (37.5%) |
| $500,000 to $749,999 | 77 (4.4%) | 133 (5.1%) |
| $750,000 to $999,999 | 33 (1.9%) | 0 (0.0%) |
| $1,000,000 or more | 0 (0.0%) | 0 (0.0%) |
| Total | 1,748 (100.0%) | 2,613 (100.0%) |
Household Income by Mortgage Status in Coos Bay
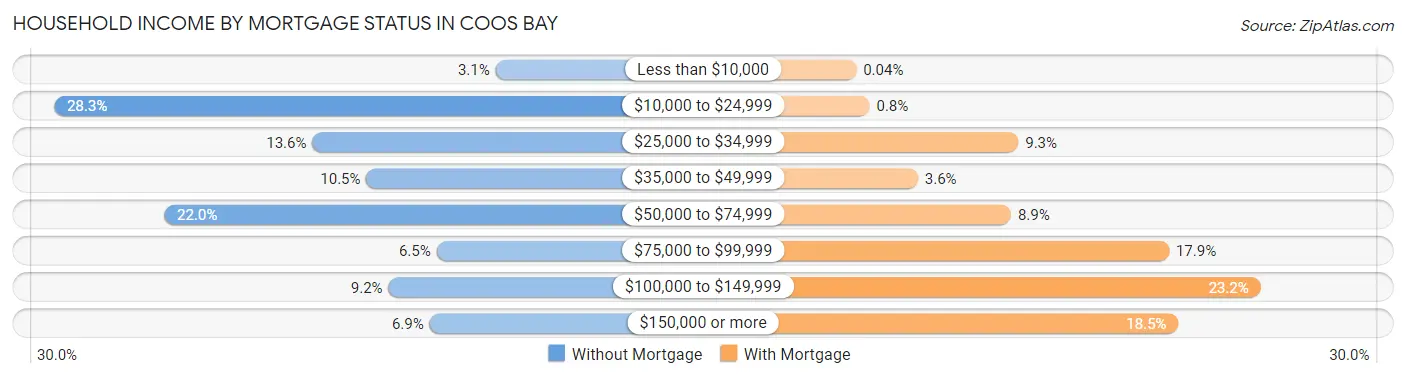
| Household Income | Without Mortgage | With Mortgage |
| Less than $10,000 | 54 (3.1%) | 1 (0.0%) |
| $10,000 to $24,999 | 495 (28.3%) | 21 (0.8%) |
| $25,000 to $34,999 | 237 (13.6%) | 243 (9.3%) |
| $35,000 to $49,999 | 183 (10.5%) | 93 (3.6%) |
| $50,000 to $74,999 | 385 (22.0%) | 232 (8.9%) |
| $75,000 to $99,999 | 113 (6.5%) | 468 (17.9%) |
| $100,000 to $149,999 | 161 (9.2%) | 605 (23.2%) |
| $150,000 or more | 120 (6.9%) | 482 (18.4%) |
| Total | 1,748 (100.0%) | 2,613 (100.0%) |
Property Value to Household Income Ratio in Coos Bay
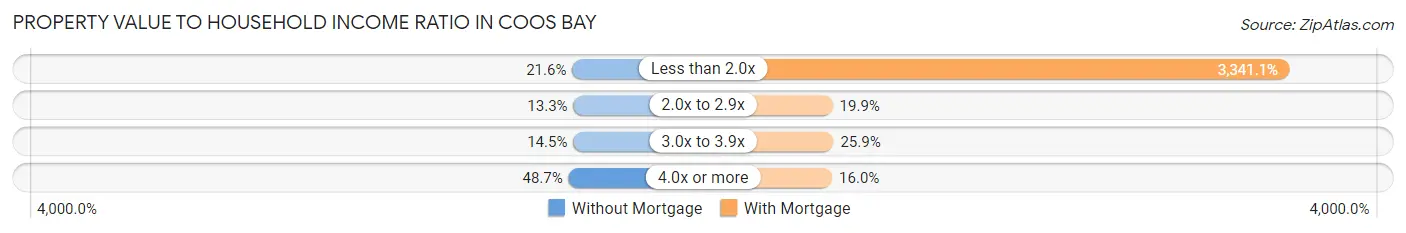
| Value-to-Income Ratio | Without Mortgage | With Mortgage |
| Less than 2.0x | 378 (21.6%) | 87,303 (3,341.1%) |
| 2.0x to 2.9x | 233 (13.3%) | 521 (19.9%) |
| 3.0x to 3.9x | 254 (14.5%) | 677 (25.9%) |
| 4.0x or more | 852 (48.7%) | 419 (16.0%) |
| Total | 1,748 (100.0%) | 2,613 (100.0%) |
Real Estate Taxes by Mortgage Status in Coos Bay
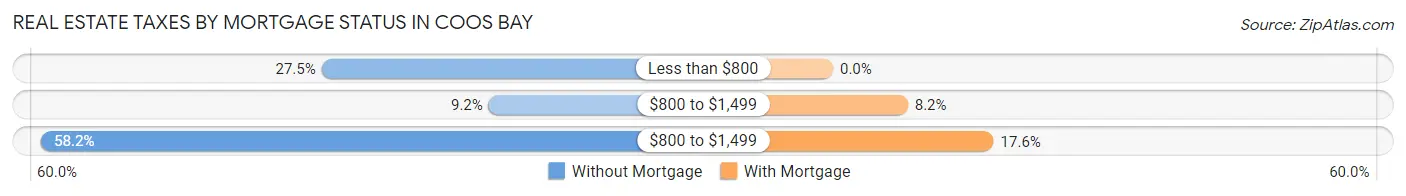
| Property Taxes | Without Mortgage | With Mortgage |
| Less than $800 | 480 (27.5%) | 0 (0.0%) |
| $800 to $1,499 | 160 (9.1%) | 214 (8.2%) |
| $800 to $1,499 | 1,017 (58.2%) | 460 (17.6%) |
| Total | 1,748 (100.0%) | 2,613 (100.0%) |
Health & Disability in Coos Bay
Health Insurance Coverage by Age in Coos Bay
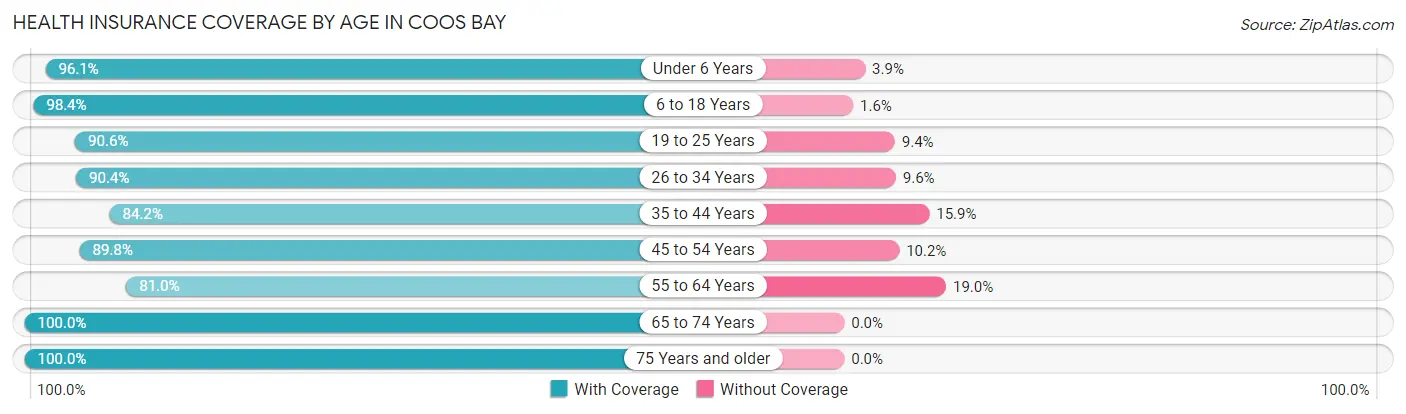
| Age Bracket | With Coverage | Without Coverage |
| Under 6 Years | 963 (96.1%) | 39 (3.9%) |
| 6 to 18 Years | 2,101 (98.4%) | 35 (1.6%) |
| 19 to 25 Years | 1,450 (90.6%) | 151 (9.4%) |
| 26 to 34 Years | 1,637 (90.4%) | 174 (9.6%) |
| 35 to 44 Years | 1,460 (84.2%) | 275 (15.9%) |
| 45 to 54 Years | 1,393 (89.8%) | 159 (10.2%) |
| 55 to 64 Years | 1,696 (81.0%) | 397 (19.0%) |
| 65 to 74 Years | 2,144 (100.0%) | 0 (0.0%) |
| 75 Years and older | 1,683 (100.0%) | 0 (0.0%) |
| Total | 14,527 (92.2%) | 1,230 (7.8%) |
Health Insurance Coverage by Citizenship Status in Coos Bay
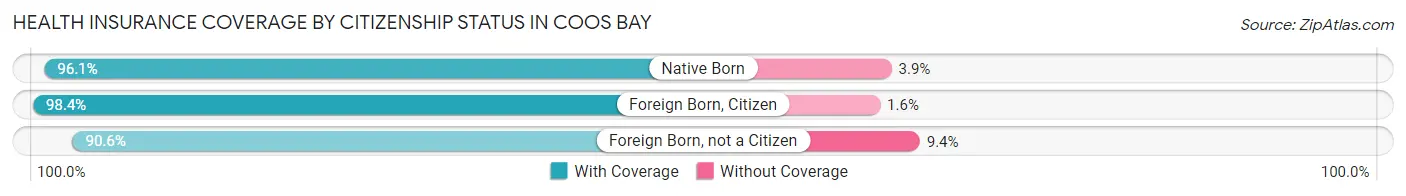
| Citizenship Status | With Coverage | Without Coverage |
| Native Born | 963 (96.1%) | 39 (3.9%) |
| Foreign Born, Citizen | 2,101 (98.4%) | 35 (1.6%) |
| Foreign Born, not a Citizen | 1,450 (90.6%) | 151 (9.4%) |
Health Insurance Coverage by Household Income in Coos Bay
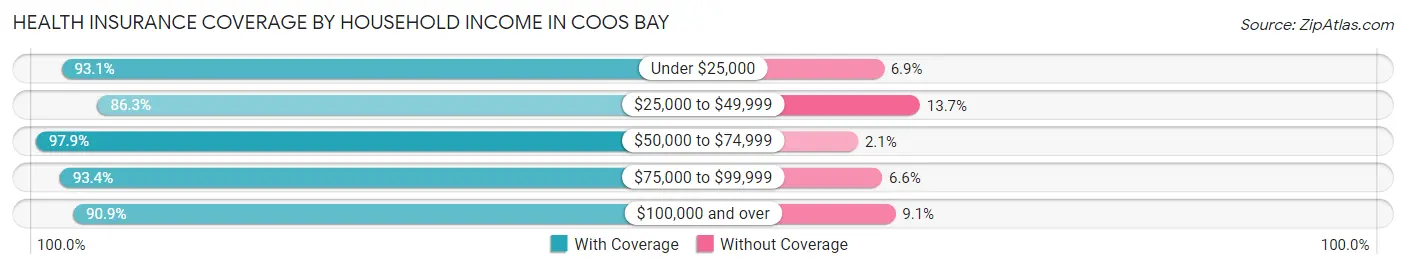
| Household Income | With Coverage | Without Coverage |
| Under $25,000 | 2,130 (93.1%) | 158 (6.9%) |
| $25,000 to $49,999 | 2,509 (86.3%) | 398 (13.7%) |
| $50,000 to $74,999 | 2,850 (97.9%) | 61 (2.1%) |
| $75,000 to $99,999 | 2,603 (93.4%) | 184 (6.6%) |
| $100,000 and over | 4,283 (90.9%) | 429 (9.1%) |
Public vs Private Health Insurance Coverage by Age in Coos Bay
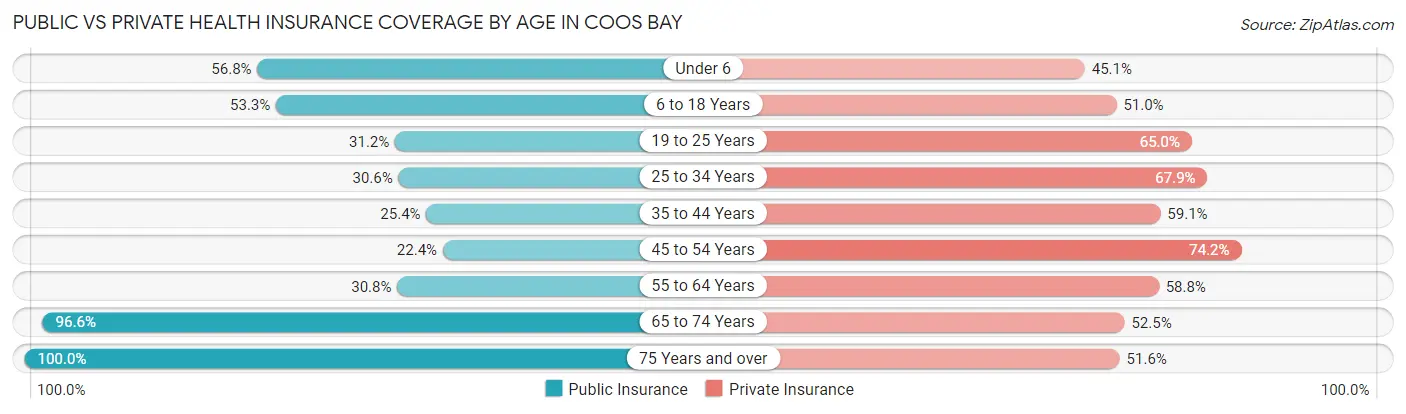
| Age Bracket | Public Insurance | Private Insurance |
| Under 6 | 569 (56.8%) | 452 (45.1%) |
| 6 to 18 Years | 1,139 (53.3%) | 1,089 (51.0%) |
| 19 to 25 Years | 500 (31.2%) | 1,040 (65.0%) |
| 25 to 34 Years | 554 (30.6%) | 1,229 (67.9%) |
| 35 to 44 Years | 441 (25.4%) | 1,026 (59.1%) |
| 45 to 54 Years | 347 (22.4%) | 1,151 (74.2%) |
| 55 to 64 Years | 645 (30.8%) | 1,231 (58.8%) |
| 65 to 74 Years | 2,072 (96.6%) | 1,125 (52.5%) |
| 75 Years and over | 1,683 (100.0%) | 868 (51.6%) |
| Total | 7,950 (50.4%) | 9,211 (58.5%) |
Disability Status by Sex by Age in Coos Bay
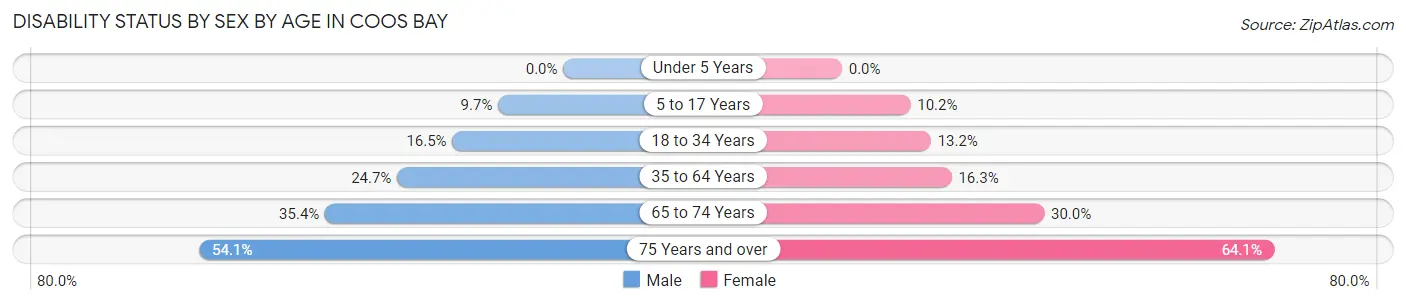
| Age Bracket | Male | Female |
| Under 5 Years | 0 (0.0%) | 0 (0.0%) |
| 5 to 17 Years | 78 (9.7%) | 119 (10.2%) |
| 18 to 34 Years | 317 (16.5%) | 221 (13.2%) |
| 35 to 64 Years | 676 (24.7%) | 430 (16.3%) |
| 65 to 74 Years | 359 (35.4%) | 339 (30.0%) |
| 75 Years and over | 378 (54.1%) | 631 (64.1%) |
Disability Class by Sex by Age in Coos Bay
Disability Class: Hearing Difficulty
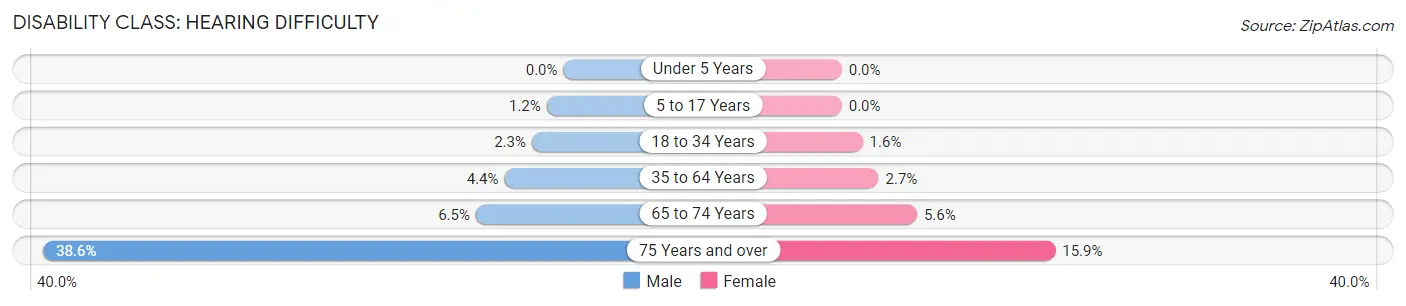
| Age Bracket | Male | Female |
| Under 5 Years | 0 (0.0%) | 0 (0.0%) |
| 5 to 17 Years | 10 (1.2%) | 0 (0.0%) |
| 18 to 34 Years | 45 (2.3%) | 26 (1.5%) |
| 35 to 64 Years | 120 (4.4%) | 72 (2.7%) |
| 65 to 74 Years | 66 (6.5%) | 63 (5.6%) |
| 75 Years and over | 270 (38.6%) | 156 (15.9%) |
Disability Class: Vision Difficulty
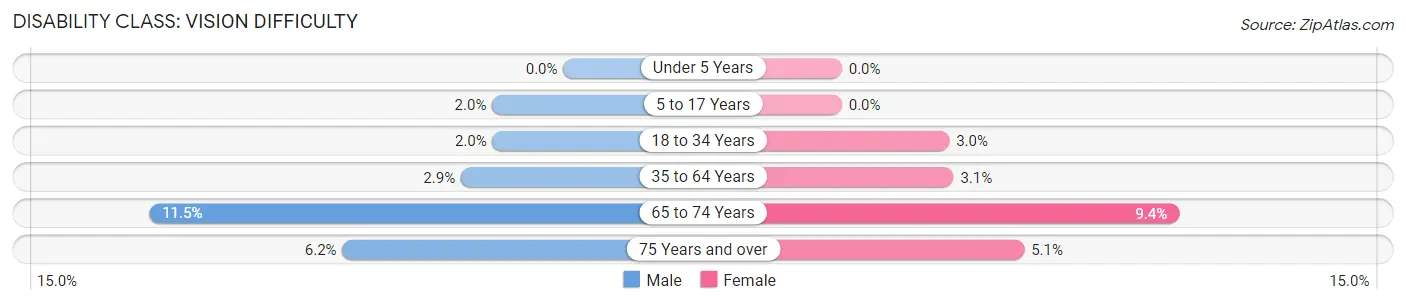
| Age Bracket | Male | Female |
| Under 5 Years | 0 (0.0%) | 0 (0.0%) |
| 5 to 17 Years | 16 (2.0%) | 0 (0.0%) |
| 18 to 34 Years | 38 (2.0%) | 50 (3.0%) |
| 35 to 64 Years | 78 (2.9%) | 82 (3.1%) |
| 65 to 74 Years | 117 (11.5%) | 106 (9.4%) |
| 75 Years and over | 43 (6.1%) | 50 (5.1%) |
Disability Class: Cognitive Difficulty
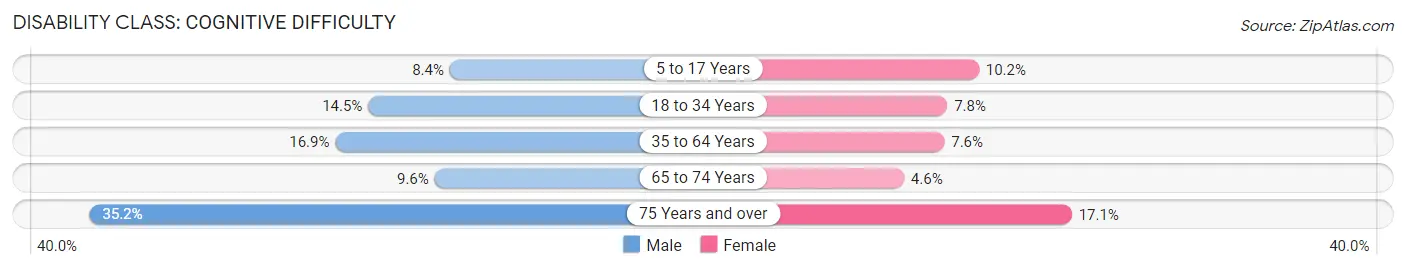
| Age Bracket | Male | Female |
| 5 to 17 Years | 68 (8.4%) | 119 (10.2%) |
| 18 to 34 Years | 279 (14.5%) | 131 (7.8%) |
| 35 to 64 Years | 464 (16.9%) | 201 (7.6%) |
| 65 to 74 Years | 97 (9.6%) | 52 (4.6%) |
| 75 Years and over | 246 (35.2%) | 168 (17.1%) |
Disability Class: Ambulatory Difficulty
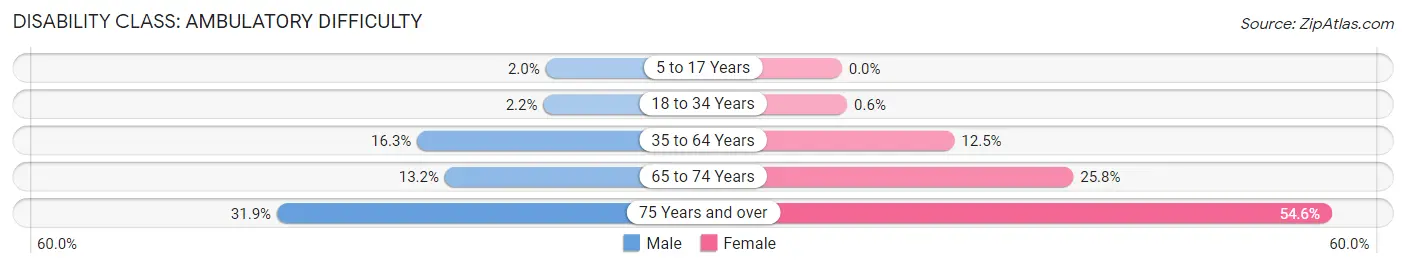
| Age Bracket | Male | Female |
| 5 to 17 Years | 16 (2.0%) | 0 (0.0%) |
| 18 to 34 Years | 43 (2.2%) | 10 (0.6%) |
| 35 to 64 Years | 446 (16.3%) | 331 (12.5%) |
| 65 to 74 Years | 134 (13.2%) | 291 (25.8%) |
| 75 Years and over | 223 (31.9%) | 537 (54.6%) |
Disability Class: Self-Care Difficulty
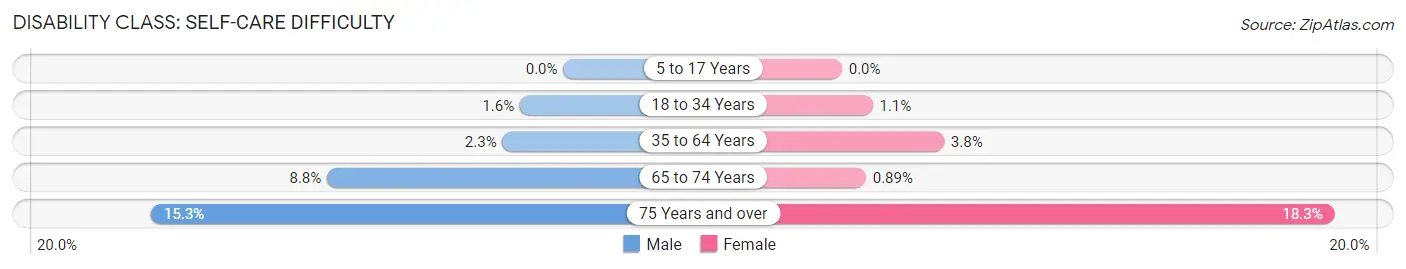
| Age Bracket | Male | Female |
| 5 to 17 Years | 0 (0.0%) | 0 (0.0%) |
| 18 to 34 Years | 31 (1.6%) | 19 (1.1%) |
| 35 to 64 Years | 62 (2.3%) | 100 (3.8%) |
| 65 to 74 Years | 89 (8.8%) | 10 (0.9%) |
| 75 Years and over | 107 (15.3%) | 180 (18.3%) |
Technology Access in Coos Bay
Computing Device Access in Coos Bay
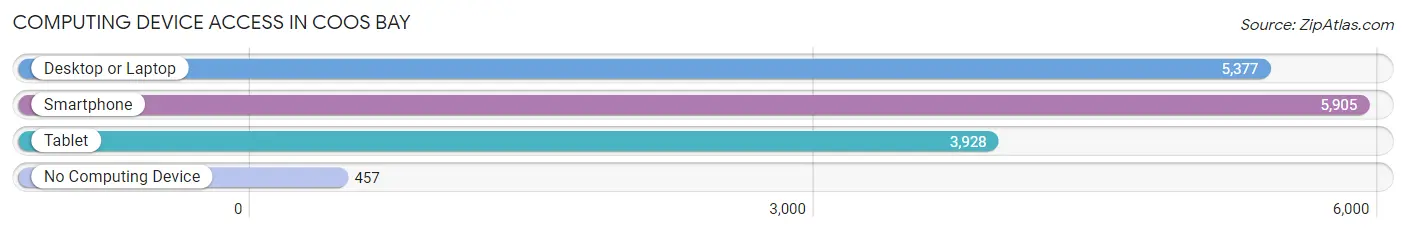
| Device Type | # Households | % Households |
| Desktop or Laptop | 5,377 | 74.1% |
| Smartphone | 5,905 | 81.4% |
| Tablet | 3,928 | 54.1% |
| No Computing Device | 457 | 6.3% |
| Total | 7,257 | 100.0% |
Internet Access in Coos Bay
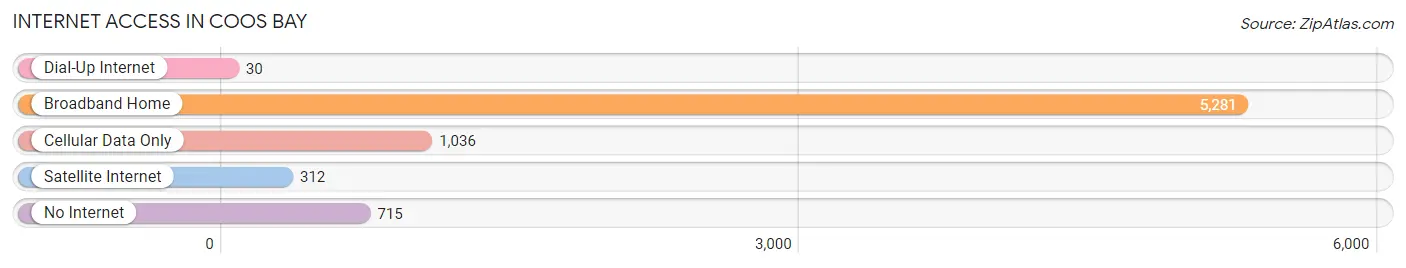
| Internet Type | # Households | % Households |
| Dial-Up Internet | 30 | 0.4% |
| Broadband Home | 5,281 | 72.8% |
| Cellular Data Only | 1,036 | 14.3% |
| Satellite Internet | 312 | 4.3% |
| No Internet | 715 | 9.9% |
| Total | 7,257 | 100.0% |
Coos Bay Summary
Coos Bay is a city located in Coos County, Oregon, United States, where the Coos River enters Coos Bay on the Pacific Ocean. The city borders the city of North Bend, and together they are often referred to as one entity called either Coos Bay-North Bend or the Bay Area. Coos Bay is the largest city on the Oregon Coast and the largest city in Coos County. It is the county seat of Coos County.
History
The area around Coos Bay was originally inhabited by the Coos, Lower Umpqua, and Siuslaw Native American tribes. The first European to visit the area was British explorer Captain James Cook in 1778. The first permanent settlement in the area was in 1853 when the town of Empire City was established. The town was later renamed Marshfield in 1874. In 1944, the city of Coos Bay was incorporated.
Geography
Coos Bay is located at the mouth of the Coos River on the Pacific Ocean in southwestern Oregon. It is situated on a bay of the same name, which is one of the largest bays on the Oregon Coast. The city is surrounded by forests and mountains, including the Oregon Coast Range to the east and the Siskiyou Mountains to the south. The city has a total area of 8.3 square miles, of which 7.9 square miles is land and 0.4 square miles is water.
Economy
Coos Bay is the economic hub of the Oregon Coast. The city is home to a variety of industries, including timber, fishing, manufacturing, and tourism. The Port of Coos Bay is the largest deep-water port between San Francisco and the Columbia River. The port is a major shipping center for lumber, fish, and other products. The city is also home to a variety of manufacturing companies, including a paper mill, a plywood mill, and a steel mill. Tourism is also an important part of the local economy, with the city being a popular destination for fishing, boating, and other outdoor activities.
Demographics
As of the 2010 census, Coos Bay had a population of 15,967. The racial makeup of the city was 87.2% White, 0.7% African American, 2.2% Native American, 1.3% Asian, 0.2% Pacific Islander, 5.2% from other races, and 3.2% from two or more races. Hispanic or Latino of any race were 10.2% of the population.
The median income for a household in the city was $35,945, and the median income for a family was $41,919. The per capita income for the city was $18,945. About 16.2% of families and 19.7% of the population were below the poverty line, including 28.2% of those under age 18 and 8.2% of those age 65 or over.
Common Questions
What is Per Capita Income in Coos Bay?
Per Capita income in Coos Bay is $32,165.
What is the Median Family Income in Coos Bay?
Median Family Income in Coos Bay is $79,327.
What is the Median Household income in Coos Bay?
Median Household Income in Coos Bay is $53,331.
What is Income or Wage Gap in Coos Bay?
Income or Wage Gap in Coos Bay is 29.6%.
Women in Coos Bay earn 70.4 cents for every dollar earned by a man.
What is Inequality or Gini Index in Coos Bay?
Inequality or Gini Index in Coos Bay is 0.44.
What is the Total Population of Coos Bay?
Total Population of Coos Bay is 15,949.
What is the Total Male Population of Coos Bay?
Total Male Population of Coos Bay is 7,650.
What is the Total Female Population of Coos Bay?
Total Female Population of Coos Bay is 8,299.
What is the Ratio of Males per 100 Females in Coos Bay?
There are 92.18 Males per 100 Females in Coos Bay.
What is the Ratio of Females per 100 Males in Coos Bay?
There are 108.48 Females per 100 Males in Coos Bay.
What is the Median Population Age in Coos Bay?
Median Population Age in Coos Bay is 42.8 Years.
What is the Average Family Size in Coos Bay
Average Family Size in Coos Bay is 2.8 People.
What is the Average Household Size in Coos Bay
Average Household Size in Coos Bay is 2.2 People.
How Large is the Labor Force in Coos Bay?
There are 7,670 People in the Labor Forcein in Coos Bay.
What is the Percentage of People in the Labor Force in Coos Bay?
57.6% of People are in the Labor Force in Coos Bay.
What is the Unemployment Rate in Coos Bay?
Unemployment Rate in Coos Bay is 4.8%.