Butte Falls, OR Map & Demographics
Butte Falls Map
Butte Falls Overview
$23,631
PER CAPITA INCOME
$67,583
AVG FAMILY INCOME
$45,357
AVG HOUSEHOLD INCOME
29.4%
WAGE / INCOME GAP [ % ]
70.6¢/ $1
WAGE / INCOME GAP [ $ ]
0.40
INEQUALITY / GINI INDEX
401
TOTAL POPULATION
222
MALE POPULATION
179
FEMALE POPULATION
124.02
MALES / 100 FEMALES
80.63
FEMALES / 100 MALES
41.6
MEDIAN AGE
2.9
AVG FAMILY SIZE
2.4
AVG HOUSEHOLD SIZE
180
LABOR FORCE [ PEOPLE ]
53.6%
PERCENT IN LABOR FORCE
8.9%
UNEMPLOYMENT RATE
Butte Falls Zip Codes
Butte Falls Area Codes
Income in Butte Falls
Income Overview in Butte Falls
Per Capita Income in Butte Falls is $23,631, while median incomes of families and households are $67,583 and $45,357 respectively.
| Characteristic | Number | Measure |
| Per Capita Income | 401 | $23,631 |
| Median Family Income | 97 | $67,583 |
| Mean Family Income | 97 | $64,682 |
| Median Household Income | 166 | $45,357 |
| Mean Household Income | 166 | $53,566 |
| Income Deficit | 97 | $0 |
| Wage / Income Gap (%) | 401 | 29.41% |
| Wage / Income Gap ($) | 401 | 70.59¢ per $1 |
| Gini / Inequality Index | 401 | 0.40 |
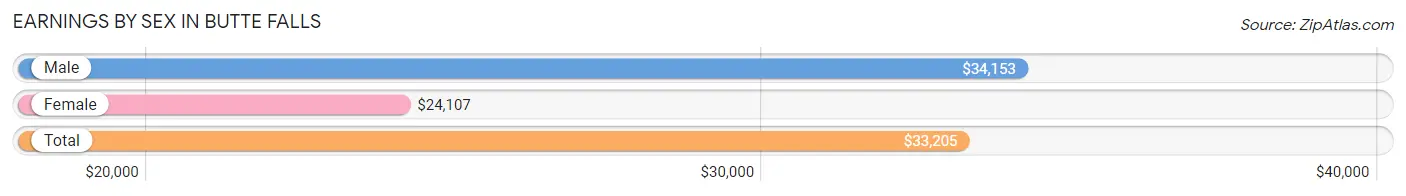
Earnings by Sex in Butte Falls
Average Earnings in Butte Falls are $33,205, $34,153 for men and $24,107 for women, a difference of 29.4%.
| Sex | Number | Average Earnings |
| Male | 115 (63.2%) | $34,153 |
| Female | 67 (36.8%) | $24,107 |
| Total | 182 (100.0%) | $33,205 |
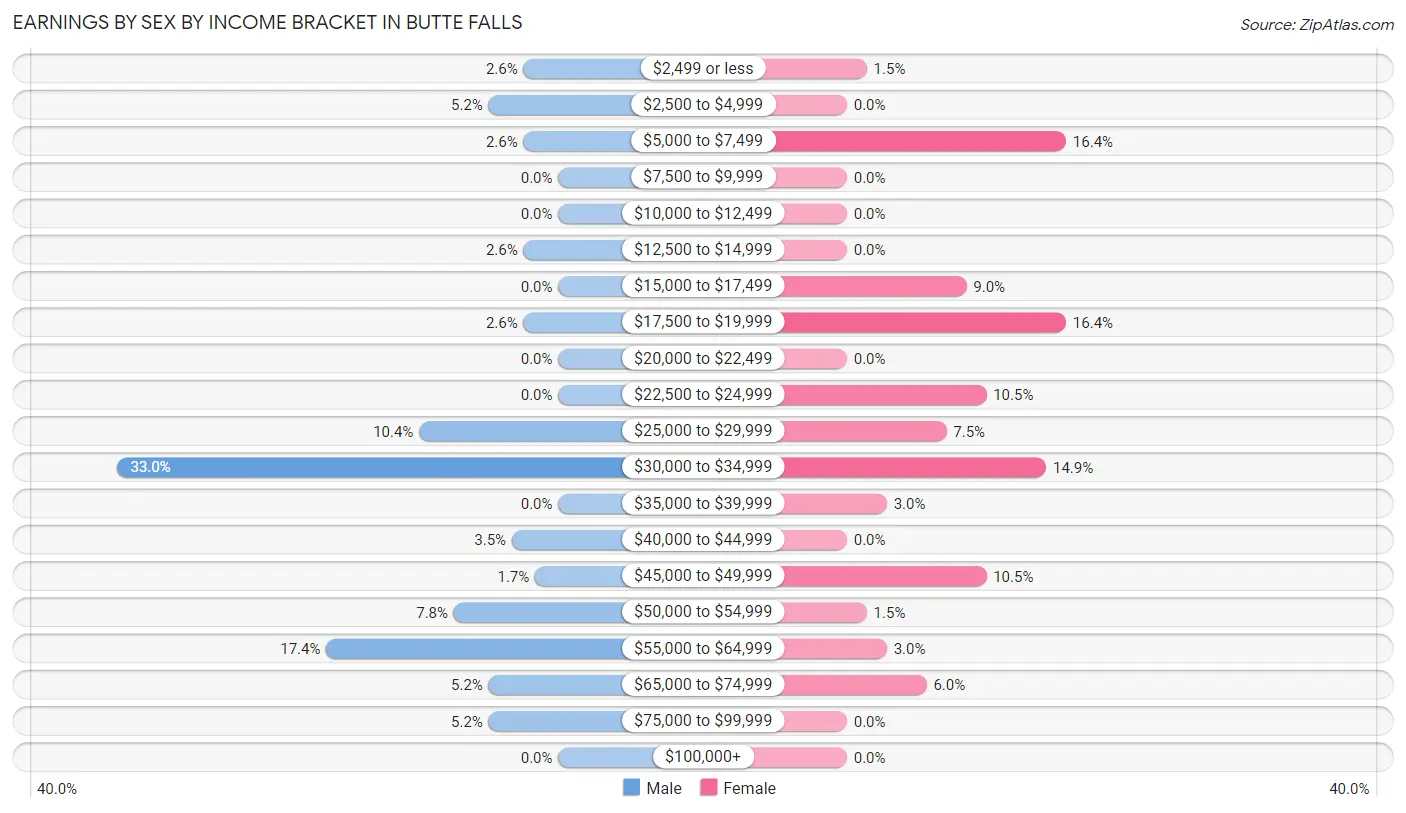
Earnings by Sex by Income Bracket in Butte Falls
The most common earnings brackets in Butte Falls are $30,000 to $34,999 for men (38 | 33.0%) and $5,000 to $7,499 for women (11 | 16.4%).
| Income | Male | Female |
| $2,499 or less | 3 (2.6%) | 1 (1.5%) |
| $2,500 to $4,999 | 6 (5.2%) | 0 (0.0%) |
| $5,000 to $7,499 | 3 (2.6%) | 11 (16.4%) |
| $7,500 to $9,999 | 0 (0.0%) | 0 (0.0%) |
| $10,000 to $12,499 | 0 (0.0%) | 0 (0.0%) |
| $12,500 to $14,999 | 3 (2.6%) | 0 (0.0%) |
| $15,000 to $17,499 | 0 (0.0%) | 6 (9.0%) |
| $17,500 to $19,999 | 3 (2.6%) | 11 (16.4%) |
| $20,000 to $22,499 | 0 (0.0%) | 0 (0.0%) |
| $22,500 to $24,999 | 0 (0.0%) | 7 (10.4%) |
| $25,000 to $29,999 | 12 (10.4%) | 5 (7.5%) |
| $30,000 to $34,999 | 38 (33.0%) | 10 (14.9%) |
| $35,000 to $39,999 | 0 (0.0%) | 2 (3.0%) |
| $40,000 to $44,999 | 4 (3.5%) | 0 (0.0%) |
| $45,000 to $49,999 | 2 (1.7%) | 7 (10.4%) |
| $50,000 to $54,999 | 9 (7.8%) | 1 (1.5%) |
| $55,000 to $64,999 | 20 (17.4%) | 2 (3.0%) |
| $65,000 to $74,999 | 6 (5.2%) | 4 (6.0%) |
| $75,000 to $99,999 | 6 (5.2%) | 0 (0.0%) |
| $100,000+ | 0 (0.0%) | 0 (0.0%) |
| Total | 115 (100.0%) | 67 (100.0%) |
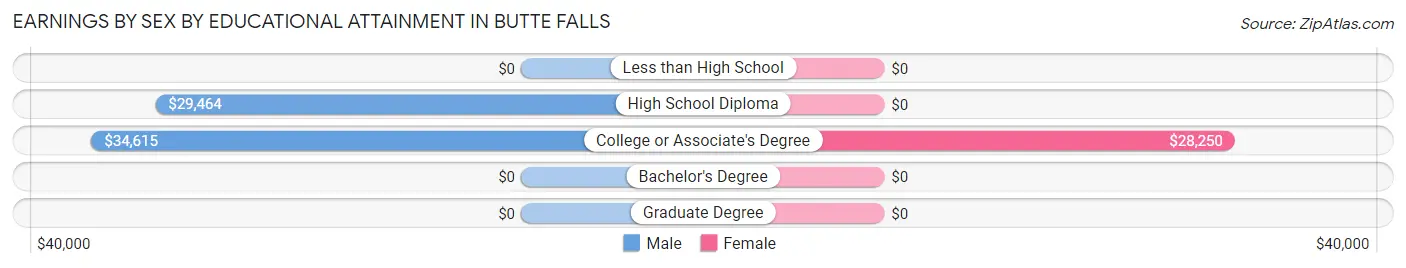
Earnings by Sex by Educational Attainment in Butte Falls
Average earnings in Butte Falls are $34,355 for men and $27,750 for women, a difference of 19.2%. Men with an educational attainment of college or associate's degree enjoy the highest average annual earnings of $34,615, while those with high school diploma education earn the least with $29,464. Women with an educational attainment of college or associate's degree earn the most with the average annual earnings of $28,250, while those with college or associate's degree education have the smallest earnings of $28,250.
| Educational Attainment | Male Income | Female Income |
| Less than High School | - | - |
| High School Diploma | $29,464 | $0 |
| College or Associate's Degree | $34,615 | $28,250 |
| Bachelor's Degree | - | - |
| Graduate Degree | - | - |
| Total | $34,355 | $27,750 |
Family Income in Butte Falls
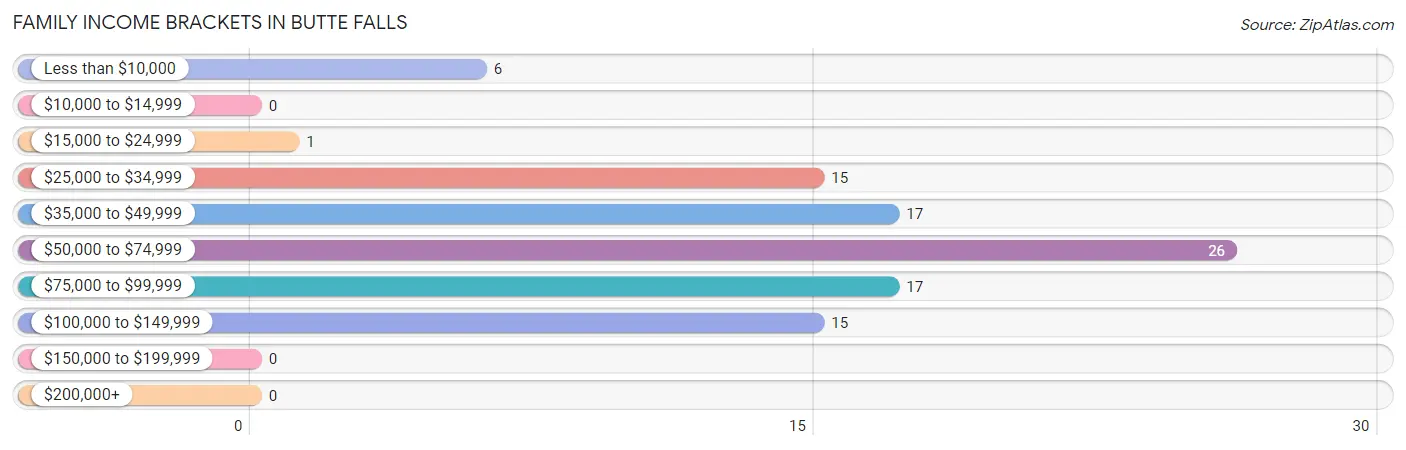
Family Income Brackets in Butte Falls
According to the Butte Falls family income data, there are 26 families falling into the $50,000 to $74,999 income range, which is the most common income bracket and makes up 26.8% of all families.
| Income Bracket | # Families | % Families |
| Less than $10,000 | 6 | 6.2% |
| $10,000 to $14,999 | 0 | 0.0% |
| $15,000 to $24,999 | 1 | 1.0% |
| $25,000 to $34,999 | 15 | 15.5% |
| $35,000 to $49,999 | 17 | 17.5% |
| $50,000 to $74,999 | 26 | 26.8% |
| $75,000 to $99,999 | 17 | 17.5% |
| $100,000 to $149,999 | 15 | 15.5% |
| $150,000 to $199,999 | 0 | 0.0% |
| $200,000+ | 0 | 0.0% |
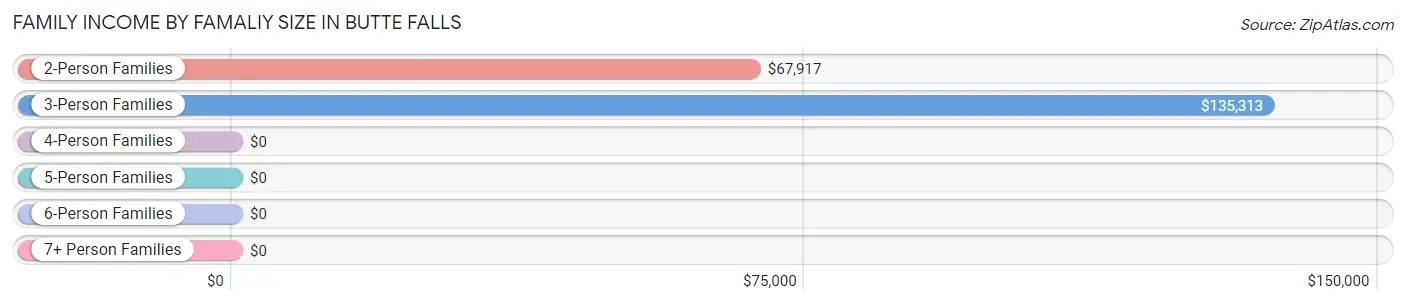
Family Income by Famaliy Size in Butte Falls
3-person families (7 | 7.2%) account for the highest median family income in Butte Falls with $135,313 per family, while 3-person families (7 | 7.2%) have the highest median income of $45,104 per family member.
| Income Bracket | # Families | Median Income |
| 2-Person Families | 71 (73.2%) | $67,917 |
| 3-Person Families | 7 (7.2%) | $135,313 |
| 4-Person Families | 6 (6.2%) | $0 |
| 5-Person Families | 9 (9.3%) | $0 |
| 6-Person Families | 0 (0.0%) | $0 |
| 7+ Person Families | 4 (4.1%) | $0 |
| Total | 97 (100.0%) | $67,583 |
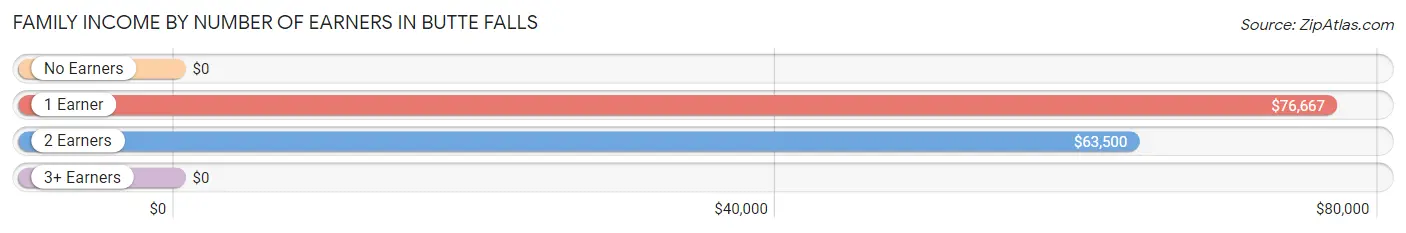
Family Income by Number of Earners in Butte Falls
| Number of Earners | # Families | Median Income |
| No Earners | 31 (32.0%) | $0 |
| 1 Earner | 32 (33.0%) | $76,667 |
| 2 Earners | 30 (30.9%) | $63,500 |
| 3+ Earners | 4 (4.1%) | $0 |
| Total | 97 (100.0%) | $67,583 |
Household Income in Butte Falls
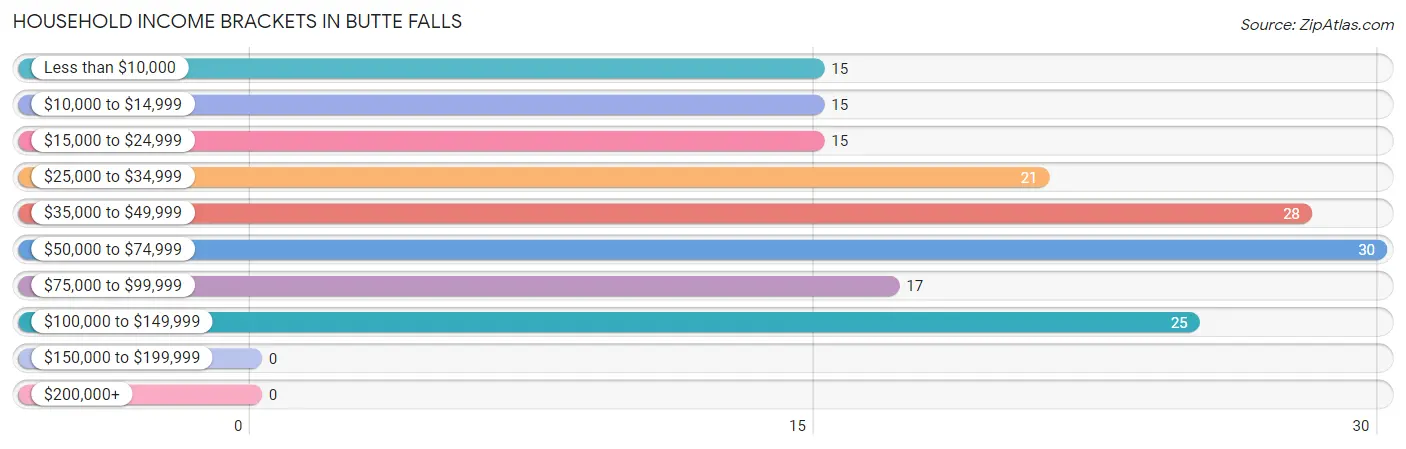
Household Income Brackets in Butte Falls
With 30 households falling in the category, the $50,000 to $74,999 income range is the most frequent in Butte Falls, accounting for 18.1% of all households.
| Income Bracket | # Households | % Households |
| Less than $10,000 | 15 | 9.0% |
| $10,000 to $14,999 | 15 | 9.0% |
| $15,000 to $24,999 | 15 | 9.0% |
| $25,000 to $34,999 | 21 | 12.7% |
| $35,000 to $49,999 | 28 | 16.9% |
| $50,000 to $74,999 | 30 | 18.1% |
| $75,000 to $99,999 | 17 | 10.2% |
| $100,000 to $149,999 | 25 | 15.1% |
| $150,000 to $199,999 | 0 | 0.0% |
| $200,000+ | 0 | 0.0% |
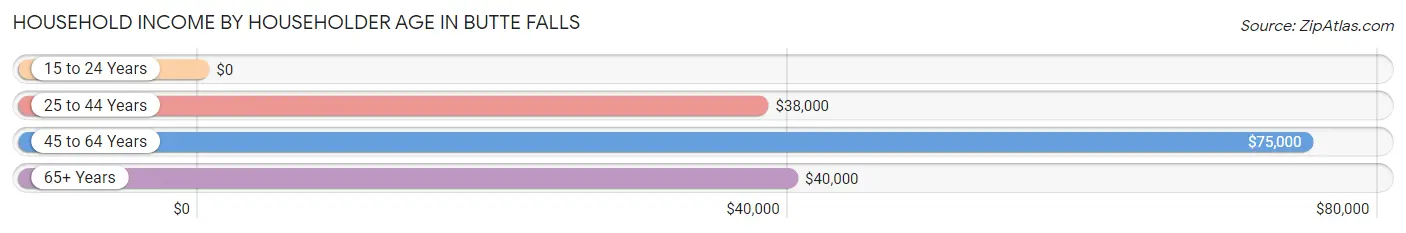
Household Income by Householder Age in Butte Falls
The median household income in Butte Falls is $45,357, with the highest median household income of $75,000 found in the 45 to 64 years age bracket for the primary householder. A total of 54 households (32.5%) fall into this category.
| Income Bracket | # Households | Median Income |
| 15 to 24 Years | 0 (0.0%) | $0 |
| 25 to 44 Years | 38 (22.9%) | $38,000 |
| 45 to 64 Years | 54 (32.5%) | $75,000 |
| 65+ Years | 74 (44.6%) | $40,000 |
| Total | 166 (100.0%) | $45,357 |
Poverty in Butte Falls
Income Below Poverty by Sex and Age in Butte Falls
With 25.0% poverty level for males and 5.6% for females among the residents of Butte Falls, 18 to 24 year old males and 55 to 64 year old females are the most vulnerable to poverty, with 12 males (80.0%) and 4 females (16.7%) in their respective age groups living below the poverty level.
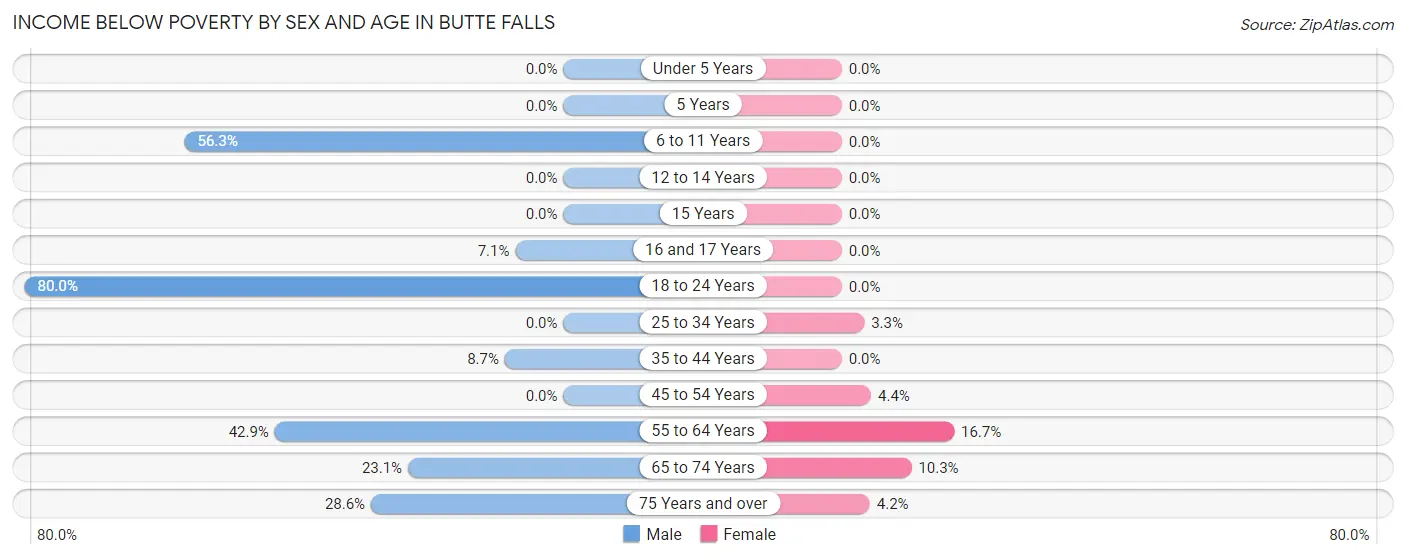
| Age Bracket | Male | Female |
| Under 5 Years | 0 (0.0%) | 0 (0.0%) |
| 5 Years | 0 (0.0%) | 0 (0.0%) |
| 6 to 11 Years | 9 (56.2%) | 0 (0.0%) |
| 12 to 14 Years | 0 (0.0%) | 0 (0.0%) |
| 15 Years | 0 (0.0%) | 0 (0.0%) |
| 16 and 17 Years | 1 (7.1%) | 0 (0.0%) |
| 18 to 24 Years | 12 (80.0%) | 0 (0.0%) |
| 25 to 34 Years | 0 (0.0%) | 1 (3.3%) |
| 35 to 44 Years | 6 (8.7%) | 0 (0.0%) |
| 45 to 54 Years | 0 (0.0%) | 1 (4.3%) |
| 55 to 64 Years | 15 (42.9%) | 4 (16.7%) |
| 65 to 74 Years | 6 (23.1%) | 3 (10.3%) |
| 75 Years and over | 4 (28.6%) | 1 (4.2%) |
| Total | 53 (25.0%) | 10 (5.6%) |
Income Above Poverty by Sex and Age in Butte Falls
According to the poverty statistics in Butte Falls, males aged under 5 years and females aged under 5 years are the age groups that are most secure financially, with 100.0% of males and 100.0% of females in these age groups living above the poverty line.
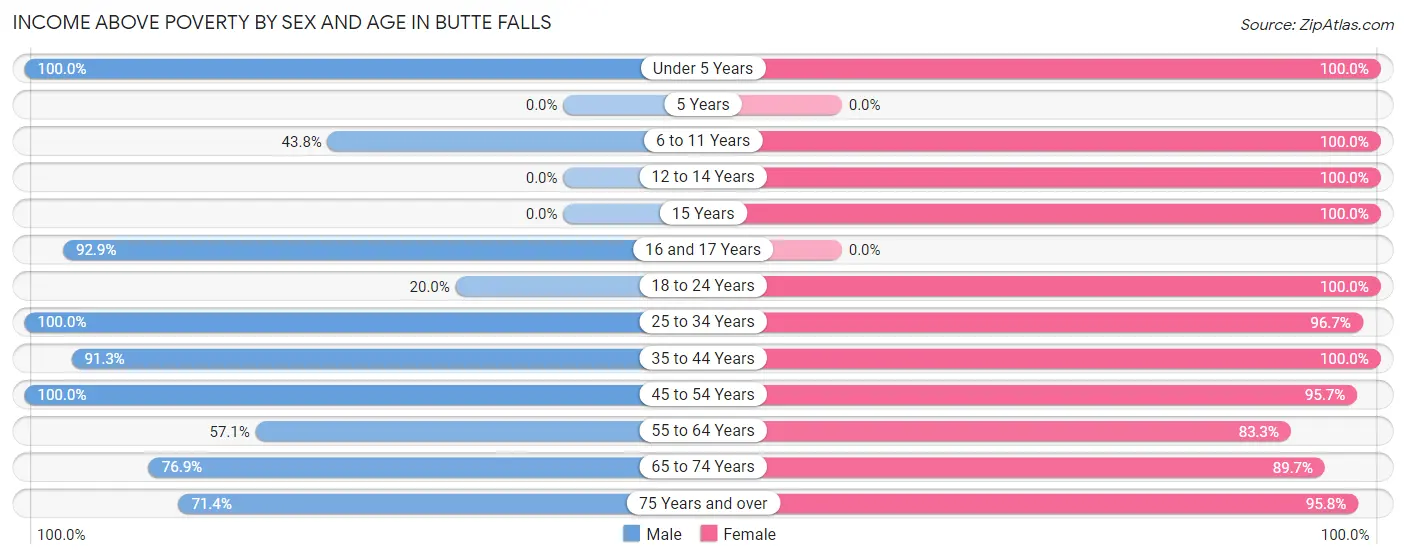
| Age Bracket | Male | Female |
| Under 5 Years | 3 (100.0%) | 8 (100.0%) |
| 5 Years | 0 (0.0%) | 0 (0.0%) |
| 6 to 11 Years | 7 (43.8%) | 14 (100.0%) |
| 12 to 14 Years | 0 (0.0%) | 6 (100.0%) |
| 15 Years | 0 (0.0%) | 8 (100.0%) |
| 16 and 17 Years | 13 (92.9%) | 0 (0.0%) |
| 18 to 24 Years | 3 (20.0%) | 6 (100.0%) |
| 25 to 34 Years | 4 (100.0%) | 29 (96.7%) |
| 35 to 44 Years | 63 (91.3%) | 7 (100.0%) |
| 45 to 54 Years | 16 (100.0%) | 22 (95.7%) |
| 55 to 64 Years | 20 (57.1%) | 20 (83.3%) |
| 65 to 74 Years | 20 (76.9%) | 26 (89.7%) |
| 75 Years and over | 10 (71.4%) | 23 (95.8%) |
| Total | 159 (75.0%) | 169 (94.4%) |
Income Below Poverty Among Married-Couple Families in Butte Falls
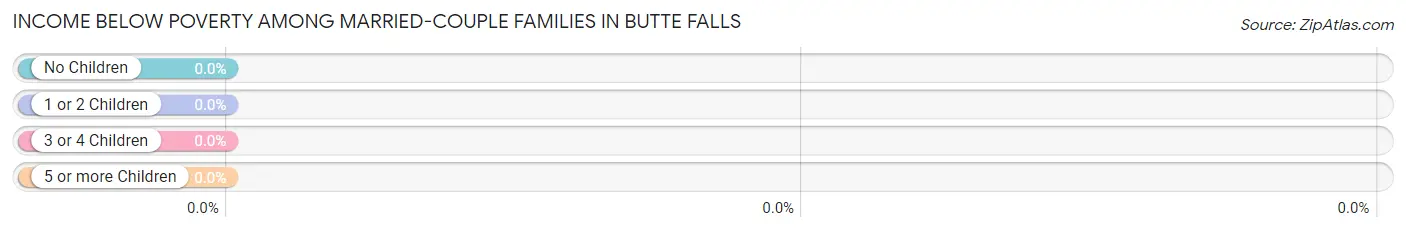
| Children | Above Poverty | Below Poverty |
| No Children | 56 (100.0%) | 0 (0.0%) |
| 1 or 2 Children | 6 (100.0%) | 0 (0.0%) |
| 3 or 4 Children | 13 (100.0%) | 0 (0.0%) |
| 5 or more Children | 0 (0.0%) | 0 (0.0%) |
| Total | 75 (100.0%) | 0 (0.0%) |
Income Below Poverty Among Single-Parent Households in Butte Falls
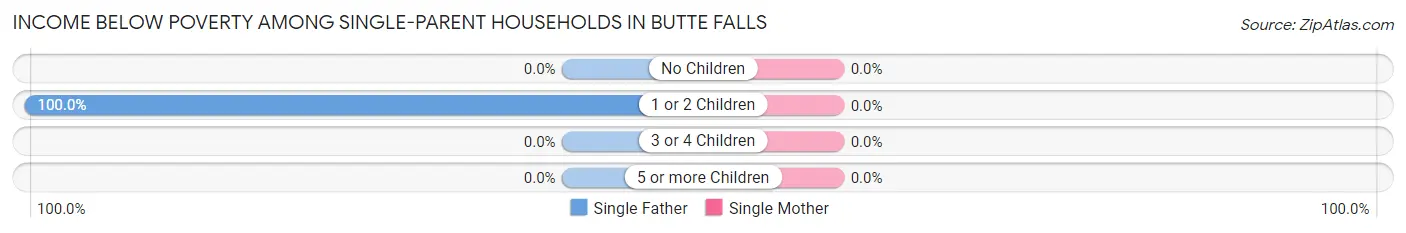
| Children | Single Father | Single Mother |
| No Children | 0 (0.0%) | 0 (0.0%) |
| 1 or 2 Children | 6 (100.0%) | 0 (0.0%) |
| 3 or 4 Children | 0 (0.0%) | 0 (0.0%) |
| 5 or more Children | 0 (0.0%) | 0 (0.0%) |
| Total | 6 (42.9%) | 0 (0.0%) |
Income Below Poverty Among Married-Couple vs Single-Parent Households in Butte Falls
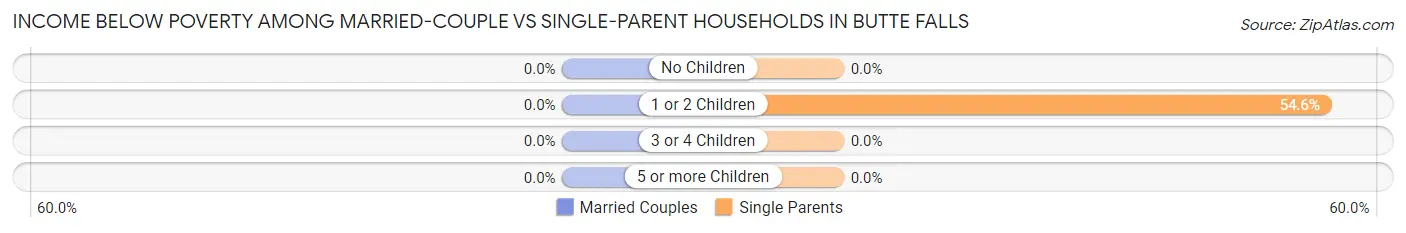
| Children | Married-Couple Families | Single-Parent Households |
| No Children | 0 (0.0%) | 0 (0.0%) |
| 1 or 2 Children | 0 (0.0%) | 6 (54.5%) |
| 3 or 4 Children | 0 (0.0%) | 0 (0.0%) |
| 5 or more Children | 0 (0.0%) | 0 (0.0%) |
| Total | 0 (0.0%) | 6 (27.3%) |
Race in Butte Falls
The most populous races in Butte Falls are White / Caucasian (339 | 84.5%), Two or more Races (46 | 11.5%), and Hawaiian / Pacific (16 | 4.0%).
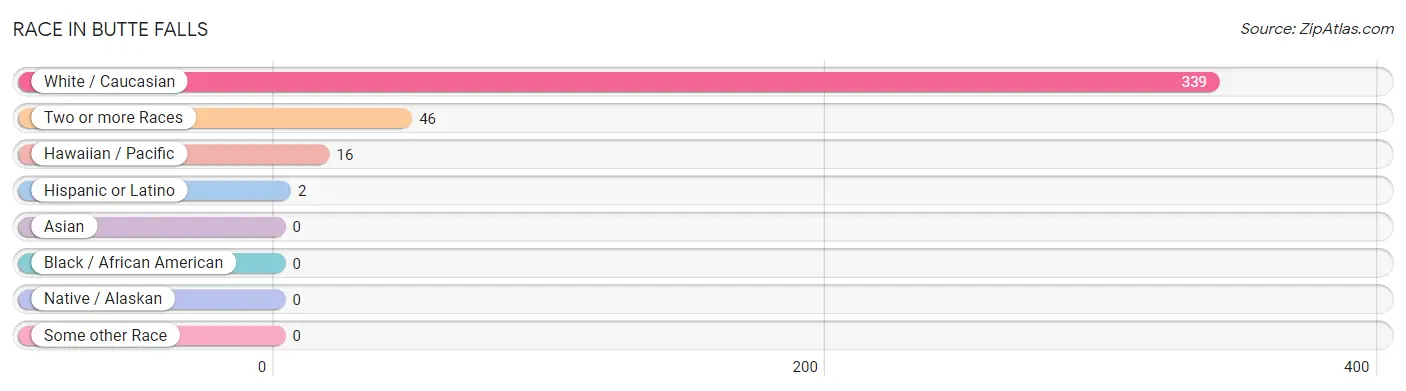
| Race | # Population | % Population |
| Asian | 0 | 0.0% |
| Black / African American | 0 | 0.0% |
| Hawaiian / Pacific | 16 | 4.0% |
| Hispanic or Latino | 2 | 0.5% |
| Native / Alaskan | 0 | 0.0% |
| White / Caucasian | 339 | 84.5% |
| Two or more Races | 46 | 11.5% |
| Some other Race | 0 | 0.0% |
| Total | 401 | 100.0% |
Ancestry in Butte Falls
The most populous ancestries reported in Butte Falls are German (107 | 26.7%), English (83 | 20.7%), Irish (69 | 17.2%), Indian (Asian) (31 | 7.7%), and Northern European (21 | 5.2%), together accounting for 77.6% of all Butte Falls residents.
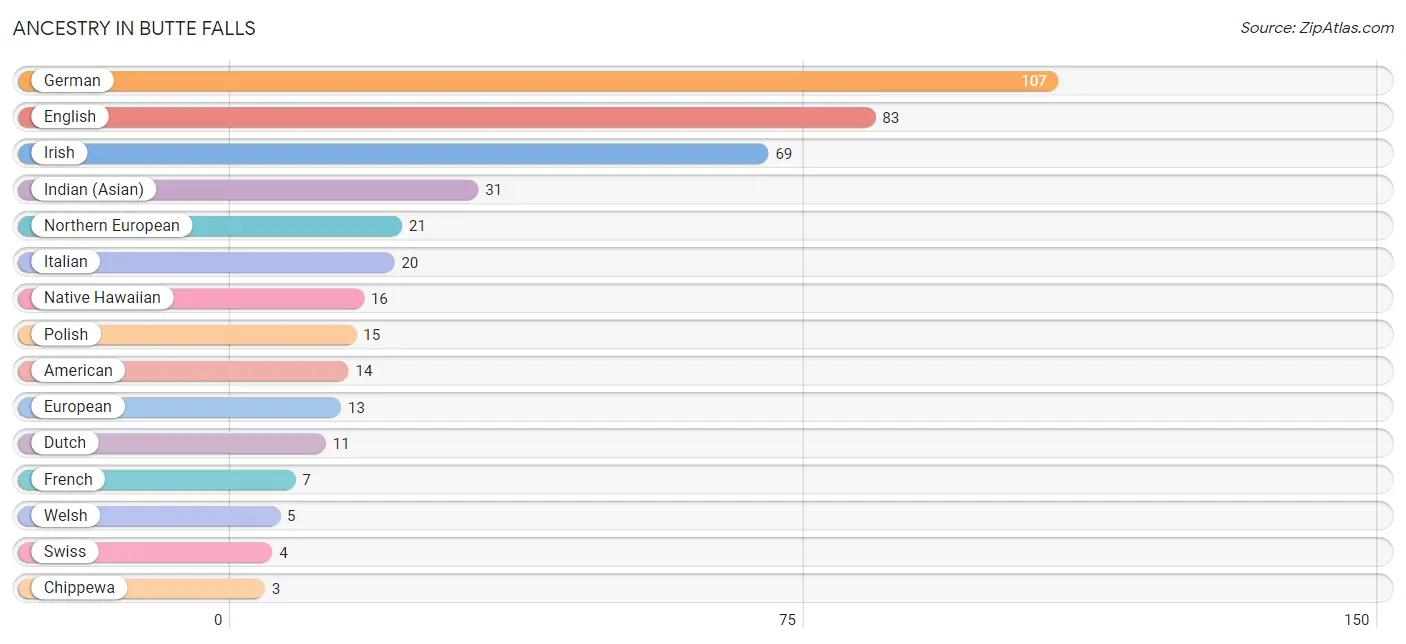
| Ancestry | # Population | % Population |
| American | 14 | 3.5% |
| Chippewa | 3 | 0.7% |
| Choctaw | 1 | 0.3% |
| Dutch | 11 | 2.7% |
| English | 83 | 20.7% |
| European | 13 | 3.2% |
| French | 7 | 1.8% |
| French Canadian | 1 | 0.3% |
| German | 107 | 26.7% |
| Indian (Asian) | 31 | 7.7% |
| Irish | 69 | 17.2% |
| Italian | 20 | 5.0% |
| Mexican | 1 | 0.3% |
| Native Hawaiian | 16 | 4.0% |
| Northern European | 21 | 5.2% |
| Polish | 15 | 3.7% |
| Portuguese | 2 | 0.5% |
| Scotch-Irish | 1 | 0.3% |
| Swiss | 4 | 1.0% |
| Welsh | 5 | 1.3% | View All 20 Rows |
Immigrants in Butte Falls
The most numerous immigrant groups reported in Butte Falls came from Canada (22 | 5.5%), Central America (1 | 0.3%), Europe (1 | 0.3%), Germany (1 | 0.3%), and Latin America (1 | 0.3%), together accounting for 6.5% of all Butte Falls residents.
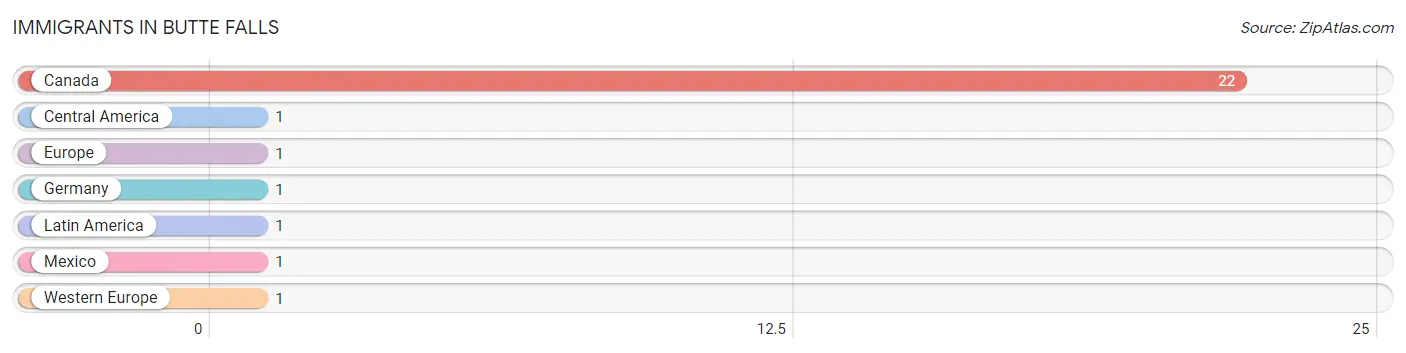
| Immigration Origin | # Population | % Population |
| Canada | 22 | 5.5% |
| Central America | 1 | 0.3% |
| Europe | 1 | 0.3% |
| Germany | 1 | 0.3% |
| Latin America | 1 | 0.3% |
| Mexico | 1 | 0.3% |
| Western Europe | 1 | 0.3% | View All 7 Rows |
Sex and Age in Butte Falls
Sex and Age in Butte Falls
The most populous age groups in Butte Falls are 35 to 39 Years (52 | 23.4%) for men and 65 to 69 Years (23 | 12.9%) for women.
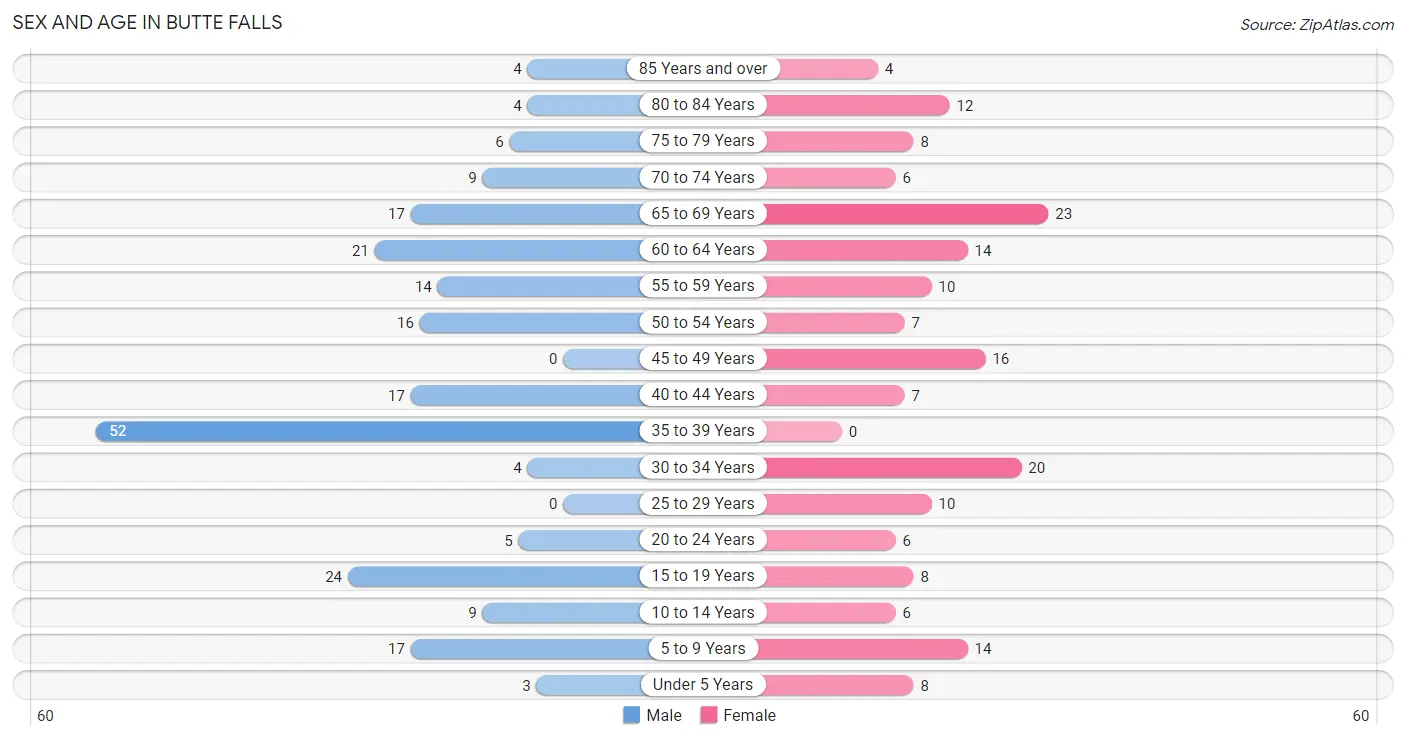
| Age Bracket | Male | Female |
| Under 5 Years | 3 (1.3%) | 8 (4.5%) |
| 5 to 9 Years | 17 (7.7%) | 14 (7.8%) |
| 10 to 14 Years | 9 (4.1%) | 6 (3.4%) |
| 15 to 19 Years | 24 (10.8%) | 8 (4.5%) |
| 20 to 24 Years | 5 (2.2%) | 6 (3.4%) |
| 25 to 29 Years | 0 (0.0%) | 10 (5.6%) |
| 30 to 34 Years | 4 (1.8%) | 20 (11.2%) |
| 35 to 39 Years | 52 (23.4%) | 0 (0.0%) |
| 40 to 44 Years | 17 (7.7%) | 7 (3.9%) |
| 45 to 49 Years | 0 (0.0%) | 16 (8.9%) |
| 50 to 54 Years | 16 (7.2%) | 7 (3.9%) |
| 55 to 59 Years | 14 (6.3%) | 10 (5.6%) |
| 60 to 64 Years | 21 (9.5%) | 14 (7.8%) |
| 65 to 69 Years | 17 (7.7%) | 23 (12.9%) |
| 70 to 74 Years | 9 (4.1%) | 6 (3.4%) |
| 75 to 79 Years | 6 (2.7%) | 8 (4.5%) |
| 80 to 84 Years | 4 (1.8%) | 12 (6.7%) |
| 85 Years and over | 4 (1.8%) | 4 (2.2%) |
| Total | 222 (100.0%) | 179 (100.0%) |
Families and Households in Butte Falls
Median Family Size in Butte Falls
The median family size in Butte Falls is 2.87 persons per family, with married-couple families (75 | 77.3%) accounting for the largest median family size of 2.89 persons per family. On the other hand, single female/mother families (8 | 8.3%) represent the smallest median family size with 2.75 persons per family.
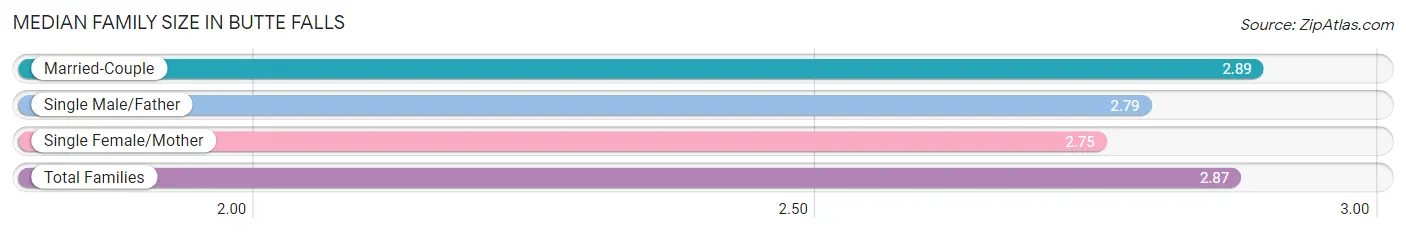
| Family Type | # Families | Family Size |
| Married-Couple | 75 (77.3%) | 2.89 |
| Single Male/Father | 14 (14.4%) | 2.79 |
| Single Female/Mother | 8 (8.3%) | 2.75 |
| Total Families | 97 (100.0%) | 2.87 |
Median Household Size in Butte Falls
The median household size in Butte Falls is 2.40 persons per household, with married-couple households (75 | 45.2%) accounting for the largest median household size of 3.29 persons per household. non-family households (69 | 41.6%) represent the smallest median household size with 1.22 persons per household.
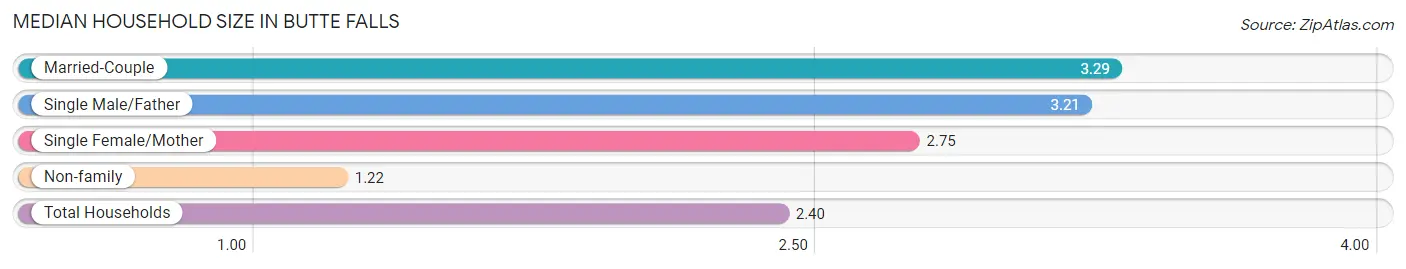
| Household Type | # Households | Household Size |
| Married-Couple | 75 (45.2%) | 3.29 |
| Single Male/Father | 14 (8.4%) | 3.21 |
| Single Female/Mother | 8 (4.8%) | 2.75 |
| Non-family | 69 (41.6%) | 1.22 |
| Total Households | 166 (100.0%) | 2.40 |
Household Size by Marriage Status in Butte Falls
Out of a total of 166 households in Butte Falls, 97 (58.4%) are family households, while 69 (41.6%) are nonfamily households. The most numerous type of family households are 2-person households, comprising 64, and the most common type of nonfamily households are 1-person households, comprising 56.
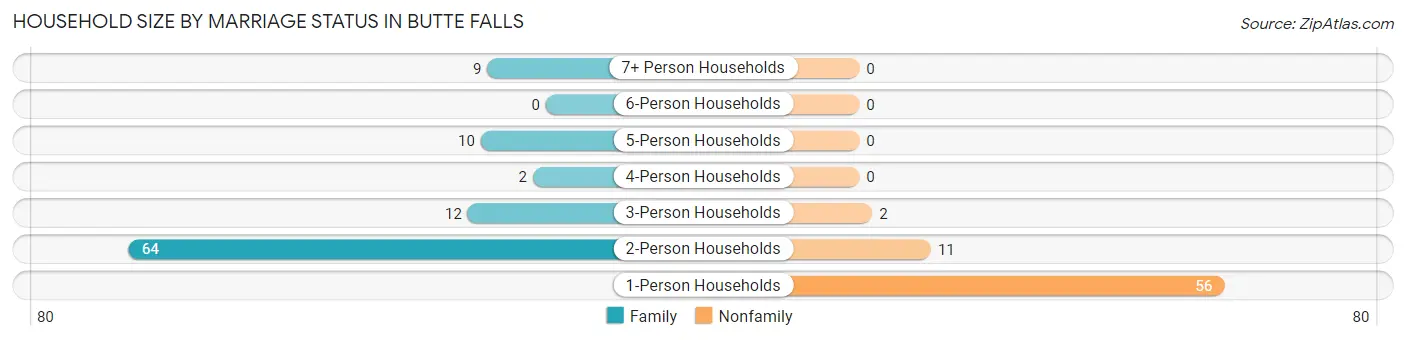
| Household Size | Family Households | Nonfamily Households |
| 1-Person Households | - | 56 (33.7%) |
| 2-Person Households | 64 (38.6%) | 11 (6.6%) |
| 3-Person Households | 12 (7.2%) | 2 (1.2%) |
| 4-Person Households | 2 (1.2%) | 0 (0.0%) |
| 5-Person Households | 10 (6.0%) | 0 (0.0%) |
| 6-Person Households | 0 (0.0%) | 0 (0.0%) |
| 7+ Person Households | 9 (5.4%) | 0 (0.0%) |
| Total | 97 (58.4%) | 69 (41.6%) |
Female Fertility in Butte Falls
Fertility by Age in Butte Falls
| Age Bracket | Women with Births | Births / 1,000 Women |
| 15 to 19 years | 0 (0.0%) | 0.0 |
| 20 to 34 years | 0 (0.0%) | 0.0 |
| 35 to 50 years | 0 (0.0%) | 0.0 |
| Total | 0 (0.0%) | 0.0 |
Fertility by Age by Marriage Status in Butte Falls
| Age Bracket | Married | Unmarried |
| 15 to 19 years | 0 (0.0%) | 0 (0.0%) |
| 20 to 34 years | 0 (0.0%) | 0 (0.0%) |
| 35 to 50 years | 0 (0.0%) | 0 (0.0%) |
| Total | 0 (0.0%) | 0 (0.0%) |
Fertility by Education in Butte Falls
| Educational Attainment | Women with Births | Births / 1,000 Women |
| Less than High School | 0 (0.0%) | 0.0 |
| High School Diploma | 0 (0.0%) | 0.0 |
| College or Associate's Degree | 0 (0.0%) | 0.0 |
| Bachelor's Degree | 0 (0.0%) | 0.0 |
| Graduate Degree | 0 (0.0%) | 0.0 |
| Total | 0 (0.0%) | 0.0 |
Fertility by Education by Marriage Status in Butte Falls
| Educational Attainment | Married | Unmarried |
| Less than High School | 0 (0.0%) | 0 (0.0%) |
| High School Diploma | 0 (0.0%) | 0 (0.0%) |
| College or Associate's Degree | 0 (0.0%) | 0 (0.0%) |
| Bachelor's Degree | 0 (0.0%) | 0 (0.0%) |
| Graduate Degree | 0 (0.0%) | 0 (0.0%) |
| Total | 0 (0.0%) | 0 (0.0%) |
Employment Characteristics in Butte Falls
Employment by Class of Employer in Butte Falls
Among the 155 employed individuals in Butte Falls, private company employees (79 | 51.0%), local government employees (35 | 22.6%), and not-for-profit organizations (20 | 12.9%) make up the most common classes of employment.
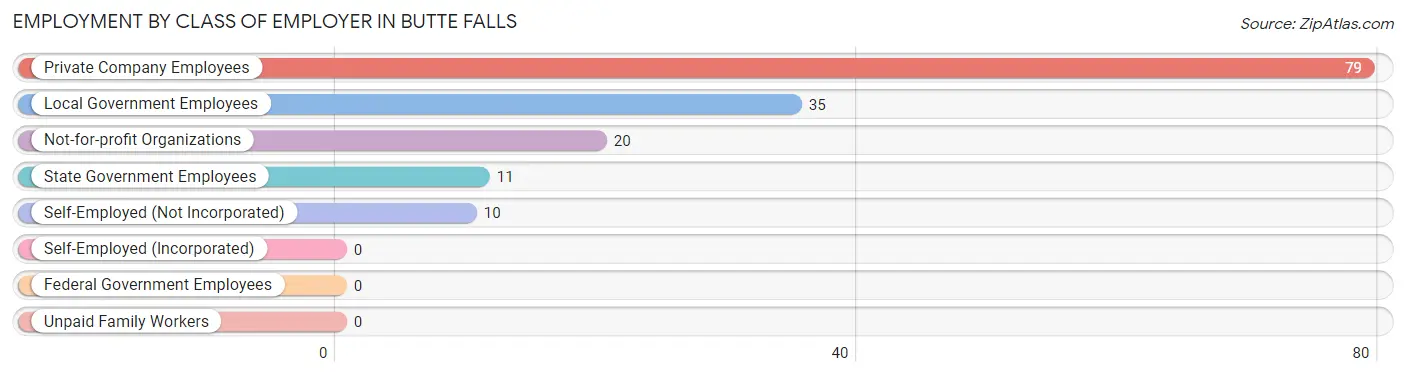
| Employer Class | # Employees | % Employees |
| Private Company Employees | 79 | 51.0% |
| Self-Employed (Incorporated) | 0 | 0.0% |
| Self-Employed (Not Incorporated) | 10 | 6.5% |
| Not-for-profit Organizations | 20 | 12.9% |
| Local Government Employees | 35 | 22.6% |
| State Government Employees | 11 | 7.1% |
| Federal Government Employees | 0 | 0.0% |
| Unpaid Family Workers | 0 | 0.0% |
| Total | 155 | 100.0% |
Employment Status by Age in Butte Falls
According to the labor force statistics for Butte Falls, out of the total population over 16 years of age (336), 53.6% or 180 individuals are in the labor force, with 8.9% or 16 of them unemployed. The age group with the highest labor force participation rate is 20 to 24 years, with 100.0% or 11 individuals in the labor force. Within the labor force, the 16 to 19 years age range has the highest percentage of unemployed individuals, with 100.0% or 7 of them being unemployed.
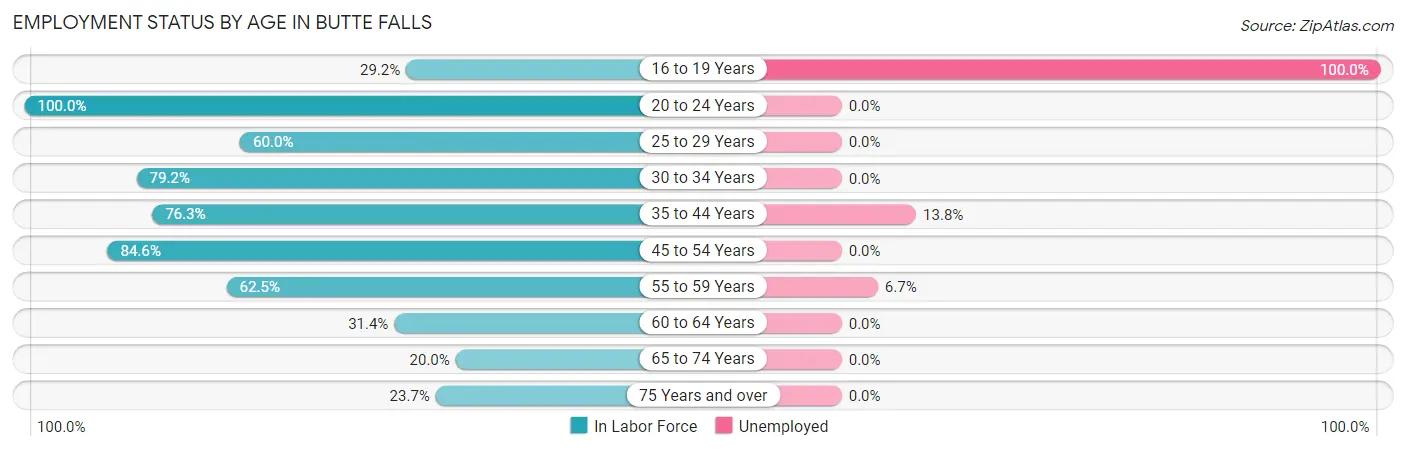
| Age Bracket | In Labor Force | Unemployed |
| 16 to 19 Years | 7 (29.2%) | 7 (100.0%) |
| 20 to 24 Years | 11 (100.0%) | 0 (0.0%) |
| 25 to 29 Years | 6 (60.0%) | 0 (0.0%) |
| 30 to 34 Years | 19 (79.2%) | 0 (0.0%) |
| 35 to 44 Years | 58 (76.3%) | 8 (13.8%) |
| 45 to 54 Years | 33 (84.6%) | 0 (0.0%) |
| 55 to 59 Years | 15 (62.5%) | 1 (6.7%) |
| 60 to 64 Years | 11 (31.4%) | 0 (0.0%) |
| 65 to 74 Years | 11 (20.0%) | 0 (0.0%) |
| 75 Years and over | 9 (23.7%) | 0 (0.0%) |
| Total | 180 (53.6%) | 16 (8.9%) |
Employment Status by Educational Attainment in Butte Falls
According to labor force statistics for Butte Falls, 68.3% of individuals (142) out of the total population between 25 and 64 years of age (208) are in the labor force, with 6.3% or 9 of them being unemployed. The group with the highest labor force participation rate are those with the educational attainment of college / associate degree, with 79.2% or 99 individuals in the labor force. Within the labor force, individuals with high school diploma education have the highest percentage of unemployment, with 26.5% or 9 of them being unemployed.
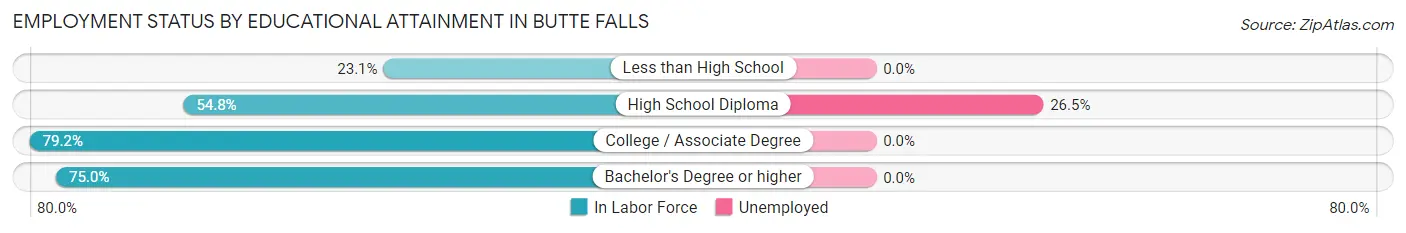
| Educational Attainment | In Labor Force | Unemployed |
| Less than High School | 3 (23.1%) | 0 (0.0%) |
| High School Diploma | 34 (54.8%) | 16 (26.5%) |
| College / Associate Degree | 99 (79.2%) | 0 (0.0%) |
| Bachelor's Degree or higher | 6 (75.0%) | 0 (0.0%) |
| Total | 142 (68.3%) | 13 (6.3%) |
Employment Occupations by Sex in Butte Falls
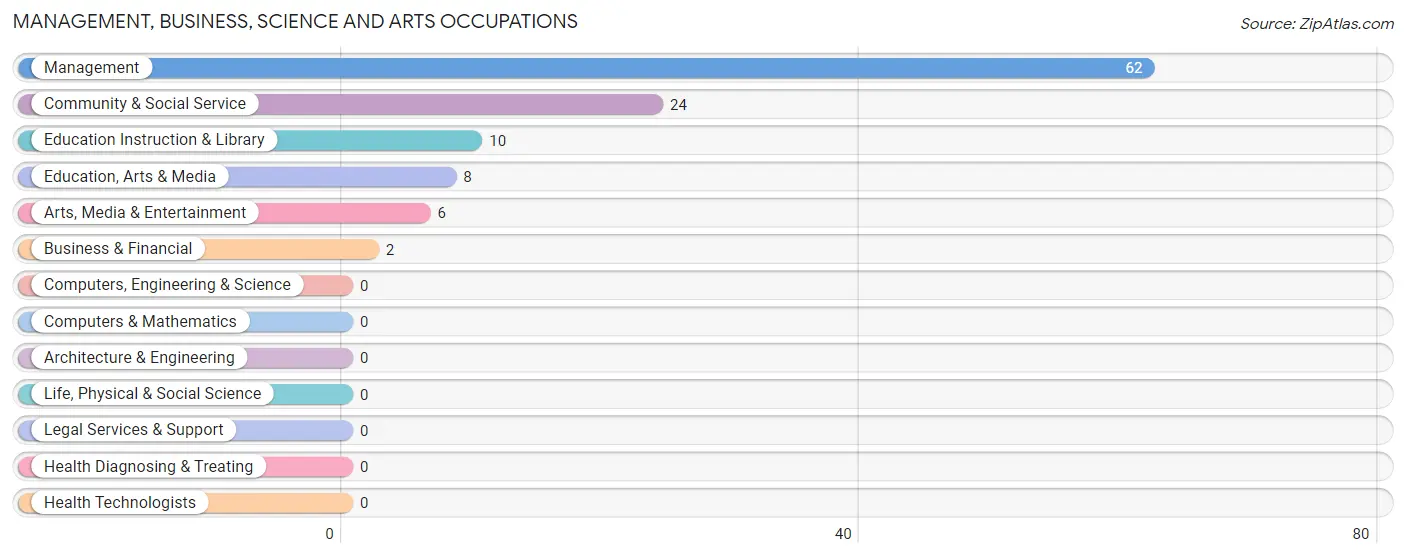
Management, Business, Science and Arts Occupations
The most common Management, Business, Science and Arts occupations in Butte Falls are Management (62 | 37.8%), Community & Social Service (24 | 14.6%), Education Instruction & Library (10 | 6.1%), Education, Arts & Media (8 | 4.9%), and Arts, Media & Entertainment (6 | 3.7%).
Management, Business, Science and Arts Occupations by Sex
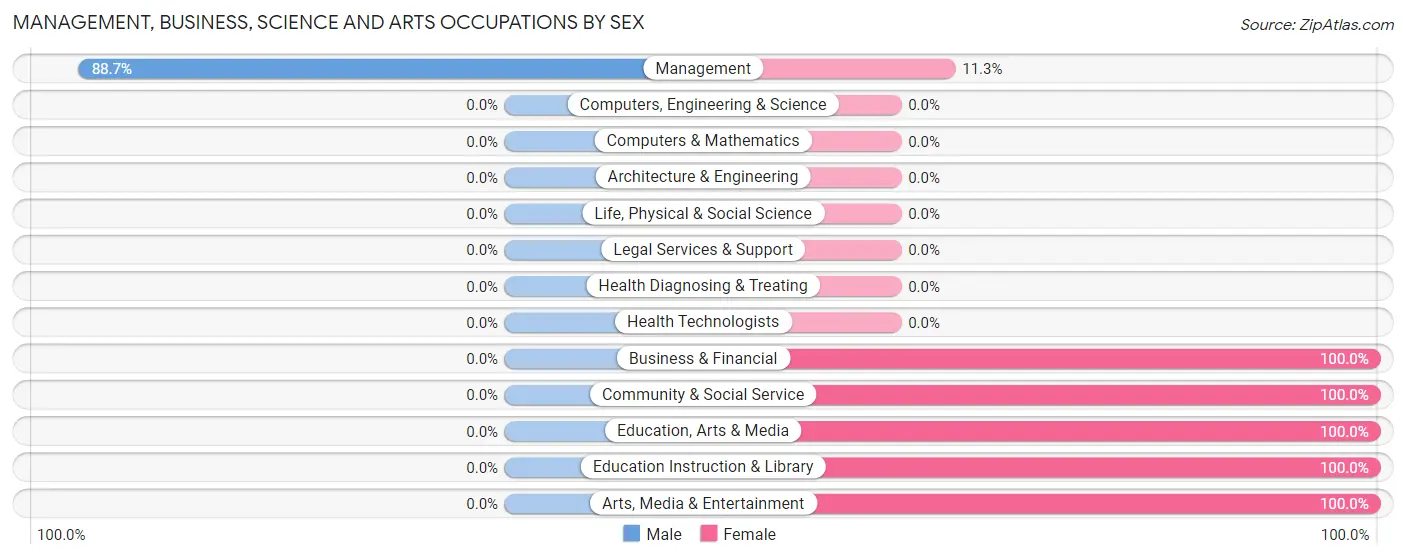
| Occupation | Male | Female |
| Management | 55 (88.7%) | 7 (11.3%) |
| Business & Financial | 0 (0.0%) | 2 (100.0%) |
| Computers, Engineering & Science | 0 (0.0%) | 0 (0.0%) |
| Computers & Mathematics | 0 (0.0%) | 0 (0.0%) |
| Architecture & Engineering | 0 (0.0%) | 0 (0.0%) |
| Life, Physical & Social Science | 0 (0.0%) | 0 (0.0%) |
| Community & Social Service | 0 (0.0%) | 24 (100.0%) |
| Education, Arts & Media | 0 (0.0%) | 8 (100.0%) |
| Legal Services & Support | 0 (0.0%) | 0 (0.0%) |
| Education Instruction & Library | 0 (0.0%) | 10 (100.0%) |
| Arts, Media & Entertainment | 0 (0.0%) | 6 (100.0%) |
| Health Diagnosing & Treating | 0 (0.0%) | 0 (0.0%) |
| Health Technologists | 0 (0.0%) | 0 (0.0%) |
| Total (Category) | 55 (62.5%) | 33 (37.5%) |
| Total (Overall) | 98 (59.8%) | 66 (40.2%) |
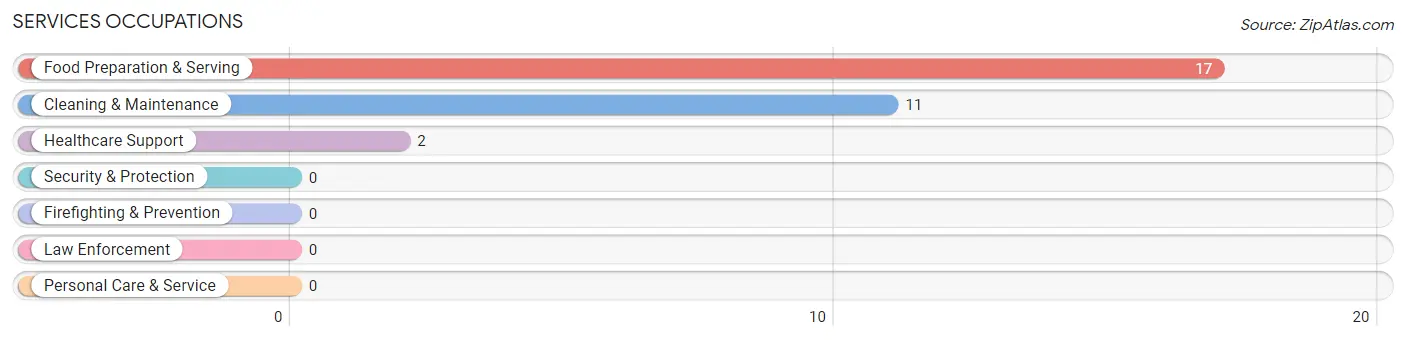
Services Occupations
The most common Services occupations in Butte Falls are Food Preparation & Serving (17 | 10.4%), Cleaning & Maintenance (11 | 6.7%), and Healthcare Support (2 | 1.2%).
Services Occupations by Sex
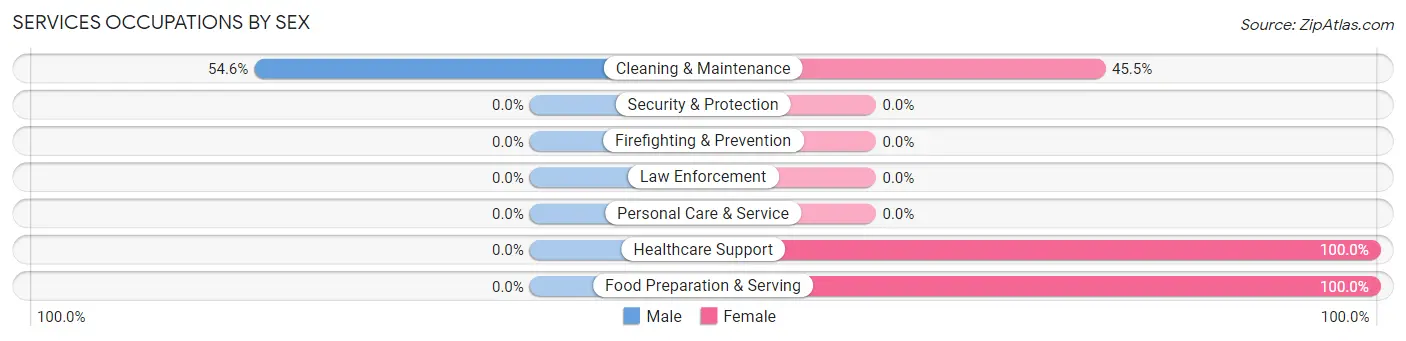
| Occupation | Male | Female |
| Healthcare Support | 0 (0.0%) | 2 (100.0%) |
| Security & Protection | 0 (0.0%) | 0 (0.0%) |
| Firefighting & Prevention | 0 (0.0%) | 0 (0.0%) |
| Law Enforcement | 0 (0.0%) | 0 (0.0%) |
| Food Preparation & Serving | 0 (0.0%) | 17 (100.0%) |
| Cleaning & Maintenance | 6 (54.5%) | 5 (45.5%) |
| Personal Care & Service | 0 (0.0%) | 0 (0.0%) |
| Total (Category) | 6 (20.0%) | 24 (80.0%) |
| Total (Overall) | 98 (59.8%) | 66 (40.2%) |
Sales and Office Occupations
The most common Sales and Office occupations in Butte Falls are Sales & Related (11 | 6.7%), and Office & Administration (2 | 1.2%).
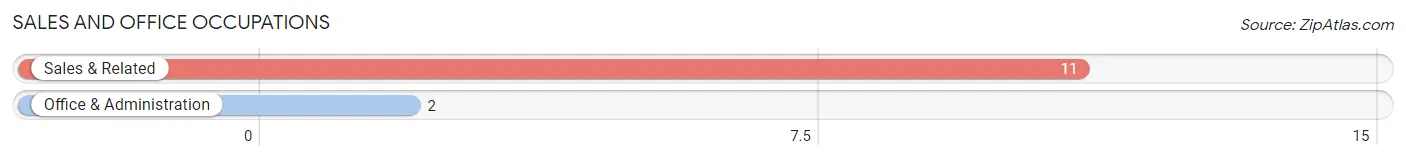
Sales and Office Occupations by Sex
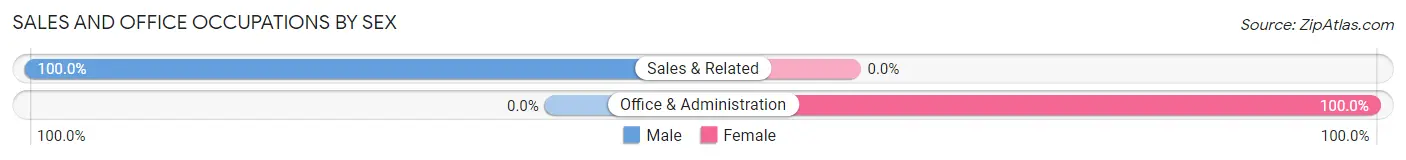
| Occupation | Male | Female |
| Sales & Related | 11 (100.0%) | 0 (0.0%) |
| Office & Administration | 0 (0.0%) | 2 (100.0%) |
| Total (Category) | 11 (84.6%) | 2 (15.4%) |
| Total (Overall) | 98 (59.8%) | 66 (40.2%) |
Natural Resources, Construction and Maintenance Occupations
The most common Natural Resources, Construction and Maintenance occupations in Butte Falls are , and Farming, Fishing & Forestry (5 | 3.0%).
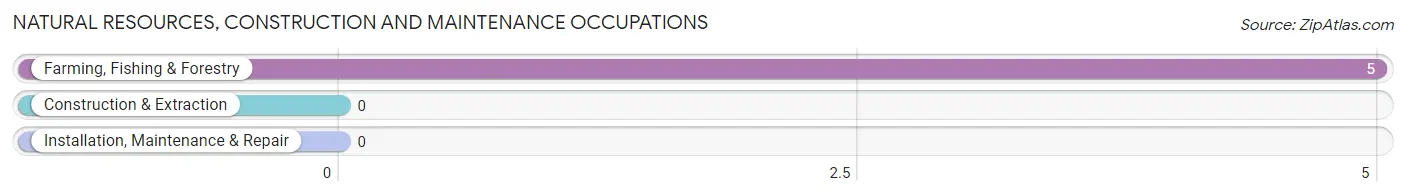
Natural Resources, Construction and Maintenance Occupations by Sex
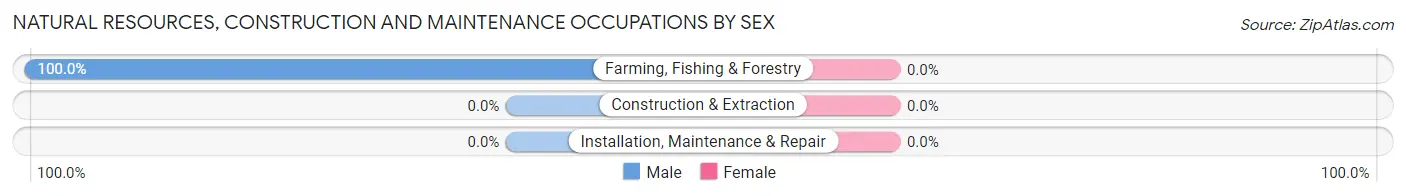
| Occupation | Male | Female |
| Farming, Fishing & Forestry | 5 (100.0%) | 0 (0.0%) |
| Construction & Extraction | 0 (0.0%) | 0 (0.0%) |
| Installation, Maintenance & Repair | 0 (0.0%) | 0 (0.0%) |
| Total (Category) | 5 (100.0%) | 0 (0.0%) |
| Total (Overall) | 98 (59.8%) | 66 (40.2%) |
Production, Transportation and Moving Occupations
The most common Production, Transportation and Moving occupations in Butte Falls are Material Moving (17 | 10.4%), Transportation (6 | 3.7%), and Production (5 | 3.0%).
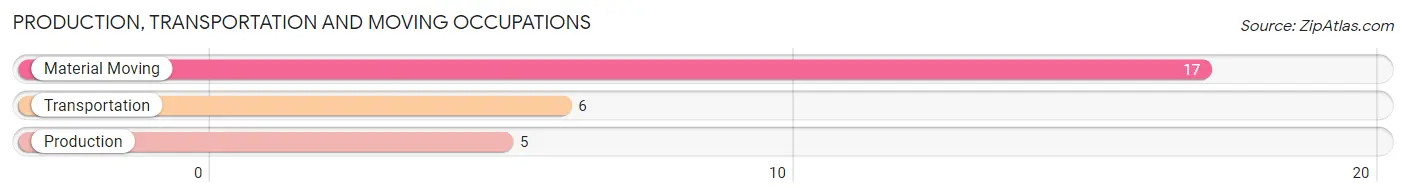
Production, Transportation and Moving Occupations by Sex
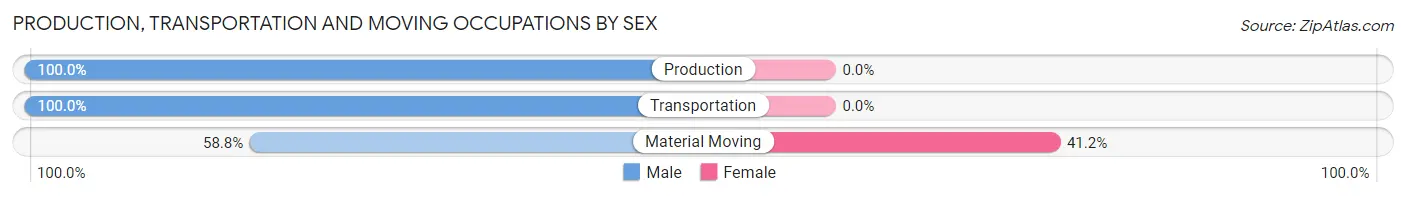
| Occupation | Male | Female |
| Production | 5 (100.0%) | 0 (0.0%) |
| Transportation | 6 (100.0%) | 0 (0.0%) |
| Material Moving | 10 (58.8%) | 7 (41.2%) |
| Total (Category) | 21 (75.0%) | 7 (25.0%) |
| Total (Overall) | 98 (59.8%) | 66 (40.2%) |
Employment Industries by Sex in Butte Falls
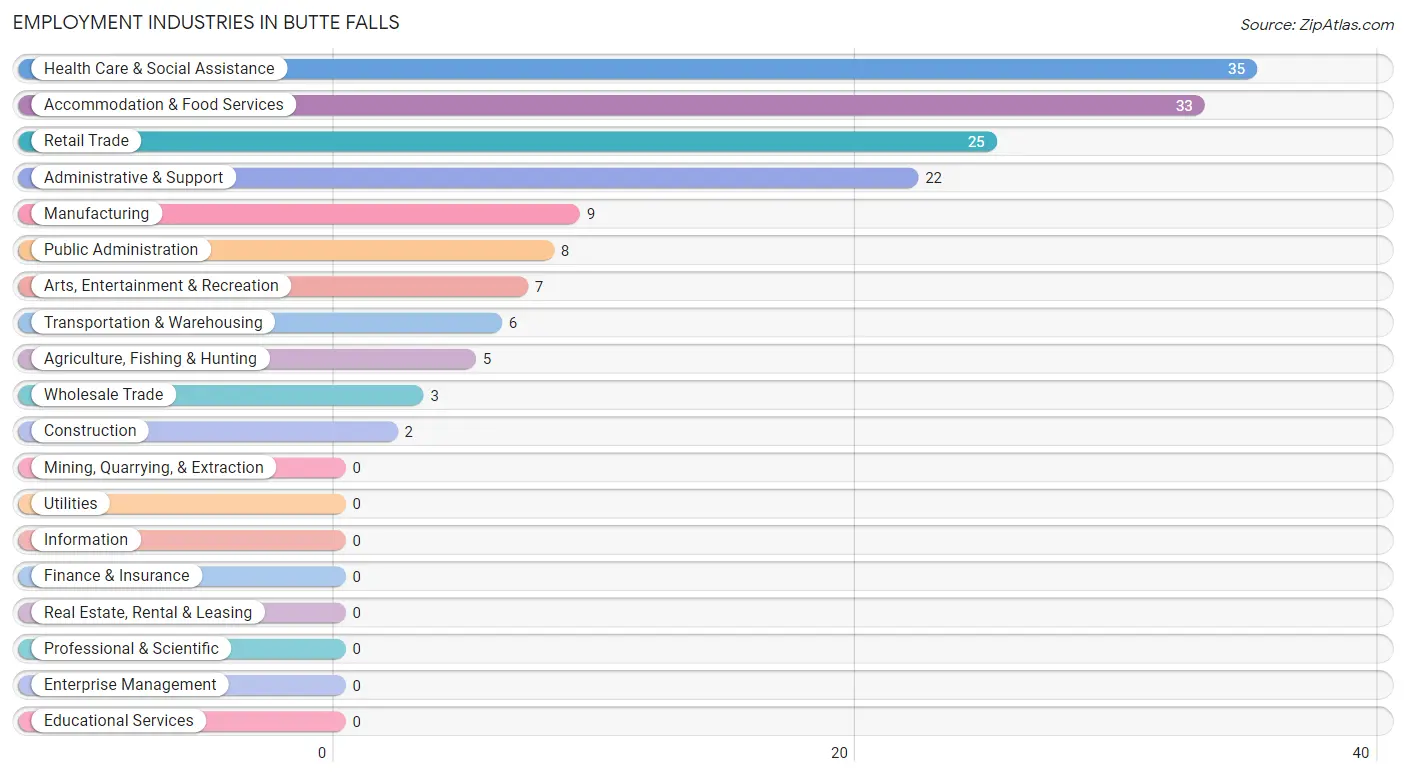
Employment Industries in Butte Falls
The major employment industries in Butte Falls include Health Care & Social Assistance (35 | 21.3%), Accommodation & Food Services (33 | 20.1%), Retail Trade (25 | 15.2%), Administrative & Support (22 | 13.4%), and Manufacturing (9 | 5.5%).
Employment Industries by Sex in Butte Falls
The Butte Falls industries that see more men than women are Agriculture, Fishing & Hunting (100.0%), Manufacturing (100.0%), and Wholesale Trade (100.0%), whereas the industries that tend to have a higher number of women are Construction (100.0%), Health Care & Social Assistance (85.7%), and Accommodation & Food Services (51.5%).
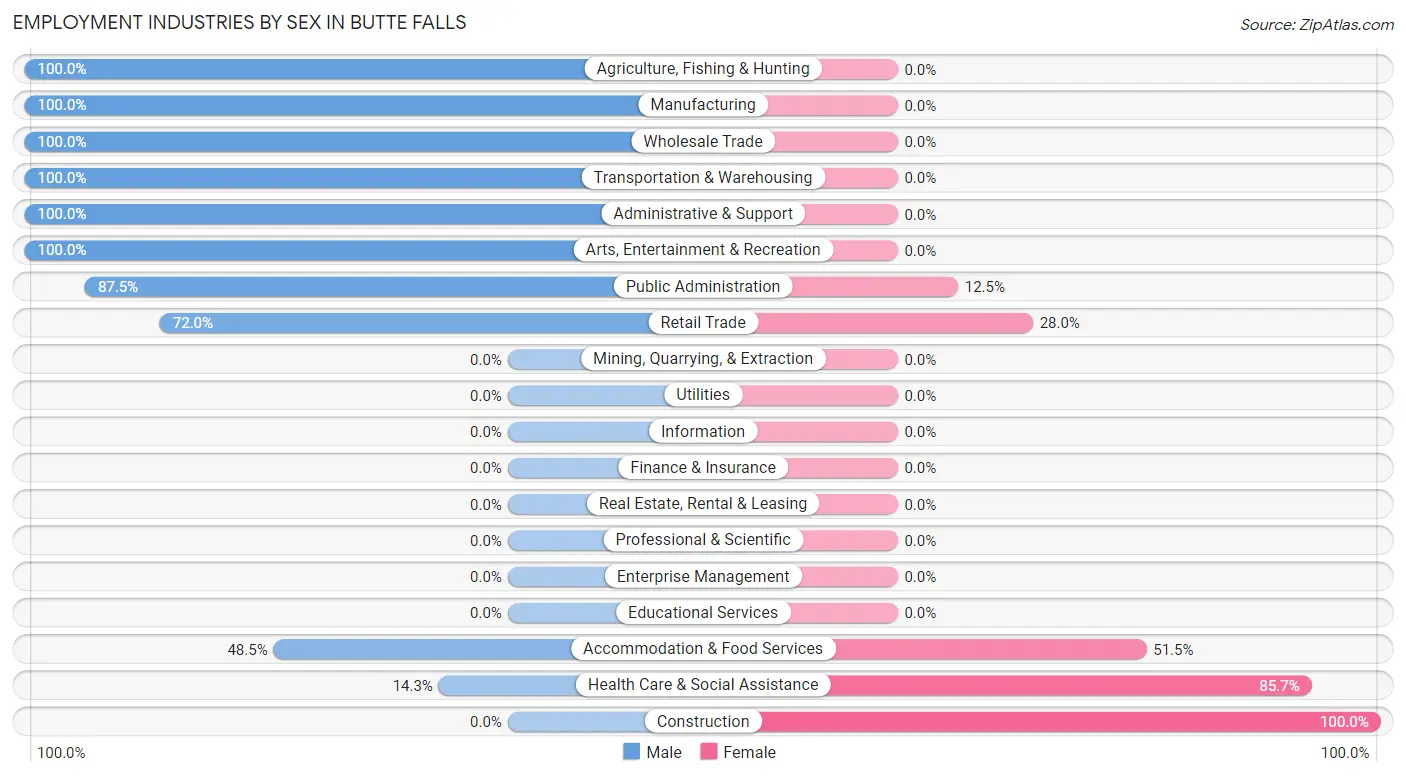
| Industry | Male | Female |
| Agriculture, Fishing & Hunting | 5 (100.0%) | 0 (0.0%) |
| Mining, Quarrying, & Extraction | 0 (0.0%) | 0 (0.0%) |
| Construction | 0 (0.0%) | 2 (100.0%) |
| Manufacturing | 9 (100.0%) | 0 (0.0%) |
| Wholesale Trade | 3 (100.0%) | 0 (0.0%) |
| Retail Trade | 18 (72.0%) | 7 (28.0%) |
| Transportation & Warehousing | 6 (100.0%) | 0 (0.0%) |
| Utilities | 0 (0.0%) | 0 (0.0%) |
| Information | 0 (0.0%) | 0 (0.0%) |
| Finance & Insurance | 0 (0.0%) | 0 (0.0%) |
| Real Estate, Rental & Leasing | 0 (0.0%) | 0 (0.0%) |
| Professional & Scientific | 0 (0.0%) | 0 (0.0%) |
| Enterprise Management | 0 (0.0%) | 0 (0.0%) |
| Administrative & Support | 22 (100.0%) | 0 (0.0%) |
| Educational Services | 0 (0.0%) | 0 (0.0%) |
| Health Care & Social Assistance | 5 (14.3%) | 30 (85.7%) |
| Arts, Entertainment & Recreation | 7 (100.0%) | 0 (0.0%) |
| Accommodation & Food Services | 16 (48.5%) | 17 (51.5%) |
| Public Administration | 7 (87.5%) | 1 (12.5%) |
| Total | 98 (59.8%) | 66 (40.2%) |
Education in Butte Falls
School Enrollment in Butte Falls
The most common levels of schooling among the 92 students in Butte Falls are high school (32 | 34.8%), elementary school (16 | 17.4%), and nursery / preschool (13 | 14.1%).
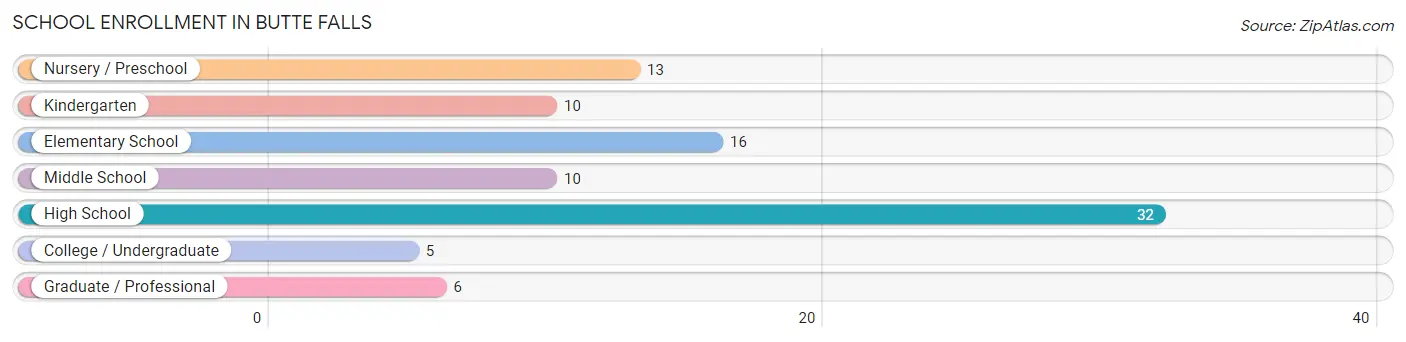
| School Level | # Students | % Students |
| Nursery / Preschool | 13 | 14.1% |
| Kindergarten | 10 | 10.9% |
| Elementary School | 16 | 17.4% |
| Middle School | 10 | 10.9% |
| High School | 32 | 34.8% |
| College / Undergraduate | 5 | 5.4% |
| Graduate / Professional | 6 | 6.5% |
| Total | 92 | 100.0% |
School Enrollment by Age by Funding Source in Butte Falls
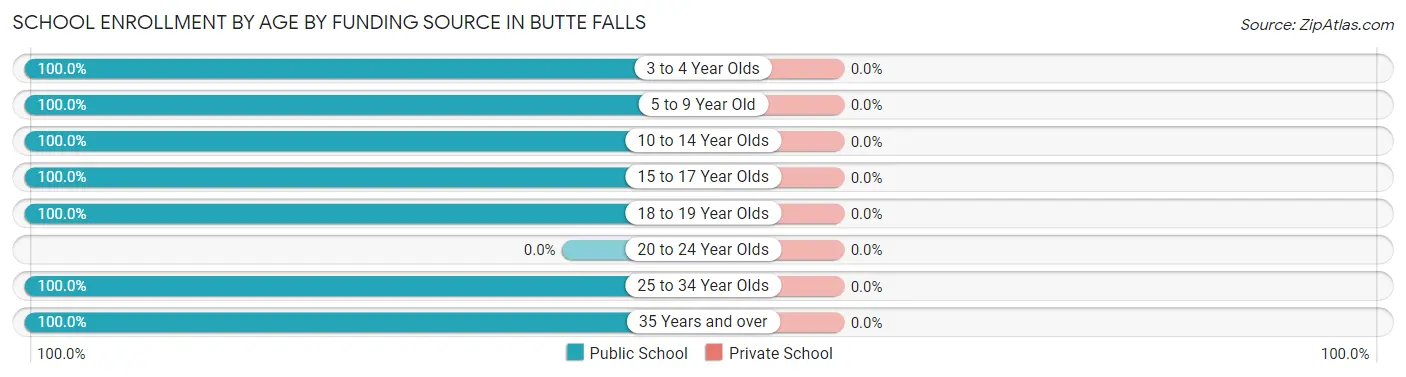
| Age Bracket | Public School | Private School |
| 3 to 4 Year Olds | 3 (100.0%) | 0 (0.0%) |
| 5 to 9 Year Old | 31 (100.0%) | 0 (0.0%) |
| 10 to 14 Year Olds | 15 (100.0%) | 0 (0.0%) |
| 15 to 17 Year Olds | 22 (100.0%) | 0 (0.0%) |
| 18 to 19 Year Olds | 10 (100.0%) | 0 (0.0%) |
| 20 to 24 Year Olds | 0 (0.0%) | 0 (0.0%) |
| 25 to 34 Year Olds | 5 (100.0%) | 0 (0.0%) |
| 35 Years and over | 6 (100.0%) | 0 (0.0%) |
| Total | 92 (100.0%) | 0 (0.0%) |
Educational Attainment by Field of Study in Butte Falls
Education (6 | 31.6%), arts & humanities (6 | 31.6%), social sciences (4 | 21.0%), business (2 | 10.5%), and science & technology (1 | 5.3%) are the most common fields of study among 19 individuals in Butte Falls who have obtained a bachelor's degree or higher.
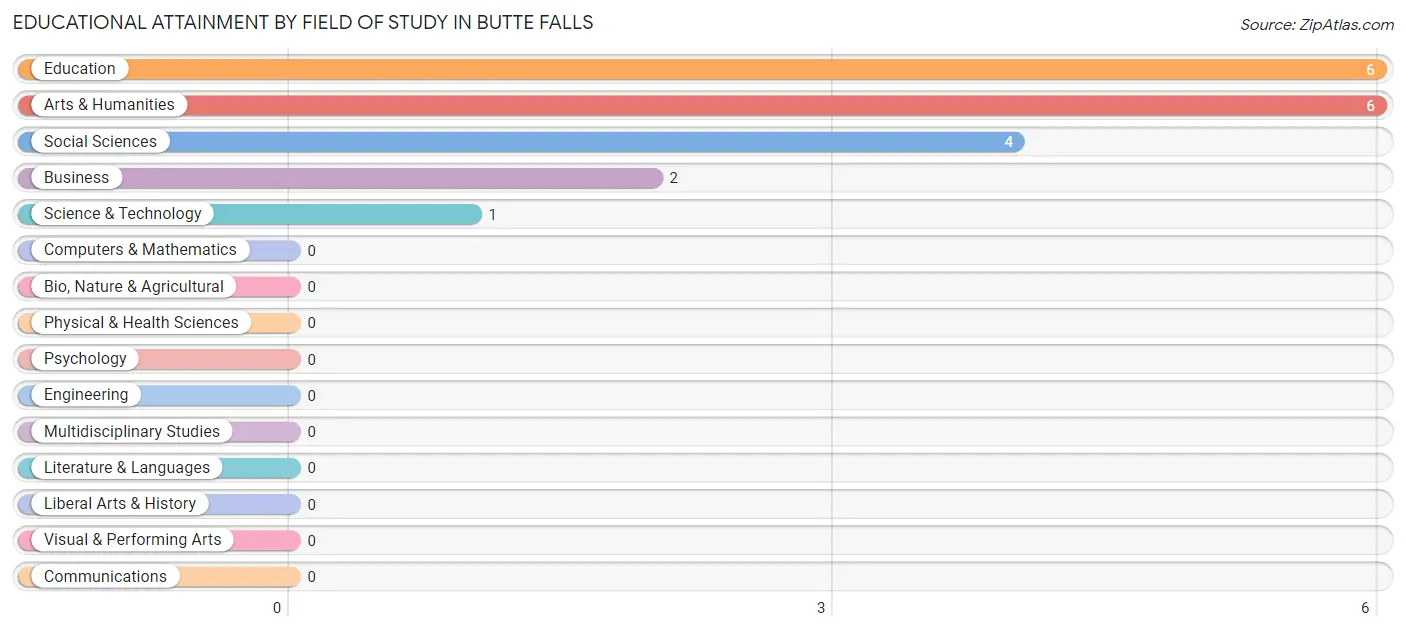
| Field of Study | # Graduates | % Graduates |
| Computers & Mathematics | 0 | 0.0% |
| Bio, Nature & Agricultural | 0 | 0.0% |
| Physical & Health Sciences | 0 | 0.0% |
| Psychology | 0 | 0.0% |
| Social Sciences | 4 | 21.0% |
| Engineering | 0 | 0.0% |
| Multidisciplinary Studies | 0 | 0.0% |
| Science & Technology | 1 | 5.3% |
| Business | 2 | 10.5% |
| Education | 6 | 31.6% |
| Literature & Languages | 0 | 0.0% |
| Liberal Arts & History | 0 | 0.0% |
| Visual & Performing Arts | 0 | 0.0% |
| Communications | 0 | 0.0% |
| Arts & Humanities | 6 | 31.6% |
| Total | 19 | 100.0% |
Transportation & Commute in Butte Falls
Vehicle Availability by Sex in Butte Falls
The most prevalent vehicle ownership categories in Butte Falls are males with 2 vehicles (43, accounting for 48.3%) and females with 2 vehicles (22, making up 65.1%).
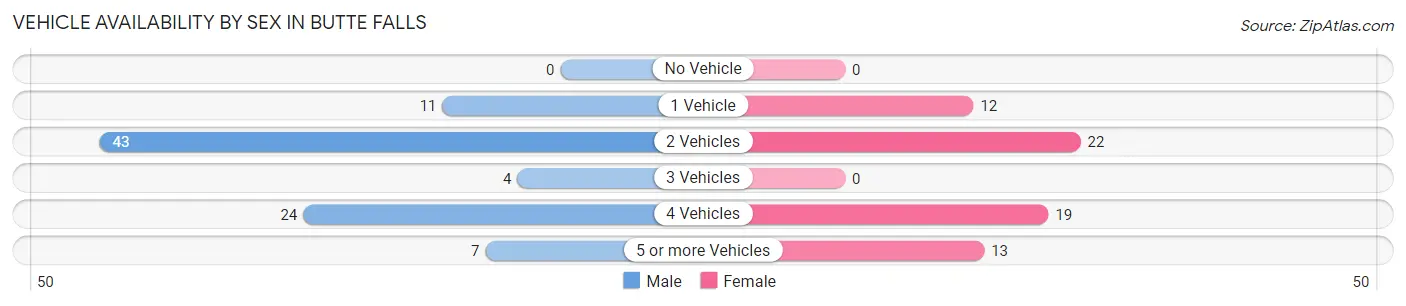
| Vehicles Available | Male | Female |
| No Vehicle | 0 (0.0%) | 0 (0.0%) |
| 1 Vehicle | 11 (12.4%) | 12 (18.2%) |
| 2 Vehicles | 43 (48.3%) | 22 (33.3%) |
| 3 Vehicles | 4 (4.5%) | 0 (0.0%) |
| 4 Vehicles | 24 (27.0%) | 19 (28.8%) |
| 5 or more Vehicles | 7 (7.9%) | 13 (19.7%) |
| Total | 89 (100.0%) | 66 (100.0%) |
Commute Time in Butte Falls
The most frequently occuring commute durations in Butte Falls are 45 to 59 minutes (56 commuters, 37.3%), 30 to 34 minutes (26 commuters, 17.3%), and less than 5 minutes (25 commuters, 16.7%).
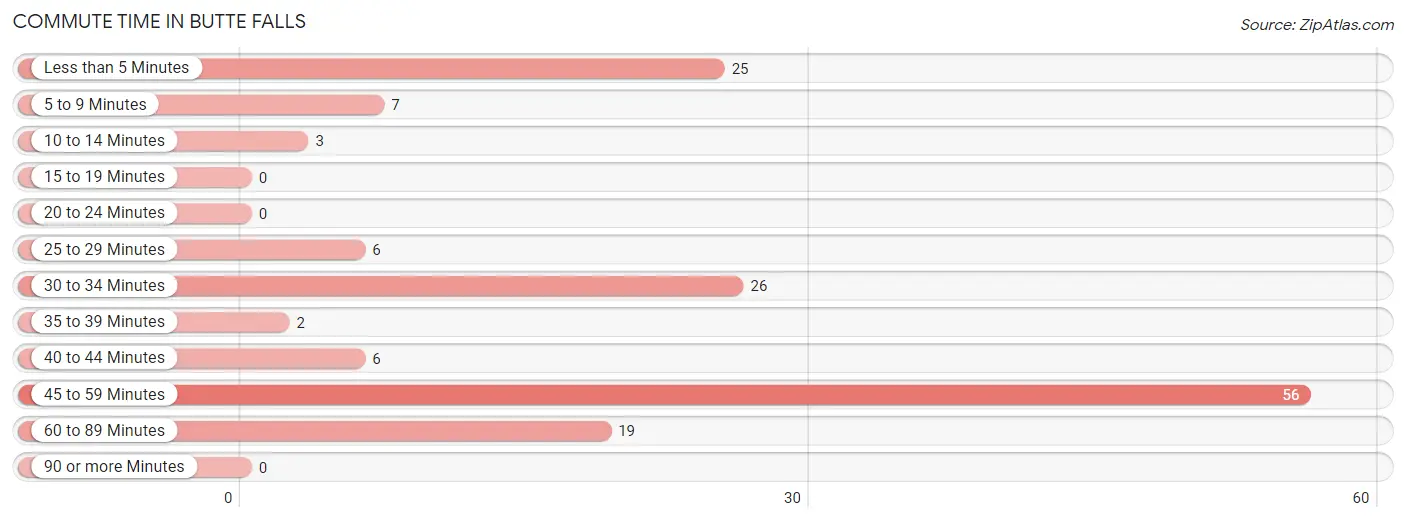
| Commute Time | # Commuters | % Commuters |
| Less than 5 Minutes | 25 | 16.7% |
| 5 to 9 Minutes | 7 | 4.7% |
| 10 to 14 Minutes | 3 | 2.0% |
| 15 to 19 Minutes | 0 | 0.0% |
| 20 to 24 Minutes | 0 | 0.0% |
| 25 to 29 Minutes | 6 | 4.0% |
| 30 to 34 Minutes | 26 | 17.3% |
| 35 to 39 Minutes | 2 | 1.3% |
| 40 to 44 Minutes | 6 | 4.0% |
| 45 to 59 Minutes | 56 | 37.3% |
| 60 to 89 Minutes | 19 | 12.7% |
| 90 or more Minutes | 0 | 0.0% |
Commute Time by Sex in Butte Falls
The most common commute times in Butte Falls are 45 to 59 minutes (32 commuters, 38.1%) for males and less than 5 minutes (25 commuters, 37.9%) for females.

| Commute Time | Male | Female |
| Less than 5 Minutes | 0 (0.0%) | 25 (37.9%) |
| 5 to 9 Minutes | 7 (8.3%) | 0 (0.0%) |
| 10 to 14 Minutes | 3 (3.6%) | 0 (0.0%) |
| 15 to 19 Minutes | 0 (0.0%) | 0 (0.0%) |
| 20 to 24 Minutes | 0 (0.0%) | 0 (0.0%) |
| 25 to 29 Minutes | 6 (7.1%) | 0 (0.0%) |
| 30 to 34 Minutes | 26 (30.9%) | 0 (0.0%) |
| 35 to 39 Minutes | 0 (0.0%) | 2 (3.0%) |
| 40 to 44 Minutes | 1 (1.2%) | 5 (7.6%) |
| 45 to 59 Minutes | 32 (38.1%) | 24 (36.4%) |
| 60 to 89 Minutes | 9 (10.7%) | 10 (15.1%) |
| 90 or more Minutes | 0 (0.0%) | 0 (0.0%) |
Time of Departure to Work by Sex in Butte Falls
The most frequent times of departure to work in Butte Falls are 4:00 PM to 11:59 PM (39, 46.4%) for males and 9:00 AM to 9:59 AM (15, 22.7%) for females.
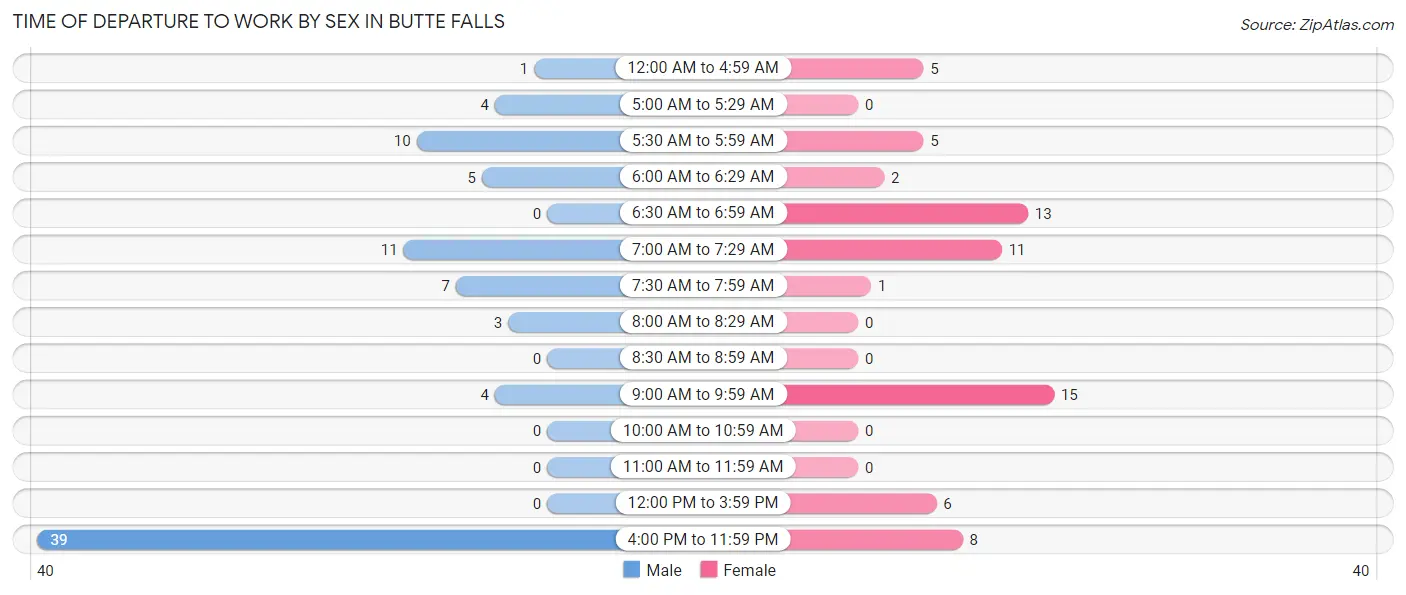
| Time of Departure | Male | Female |
| 12:00 AM to 4:59 AM | 1 (1.2%) | 5 (7.6%) |
| 5:00 AM to 5:29 AM | 4 (4.8%) | 0 (0.0%) |
| 5:30 AM to 5:59 AM | 10 (11.9%) | 5 (7.6%) |
| 6:00 AM to 6:29 AM | 5 (5.9%) | 2 (3.0%) |
| 6:30 AM to 6:59 AM | 0 (0.0%) | 13 (19.7%) |
| 7:00 AM to 7:29 AM | 11 (13.1%) | 11 (16.7%) |
| 7:30 AM to 7:59 AM | 7 (8.3%) | 1 (1.5%) |
| 8:00 AM to 8:29 AM | 3 (3.6%) | 0 (0.0%) |
| 8:30 AM to 8:59 AM | 0 (0.0%) | 0 (0.0%) |
| 9:00 AM to 9:59 AM | 4 (4.8%) | 15 (22.7%) |
| 10:00 AM to 10:59 AM | 0 (0.0%) | 0 (0.0%) |
| 11:00 AM to 11:59 AM | 0 (0.0%) | 0 (0.0%) |
| 12:00 PM to 3:59 PM | 0 (0.0%) | 6 (9.1%) |
| 4:00 PM to 11:59 PM | 39 (46.4%) | 8 (12.1%) |
| Total | 84 (100.0%) | 66 (100.0%) |
Housing Occupancy in Butte Falls
Occupancy by Ownership in Butte Falls
Of the total 166 dwellings in Butte Falls, owner-occupied units account for 128 (77.1%), while renter-occupied units make up 38 (22.9%).
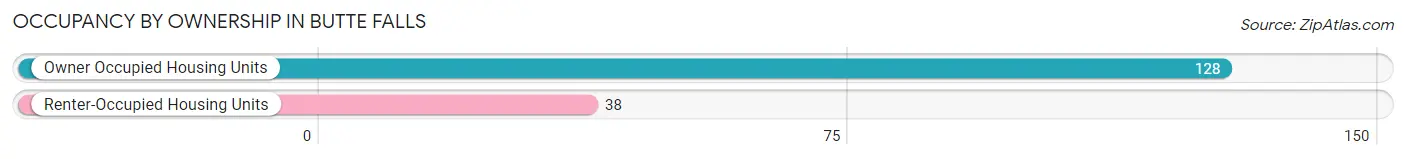
| Occupancy | # Housing Units | % Housing Units |
| Owner Occupied Housing Units | 128 | 77.1% |
| Renter-Occupied Housing Units | 38 | 22.9% |
| Total Occupied Housing Units | 166 | 100.0% |
Occupancy by Household Size in Butte Falls
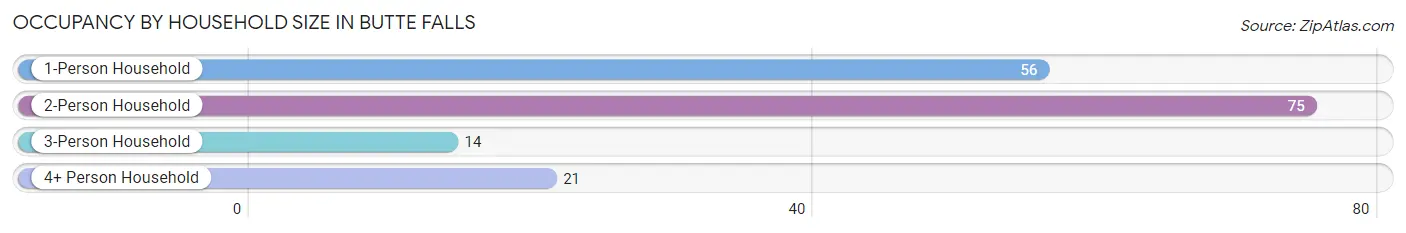
| Household Size | # Housing Units | % Housing Units |
| 1-Person Household | 56 | 33.7% |
| 2-Person Household | 75 | 45.2% |
| 3-Person Household | 14 | 8.4% |
| 4+ Person Household | 21 | 12.7% |
| Total Housing Units | 166 | 100.0% |
Occupancy by Ownership by Household Size in Butte Falls
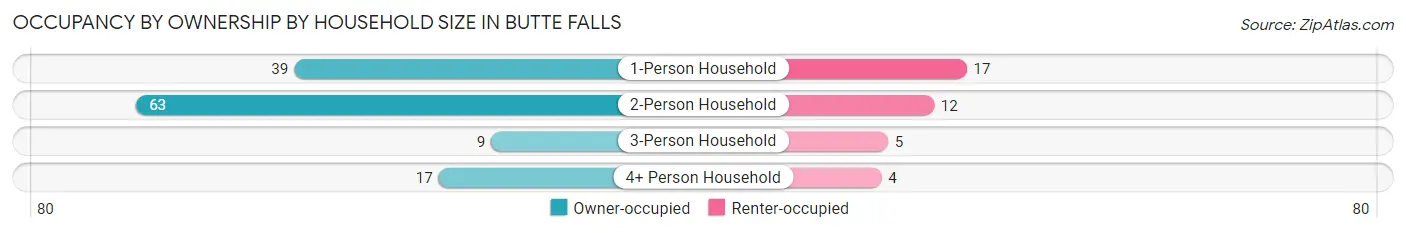
| Household Size | Owner-occupied | Renter-occupied |
| 1-Person Household | 39 (69.6%) | 17 (30.4%) |
| 2-Person Household | 63 (84.0%) | 12 (16.0%) |
| 3-Person Household | 9 (64.3%) | 5 (35.7%) |
| 4+ Person Household | 17 (80.9%) | 4 (19.1%) |
| Total Housing Units | 128 (77.1%) | 38 (22.9%) |
Occupancy by Educational Attainment in Butte Falls
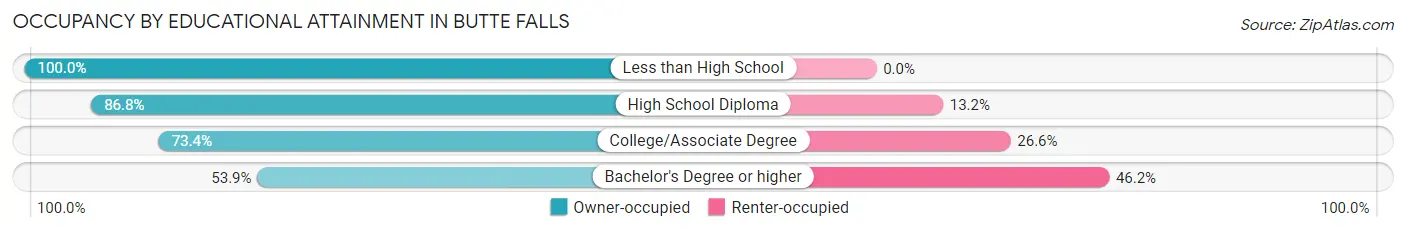
| Household Size | Owner-occupied | Renter-occupied |
| Less than High School | 6 (100.0%) | 0 (0.0%) |
| High School Diploma | 46 (86.8%) | 7 (13.2%) |
| College/Associate Degree | 69 (73.4%) | 25 (26.6%) |
| Bachelor's Degree or higher | 7 (53.8%) | 6 (46.2%) |
Occupancy by Age of Householder in Butte Falls
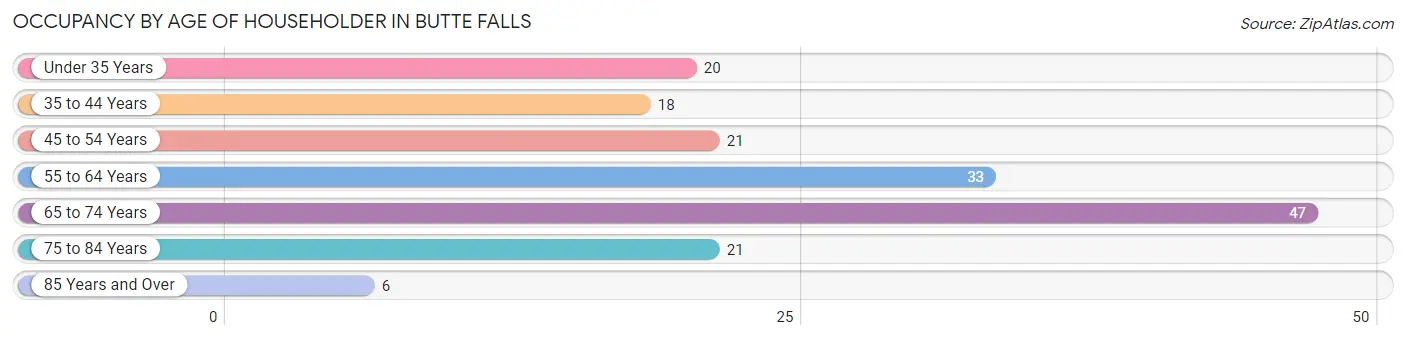
| Age Bracket | # Households | % Households |
| Under 35 Years | 20 | 12.0% |
| 35 to 44 Years | 18 | 10.8% |
| 45 to 54 Years | 21 | 12.7% |
| 55 to 64 Years | 33 | 19.9% |
| 65 to 74 Years | 47 | 28.3% |
| 75 to 84 Years | 21 | 12.7% |
| 85 Years and Over | 6 | 3.6% |
| Total | 166 | 100.0% |
Housing Finances in Butte Falls
Median Income by Occupancy in Butte Falls
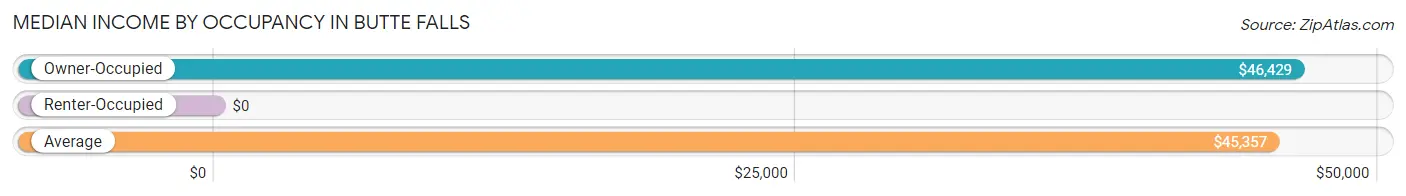
| Occupancy Type | # Households | Median Income |
| Owner-Occupied | 128 (77.1%) | $46,429 |
| Renter-Occupied | 38 (22.9%) | $0 |
| Average | 166 (100.0%) | $45,357 |
Occupancy by Householder Income Bracket in Butte Falls
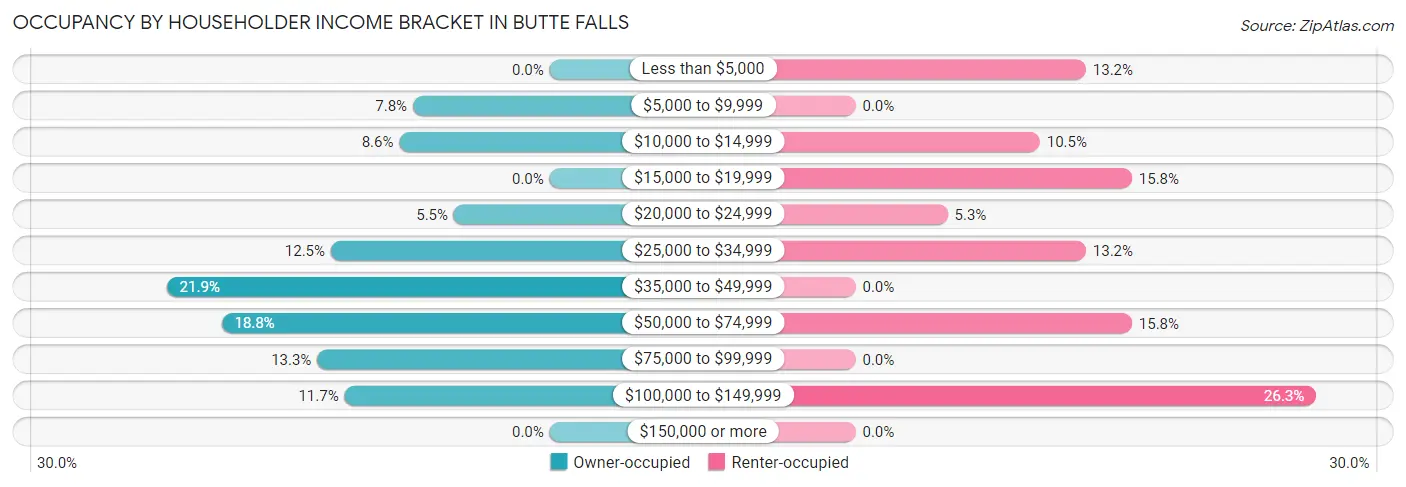
| Income Bracket | Owner-occupied | Renter-occupied |
| Less than $5,000 | 0 (0.0%) | 5 (13.2%) |
| $5,000 to $9,999 | 10 (7.8%) | 0 (0.0%) |
| $10,000 to $14,999 | 11 (8.6%) | 4 (10.5%) |
| $15,000 to $19,999 | 0 (0.0%) | 6 (15.8%) |
| $20,000 to $24,999 | 7 (5.5%) | 2 (5.3%) |
| $25,000 to $34,999 | 16 (12.5%) | 5 (13.2%) |
| $35,000 to $49,999 | 28 (21.9%) | 0 (0.0%) |
| $50,000 to $74,999 | 24 (18.8%) | 6 (15.8%) |
| $75,000 to $99,999 | 17 (13.3%) | 0 (0.0%) |
| $100,000 to $149,999 | 15 (11.7%) | 10 (26.3%) |
| $150,000 or more | 0 (0.0%) | 0 (0.0%) |
| Total | 128 (100.0%) | 38 (100.0%) |
Monthly Housing Cost Tiers in Butte Falls
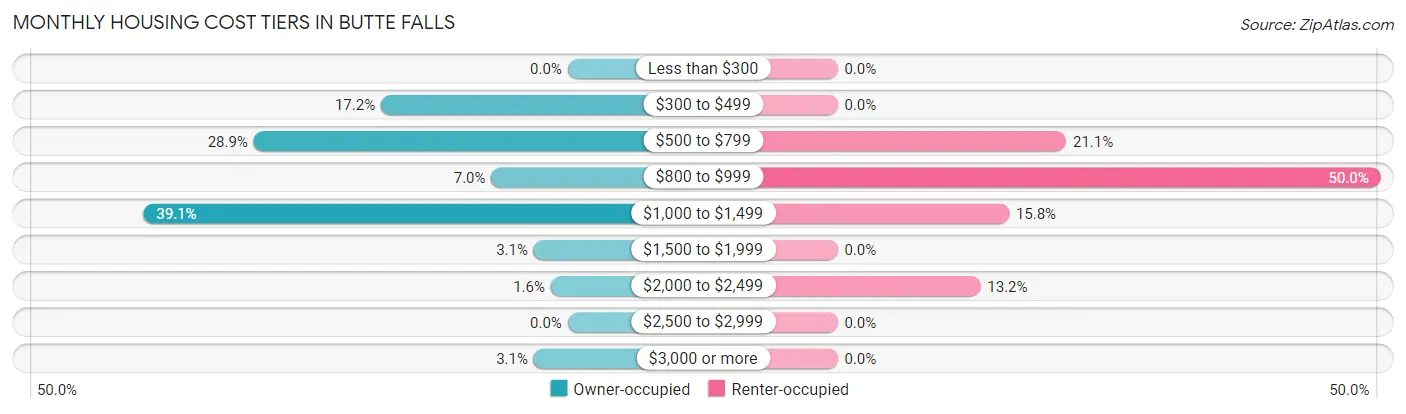
| Monthly Cost | Owner-occupied | Renter-occupied |
| Less than $300 | 0 (0.0%) | 0 (0.0%) |
| $300 to $499 | 22 (17.2%) | 0 (0.0%) |
| $500 to $799 | 37 (28.9%) | 8 (21.0%) |
| $800 to $999 | 9 (7.0%) | 19 (50.0%) |
| $1,000 to $1,499 | 50 (39.1%) | 6 (15.8%) |
| $1,500 to $1,999 | 4 (3.1%) | 0 (0.0%) |
| $2,000 to $2,499 | 2 (1.6%) | 5 (13.2%) |
| $2,500 to $2,999 | 0 (0.0%) | 0 (0.0%) |
| $3,000 or more | 4 (3.1%) | 0 (0.0%) |
| Total | 128 (100.0%) | 38 (100.0%) |
Physical Housing Characteristics in Butte Falls
Housing Structures in Butte Falls
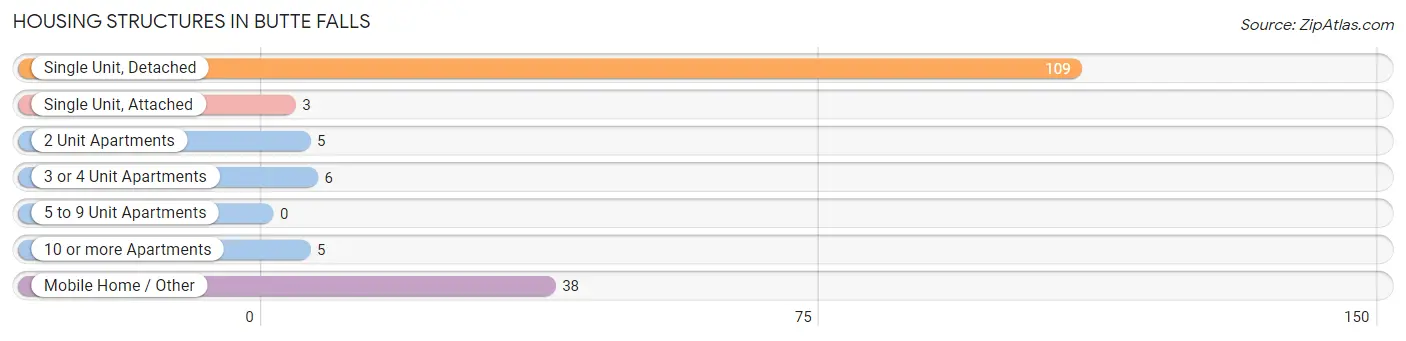
| Structure Type | # Housing Units | % Housing Units |
| Single Unit, Detached | 109 | 65.7% |
| Single Unit, Attached | 3 | 1.8% |
| 2 Unit Apartments | 5 | 3.0% |
| 3 or 4 Unit Apartments | 6 | 3.6% |
| 5 to 9 Unit Apartments | 0 | 0.0% |
| 10 or more Apartments | 5 | 3.0% |
| Mobile Home / Other | 38 | 22.9% |
| Total | 166 | 100.0% |
Housing Structures by Occupancy in Butte Falls
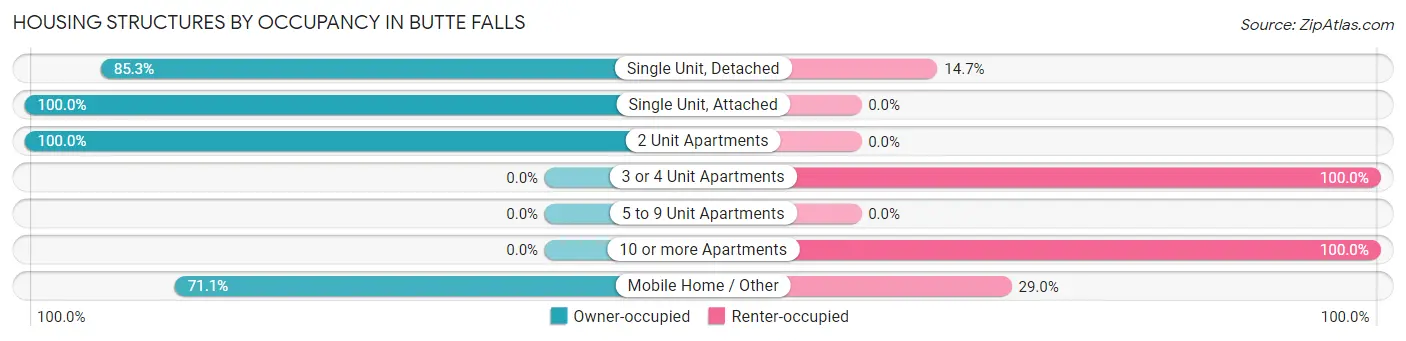
| Structure Type | Owner-occupied | Renter-occupied |
| Single Unit, Detached | 93 (85.3%) | 16 (14.7%) |
| Single Unit, Attached | 3 (100.0%) | 0 (0.0%) |
| 2 Unit Apartments | 5 (100.0%) | 0 (0.0%) |
| 3 or 4 Unit Apartments | 0 (0.0%) | 6 (100.0%) |
| 5 to 9 Unit Apartments | 0 (0.0%) | 0 (0.0%) |
| 10 or more Apartments | 0 (0.0%) | 5 (100.0%) |
| Mobile Home / Other | 27 (71.1%) | 11 (28.9%) |
| Total | 128 (77.1%) | 38 (22.9%) |
Housing Structures by Number of Rooms in Butte Falls
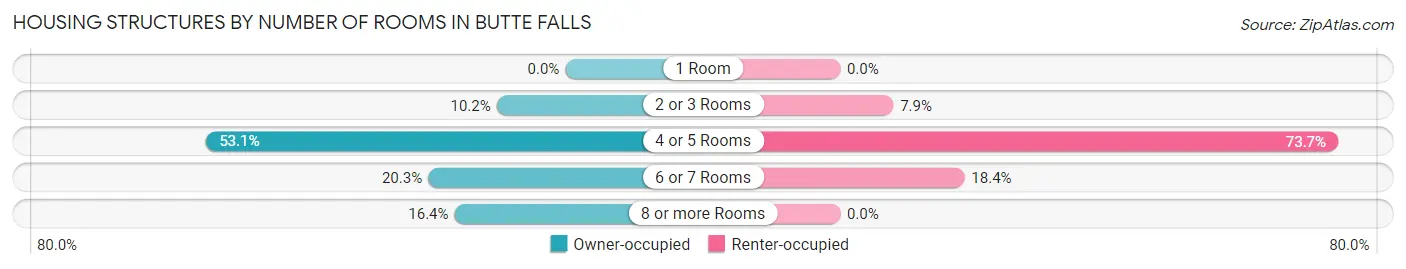
| Number of Rooms | Owner-occupied | Renter-occupied |
| 1 Room | 0 (0.0%) | 0 (0.0%) |
| 2 or 3 Rooms | 13 (10.2%) | 3 (7.9%) |
| 4 or 5 Rooms | 68 (53.1%) | 28 (73.7%) |
| 6 or 7 Rooms | 26 (20.3%) | 7 (18.4%) |
| 8 or more Rooms | 21 (16.4%) | 0 (0.0%) |
| Total | 128 (100.0%) | 38 (100.0%) |
Housing Structure by Heating Type in Butte Falls
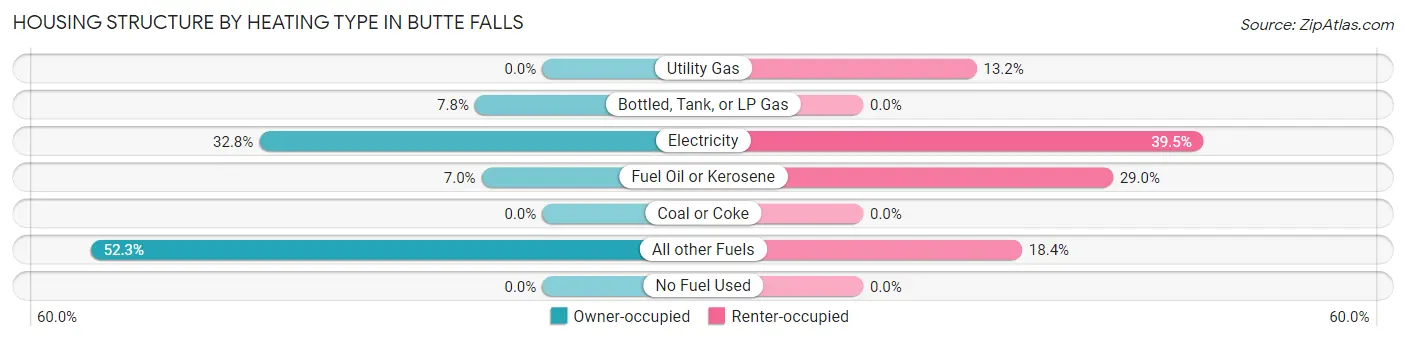
| Heating Type | Owner-occupied | Renter-occupied |
| Utility Gas | 0 (0.0%) | 5 (13.2%) |
| Bottled, Tank, or LP Gas | 10 (7.8%) | 0 (0.0%) |
| Electricity | 42 (32.8%) | 15 (39.5%) |
| Fuel Oil or Kerosene | 9 (7.0%) | 11 (28.9%) |
| Coal or Coke | 0 (0.0%) | 0 (0.0%) |
| All other Fuels | 67 (52.3%) | 7 (18.4%) |
| No Fuel Used | 0 (0.0%) | 0 (0.0%) |
| Total | 128 (100.0%) | 38 (100.0%) |
Household Vehicle Usage in Butte Falls
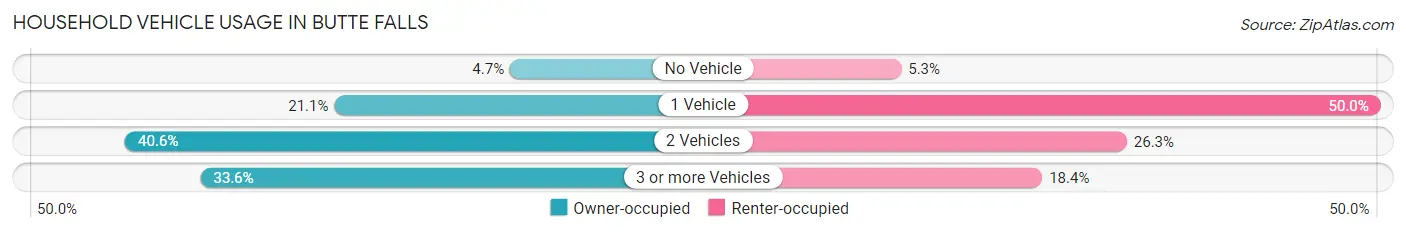
| Vehicles per Household | Owner-occupied | Renter-occupied |
| No Vehicle | 6 (4.7%) | 2 (5.3%) |
| 1 Vehicle | 27 (21.1%) | 19 (50.0%) |
| 2 Vehicles | 52 (40.6%) | 10 (26.3%) |
| 3 or more Vehicles | 43 (33.6%) | 7 (18.4%) |
| Total | 128 (100.0%) | 38 (100.0%) |
Real Estate & Mortgages in Butte Falls
Real Estate and Mortgage Overview in Butte Falls
| Characteristic | Without Mortgage | With Mortgage |
| Housing Units | 50 | 78 |
| Median Property Value | $135,900 | $148,500 |
| Median Household Income | - | - |
| Monthly Housing Costs | $543 | $4 |
| Real Estate Taxes | $1,589 | $5 |
Property Value by Mortgage Status in Butte Falls
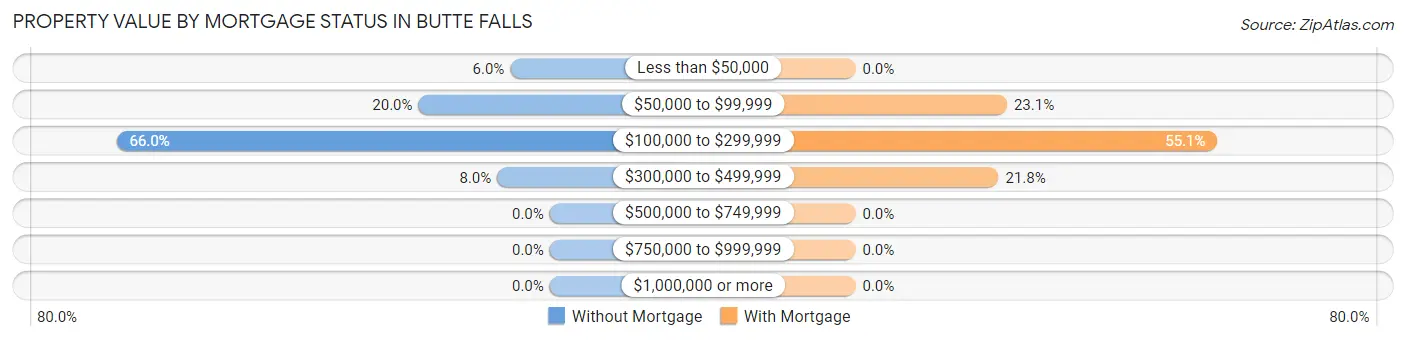
| Property Value | Without Mortgage | With Mortgage |
| Less than $50,000 | 3 (6.0%) | 0 (0.0%) |
| $50,000 to $99,999 | 10 (20.0%) | 18 (23.1%) |
| $100,000 to $299,999 | 33 (66.0%) | 43 (55.1%) |
| $300,000 to $499,999 | 4 (8.0%) | 17 (21.8%) |
| $500,000 to $749,999 | 0 (0.0%) | 0 (0.0%) |
| $750,000 to $999,999 | 0 (0.0%) | 0 (0.0%) |
| $1,000,000 or more | 0 (0.0%) | 0 (0.0%) |
| Total | 50 (100.0%) | 78 (100.0%) |
Household Income by Mortgage Status in Butte Falls
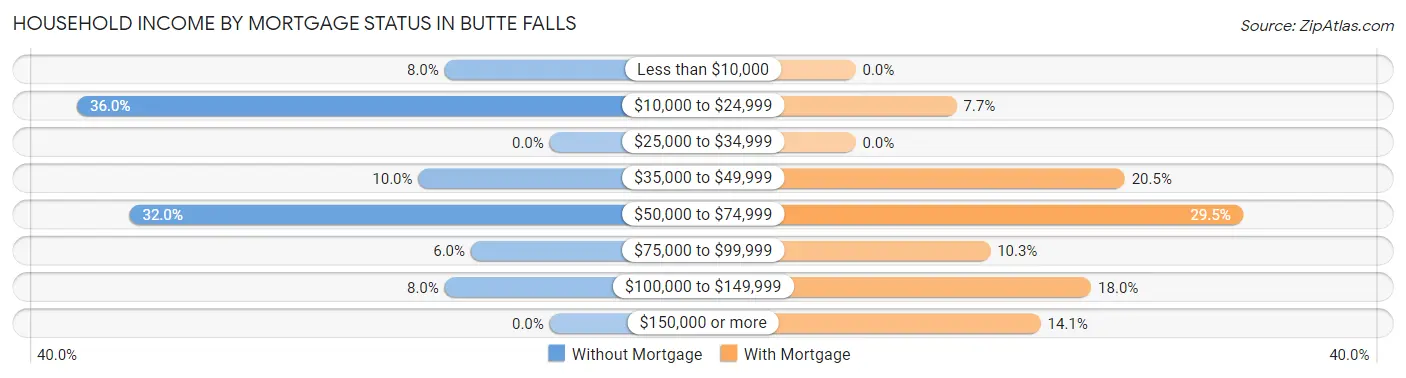
| Household Income | Without Mortgage | With Mortgage |
| Less than $10,000 | 4 (8.0%) | 0 (0.0%) |
| $10,000 to $24,999 | 18 (36.0%) | 6 (7.7%) |
| $25,000 to $34,999 | 0 (0.0%) | 0 (0.0%) |
| $35,000 to $49,999 | 5 (10.0%) | 16 (20.5%) |
| $50,000 to $74,999 | 16 (32.0%) | 23 (29.5%) |
| $75,000 to $99,999 | 3 (6.0%) | 8 (10.3%) |
| $100,000 to $149,999 | 4 (8.0%) | 14 (17.9%) |
| $150,000 or more | 0 (0.0%) | 11 (14.1%) |
| Total | 50 (100.0%) | 78 (100.0%) |
Property Value to Household Income Ratio in Butte Falls
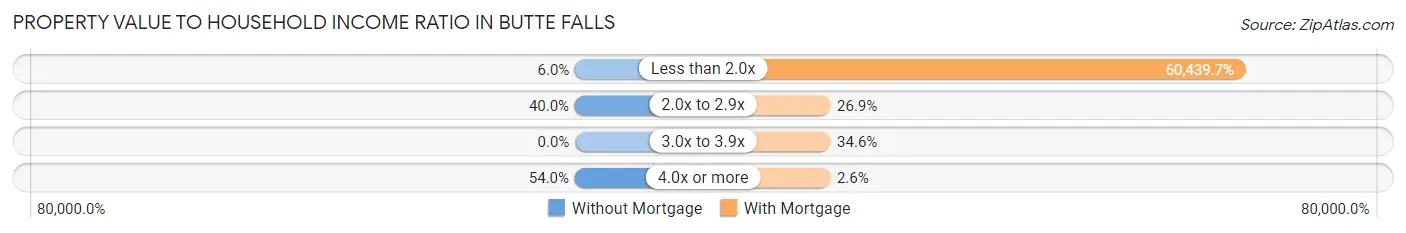
| Value-to-Income Ratio | Without Mortgage | With Mortgage |
| Less than 2.0x | 3 (6.0%) | 47,143 (60,439.7%) |
| 2.0x to 2.9x | 20 (40.0%) | 21 (26.9%) |
| 3.0x to 3.9x | 0 (0.0%) | 27 (34.6%) |
| 4.0x or more | 27 (54.0%) | 2 (2.6%) |
| Total | 50 (100.0%) | 78 (100.0%) |
Real Estate Taxes by Mortgage Status in Butte Falls
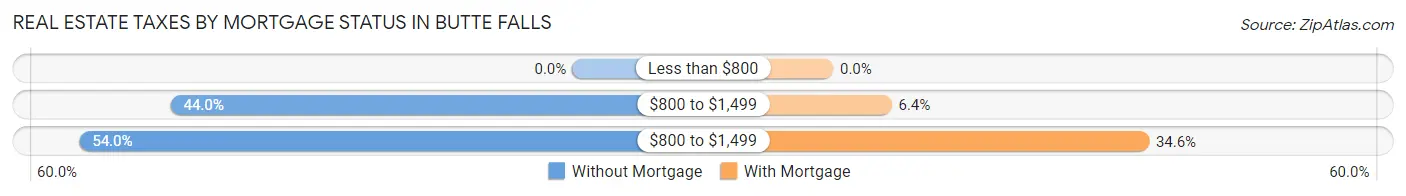
| Property Taxes | Without Mortgage | With Mortgage |
| Less than $800 | 0 (0.0%) | 0 (0.0%) |
| $800 to $1,499 | 22 (44.0%) | 5 (6.4%) |
| $800 to $1,499 | 27 (54.0%) | 27 (34.6%) |
| Total | 50 (100.0%) | 78 (100.0%) |
Health & Disability in Butte Falls
Health Insurance Coverage by Age in Butte Falls
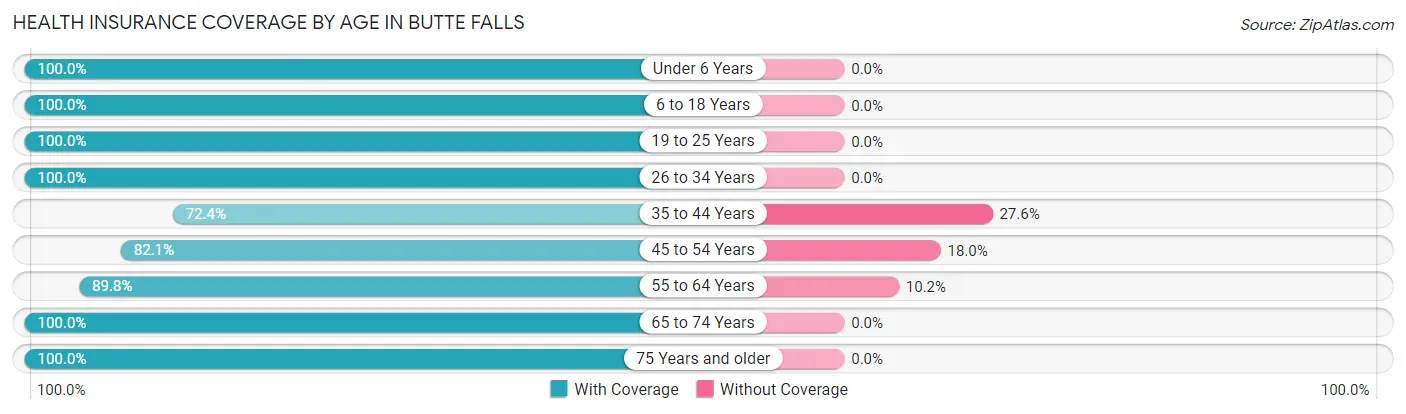
| Age Bracket | With Coverage | Without Coverage |
| Under 6 Years | 21 (100.0%) | 0 (0.0%) |
| 6 to 18 Years | 68 (100.0%) | 0 (0.0%) |
| 19 to 25 Years | 11 (100.0%) | 0 (0.0%) |
| 26 to 34 Years | 34 (100.0%) | 0 (0.0%) |
| 35 to 44 Years | 55 (72.4%) | 21 (27.6%) |
| 45 to 54 Years | 32 (82.1%) | 7 (17.9%) |
| 55 to 64 Years | 53 (89.8%) | 6 (10.2%) |
| 65 to 74 Years | 55 (100.0%) | 0 (0.0%) |
| 75 Years and older | 38 (100.0%) | 0 (0.0%) |
| Total | 367 (91.5%) | 34 (8.5%) |
Health Insurance Coverage by Citizenship Status in Butte Falls
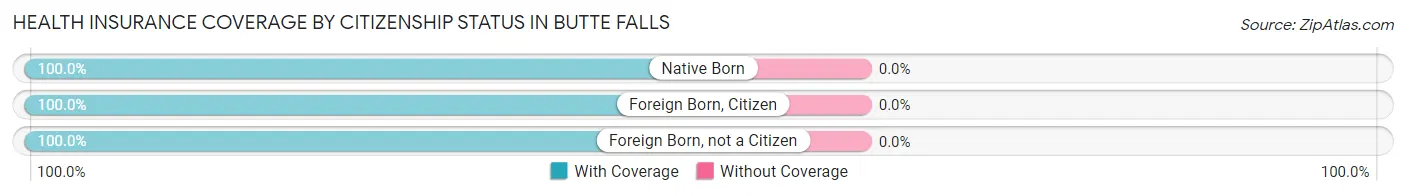
| Citizenship Status | With Coverage | Without Coverage |
| Native Born | 21 (100.0%) | 0 (0.0%) |
| Foreign Born, Citizen | 68 (100.0%) | 0 (0.0%) |
| Foreign Born, not a Citizen | 11 (100.0%) | 0 (0.0%) |
Health Insurance Coverage by Household Income in Butte Falls
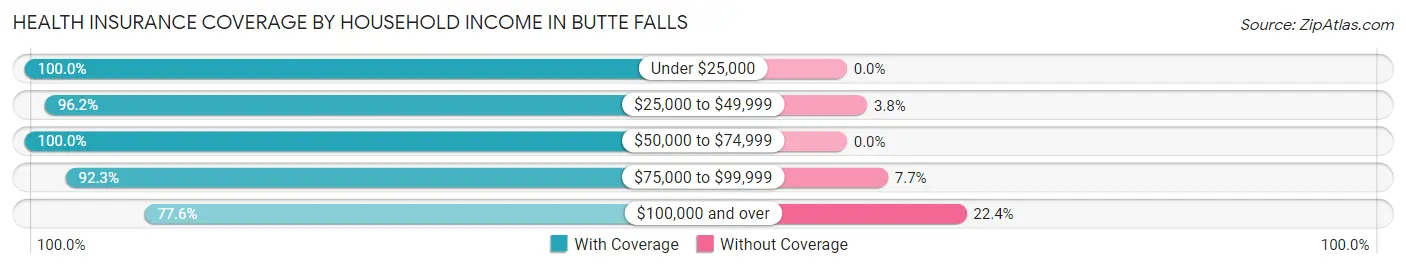
| Household Income | With Coverage | Without Coverage |
| Under $25,000 | 49 (100.0%) | 0 (0.0%) |
| $25,000 to $49,999 | 127 (96.2%) | 5 (3.8%) |
| $50,000 to $74,999 | 62 (100.0%) | 0 (0.0%) |
| $75,000 to $99,999 | 36 (92.3%) | 3 (7.7%) |
| $100,000 and over | 90 (77.6%) | 26 (22.4%) |
Public vs Private Health Insurance Coverage by Age in Butte Falls
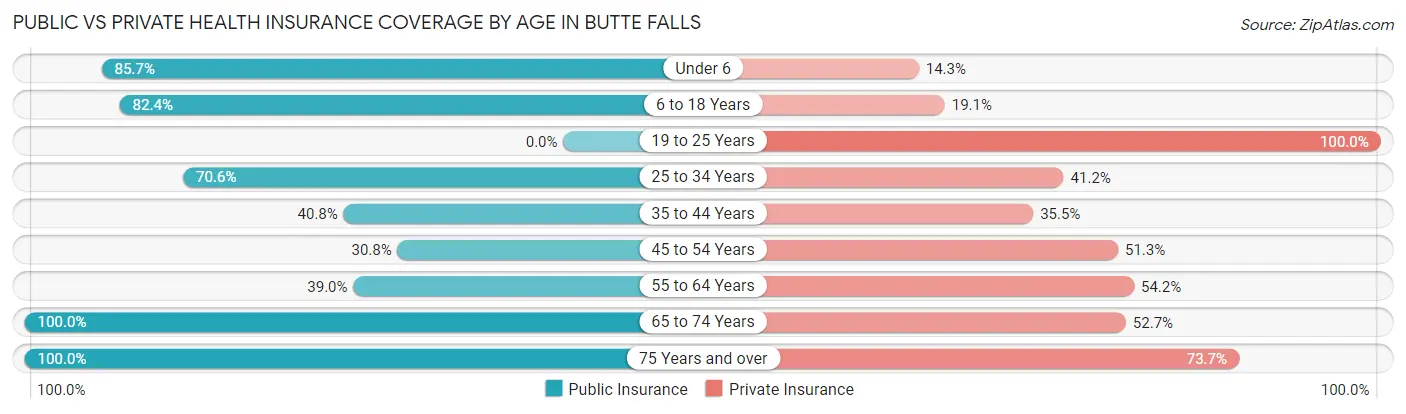
| Age Bracket | Public Insurance | Private Insurance |
| Under 6 | 18 (85.7%) | 3 (14.3%) |
| 6 to 18 Years | 56 (82.4%) | 13 (19.1%) |
| 19 to 25 Years | 0 (0.0%) | 11 (100.0%) |
| 25 to 34 Years | 24 (70.6%) | 14 (41.2%) |
| 35 to 44 Years | 31 (40.8%) | 27 (35.5%) |
| 45 to 54 Years | 12 (30.8%) | 20 (51.3%) |
| 55 to 64 Years | 23 (39.0%) | 32 (54.2%) |
| 65 to 74 Years | 55 (100.0%) | 29 (52.7%) |
| 75 Years and over | 38 (100.0%) | 28 (73.7%) |
| Total | 257 (64.1%) | 177 (44.1%) |
Disability Status by Sex by Age in Butte Falls
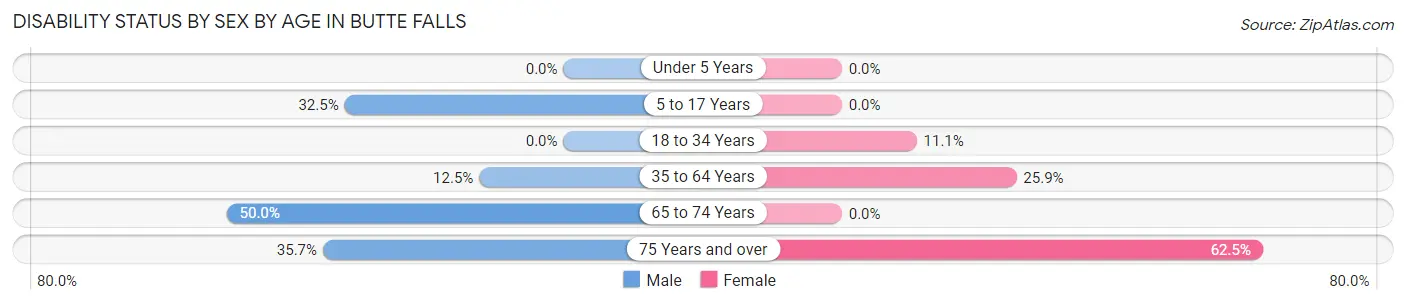
| Age Bracket | Male | Female |
| Under 5 Years | 0 (0.0%) | 0 (0.0%) |
| 5 to 17 Years | 13 (32.5%) | 0 (0.0%) |
| 18 to 34 Years | 0 (0.0%) | 4 (11.1%) |
| 35 to 64 Years | 15 (12.5%) | 14 (25.9%) |
| 65 to 74 Years | 13 (50.0%) | 0 (0.0%) |
| 75 Years and over | 5 (35.7%) | 15 (62.5%) |
Disability Class by Sex by Age in Butte Falls
Disability Class: Hearing Difficulty
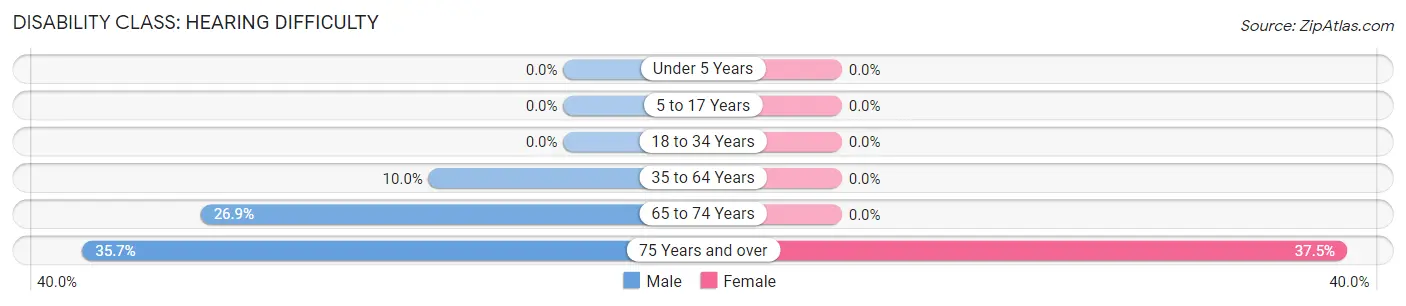
| Age Bracket | Male | Female |
| Under 5 Years | 0 (0.0%) | 0 (0.0%) |
| 5 to 17 Years | 0 (0.0%) | 0 (0.0%) |
| 18 to 34 Years | 0 (0.0%) | 0 (0.0%) |
| 35 to 64 Years | 12 (10.0%) | 0 (0.0%) |
| 65 to 74 Years | 7 (26.9%) | 0 (0.0%) |
| 75 Years and over | 5 (35.7%) | 9 (37.5%) |
Disability Class: Vision Difficulty
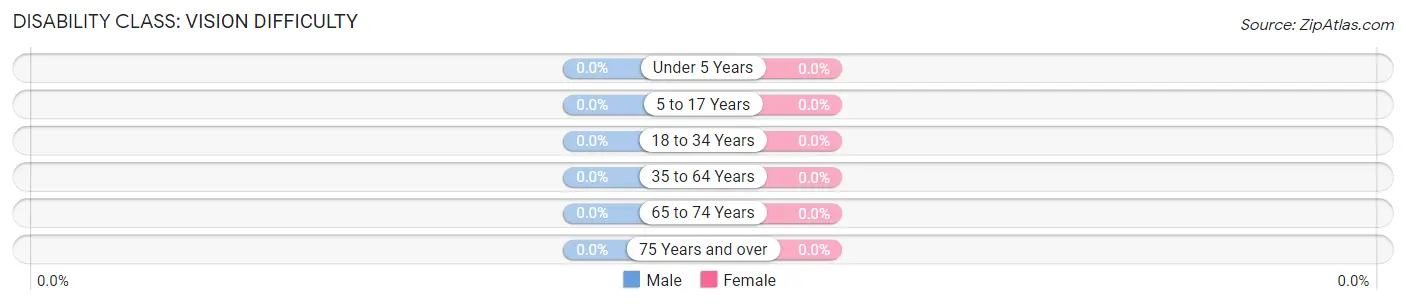
| Age Bracket | Male | Female |
| Under 5 Years | 0 (0.0%) | 0 (0.0%) |
| 5 to 17 Years | 0 (0.0%) | 0 (0.0%) |
| 18 to 34 Years | 0 (0.0%) | 0 (0.0%) |
| 35 to 64 Years | 0 (0.0%) | 0 (0.0%) |
| 65 to 74 Years | 0 (0.0%) | 0 (0.0%) |
| 75 Years and over | 0 (0.0%) | 0 (0.0%) |
Disability Class: Cognitive Difficulty
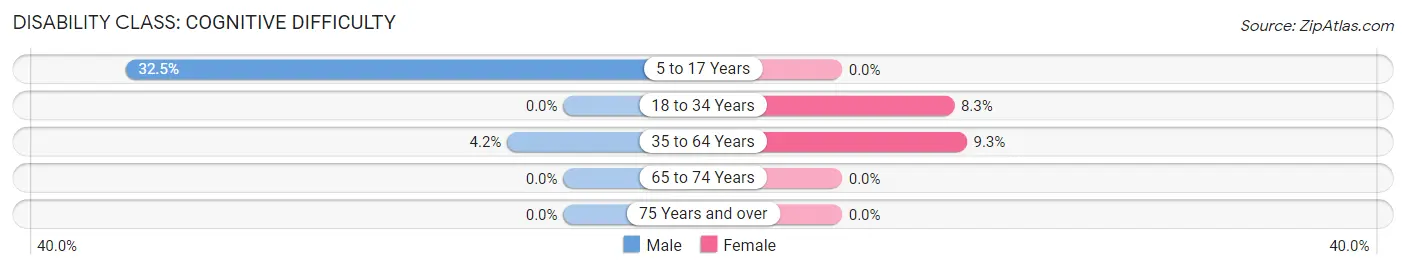
| Age Bracket | Male | Female |
| 5 to 17 Years | 13 (32.5%) | 0 (0.0%) |
| 18 to 34 Years | 0 (0.0%) | 3 (8.3%) |
| 35 to 64 Years | 5 (4.2%) | 5 (9.3%) |
| 65 to 74 Years | 0 (0.0%) | 0 (0.0%) |
| 75 Years and over | 0 (0.0%) | 0 (0.0%) |
Disability Class: Ambulatory Difficulty
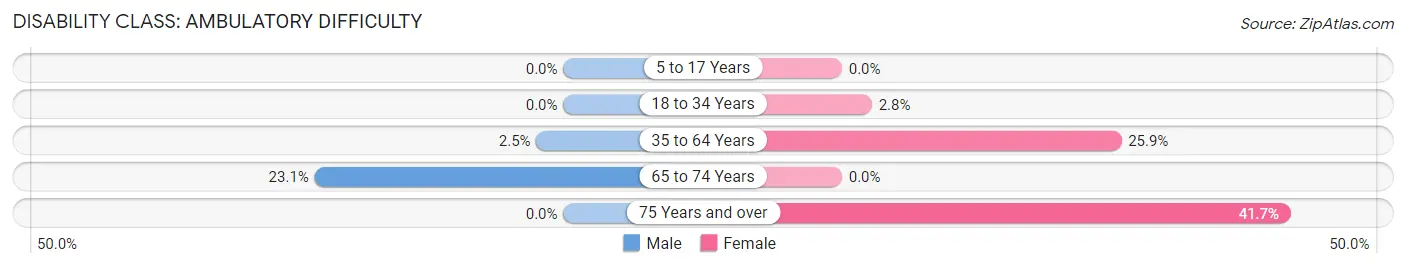
| Age Bracket | Male | Female |
| 5 to 17 Years | 0 (0.0%) | 0 (0.0%) |
| 18 to 34 Years | 0 (0.0%) | 1 (2.8%) |
| 35 to 64 Years | 3 (2.5%) | 14 (25.9%) |
| 65 to 74 Years | 6 (23.1%) | 0 (0.0%) |
| 75 Years and over | 0 (0.0%) | 10 (41.7%) |
Disability Class: Self-Care Difficulty
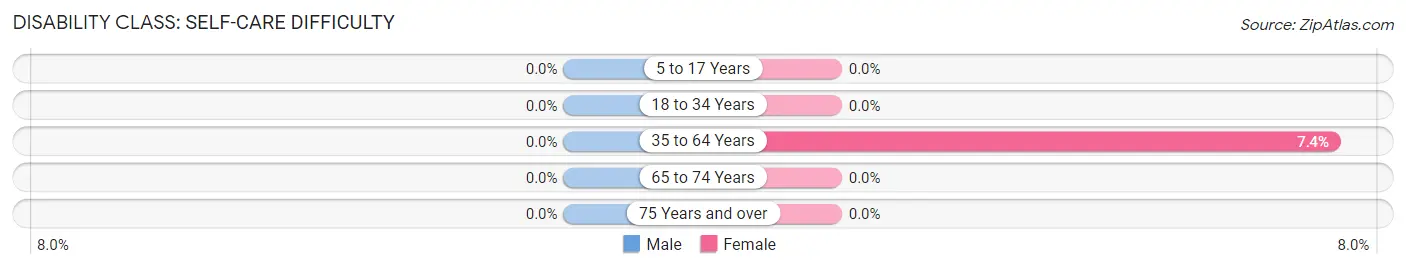
| Age Bracket | Male | Female |
| 5 to 17 Years | 0 (0.0%) | 0 (0.0%) |
| 18 to 34 Years | 0 (0.0%) | 0 (0.0%) |
| 35 to 64 Years | 0 (0.0%) | 4 (7.4%) |
| 65 to 74 Years | 0 (0.0%) | 0 (0.0%) |
| 75 Years and over | 0 (0.0%) | 0 (0.0%) |
Technology Access in Butte Falls
Computing Device Access in Butte Falls
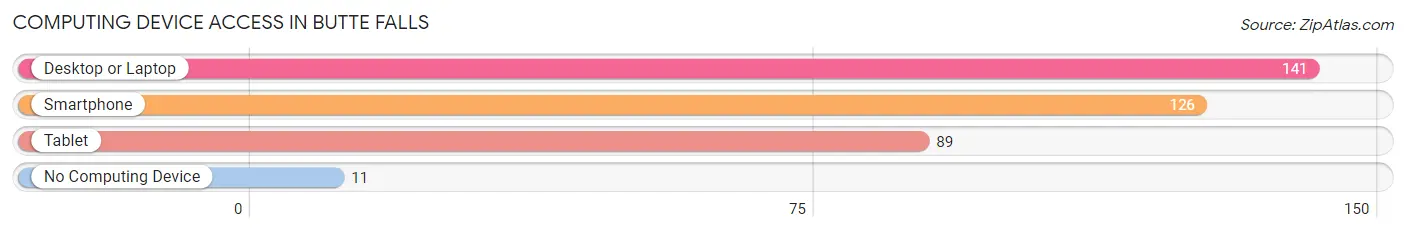
| Device Type | # Households | % Households |
| Desktop or Laptop | 141 | 84.9% |
| Smartphone | 126 | 75.9% |
| Tablet | 89 | 53.6% |
| No Computing Device | 11 | 6.6% |
| Total | 166 | 100.0% |
Internet Access in Butte Falls
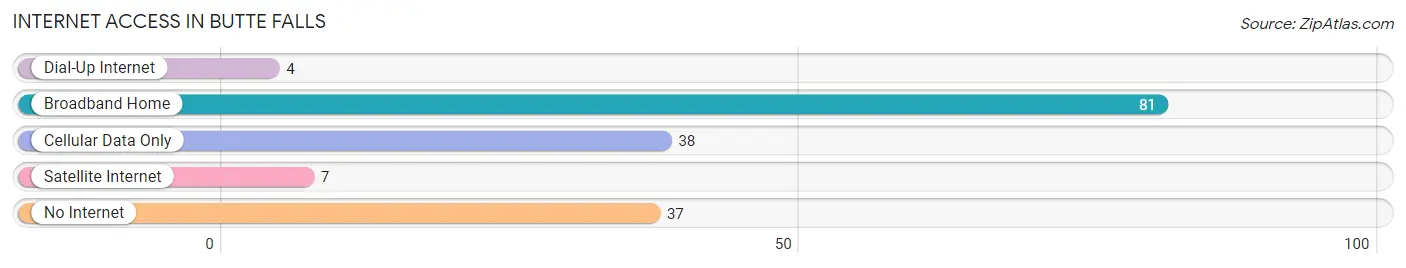
| Internet Type | # Households | % Households |
| Dial-Up Internet | 4 | 2.4% |
| Broadband Home | 81 | 48.8% |
| Cellular Data Only | 38 | 22.9% |
| Satellite Internet | 7 | 4.2% |
| No Internet | 37 | 22.3% |
| Total | 166 | 100.0% |
Butte Falls Summary
Butte Falls is a small unincorporated community located in Jackson County, Oregon, United States. It is situated in the foothills of the Cascade Mountains, approximately 25 miles east of Medford. The population of Butte Falls was estimated to be 545 in 2019.
History
Butte Falls was first settled in the late 1800s by homesteaders who were attracted to the area by its abundance of natural resources. The town was originally known as "Butte City" and was later renamed "Butte Falls" in 1891. The name was chosen to reflect the nearby Butte Creek Falls, which is located just outside of town.
The town was initially a logging and milling center, and the Butte Falls Lumber Company was established in 1891. The company operated until the early 1900s, when the timber resources in the area were depleted.
In the early 1900s, Butte Falls began to transition from a logging and milling center to an agricultural community. The town was home to several farms, and the Butte Falls Canning Company was established in 1912. The cannery operated until the 1950s, when it was closed due to declining demand.
Geography
Butte Falls is located in the foothills of the Cascade Mountains, approximately 25 miles east of Medford. The town is situated at an elevation of 1,890 feet above sea level. The climate in Butte Falls is mild and temperate, with warm summers and cool winters.
The town is surrounded by forests and is home to several creeks and rivers, including Butte Creek, which flows through the center of town. The nearby Butte Creek Falls is a popular tourist attraction.
Economy
Butte Falls is a small, rural community with a limited economy. The town is home to several small businesses, including a grocery store, a hardware store, and a restaurant. The town is also home to a sawmill, which is the largest employer in the area.
The town is also home to several farms, which produce a variety of crops, including hay, wheat, and potatoes. The Butte Falls Canning Company, which closed in the 1950s, is now a museum and is a popular tourist attraction.
Demographics
As of 2019, the population of Butte Falls was estimated to be 545. The town is predominantly white, with a small Hispanic population. The median household income in Butte Falls is $37,000, and the median home value is $150,000. The town has a poverty rate of 16.3%, which is higher than the national average.
Conclusion
Butte Falls is a small, rural community located in the foothills of the Cascade Mountains in Jackson County, Oregon. The town was originally a logging and milling center, but has since transitioned to an agricultural community. The town is home to several small businesses, farms, and a sawmill, and is a popular tourist destination due to its proximity to Butte Creek Falls. The population of Butte Falls was estimated to be 545 in 2019, and the town has a median household income of $37,000 and a median home value of $150,000.
Common Questions
What is Per Capita Income in Butte Falls?
Per Capita income in Butte Falls is $23,631.
What is the Median Family Income in Butte Falls?
Median Family Income in Butte Falls is $67,583.
What is the Median Household income in Butte Falls?
Median Household Income in Butte Falls is $45,357.
What is Income or Wage Gap in Butte Falls?
Income or Wage Gap in Butte Falls is 29.4%.
Women in Butte Falls earn 70.6 cents for every dollar earned by a man.
What is Inequality or Gini Index in Butte Falls?
Inequality or Gini Index in Butte Falls is 0.40.
What is the Total Population of Butte Falls?
Total Population of Butte Falls is 401.
What is the Total Male Population of Butte Falls?
Total Male Population of Butte Falls is 222.
What is the Total Female Population of Butte Falls?
Total Female Population of Butte Falls is 179.
What is the Ratio of Males per 100 Females in Butte Falls?
There are 124.02 Males per 100 Females in Butte Falls.
What is the Ratio of Females per 100 Males in Butte Falls?
There are 80.63 Females per 100 Males in Butte Falls.
What is the Median Population Age in Butte Falls?
Median Population Age in Butte Falls is 41.6 Years.
What is the Average Family Size in Butte Falls
Average Family Size in Butte Falls is 2.9 People.
What is the Average Household Size in Butte Falls
Average Household Size in Butte Falls is 2.4 People.
How Large is the Labor Force in Butte Falls?
There are 180 People in the Labor Forcein in Butte Falls.
What is the Percentage of People in the Labor Force in Butte Falls?
53.6% of People are in the Labor Force in Butte Falls.
What is the Unemployment Rate in Butte Falls?
Unemployment Rate in Butte Falls is 8.9%.