Hayesville, OR Map & Demographics
Hayesville Map
Hayesville Overview
$26,814
PER CAPITA INCOME
$63,719
AVG FAMILY INCOME
$65,833
AVG HOUSEHOLD INCOME
35.1%
WAGE / INCOME GAP [ % ]
64.9¢/ $1
WAGE / INCOME GAP [ $ ]
$10,811
FAMILY INCOME DEFICIT
0.37
INEQUALITY / GINI INDEX
21,822
TOTAL POPULATION
11,977
MALE POPULATION
9,845
FEMALE POPULATION
121.66
MALES / 100 FEMALES
82.20
FEMALES / 100 MALES
30.9
MEDIAN AGE
3.6
AVG FAMILY SIZE
3.0
AVG HOUSEHOLD SIZE
10,298
LABOR FORCE [ PEOPLE ]
60.9%
PERCENT IN LABOR FORCE
5.8%
UNEMPLOYMENT RATE
Income in Hayesville
Income Overview in Hayesville
Per Capita Income in Hayesville is $26,814, while median incomes of families and households are $63,719 and $65,833 respectively.
| Characteristic | Number | Measure |
| Per Capita Income | 21,822 | $26,814 |
| Median Family Income | 4,815 | $63,719 |
| Mean Family Income | 4,815 | $77,390 |
| Median Household Income | 7,080 | $65,833 |
| Mean Household Income | 7,080 | $79,569 |
| Income Deficit | 4,815 | $10,811 |
| Wage / Income Gap (%) | 21,822 | 35.12% |
| Wage / Income Gap ($) | 21,822 | 64.88¢ per $1 |
| Gini / Inequality Index | 21,822 | 0.37 |
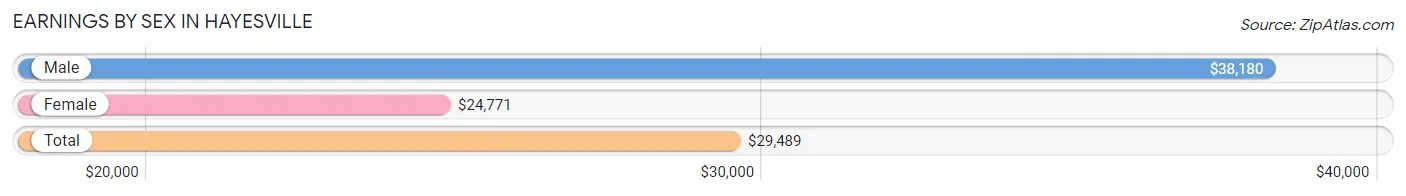
Earnings by Sex in Hayesville
Average Earnings in Hayesville are $29,489, $38,180 for men and $24,771 for women, a difference of 35.1%.
| Sex | Number | Average Earnings |
| Male | 6,059 (57.0%) | $38,180 |
| Female | 4,581 (43.0%) | $24,771 |
| Total | 10,640 (100.0%) | $29,489 |
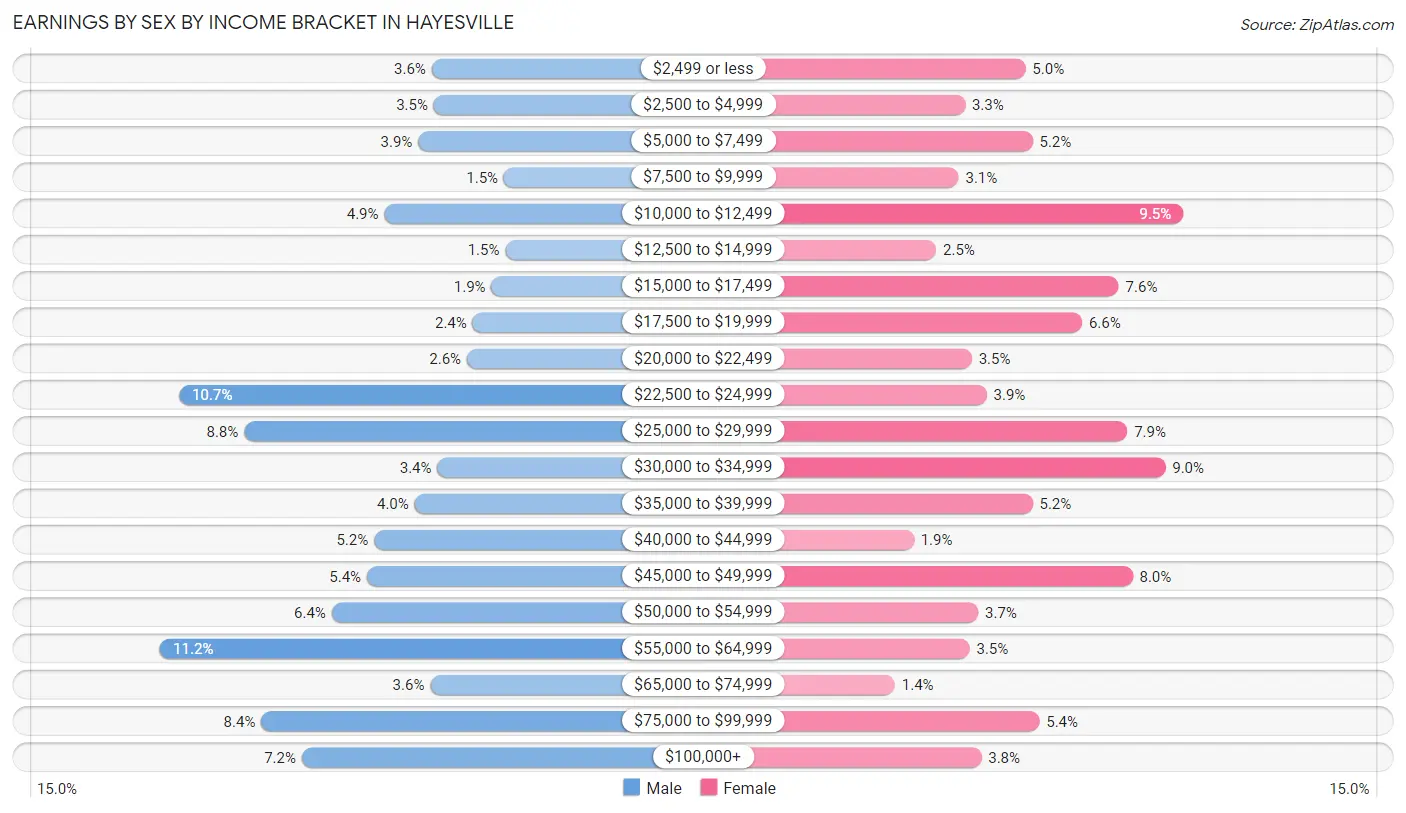
Earnings by Sex by Income Bracket in Hayesville
The most common earnings brackets in Hayesville are $55,000 to $64,999 for men (678 | 11.2%) and $10,000 to $12,499 for women (433 | 9.5%).
| Income | Male | Female |
| $2,499 or less | 216 (3.6%) | 230 (5.0%) |
| $2,500 to $4,999 | 212 (3.5%) | 152 (3.3%) |
| $5,000 to $7,499 | 239 (3.9%) | 239 (5.2%) |
| $7,500 to $9,999 | 93 (1.5%) | 144 (3.1%) |
| $10,000 to $12,499 | 296 (4.9%) | 433 (9.5%) |
| $12,500 to $14,999 | 90 (1.5%) | 115 (2.5%) |
| $15,000 to $17,499 | 114 (1.9%) | 350 (7.6%) |
| $17,500 to $19,999 | 146 (2.4%) | 303 (6.6%) |
| $20,000 to $22,499 | 156 (2.6%) | 161 (3.5%) |
| $22,500 to $24,999 | 646 (10.7%) | 180 (3.9%) |
| $25,000 to $29,999 | 535 (8.8%) | 361 (7.9%) |
| $30,000 to $34,999 | 206 (3.4%) | 410 (8.9%) |
| $35,000 to $39,999 | 245 (4.0%) | 239 (5.2%) |
| $40,000 to $44,999 | 314 (5.2%) | 86 (1.9%) |
| $45,000 to $49,999 | 326 (5.4%) | 368 (8.0%) |
| $50,000 to $54,999 | 386 (6.4%) | 169 (3.7%) |
| $55,000 to $64,999 | 678 (11.2%) | 158 (3.5%) |
| $65,000 to $74,999 | 218 (3.6%) | 62 (1.3%) |
| $75,000 to $99,999 | 506 (8.4%) | 248 (5.4%) |
| $100,000+ | 437 (7.2%) | 173 (3.8%) |
| Total | 6,059 (100.0%) | 4,581 (100.0%) |
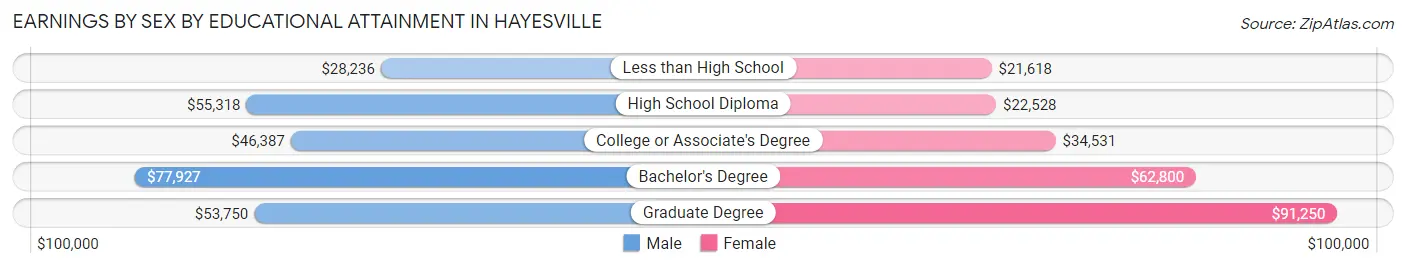
Earnings by Sex by Educational Attainment in Hayesville
Average earnings in Hayesville are $44,372 for men and $31,654 for women, a difference of 28.7%. Men with an educational attainment of bachelor's degree enjoy the highest average annual earnings of $77,927, while those with less than high school education earn the least with $28,236. Women with an educational attainment of graduate degree earn the most with the average annual earnings of $91,250, while those with less than high school education have the smallest earnings of $21,618.
| Educational Attainment | Male Income | Female Income |
| Less than High School | $28,236 | $21,618 |
| High School Diploma | $55,318 | $22,528 |
| College or Associate's Degree | $46,387 | $34,531 |
| Bachelor's Degree | $77,927 | $62,800 |
| Graduate Degree | $53,750 | $91,250 |
| Total | $44,372 | $31,654 |
Family Income in Hayesville
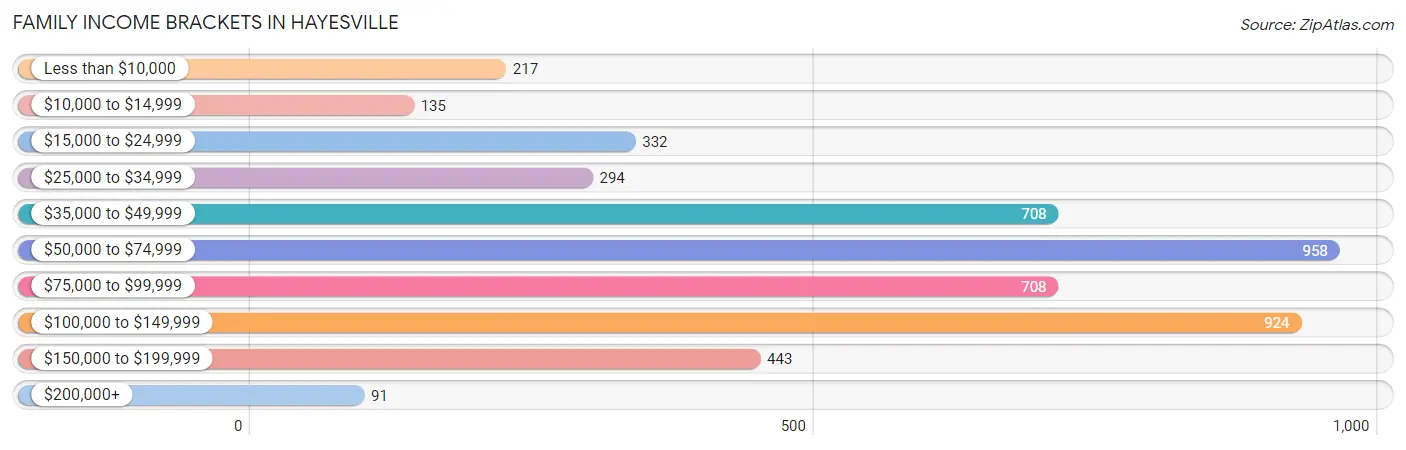
Family Income Brackets in Hayesville
According to the Hayesville family income data, there are 958 families falling into the $50,000 to $74,999 income range, which is the most common income bracket and makes up 19.9% of all families. Conversely, the $200,000+ income bracket is the least frequent group with only 91 families (1.9%) belonging to this category.
| Income Bracket | # Families | % Families |
| Less than $10,000 | 217 | 4.5% |
| $10,000 to $14,999 | 135 | 2.8% |
| $15,000 to $24,999 | 332 | 6.9% |
| $25,000 to $34,999 | 294 | 6.1% |
| $35,000 to $49,999 | 708 | 14.7% |
| $50,000 to $74,999 | 958 | 19.9% |
| $75,000 to $99,999 | 708 | 14.7% |
| $100,000 to $149,999 | 924 | 19.2% |
| $150,000 to $199,999 | 443 | 9.2% |
| $200,000+ | 91 | 1.9% |
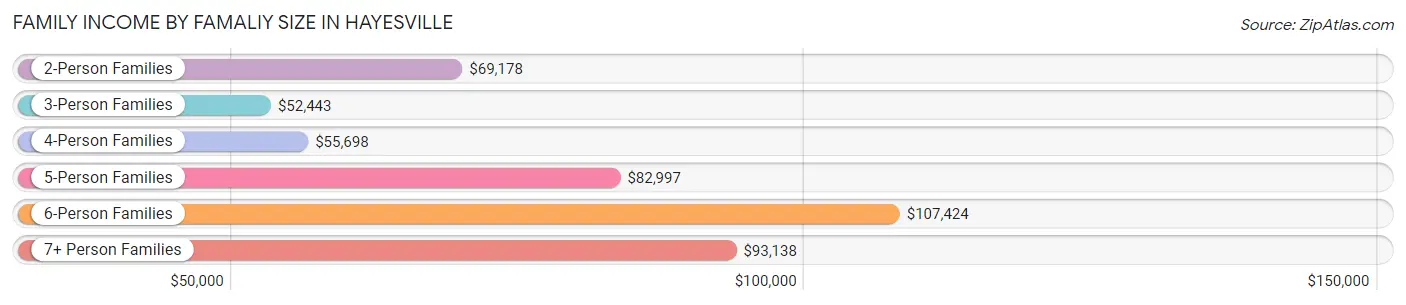
Family Income by Famaliy Size in Hayesville
6-person families (646 | 13.4%) account for the highest median family income in Hayesville with $107,424 per family, while 2-person families (1,575 | 32.7%) have the highest median income of $34,589 per family member.
| Income Bracket | # Families | Median Income |
| 2-Person Families | 1,575 (32.7%) | $69,178 |
| 3-Person Families | 1,089 (22.6%) | $52,443 |
| 4-Person Families | 964 (20.0%) | $55,698 |
| 5-Person Families | 471 (9.8%) | $82,997 |
| 6-Person Families | 646 (13.4%) | $107,424 |
| 7+ Person Families | 70 (1.5%) | $93,138 |
| Total | 4,815 (100.0%) | $63,719 |
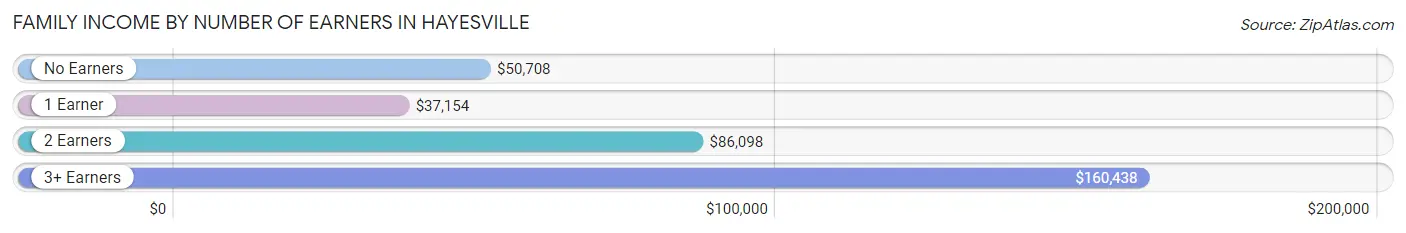
Family Income by Number of Earners in Hayesville
The median family income in Hayesville is $63,719, with families comprising 3+ earners (578) having the highest median family income of $160,438, while families with 1 earner (1,552) have the lowest median family income of $37,154, accounting for 12.0% and 32.2% of families, respectively.
| Number of Earners | # Families | Median Income |
| No Earners | 795 (16.5%) | $50,708 |
| 1 Earner | 1,552 (32.2%) | $37,154 |
| 2 Earners | 1,890 (39.3%) | $86,098 |
| 3+ Earners | 578 (12.0%) | $160,438 |
| Total | 4,815 (100.0%) | $63,719 |
Household Income in Hayesville
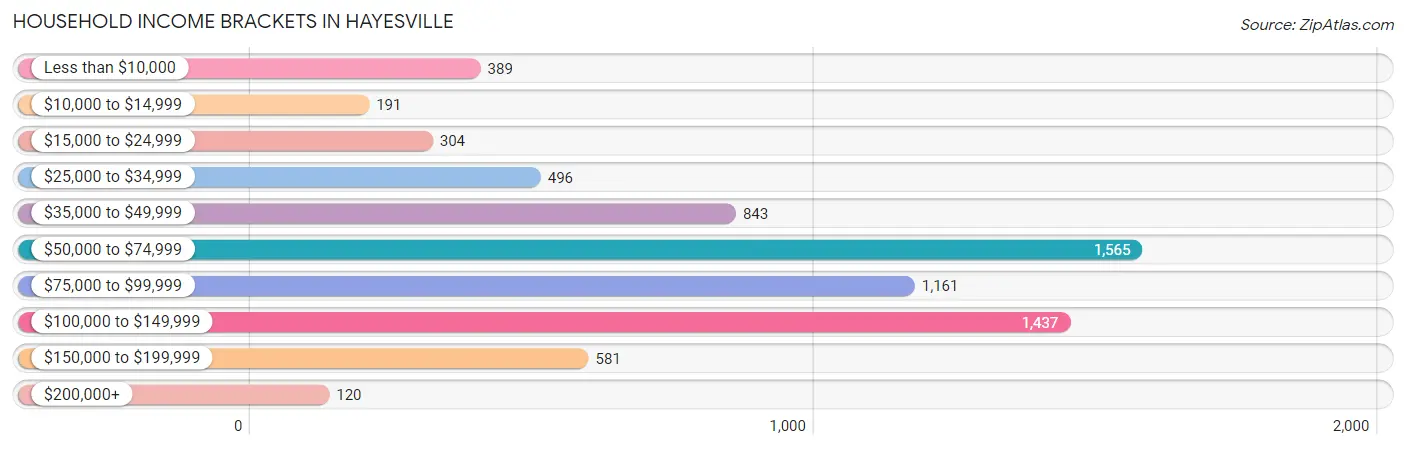
Household Income Brackets in Hayesville
With 1,565 households falling in the category, the $50,000 to $74,999 income range is the most frequent in Hayesville, accounting for 22.1% of all households. In contrast, only 120 households (1.7%) fall into the $200,000+ income bracket, making it the least populous group.
| Income Bracket | # Households | % Households |
| Less than $10,000 | 389 | 5.5% |
| $10,000 to $14,999 | 191 | 2.7% |
| $15,000 to $24,999 | 304 | 4.3% |
| $25,000 to $34,999 | 496 | 7.0% |
| $35,000 to $49,999 | 843 | 11.9% |
| $50,000 to $74,999 | 1,565 | 22.1% |
| $75,000 to $99,999 | 1,161 | 16.4% |
| $100,000 to $149,999 | 1,437 | 20.3% |
| $150,000 to $199,999 | 581 | 8.2% |
| $200,000+ | 120 | 1.7% |
Household Income by Householder Age in Hayesville
The median household income in Hayesville is $65,833, with the highest median household income of $84,153 found in the 45 to 64 years age bracket for the primary householder. A total of 2,247 households (31.7%) fall into this category. Meanwhile, the 15 to 24 years age bracket for the primary householder has the lowest median household income of $0, with 431 households (6.1%) in this group.
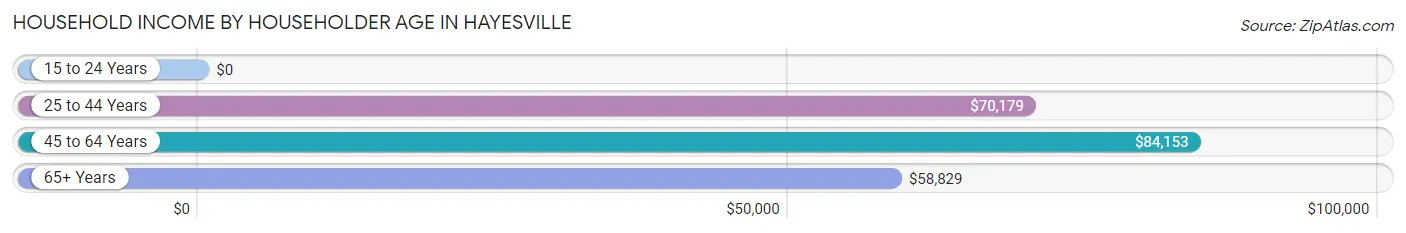
| Income Bracket | # Households | Median Income |
| 15 to 24 Years | 431 (6.1%) | $0 |
| 25 to 44 Years | 2,804 (39.6%) | $70,179 |
| 45 to 64 Years | 2,247 (31.7%) | $84,153 |
| 65+ Years | 1,598 (22.6%) | $58,829 |
| Total | 7,080 (100.0%) | $65,833 |
Poverty in Hayesville
Income Below Poverty by Sex and Age in Hayesville
With 18.5% poverty level for males and 18.7% for females among the residents of Hayesville, 5 year old males and 16 and 17 year old females are the most vulnerable to poverty, with 217 males (91.6%) and 172 females (42.8%) in their respective age groups living below the poverty level.
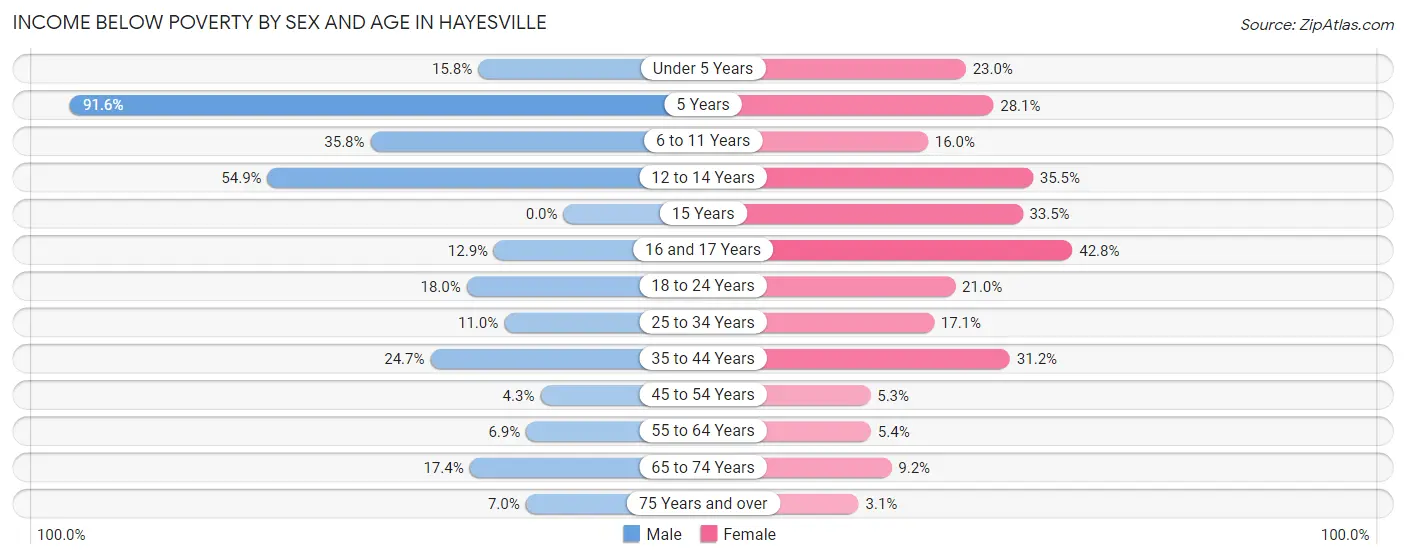
| Age Bracket | Male | Female |
| Under 5 Years | 135 (15.8%) | 170 (23.0%) |
| 5 Years | 217 (91.6%) | 18 (28.1%) |
| 6 to 11 Years | 408 (35.8%) | 120 (16.0%) |
| 12 to 14 Years | 195 (54.9%) | 145 (35.4%) |
| 15 Years | 0 (0.0%) | 116 (33.5%) |
| 16 and 17 Years | 46 (12.9%) | 172 (42.8%) |
| 18 to 24 Years | 290 (18.0%) | 286 (21.0%) |
| 25 to 34 Years | 251 (11.0%) | 233 (17.1%) |
| 35 to 44 Years | 331 (24.7%) | 385 (31.2%) |
| 45 to 54 Years | 51 (4.3%) | 66 (5.3%) |
| 55 to 64 Years | 72 (6.9%) | 38 (5.4%) |
| 65 to 74 Years | 181 (17.4%) | 82 (9.2%) |
| 75 Years and over | 36 (7.0%) | 10 (3.1%) |
| Total | 2,213 (18.5%) | 1,841 (18.7%) |
Income Above Poverty by Sex and Age in Hayesville
According to the poverty statistics in Hayesville, males aged 45 to 54 years and females aged 75 years and over are the age groups that are most secure financially, with 95.7% of males and 96.9% of females in these age groups living above the poverty line.
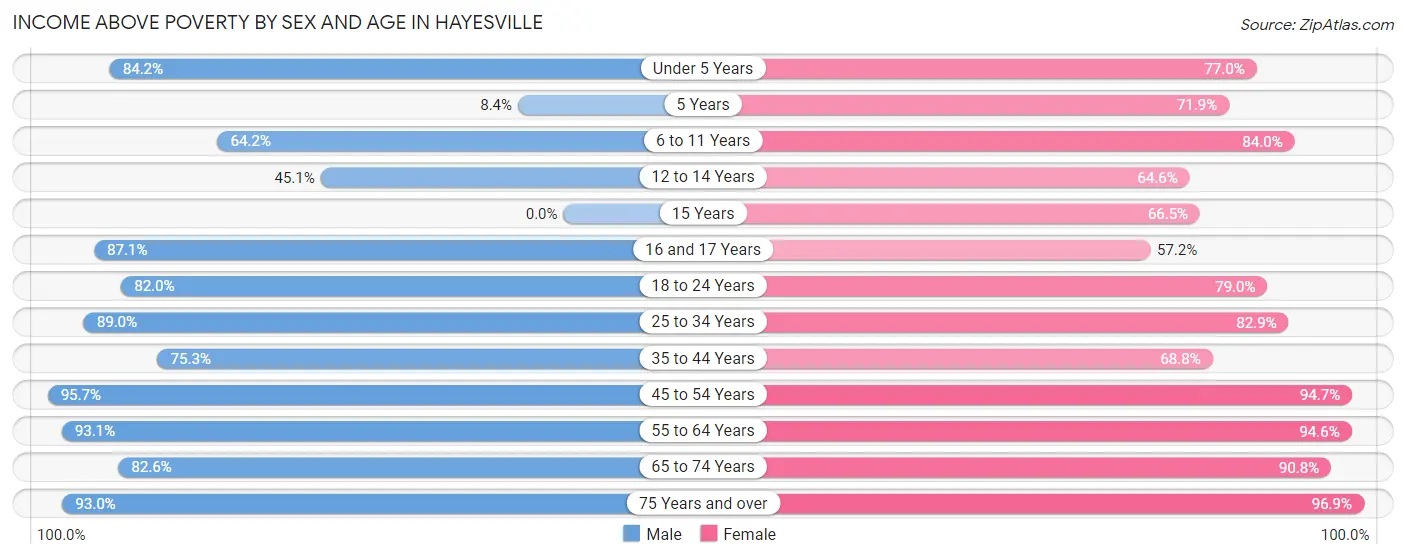
| Age Bracket | Male | Female |
| Under 5 Years | 718 (84.2%) | 569 (77.0%) |
| 5 Years | 20 (8.4%) | 46 (71.9%) |
| 6 to 11 Years | 731 (64.2%) | 632 (84.0%) |
| 12 to 14 Years | 160 (45.1%) | 264 (64.5%) |
| 15 Years | 0 (0.0%) | 230 (66.5%) |
| 16 and 17 Years | 311 (87.1%) | 230 (57.2%) |
| 18 to 24 Years | 1,325 (82.0%) | 1,074 (79.0%) |
| 25 to 34 Years | 2,029 (89.0%) | 1,130 (82.9%) |
| 35 to 44 Years | 1,009 (75.3%) | 849 (68.8%) |
| 45 to 54 Years | 1,137 (95.7%) | 1,181 (94.7%) |
| 55 to 64 Years | 969 (93.1%) | 666 (94.6%) |
| 65 to 74 Years | 858 (82.6%) | 809 (90.8%) |
| 75 Years and over | 477 (93.0%) | 310 (96.9%) |
| Total | 9,744 (81.5%) | 7,990 (81.3%) |
Income Below Poverty Among Married-Couple Families in Hayesville
The poverty statistics for married-couple families in Hayesville show that 6.7% or 212 of the total 3,183 families live below the poverty line. Families with 3 or 4 children have the highest poverty rate of 20.9%, comprising of 100 families. On the other hand, families with 5 or more children have the lowest poverty rate of 0.0%, which includes 0 families.
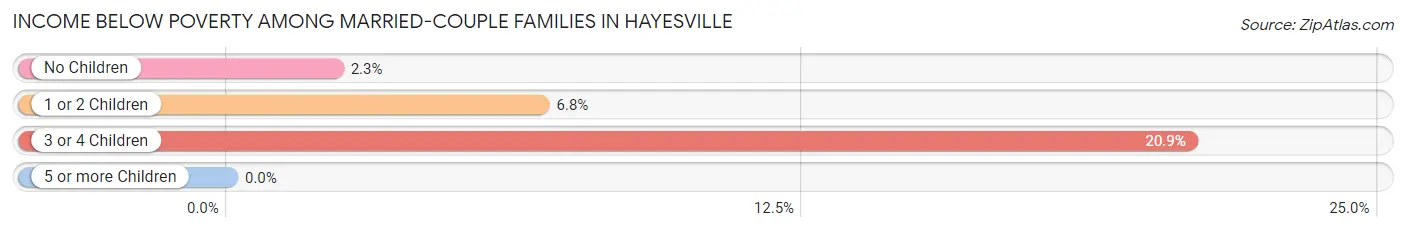
| Children | Above Poverty | Below Poverty |
| No Children | 1,532 (97.7%) | 36 (2.3%) |
| 1 or 2 Children | 1,045 (93.2%) | 76 (6.8%) |
| 3 or 4 Children | 379 (79.1%) | 100 (20.9%) |
| 5 or more Children | 15 (100.0%) | 0 (0.0%) |
| Total | 2,971 (93.3%) | 212 (6.7%) |
Income Below Poverty Among Single-Parent Households in Hayesville
According to the poverty data in Hayesville, 41.1% or 290 single-father households and 29.7% or 275 single-mother households are living below the poverty line. Among single-father households, those with 3 or 4 children have the highest poverty rate, with 92 households (88.5%) experiencing poverty. Likewise, among single-mother households, those with 5 or more children have the highest poverty rate, with 39 households (100.0%) falling below the poverty line.
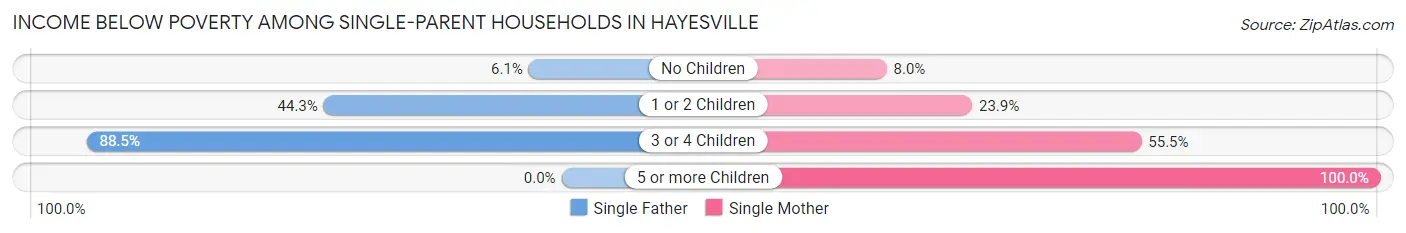
| Children | Single Father | Single Mother |
| No Children | 11 (6.1%) | 20 (8.0%) |
| 1 or 2 Children | 187 (44.3%) | 104 (23.9%) |
| 3 or 4 Children | 92 (88.5%) | 112 (55.4%) |
| 5 or more Children | 0 (0.0%) | 39 (100.0%) |
| Total | 290 (41.1%) | 275 (29.7%) |
Income Below Poverty Among Married-Couple vs Single-Parent Households in Hayesville
The poverty data for Hayesville shows that 212 of the married-couple family households (6.7%) and 565 of the single-parent households (34.6%) are living below the poverty level. Within the married-couple family households, those with 3 or 4 children have the highest poverty rate, with 100 households (20.9%) falling below the poverty line. Among the single-parent households, those with 5 or more children have the highest poverty rate, with 39 household (100.0%) living below poverty.
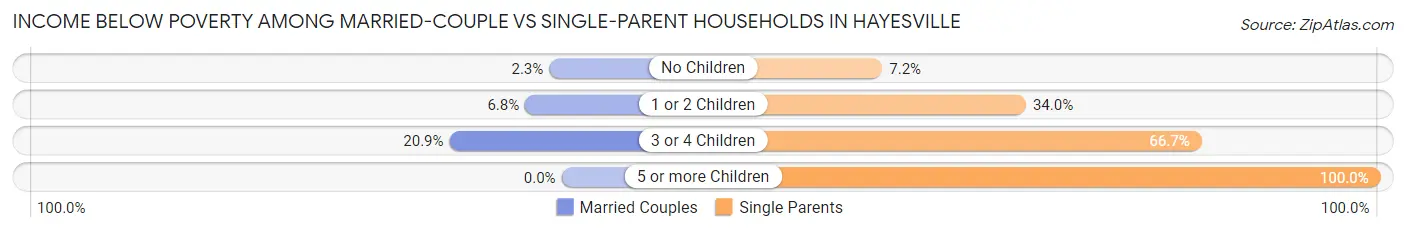
| Children | Married-Couple Families | Single-Parent Households |
| No Children | 36 (2.3%) | 31 (7.2%) |
| 1 or 2 Children | 76 (6.8%) | 291 (34.0%) |
| 3 or 4 Children | 100 (20.9%) | 204 (66.7%) |
| 5 or more Children | 0 (0.0%) | 39 (100.0%) |
| Total | 212 (6.7%) | 565 (34.6%) |
Race in Hayesville
The most populous races in Hayesville are White / Caucasian (12,991 | 59.5%), Hispanic or Latino (10,667 | 48.9%), and Some other Race (3,956 | 18.1%).
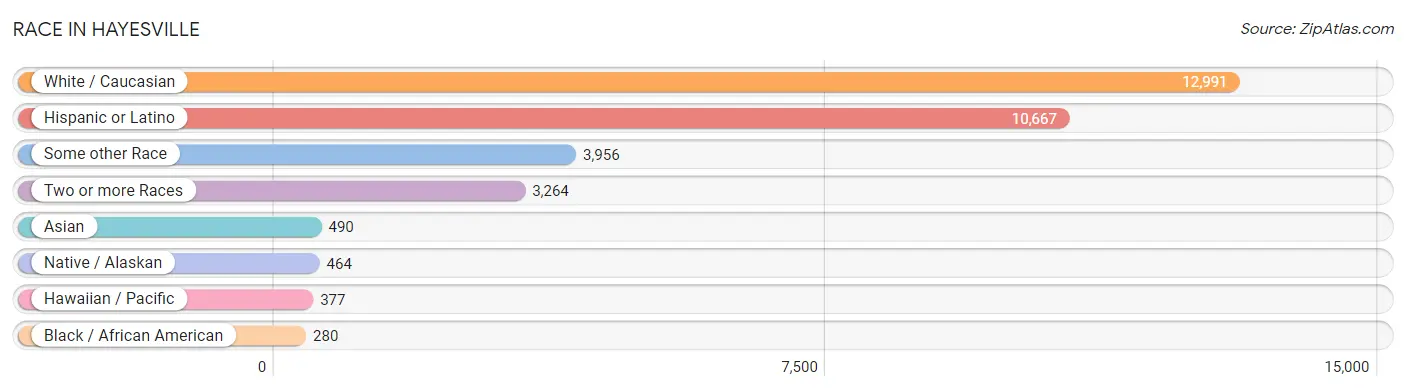
| Race | # Population | % Population |
| Asian | 490 | 2.2% |
| Black / African American | 280 | 1.3% |
| Hawaiian / Pacific | 377 | 1.7% |
| Hispanic or Latino | 10,667 | 48.9% |
| Native / Alaskan | 464 | 2.1% |
| White / Caucasian | 12,991 | 59.5% |
| Two or more Races | 3,264 | 15.0% |
| Some other Race | 3,956 | 18.1% |
| Total | 21,822 | 100.0% |
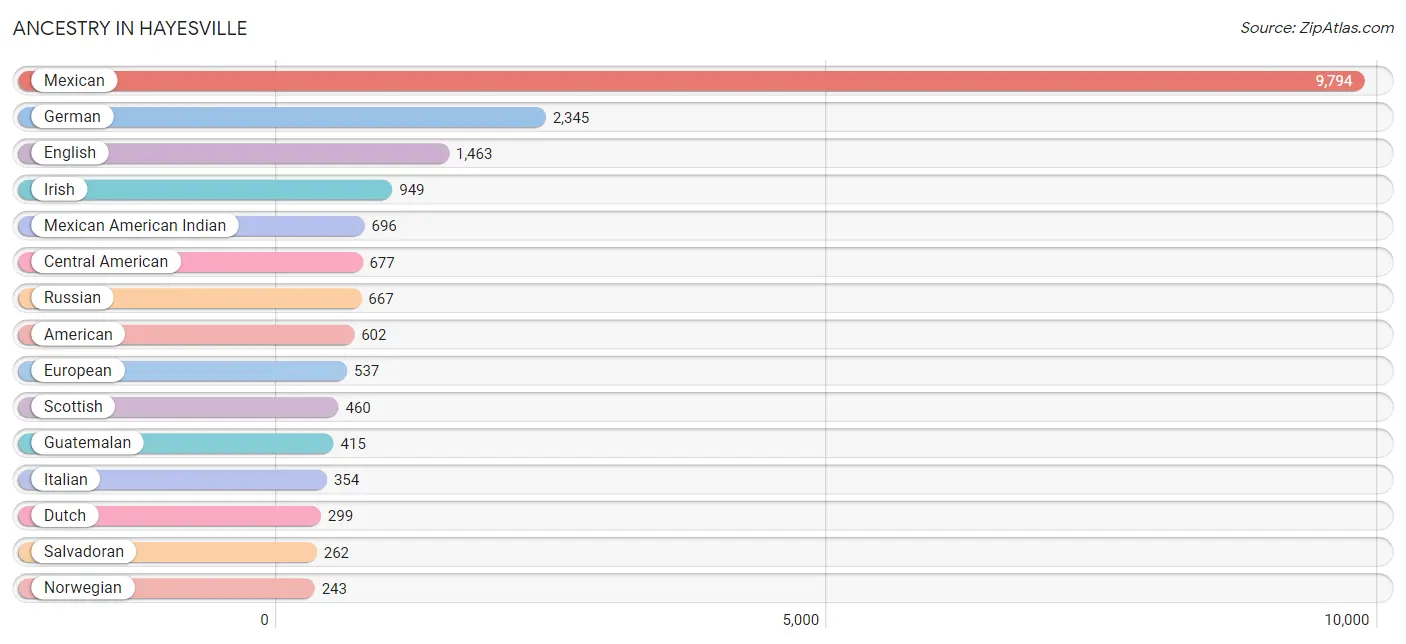
Ancestry in Hayesville
The most populous ancestries reported in Hayesville are Mexican (9,794 | 44.9%), German (2,345 | 10.7%), English (1,463 | 6.7%), Irish (949 | 4.3%), and Mexican American Indian (696 | 3.2%), together accounting for 69.9% of all Hayesville residents.
| Ancestry | # Population | % Population |
| Alsatian | 12 | 0.1% |
| American | 602 | 2.8% |
| Apache | 18 | 0.1% |
| Armenian | 15 | 0.1% |
| Austrian | 8 | 0.0% |
| Bangladeshi | 59 | 0.3% |
| Bhutanese | 35 | 0.2% |
| British | 173 | 0.8% |
| Burmese | 27 | 0.1% |
| Canadian | 32 | 0.2% |
| Central American | 677 | 3.1% |
| Central American Indian | 32 | 0.2% |
| Cherokee | 13 | 0.1% |
| Chippewa | 12 | 0.1% |
| Czech | 40 | 0.2% |
| Danish | 100 | 0.5% |
| Dutch | 299 | 1.4% |
| Eastern European | 10 | 0.1% |
| English | 1,463 | 6.7% |
| European | 537 | 2.5% |
| Fijian | 51 | 0.2% |
| French | 220 | 1.0% |
| French Canadian | 161 | 0.7% |
| German | 2,345 | 10.7% |
| Greek | 31 | 0.1% |
| Guatemalan | 415 | 1.9% |
| Hungarian | 57 | 0.3% |
| Indian (Asian) | 32 | 0.2% |
| Irish | 949 | 4.3% |
| Italian | 354 | 1.6% |
| Japanese | 64 | 0.3% |
| Korean | 146 | 0.7% |
| Malaysian | 35 | 0.2% |
| Mexican | 9,794 | 44.9% |
| Mexican American Indian | 696 | 3.2% |
| Native Hawaiian | 61 | 0.3% |
| Navajo | 18 | 0.1% |
| Northern European | 27 | 0.1% |
| Norwegian | 243 | 1.1% |
| Paiute | 23 | 0.1% |
| Pakistani | 62 | 0.3% |
| Peruvian | 178 | 0.8% |
| Polish | 163 | 0.7% |
| Portuguese | 35 | 0.2% |
| Puerto Rican | 16 | 0.1% |
| Romanian | 3 | 0.0% |
| Russian | 667 | 3.1% |
| Salvadoran | 262 | 1.2% |
| Scandinavian | 51 | 0.2% |
| Scotch-Irish | 84 | 0.4% |
| Scottish | 460 | 2.1% |
| Serbian | 30 | 0.1% |
| Sioux | 66 | 0.3% |
| Slavic | 11 | 0.1% |
| South American | 178 | 0.8% |
| Spaniard | 2 | 0.0% |
| Sri Lankan | 122 | 0.6% |
| Swedish | 152 | 0.7% |
| Swiss | 65 | 0.3% |
| Thai | 113 | 0.5% |
| Ukrainian | 52 | 0.2% |
| Welsh | 126 | 0.6% | View All 62 Rows |
Immigrants in Hayesville
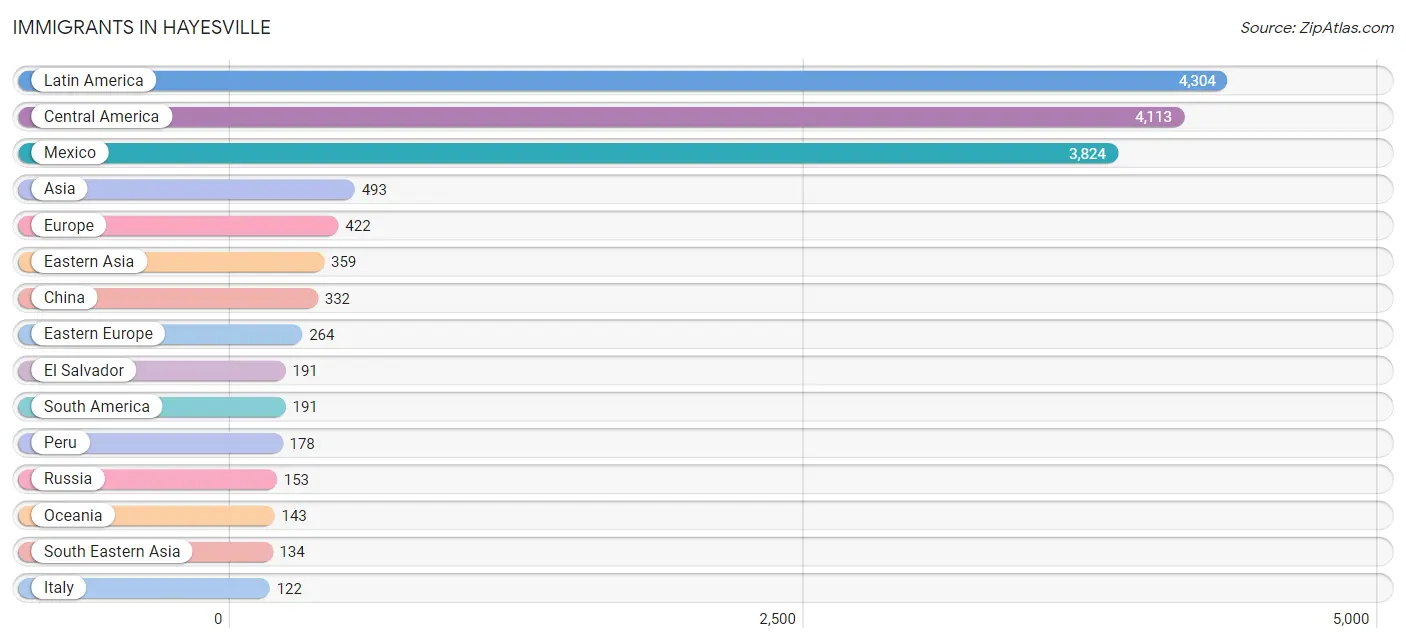
The most numerous immigrant groups reported in Hayesville came from Latin America (4,304 | 19.7%), Central America (4,113 | 18.9%), Mexico (3,824 | 17.5%), Asia (493 | 2.3%), and Europe (422 | 1.9%), together accounting for 60.3% of all Hayesville residents.
| Immigration Origin | # Population | % Population |
| Africa | 34 | 0.2% |
| Asia | 493 | 2.3% |
| Belarus | 69 | 0.3% |
| Brazil | 13 | 0.1% |
| Canada | 42 | 0.2% |
| Central America | 4,113 | 18.9% |
| China | 332 | 1.5% |
| Czechoslovakia | 12 | 0.1% |
| Eastern Africa | 1 | 0.0% |
| Eastern Asia | 359 | 1.7% |
| Eastern Europe | 264 | 1.2% |
| El Salvador | 191 | 0.9% |
| England | 5 | 0.0% |
| Ethiopia | 1 | 0.0% |
| Europe | 422 | 1.9% |
| Germany | 31 | 0.1% |
| Guatemala | 98 | 0.4% |
| Italy | 122 | 0.6% |
| Korea | 27 | 0.1% |
| Laos | 10 | 0.1% |
| Latin America | 4,304 | 19.7% |
| Mexico | 3,824 | 17.5% |
| Micronesia | 92 | 0.4% |
| Middle Africa | 33 | 0.2% |
| Northern Europe | 5 | 0.0% |
| Oceania | 143 | 0.7% |
| Peru | 178 | 0.8% |
| Philippines | 39 | 0.2% |
| Romania | 3 | 0.0% |
| Russia | 153 | 0.7% |
| South America | 191 | 0.9% |
| South Eastern Asia | 134 | 0.6% |
| Southern Europe | 122 | 0.6% |
| Thailand | 33 | 0.2% |
| Ukraine | 27 | 0.1% |
| Vietnam | 52 | 0.2% |
| Western Europe | 31 | 0.1% | View All 37 Rows |
Sex and Age in Hayesville
Sex and Age in Hayesville
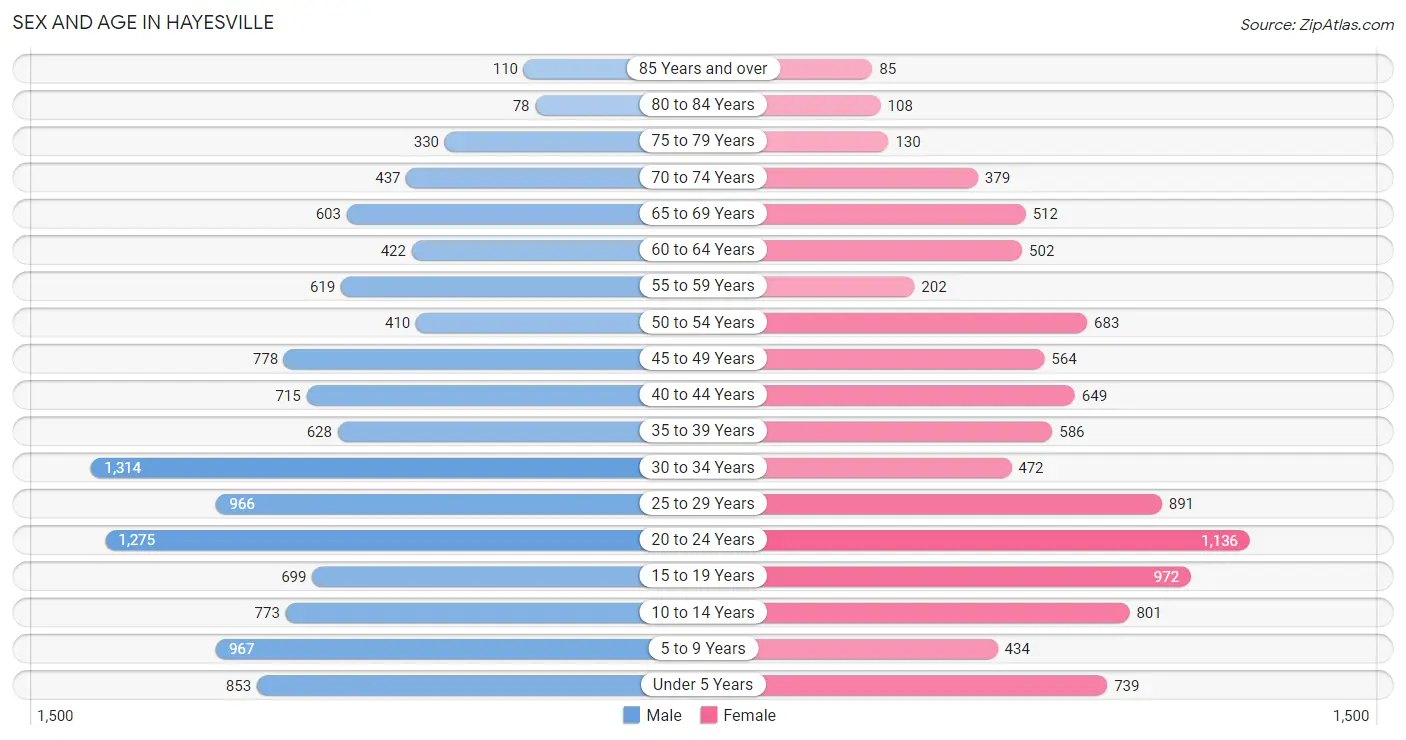
The most populous age groups in Hayesville are 30 to 34 Years (1,314 | 11.0%) for men and 20 to 24 Years (1,136 | 11.5%) for women.
| Age Bracket | Male | Female |
| Under 5 Years | 853 (7.1%) | 739 (7.5%) |
| 5 to 9 Years | 967 (8.1%) | 434 (4.4%) |
| 10 to 14 Years | 773 (6.5%) | 801 (8.1%) |
| 15 to 19 Years | 699 (5.8%) | 972 (9.9%) |
| 20 to 24 Years | 1,275 (10.6%) | 1,136 (11.5%) |
| 25 to 29 Years | 966 (8.1%) | 891 (9.0%) |
| 30 to 34 Years | 1,314 (11.0%) | 472 (4.8%) |
| 35 to 39 Years | 628 (5.2%) | 586 (5.9%) |
| 40 to 44 Years | 715 (6.0%) | 649 (6.6%) |
| 45 to 49 Years | 778 (6.5%) | 564 (5.7%) |
| 50 to 54 Years | 410 (3.4%) | 683 (6.9%) |
| 55 to 59 Years | 619 (5.2%) | 202 (2.1%) |
| 60 to 64 Years | 422 (3.5%) | 502 (5.1%) |
| 65 to 69 Years | 603 (5.0%) | 512 (5.2%) |
| 70 to 74 Years | 437 (3.6%) | 379 (3.8%) |
| 75 to 79 Years | 330 (2.8%) | 130 (1.3%) |
| 80 to 84 Years | 78 (0.6%) | 108 (1.1%) |
| 85 Years and over | 110 (0.9%) | 85 (0.9%) |
| Total | 11,977 (100.0%) | 9,845 (100.0%) |
Families and Households in Hayesville
Median Family Size in Hayesville
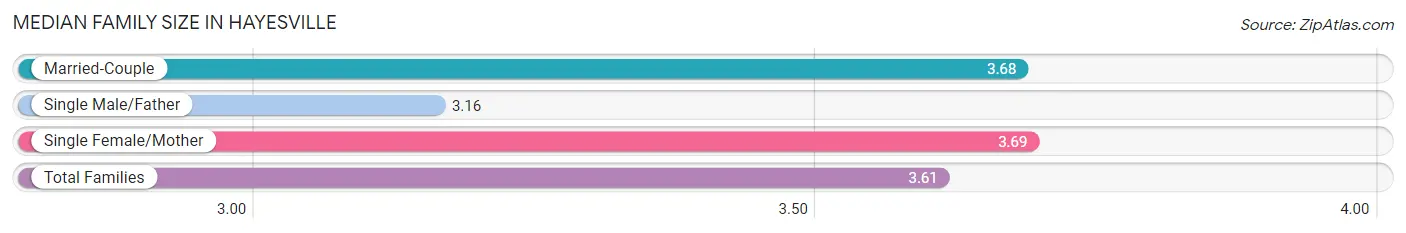
The median family size in Hayesville is 3.61 persons per family, with single female/mother families (926 | 19.2%) accounting for the largest median family size of 3.69 persons per family. On the other hand, single male/father families (706 | 14.7%) represent the smallest median family size with 3.16 persons per family.
| Family Type | # Families | Family Size |
| Married-Couple | 3,183 (66.1%) | 3.68 |
| Single Male/Father | 706 (14.7%) | 3.16 |
| Single Female/Mother | 926 (19.2%) | 3.69 |
| Total Families | 4,815 (100.0%) | 3.61 |
Median Household Size in Hayesville
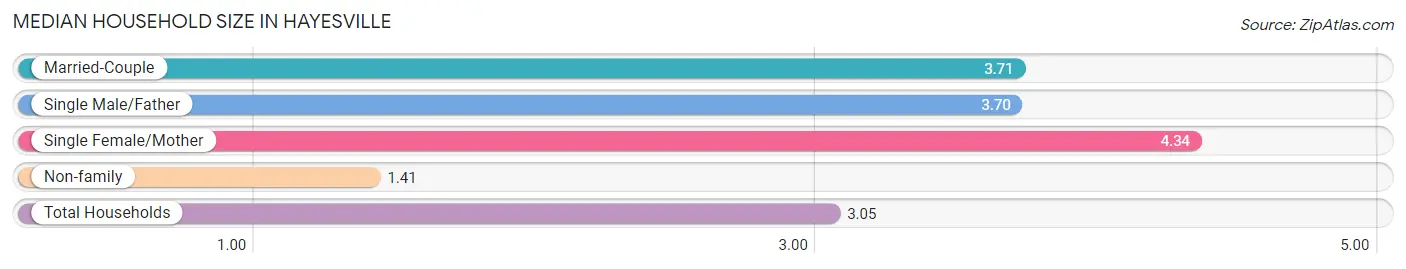
The median household size in Hayesville is 3.05 persons per household, with single female/mother households (926 | 13.1%) accounting for the largest median household size of 4.34 persons per household. non-family households (2,265 | 32.0%) represent the smallest median household size with 1.41 persons per household.
| Household Type | # Households | Household Size |
| Married-Couple | 3,183 (45.0%) | 3.71 |
| Single Male/Father | 706 (10.0%) | 3.70 |
| Single Female/Mother | 926 (13.1%) | 4.34 |
| Non-family | 2,265 (32.0%) | 1.41 |
| Total Households | 7,080 (100.0%) | 3.05 |
Household Size by Marriage Status in Hayesville
Out of a total of 7,080 households in Hayesville, 4,815 (68.0%) are family households, while 2,265 (32.0%) are nonfamily households. The most numerous type of family households are 2-person households, comprising 1,499, and the most common type of nonfamily households are 1-person households, comprising 1,680.
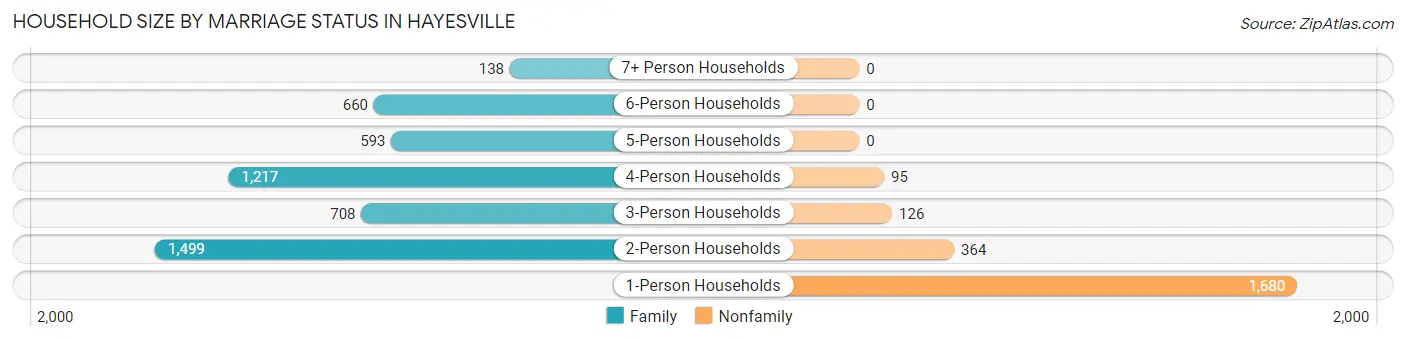
| Household Size | Family Households | Nonfamily Households |
| 1-Person Households | - | 1,680 (23.7%) |
| 2-Person Households | 1,499 (21.2%) | 364 (5.1%) |
| 3-Person Households | 708 (10.0%) | 126 (1.8%) |
| 4-Person Households | 1,217 (17.2%) | 95 (1.3%) |
| 5-Person Households | 593 (8.4%) | 0 (0.0%) |
| 6-Person Households | 660 (9.3%) | 0 (0.0%) |
| 7+ Person Households | 138 (1.9%) | 0 (0.0%) |
| Total | 4,815 (68.0%) | 2,265 (32.0%) |
Female Fertility in Hayesville
Fertility by Age in Hayesville
Average fertility rate in Hayesville is 40.0 births per 1,000 women. Women in the age bracket of 20 to 34 years have the highest fertility rate with 85.0 births per 1,000 women. Women in the age bracket of 20 to 34 years acount for 96.8% of all women with births.
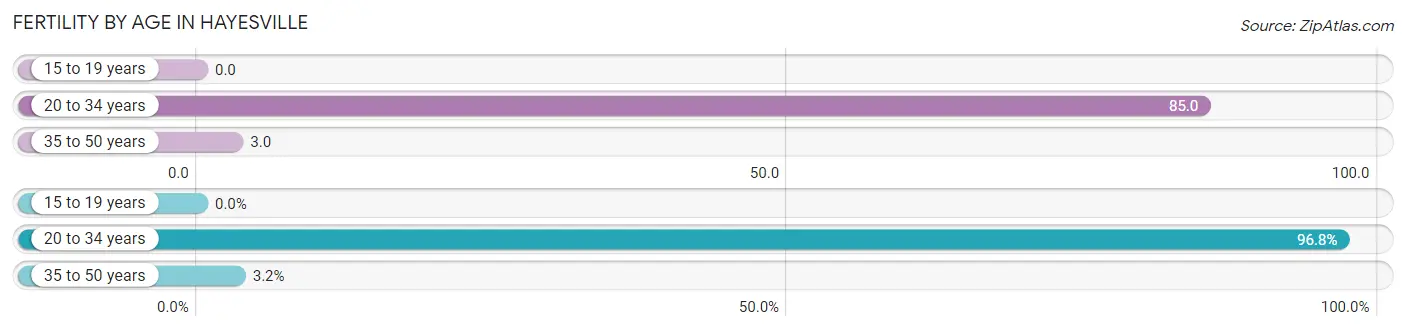
| Age Bracket | Women with Births | Births / 1,000 Women |
| 15 to 19 years | 0 (0.0%) | 0.0 |
| 20 to 34 years | 212 (96.8%) | 85.0 |
| 35 to 50 years | 7 (3.2%) | 3.0 |
| Total | 219 (100.0%) | 40.0 |
Fertility by Age by Marriage Status in Hayesville
55.3% of women with births (219) in Hayesville are married. The highest percentage of unmarried women with births falls into 35 to 50 years age bracket with 100.0% of them unmarried at the time of birth, while the lowest percentage of unmarried women with births belong to 20 to 34 years age bracket with 42.9% of them unmarried.
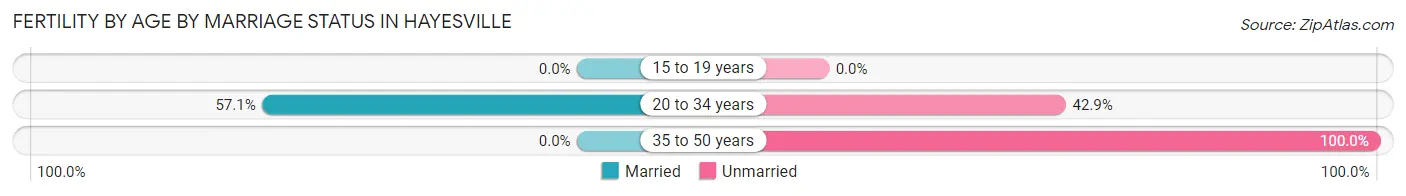
| Age Bracket | Married | Unmarried |
| 15 to 19 years | 0 (0.0%) | 0 (0.0%) |
| 20 to 34 years | 121 (57.1%) | 91 (42.9%) |
| 35 to 50 years | 0 (0.0%) | 7 (100.0%) |
| Total | 121 (55.2%) | 98 (44.8%) |
Fertility by Education in Hayesville
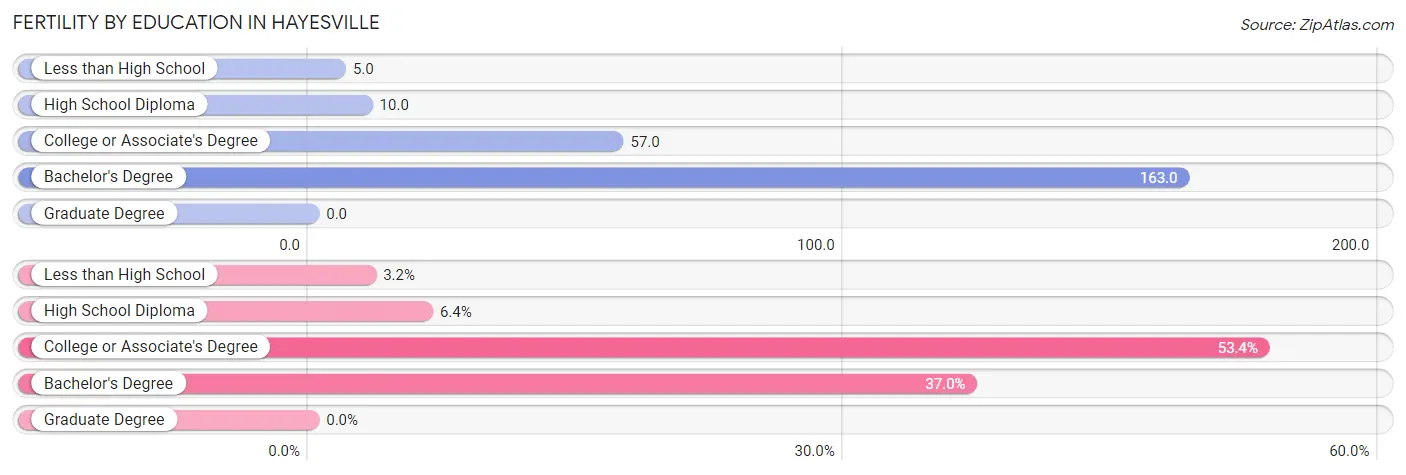
| Educational Attainment | Women with Births | Births / 1,000 Women |
| Less than High School | 7 (3.2%) | 5.0 |
| High School Diploma | 14 (6.4%) | 10.0 |
| College or Associate's Degree | 117 (53.4%) | 57.0 |
| Bachelor's Degree | 81 (37.0%) | 163.0 |
| Graduate Degree | 0 (0.0%) | 0.0 |
| Total | 219 (100.0%) | 40.0 |
Fertility by Education by Marriage Status in Hayesville
44.8% of women with births in Hayesville are unmarried. Women with the educational attainment of college or associate's degree are most likely to be married with 66.7% of them married at childbirth, while women with the educational attainment of less than high school are least likely to be married with 100.0% of them unmarried at childbirth.
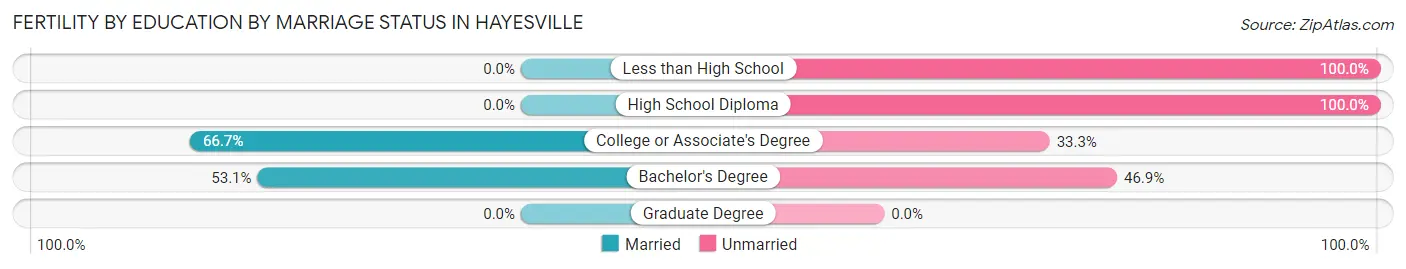
| Educational Attainment | Married | Unmarried |
| Less than High School | 0 (0.0%) | 7 (100.0%) |
| High School Diploma | 0 (0.0%) | 14 (100.0%) |
| College or Associate's Degree | 78 (66.7%) | 39 (33.3%) |
| Bachelor's Degree | 43 (53.1%) | 38 (46.9%) |
| Graduate Degree | 0 (0.0%) | 0 (0.0%) |
| Total | 121 (55.2%) | 98 (44.8%) |
Employment Characteristics in Hayesville
Employment by Class of Employer in Hayesville
Among the 9,553 employed individuals in Hayesville, private company employees (7,762 | 81.2%), local government employees (555 | 5.8%), and state government employees (389 | 4.1%) make up the most common classes of employment.
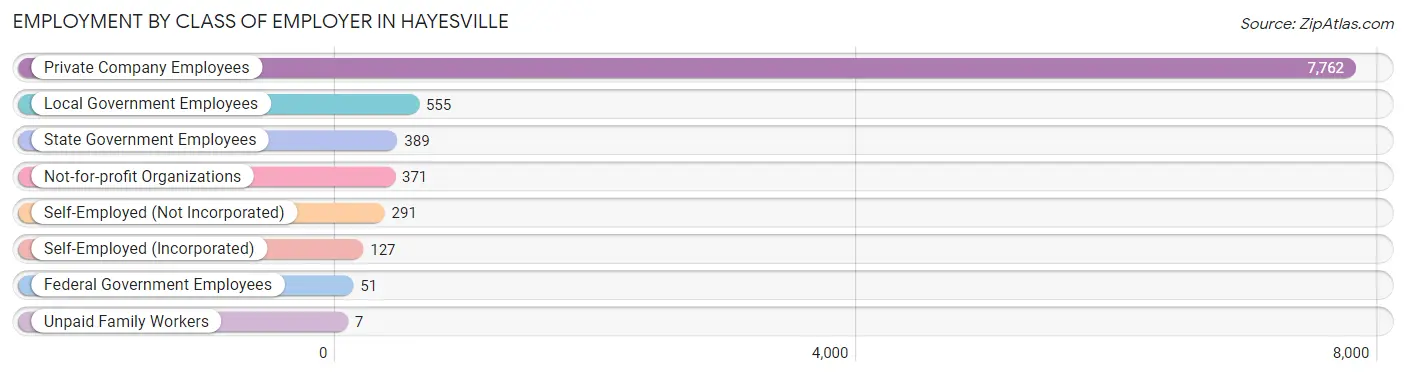
| Employer Class | # Employees | % Employees |
| Private Company Employees | 7,762 | 81.2% |
| Self-Employed (Incorporated) | 127 | 1.3% |
| Self-Employed (Not Incorporated) | 291 | 3.0% |
| Not-for-profit Organizations | 371 | 3.9% |
| Local Government Employees | 555 | 5.8% |
| State Government Employees | 389 | 4.1% |
| Federal Government Employees | 51 | 0.5% |
| Unpaid Family Workers | 7 | 0.1% |
| Total | 9,553 | 100.0% |
Employment Status by Age in Hayesville
According to the labor force statistics for Hayesville, out of the total population over 16 years of age (16,909), 60.9% or 10,298 individuals are in the labor force, with 5.8% or 597 of them unemployed. The age group with the highest labor force participation rate is 30 to 34 years, with 91.2% or 1,629 individuals in the labor force. Within the labor force, the 20 to 24 years age range has the highest percentage of unemployed individuals, with 16.4% or 270 of them being unemployed.
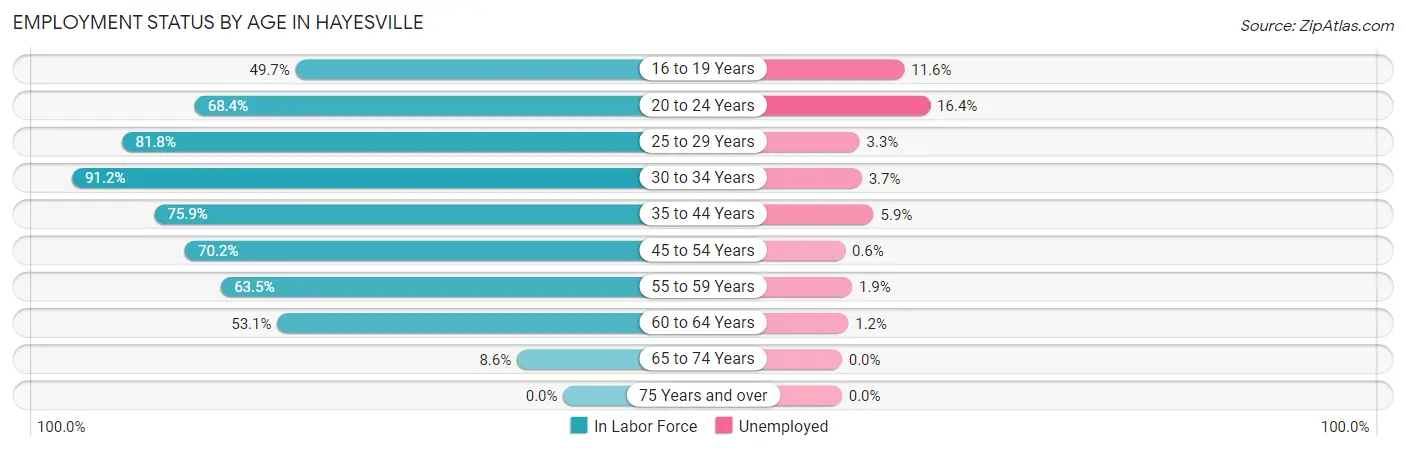
| Age Bracket | In Labor Force | Unemployed |
| 16 to 19 Years | 659 (49.7%) | 76 (11.6%) |
| 20 to 24 Years | 1,649 (68.4%) | 270 (16.4%) |
| 25 to 29 Years | 1,519 (81.8%) | 50 (3.3%) |
| 30 to 34 Years | 1,629 (91.2%) | 60 (3.7%) |
| 35 to 44 Years | 1,957 (75.9%) | 115 (5.9%) |
| 45 to 54 Years | 1,709 (70.2%) | 10 (0.6%) |
| 55 to 59 Years | 521 (63.5%) | 10 (1.9%) |
| 60 to 64 Years | 491 (53.1%) | 6 (1.2%) |
| 65 to 74 Years | 166 (8.6%) | 0 (0.0%) |
| 75 Years and over | 0 (0.0%) | 0 (0.0%) |
| Total | 10,298 (60.9%) | 597 (5.8%) |
Employment Status by Educational Attainment in Hayesville
According to labor force statistics for Hayesville, 75.2% of individuals (7,822) out of the total population between 25 and 64 years of age (10,401) are in the labor force, with 3.2% or 250 of them being unemployed. The group with the highest labor force participation rate are those with the educational attainment of bachelor's degree or higher, with 88.0% or 951 individuals in the labor force. Within the labor force, individuals with college / associate degree education have the highest percentage of unemployment, with 6.3% or 173 of them being unemployed.
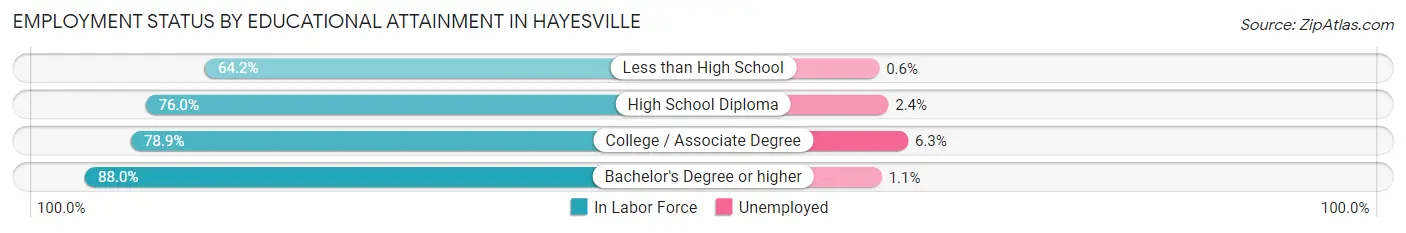
| Educational Attainment | In Labor Force | Unemployed |
| Less than High School | 1,688 (64.2%) | 16 (0.6%) |
| High School Diploma | 2,434 (76.0%) | 77 (2.4%) |
| College / Associate Degree | 2,752 (78.9%) | 220 (6.3%) |
| Bachelor's Degree or higher | 951 (88.0%) | 12 (1.1%) |
| Total | 7,822 (75.2%) | 333 (3.2%) |
Employment Occupations by Sex in Hayesville
Management, Business, Science and Arts Occupations
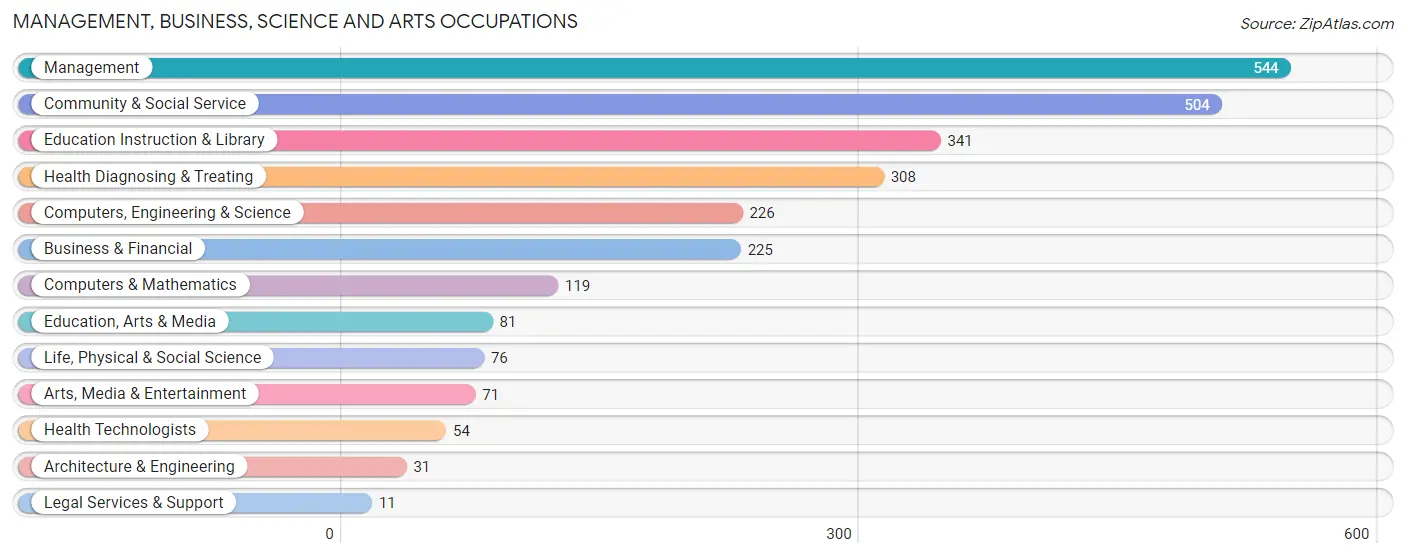
The most common Management, Business, Science and Arts occupations in Hayesville are Management (544 | 5.6%), Community & Social Service (504 | 5.2%), Education Instruction & Library (341 | 3.5%), Health Diagnosing & Treating (308 | 3.2%), and Computers, Engineering & Science (226 | 2.3%).
Management, Business, Science and Arts Occupations by Sex
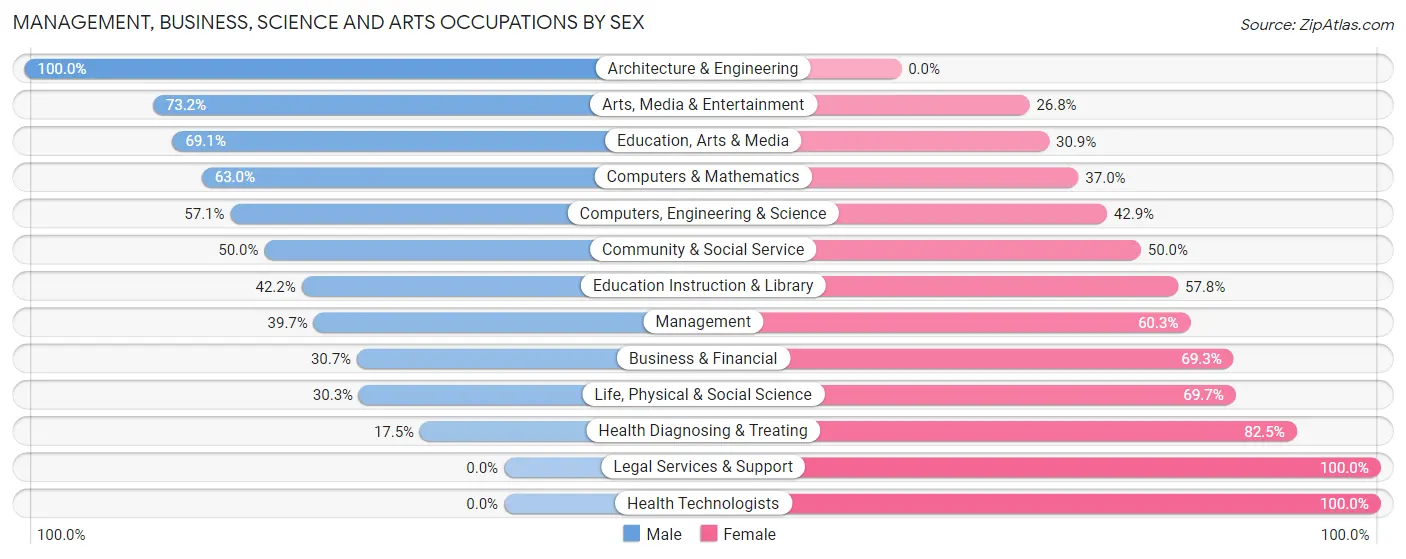
Within the Management, Business, Science and Arts occupations in Hayesville, the most male-oriented occupations are Architecture & Engineering (100.0%), Arts, Media & Entertainment (73.2%), and Education, Arts & Media (69.1%), while the most female-oriented occupations are Legal Services & Support (100.0%), Health Technologists (100.0%), and Health Diagnosing & Treating (82.5%).
| Occupation | Male | Female |
| Management | 216 (39.7%) | 328 (60.3%) |
| Business & Financial | 69 (30.7%) | 156 (69.3%) |
| Computers, Engineering & Science | 129 (57.1%) | 97 (42.9%) |
| Computers & Mathematics | 75 (63.0%) | 44 (37.0%) |
| Architecture & Engineering | 31 (100.0%) | 0 (0.0%) |
| Life, Physical & Social Science | 23 (30.3%) | 53 (69.7%) |
| Community & Social Service | 252 (50.0%) | 252 (50.0%) |
| Education, Arts & Media | 56 (69.1%) | 25 (30.9%) |
| Legal Services & Support | 0 (0.0%) | 11 (100.0%) |
| Education Instruction & Library | 144 (42.2%) | 197 (57.8%) |
| Arts, Media & Entertainment | 52 (73.2%) | 19 (26.8%) |
| Health Diagnosing & Treating | 54 (17.5%) | 254 (82.5%) |
| Health Technologists | 0 (0.0%) | 54 (100.0%) |
| Total (Category) | 720 (39.9%) | 1,087 (60.2%) |
| Total (Overall) | 5,523 (56.9%) | 4,177 (43.1%) |
Services Occupations
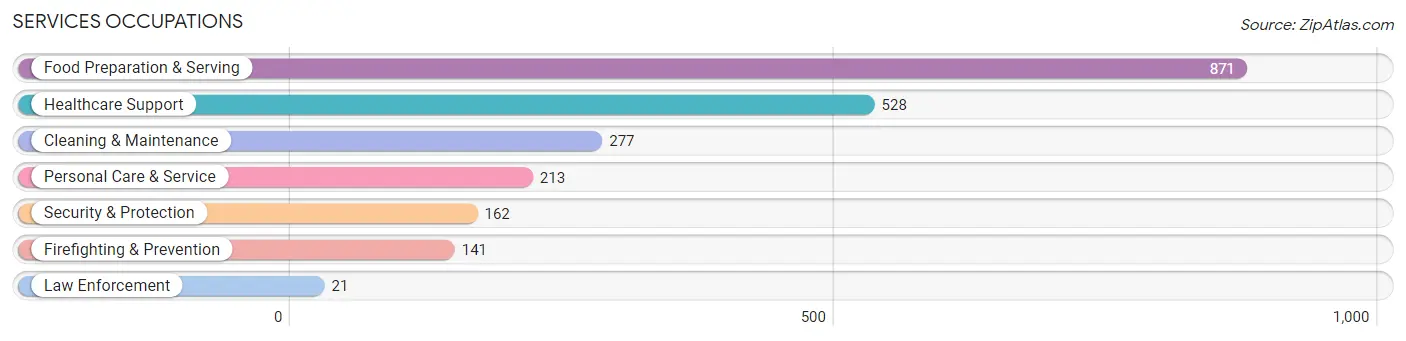
The most common Services occupations in Hayesville are Food Preparation & Serving (871 | 9.0%), Healthcare Support (528 | 5.4%), Cleaning & Maintenance (277 | 2.9%), Personal Care & Service (213 | 2.2%), and Security & Protection (162 | 1.7%).
Services Occupations by Sex
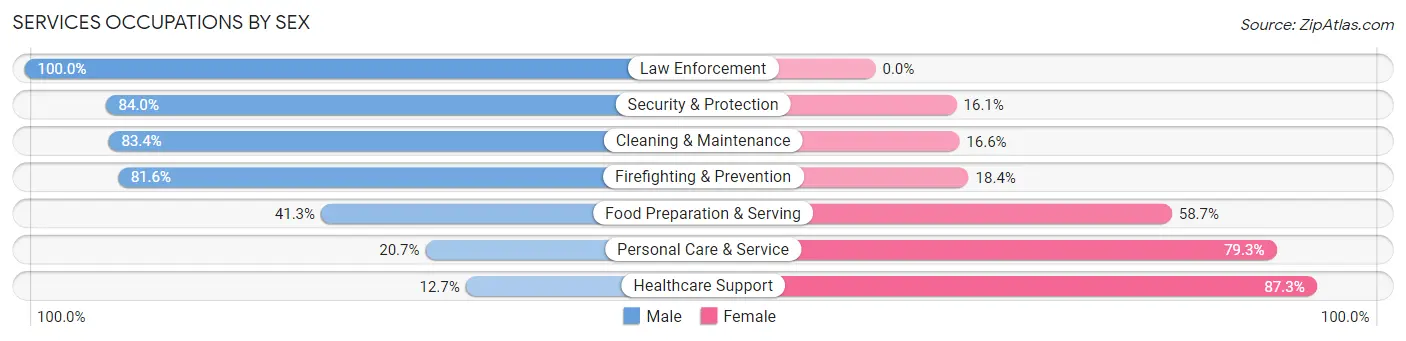
Within the Services occupations in Hayesville, the most male-oriented occupations are Law Enforcement (100.0%), Security & Protection (84.0%), and Cleaning & Maintenance (83.4%), while the most female-oriented occupations are Healthcare Support (87.3%), Personal Care & Service (79.3%), and Food Preparation & Serving (58.7%).
| Occupation | Male | Female |
| Healthcare Support | 67 (12.7%) | 461 (87.3%) |
| Security & Protection | 136 (84.0%) | 26 (16.1%) |
| Firefighting & Prevention | 115 (81.6%) | 26 (18.4%) |
| Law Enforcement | 21 (100.0%) | 0 (0.0%) |
| Food Preparation & Serving | 360 (41.3%) | 511 (58.7%) |
| Cleaning & Maintenance | 231 (83.4%) | 46 (16.6%) |
| Personal Care & Service | 44 (20.7%) | 169 (79.3%) |
| Total (Category) | 838 (40.9%) | 1,213 (59.1%) |
| Total (Overall) | 5,523 (56.9%) | 4,177 (43.1%) |
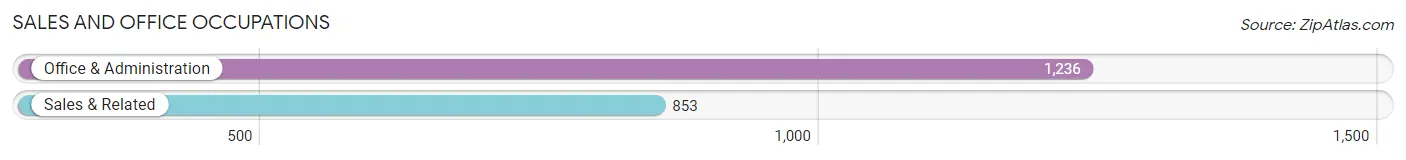
Sales and Office Occupations
The most common Sales and Office occupations in Hayesville are Office & Administration (1,236 | 12.7%), and Sales & Related (853 | 8.8%).
Sales and Office Occupations by Sex
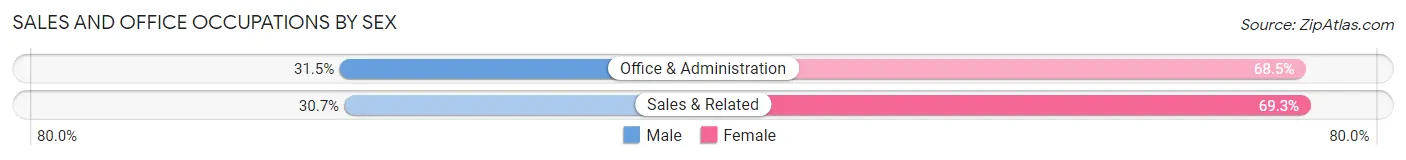
| Occupation | Male | Female |
| Sales & Related | 262 (30.7%) | 591 (69.3%) |
| Office & Administration | 389 (31.5%) | 847 (68.5%) |
| Total (Category) | 651 (31.2%) | 1,438 (68.8%) |
| Total (Overall) | 5,523 (56.9%) | 4,177 (43.1%) |
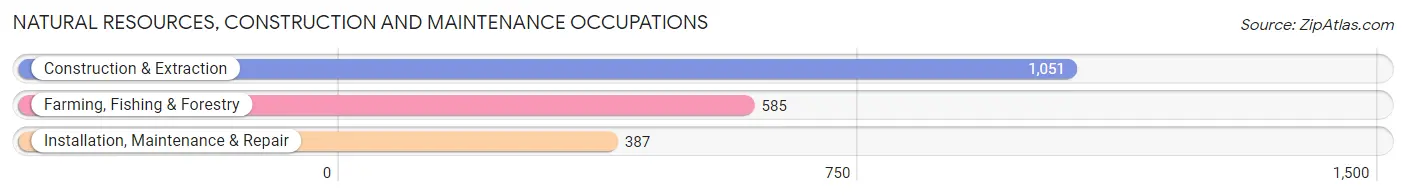
Natural Resources, Construction and Maintenance Occupations
The most common Natural Resources, Construction and Maintenance occupations in Hayesville are Construction & Extraction (1,051 | 10.8%), Farming, Fishing & Forestry (585 | 6.0%), and Installation, Maintenance & Repair (387 | 4.0%).
Natural Resources, Construction and Maintenance Occupations by Sex
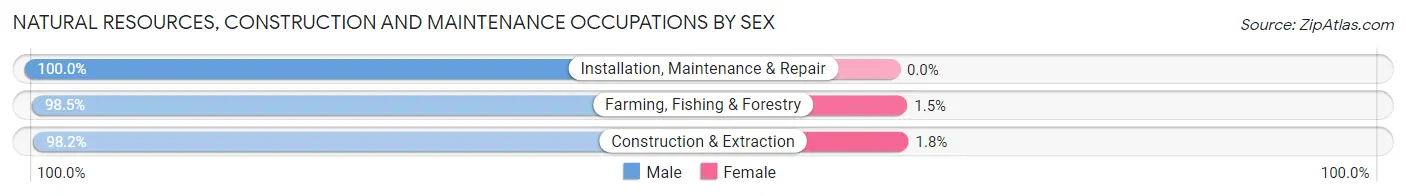
| Occupation | Male | Female |
| Farming, Fishing & Forestry | 576 (98.5%) | 9 (1.5%) |
| Construction & Extraction | 1,032 (98.2%) | 19 (1.8%) |
| Installation, Maintenance & Repair | 387 (100.0%) | 0 (0.0%) |
| Total (Category) | 1,995 (98.6%) | 28 (1.4%) |
| Total (Overall) | 5,523 (56.9%) | 4,177 (43.1%) |
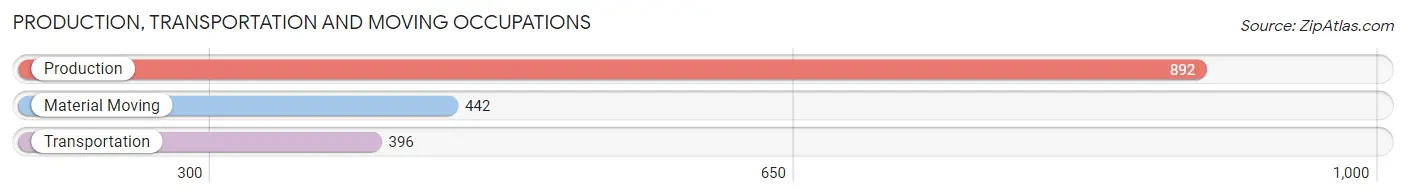
Production, Transportation and Moving Occupations
The most common Production, Transportation and Moving occupations in Hayesville are Production (892 | 9.2%), Material Moving (442 | 4.6%), and Transportation (396 | 4.1%).
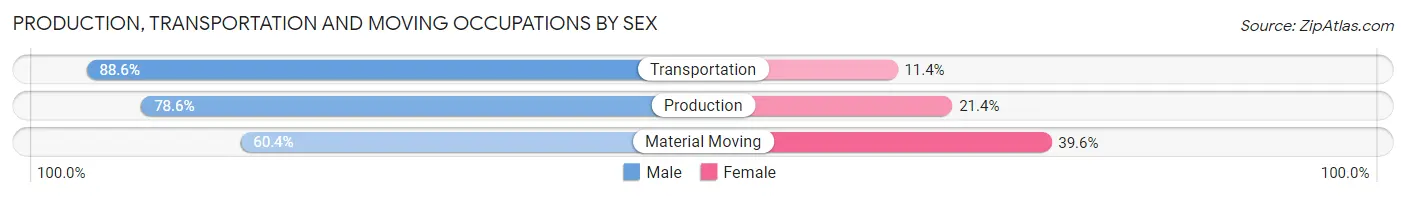
Production, Transportation and Moving Occupations by Sex
| Occupation | Male | Female |
| Production | 701 (78.6%) | 191 (21.4%) |
| Transportation | 351 (88.6%) | 45 (11.4%) |
| Material Moving | 267 (60.4%) | 175 (39.6%) |
| Total (Category) | 1,319 (76.2%) | 411 (23.8%) |
| Total (Overall) | 5,523 (56.9%) | 4,177 (43.1%) |
Employment Industries by Sex in Hayesville
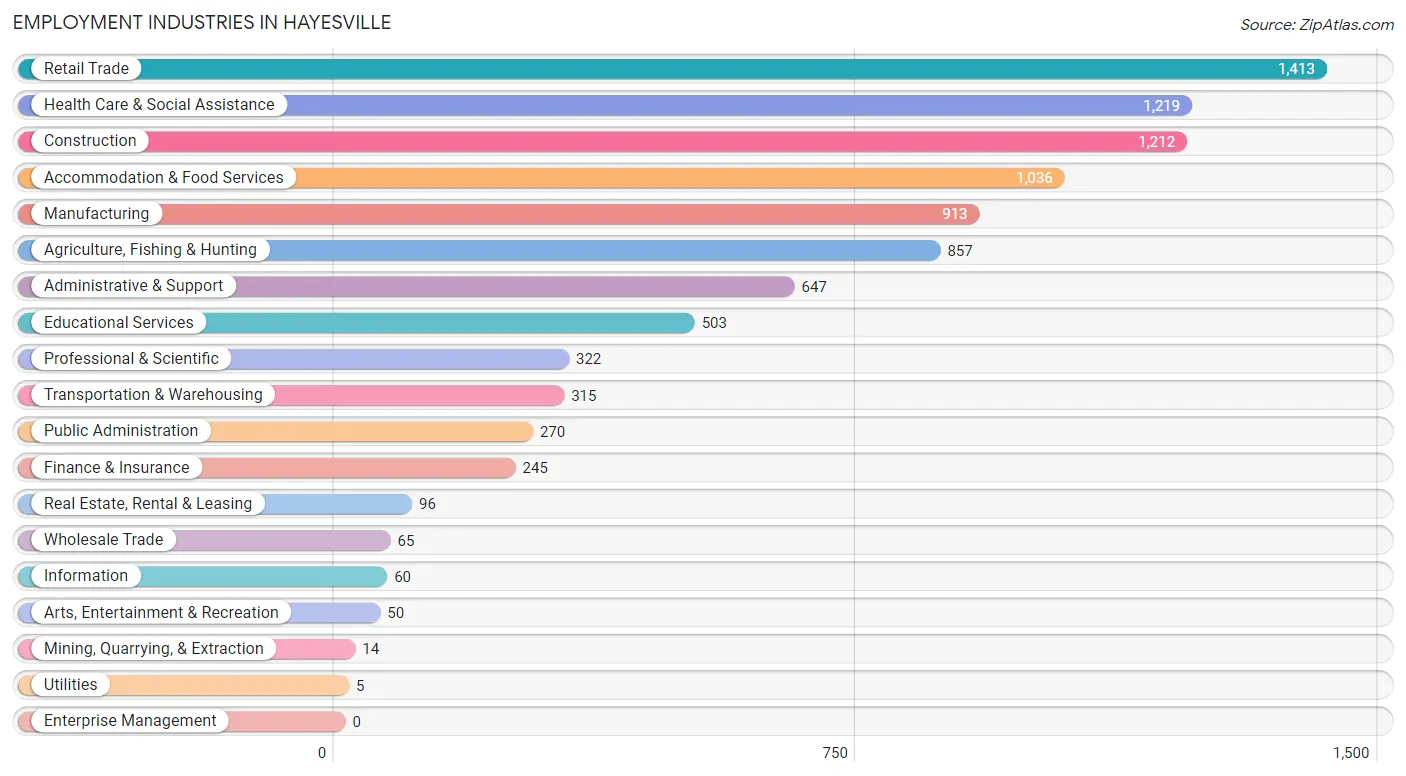
Employment Industries in Hayesville
The major employment industries in Hayesville include Retail Trade (1,413 | 14.6%), Health Care & Social Assistance (1,219 | 12.6%), Construction (1,212 | 12.5%), Accommodation & Food Services (1,036 | 10.7%), and Manufacturing (913 | 9.4%).
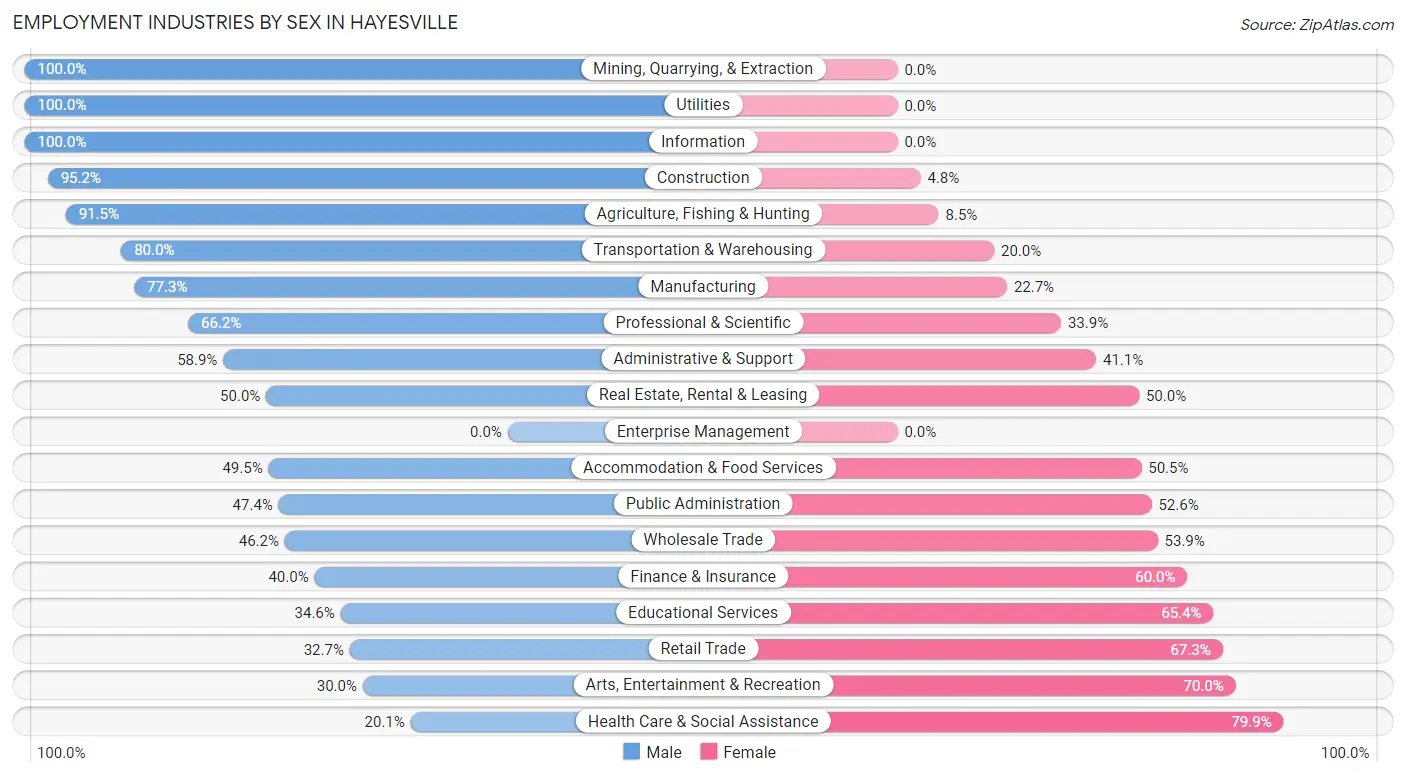
Employment Industries by Sex in Hayesville
The Hayesville industries that see more men than women are Mining, Quarrying, & Extraction (100.0%), Utilities (100.0%), and Information (100.0%), whereas the industries that tend to have a higher number of women are Health Care & Social Assistance (79.9%), Arts, Entertainment & Recreation (70.0%), and Retail Trade (67.3%).
| Industry | Male | Female |
| Agriculture, Fishing & Hunting | 784 (91.5%) | 73 (8.5%) |
| Mining, Quarrying, & Extraction | 14 (100.0%) | 0 (0.0%) |
| Construction | 1,154 (95.2%) | 58 (4.8%) |
| Manufacturing | 706 (77.3%) | 207 (22.7%) |
| Wholesale Trade | 30 (46.2%) | 35 (53.8%) |
| Retail Trade | 462 (32.7%) | 951 (67.3%) |
| Transportation & Warehousing | 252 (80.0%) | 63 (20.0%) |
| Utilities | 5 (100.0%) | 0 (0.0%) |
| Information | 60 (100.0%) | 0 (0.0%) |
| Finance & Insurance | 98 (40.0%) | 147 (60.0%) |
| Real Estate, Rental & Leasing | 48 (50.0%) | 48 (50.0%) |
| Professional & Scientific | 213 (66.1%) | 109 (33.9%) |
| Enterprise Management | 0 (0.0%) | 0 (0.0%) |
| Administrative & Support | 381 (58.9%) | 266 (41.1%) |
| Educational Services | 174 (34.6%) | 329 (65.4%) |
| Health Care & Social Assistance | 245 (20.1%) | 974 (79.9%) |
| Arts, Entertainment & Recreation | 15 (30.0%) | 35 (70.0%) |
| Accommodation & Food Services | 513 (49.5%) | 523 (50.5%) |
| Public Administration | 128 (47.4%) | 142 (52.6%) |
| Total | 5,523 (56.9%) | 4,177 (43.1%) |
Education in Hayesville
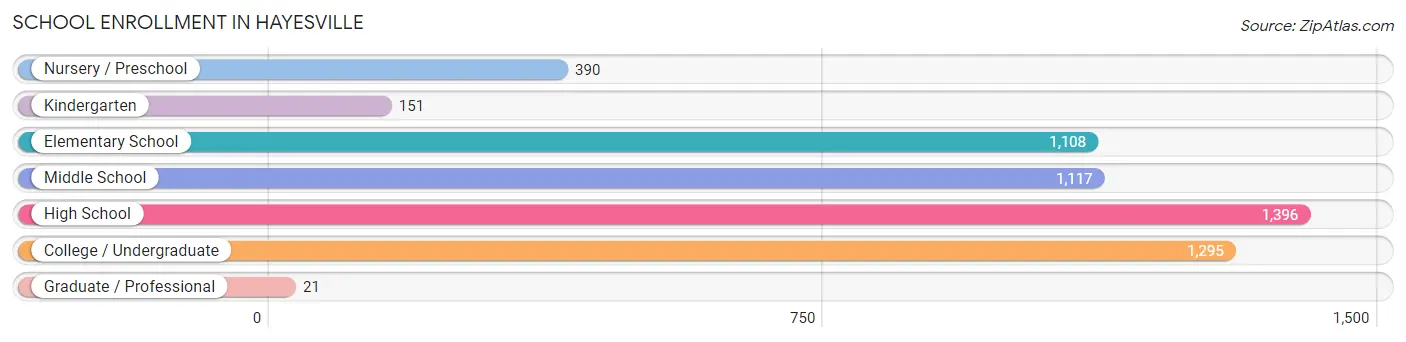
School Enrollment in Hayesville
The most common levels of schooling among the 5,478 students in Hayesville are high school (1,396 | 25.5%), college / undergraduate (1,295 | 23.6%), and middle school (1,117 | 20.4%).
| School Level | # Students | % Students |
| Nursery / Preschool | 390 | 7.1% |
| Kindergarten | 151 | 2.8% |
| Elementary School | 1,108 | 20.2% |
| Middle School | 1,117 | 20.4% |
| High School | 1,396 | 25.5% |
| College / Undergraduate | 1,295 | 23.6% |
| Graduate / Professional | 21 | 0.4% |
| Total | 5,478 | 100.0% |
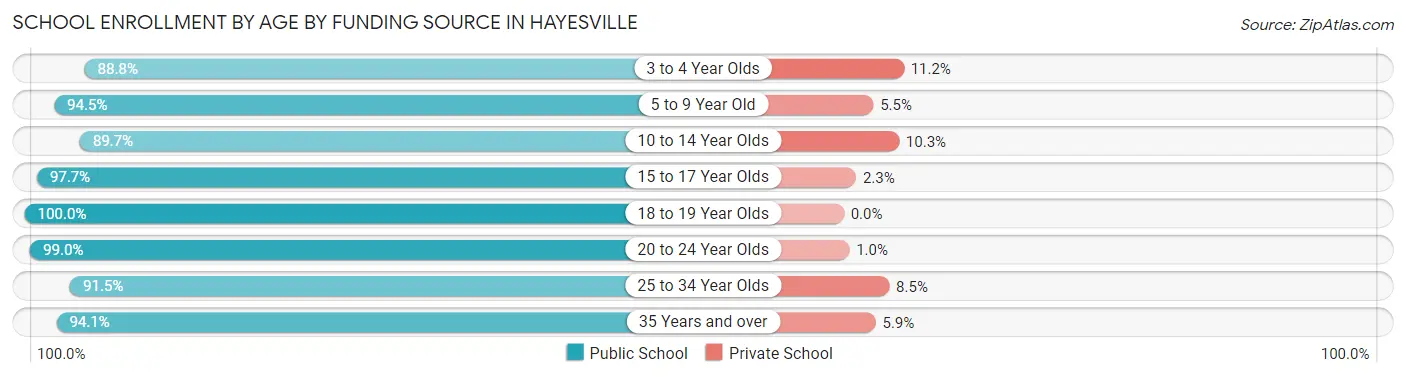
School Enrollment by Age by Funding Source in Hayesville
Out of a total of 5,478 students who are enrolled in schools in Hayesville, 334 (6.1%) attend a private institution, while the remaining 5,144 (93.9%) are enrolled in public schools. The age group of 3 to 4 year olds has the highest likelihood of being enrolled in private schools, with 34 (11.2% in the age bracket) enrolled. Conversely, the age group of 18 to 19 year olds has the lowest likelihood of being enrolled in a private school, with 156 (100.0% in the age bracket) attending a public institution.
| Age Bracket | Public School | Private School |
| 3 to 4 Year Olds | 270 (88.8%) | 34 (11.2%) |
| 5 to 9 Year Old | 1,031 (94.5%) | 60 (5.5%) |
| 10 to 14 Year Olds | 1,412 (89.7%) | 162 (10.3%) |
| 15 to 17 Year Olds | 1,067 (97.7%) | 25 (2.3%) |
| 18 to 19 Year Olds | 156 (100.0%) | 0 (0.0%) |
| 20 to 24 Year Olds | 573 (99.0%) | 6 (1.0%) |
| 25 to 34 Year Olds | 162 (91.5%) | 15 (8.5%) |
| 35 Years and over | 475 (94.1%) | 30 (5.9%) |
| Total | 5,144 (93.9%) | 334 (6.1%) |
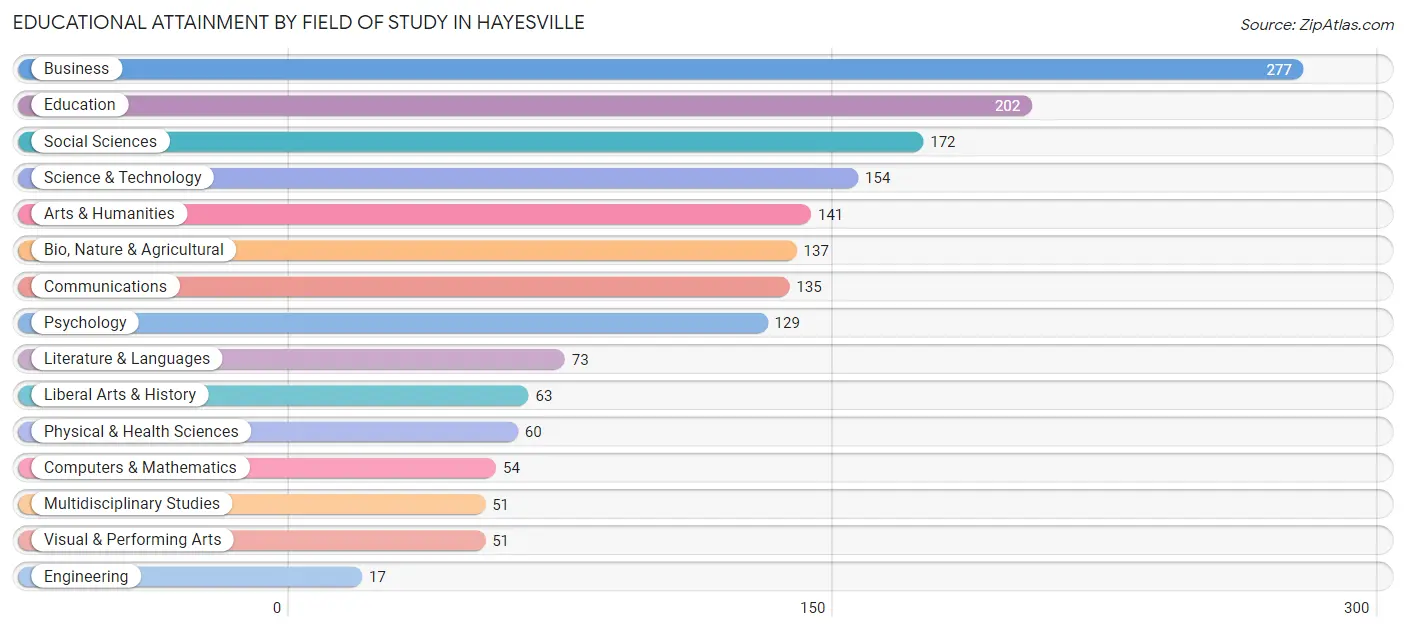
Educational Attainment by Field of Study in Hayesville
Business (277 | 16.1%), education (202 | 11.8%), social sciences (172 | 10.0%), science & technology (154 | 9.0%), and arts & humanities (141 | 8.2%) are the most common fields of study among 1,716 individuals in Hayesville who have obtained a bachelor's degree or higher.
| Field of Study | # Graduates | % Graduates |
| Computers & Mathematics | 54 | 3.2% |
| Bio, Nature & Agricultural | 137 | 8.0% |
| Physical & Health Sciences | 60 | 3.5% |
| Psychology | 129 | 7.5% |
| Social Sciences | 172 | 10.0% |
| Engineering | 17 | 1.0% |
| Multidisciplinary Studies | 51 | 3.0% |
| Science & Technology | 154 | 9.0% |
| Business | 277 | 16.1% |
| Education | 202 | 11.8% |
| Literature & Languages | 73 | 4.3% |
| Liberal Arts & History | 63 | 3.7% |
| Visual & Performing Arts | 51 | 3.0% |
| Communications | 135 | 7.9% |
| Arts & Humanities | 141 | 8.2% |
| Total | 1,716 | 100.0% |
Transportation & Commute in Hayesville
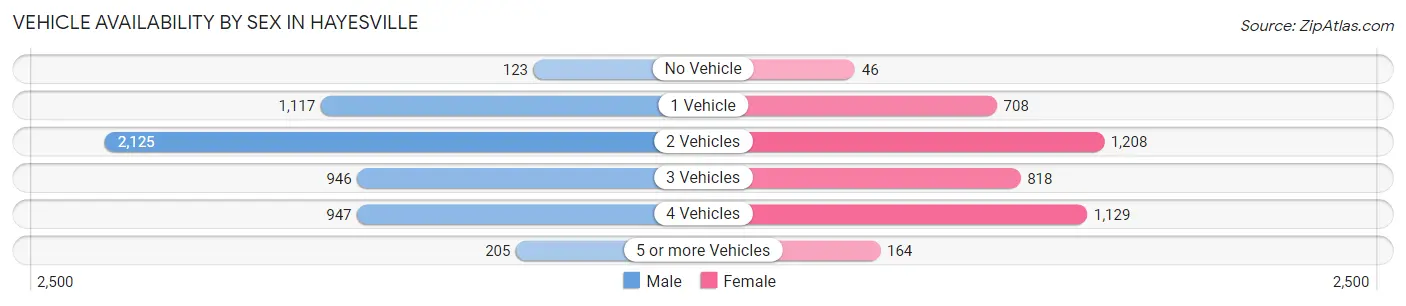
Vehicle Availability by Sex in Hayesville
The most prevalent vehicle ownership categories in Hayesville are males with 2 vehicles (2,125, accounting for 38.9%) and females with 2 vehicles (1,208, making up 52.2%).
| Vehicles Available | Male | Female |
| No Vehicle | 123 (2.2%) | 46 (1.1%) |
| 1 Vehicle | 1,117 (20.4%) | 708 (17.4%) |
| 2 Vehicles | 2,125 (38.9%) | 1,208 (29.7%) |
| 3 Vehicles | 946 (17.3%) | 818 (20.1%) |
| 4 Vehicles | 947 (17.3%) | 1,129 (27.7%) |
| 5 or more Vehicles | 205 (3.7%) | 164 (4.0%) |
| Total | 5,463 (100.0%) | 4,073 (100.0%) |
Commute Time in Hayesville
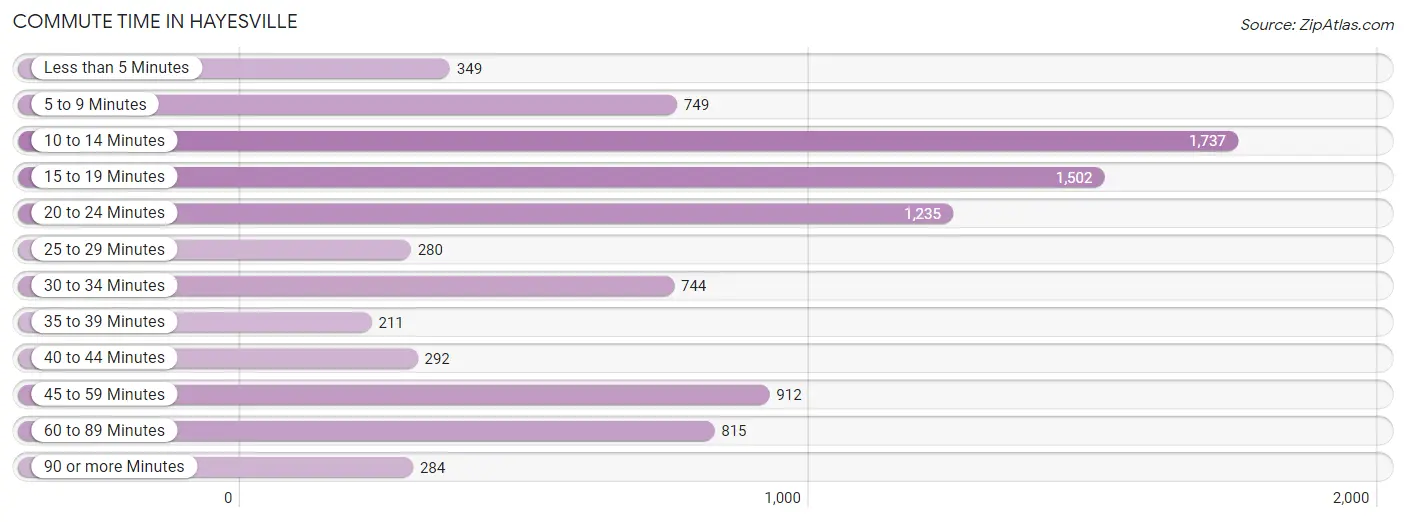
The most frequently occuring commute durations in Hayesville are 10 to 14 minutes (1,737 commuters, 19.1%), 15 to 19 minutes (1,502 commuters, 16.5%), and 20 to 24 minutes (1,235 commuters, 13.6%).
| Commute Time | # Commuters | % Commuters |
| Less than 5 Minutes | 349 | 3.8% |
| 5 to 9 Minutes | 749 | 8.2% |
| 10 to 14 Minutes | 1,737 | 19.1% |
| 15 to 19 Minutes | 1,502 | 16.5% |
| 20 to 24 Minutes | 1,235 | 13.6% |
| 25 to 29 Minutes | 280 | 3.1% |
| 30 to 34 Minutes | 744 | 8.2% |
| 35 to 39 Minutes | 211 | 2.3% |
| 40 to 44 Minutes | 292 | 3.2% |
| 45 to 59 Minutes | 912 | 10.0% |
| 60 to 89 Minutes | 815 | 8.9% |
| 90 or more Minutes | 284 | 3.1% |
Commute Time by Sex in Hayesville
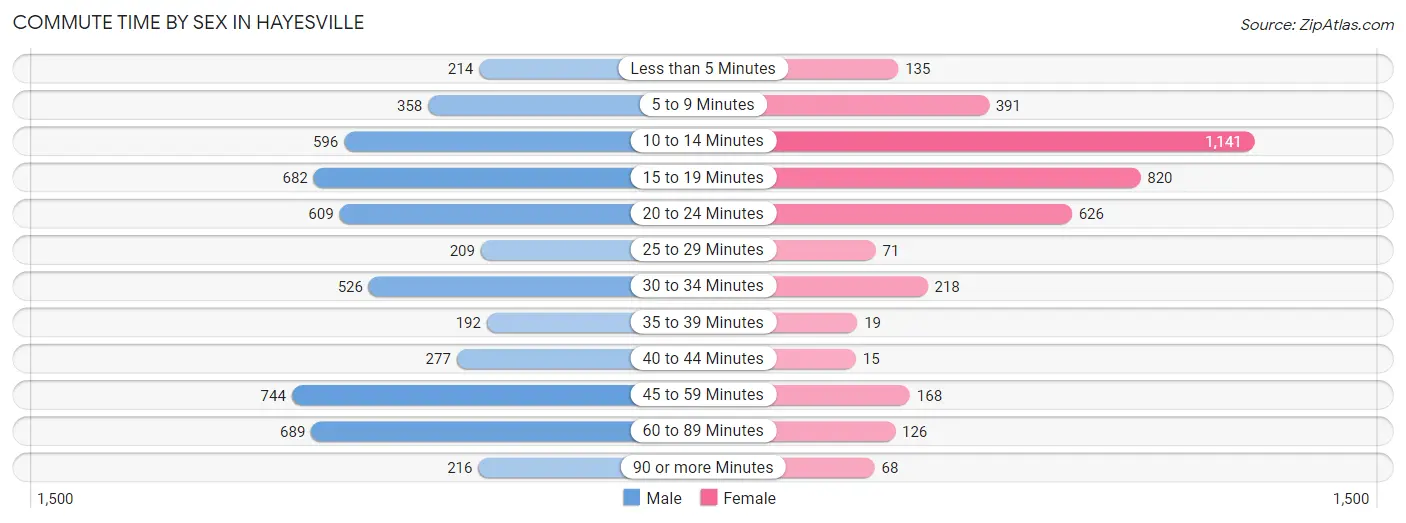
The most common commute times in Hayesville are 45 to 59 minutes (744 commuters, 14.0%) for males and 10 to 14 minutes (1,141 commuters, 30.0%) for females.
| Commute Time | Male | Female |
| Less than 5 Minutes | 214 (4.0%) | 135 (3.5%) |
| 5 to 9 Minutes | 358 (6.7%) | 391 (10.3%) |
| 10 to 14 Minutes | 596 (11.2%) | 1,141 (30.0%) |
| 15 to 19 Minutes | 682 (12.8%) | 820 (21.6%) |
| 20 to 24 Minutes | 609 (11.5%) | 626 (16.5%) |
| 25 to 29 Minutes | 209 (3.9%) | 71 (1.9%) |
| 30 to 34 Minutes | 526 (9.9%) | 218 (5.7%) |
| 35 to 39 Minutes | 192 (3.6%) | 19 (0.5%) |
| 40 to 44 Minutes | 277 (5.2%) | 15 (0.4%) |
| 45 to 59 Minutes | 744 (14.0%) | 168 (4.4%) |
| 60 to 89 Minutes | 689 (13.0%) | 126 (3.3%) |
| 90 or more Minutes | 216 (4.1%) | 68 (1.8%) |
Time of Departure to Work by Sex in Hayesville
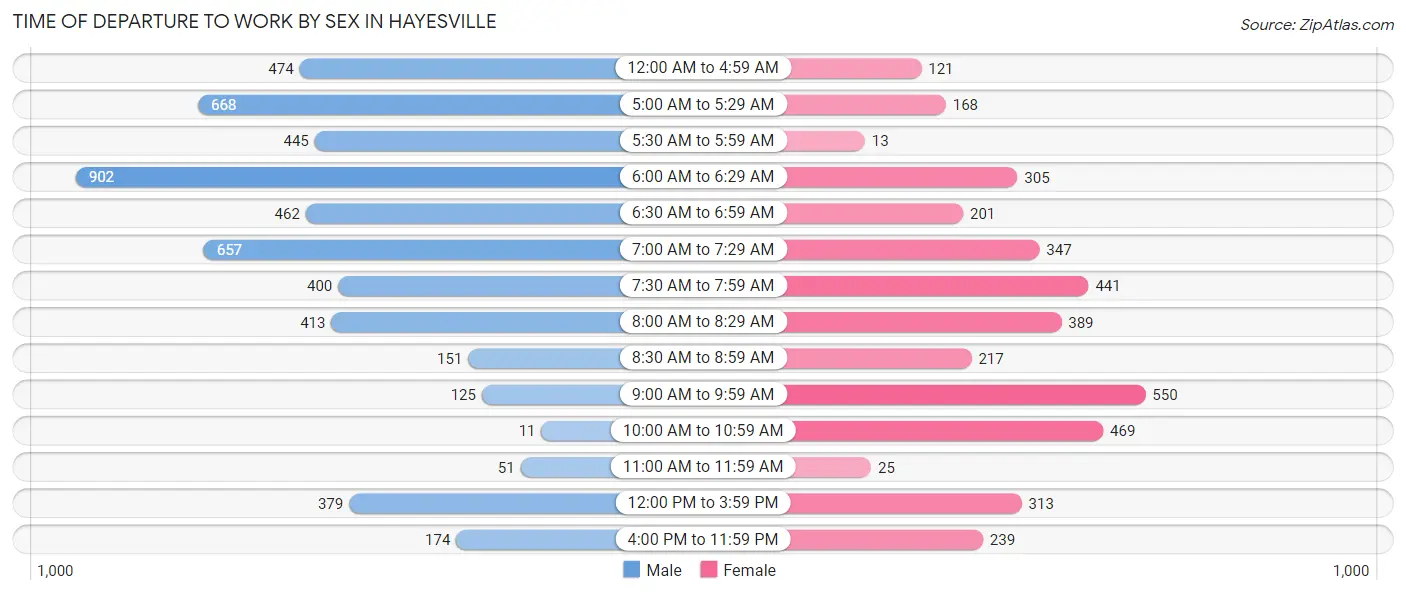
The most frequent times of departure to work in Hayesville are 6:00 AM to 6:29 AM (902, 17.0%) for males and 9:00 AM to 9:59 AM (550, 14.5%) for females.
| Time of Departure | Male | Female |
| 12:00 AM to 4:59 AM | 474 (8.9%) | 121 (3.2%) |
| 5:00 AM to 5:29 AM | 668 (12.6%) | 168 (4.4%) |
| 5:30 AM to 5:59 AM | 445 (8.4%) | 13 (0.3%) |
| 6:00 AM to 6:29 AM | 902 (17.0%) | 305 (8.0%) |
| 6:30 AM to 6:59 AM | 462 (8.7%) | 201 (5.3%) |
| 7:00 AM to 7:29 AM | 657 (12.4%) | 347 (9.1%) |
| 7:30 AM to 7:59 AM | 400 (7.5%) | 441 (11.6%) |
| 8:00 AM to 8:29 AM | 413 (7.8%) | 389 (10.2%) |
| 8:30 AM to 8:59 AM | 151 (2.8%) | 217 (5.7%) |
| 9:00 AM to 9:59 AM | 125 (2.4%) | 550 (14.5%) |
| 10:00 AM to 10:59 AM | 11 (0.2%) | 469 (12.3%) |
| 11:00 AM to 11:59 AM | 51 (1.0%) | 25 (0.7%) |
| 12:00 PM to 3:59 PM | 379 (7.1%) | 313 (8.2%) |
| 4:00 PM to 11:59 PM | 174 (3.3%) | 239 (6.3%) |
| Total | 5,312 (100.0%) | 3,798 (100.0%) |
Housing Occupancy in Hayesville
Occupancy by Ownership in Hayesville
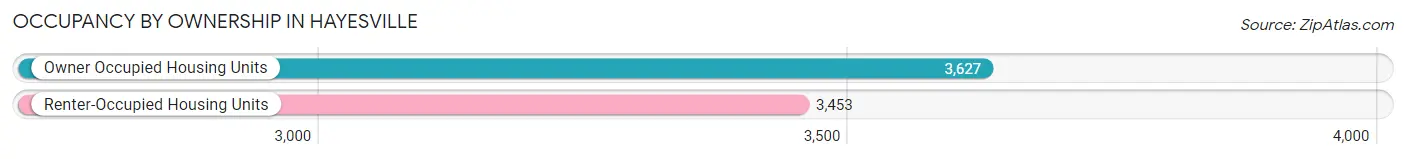
Of the total 7,080 dwellings in Hayesville, owner-occupied units account for 3,627 (51.2%), while renter-occupied units make up 3,453 (48.8%).
| Occupancy | # Housing Units | % Housing Units |
| Owner Occupied Housing Units | 3,627 | 51.2% |
| Renter-Occupied Housing Units | 3,453 | 48.8% |
| Total Occupied Housing Units | 7,080 | 100.0% |
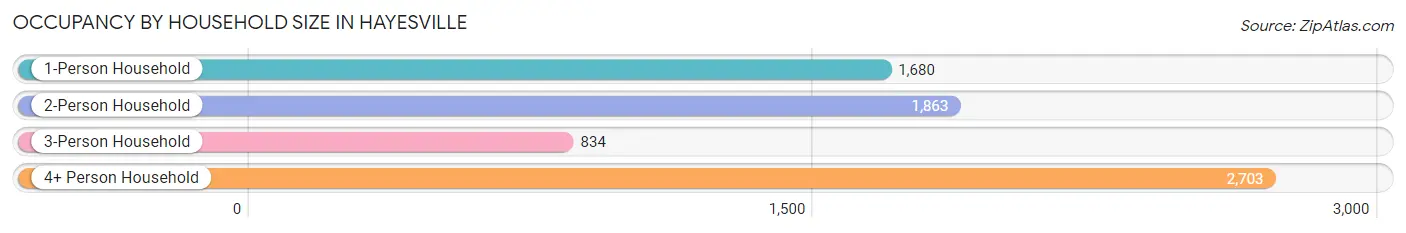
Occupancy by Household Size in Hayesville
| Household Size | # Housing Units | % Housing Units |
| 1-Person Household | 1,680 | 23.7% |
| 2-Person Household | 1,863 | 26.3% |
| 3-Person Household | 834 | 11.8% |
| 4+ Person Household | 2,703 | 38.2% |
| Total Housing Units | 7,080 | 100.0% |
Occupancy by Ownership by Household Size in Hayesville
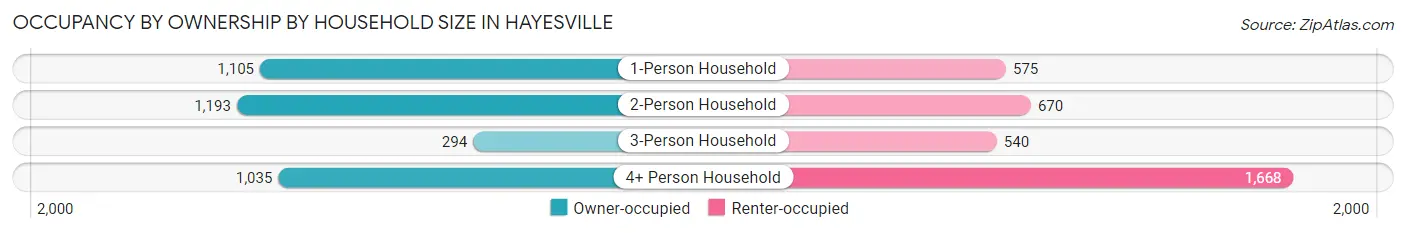
| Household Size | Owner-occupied | Renter-occupied |
| 1-Person Household | 1,105 (65.8%) | 575 (34.2%) |
| 2-Person Household | 1,193 (64.0%) | 670 (36.0%) |
| 3-Person Household | 294 (35.2%) | 540 (64.7%) |
| 4+ Person Household | 1,035 (38.3%) | 1,668 (61.7%) |
| Total Housing Units | 3,627 (51.2%) | 3,453 (48.8%) |
Occupancy by Educational Attainment in Hayesville
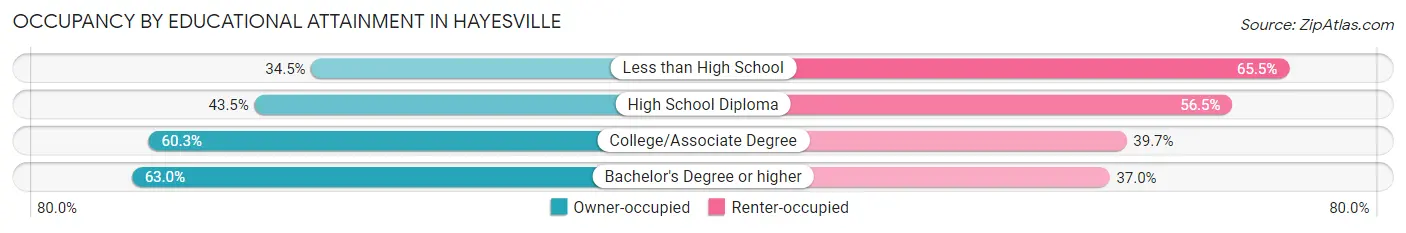
| Household Size | Owner-occupied | Renter-occupied |
| Less than High School | 458 (34.5%) | 869 (65.5%) |
| High School Diploma | 856 (43.5%) | 1,111 (56.5%) |
| College/Associate Degree | 1,625 (60.3%) | 1,069 (39.7%) |
| Bachelor's Degree or higher | 688 (63.0%) | 404 (37.0%) |
Occupancy by Age of Householder in Hayesville
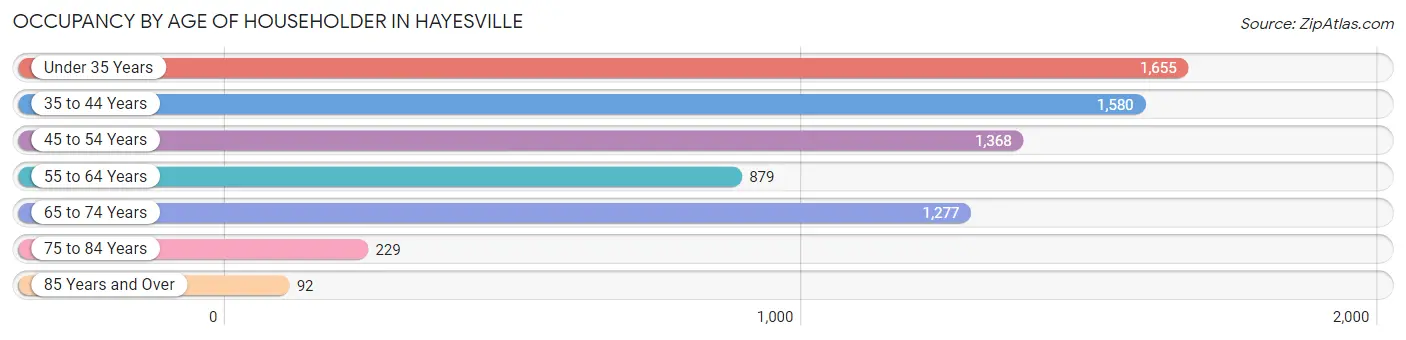
| Age Bracket | # Households | % Households |
| Under 35 Years | 1,655 | 23.4% |
| 35 to 44 Years | 1,580 | 22.3% |
| 45 to 54 Years | 1,368 | 19.3% |
| 55 to 64 Years | 879 | 12.4% |
| 65 to 74 Years | 1,277 | 18.0% |
| 75 to 84 Years | 229 | 3.2% |
| 85 Years and Over | 92 | 1.3% |
| Total | 7,080 | 100.0% |
Housing Finances in Hayesville
Median Income by Occupancy in Hayesville
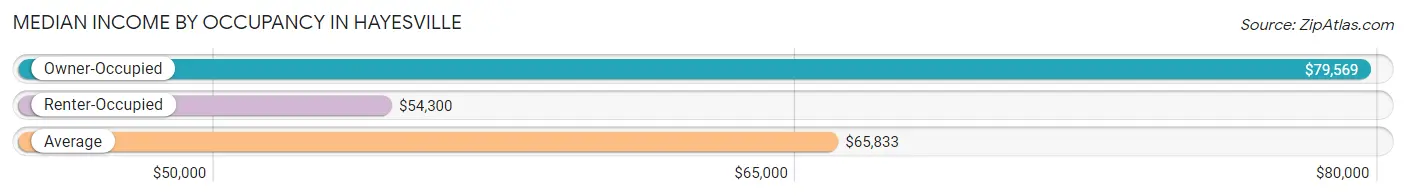
| Occupancy Type | # Households | Median Income |
| Owner-Occupied | 3,627 (51.2%) | $79,569 |
| Renter-Occupied | 3,453 (48.8%) | $54,300 |
| Average | 7,080 (100.0%) | $65,833 |
Occupancy by Householder Income Bracket in Hayesville
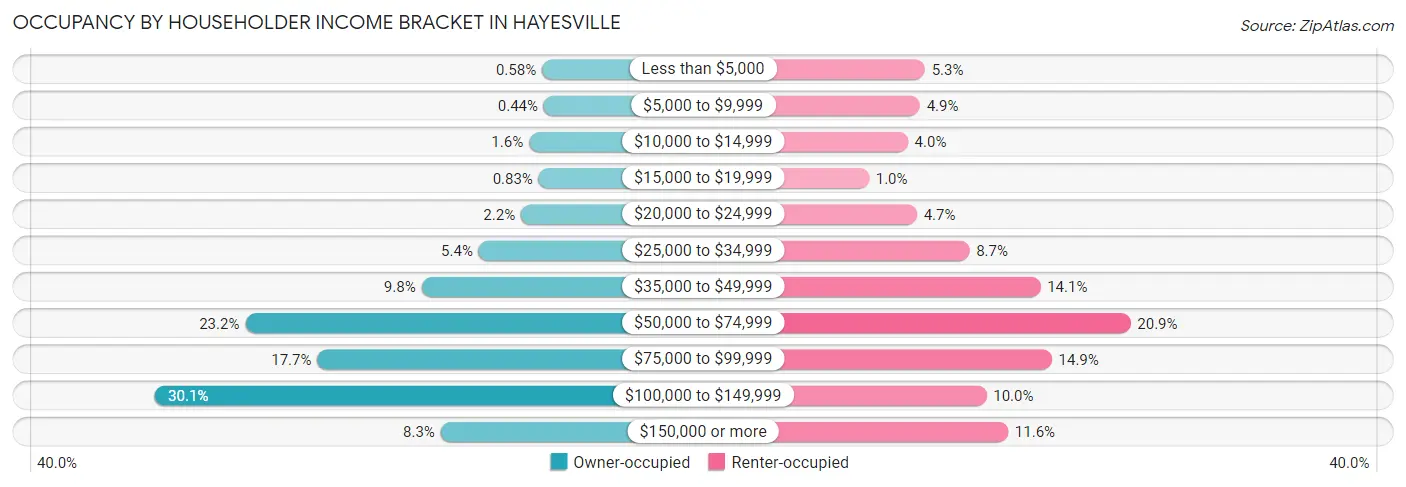
| Income Bracket | Owner-occupied | Renter-occupied |
| Less than $5,000 | 21 (0.6%) | 182 (5.3%) |
| $5,000 to $9,999 | 16 (0.4%) | 169 (4.9%) |
| $10,000 to $14,999 | 57 (1.6%) | 137 (4.0%) |
| $15,000 to $19,999 | 30 (0.8%) | 35 (1.0%) |
| $20,000 to $24,999 | 79 (2.2%) | 161 (4.7%) |
| $25,000 to $34,999 | 196 (5.4%) | 299 (8.7%) |
| $35,000 to $49,999 | 354 (9.8%) | 486 (14.1%) |
| $50,000 to $74,999 | 841 (23.2%) | 723 (20.9%) |
| $75,000 to $99,999 | 642 (17.7%) | 516 (14.9%) |
| $100,000 to $149,999 | 1,090 (30.0%) | 344 (10.0%) |
| $150,000 or more | 301 (8.3%) | 401 (11.6%) |
| Total | 3,627 (100.0%) | 3,453 (100.0%) |
Monthly Housing Cost Tiers in Hayesville
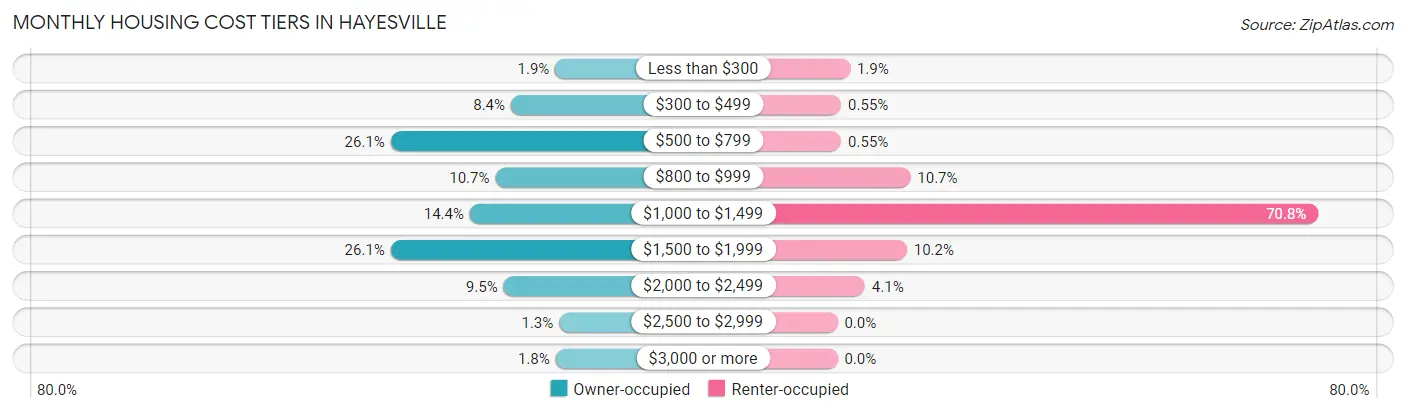
| Monthly Cost | Owner-occupied | Renter-occupied |
| Less than $300 | 67 (1.8%) | 64 (1.8%) |
| $300 to $499 | 304 (8.4%) | 19 (0.5%) |
| $500 to $799 | 946 (26.1%) | 19 (0.5%) |
| $800 to $999 | 387 (10.7%) | 371 (10.7%) |
| $1,000 to $1,499 | 523 (14.4%) | 2,445 (70.8%) |
| $1,500 to $1,999 | 946 (26.1%) | 353 (10.2%) |
| $2,000 to $2,499 | 343 (9.5%) | 140 (4.1%) |
| $2,500 to $2,999 | 46 (1.3%) | 0 (0.0%) |
| $3,000 or more | 65 (1.8%) | 0 (0.0%) |
| Total | 3,627 (100.0%) | 3,453 (100.0%) |
Physical Housing Characteristics in Hayesville
Housing Structures in Hayesville
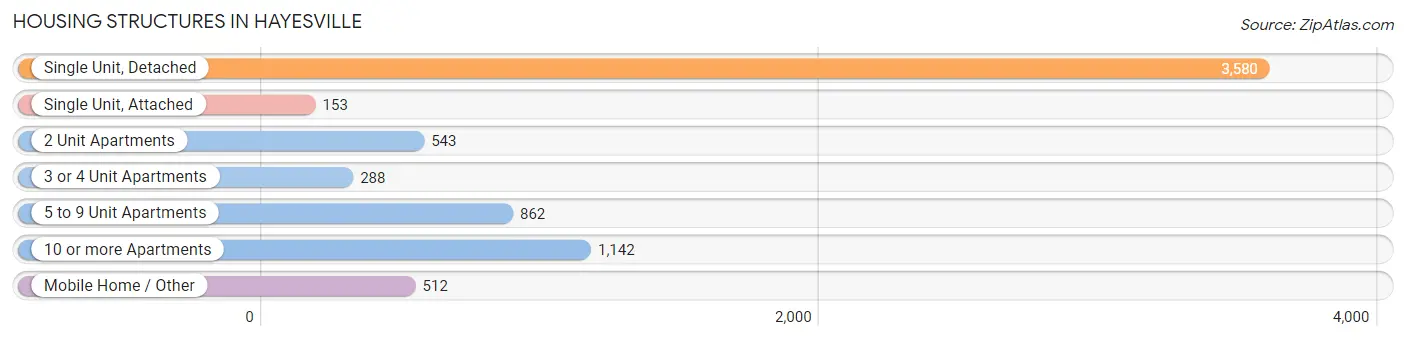
| Structure Type | # Housing Units | % Housing Units |
| Single Unit, Detached | 3,580 | 50.6% |
| Single Unit, Attached | 153 | 2.2% |
| 2 Unit Apartments | 543 | 7.7% |
| 3 or 4 Unit Apartments | 288 | 4.1% |
| 5 to 9 Unit Apartments | 862 | 12.2% |
| 10 or more Apartments | 1,142 | 16.1% |
| Mobile Home / Other | 512 | 7.2% |
| Total | 7,080 | 100.0% |
Housing Structures by Occupancy in Hayesville
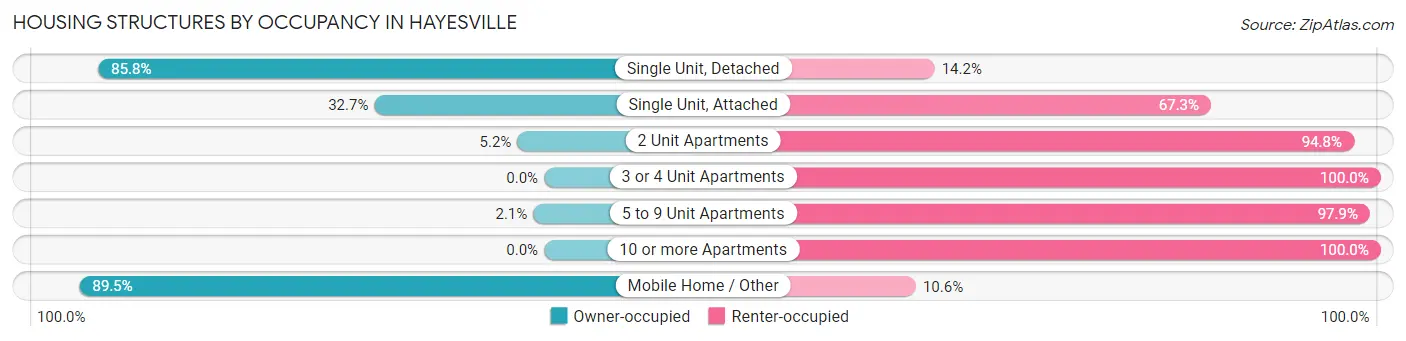
| Structure Type | Owner-occupied | Renter-occupied |
| Single Unit, Detached | 3,073 (85.8%) | 507 (14.2%) |
| Single Unit, Attached | 50 (32.7%) | 103 (67.3%) |
| 2 Unit Apartments | 28 (5.2%) | 515 (94.8%) |
| 3 or 4 Unit Apartments | 0 (0.0%) | 288 (100.0%) |
| 5 to 9 Unit Apartments | 18 (2.1%) | 844 (97.9%) |
| 10 or more Apartments | 0 (0.0%) | 1,142 (100.0%) |
| Mobile Home / Other | 458 (89.4%) | 54 (10.5%) |
| Total | 3,627 (51.2%) | 3,453 (48.8%) |
Housing Structures by Number of Rooms in Hayesville
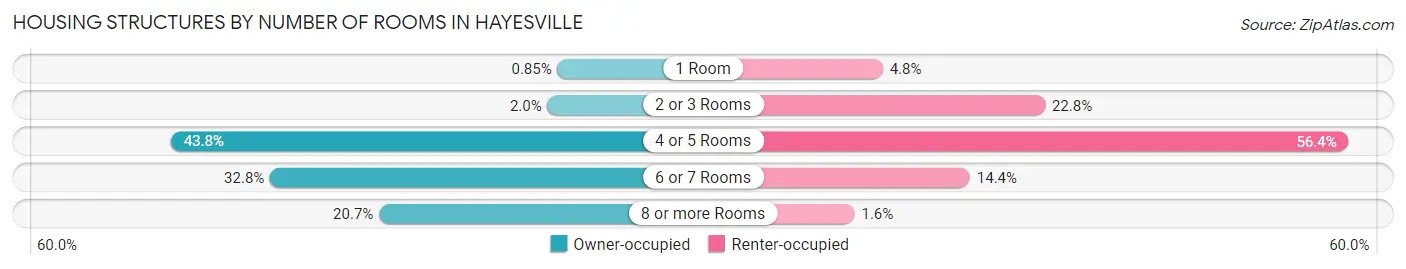
| Number of Rooms | Owner-occupied | Renter-occupied |
| 1 Room | 31 (0.9%) | 164 (4.8%) |
| 2 or 3 Rooms | 71 (2.0%) | 786 (22.8%) |
| 4 or 5 Rooms | 1,588 (43.8%) | 1,949 (56.4%) |
| 6 or 7 Rooms | 1,188 (32.8%) | 498 (14.4%) |
| 8 or more Rooms | 749 (20.6%) | 56 (1.6%) |
| Total | 3,627 (100.0%) | 3,453 (100.0%) |
Housing Structure by Heating Type in Hayesville
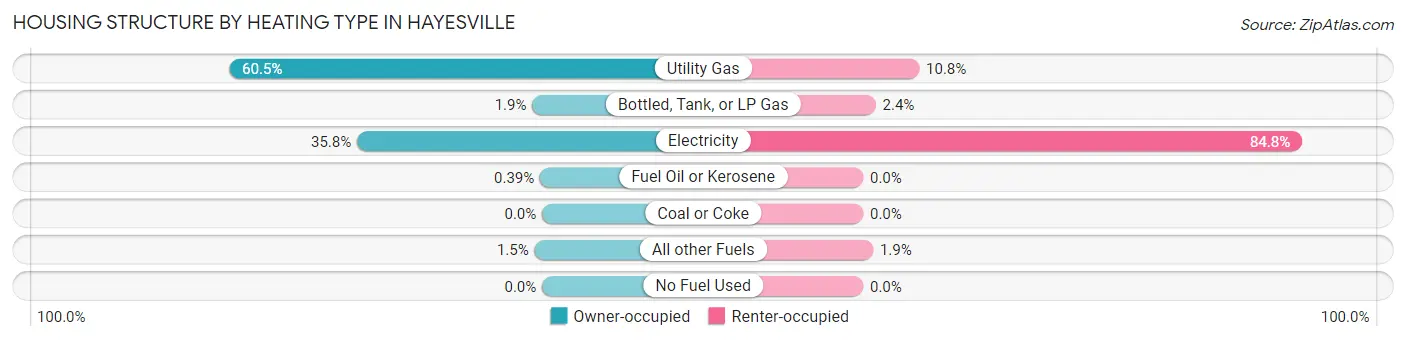
| Heating Type | Owner-occupied | Renter-occupied |
| Utility Gas | 2,194 (60.5%) | 374 (10.8%) |
| Bottled, Tank, or LP Gas | 69 (1.9%) | 84 (2.4%) |
| Electricity | 1,297 (35.8%) | 2,929 (84.8%) |
| Fuel Oil or Kerosene | 14 (0.4%) | 0 (0.0%) |
| Coal or Coke | 0 (0.0%) | 0 (0.0%) |
| All other Fuels | 53 (1.5%) | 66 (1.9%) |
| No Fuel Used | 0 (0.0%) | 0 (0.0%) |
| Total | 3,627 (100.0%) | 3,453 (100.0%) |
Household Vehicle Usage in Hayesville
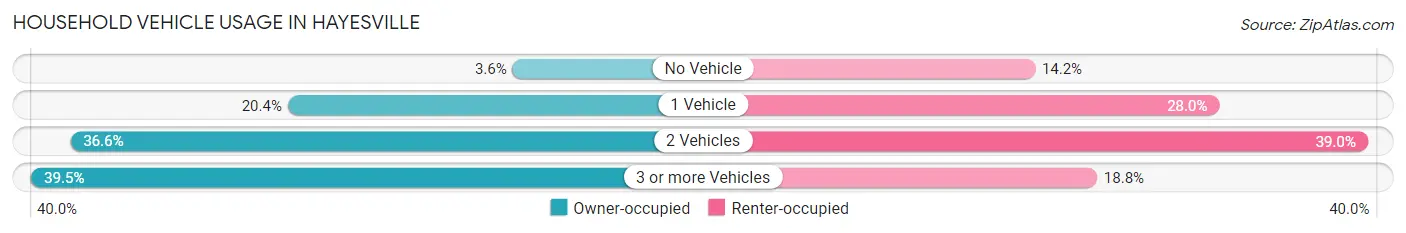
| Vehicles per Household | Owner-occupied | Renter-occupied |
| No Vehicle | 129 (3.6%) | 490 (14.2%) |
| 1 Vehicle | 738 (20.3%) | 965 (28.0%) |
| 2 Vehicles | 1,327 (36.6%) | 1,348 (39.0%) |
| 3 or more Vehicles | 1,433 (39.5%) | 650 (18.8%) |
| Total | 3,627 (100.0%) | 3,453 (100.0%) |
Real Estate & Mortgages in Hayesville
Real Estate and Mortgage Overview in Hayesville
| Characteristic | Without Mortgage | With Mortgage |
| Housing Units | 1,439 | 2,188 |
| Median Property Value | $302,500 | $310,000 |
| Median Household Income | $79,116 | $224 |
| Monthly Housing Costs | $574 | $65 |
| Real Estate Taxes | $3,050 | $121 |
Property Value by Mortgage Status in Hayesville
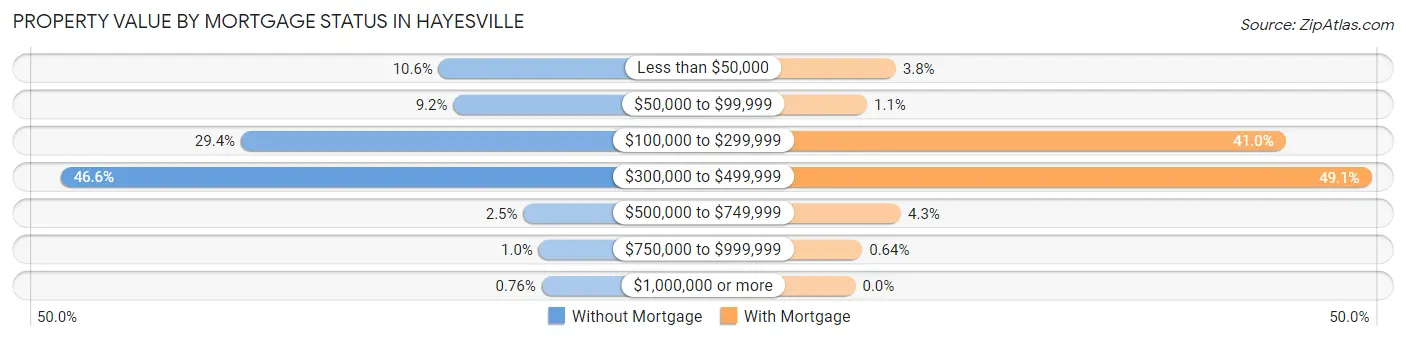
| Property Value | Without Mortgage | With Mortgage |
| Less than $50,000 | 152 (10.6%) | 84 (3.8%) |
| $50,000 to $99,999 | 132 (9.2%) | 24 (1.1%) |
| $100,000 to $299,999 | 423 (29.4%) | 896 (40.9%) |
| $300,000 to $499,999 | 670 (46.6%) | 1,075 (49.1%) |
| $500,000 to $749,999 | 36 (2.5%) | 95 (4.3%) |
| $750,000 to $999,999 | 15 (1.0%) | 14 (0.6%) |
| $1,000,000 or more | 11 (0.8%) | 0 (0.0%) |
| Total | 1,439 (100.0%) | 2,188 (100.0%) |
Household Income by Mortgage Status in Hayesville
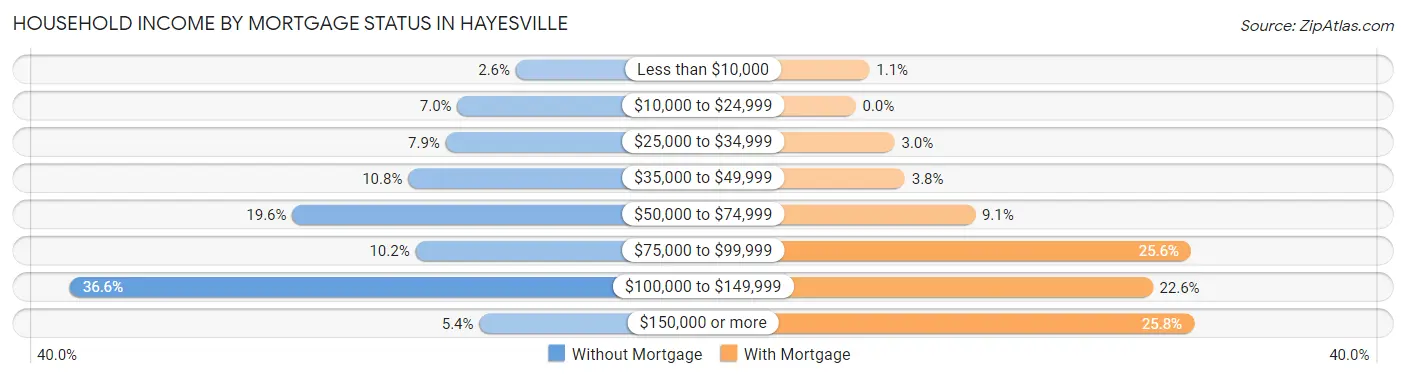
| Household Income | Without Mortgage | With Mortgage |
| Less than $10,000 | 37 (2.6%) | 23 (1.1%) |
| $10,000 to $24,999 | 101 (7.0%) | 0 (0.0%) |
| $25,000 to $34,999 | 114 (7.9%) | 65 (3.0%) |
| $35,000 to $49,999 | 155 (10.8%) | 82 (3.7%) |
| $50,000 to $74,999 | 282 (19.6%) | 199 (9.1%) |
| $75,000 to $99,999 | 147 (10.2%) | 559 (25.6%) |
| $100,000 to $149,999 | 526 (36.5%) | 495 (22.6%) |
| $150,000 or more | 77 (5.3%) | 564 (25.8%) |
| Total | 1,439 (100.0%) | 2,188 (100.0%) |
Property Value to Household Income Ratio in Hayesville
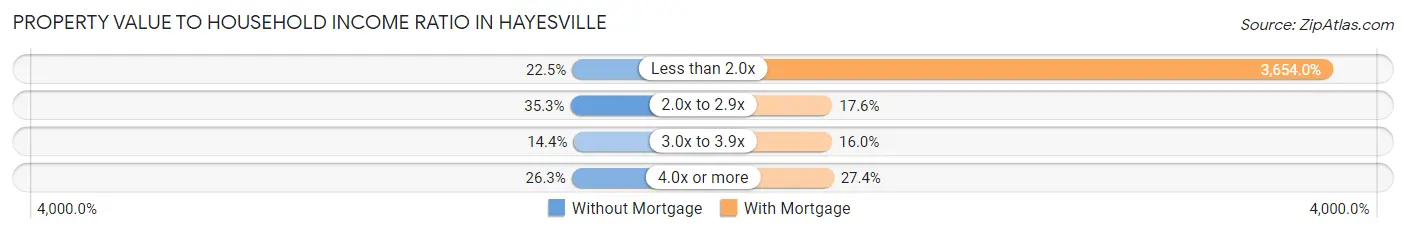
| Value-to-Income Ratio | Without Mortgage | With Mortgage |
| Less than 2.0x | 324 (22.5%) | 79,949 (3,654.0%) |
| 2.0x to 2.9x | 508 (35.3%) | 385 (17.6%) |
| 3.0x to 3.9x | 207 (14.4%) | 350 (16.0%) |
| 4.0x or more | 379 (26.3%) | 600 (27.4%) |
| Total | 1,439 (100.0%) | 2,188 (100.0%) |
Real Estate Taxes by Mortgage Status in Hayesville
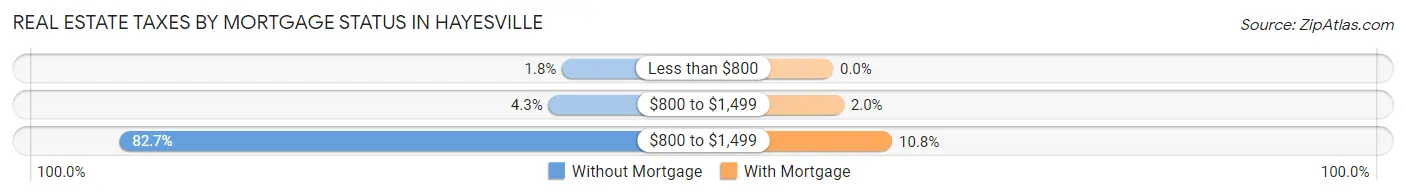
| Property Taxes | Without Mortgage | With Mortgage |
| Less than $800 | 26 (1.8%) | 0 (0.0%) |
| $800 to $1,499 | 62 (4.3%) | 43 (2.0%) |
| $800 to $1,499 | 1,190 (82.7%) | 236 (10.8%) |
| Total | 1,439 (100.0%) | 2,188 (100.0%) |
Health & Disability in Hayesville
Health Insurance Coverage by Age in Hayesville
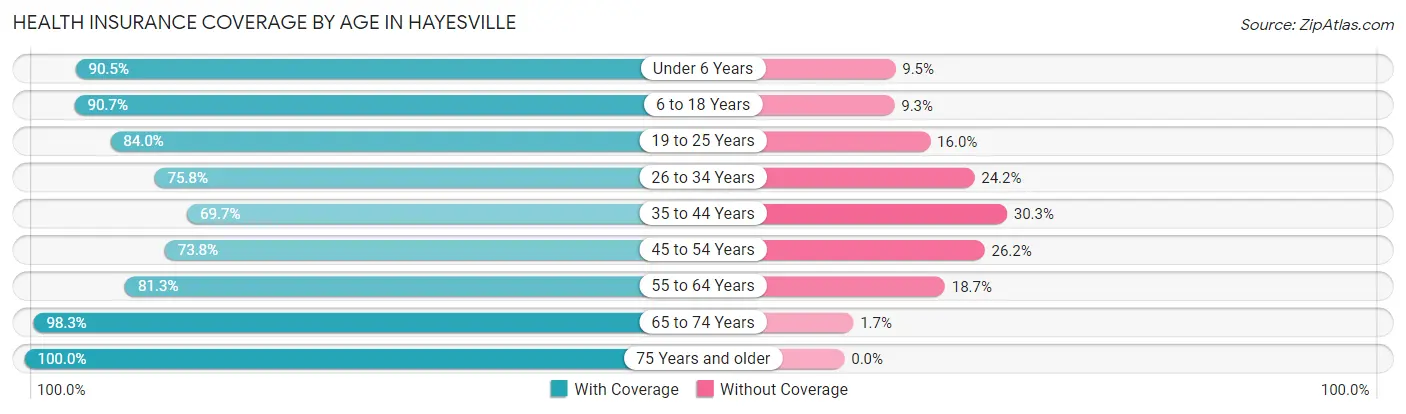
| Age Bracket | With Coverage | Without Coverage |
| Under 6 Years | 1,713 (90.5%) | 180 (9.5%) |
| 6 to 18 Years | 3,670 (90.7%) | 377 (9.3%) |
| 19 to 25 Years | 2,613 (84.0%) | 498 (16.0%) |
| 26 to 34 Years | 2,454 (75.8%) | 785 (24.2%) |
| 35 to 44 Years | 1,794 (69.7%) | 780 (30.3%) |
| 45 to 54 Years | 1,798 (73.8%) | 637 (26.2%) |
| 55 to 64 Years | 1,418 (81.3%) | 327 (18.7%) |
| 65 to 74 Years | 1,898 (98.3%) | 32 (1.7%) |
| 75 Years and older | 833 (100.0%) | 0 (0.0%) |
| Total | 18,191 (83.4%) | 3,616 (16.6%) |
Health Insurance Coverage by Citizenship Status in Hayesville
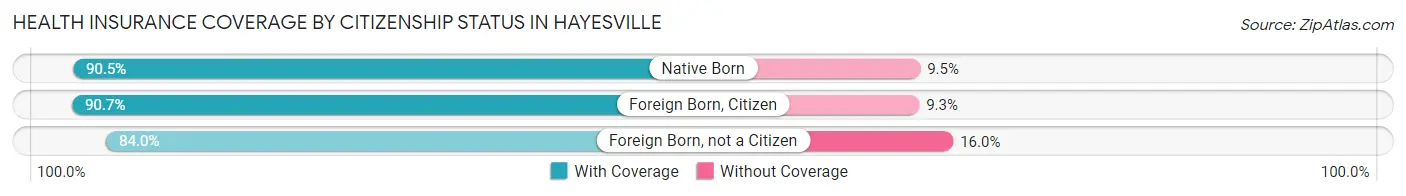
| Citizenship Status | With Coverage | Without Coverage |
| Native Born | 1,713 (90.5%) | 180 (9.5%) |
| Foreign Born, Citizen | 3,670 (90.7%) | 377 (9.3%) |
| Foreign Born, not a Citizen | 2,613 (84.0%) | 498 (16.0%) |
Health Insurance Coverage by Household Income in Hayesville
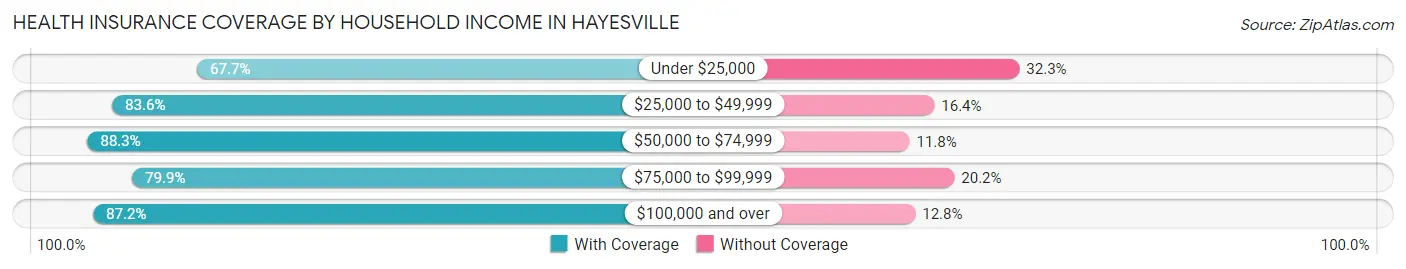
| Household Income | With Coverage | Without Coverage |
| Under $25,000 | 1,538 (67.7%) | 735 (32.3%) |
| $25,000 to $49,999 | 3,015 (83.6%) | 592 (16.4%) |
| $50,000 to $74,999 | 3,966 (88.2%) | 528 (11.7%) |
| $75,000 to $99,999 | 3,471 (79.8%) | 876 (20.2%) |
| $100,000 and over | 6,013 (87.2%) | 885 (12.8%) |
Public vs Private Health Insurance Coverage by Age in Hayesville
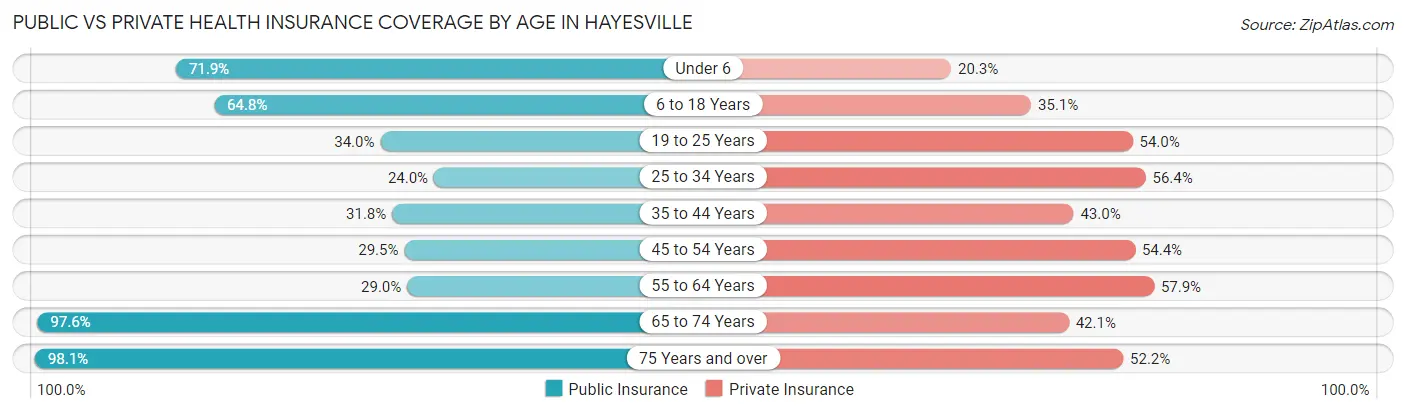
| Age Bracket | Public Insurance | Private Insurance |
| Under 6 | 1,361 (71.9%) | 384 (20.3%) |
| 6 to 18 Years | 2,624 (64.8%) | 1,422 (35.1%) |
| 19 to 25 Years | 1,057 (34.0%) | 1,679 (54.0%) |
| 25 to 34 Years | 778 (24.0%) | 1,826 (56.4%) |
| 35 to 44 Years | 818 (31.8%) | 1,107 (43.0%) |
| 45 to 54 Years | 719 (29.5%) | 1,325 (54.4%) |
| 55 to 64 Years | 506 (29.0%) | 1,011 (57.9%) |
| 65 to 74 Years | 1,884 (97.6%) | 813 (42.1%) |
| 75 Years and over | 817 (98.1%) | 435 (52.2%) |
| Total | 10,564 (48.4%) | 10,002 (45.9%) |
Disability Status by Sex by Age in Hayesville
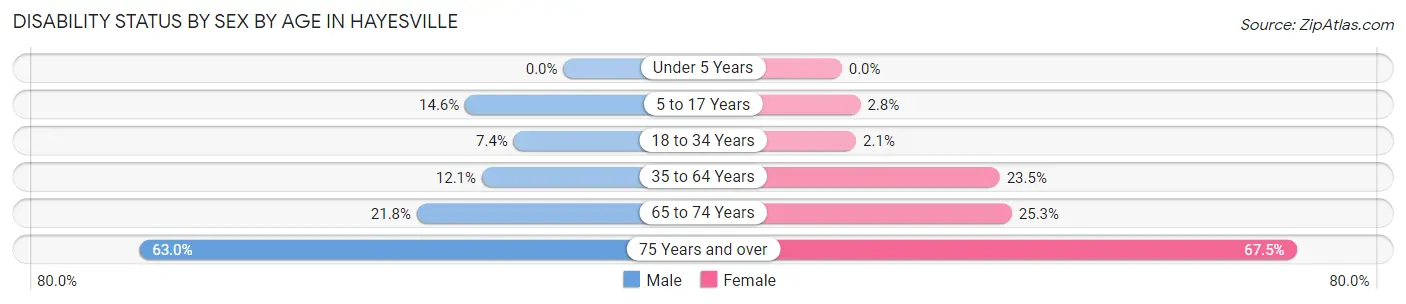
| Age Bracket | Male | Female |
| Under 5 Years | 0 (0.0%) | 0 (0.0%) |
| 5 to 17 Years | 306 (14.6%) | 55 (2.8%) |
| 18 to 34 Years | 287 (7.4%) | 58 (2.1%) |
| 35 to 64 Years | 432 (12.1%) | 747 (23.4%) |
| 65 to 74 Years | 226 (21.7%) | 225 (25.3%) |
| 75 Years and over | 323 (63.0%) | 216 (67.5%) |
Disability Class by Sex by Age in Hayesville
Disability Class: Hearing Difficulty
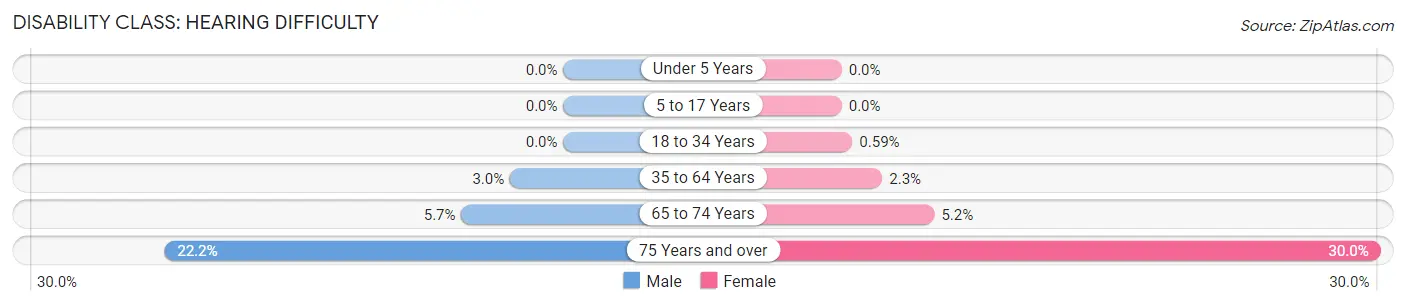
| Age Bracket | Male | Female |
| Under 5 Years | 0 (0.0%) | 0 (0.0%) |
| 5 to 17 Years | 0 (0.0%) | 0 (0.0%) |
| 18 to 34 Years | 0 (0.0%) | 16 (0.6%) |
| 35 to 64 Years | 106 (3.0%) | 72 (2.3%) |
| 65 to 74 Years | 59 (5.7%) | 46 (5.2%) |
| 75 Years and over | 114 (22.2%) | 96 (30.0%) |
Disability Class: Vision Difficulty
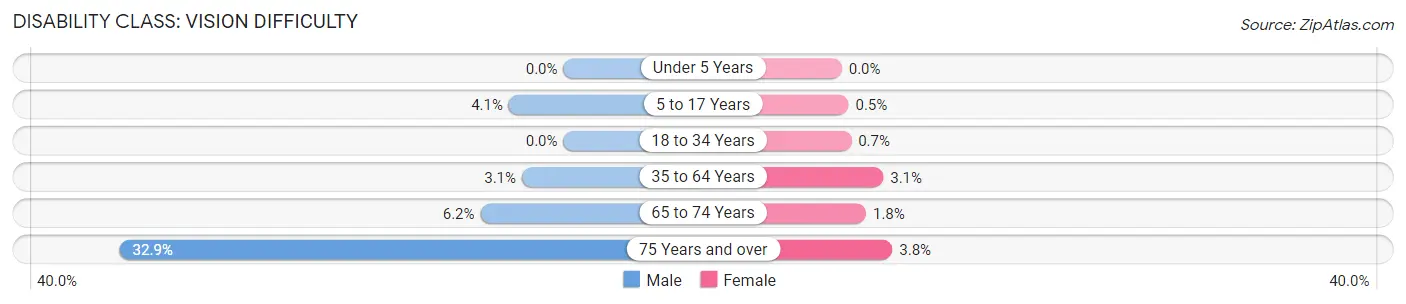
| Age Bracket | Male | Female |
| Under 5 Years | 0 (0.0%) | 0 (0.0%) |
| 5 to 17 Years | 85 (4.1%) | 10 (0.5%) |
| 18 to 34 Years | 0 (0.0%) | 19 (0.7%) |
| 35 to 64 Years | 110 (3.1%) | 98 (3.1%) |
| 65 to 74 Years | 64 (6.2%) | 16 (1.8%) |
| 75 Years and over | 169 (32.9%) | 12 (3.7%) |
Disability Class: Cognitive Difficulty
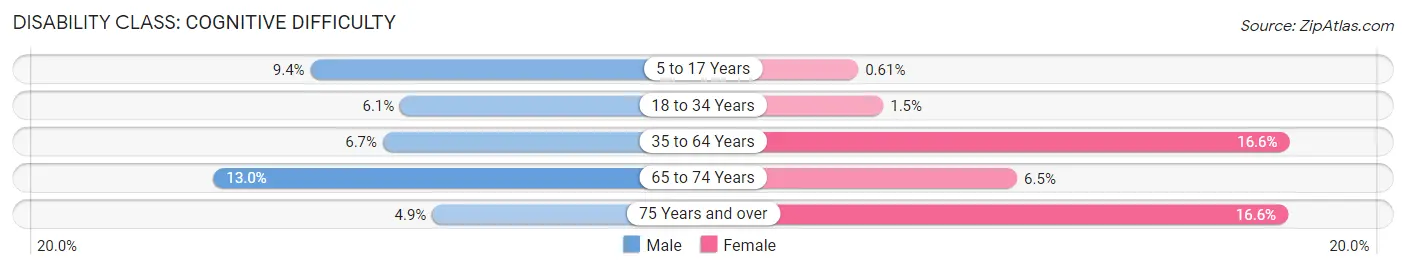
| Age Bracket | Male | Female |
| 5 to 17 Years | 197 (9.4%) | 12 (0.6%) |
| 18 to 34 Years | 236 (6.1%) | 42 (1.5%) |
| 35 to 64 Years | 239 (6.7%) | 529 (16.6%) |
| 65 to 74 Years | 135 (13.0%) | 58 (6.5%) |
| 75 Years and over | 25 (4.9%) | 53 (16.6%) |
Disability Class: Ambulatory Difficulty
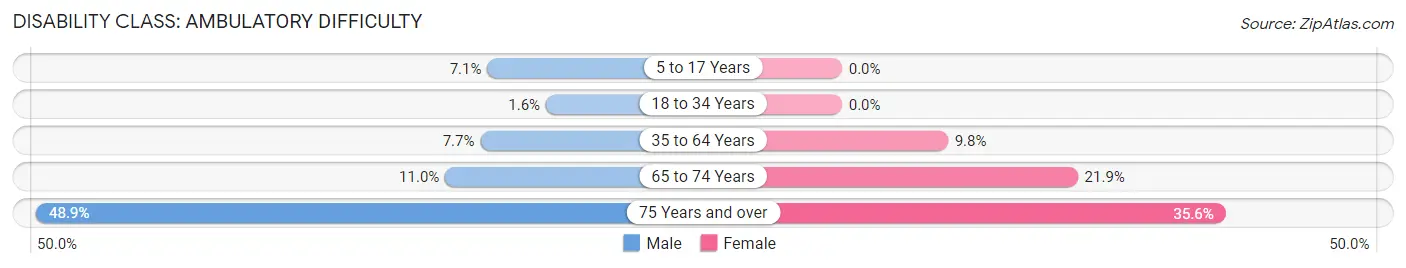
| Age Bracket | Male | Female |
| 5 to 17 Years | 148 (7.1%) | 0 (0.0%) |
| 18 to 34 Years | 63 (1.6%) | 0 (0.0%) |
| 35 to 64 Years | 275 (7.7%) | 313 (9.8%) |
| 65 to 74 Years | 114 (11.0%) | 195 (21.9%) |
| 75 Years and over | 251 (48.9%) | 114 (35.6%) |
Disability Class: Self-Care Difficulty
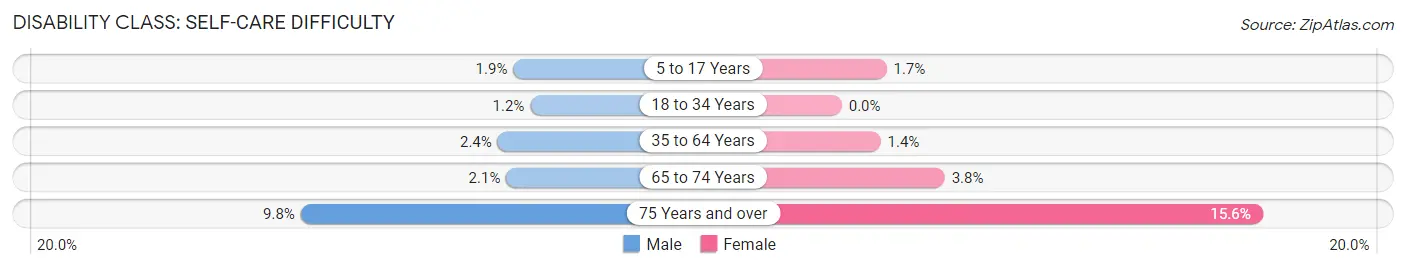
| Age Bracket | Male | Female |
| 5 to 17 Years | 39 (1.9%) | 33 (1.7%) |
| 18 to 34 Years | 48 (1.2%) | 0 (0.0%) |
| 35 to 64 Years | 87 (2.4%) | 46 (1.4%) |
| 65 to 74 Years | 22 (2.1%) | 34 (3.8%) |
| 75 Years and over | 50 (9.8%) | 50 (15.6%) |
Technology Access in Hayesville
Computing Device Access in Hayesville
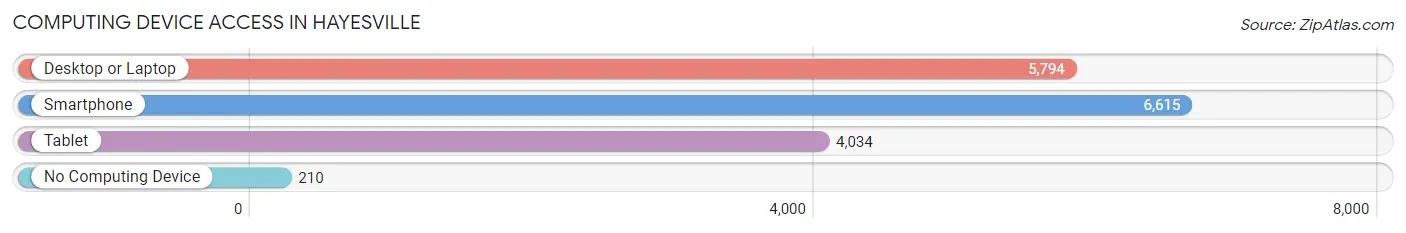
| Device Type | # Households | % Households |
| Desktop or Laptop | 5,794 | 81.8% |
| Smartphone | 6,615 | 93.4% |
| Tablet | 4,034 | 57.0% |
| No Computing Device | 210 | 3.0% |
| Total | 7,080 | 100.0% |
Internet Access in Hayesville
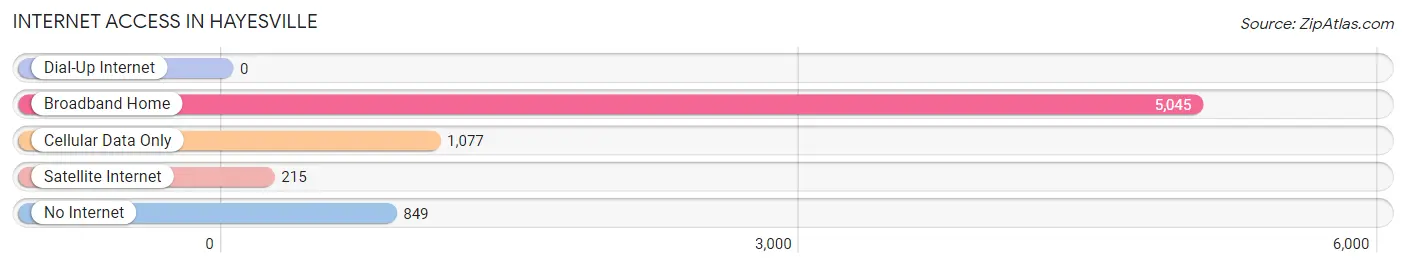
| Internet Type | # Households | % Households |
| Dial-Up Internet | 0 | 0.0% |
| Broadband Home | 5,045 | 71.3% |
| Cellular Data Only | 1,077 | 15.2% |
| Satellite Internet | 215 | 3.0% |
| No Internet | 849 | 12.0% |
| Total | 7,080 | 100.0% |
Hayesville Summary
Hayesville is a small unincorporated community located in the foothills of the Cascade Mountains in Lane County, Oregon. The community is situated on the banks of the McKenzie River, approximately 20 miles east of Eugene. The population of Hayesville is estimated to be around 200 people.
History
The area that is now Hayesville was first settled in the late 1800s by homesteaders. The first post office was established in 1891 and the community was named after the first postmaster, William Hay. The town was originally a logging and farming community, but in the early 1900s, the timber industry began to decline and the town shifted to a more rural lifestyle.
In the 1950s, the town began to experience a resurgence in population as people moved to the area to take advantage of the area’s natural beauty and recreational opportunities. The town was incorporated in 1959 and has remained a small, rural community ever since.
Geography
Hayesville is located in the foothills of the Cascade Mountains in Lane County, Oregon. The town is situated on the banks of the McKenzie River, approximately 20 miles east of Eugene. The town is surrounded by lush forests and rolling hills, providing a picturesque backdrop for the community.
The climate in Hayesville is mild and temperate, with warm summers and cool winters. The average annual temperature is around 50 degrees Fahrenheit. The area receives an average of 40 inches of precipitation per year, with most of it falling in the winter months.
Economy
The economy of Hayesville is largely based on tourism and recreation. The town is home to several campgrounds, fishing spots, and hiking trails, which attract visitors from all over the region. The town also has a few small businesses, including a general store, a cafe, and a few other local shops.
The town is also home to a few small farms, which produce a variety of fruits and vegetables. The town also has a few small wineries, which produce a variety of wines.
Demographics
As of the 2010 census, the population of Hayesville was estimated to be around 200 people. The racial makeup of the town was 97.5% White, 0.5% Native American, 0.5% Asian, and 1.5% from other races. The median household income in the town was $37,500, and the median age was 44.
The town is home to a variety of religious denominations, including Baptist, Methodist, and Catholic. The town also has a few small churches, including the Hayesville United Methodist Church and the Hayesville Baptist Church.
Conclusion
Hayesville is a small, rural community located in the foothills of the Cascade Mountains in Lane County, Oregon. The town is situated on the banks of the McKenzie River, approximately 20 miles east of Eugene. The town is home to a variety of recreational activities, including camping, fishing, and hiking. The town also has a few small businesses, farms, and wineries. The population of Hayesville is estimated to be around 200 people, and the median household income is $37,500. The town is home to a variety of religious denominations, including Baptist, Methodist, and Catholic.
Common Questions
What is Per Capita Income in Hayesville?
Per Capita income in Hayesville is $26,814.
What is the Median Family Income in Hayesville?
Median Family Income in Hayesville is $63,719.
What is the Median Household income in Hayesville?
Median Household Income in Hayesville is $65,833.
What is Income or Wage Gap in Hayesville?
Income or Wage Gap in Hayesville is 35.1%.
Women in Hayesville earn 64.9 cents for every dollar earned by a man.
What is Family Income Deficit in Hayesville?
Family Income Deficit in Hayesville is $10,811.
Families that are below poverty line in Hayesville earn $10,811 less on average than the poverty threshold level.
What is Inequality or Gini Index in Hayesville?
Inequality or Gini Index in Hayesville is 0.37.
What is the Total Population of Hayesville?
Total Population of Hayesville is 21,822.
What is the Total Male Population of Hayesville?
Total Male Population of Hayesville is 11,977.
What is the Total Female Population of Hayesville?
Total Female Population of Hayesville is 9,845.
What is the Ratio of Males per 100 Females in Hayesville?
There are 121.66 Males per 100 Females in Hayesville.
What is the Ratio of Females per 100 Males in Hayesville?
There are 82.20 Females per 100 Males in Hayesville.
What is the Median Population Age in Hayesville?
Median Population Age in Hayesville is 30.9 Years.
What is the Average Family Size in Hayesville
Average Family Size in Hayesville is 3.6 People.
What is the Average Household Size in Hayesville
Average Household Size in Hayesville is 3.0 People.
How Large is the Labor Force in Hayesville?
There are 10,298 People in the Labor Forcein in Hayesville.
What is the Percentage of People in the Labor Force in Hayesville?
60.9% of People are in the Labor Force in Hayesville.
What is the Unemployment Rate in Hayesville?
Unemployment Rate in Hayesville is 5.8%.