Lincoln Beach, OR Map & Demographics
Lincoln Beach Map
Lincoln Beach Overview
$36,107
PER CAPITA INCOME
$78,109
AVG FAMILY INCOME
$60,508
AVG HOUSEHOLD INCOME
2.6%
WAGE / INCOME GAP [ % ]
97.4¢/ $1
WAGE / INCOME GAP [ $ ]
0.35
INEQUALITY / GINI INDEX
2,779
TOTAL POPULATION
1,397
MALE POPULATION
1,382
FEMALE POPULATION
101.09
MALES / 100 FEMALES
98.93
FEMALES / 100 MALES
60.0
MEDIAN AGE
2.6
AVG FAMILY SIZE
2.0
AVG HOUSEHOLD SIZE
1,264
LABOR FORCE [ PEOPLE ]
50.9%
PERCENT IN LABOR FORCE
3.6%
UNEMPLOYMENT RATE
Income in Lincoln Beach
Income Overview in Lincoln Beach
Per Capita Income in Lincoln Beach is $36,107, while median incomes of families and households are $78,109 and $60,508 respectively.
| Characteristic | Number | Measure |
| Per Capita Income | 2,779 | $36,107 |
| Median Family Income | 672 | $78,109 |
| Mean Family Income | 672 | $82,671 |
| Median Household Income | 1,358 | $60,508 |
| Mean Household Income | 1,358 | $73,448 |
| Income Deficit | 672 | $0 |
| Wage / Income Gap (%) | 2,779 | 2.63% |
| Wage / Income Gap ($) | 2,779 | 97.37¢ per $1 |
| Gini / Inequality Index | 2,779 | 0.35 |
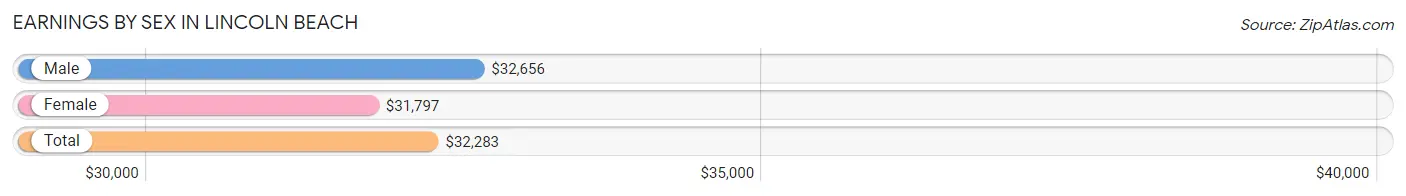
Earnings by Sex in Lincoln Beach
Average Earnings in Lincoln Beach are $32,283, $32,656 for men and $31,797 for women, a difference of 2.6%.
| Sex | Number | Average Earnings |
| Male | 589 (44.7%) | $32,656 |
| Female | 730 (55.3%) | $31,797 |
| Total | 1,319 (100.0%) | $32,283 |
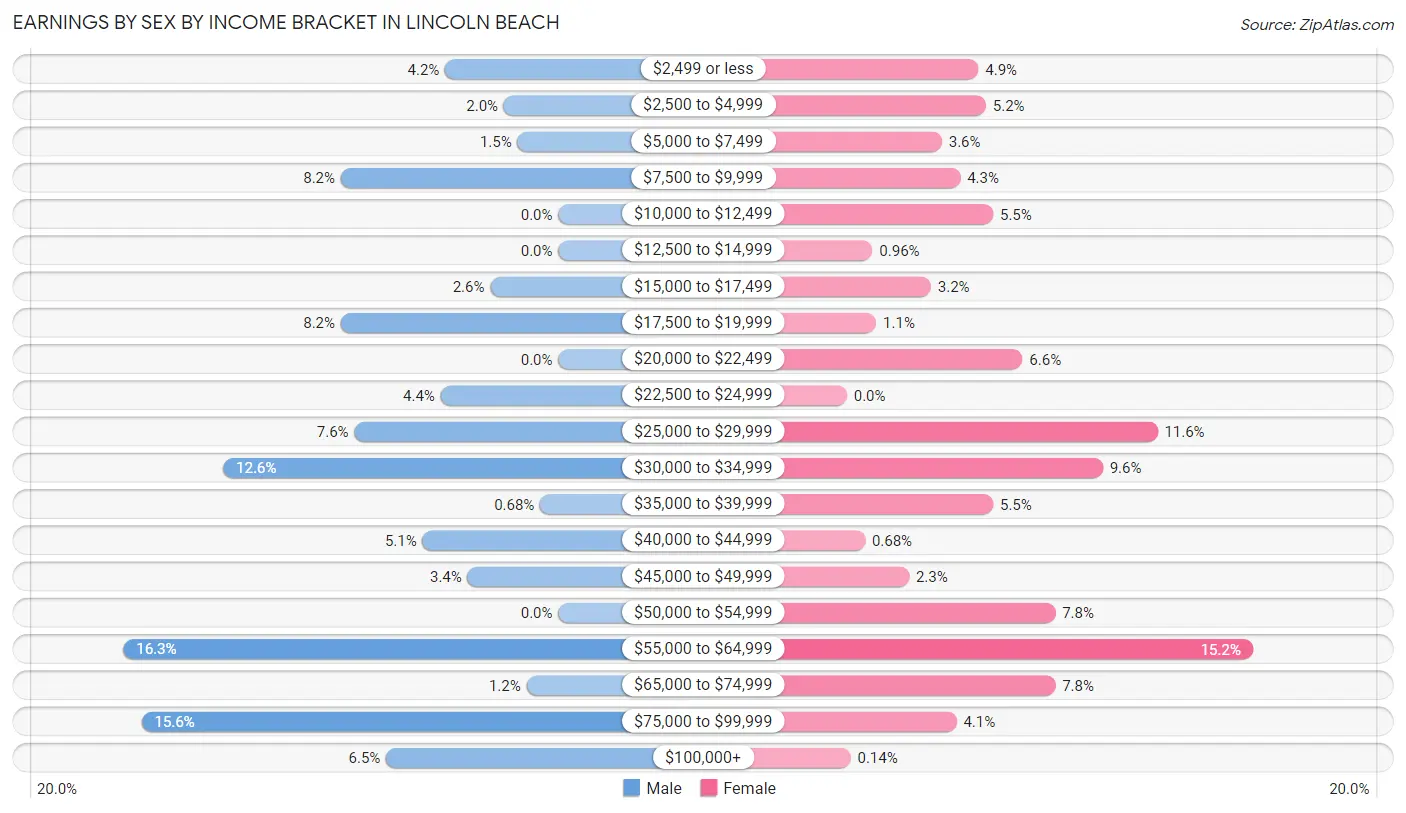
Earnings by Sex by Income Bracket in Lincoln Beach
The most common earnings brackets in Lincoln Beach are $55,000 to $64,999 for men (96 | 16.3%) and $55,000 to $64,999 for women (111 | 15.2%).
| Income | Male | Female |
| $2,499 or less | 25 (4.2%) | 36 (4.9%) |
| $2,500 to $4,999 | 12 (2.0%) | 38 (5.2%) |
| $5,000 to $7,499 | 9 (1.5%) | 26 (3.6%) |
| $7,500 to $9,999 | 48 (8.2%) | 31 (4.3%) |
| $10,000 to $12,499 | 0 (0.0%) | 40 (5.5%) |
| $12,500 to $14,999 | 0 (0.0%) | 7 (1.0%) |
| $15,000 to $17,499 | 15 (2.5%) | 23 (3.2%) |
| $17,500 to $19,999 | 48 (8.2%) | 8 (1.1%) |
| $20,000 to $22,499 | 0 (0.0%) | 48 (6.6%) |
| $22,500 to $24,999 | 26 (4.4%) | 0 (0.0%) |
| $25,000 to $29,999 | 45 (7.6%) | 85 (11.6%) |
| $30,000 to $34,999 | 74 (12.6%) | 70 (9.6%) |
| $35,000 to $39,999 | 4 (0.7%) | 40 (5.5%) |
| $40,000 to $44,999 | 30 (5.1%) | 5 (0.7%) |
| $45,000 to $49,999 | 20 (3.4%) | 17 (2.3%) |
| $50,000 to $54,999 | 0 (0.0%) | 57 (7.8%) |
| $55,000 to $64,999 | 96 (16.3%) | 111 (15.2%) |
| $65,000 to $74,999 | 7 (1.2%) | 57 (7.8%) |
| $75,000 to $99,999 | 92 (15.6%) | 30 (4.1%) |
| $100,000+ | 38 (6.5%) | 1 (0.1%) |
| Total | 589 (100.0%) | 730 (100.0%) |
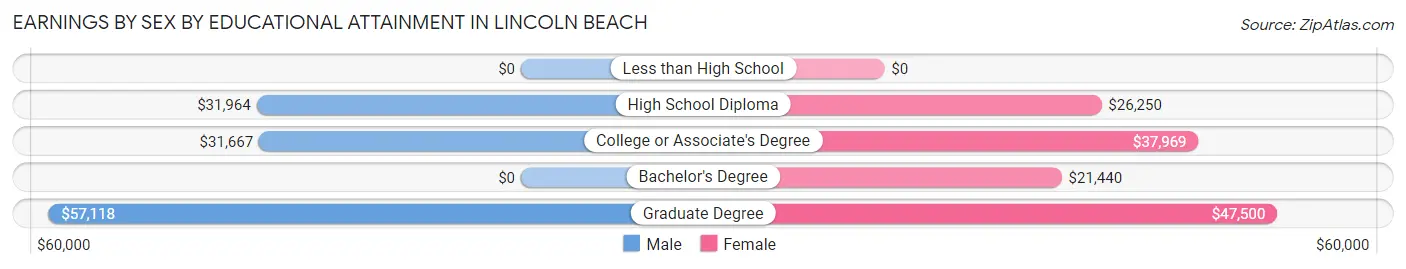
Earnings by Sex by Educational Attainment in Lincoln Beach
Average earnings in Lincoln Beach are $41,042 for men and $32,109 for women, a difference of 21.8%. Men with an educational attainment of graduate degree enjoy the highest average annual earnings of $57,118, while those with college or associate's degree education earn the least with $31,667. Women with an educational attainment of graduate degree earn the most with the average annual earnings of $47,500, while those with bachelor's degree education have the smallest earnings of $21,440.
| Educational Attainment | Male Income | Female Income |
| Less than High School | - | - |
| High School Diploma | $31,964 | $26,250 |
| College or Associate's Degree | $31,667 | $37,969 |
| Bachelor's Degree | - | - |
| Graduate Degree | $57,118 | $47,500 |
| Total | $41,042 | $32,109 |
Family Income in Lincoln Beach
Family Income Brackets in Lincoln Beach
According to the Lincoln Beach family income data, there are 210 families falling into the $50,000 to $74,999 income range, which is the most common income bracket and makes up 31.2% of all families.
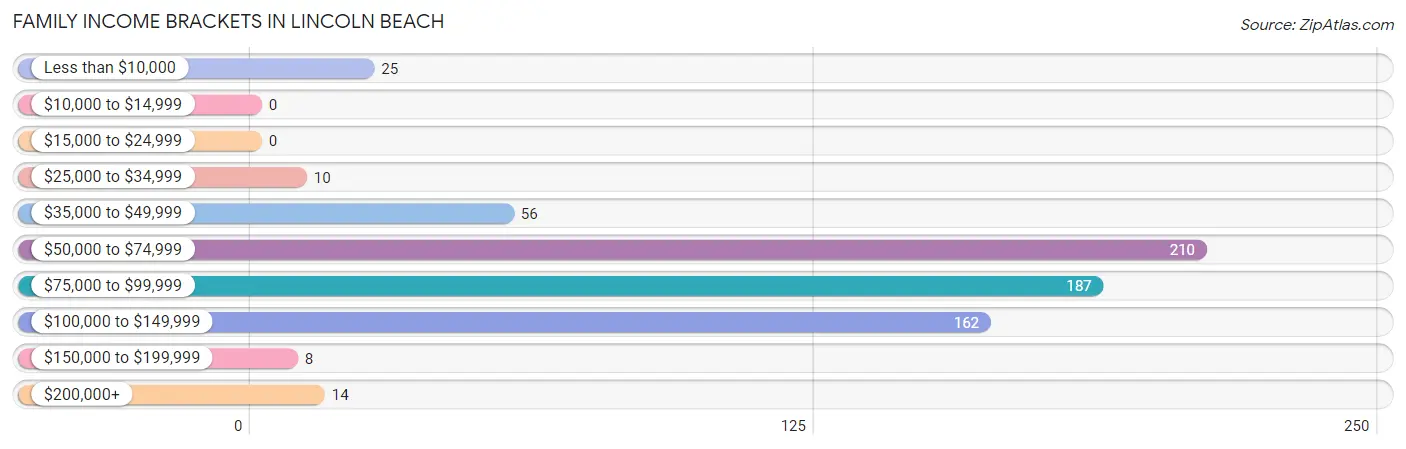
| Income Bracket | # Families | % Families |
| Less than $10,000 | 25 | 3.7% |
| $10,000 to $14,999 | 0 | 0.0% |
| $15,000 to $24,999 | 0 | 0.0% |
| $25,000 to $34,999 | 10 | 1.5% |
| $35,000 to $49,999 | 56 | 8.3% |
| $50,000 to $74,999 | 210 | 31.3% |
| $75,000 to $99,999 | 187 | 27.8% |
| $100,000 to $149,999 | 162 | 24.1% |
| $150,000 to $199,999 | 8 | 1.2% |
| $200,000+ | 14 | 2.1% |
Family Income by Famaliy Size in Lincoln Beach
4-person families (59 | 8.8%) account for the highest median family income in Lincoln Beach with $109,549 per family, while 2-person families (545 | 81.1%) have the highest median income of $33,282 per family member.
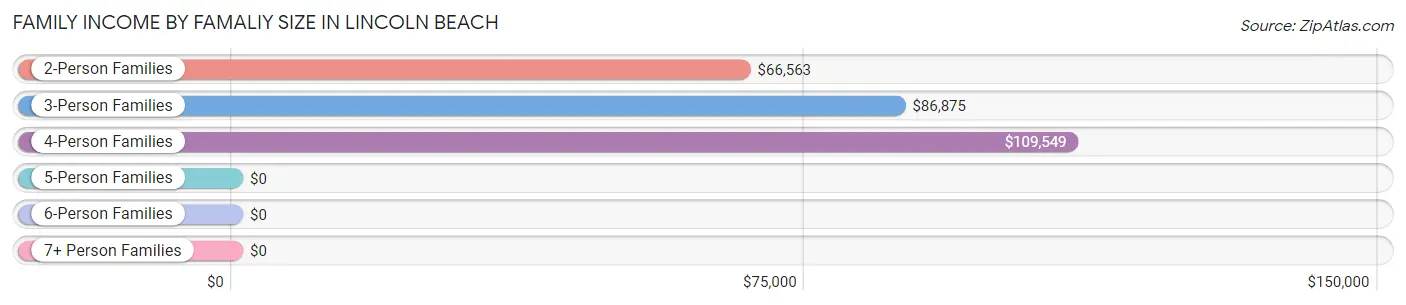
| Income Bracket | # Families | Median Income |
| 2-Person Families | 545 (81.1%) | $66,563 |
| 3-Person Families | 23 (3.4%) | $86,875 |
| 4-Person Families | 59 (8.8%) | $109,549 |
| 5-Person Families | 45 (6.7%) | $0 |
| 6-Person Families | 0 (0.0%) | $0 |
| 7+ Person Families | 0 (0.0%) | $0 |
| Total | 672 (100.0%) | $78,109 |
Family Income by Number of Earners in Lincoln Beach
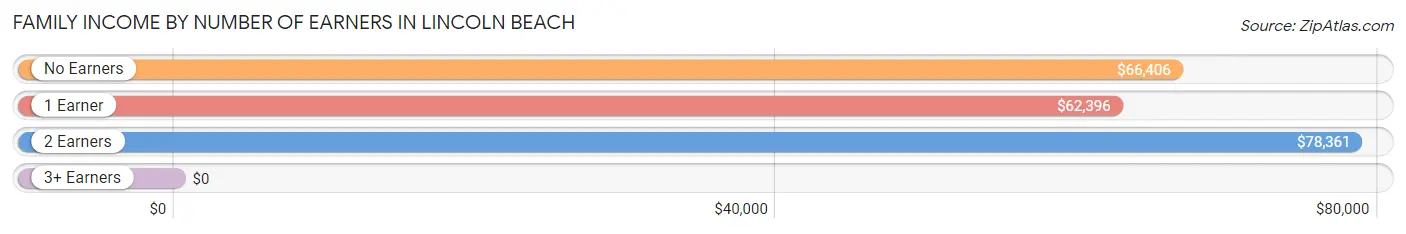
| Number of Earners | # Families | Median Income |
| No Earners | 211 (31.4%) | $66,406 |
| 1 Earner | 155 (23.1%) | $62,396 |
| 2 Earners | 261 (38.8%) | $78,361 |
| 3+ Earners | 45 (6.7%) | $0 |
| Total | 672 (100.0%) | $78,109 |
Household Income in Lincoln Beach
Household Income Brackets in Lincoln Beach
With 449 households falling in the category, the $50,000 to $74,999 income range is the most frequent in Lincoln Beach, accounting for 33.1% of all households. In contrast, only 27 households (2.0%) fall into the $200,000+ income bracket, making it the least populous group.
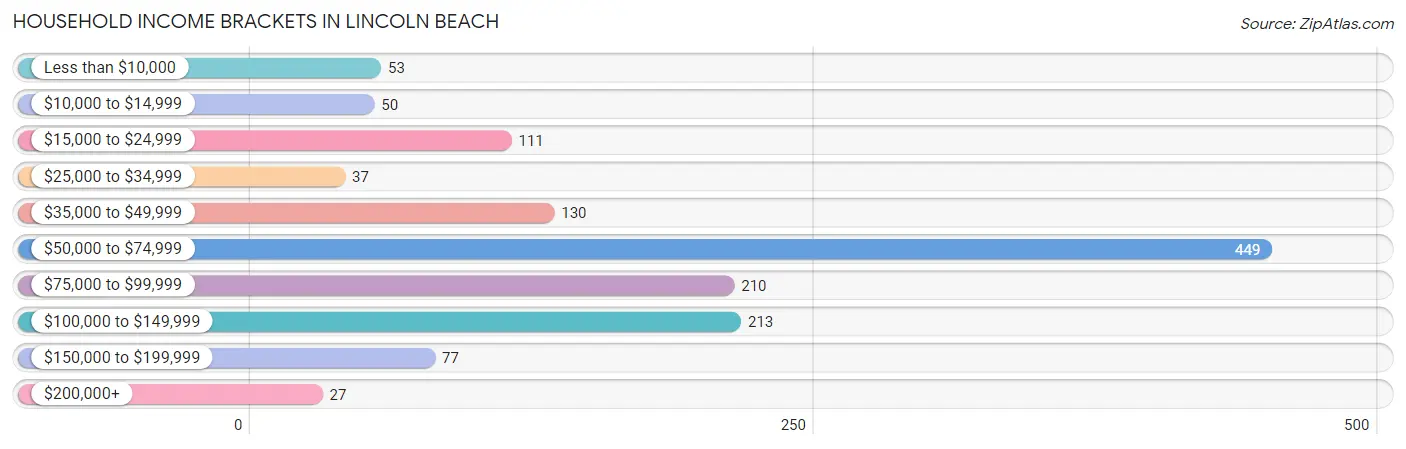
| Income Bracket | # Households | % Households |
| Less than $10,000 | 53 | 3.9% |
| $10,000 to $14,999 | 50 | 3.7% |
| $15,000 to $24,999 | 111 | 8.2% |
| $25,000 to $34,999 | 37 | 2.7% |
| $35,000 to $49,999 | 130 | 9.6% |
| $50,000 to $74,999 | 449 | 33.1% |
| $75,000 to $99,999 | 210 | 15.5% |
| $100,000 to $149,999 | 213 | 15.7% |
| $150,000 to $199,999 | 77 | 5.7% |
| $200,000+ | 27 | 2.0% |
Household Income by Householder Age in Lincoln Beach
The median household income in Lincoln Beach is $60,508, with the highest median household income of $78,984 found in the 25 to 44 years age bracket for the primary householder. A total of 188 households (13.8%) fall into this category. Meanwhile, the 15 to 24 years age bracket for the primary householder has the lowest median household income of $0, with 8 households (0.6%) in this group.
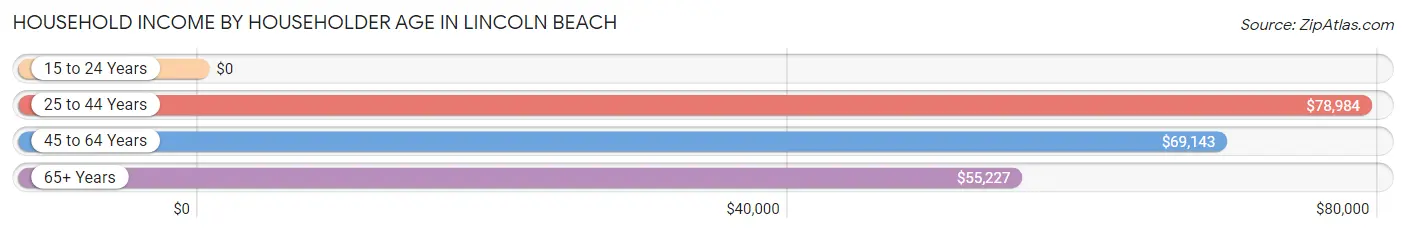
| Income Bracket | # Households | Median Income |
| 15 to 24 Years | 8 (0.6%) | $0 |
| 25 to 44 Years | 188 (13.8%) | $78,984 |
| 45 to 64 Years | 484 (35.6%) | $69,143 |
| 65+ Years | 678 (49.9%) | $55,227 |
| Total | 1,358 (100.0%) | $60,508 |
Poverty in Lincoln Beach
Income Below Poverty by Sex and Age in Lincoln Beach
With 3.4% poverty level for males and 10.8% for females among the residents of Lincoln Beach, 45 to 54 year old males and 18 to 24 year old females are the most vulnerable to poverty, with 25 males (16.1%) and 8 females (100.0%) in their respective age groups living below the poverty level.
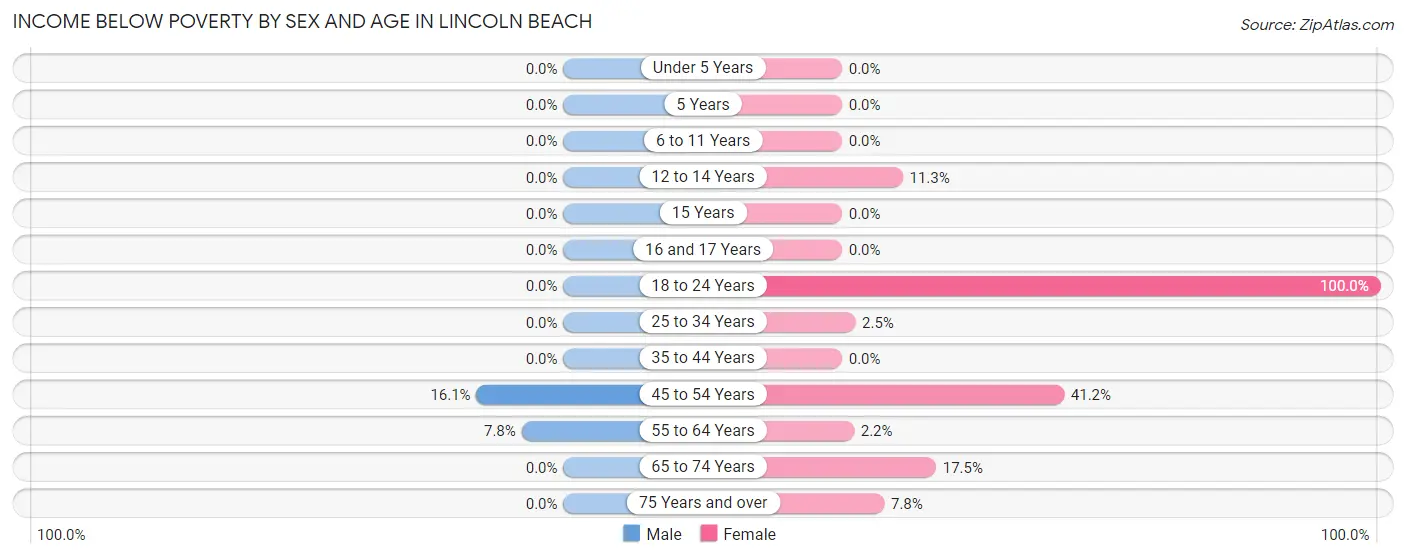
| Age Bracket | Male | Female |
| Under 5 Years | 0 (0.0%) | 0 (0.0%) |
| 5 Years | 0 (0.0%) | 0 (0.0%) |
| 6 to 11 Years | 0 (0.0%) | 0 (0.0%) |
| 12 to 14 Years | 0 (0.0%) | 8 (11.3%) |
| 15 Years | 0 (0.0%) | 0 (0.0%) |
| 16 and 17 Years | 0 (0.0%) | 0 (0.0%) |
| 18 to 24 Years | 0 (0.0%) | 8 (100.0%) |
| 25 to 34 Years | 0 (0.0%) | 2 (2.5%) |
| 35 to 44 Years | 0 (0.0%) | 0 (0.0%) |
| 45 to 54 Years | 25 (16.1%) | 61 (41.2%) |
| 55 to 64 Years | 20 (7.7%) | 9 (2.2%) |
| 65 to 74 Years | 0 (0.0%) | 37 (17.4%) |
| 75 Years and over | 0 (0.0%) | 25 (7.8%) |
| Total | 45 (3.4%) | 150 (10.8%) |
Income Above Poverty by Sex and Age in Lincoln Beach
According to the poverty statistics in Lincoln Beach, males aged 6 to 11 years and females aged 16 and 17 years are the age groups that are most secure financially, with 100.0% of males and 100.0% of females in these age groups living above the poverty line.
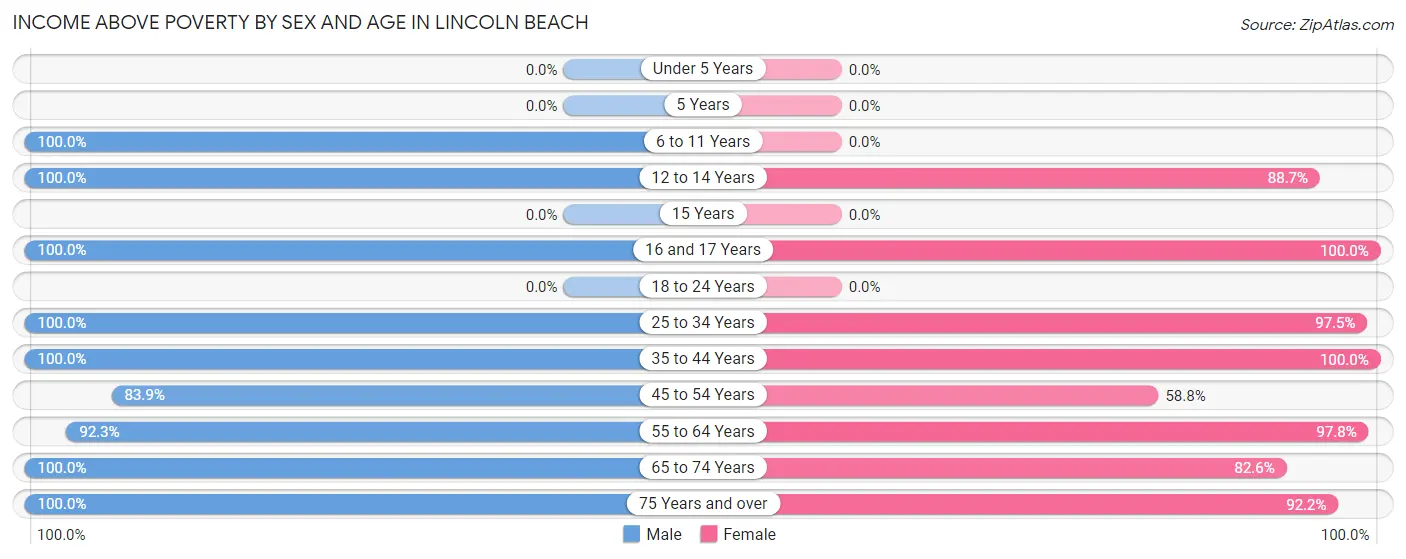
| Age Bracket | Male | Female |
| Under 5 Years | 0 (0.0%) | 0 (0.0%) |
| 5 Years | 0 (0.0%) | 0 (0.0%) |
| 6 to 11 Years | 86 (100.0%) | 0 (0.0%) |
| 12 to 14 Years | 60 (100.0%) | 63 (88.7%) |
| 15 Years | 0 (0.0%) | 0 (0.0%) |
| 16 and 17 Years | 168 (100.0%) | 5 (100.0%) |
| 18 to 24 Years | 0 (0.0%) | 0 (0.0%) |
| 25 to 34 Years | 65 (100.0%) | 79 (97.5%) |
| 35 to 44 Years | 96 (100.0%) | 132 (100.0%) |
| 45 to 54 Years | 130 (83.9%) | 87 (58.8%) |
| 55 to 64 Years | 238 (92.2%) | 397 (97.8%) |
| 65 to 74 Years | 231 (100.0%) | 175 (82.6%) |
| 75 Years and over | 200 (100.0%) | 294 (92.2%) |
| Total | 1,274 (96.6%) | 1,232 (89.1%) |
Income Below Poverty Among Married-Couple Families in Lincoln Beach
The poverty statistics for married-couple families in Lincoln Beach show that 1.3% or 8 of the total 619 families live below the poverty line. Families with no children have the highest poverty rate of 1.6%, comprising of 8 families. On the other hand, families with 1 or 2 children have the lowest poverty rate of 0.0%, which includes 0 families.
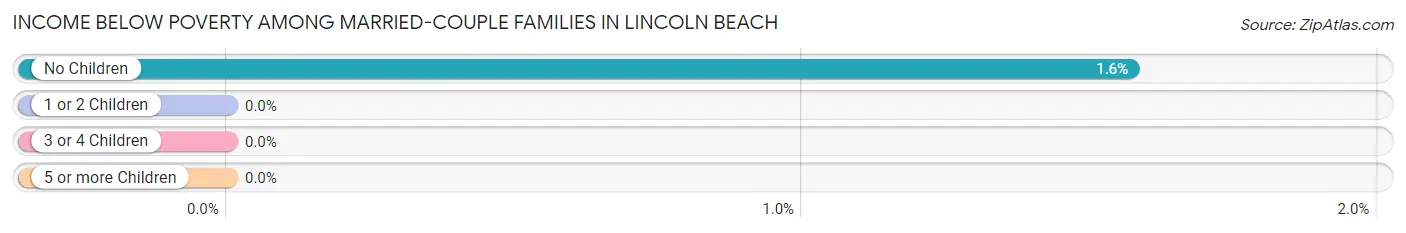
| Children | Above Poverty | Below Poverty |
| No Children | 503 (98.4%) | 8 (1.6%) |
| 1 or 2 Children | 63 (100.0%) | 0 (0.0%) |
| 3 or 4 Children | 45 (100.0%) | 0 (0.0%) |
| 5 or more Children | 0 (0.0%) | 0 (0.0%) |
| Total | 611 (98.7%) | 8 (1.3%) |
Income Below Poverty Among Single-Parent Households in Lincoln Beach
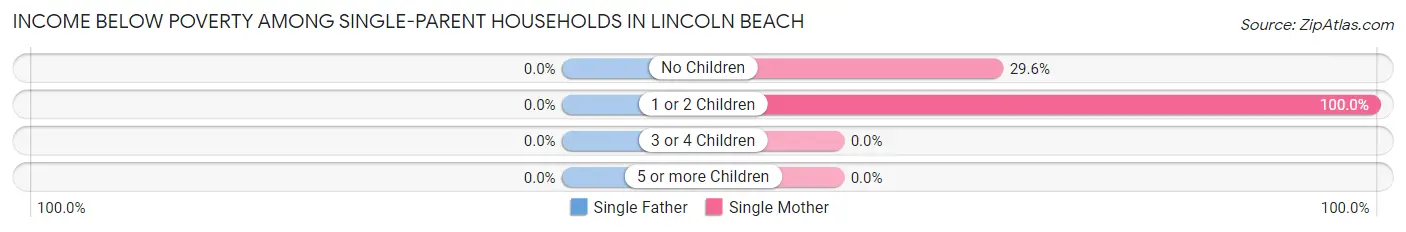
| Children | Single Father | Single Mother |
| No Children | 0 (0.0%) | 8 (29.6%) |
| 1 or 2 Children | 0 (0.0%) | 9 (100.0%) |
| 3 or 4 Children | 0 (0.0%) | 0 (0.0%) |
| 5 or more Children | 0 (0.0%) | 0 (0.0%) |
| Total | 0 (0.0%) | 17 (47.2%) |
Income Below Poverty Among Married-Couple vs Single-Parent Households in Lincoln Beach
The poverty data for Lincoln Beach shows that 8 of the married-couple family households (1.3%) and 17 of the single-parent households (32.1%) are living below the poverty level. Within the married-couple family households, those with no children have the highest poverty rate, with 8 households (1.6%) falling below the poverty line. Among the single-parent households, those with 1 or 2 children have the highest poverty rate, with 9 household (100.0%) living below poverty.
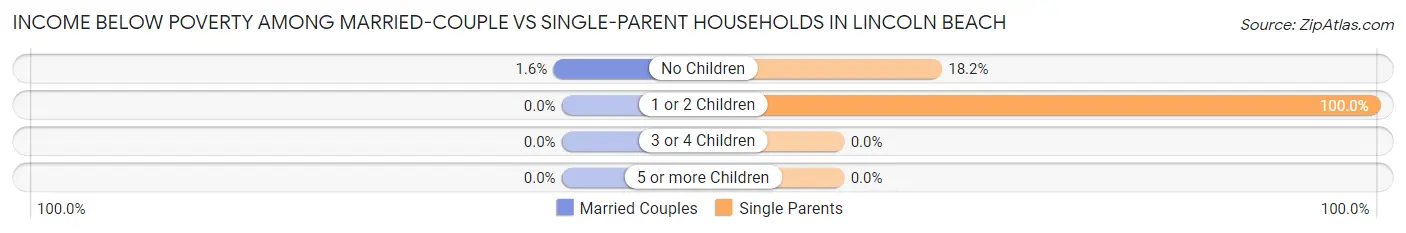
| Children | Married-Couple Families | Single-Parent Households |
| No Children | 8 (1.6%) | 8 (18.2%) |
| 1 or 2 Children | 0 (0.0%) | 9 (100.0%) |
| 3 or 4 Children | 0 (0.0%) | 0 (0.0%) |
| 5 or more Children | 0 (0.0%) | 0 (0.0%) |
| Total | 8 (1.3%) | 17 (32.1%) |
Race in Lincoln Beach
The most populous races in Lincoln Beach are White / Caucasian (2,383 | 85.8%), Two or more Races (315 | 11.3%), and Asian (41 | 1.5%).
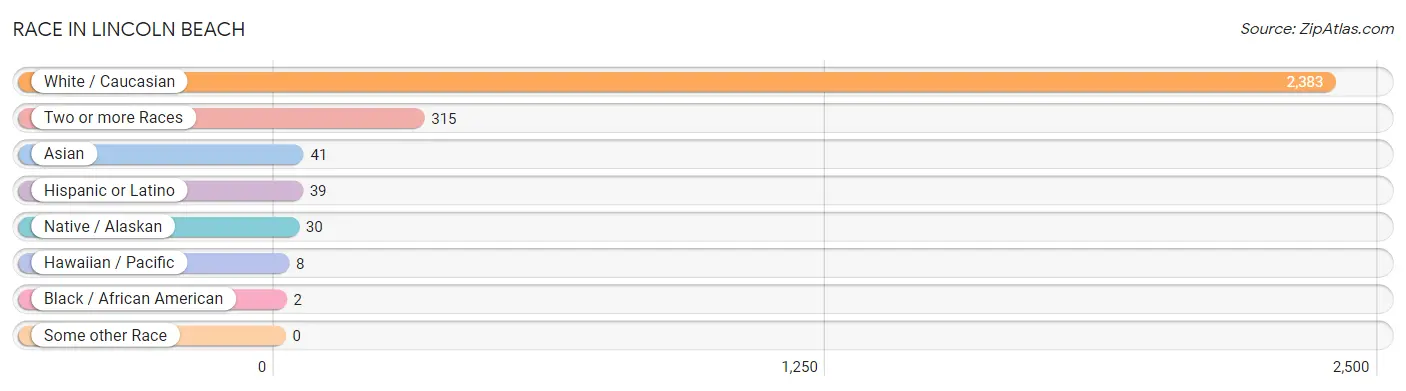
| Race | # Population | % Population |
| Asian | 41 | 1.5% |
| Black / African American | 2 | 0.1% |
| Hawaiian / Pacific | 8 | 0.3% |
| Hispanic or Latino | 39 | 1.4% |
| Native / Alaskan | 30 | 1.1% |
| White / Caucasian | 2,383 | 85.8% |
| Two or more Races | 315 | 11.3% |
| Some other Race | 0 | 0.0% |
| Total | 2,779 | 100.0% |
Ancestry in Lincoln Beach
The most populous ancestries reported in Lincoln Beach are German (599 | 21.5%), English (456 | 16.4%), American (438 | 15.8%), Irish (272 | 9.8%), and Italian (207 | 7.4%), together accounting for 71.0% of all Lincoln Beach residents.
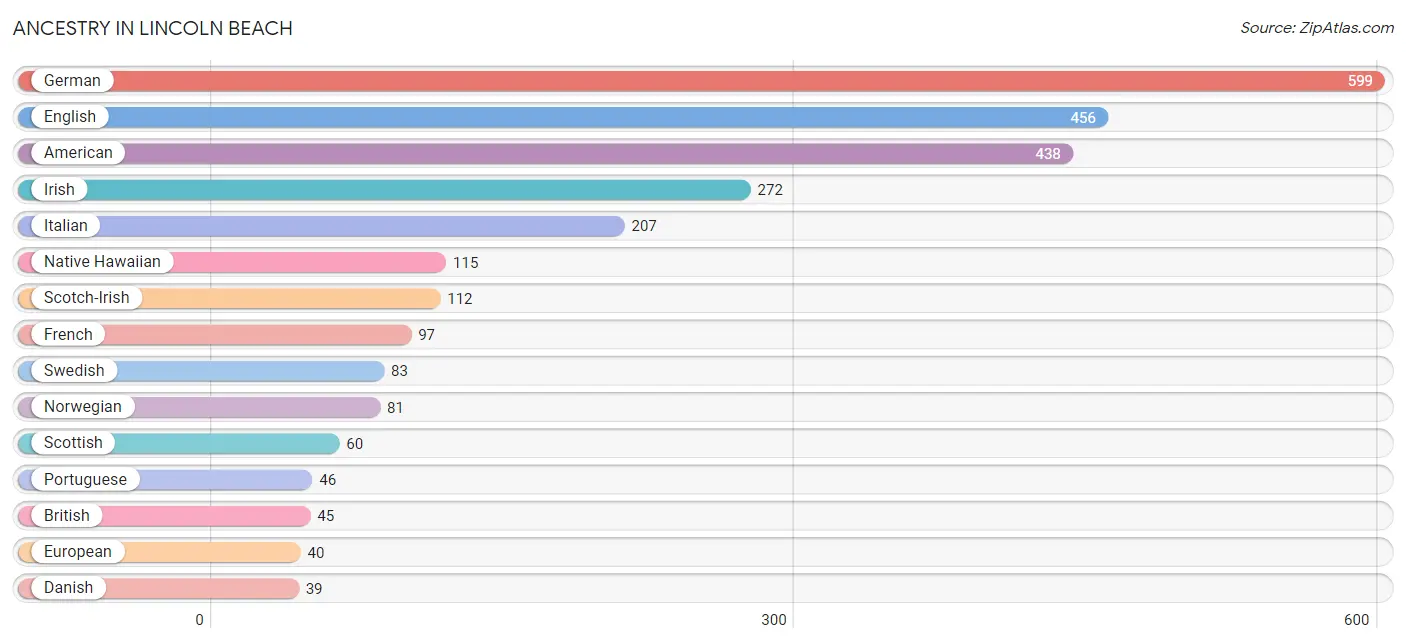
| Ancestry | # Population | % Population |
| American | 438 | 15.8% |
| Austrian | 16 | 0.6% |
| Bhutanese | 26 | 0.9% |
| Blackfeet | 38 | 1.4% |
| British | 45 | 1.6% |
| Cherokee | 37 | 1.3% |
| Danish | 39 | 1.4% |
| Dutch | 17 | 0.6% |
| English | 456 | 16.4% |
| European | 40 | 1.4% |
| French | 97 | 3.5% |
| French Canadian | 25 | 0.9% |
| German | 599 | 21.5% |
| Hungarian | 9 | 0.3% |
| Indian (Asian) | 14 | 0.5% |
| Irish | 272 | 9.8% |
| Italian | 207 | 7.4% |
| Korean | 23 | 0.8% |
| Latvian | 8 | 0.3% |
| Mexican | 39 | 1.4% |
| Native Hawaiian | 115 | 4.1% |
| Norwegian | 81 | 2.9% |
| Polish | 19 | 0.7% |
| Portuguese | 46 | 1.7% |
| Romanian | 1 | 0.0% |
| Russian | 28 | 1.0% |
| Scandinavian | 8 | 0.3% |
| Scotch-Irish | 112 | 4.0% |
| Scottish | 60 | 2.2% |
| Slovak | 22 | 0.8% |
| Swedish | 83 | 3.0% |
| Welsh | 9 | 0.3% | View All 32 Rows |
Immigrants in Lincoln Beach
The most numerous immigrant groups reported in Lincoln Beach came from Europe (78 | 2.8%), Northern Europe (67 | 2.4%), England (47 | 1.7%), Asia (26 | 0.9%), and Eastern Asia (18 | 0.6%), together accounting for 8.5% of all Lincoln Beach residents.
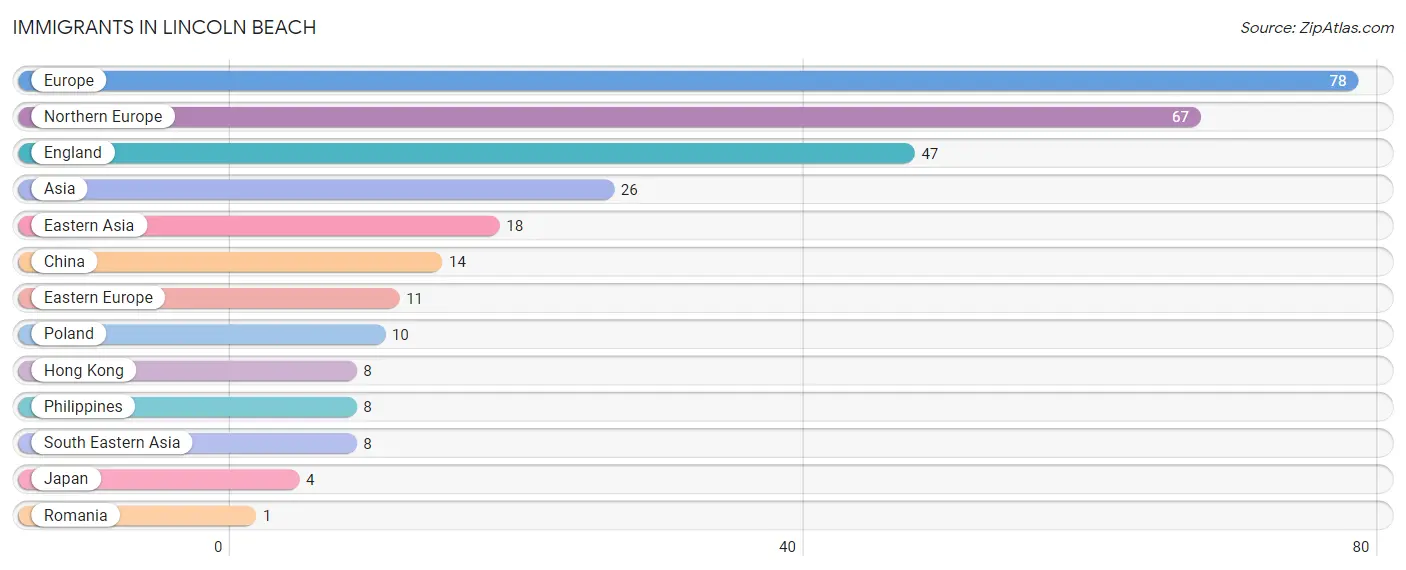
| Immigration Origin | # Population | % Population |
| Asia | 26 | 0.9% |
| China | 14 | 0.5% |
| Eastern Asia | 18 | 0.6% |
| Eastern Europe | 11 | 0.4% |
| England | 47 | 1.7% |
| Europe | 78 | 2.8% |
| Hong Kong | 8 | 0.3% |
| Japan | 4 | 0.1% |
| Northern Europe | 67 | 2.4% |
| Philippines | 8 | 0.3% |
| Poland | 10 | 0.4% |
| Romania | 1 | 0.0% |
| South Eastern Asia | 8 | 0.3% | View All 13 Rows |
Sex and Age in Lincoln Beach
Sex and Age in Lincoln Beach
The most populous age groups in Lincoln Beach are 15 to 19 Years (168 | 12.0%) for men and 60 to 64 Years (298 | 21.6%) for women.
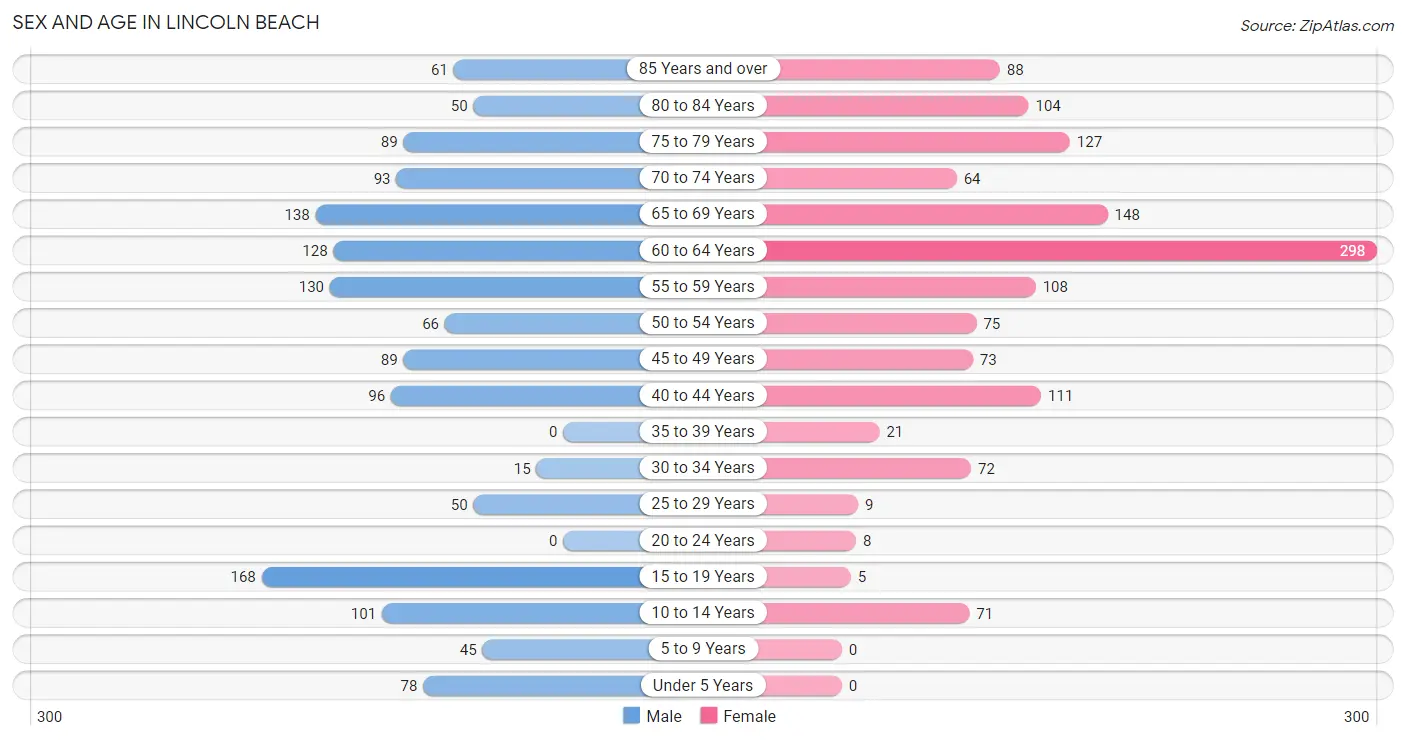
| Age Bracket | Male | Female |
| Under 5 Years | 78 (5.6%) | 0 (0.0%) |
| 5 to 9 Years | 45 (3.2%) | 0 (0.0%) |
| 10 to 14 Years | 101 (7.2%) | 71 (5.1%) |
| 15 to 19 Years | 168 (12.0%) | 5 (0.4%) |
| 20 to 24 Years | 0 (0.0%) | 8 (0.6%) |
| 25 to 29 Years | 50 (3.6%) | 9 (0.6%) |
| 30 to 34 Years | 15 (1.1%) | 72 (5.2%) |
| 35 to 39 Years | 0 (0.0%) | 21 (1.5%) |
| 40 to 44 Years | 96 (6.9%) | 111 (8.0%) |
| 45 to 49 Years | 89 (6.4%) | 73 (5.3%) |
| 50 to 54 Years | 66 (4.7%) | 75 (5.4%) |
| 55 to 59 Years | 130 (9.3%) | 108 (7.8%) |
| 60 to 64 Years | 128 (9.2%) | 298 (21.6%) |
| 65 to 69 Years | 138 (9.9%) | 148 (10.7%) |
| 70 to 74 Years | 93 (6.7%) | 64 (4.6%) |
| 75 to 79 Years | 89 (6.4%) | 127 (9.2%) |
| 80 to 84 Years | 50 (3.6%) | 104 (7.5%) |
| 85 Years and over | 61 (4.4%) | 88 (6.4%) |
| Total | 1,397 (100.0%) | 1,382 (100.0%) |
Families and Households in Lincoln Beach
Median Family Size in Lincoln Beach
The median family size in Lincoln Beach is 2.61 persons per family, with married-couple families (619 | 92.1%) accounting for the largest median family size of 2.66 persons per family. On the other hand, single male/father families (17 | 2.5%) represent the smallest median family size with 1.71 persons per family.
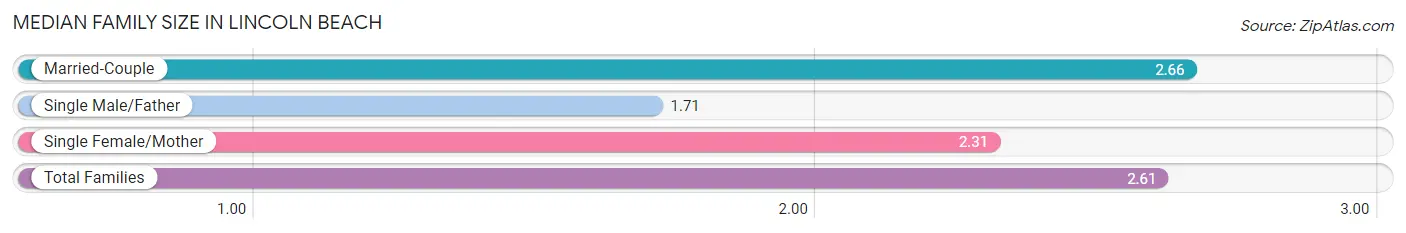
| Family Type | # Families | Family Size |
| Married-Couple | 619 (92.1%) | 2.66 |
| Single Male/Father | 17 (2.5%) | 1.71 |
| Single Female/Mother | 36 (5.4%) | 2.31 |
| Total Families | 672 (100.0%) | 2.61 |
Median Household Size in Lincoln Beach
The median household size in Lincoln Beach is 2.04 persons per household, with single male/father households (17 | 1.3%) accounting for the largest median household size of 3 persons per household. non-family households (686 | 50.5%) represent the smallest median household size with 1.28 persons per household.
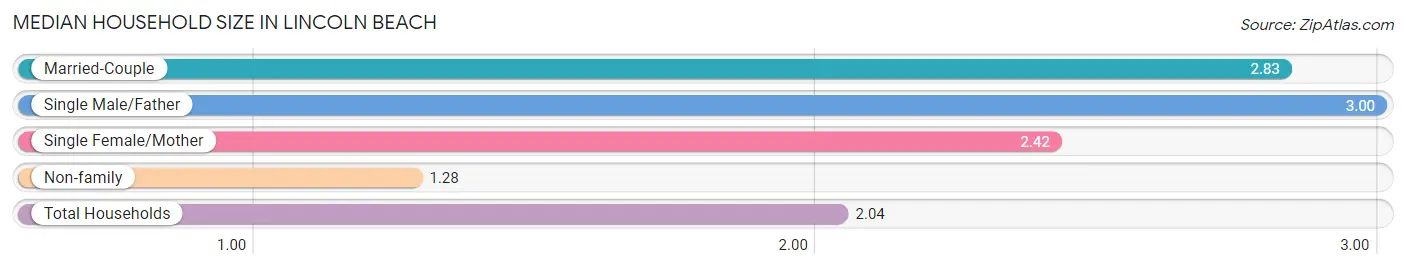
| Household Type | # Households | Household Size |
| Married-Couple | 619 (45.6%) | 2.83 |
| Single Male/Father | 17 (1.3%) | 3.00 |
| Single Female/Mother | 36 (2.6%) | 2.42 |
| Non-family | 686 (50.5%) | 1.28 |
| Total Households | 1,358 (100.0%) | 2.04 |
Household Size by Marriage Status in Lincoln Beach
Out of a total of 1,358 households in Lincoln Beach, 672 (49.5%) are family households, while 686 (50.5%) are nonfamily households. The most numerous type of family households are 2-person households, comprising 470, and the most common type of nonfamily households are 1-person households, comprising 499.
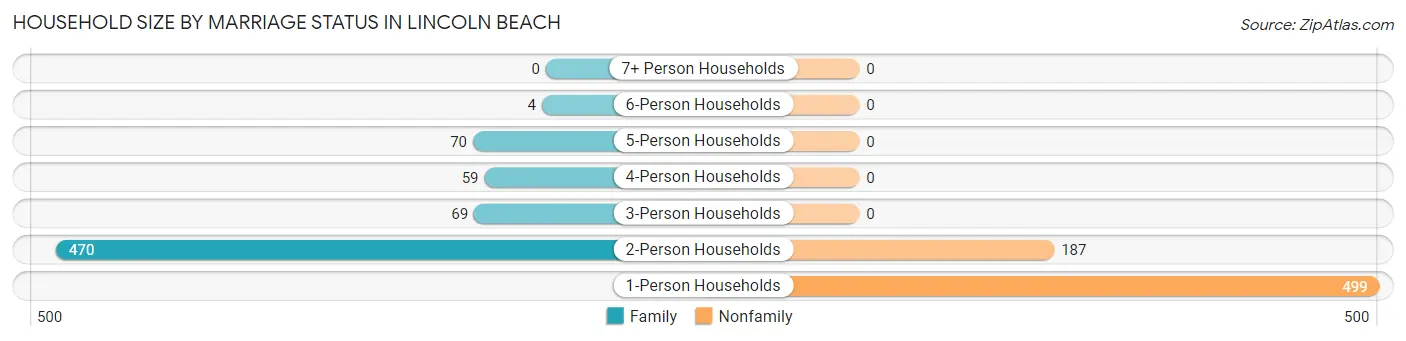
| Household Size | Family Households | Nonfamily Households |
| 1-Person Households | - | 499 (36.7%) |
| 2-Person Households | 470 (34.6%) | 187 (13.8%) |
| 3-Person Households | 69 (5.1%) | 0 (0.0%) |
| 4-Person Households | 59 (4.3%) | 0 (0.0%) |
| 5-Person Households | 70 (5.1%) | 0 (0.0%) |
| 6-Person Households | 4 (0.3%) | 0 (0.0%) |
| 7+ Person Households | 0 (0.0%) | 0 (0.0%) |
| Total | 672 (49.5%) | 686 (50.5%) |
Female Fertility in Lincoln Beach
Fertility by Age in Lincoln Beach
| Age Bracket | Women with Births | Births / 1,000 Women |
| 15 to 19 years | 0 (0.0%) | 0.0 |
| 20 to 34 years | 0 (0.0%) | 0.0 |
| 35 to 50 years | 0 (0.0%) | 0.0 |
| Total | 0 (0.0%) | 0.0 |
Fertility by Age by Marriage Status in Lincoln Beach
| Age Bracket | Married | Unmarried |
| 15 to 19 years | 0 (0.0%) | 0 (0.0%) |
| 20 to 34 years | 0 (0.0%) | 0 (0.0%) |
| 35 to 50 years | 0 (0.0%) | 0 (0.0%) |
| Total | 0 (0.0%) | 0 (0.0%) |
Fertility by Education in Lincoln Beach
| Educational Attainment | Women with Births | Births / 1,000 Women |
| Less than High School | 0 (0.0%) | 0.0 |
| High School Diploma | 0 (0.0%) | 0.0 |
| College or Associate's Degree | 0 (0.0%) | 0.0 |
| Bachelor's Degree | 0 (0.0%) | 0.0 |
| Graduate Degree | 0 (0.0%) | 0.0 |
| Total | 0 (0.0%) | 0.0 |
Fertility by Education by Marriage Status in Lincoln Beach
| Educational Attainment | Married | Unmarried |
| Less than High School | 0 (0.0%) | 0 (0.0%) |
| High School Diploma | 0 (0.0%) | 0 (0.0%) |
| College or Associate's Degree | 0 (0.0%) | 0 (0.0%) |
| Bachelor's Degree | 0 (0.0%) | 0 (0.0%) |
| Graduate Degree | 0 (0.0%) | 0 (0.0%) |
| Total | 0 (0.0%) | 0 (0.0%) |
Employment Characteristics in Lincoln Beach
Employment by Class of Employer in Lincoln Beach
Among the 1,177 employed individuals in Lincoln Beach, private company employees (732 | 62.2%), local government employees (162 | 13.8%), and not-for-profit organizations (118 | 10.0%) make up the most common classes of employment.
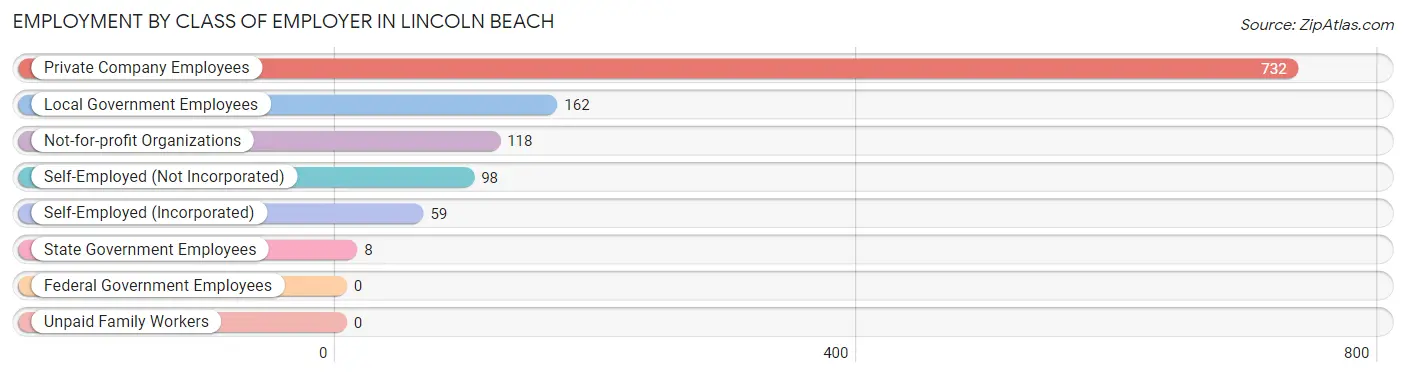
| Employer Class | # Employees | % Employees |
| Private Company Employees | 732 | 62.2% |
| Self-Employed (Incorporated) | 59 | 5.0% |
| Self-Employed (Not Incorporated) | 98 | 8.3% |
| Not-for-profit Organizations | 118 | 10.0% |
| Local Government Employees | 162 | 13.8% |
| State Government Employees | 8 | 0.7% |
| Federal Government Employees | 0 | 0.0% |
| Unpaid Family Workers | 0 | 0.0% |
| Total | 1,177 | 100.0% |
Employment Status by Age in Lincoln Beach
According to the labor force statistics for Lincoln Beach, out of the total population over 16 years of age (2,484), 50.9% or 1,264 individuals are in the labor force, with 3.6% or 46 of them unemployed. The age group with the highest labor force participation rate is 20 to 24 years, with 100.0% or 8 individuals in the labor force. Within the labor force, the 20 to 24 years age range has the highest percentage of unemployed individuals, with 100.0% or 8 of them being unemployed.
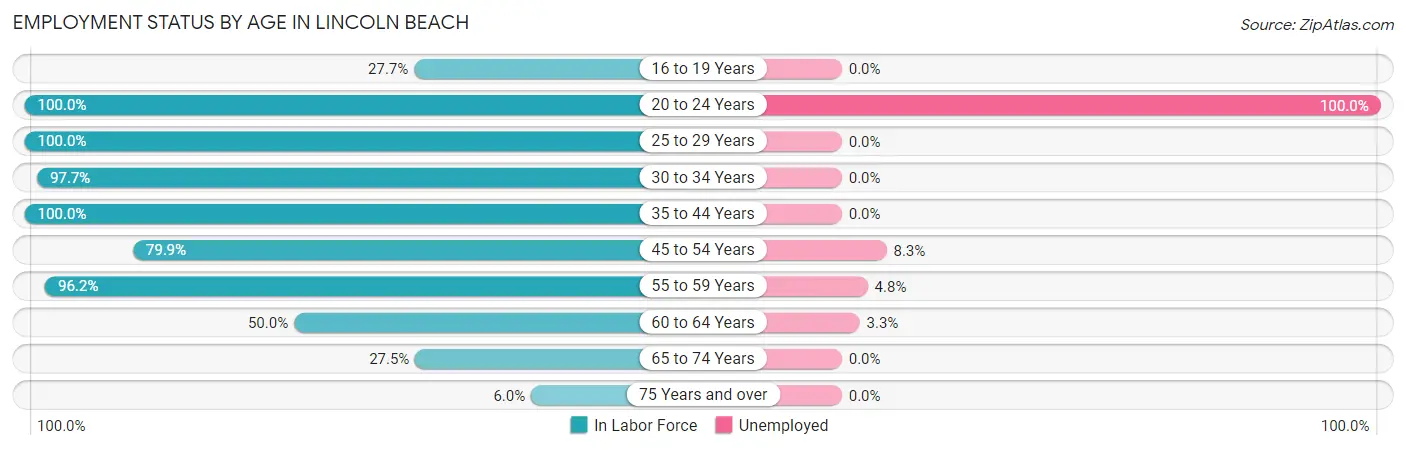
| Age Bracket | In Labor Force | Unemployed |
| 16 to 19 Years | 48 (27.7%) | 0 (0.0%) |
| 20 to 24 Years | 8 (100.0%) | 8 (100.0%) |
| 25 to 29 Years | 59 (100.0%) | 0 (0.0%) |
| 30 to 34 Years | 85 (97.7%) | 0 (0.0%) |
| 35 to 44 Years | 228 (100.0%) | 0 (0.0%) |
| 45 to 54 Years | 242 (79.9%) | 20 (8.3%) |
| 55 to 59 Years | 229 (96.2%) | 11 (4.8%) |
| 60 to 64 Years | 213 (50.0%) | 7 (3.3%) |
| 65 to 74 Years | 122 (27.5%) | 0 (0.0%) |
| 75 Years and over | 31 (6.0%) | 0 (0.0%) |
| Total | 1,264 (50.9%) | 46 (3.6%) |
Employment Status by Educational Attainment in Lincoln Beach
According to labor force statistics for Lincoln Beach, 78.7% of individuals (1,055) out of the total population between 25 and 64 years of age (1,341) are in the labor force, with 3.6% or 38 of them being unemployed. The group with the highest labor force participation rate are those with the educational attainment of less than high school, with 90.0% or 9 individuals in the labor force. Within the labor force, individuals with college / associate degree education have the highest percentage of unemployment, with 4.4% or 22 of them being unemployed.
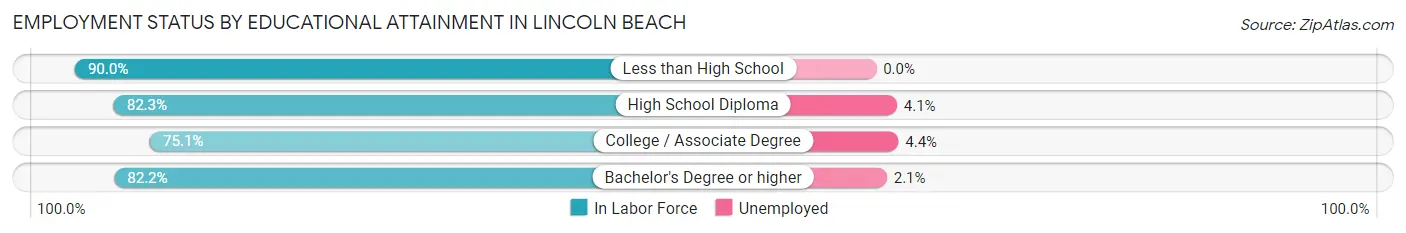
| Educational Attainment | In Labor Force | Unemployed |
| Less than High School | 9 (90.0%) | 0 (0.0%) |
| High School Diploma | 218 (82.3%) | 11 (4.1%) |
| College / Associate Degree | 501 (75.1%) | 29 (4.4%) |
| Bachelor's Degree or higher | 328 (82.2%) | 8 (2.1%) |
| Total | 1,055 (78.7%) | 48 (3.6%) |
Employment Occupations by Sex in Lincoln Beach
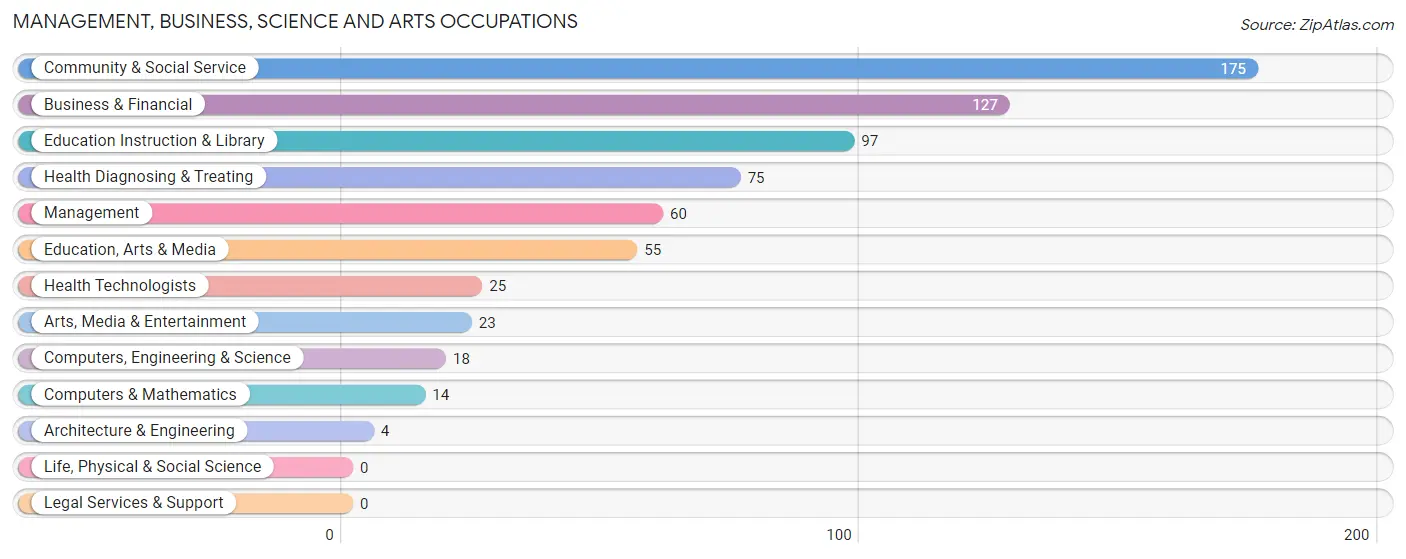
Management, Business, Science and Arts Occupations
The most common Management, Business, Science and Arts occupations in Lincoln Beach are Community & Social Service (175 | 14.4%), Business & Financial (127 | 10.4%), Education Instruction & Library (97 | 8.0%), Health Diagnosing & Treating (75 | 6.1%), and Management (60 | 4.9%).
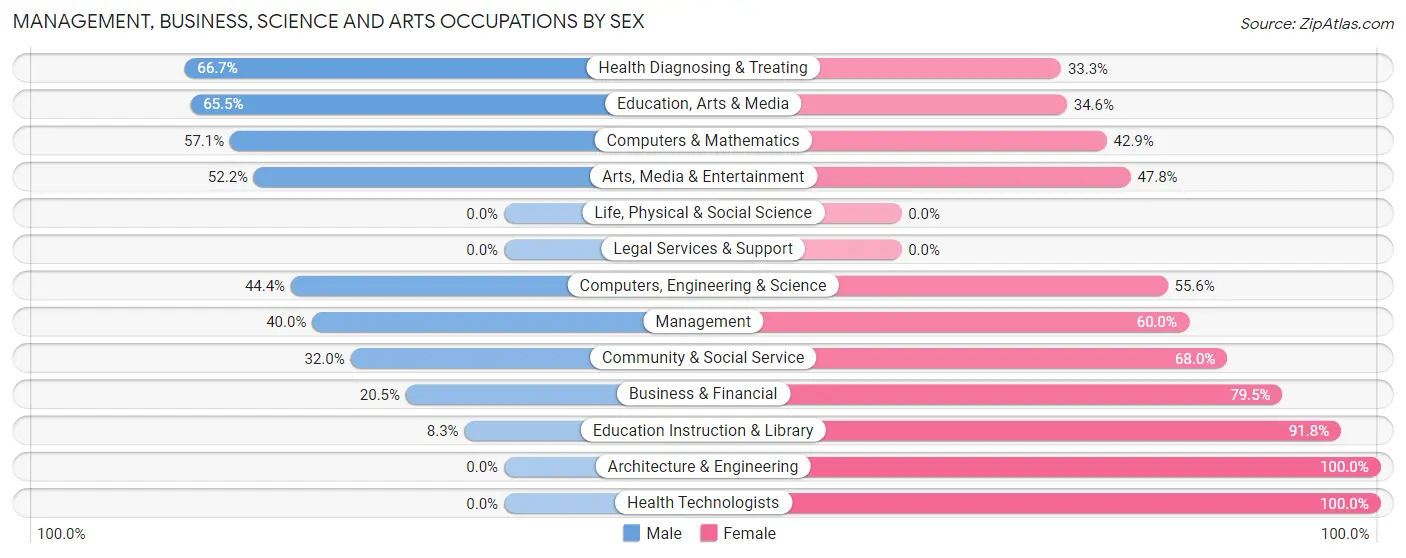
Management, Business, Science and Arts Occupations by Sex
Within the Management, Business, Science and Arts occupations in Lincoln Beach, the most male-oriented occupations are Health Diagnosing & Treating (66.7%), Education, Arts & Media (65.4%), and Computers & Mathematics (57.1%), while the most female-oriented occupations are Architecture & Engineering (100.0%), Health Technologists (100.0%), and Education Instruction & Library (91.7%).
| Occupation | Male | Female |
| Management | 24 (40.0%) | 36 (60.0%) |
| Business & Financial | 26 (20.5%) | 101 (79.5%) |
| Computers, Engineering & Science | 8 (44.4%) | 10 (55.6%) |
| Computers & Mathematics | 8 (57.1%) | 6 (42.9%) |
| Architecture & Engineering | 0 (0.0%) | 4 (100.0%) |
| Life, Physical & Social Science | 0 (0.0%) | 0 (0.0%) |
| Community & Social Service | 56 (32.0%) | 119 (68.0%) |
| Education, Arts & Media | 36 (65.4%) | 19 (34.5%) |
| Legal Services & Support | 0 (0.0%) | 0 (0.0%) |
| Education Instruction & Library | 8 (8.3%) | 89 (91.7%) |
| Arts, Media & Entertainment | 12 (52.2%) | 11 (47.8%) |
| Health Diagnosing & Treating | 50 (66.7%) | 25 (33.3%) |
| Health Technologists | 0 (0.0%) | 25 (100.0%) |
| Total (Category) | 164 (36.0%) | 291 (64.0%) |
| Total (Overall) | 559 (45.9%) | 660 (54.1%) |
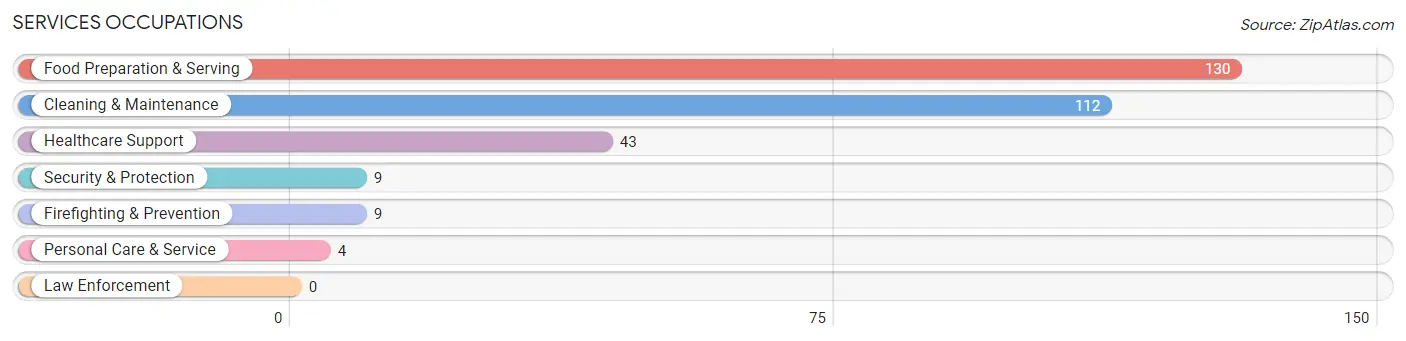
Services Occupations
The most common Services occupations in Lincoln Beach are Food Preparation & Serving (130 | 10.7%), Cleaning & Maintenance (112 | 9.2%), Healthcare Support (43 | 3.5%), Security & Protection (9 | 0.7%), and Firefighting & Prevention (9 | 0.7%).
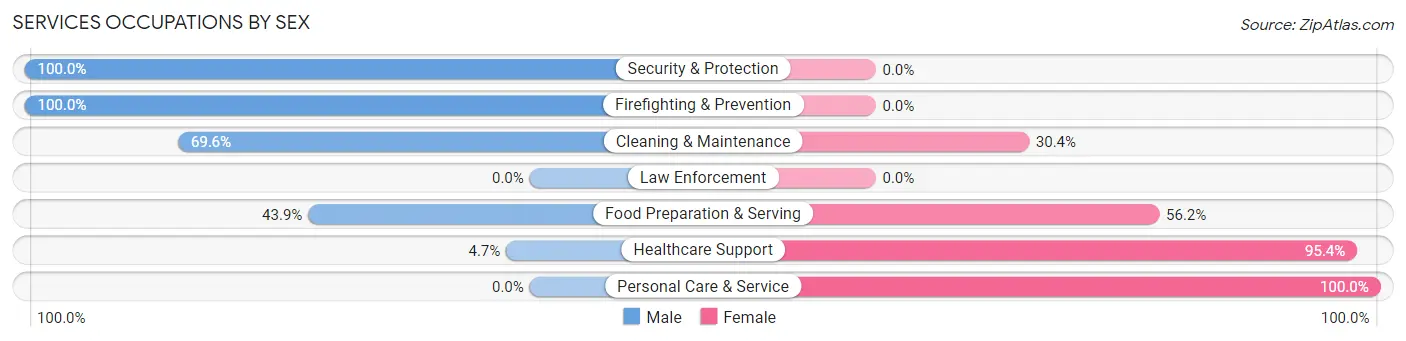
Services Occupations by Sex
Within the Services occupations in Lincoln Beach, the most male-oriented occupations are Security & Protection (100.0%), Firefighting & Prevention (100.0%), and Cleaning & Maintenance (69.6%), while the most female-oriented occupations are Personal Care & Service (100.0%), Healthcare Support (95.4%), and Food Preparation & Serving (56.1%).
| Occupation | Male | Female |
| Healthcare Support | 2 (4.6%) | 41 (95.4%) |
| Security & Protection | 9 (100.0%) | 0 (0.0%) |
| Firefighting & Prevention | 9 (100.0%) | 0 (0.0%) |
| Law Enforcement | 0 (0.0%) | 0 (0.0%) |
| Food Preparation & Serving | 57 (43.9%) | 73 (56.1%) |
| Cleaning & Maintenance | 78 (69.6%) | 34 (30.4%) |
| Personal Care & Service | 0 (0.0%) | 4 (100.0%) |
| Total (Category) | 146 (49.0%) | 152 (51.0%) |
| Total (Overall) | 559 (45.9%) | 660 (54.1%) |
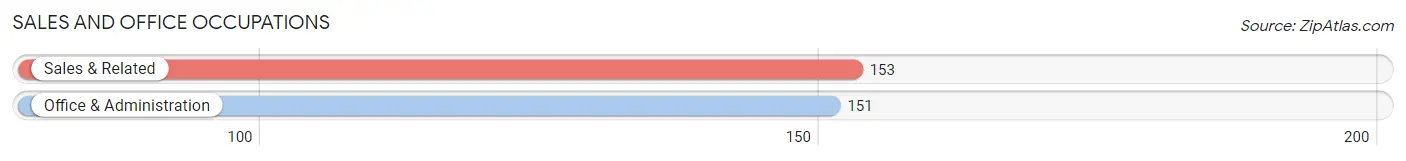
Sales and Office Occupations
The most common Sales and Office occupations in Lincoln Beach are Sales & Related (153 | 12.6%), and Office & Administration (151 | 12.4%).
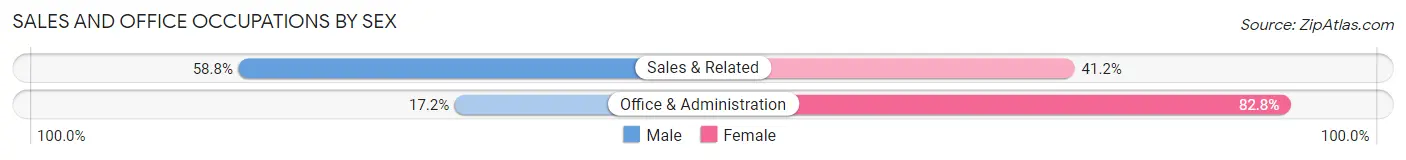
Sales and Office Occupations by Sex
| Occupation | Male | Female |
| Sales & Related | 90 (58.8%) | 63 (41.2%) |
| Office & Administration | 26 (17.2%) | 125 (82.8%) |
| Total (Category) | 116 (38.2%) | 188 (61.8%) |
| Total (Overall) | 559 (45.9%) | 660 (54.1%) |
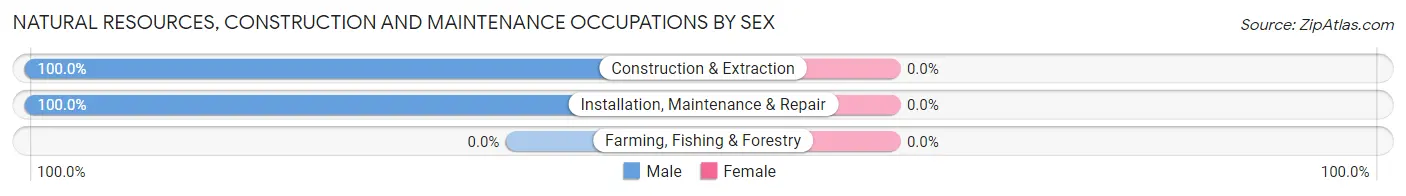
Natural Resources, Construction and Maintenance Occupations
The most common Natural Resources, Construction and Maintenance occupations in Lincoln Beach are Construction & Extraction (46 | 3.8%), and Installation, Maintenance & Repair (27 | 2.2%).

Natural Resources, Construction and Maintenance Occupations by Sex
| Occupation | Male | Female |
| Farming, Fishing & Forestry | 0 (0.0%) | 0 (0.0%) |
| Construction & Extraction | 46 (100.0%) | 0 (0.0%) |
| Installation, Maintenance & Repair | 27 (100.0%) | 0 (0.0%) |
| Total (Category) | 73 (100.0%) | 0 (0.0%) |
| Total (Overall) | 559 (45.9%) | 660 (54.1%) |
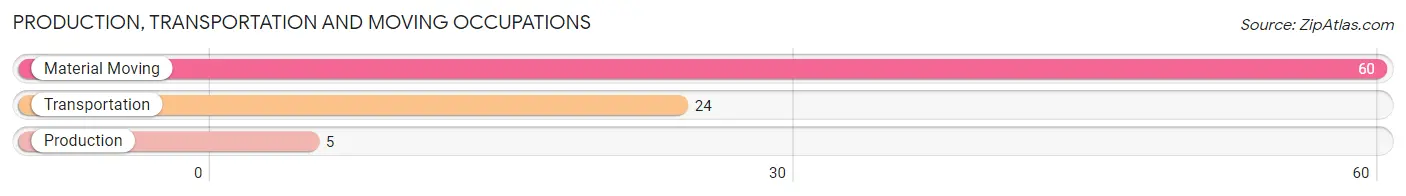
Production, Transportation and Moving Occupations
The most common Production, Transportation and Moving occupations in Lincoln Beach are Material Moving (60 | 4.9%), Transportation (24 | 2.0%), and Production (5 | 0.4%).
Production, Transportation and Moving Occupations by Sex
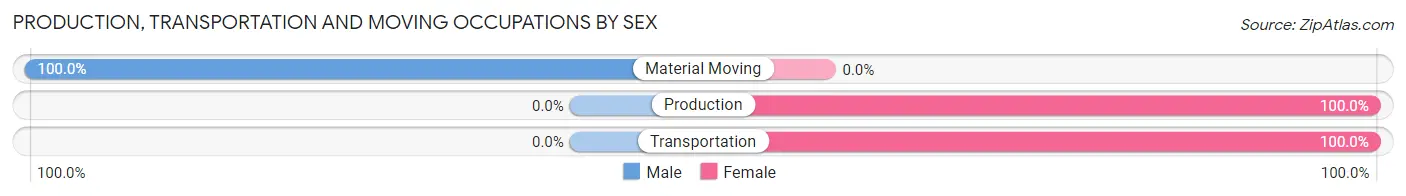
| Occupation | Male | Female |
| Production | 0 (0.0%) | 5 (100.0%) |
| Transportation | 0 (0.0%) | 24 (100.0%) |
| Material Moving | 60 (100.0%) | 0 (0.0%) |
| Total (Category) | 60 (67.4%) | 29 (32.6%) |
| Total (Overall) | 559 (45.9%) | 660 (54.1%) |
Employment Industries by Sex in Lincoln Beach
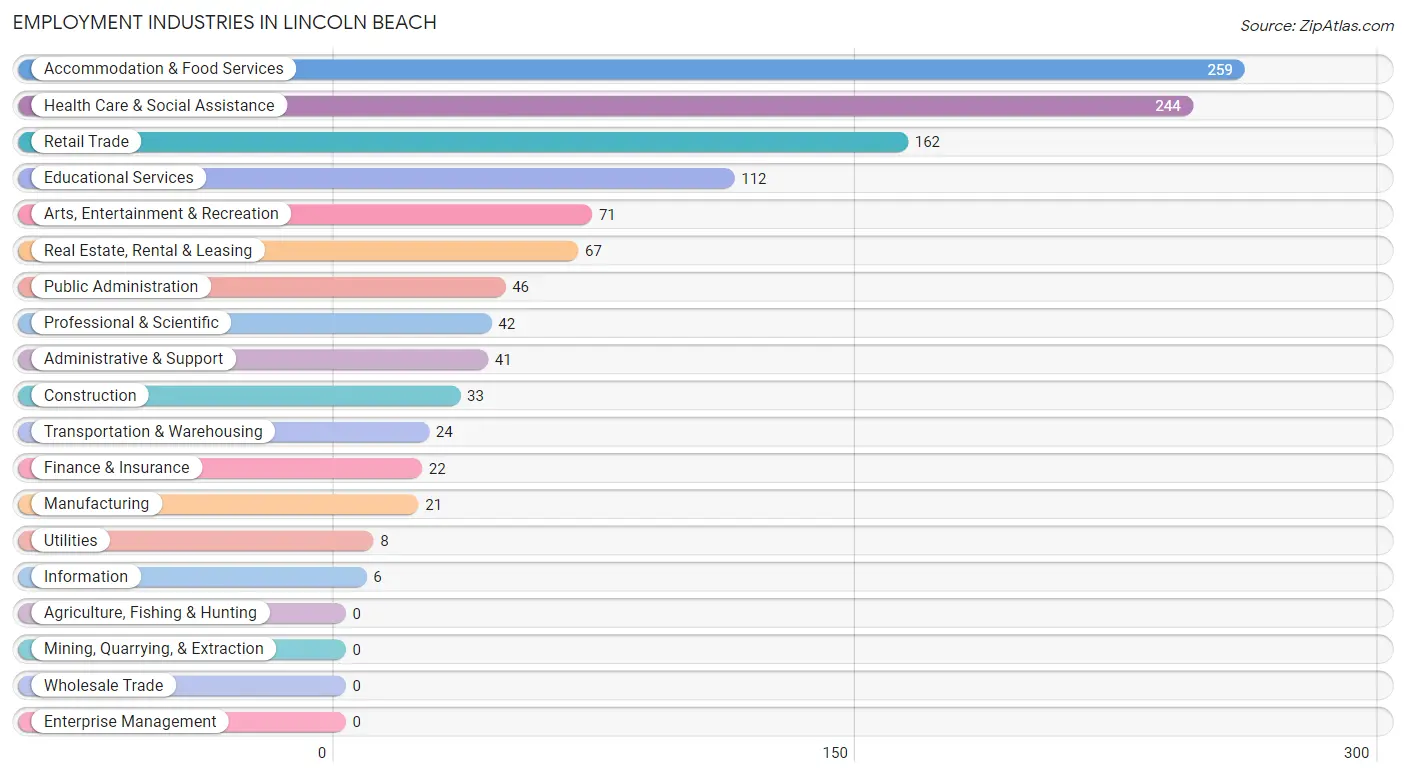
Employment Industries in Lincoln Beach
The major employment industries in Lincoln Beach include Accommodation & Food Services (259 | 21.2%), Health Care & Social Assistance (244 | 20.0%), Retail Trade (162 | 13.3%), Educational Services (112 | 9.2%), and Arts, Entertainment & Recreation (71 | 5.8%).
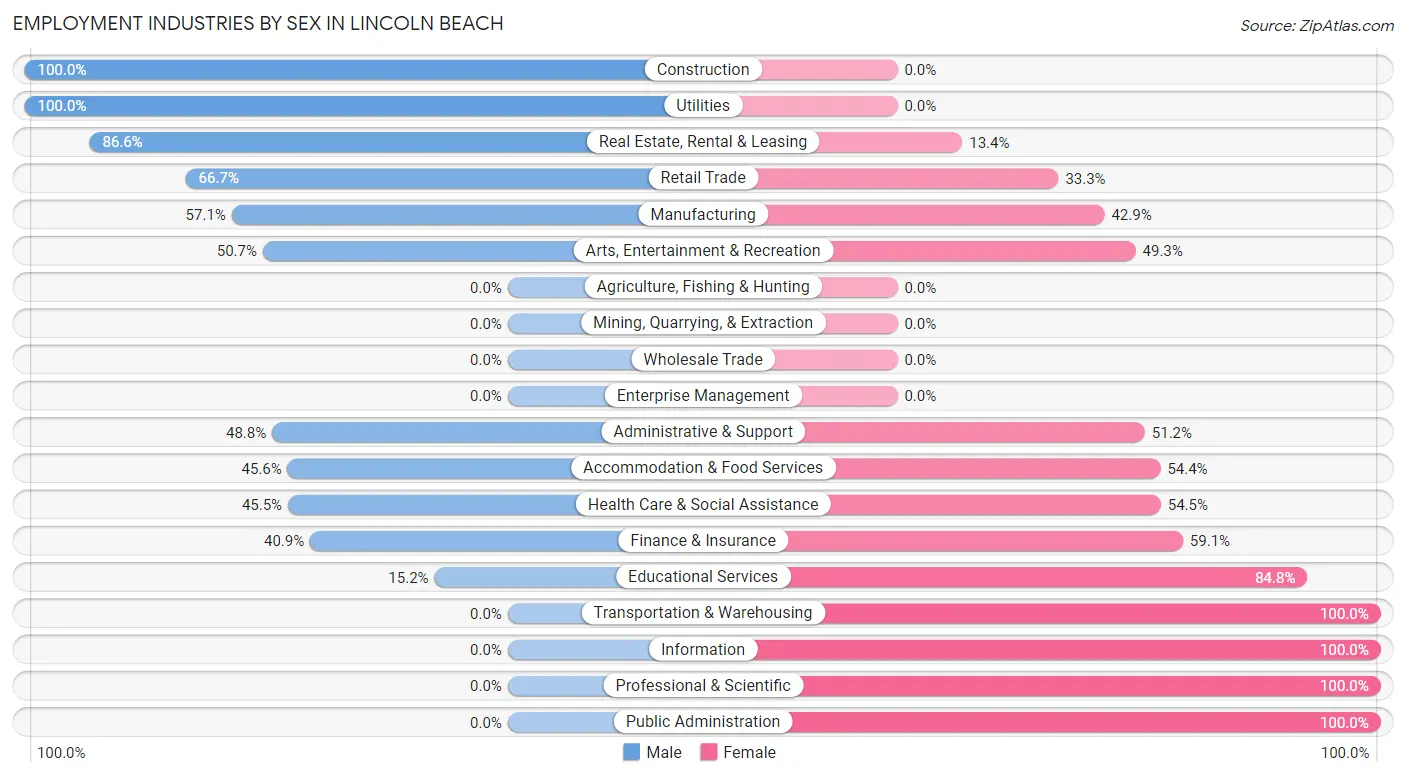
Employment Industries by Sex in Lincoln Beach
The Lincoln Beach industries that see more men than women are Construction (100.0%), Utilities (100.0%), and Real Estate, Rental & Leasing (86.6%), whereas the industries that tend to have a higher number of women are Transportation & Warehousing (100.0%), Information (100.0%), and Professional & Scientific (100.0%).
| Industry | Male | Female |
| Agriculture, Fishing & Hunting | 0 (0.0%) | 0 (0.0%) |
| Mining, Quarrying, & Extraction | 0 (0.0%) | 0 (0.0%) |
| Construction | 33 (100.0%) | 0 (0.0%) |
| Manufacturing | 12 (57.1%) | 9 (42.9%) |
| Wholesale Trade | 0 (0.0%) | 0 (0.0%) |
| Retail Trade | 108 (66.7%) | 54 (33.3%) |
| Transportation & Warehousing | 0 (0.0%) | 24 (100.0%) |
| Utilities | 8 (100.0%) | 0 (0.0%) |
| Information | 0 (0.0%) | 6 (100.0%) |
| Finance & Insurance | 9 (40.9%) | 13 (59.1%) |
| Real Estate, Rental & Leasing | 58 (86.6%) | 9 (13.4%) |
| Professional & Scientific | 0 (0.0%) | 42 (100.0%) |
| Enterprise Management | 0 (0.0%) | 0 (0.0%) |
| Administrative & Support | 20 (48.8%) | 21 (51.2%) |
| Educational Services | 17 (15.2%) | 95 (84.8%) |
| Health Care & Social Assistance | 111 (45.5%) | 133 (54.5%) |
| Arts, Entertainment & Recreation | 36 (50.7%) | 35 (49.3%) |
| Accommodation & Food Services | 118 (45.6%) | 141 (54.4%) |
| Public Administration | 0 (0.0%) | 46 (100.0%) |
| Total | 559 (45.9%) | 660 (54.1%) |
Education in Lincoln Beach
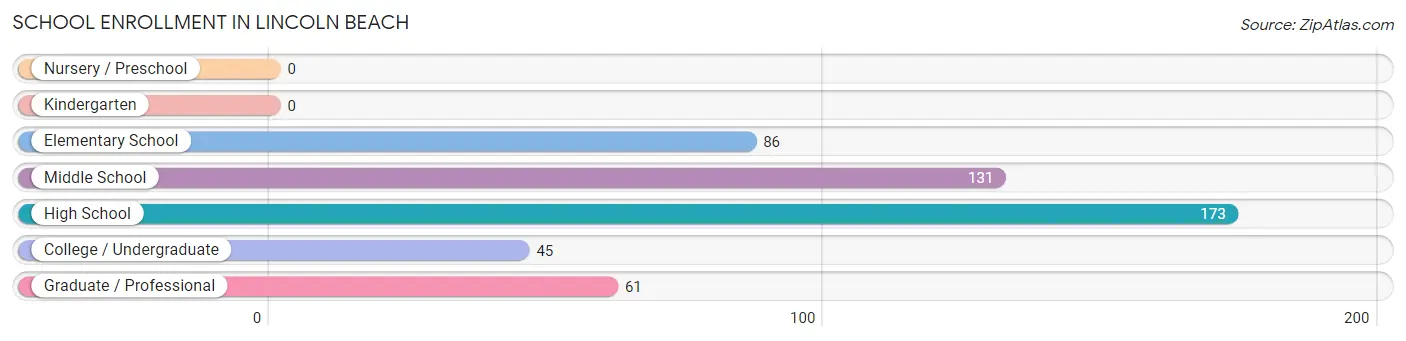
School Enrollment in Lincoln Beach
The most common levels of schooling among the 496 students in Lincoln Beach are high school (173 | 34.9%), middle school (131 | 26.4%), and elementary school (86 | 17.3%).
| School Level | # Students | % Students |
| Nursery / Preschool | 0 | 0.0% |
| Kindergarten | 0 | 0.0% |
| Elementary School | 86 | 17.3% |
| Middle School | 131 | 26.4% |
| High School | 173 | 34.9% |
| College / Undergraduate | 45 | 9.1% |
| Graduate / Professional | 61 | 12.3% |
| Total | 496 | 100.0% |
School Enrollment by Age by Funding Source in Lincoln Beach
Out of a total of 496 students who are enrolled in schools in Lincoln Beach, 165 (33.3%) attend a private institution, while the remaining 331 (66.7%) are enrolled in public schools. The age group of 35 years and over has the highest likelihood of being enrolled in private schools, with 45 (100.0% in the age bracket) enrolled. Conversely, the age group of 15 to 17 year olds has the lowest likelihood of being enrolled in a private school, with 173 (100.0% in the age bracket) attending a public institution.
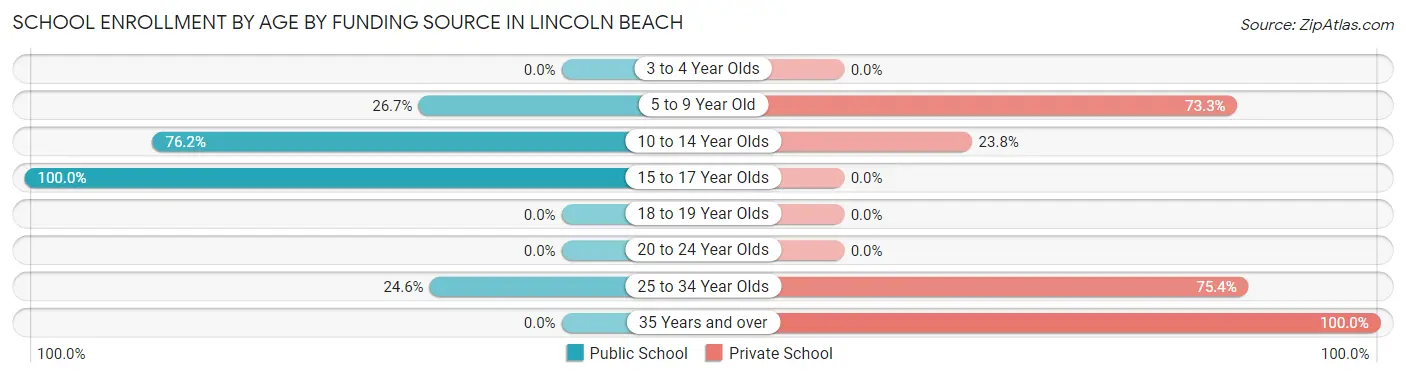
| Age Bracket | Public School | Private School |
| 3 to 4 Year Olds | 0 (0.0%) | 0 (0.0%) |
| 5 to 9 Year Old | 12 (26.7%) | 33 (73.3%) |
| 10 to 14 Year Olds | 131 (76.2%) | 41 (23.8%) |
| 15 to 17 Year Olds | 173 (100.0%) | 0 (0.0%) |
| 18 to 19 Year Olds | 0 (0.0%) | 0 (0.0%) |
| 20 to 24 Year Olds | 0 (0.0%) | 0 (0.0%) |
| 25 to 34 Year Olds | 15 (24.6%) | 46 (75.4%) |
| 35 Years and over | 0 (0.0%) | 45 (100.0%) |
| Total | 331 (66.7%) | 165 (33.3%) |
Educational Attainment by Field of Study in Lincoln Beach
Education (127 | 15.7%), business (87 | 10.7%), psychology (83 | 10.2%), science & technology (79 | 9.8%), and literature & languages (73 | 9.0%) are the most common fields of study among 810 individuals in Lincoln Beach who have obtained a bachelor's degree or higher.
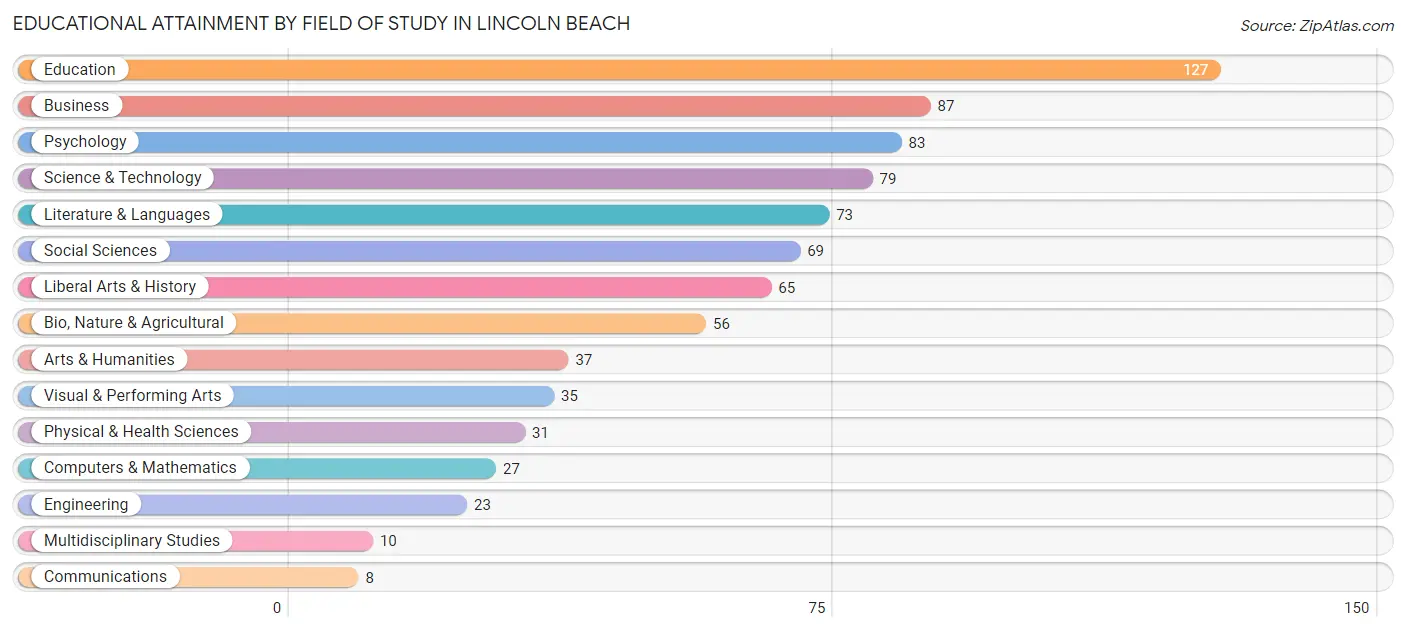
| Field of Study | # Graduates | % Graduates |
| Computers & Mathematics | 27 | 3.3% |
| Bio, Nature & Agricultural | 56 | 6.9% |
| Physical & Health Sciences | 31 | 3.8% |
| Psychology | 83 | 10.2% |
| Social Sciences | 69 | 8.5% |
| Engineering | 23 | 2.8% |
| Multidisciplinary Studies | 10 | 1.2% |
| Science & Technology | 79 | 9.8% |
| Business | 87 | 10.7% |
| Education | 127 | 15.7% |
| Literature & Languages | 73 | 9.0% |
| Liberal Arts & History | 65 | 8.0% |
| Visual & Performing Arts | 35 | 4.3% |
| Communications | 8 | 1.0% |
| Arts & Humanities | 37 | 4.6% |
| Total | 810 | 100.0% |
Transportation & Commute in Lincoln Beach
Vehicle Availability by Sex in Lincoln Beach
The most prevalent vehicle ownership categories in Lincoln Beach are males with 2 vehicles (232, accounting for 44.2%) and females with 2 vehicles (350, making up 35.6%).
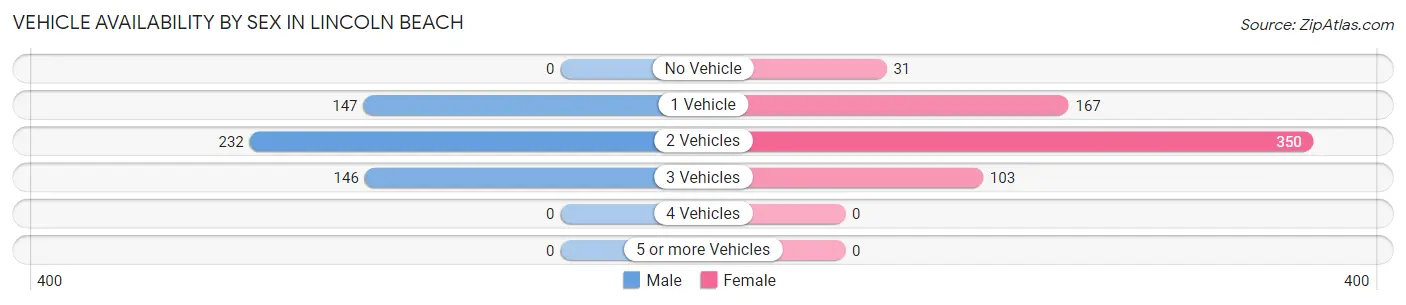
| Vehicles Available | Male | Female |
| No Vehicle | 0 (0.0%) | 31 (4.8%) |
| 1 Vehicle | 147 (28.0%) | 167 (25.7%) |
| 2 Vehicles | 232 (44.2%) | 350 (53.8%) |
| 3 Vehicles | 146 (27.8%) | 103 (15.8%) |
| 4 Vehicles | 0 (0.0%) | 0 (0.0%) |
| 5 or more Vehicles | 0 (0.0%) | 0 (0.0%) |
| Total | 525 (100.0%) | 651 (100.0%) |
Commute Time in Lincoln Beach
The most frequently occuring commute durations in Lincoln Beach are 30 to 34 minutes (177 commuters, 18.5%), 20 to 24 minutes (169 commuters, 17.7%), and 15 to 19 minutes (138 commuters, 14.4%).
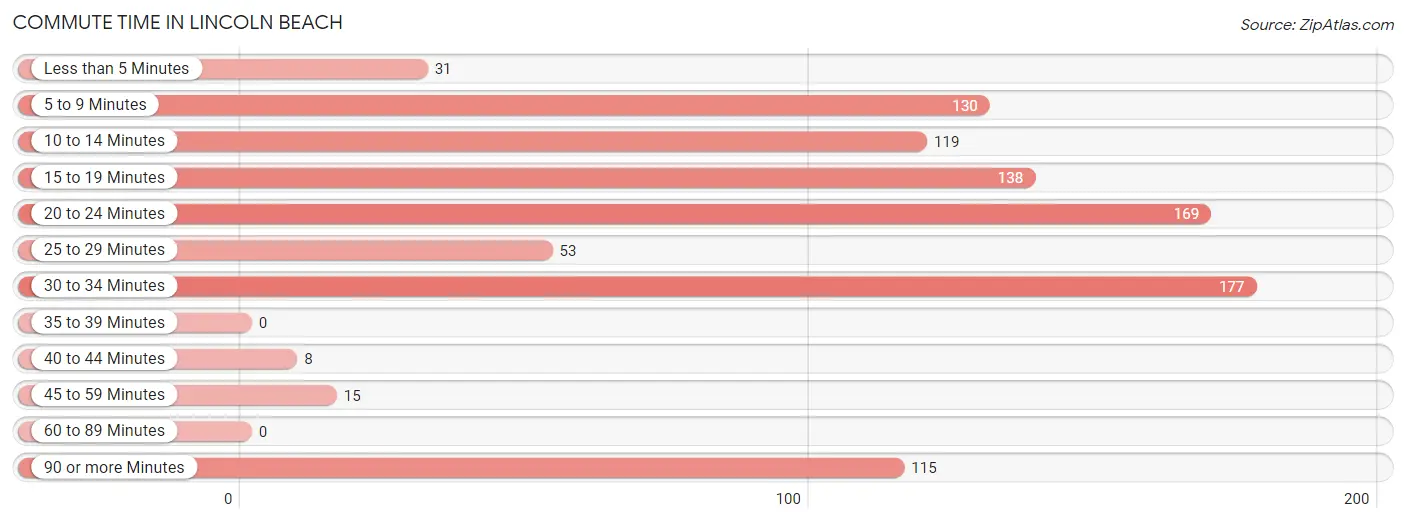
| Commute Time | # Commuters | % Commuters |
| Less than 5 Minutes | 31 | 3.3% |
| 5 to 9 Minutes | 130 | 13.6% |
| 10 to 14 Minutes | 119 | 12.5% |
| 15 to 19 Minutes | 138 | 14.4% |
| 20 to 24 Minutes | 169 | 17.7% |
| 25 to 29 Minutes | 53 | 5.6% |
| 30 to 34 Minutes | 177 | 18.5% |
| 35 to 39 Minutes | 0 | 0.0% |
| 40 to 44 Minutes | 8 | 0.8% |
| 45 to 59 Minutes | 15 | 1.6% |
| 60 to 89 Minutes | 0 | 0.0% |
| 90 or more Minutes | 115 | 12.0% |
Commute Time by Sex in Lincoln Beach
The most common commute times in Lincoln Beach are 20 to 24 minutes (95 commuters, 23.6%) for males and 5 to 9 minutes (117 commuters, 21.2%) for females.
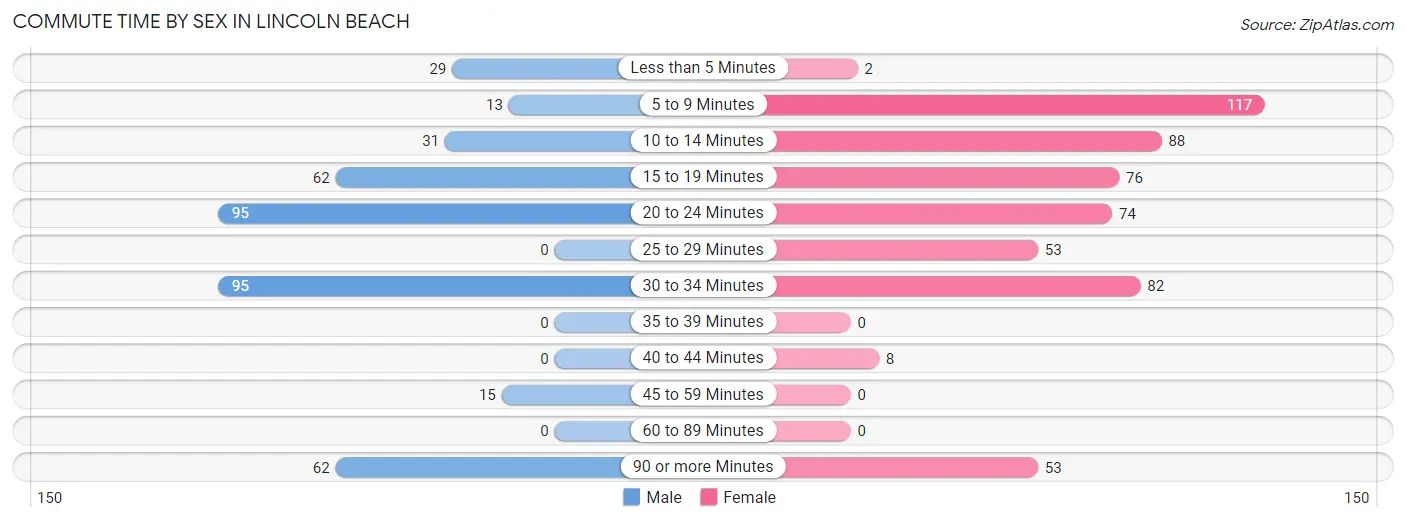
| Commute Time | Male | Female |
| Less than 5 Minutes | 29 (7.2%) | 2 (0.4%) |
| 5 to 9 Minutes | 13 (3.2%) | 117 (21.2%) |
| 10 to 14 Minutes | 31 (7.7%) | 88 (15.9%) |
| 15 to 19 Minutes | 62 (15.4%) | 76 (13.7%) |
| 20 to 24 Minutes | 95 (23.6%) | 74 (13.4%) |
| 25 to 29 Minutes | 0 (0.0%) | 53 (9.6%) |
| 30 to 34 Minutes | 95 (23.6%) | 82 (14.8%) |
| 35 to 39 Minutes | 0 (0.0%) | 0 (0.0%) |
| 40 to 44 Minutes | 0 (0.0%) | 8 (1.5%) |
| 45 to 59 Minutes | 15 (3.7%) | 0 (0.0%) |
| 60 to 89 Minutes | 0 (0.0%) | 0 (0.0%) |
| 90 or more Minutes | 62 (15.4%) | 53 (9.6%) |
Time of Departure to Work by Sex in Lincoln Beach
The most frequent times of departure to work in Lincoln Beach are 8:00 AM to 8:29 AM (104, 25.9%) for males and 7:00 AM to 7:29 AM (174, 31.5%) for females.
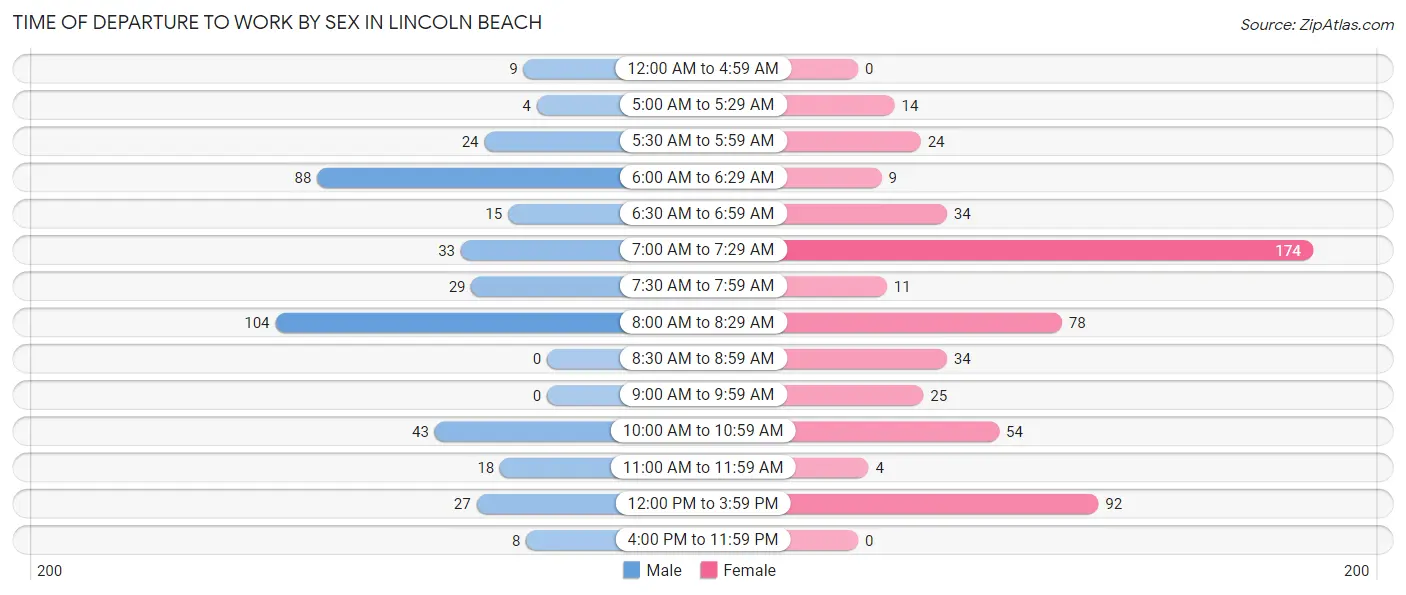
| Time of Departure | Male | Female |
| 12:00 AM to 4:59 AM | 9 (2.2%) | 0 (0.0%) |
| 5:00 AM to 5:29 AM | 4 (1.0%) | 14 (2.5%) |
| 5:30 AM to 5:59 AM | 24 (6.0%) | 24 (4.3%) |
| 6:00 AM to 6:29 AM | 88 (21.9%) | 9 (1.6%) |
| 6:30 AM to 6:59 AM | 15 (3.7%) | 34 (6.1%) |
| 7:00 AM to 7:29 AM | 33 (8.2%) | 174 (31.5%) |
| 7:30 AM to 7:59 AM | 29 (7.2%) | 11 (2.0%) |
| 8:00 AM to 8:29 AM | 104 (25.9%) | 78 (14.1%) |
| 8:30 AM to 8:59 AM | 0 (0.0%) | 34 (6.1%) |
| 9:00 AM to 9:59 AM | 0 (0.0%) | 25 (4.5%) |
| 10:00 AM to 10:59 AM | 43 (10.7%) | 54 (9.8%) |
| 11:00 AM to 11:59 AM | 18 (4.5%) | 4 (0.7%) |
| 12:00 PM to 3:59 PM | 27 (6.7%) | 92 (16.6%) |
| 4:00 PM to 11:59 PM | 8 (2.0%) | 0 (0.0%) |
| Total | 402 (100.0%) | 553 (100.0%) |
Housing Occupancy in Lincoln Beach
Occupancy by Ownership in Lincoln Beach
Of the total 1,358 dwellings in Lincoln Beach, owner-occupied units account for 1,130 (83.2%), while renter-occupied units make up 228 (16.8%).
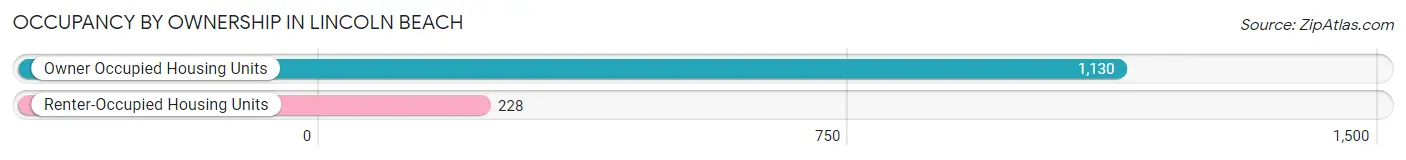
| Occupancy | # Housing Units | % Housing Units |
| Owner Occupied Housing Units | 1,130 | 83.2% |
| Renter-Occupied Housing Units | 228 | 16.8% |
| Total Occupied Housing Units | 1,358 | 100.0% |
Occupancy by Household Size in Lincoln Beach
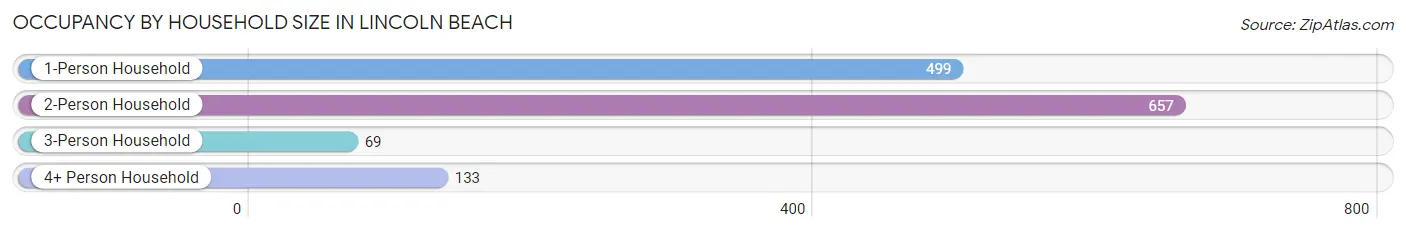
| Household Size | # Housing Units | % Housing Units |
| 1-Person Household | 499 | 36.7% |
| 2-Person Household | 657 | 48.4% |
| 3-Person Household | 69 | 5.1% |
| 4+ Person Household | 133 | 9.8% |
| Total Housing Units | 1,358 | 100.0% |
Occupancy by Ownership by Household Size in Lincoln Beach
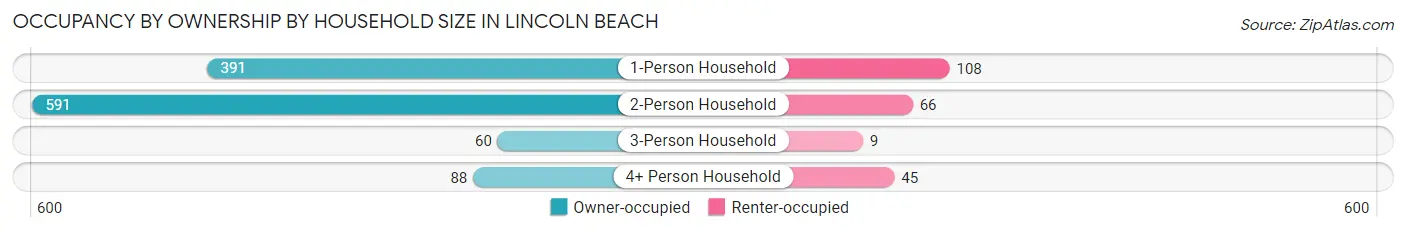
| Household Size | Owner-occupied | Renter-occupied |
| 1-Person Household | 391 (78.4%) | 108 (21.6%) |
| 2-Person Household | 591 (89.9%) | 66 (10.1%) |
| 3-Person Household | 60 (87.0%) | 9 (13.0%) |
| 4+ Person Household | 88 (66.2%) | 45 (33.8%) |
| Total Housing Units | 1,130 (83.2%) | 228 (16.8%) |
Occupancy by Educational Attainment in Lincoln Beach
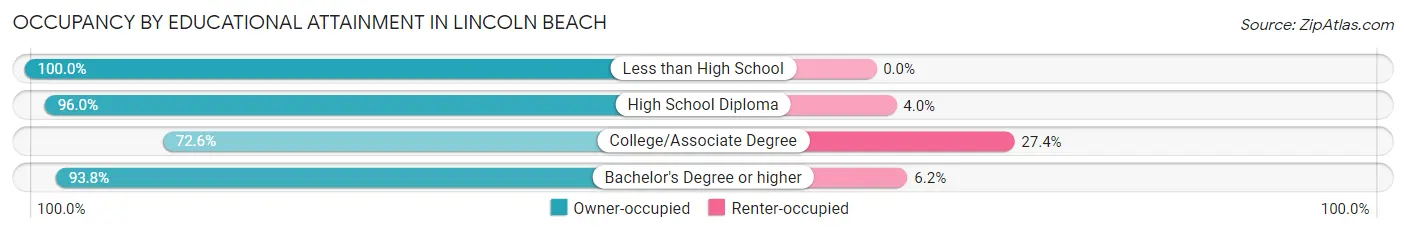
| Household Size | Owner-occupied | Renter-occupied |
| Less than High School | 9 (100.0%) | 0 (0.0%) |
| High School Diploma | 216 (96.0%) | 9 (4.0%) |
| College/Associate Degree | 511 (72.6%) | 193 (27.4%) |
| Bachelor's Degree or higher | 394 (93.8%) | 26 (6.2%) |
Occupancy by Age of Householder in Lincoln Beach
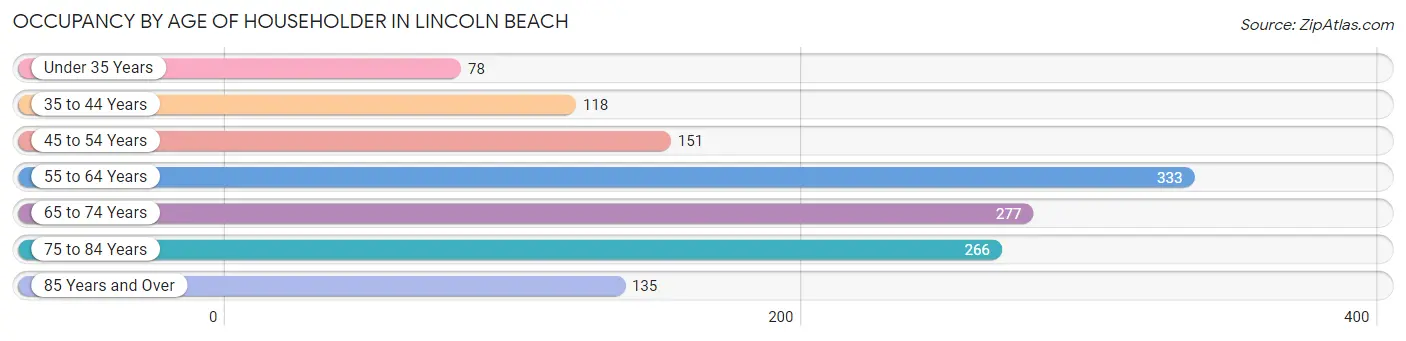
| Age Bracket | # Households | % Households |
| Under 35 Years | 78 | 5.7% |
| 35 to 44 Years | 118 | 8.7% |
| 45 to 54 Years | 151 | 11.1% |
| 55 to 64 Years | 333 | 24.5% |
| 65 to 74 Years | 277 | 20.4% |
| 75 to 84 Years | 266 | 19.6% |
| 85 Years and Over | 135 | 9.9% |
| Total | 1,358 | 100.0% |
Housing Finances in Lincoln Beach
Median Income by Occupancy in Lincoln Beach
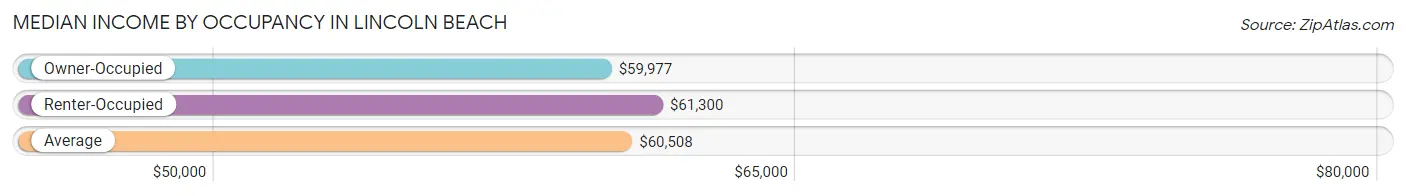
| Occupancy Type | # Households | Median Income |
| Owner-Occupied | 1,130 (83.2%) | $59,977 |
| Renter-Occupied | 228 (16.8%) | $61,300 |
| Average | 1,358 (100.0%) | $60,508 |
Occupancy by Householder Income Bracket in Lincoln Beach
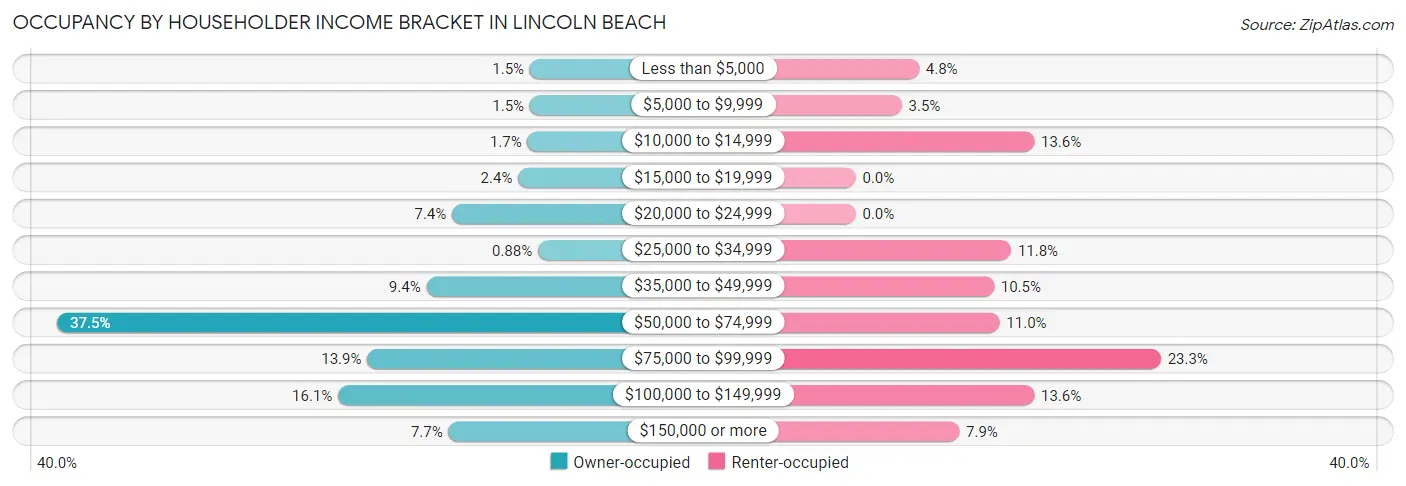
| Income Bracket | Owner-occupied | Renter-occupied |
| Less than $5,000 | 17 (1.5%) | 11 (4.8%) |
| $5,000 to $9,999 | 17 (1.5%) | 8 (3.5%) |
| $10,000 to $14,999 | 19 (1.7%) | 31 (13.6%) |
| $15,000 to $19,999 | 27 (2.4%) | 0 (0.0%) |
| $20,000 to $24,999 | 84 (7.4%) | 0 (0.0%) |
| $25,000 to $34,999 | 10 (0.9%) | 27 (11.8%) |
| $35,000 to $49,999 | 106 (9.4%) | 24 (10.5%) |
| $50,000 to $74,999 | 424 (37.5%) | 25 (11.0%) |
| $75,000 to $99,999 | 157 (13.9%) | 53 (23.3%) |
| $100,000 to $149,999 | 182 (16.1%) | 31 (13.6%) |
| $150,000 or more | 87 (7.7%) | 18 (7.9%) |
| Total | 1,130 (100.0%) | 228 (100.0%) |
Monthly Housing Cost Tiers in Lincoln Beach
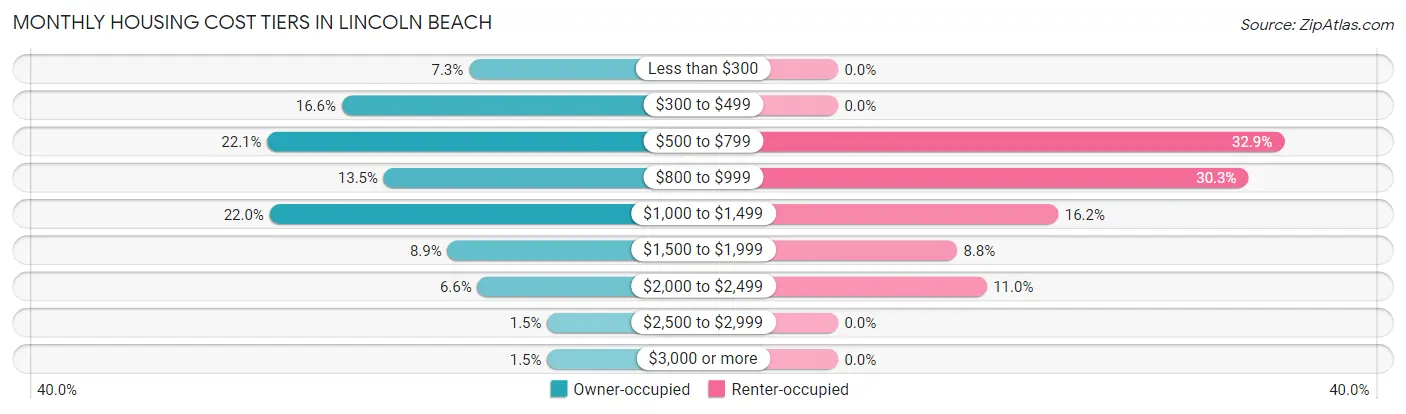
| Monthly Cost | Owner-occupied | Renter-occupied |
| Less than $300 | 82 (7.3%) | 0 (0.0%) |
| $300 to $499 | 188 (16.6%) | 0 (0.0%) |
| $500 to $799 | 250 (22.1%) | 75 (32.9%) |
| $800 to $999 | 153 (13.5%) | 69 (30.3%) |
| $1,000 to $1,499 | 248 (22.0%) | 37 (16.2%) |
| $1,500 to $1,999 | 100 (8.8%) | 20 (8.8%) |
| $2,000 to $2,499 | 75 (6.6%) | 25 (11.0%) |
| $2,500 to $2,999 | 17 (1.5%) | 0 (0.0%) |
| $3,000 or more | 17 (1.5%) | 0 (0.0%) |
| Total | 1,130 (100.0%) | 228 (100.0%) |
Physical Housing Characteristics in Lincoln Beach
Housing Structures in Lincoln Beach
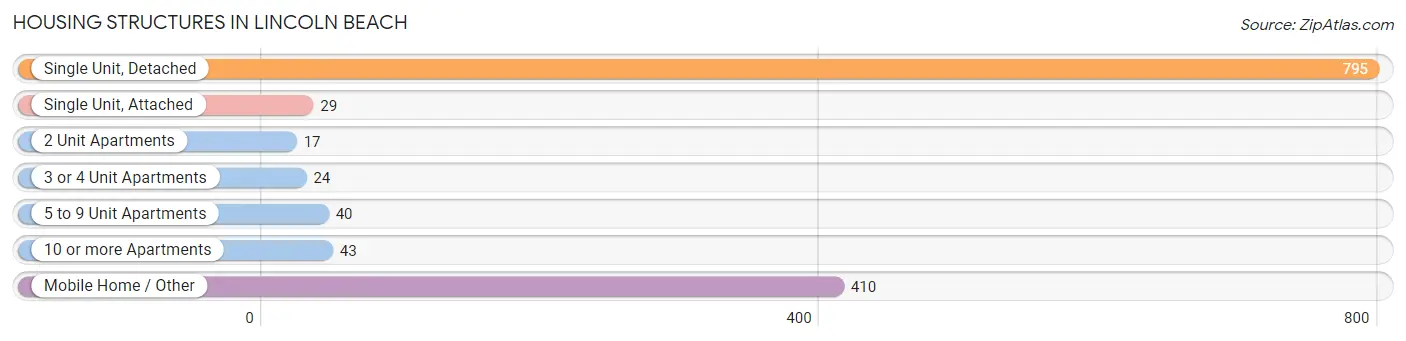
| Structure Type | # Housing Units | % Housing Units |
| Single Unit, Detached | 795 | 58.5% |
| Single Unit, Attached | 29 | 2.1% |
| 2 Unit Apartments | 17 | 1.3% |
| 3 or 4 Unit Apartments | 24 | 1.8% |
| 5 to 9 Unit Apartments | 40 | 2.9% |
| 10 or more Apartments | 43 | 3.2% |
| Mobile Home / Other | 410 | 30.2% |
| Total | 1,358 | 100.0% |
Housing Structures by Occupancy in Lincoln Beach
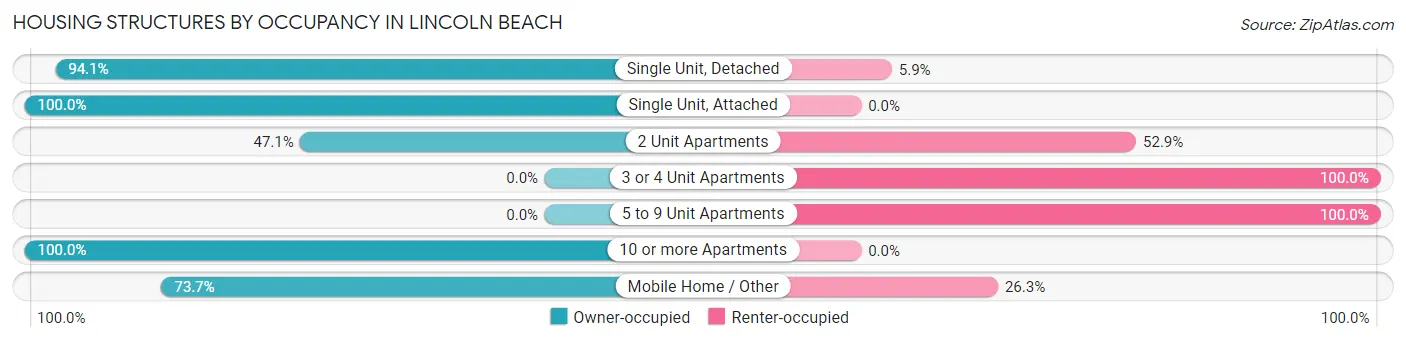
| Structure Type | Owner-occupied | Renter-occupied |
| Single Unit, Detached | 748 (94.1%) | 47 (5.9%) |
| Single Unit, Attached | 29 (100.0%) | 0 (0.0%) |
| 2 Unit Apartments | 8 (47.1%) | 9 (52.9%) |
| 3 or 4 Unit Apartments | 0 (0.0%) | 24 (100.0%) |
| 5 to 9 Unit Apartments | 0 (0.0%) | 40 (100.0%) |
| 10 or more Apartments | 43 (100.0%) | 0 (0.0%) |
| Mobile Home / Other | 302 (73.7%) | 108 (26.3%) |
| Total | 1,130 (83.2%) | 228 (16.8%) |
Housing Structures by Number of Rooms in Lincoln Beach
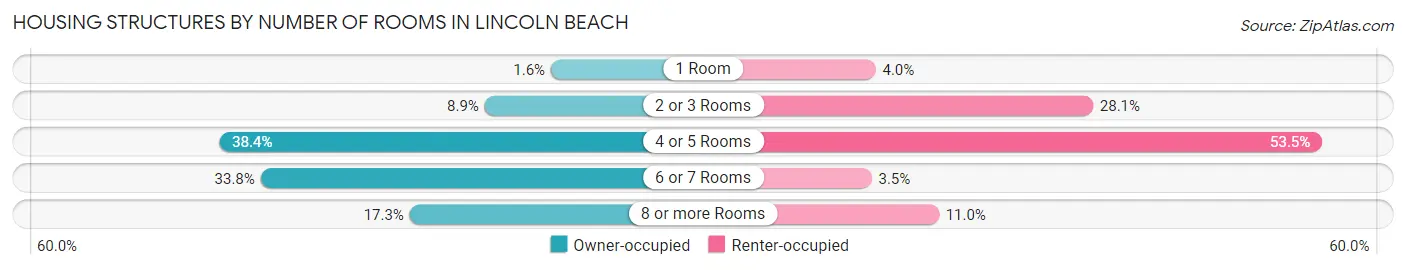
| Number of Rooms | Owner-occupied | Renter-occupied |
| 1 Room | 18 (1.6%) | 9 (4.0%) |
| 2 or 3 Rooms | 101 (8.9%) | 64 (28.1%) |
| 4 or 5 Rooms | 434 (38.4%) | 122 (53.5%) |
| 6 or 7 Rooms | 382 (33.8%) | 8 (3.5%) |
| 8 or more Rooms | 195 (17.3%) | 25 (11.0%) |
| Total | 1,130 (100.0%) | 228 (100.0%) |
Housing Structure by Heating Type in Lincoln Beach
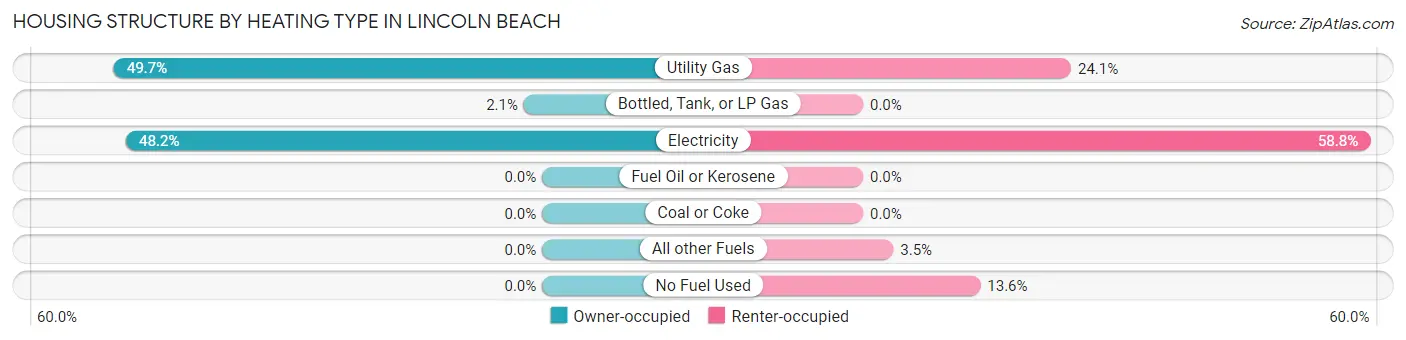
| Heating Type | Owner-occupied | Renter-occupied |
| Utility Gas | 561 (49.6%) | 55 (24.1%) |
| Bottled, Tank, or LP Gas | 24 (2.1%) | 0 (0.0%) |
| Electricity | 545 (48.2%) | 134 (58.8%) |
| Fuel Oil or Kerosene | 0 (0.0%) | 0 (0.0%) |
| Coal or Coke | 0 (0.0%) | 0 (0.0%) |
| All other Fuels | 0 (0.0%) | 8 (3.5%) |
| No Fuel Used | 0 (0.0%) | 31 (13.6%) |
| Total | 1,130 (100.0%) | 228 (100.0%) |
Household Vehicle Usage in Lincoln Beach
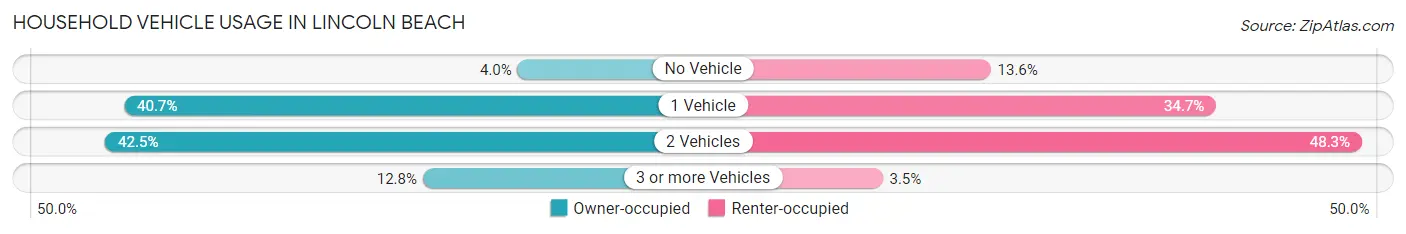
| Vehicles per Household | Owner-occupied | Renter-occupied |
| No Vehicle | 45 (4.0%) | 31 (13.6%) |
| 1 Vehicle | 460 (40.7%) | 79 (34.6%) |
| 2 Vehicles | 480 (42.5%) | 110 (48.2%) |
| 3 or more Vehicles | 145 (12.8%) | 8 (3.5%) |
| Total | 1,130 (100.0%) | 228 (100.0%) |
Real Estate & Mortgages in Lincoln Beach
Real Estate and Mortgage Overview in Lincoln Beach
| Characteristic | Without Mortgage | With Mortgage |
| Housing Units | 670 | 460 |
| Median Property Value | $360,100 | $367,300 |
| Median Household Income | $55,643 | $17 |
| Monthly Housing Costs | $559 | $17 |
| Real Estate Taxes | $2,990 | $0 |
Property Value by Mortgage Status in Lincoln Beach
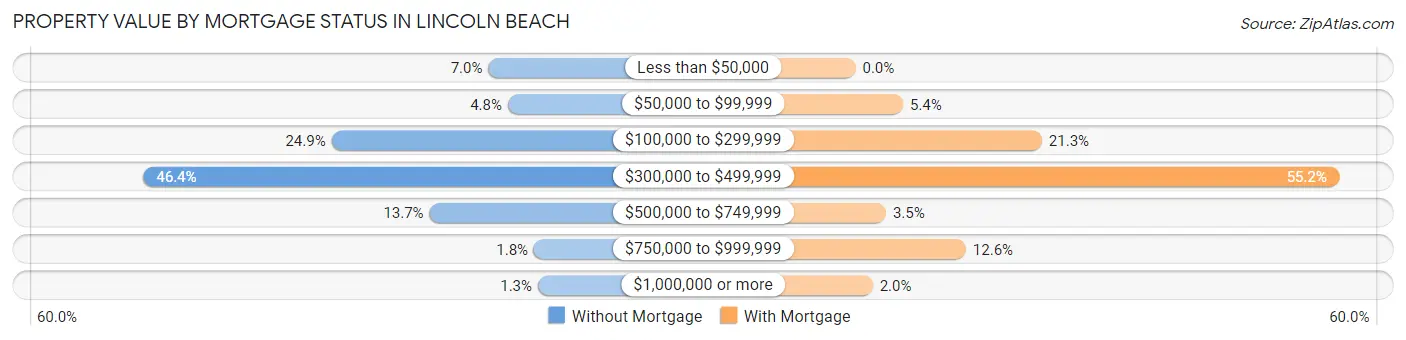
| Property Value | Without Mortgage | With Mortgage |
| Less than $50,000 | 47 (7.0%) | 0 (0.0%) |
| $50,000 to $99,999 | 32 (4.8%) | 25 (5.4%) |
| $100,000 to $299,999 | 167 (24.9%) | 98 (21.3%) |
| $300,000 to $499,999 | 311 (46.4%) | 254 (55.2%) |
| $500,000 to $749,999 | 92 (13.7%) | 16 (3.5%) |
| $750,000 to $999,999 | 12 (1.8%) | 58 (12.6%) |
| $1,000,000 or more | 9 (1.3%) | 9 (2.0%) |
| Total | 670 (100.0%) | 460 (100.0%) |
Household Income by Mortgage Status in Lincoln Beach
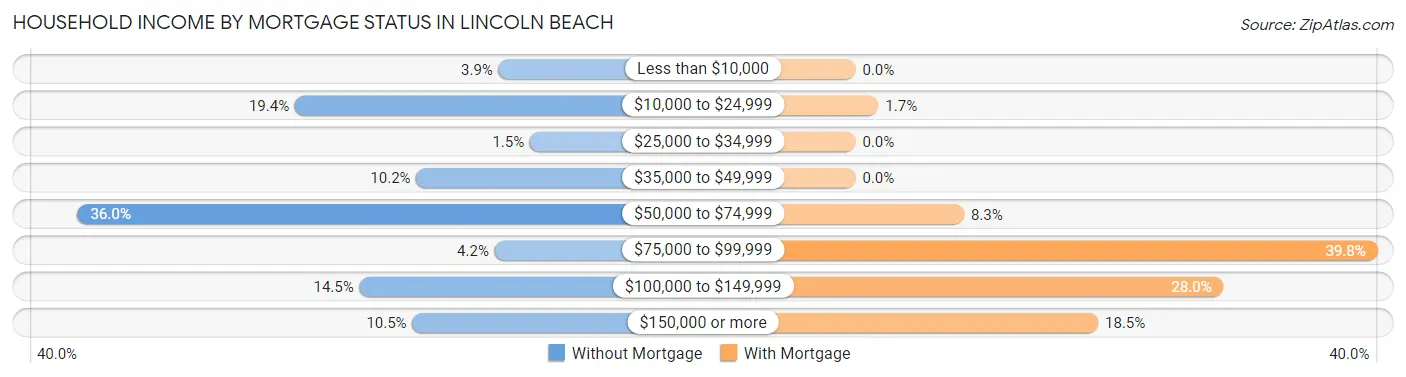
| Household Income | Without Mortgage | With Mortgage |
| Less than $10,000 | 26 (3.9%) | 0 (0.0%) |
| $10,000 to $24,999 | 130 (19.4%) | 8 (1.7%) |
| $25,000 to $34,999 | 10 (1.5%) | 0 (0.0%) |
| $35,000 to $49,999 | 68 (10.2%) | 0 (0.0%) |
| $50,000 to $74,999 | 241 (36.0%) | 38 (8.3%) |
| $75,000 to $99,999 | 28 (4.2%) | 183 (39.8%) |
| $100,000 to $149,999 | 97 (14.5%) | 129 (28.0%) |
| $150,000 or more | 70 (10.4%) | 85 (18.5%) |
| Total | 670 (100.0%) | 460 (100.0%) |
Property Value to Household Income Ratio in Lincoln Beach
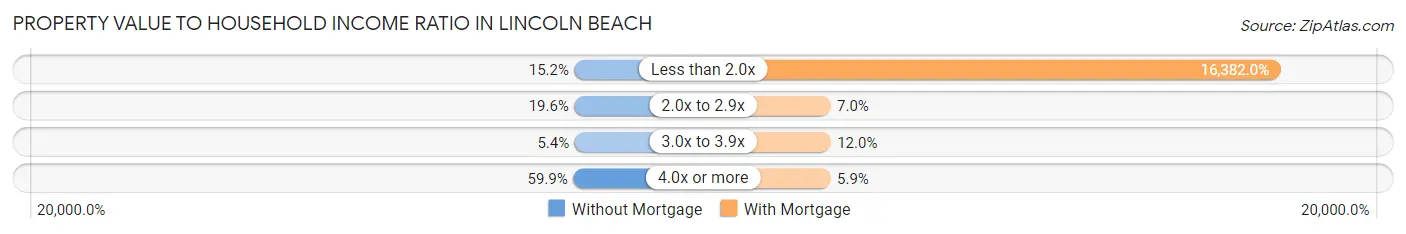
| Value-to-Income Ratio | Without Mortgage | With Mortgage |
| Less than 2.0x | 102 (15.2%) | 75,357 (16,382.0%) |
| 2.0x to 2.9x | 131 (19.6%) | 32 (7.0%) |
| 3.0x to 3.9x | 36 (5.4%) | 55 (12.0%) |
| 4.0x or more | 401 (59.9%) | 27 (5.9%) |
| Total | 670 (100.0%) | 460 (100.0%) |
Real Estate Taxes by Mortgage Status in Lincoln Beach
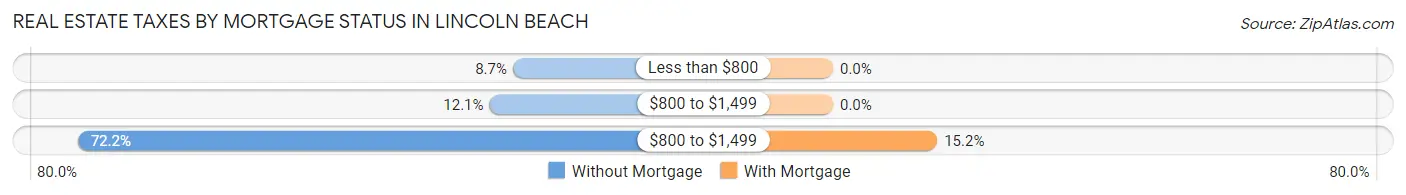
| Property Taxes | Without Mortgage | With Mortgage |
| Less than $800 | 58 (8.7%) | 0 (0.0%) |
| $800 to $1,499 | 81 (12.1%) | 0 (0.0%) |
| $800 to $1,499 | 484 (72.2%) | 70 (15.2%) |
| Total | 670 (100.0%) | 460 (100.0%) |
Health & Disability in Lincoln Beach
Health Insurance Coverage by Age in Lincoln Beach
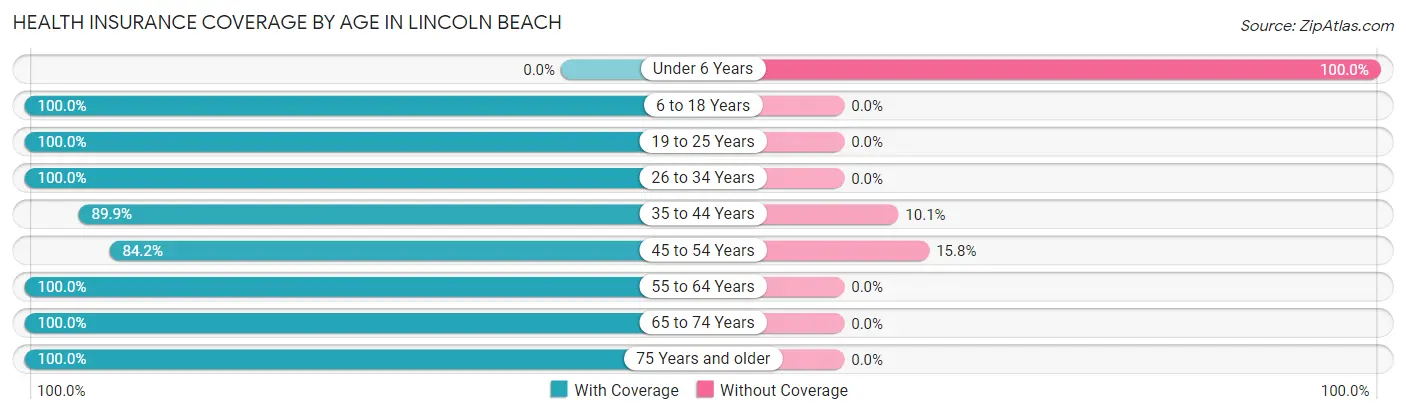
| Age Bracket | With Coverage | Without Coverage |
| Under 6 Years | 0 (0.0%) | 78 (100.0%) |
| 6 to 18 Years | 390 (100.0%) | 0 (0.0%) |
| 19 to 25 Years | 8 (100.0%) | 0 (0.0%) |
| 26 to 34 Years | 146 (100.0%) | 0 (0.0%) |
| 35 to 44 Years | 205 (89.9%) | 23 (10.1%) |
| 45 to 54 Years | 255 (84.2%) | 48 (15.8%) |
| 55 to 64 Years | 664 (100.0%) | 0 (0.0%) |
| 65 to 74 Years | 443 (100.0%) | 0 (0.0%) |
| 75 Years and older | 519 (100.0%) | 0 (0.0%) |
| Total | 2,630 (94.6%) | 149 (5.4%) |
Health Insurance Coverage by Citizenship Status in Lincoln Beach
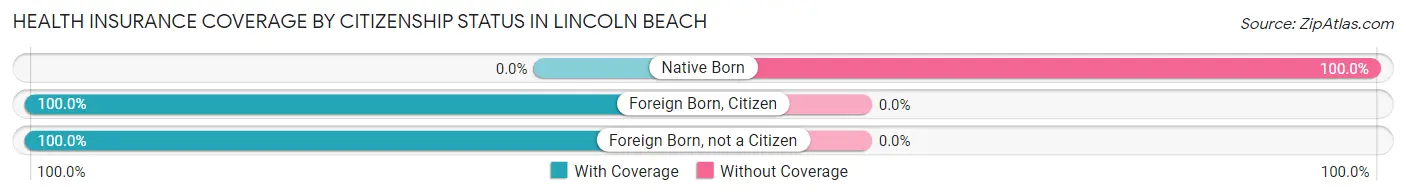
| Citizenship Status | With Coverage | Without Coverage |
| Native Born | 0 (0.0%) | 78 (100.0%) |
| Foreign Born, Citizen | 390 (100.0%) | 0 (0.0%) |
| Foreign Born, not a Citizen | 8 (100.0%) | 0 (0.0%) |
Health Insurance Coverage by Household Income in Lincoln Beach
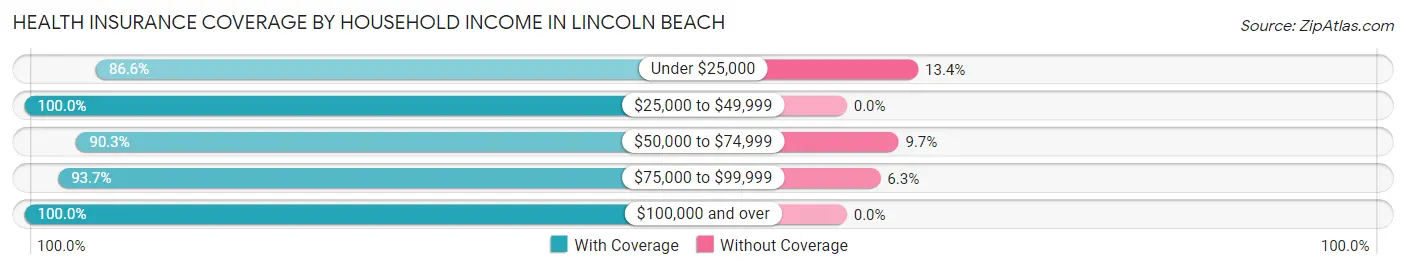
| Household Income | With Coverage | Without Coverage |
| Under $25,000 | 201 (86.6%) | 31 (13.4%) |
| $25,000 to $49,999 | 248 (100.0%) | 0 (0.0%) |
| $50,000 to $74,999 | 727 (90.3%) | 78 (9.7%) |
| $75,000 to $99,999 | 595 (93.7%) | 40 (6.3%) |
| $100,000 and over | 846 (100.0%) | 0 (0.0%) |
Public vs Private Health Insurance Coverage by Age in Lincoln Beach
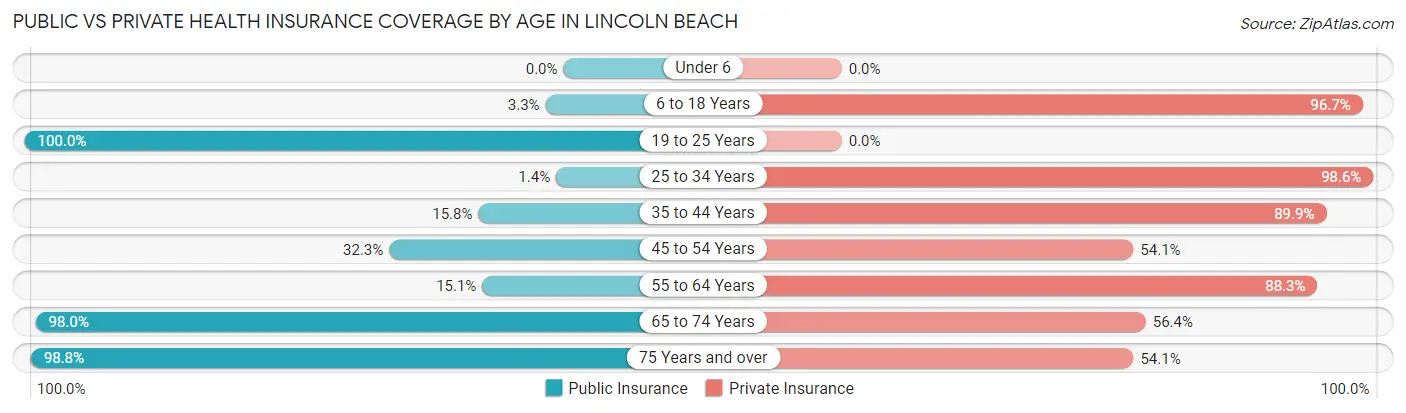
| Age Bracket | Public Insurance | Private Insurance |
| Under 6 | 0 (0.0%) | 0 (0.0%) |
| 6 to 18 Years | 13 (3.3%) | 377 (96.7%) |
| 19 to 25 Years | 8 (100.0%) | 0 (0.0%) |
| 25 to 34 Years | 2 (1.4%) | 144 (98.6%) |
| 35 to 44 Years | 36 (15.8%) | 205 (89.9%) |
| 45 to 54 Years | 98 (32.3%) | 164 (54.1%) |
| 55 to 64 Years | 100 (15.1%) | 586 (88.2%) |
| 65 to 74 Years | 434 (98.0%) | 250 (56.4%) |
| 75 Years and over | 513 (98.8%) | 281 (54.1%) |
| Total | 1,204 (43.3%) | 2,007 (72.2%) |
Disability Status by Sex by Age in Lincoln Beach
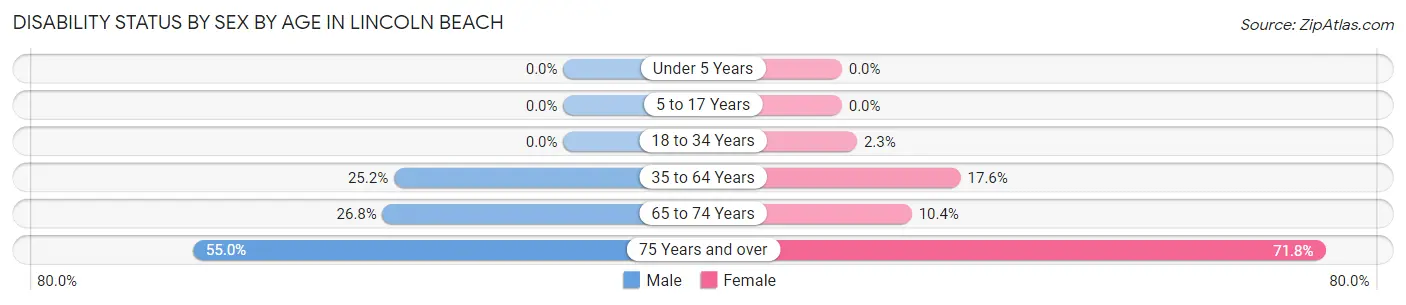
| Age Bracket | Male | Female |
| Under 5 Years | 0 (0.0%) | 0 (0.0%) |
| 5 to 17 Years | 0 (0.0%) | 0 (0.0%) |
| 18 to 34 Years | 0 (0.0%) | 2 (2.2%) |
| 35 to 64 Years | 128 (25.2%) | 121 (17.6%) |
| 65 to 74 Years | 62 (26.8%) | 22 (10.4%) |
| 75 Years and over | 110 (55.0%) | 229 (71.8%) |
Disability Class by Sex by Age in Lincoln Beach
Disability Class: Hearing Difficulty
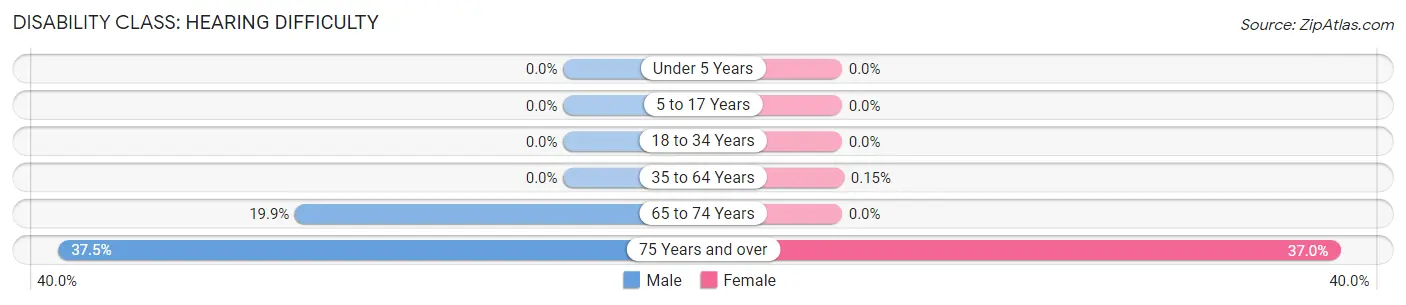
| Age Bracket | Male | Female |
| Under 5 Years | 0 (0.0%) | 0 (0.0%) |
| 5 to 17 Years | 0 (0.0%) | 0 (0.0%) |
| 18 to 34 Years | 0 (0.0%) | 0 (0.0%) |
| 35 to 64 Years | 0 (0.0%) | 1 (0.2%) |
| 65 to 74 Years | 46 (19.9%) | 0 (0.0%) |
| 75 Years and over | 75 (37.5%) | 118 (37.0%) |
Disability Class: Vision Difficulty
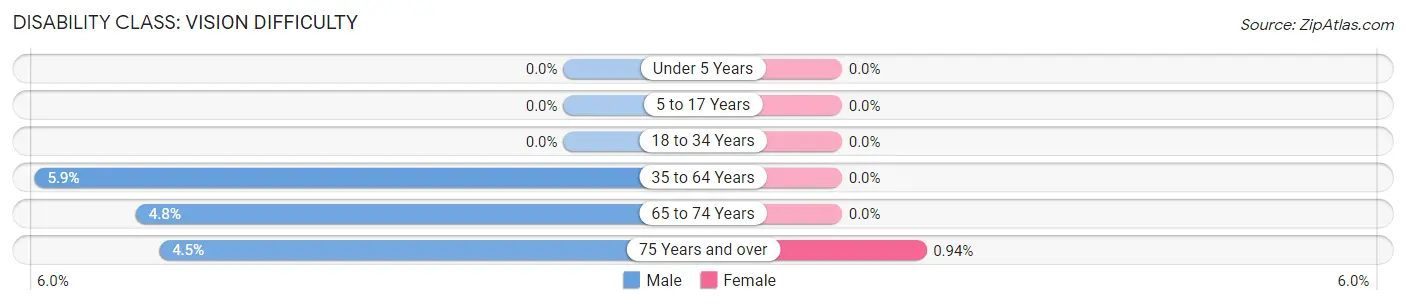
| Age Bracket | Male | Female |
| Under 5 Years | 0 (0.0%) | 0 (0.0%) |
| 5 to 17 Years | 0 (0.0%) | 0 (0.0%) |
| 18 to 34 Years | 0 (0.0%) | 0 (0.0%) |
| 35 to 64 Years | 30 (5.9%) | 0 (0.0%) |
| 65 to 74 Years | 11 (4.8%) | 0 (0.0%) |
| 75 Years and over | 9 (4.5%) | 3 (0.9%) |
Disability Class: Cognitive Difficulty
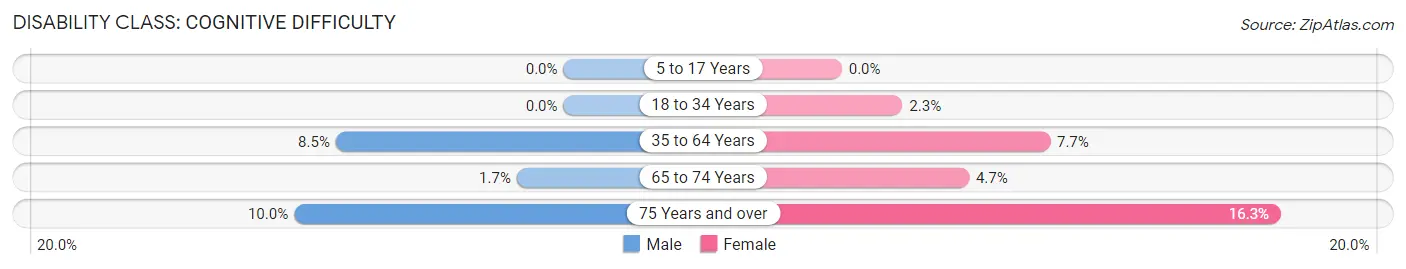
| Age Bracket | Male | Female |
| 5 to 17 Years | 0 (0.0%) | 0 (0.0%) |
| 18 to 34 Years | 0 (0.0%) | 2 (2.2%) |
| 35 to 64 Years | 43 (8.5%) | 53 (7.7%) |
| 65 to 74 Years | 4 (1.7%) | 10 (4.7%) |
| 75 Years and over | 20 (10.0%) | 52 (16.3%) |
Disability Class: Ambulatory Difficulty
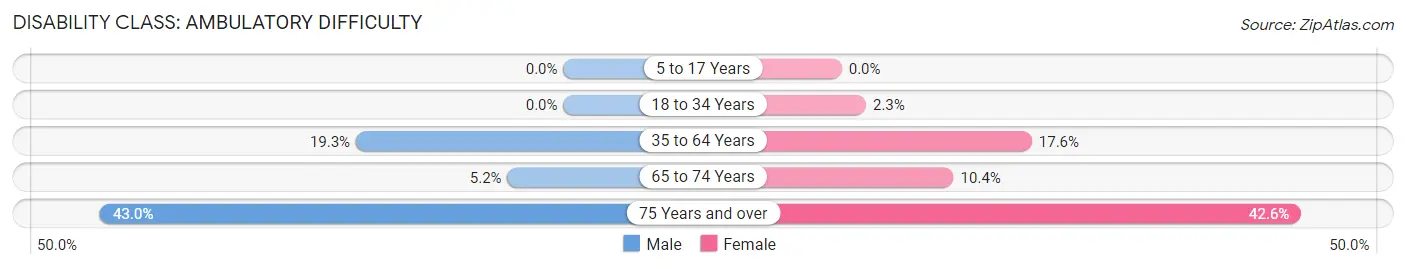
| Age Bracket | Male | Female |
| 5 to 17 Years | 0 (0.0%) | 0 (0.0%) |
| 18 to 34 Years | 0 (0.0%) | 2 (2.2%) |
| 35 to 64 Years | 98 (19.3%) | 121 (17.6%) |
| 65 to 74 Years | 12 (5.2%) | 22 (10.4%) |
| 75 Years and over | 86 (43.0%) | 136 (42.6%) |
Disability Class: Self-Care Difficulty
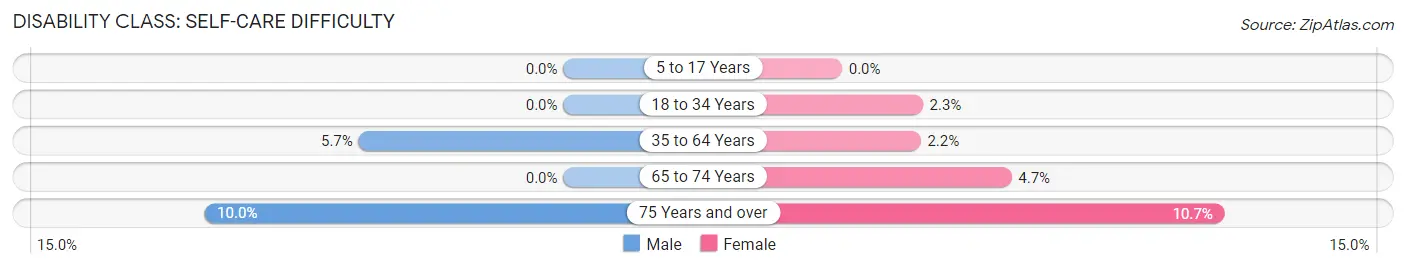
| Age Bracket | Male | Female |
| 5 to 17 Years | 0 (0.0%) | 0 (0.0%) |
| 18 to 34 Years | 0 (0.0%) | 2 (2.2%) |
| 35 to 64 Years | 29 (5.7%) | 15 (2.2%) |
| 65 to 74 Years | 0 (0.0%) | 10 (4.7%) |
| 75 Years and over | 20 (10.0%) | 34 (10.7%) |
Technology Access in Lincoln Beach
Computing Device Access in Lincoln Beach
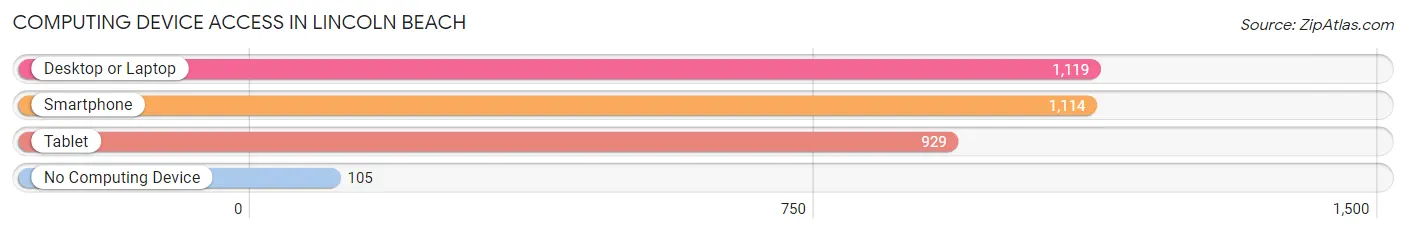
| Device Type | # Households | % Households |
| Desktop or Laptop | 1,119 | 82.4% |
| Smartphone | 1,114 | 82.0% |
| Tablet | 929 | 68.4% |
| No Computing Device | 105 | 7.7% |
| Total | 1,358 | 100.0% |
Internet Access in Lincoln Beach
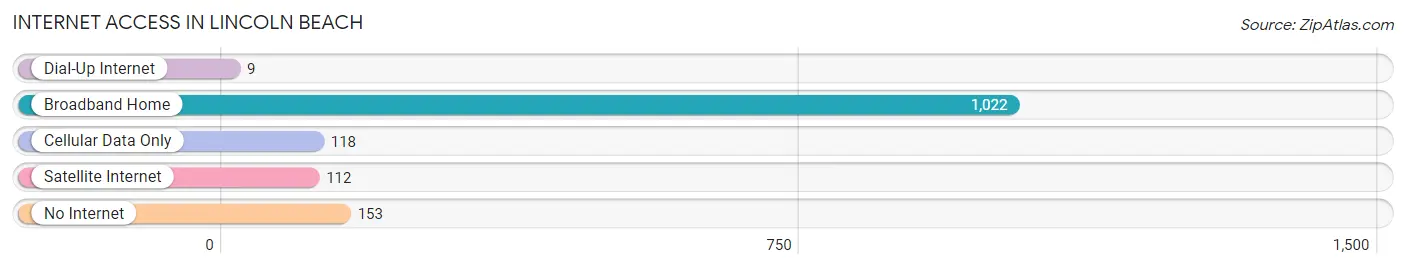
| Internet Type | # Households | % Households |
| Dial-Up Internet | 9 | 0.7% |
| Broadband Home | 1,022 | 75.3% |
| Cellular Data Only | 118 | 8.7% |
| Satellite Internet | 112 | 8.3% |
| No Internet | 153 | 11.3% |
| Total | 1,358 | 100.0% |
Lincoln Beach Summary
Lincoln Beach is a small unincorporated community located in Lincoln County, Oregon, United States. It is situated on the Oregon Coast, approximately 10 miles south of Newport and 8 miles north of Depoe Bay. The community is located on the east side of the Yaquina Bay, and is home to a small population of approximately 200 people.
History
Lincoln Beach was originally inhabited by the Siletz tribe of Native Americans. The area was first explored by Europeans in 1788, when the British explorer Captain Robert Gray sailed into Yaquina Bay. In 1851, the first settlers arrived in the area, and the community was officially established in 1853. The town was named after Abraham Lincoln, who had recently been elected President of the United States.
In the late 19th century, Lincoln Beach was a popular tourist destination, and the town was home to several hotels and resorts. The town was also home to a number of commercial fishing operations, and the local economy was largely based on the fishing industry.
In the early 20th century, the town began to decline in popularity as a tourist destination, and the local economy shifted to focus on the timber industry. The town was also home to a number of canneries, which processed the local seafood.
In the 1950s, the town began to experience a resurgence in popularity as a tourist destination. The town was home to a number of resorts and restaurants, and the local economy shifted to focus on tourism.
Geography
Lincoln Beach is located on the Oregon Coast, approximately 10 miles south of Newport and 8 miles north of Depoe Bay. The town is situated on the east side of the Yaquina Bay, and is surrounded by the Siletz Bay National Wildlife Refuge. The town is located at an elevation of approximately 20 feet above sea level.
The climate in Lincoln Beach is mild and temperate, with average temperatures ranging from the mid-50s in the winter to the mid-70s in the summer. The town receives an average of approximately 50 inches of precipitation per year, with most of the precipitation occurring in the winter months.
Economy
The economy of Lincoln Beach is largely based on tourism. The town is home to a number of resorts and restaurants, and the local economy is supported by the influx of visitors during the summer months. The town is also home to a number of commercial fishing operations, and the local seafood is sold in markets throughout the region.
Demographics
As of the 2010 census, the population of Lincoln Beach was approximately 200 people. The town is predominantly white, with approximately 95% of the population identifying as white. The median household income in the town is approximately $45,000, and the median home value is approximately $250,000. The town is home to a number of retirees, and the median age of the population is approximately 55 years old.
Common Questions
What is Per Capita Income in Lincoln Beach?
Per Capita income in Lincoln Beach is $36,107.
What is the Median Family Income in Lincoln Beach?
Median Family Income in Lincoln Beach is $78,109.
What is the Median Household income in Lincoln Beach?
Median Household Income in Lincoln Beach is $60,508.
What is Income or Wage Gap in Lincoln Beach?
Income or Wage Gap in Lincoln Beach is 2.6%.
Women in Lincoln Beach earn 97.4 cents for every dollar earned by a man.
What is Inequality or Gini Index in Lincoln Beach?
Inequality or Gini Index in Lincoln Beach is 0.35.
What is the Total Population of Lincoln Beach?
Total Population of Lincoln Beach is 2,779.
What is the Total Male Population of Lincoln Beach?
Total Male Population of Lincoln Beach is 1,397.
What is the Total Female Population of Lincoln Beach?
Total Female Population of Lincoln Beach is 1,382.
What is the Ratio of Males per 100 Females in Lincoln Beach?
There are 101.09 Males per 100 Females in Lincoln Beach.
What is the Ratio of Females per 100 Males in Lincoln Beach?
There are 98.93 Females per 100 Males in Lincoln Beach.
What is the Median Population Age in Lincoln Beach?
Median Population Age in Lincoln Beach is 60.0 Years.
What is the Average Family Size in Lincoln Beach
Average Family Size in Lincoln Beach is 2.6 People.
What is the Average Household Size in Lincoln Beach
Average Household Size in Lincoln Beach is 2.0 People.
How Large is the Labor Force in Lincoln Beach?
There are 1,264 People in the Labor Forcein in Lincoln Beach.
What is the Percentage of People in the Labor Force in Lincoln Beach?
50.9% of People are in the Labor Force in Lincoln Beach.
What is the Unemployment Rate in Lincoln Beach?
Unemployment Rate in Lincoln Beach is 3.6%.