Zip Codes with the Highest Percentage of Population Employed in Food Preparation & Serving in Albany, OR
RELATED REPORTS & OPTIONS
Food Preparation & Serving
Albany
Compare Zip Codes
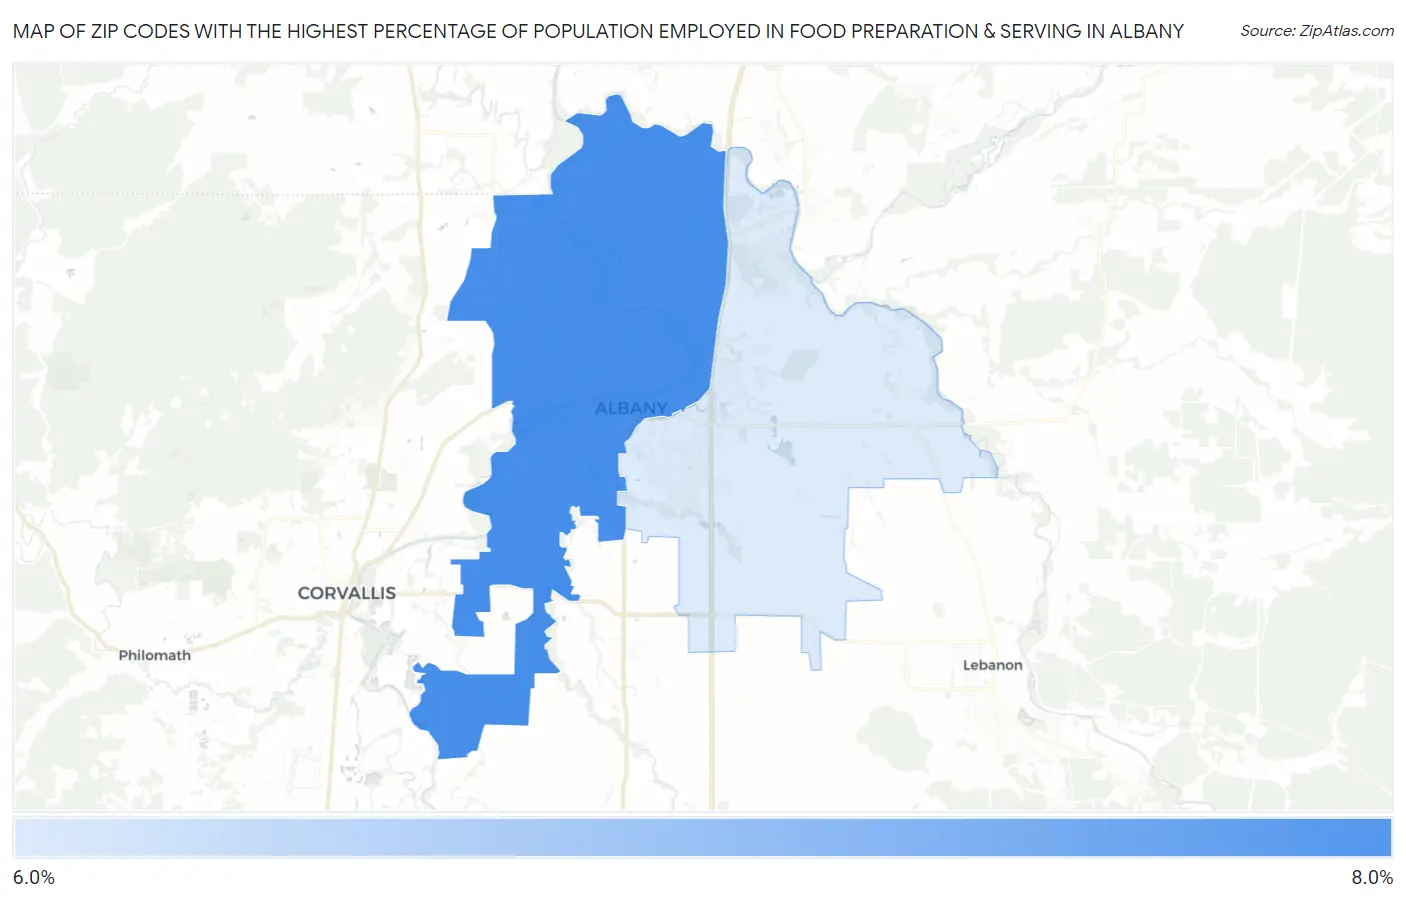
Map of Zip Codes with the Highest Percentage of Population Employed in Food Preparation & Serving in Albany
6.2%
6.3%
Zip Codes with the Highest Percentage of Population Employed in Food Preparation & Serving in Albany, OR
| Zip Code | % Employed | vs State | vs National | |
| 1. | 97321 | 6.3% | 5.9%(+0.335)#146 | 5.3%(+0.976)#8,537 |
| 2. | 97322 | 6.2% | 5.9%(+0.234)#148 | 5.3%(+0.875)#8,851 |
1
Common Questions
What are the Top Zip Codes with the Highest Percentage of Population Employed in Food Preparation & Serving in Albany, OR?
Top Zip Codes with the Highest Percentage of Population Employed in Food Preparation & Serving in Albany, OR are:
What zip code has the Highest Percentage of Population Employed in Food Preparation & Serving in Albany, OR?
97321 has the Highest Percentage of Population Employed in Food Preparation & Serving in Albany, OR with 6.3%.
What is the Percentage of Population Employed in Food Preparation & Serving in Albany, OR?
Percentage of Population Employed in Food Preparation & Serving in Albany is 7.0%.
What is the Percentage of Population Employed in Food Preparation & Serving in Oregon?
Percentage of Population Employed in Food Preparation & Serving in Oregon is 5.9%.
What is the Percentage of Population Employed in Food Preparation & Serving in the United States?
Percentage of Population Employed in Food Preparation & Serving in the United States is 5.3%.