Takilma, OR Map & Demographics
Takilma Map
Takilma Overview
$18,285
PER CAPITA INCOME
$30,625
AVG HOUSEHOLD INCOME
82.7%
WAGE / INCOME GAP [ % ]
17.3¢/ $1
WAGE / INCOME GAP [ $ ]
0.37
INEQUALITY / GINI INDEX
633
TOTAL POPULATION
245
MALE POPULATION
388
FEMALE POPULATION
63.14
MALES / 100 FEMALES
158.37
FEMALES / 100 MALES
40.9
MEDIAN AGE
3.8
AVG FAMILY SIZE
2.5
AVG HOUSEHOLD SIZE
259
LABOR FORCE [ PEOPLE ]
58.5%
PERCENT IN LABOR FORCE
5.8%
UNEMPLOYMENT RATE
Income in Takilma
Income Overview in Takilma
| Characteristic | Number | Measure |
| Per Capita Income | 633 | $18,285 |
| Median Family Income | 129 | $0 |
| Mean Family Income | 129 | $54,378 |
| Median Household Income | 248 | $30,625 |
| Mean Household Income | 248 | $45,223 |
| Income Deficit | 129 | $0 |
| Wage / Income Gap (%) | 633 | 82.70% |
| Wage / Income Gap ($) | 633 | 17.30¢ per $1 |
| Gini / Inequality Index | 633 | 0.37 |
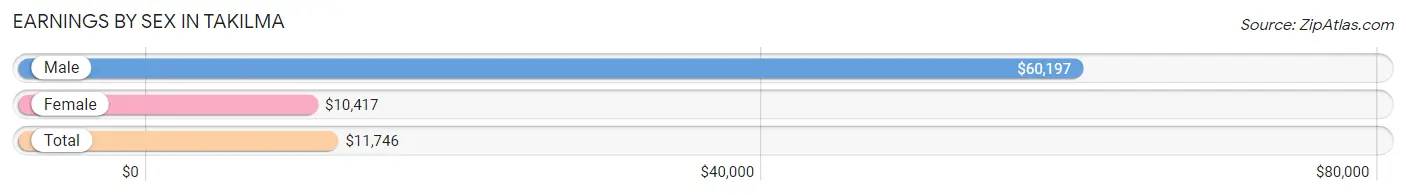
Earnings by Sex in Takilma
Average Earnings in Takilma are $11,746, $60,197 for men and $10,417 for women, a difference of 82.7%.
| Sex | Number | Average Earnings |
| Male | 97 (35.1%) | $60,197 |
| Female | 179 (64.9%) | $10,417 |
| Total | 276 (100.0%) | $11,746 |
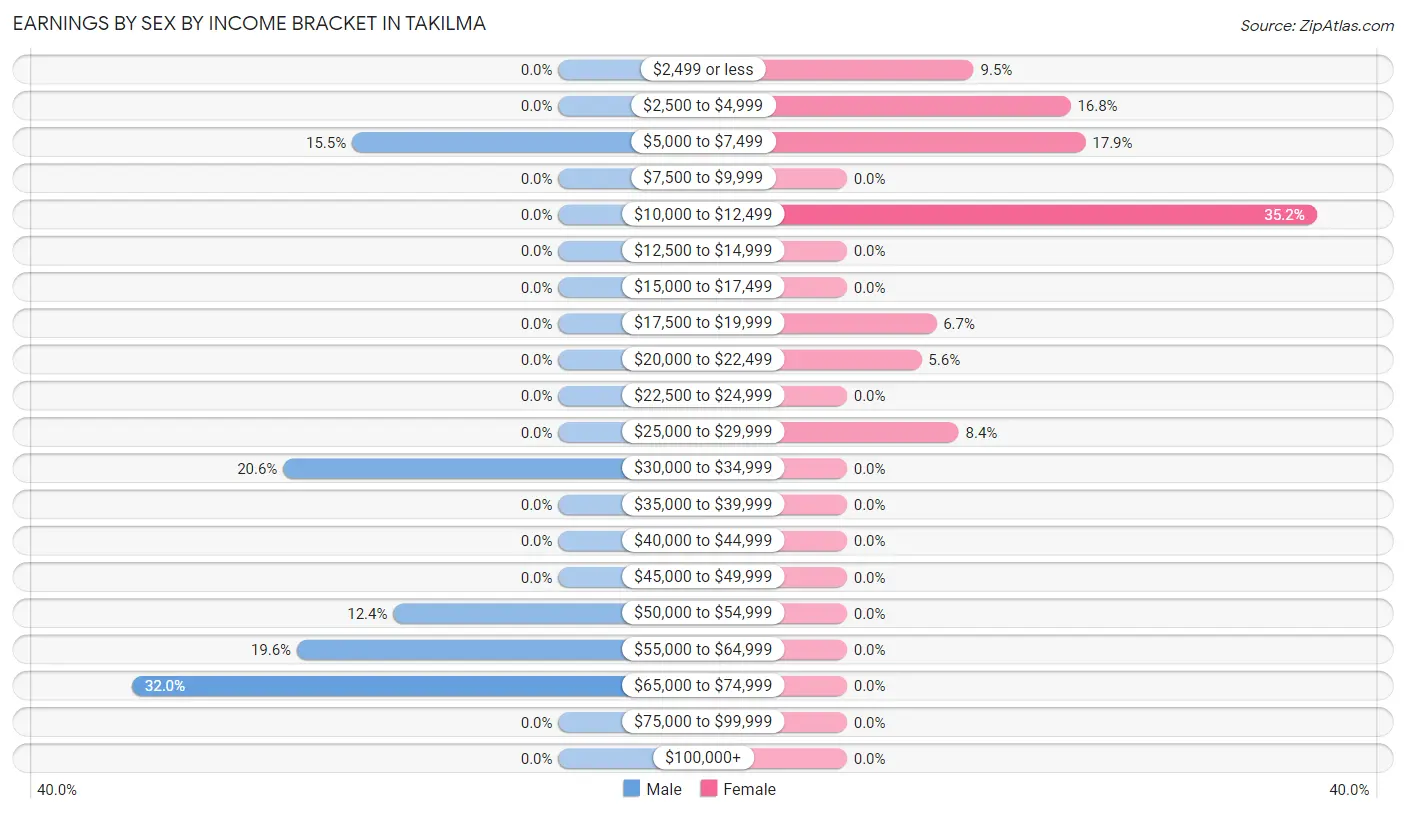
Earnings by Sex by Income Bracket in Takilma
The most common earnings brackets in Takilma are $65,000 to $74,999 for men (31 | 32.0%) and $10,000 to $12,499 for women (63 | 35.2%).
| Income | Male | Female |
| $2,499 or less | 0 (0.0%) | 17 (9.5%) |
| $2,500 to $4,999 | 0 (0.0%) | 30 (16.8%) |
| $5,000 to $7,499 | 15 (15.5%) | 32 (17.9%) |
| $7,500 to $9,999 | 0 (0.0%) | 0 (0.0%) |
| $10,000 to $12,499 | 0 (0.0%) | 63 (35.2%) |
| $12,500 to $14,999 | 0 (0.0%) | 0 (0.0%) |
| $15,000 to $17,499 | 0 (0.0%) | 0 (0.0%) |
| $17,500 to $19,999 | 0 (0.0%) | 12 (6.7%) |
| $20,000 to $22,499 | 0 (0.0%) | 10 (5.6%) |
| $22,500 to $24,999 | 0 (0.0%) | 0 (0.0%) |
| $25,000 to $29,999 | 0 (0.0%) | 15 (8.4%) |
| $30,000 to $34,999 | 20 (20.6%) | 0 (0.0%) |
| $35,000 to $39,999 | 0 (0.0%) | 0 (0.0%) |
| $40,000 to $44,999 | 0 (0.0%) | 0 (0.0%) |
| $45,000 to $49,999 | 0 (0.0%) | 0 (0.0%) |
| $50,000 to $54,999 | 12 (12.4%) | 0 (0.0%) |
| $55,000 to $64,999 | 19 (19.6%) | 0 (0.0%) |
| $65,000 to $74,999 | 31 (32.0%) | 0 (0.0%) |
| $75,000 to $99,999 | 0 (0.0%) | 0 (0.0%) |
| $100,000+ | 0 (0.0%) | 0 (0.0%) |
| Total | 97 (100.0%) | 179 (100.0%) |
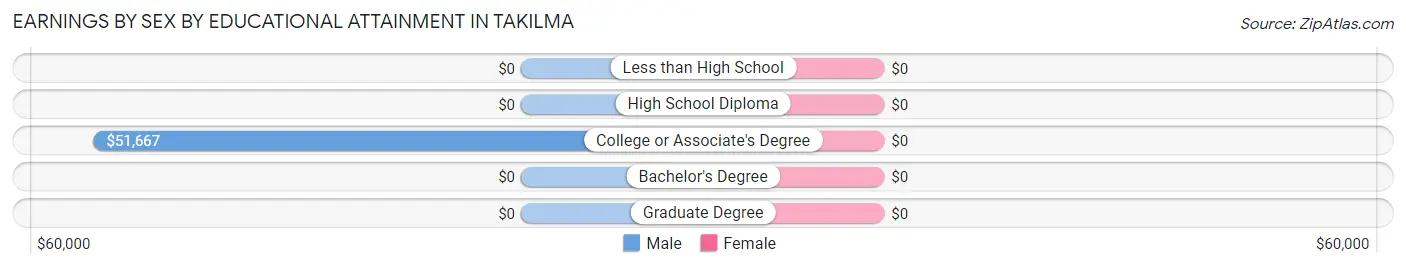
Earnings by Sex by Educational Attainment in Takilma
| Educational Attainment | Male Income | Female Income |
| Less than High School | - | - |
| High School Diploma | - | - |
| College or Associate's Degree | $51,667 | $0 |
| Bachelor's Degree | - | - |
| Graduate Degree | - | - |
| Total | $61,513 | $10,417 |
Family Income in Takilma
Family Income Brackets in Takilma
According to the Takilma family income data, there are 35 families falling into the $75,000 to $99,999 income range, which is the most common income bracket and makes up 27.1% of all families.
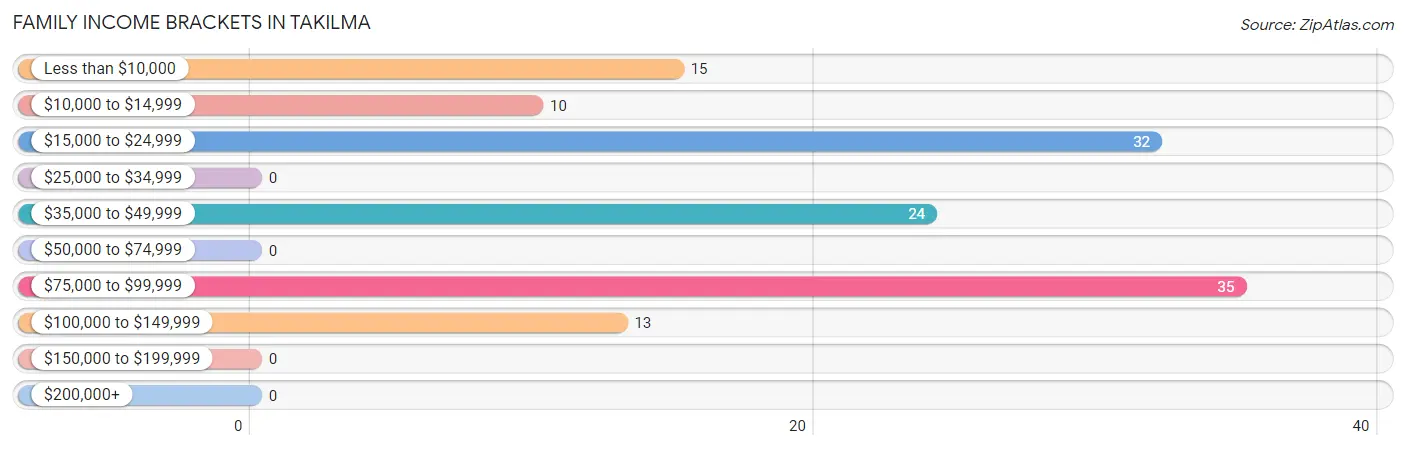
| Income Bracket | # Families | % Families |
| Less than $10,000 | 15 | 11.6% |
| $10,000 to $14,999 | 10 | 7.8% |
| $15,000 to $24,999 | 32 | 24.8% |
| $25,000 to $34,999 | 0 | 0.0% |
| $35,000 to $49,999 | 24 | 18.6% |
| $50,000 to $74,999 | 0 | 0.0% |
| $75,000 to $99,999 | 35 | 27.1% |
| $100,000 to $149,999 | 13 | 10.1% |
| $150,000 to $199,999 | 0 | 0.0% |
| $200,000+ | 0 | 0.0% |
Family Income by Famaliy Size in Takilma
2-person families (34 | 26.4%) account for the highest median family income in Takilma with $43,846 per family, while 2-person families (34 | 26.4%) have the highest median income of $21,923 per family member.
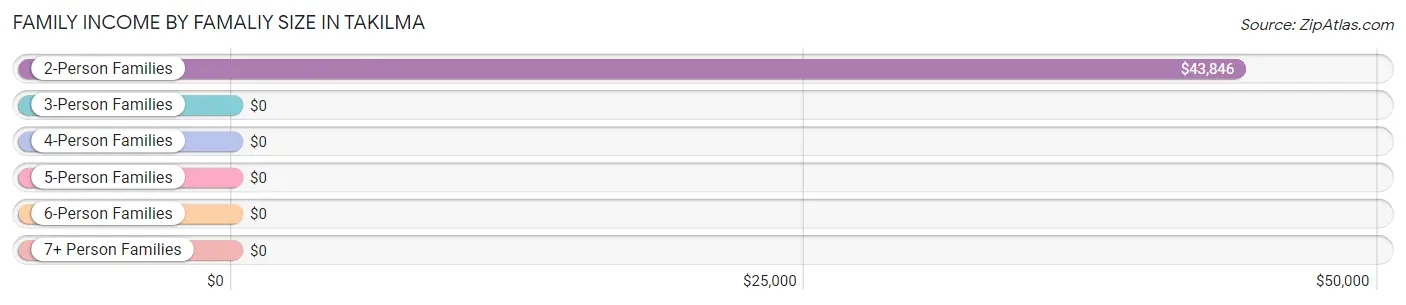
| Income Bracket | # Families | Median Income |
| 2-Person Families | 34 (26.4%) | $43,846 |
| 3-Person Families | 45 (34.9%) | $0 |
| 4-Person Families | 31 (24.0%) | $0 |
| 5-Person Families | 0 (0.0%) | $0 |
| 6-Person Families | 0 (0.0%) | $0 |
| 7+ Person Families | 19 (14.7%) | $0 |
| Total | 129 (100.0%) | $0 |
Family Income by Number of Earners in Takilma
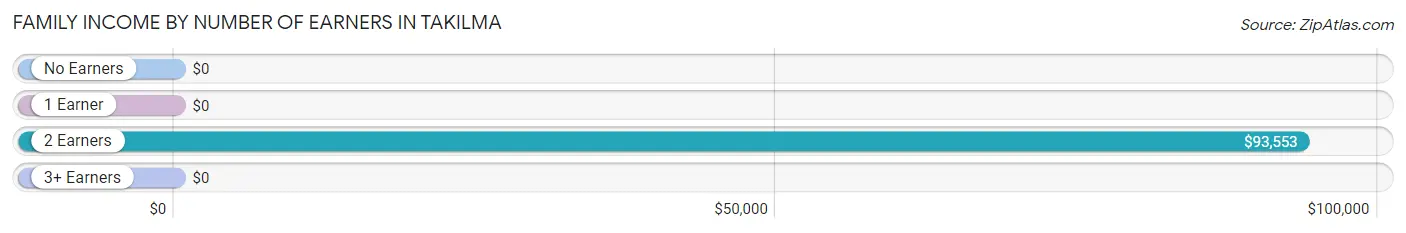
| Number of Earners | # Families | Median Income |
| No Earners | 10 (7.7%) | $0 |
| 1 Earner | 71 (55.0%) | $0 |
| 2 Earners | 48 (37.2%) | $93,553 |
| 3+ Earners | 0 (0.0%) | $0 |
| Total | 129 (100.0%) | $0 |
Household Income in Takilma
Household Income Brackets in Takilma
With 119 households falling in the category, the $25,000 to $34,999 income range is the most frequent in Takilma, accounting for 48.0% of all households.
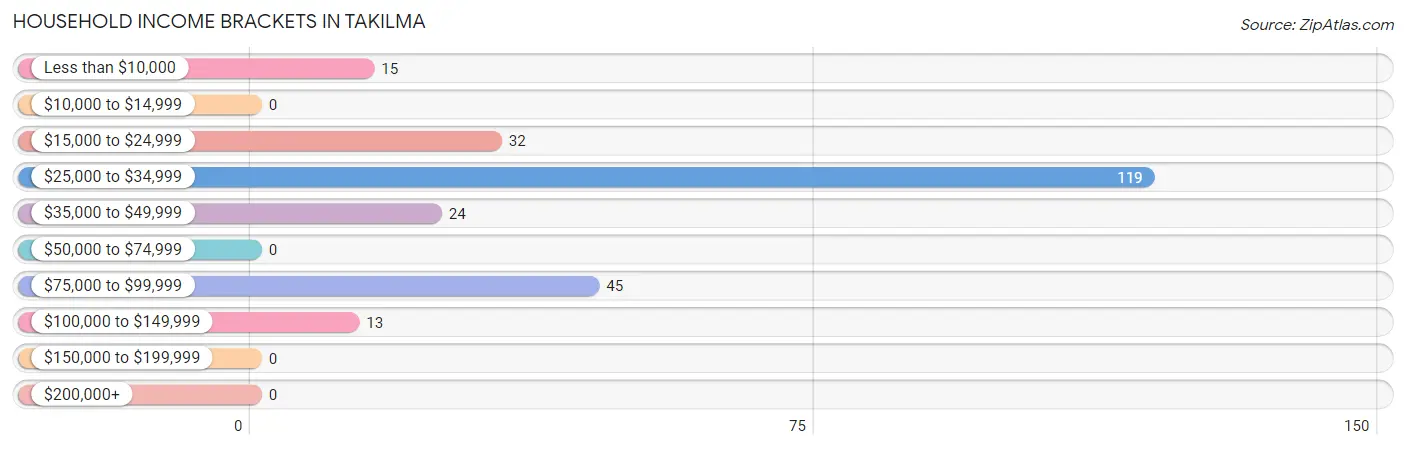
| Income Bracket | # Households | % Households |
| Less than $10,000 | 15 | 6.0% |
| $10,000 to $14,999 | 0 | 0.0% |
| $15,000 to $24,999 | 32 | 12.9% |
| $25,000 to $34,999 | 119 | 48.0% |
| $35,000 to $49,999 | 24 | 9.7% |
| $50,000 to $74,999 | 0 | 0.0% |
| $75,000 to $99,999 | 45 | 18.1% |
| $100,000 to $149,999 | 13 | 5.2% |
| $150,000 to $199,999 | 0 | 0.0% |
| $200,000+ | 0 | 0.0% |
Household Income by Householder Age in Takilma
The median household income in Takilma is $30,625, with the highest median household income of $30,893 found in the 65+ years age bracket for the primary householder. A total of 166 households (66.9%) fall into this category.
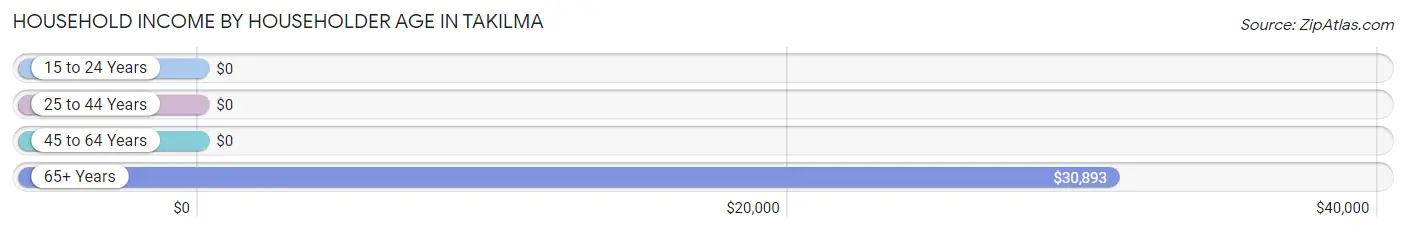
| Income Bracket | # Households | Median Income |
| 15 to 24 Years | 0 (0.0%) | $0 |
| 25 to 44 Years | 35 (14.1%) | $0 |
| 45 to 64 Years | 47 (19.0%) | $0 |
| 65+ Years | 166 (66.9%) | $30,893 |
| Total | 248 (100.0%) | $30,625 |
Poverty in Takilma
Income Below Poverty by Sex and Age in Takilma
With 26.9% poverty level for males and 21.4% for females among the residents of Takilma, 45 to 54 year old males and 45 to 54 year old females are the most vulnerable to poverty, with 15 males (100.0%) and 58 females (100.0%) in their respective age groups living below the poverty level.
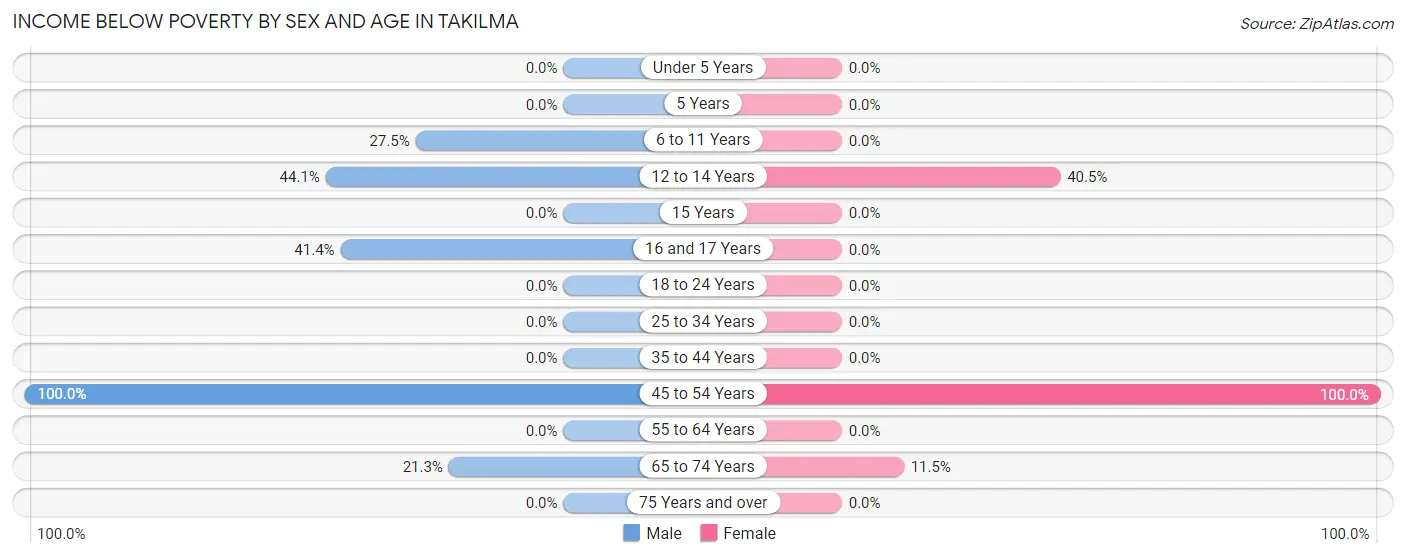
| Age Bracket | Male | Female |
| Under 5 Years | 0 (0.0%) | 0 (0.0%) |
| 5 Years | 0 (0.0%) | 0 (0.0%) |
| 6 to 11 Years | 14 (27.5%) | 0 (0.0%) |
| 12 to 14 Years | 15 (44.1%) | 15 (40.5%) |
| 15 Years | 0 (0.0%) | 0 (0.0%) |
| 16 and 17 Years | 12 (41.4%) | 0 (0.0%) |
| 18 to 24 Years | 0 (0.0%) | 0 (0.0%) |
| 25 to 34 Years | 0 (0.0%) | 0 (0.0%) |
| 35 to 44 Years | 0 (0.0%) | 0 (0.0%) |
| 45 to 54 Years | 15 (100.0%) | 58 (100.0%) |
| 55 to 64 Years | 0 (0.0%) | 0 (0.0%) |
| 65 to 74 Years | 10 (21.3%) | 10 (11.5%) |
| 75 Years and over | 0 (0.0%) | 0 (0.0%) |
| Total | 66 (26.9%) | 83 (21.4%) |
Income Above Poverty by Sex and Age in Takilma
According to the poverty statistics in Takilma, males aged 18 to 24 years and females aged under 5 years are the age groups that are most secure financially, with 100.0% of males and 100.0% of females in these age groups living above the poverty line.
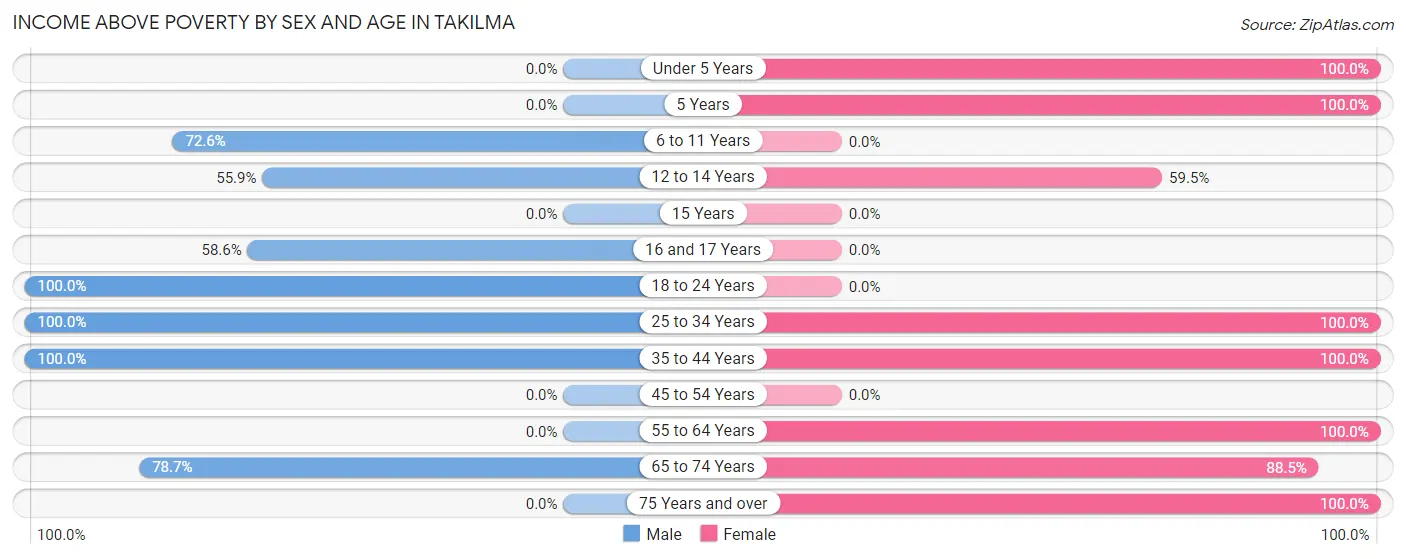
| Age Bracket | Male | Female |
| Under 5 Years | 0 (0.0%) | 22 (100.0%) |
| 5 Years | 0 (0.0%) | 46 (100.0%) |
| 6 to 11 Years | 37 (72.6%) | 0 (0.0%) |
| 12 to 14 Years | 19 (55.9%) | 22 (59.5%) |
| 15 Years | 0 (0.0%) | 0 (0.0%) |
| 16 and 17 Years | 17 (58.6%) | 0 (0.0%) |
| 18 to 24 Years | 20 (100.0%) | 0 (0.0%) |
| 25 to 34 Years | 12 (100.0%) | 15 (100.0%) |
| 35 to 44 Years | 37 (100.0%) | 34 (100.0%) |
| 45 to 54 Years | 0 (0.0%) | 0 (0.0%) |
| 55 to 64 Years | 0 (0.0%) | 22 (100.0%) |
| 65 to 74 Years | 37 (78.7%) | 77 (88.5%) |
| 75 Years and over | 0 (0.0%) | 67 (100.0%) |
| Total | 179 (73.1%) | 305 (78.6%) |
Income Below Poverty Among Married-Couple Families in Takilma
The poverty statistics for married-couple families in Takilma show that 25.8% or 25 of the total 97 families live below the poverty line. Families with 1 or 2 children have the highest poverty rate of 48.4%, comprising of 15 families. On the other hand, families with 5 or more children have the lowest poverty rate of 0.0%, which includes 0 families.
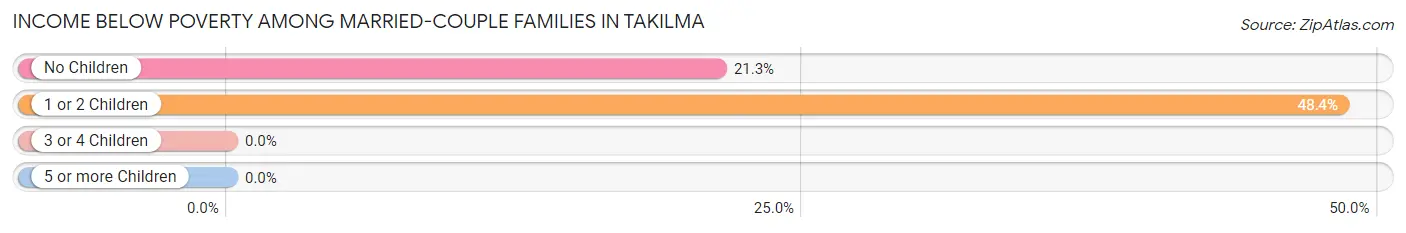
| Children | Above Poverty | Below Poverty |
| No Children | 37 (78.7%) | 10 (21.3%) |
| 1 or 2 Children | 16 (51.6%) | 15 (48.4%) |
| 3 or 4 Children | 0 (0.0%) | 0 (0.0%) |
| 5 or more Children | 19 (100.0%) | 0 (0.0%) |
| Total | 72 (74.2%) | 25 (25.8%) |
Income Below Poverty Among Single-Parent Households in Takilma
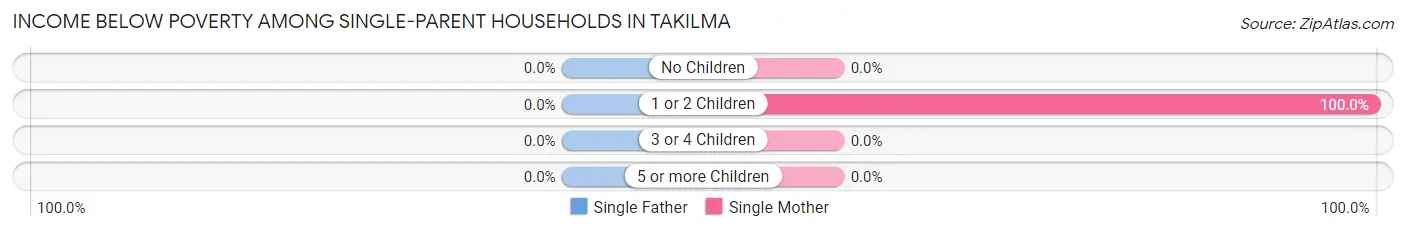
| Children | Single Father | Single Mother |
| No Children | 0 (0.0%) | 0 (0.0%) |
| 1 or 2 Children | 0 (0.0%) | 32 (100.0%) |
| 3 or 4 Children | 0 (0.0%) | 0 (0.0%) |
| 5 or more Children | 0 (0.0%) | 0 (0.0%) |
| Total | 0 (0.0%) | 32 (100.0%) |
Income Below Poverty Among Married-Couple vs Single-Parent Households in Takilma
The poverty data for Takilma shows that 25 of the married-couple family households (25.8%) and 32 of the single-parent households (100.0%) are living below the poverty level. Within the married-couple family households, those with 1 or 2 children have the highest poverty rate, with 15 households (48.4%) falling below the poverty line. Among the single-parent households, those with 1 or 2 children have the highest poverty rate, with 32 household (100.0%) living below poverty.
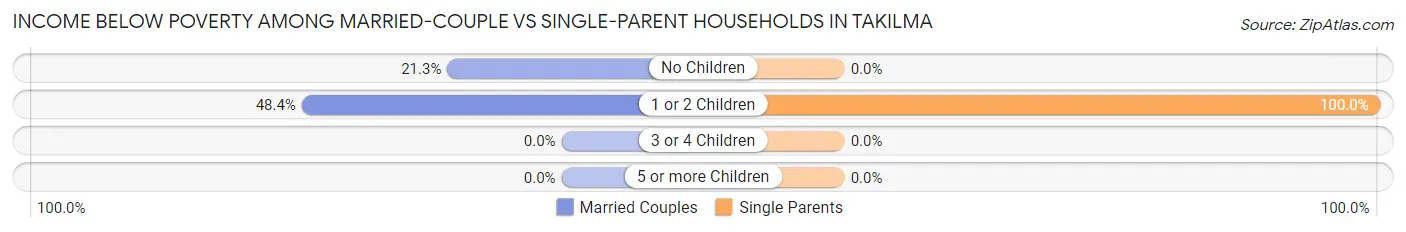
| Children | Married-Couple Families | Single-Parent Households |
| No Children | 10 (21.3%) | 0 (0.0%) |
| 1 or 2 Children | 15 (48.4%) | 32 (100.0%) |
| 3 or 4 Children | 0 (0.0%) | 0 (0.0%) |
| 5 or more Children | 0 (0.0%) | 0 (0.0%) |
| Total | 25 (25.8%) | 32 (100.0%) |
Race in Takilma
The most populous races in Takilma are White / Caucasian (488 | 77.1%), Black / African American (70 | 11.1%), and Two or more Races (63 | 10.0%).
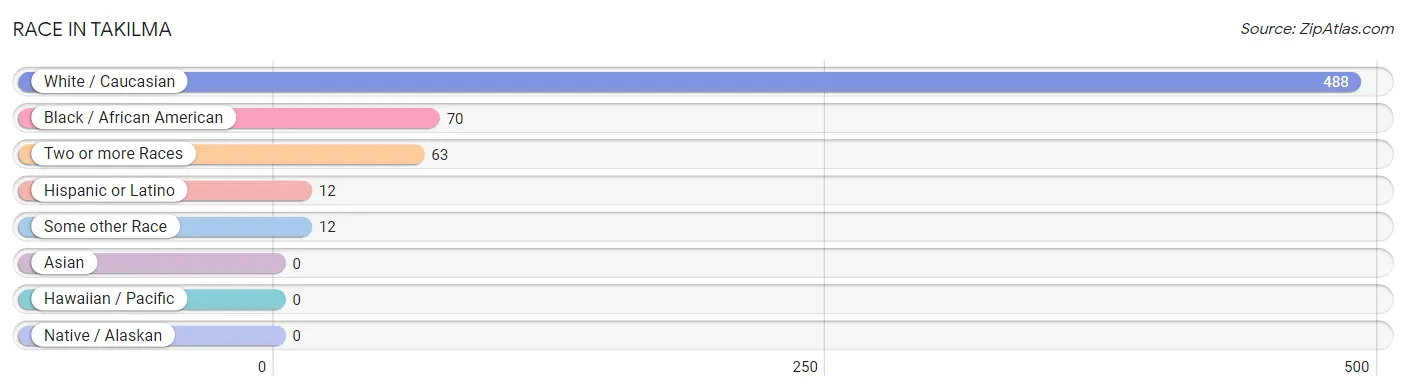
| Race | # Population | % Population |
| Asian | 0 | 0.0% |
| Black / African American | 70 | 11.1% |
| Hawaiian / Pacific | 0 | 0.0% |
| Hispanic or Latino | 12 | 1.9% |
| Native / Alaskan | 0 | 0.0% |
| White / Caucasian | 488 | 77.1% |
| Two or more Races | 63 | 10.0% |
| Some other Race | 12 | 1.9% |
| Total | 633 | 100.0% |
Ancestry in Takilma
The most populous ancestries reported in Takilma are English (73 | 11.5%), Norwegian (49 | 7.7%), German (32 | 5.1%), Russian (32 | 5.1%), and American (24 | 3.8%), together accounting for 33.2% of all Takilma residents.
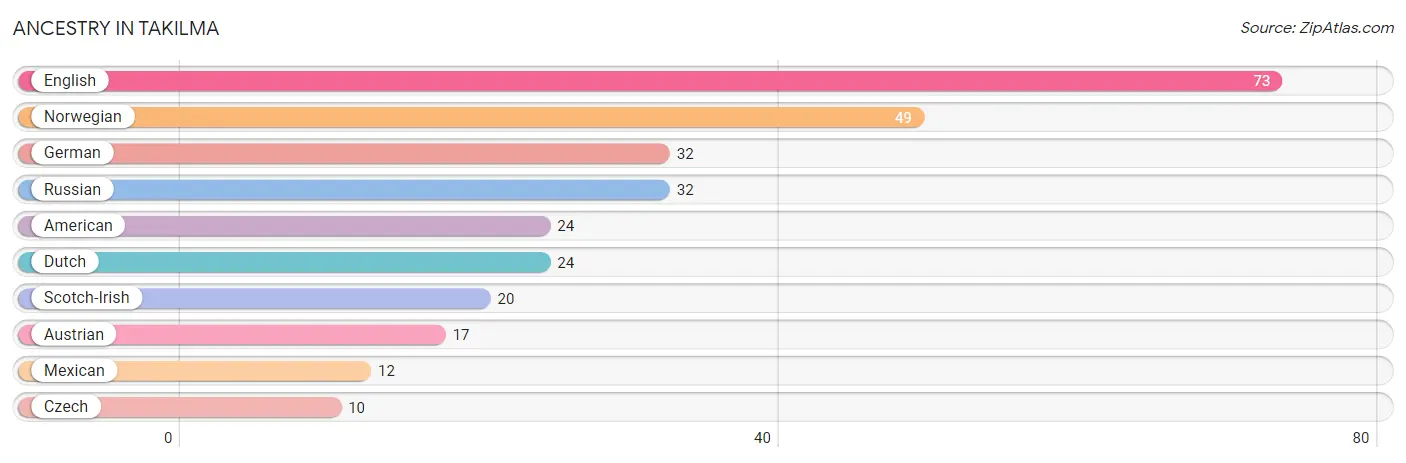
| Ancestry | # Population | % Population |
| American | 24 | 3.8% |
| Austrian | 17 | 2.7% |
| Czech | 10 | 1.6% |
| Dutch | 24 | 3.8% |
| English | 73 | 11.5% |
| German | 32 | 5.1% |
| Mexican | 12 | 1.9% |
| Norwegian | 49 | 7.7% |
| Russian | 32 | 5.1% |
| Scotch-Irish | 20 | 3.2% | View All 10 Rows |
Immigrants in Takilma
The most numerous immigrant groups reported in Takilma came from Africa (56 | 8.8%), Europe (42 | 6.6%), Western Africa (30 | 4.7%), Eastern Africa (26 | 4.1%), and Ethiopia (26 | 4.1%), together accounting for 28.4% of all Takilma residents.
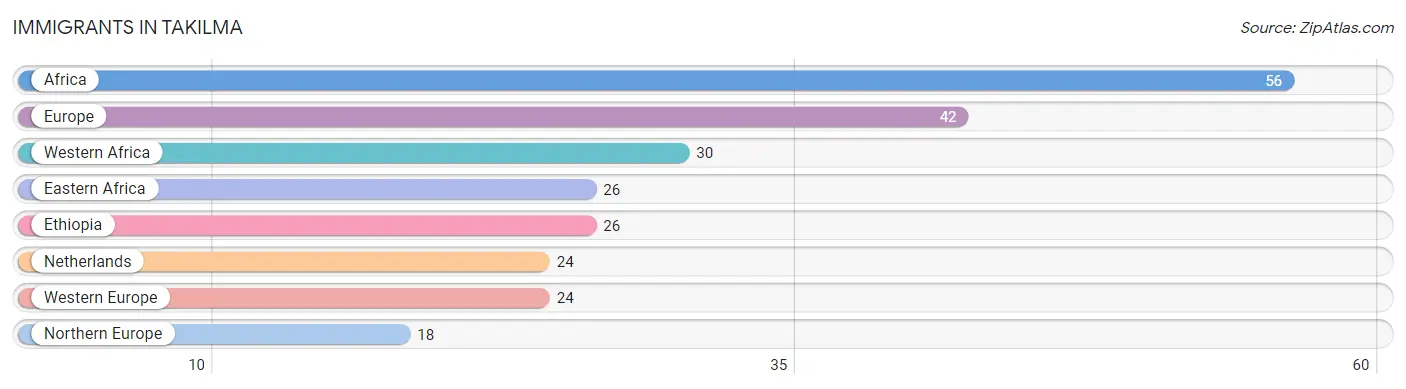
| Immigration Origin | # Population | % Population |
| Africa | 56 | 8.8% |
| Eastern Africa | 26 | 4.1% |
| Ethiopia | 26 | 4.1% |
| Europe | 42 | 6.6% |
| Netherlands | 24 | 3.8% |
| Northern Europe | 18 | 2.8% |
| Western Africa | 30 | 4.7% |
| Western Europe | 24 | 3.8% | View All 8 Rows |
Sex and Age in Takilma
Sex and Age in Takilma
The most populous age groups in Takilma are 10 to 14 Years (53 | 21.6%) for men and 70 to 74 Years (73 | 18.8%) for women.
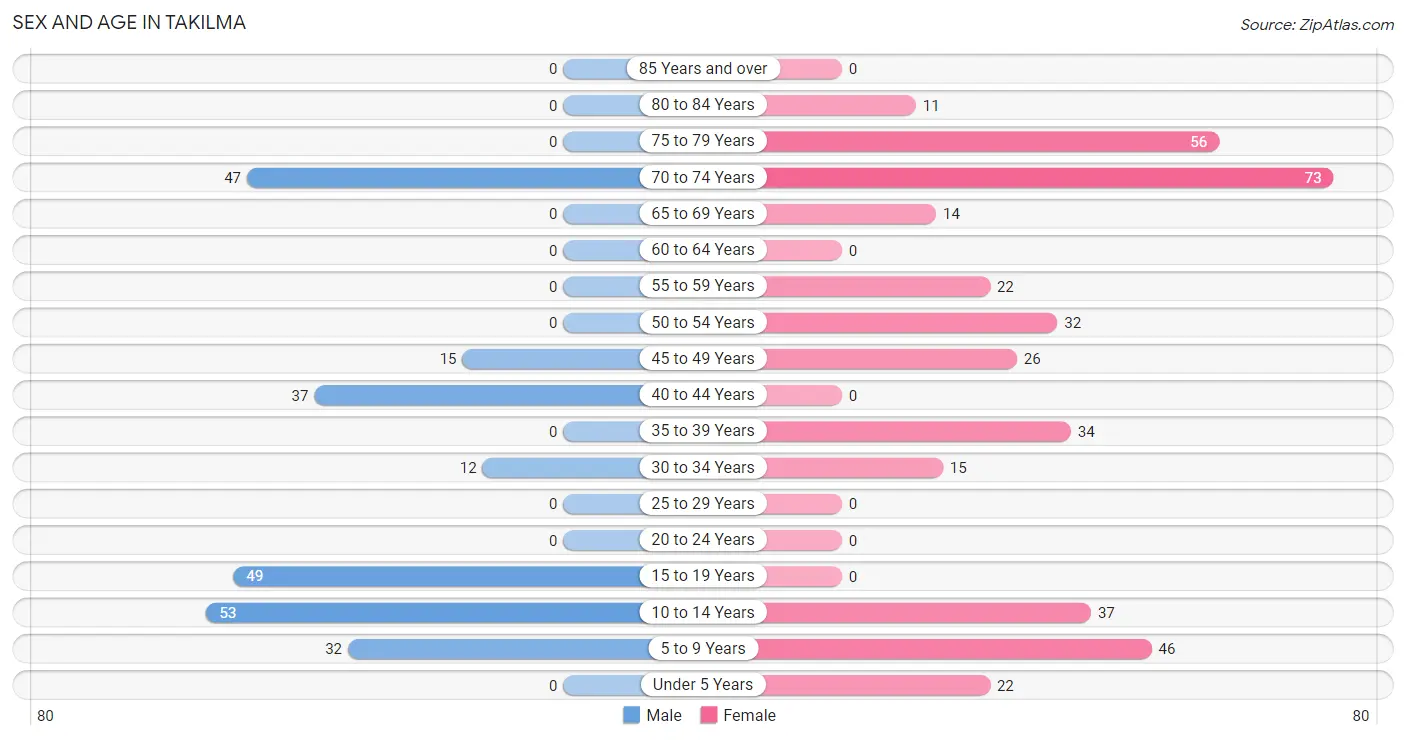
| Age Bracket | Male | Female |
| Under 5 Years | 0 (0.0%) | 22 (5.7%) |
| 5 to 9 Years | 32 (13.1%) | 46 (11.9%) |
| 10 to 14 Years | 53 (21.6%) | 37 (9.5%) |
| 15 to 19 Years | 49 (20.0%) | 0 (0.0%) |
| 20 to 24 Years | 0 (0.0%) | 0 (0.0%) |
| 25 to 29 Years | 0 (0.0%) | 0 (0.0%) |
| 30 to 34 Years | 12 (4.9%) | 15 (3.9%) |
| 35 to 39 Years | 0 (0.0%) | 34 (8.8%) |
| 40 to 44 Years | 37 (15.1%) | 0 (0.0%) |
| 45 to 49 Years | 15 (6.1%) | 26 (6.7%) |
| 50 to 54 Years | 0 (0.0%) | 32 (8.3%) |
| 55 to 59 Years | 0 (0.0%) | 22 (5.7%) |
| 60 to 64 Years | 0 (0.0%) | 0 (0.0%) |
| 65 to 69 Years | 0 (0.0%) | 14 (3.6%) |
| 70 to 74 Years | 47 (19.2%) | 73 (18.8%) |
| 75 to 79 Years | 0 (0.0%) | 56 (14.4%) |
| 80 to 84 Years | 0 (0.0%) | 11 (2.8%) |
| 85 Years and over | 0 (0.0%) | 0 (0.0%) |
| Total | 245 (100.0%) | 388 (100.0%) |
Families and Households in Takilma
Median Family Size in Takilma
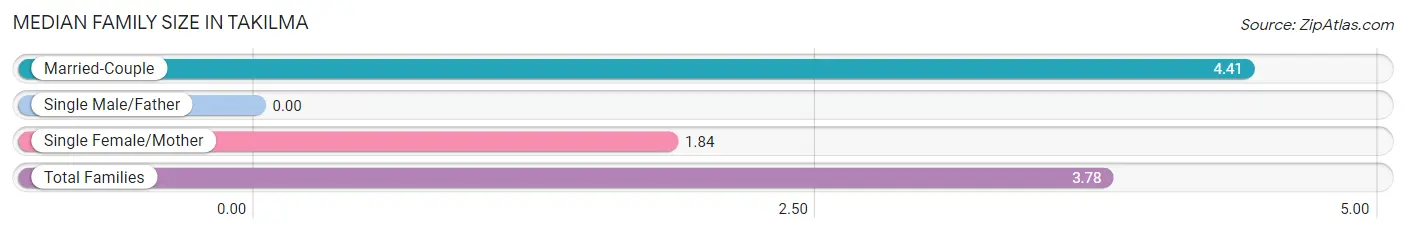
| Family Type | # Families | Family Size |
| Married-Couple | 97 (75.2%) | 4.41 |
| Single Male/Father | 0 (0.0%) | - |
| Single Female/Mother | 32 (24.8%) | 1.84 |
| Total Families | 129 (100.0%) | 3.78 |
Median Household Size in Takilma
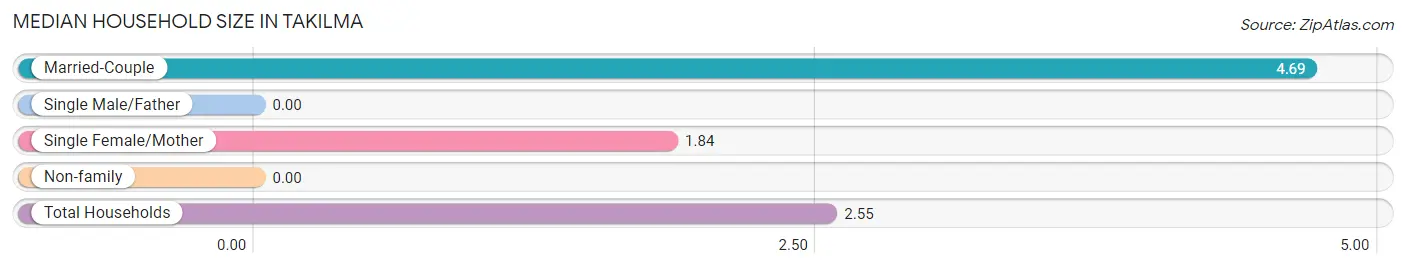
| Household Type | # Households | Household Size |
| Married-Couple | 97 (39.1%) | 4.69 |
| Single Male/Father | 0 (0.0%) | - |
| Single Female/Mother | 32 (12.9%) | 1.84 |
| Non-family | 119 (48.0%) | - |
| Total Households | 248 (100.0%) | 2.55 |
Household Size by Marriage Status in Takilma
Out of a total of 248 households in Takilma, 129 (52.0%) are family households, while 119 (48.0%) are nonfamily households. The most numerous type of family households are 3-person households, comprising 45, and the most common type of nonfamily households are 1-person households, comprising 119.
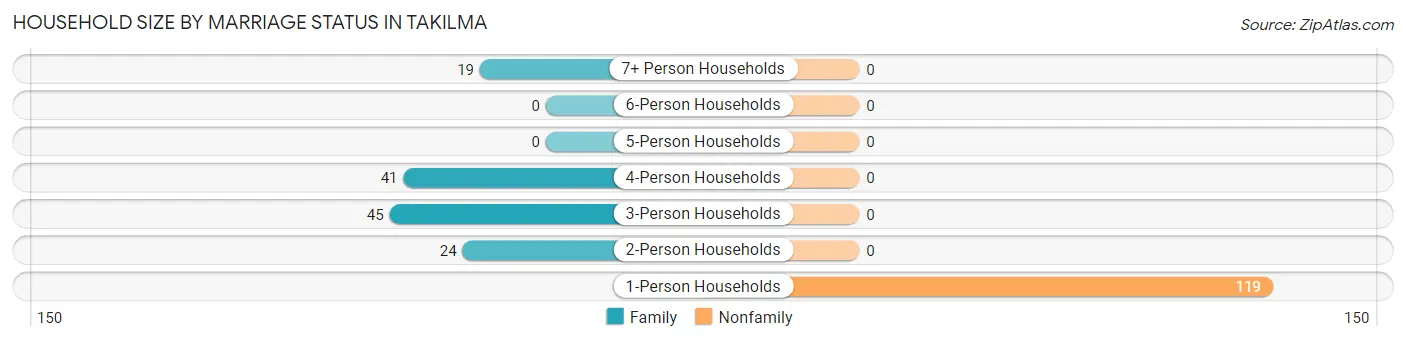
| Household Size | Family Households | Nonfamily Households |
| 1-Person Households | - | 119 (48.0%) |
| 2-Person Households | 24 (9.7%) | 0 (0.0%) |
| 3-Person Households | 45 (18.1%) | 0 (0.0%) |
| 4-Person Households | 41 (16.5%) | 0 (0.0%) |
| 5-Person Households | 0 (0.0%) | 0 (0.0%) |
| 6-Person Households | 0 (0.0%) | 0 (0.0%) |
| 7+ Person Households | 19 (7.7%) | 0 (0.0%) |
| Total | 129 (52.0%) | 119 (48.0%) |
Female Fertility in Takilma
Fertility by Age in Takilma
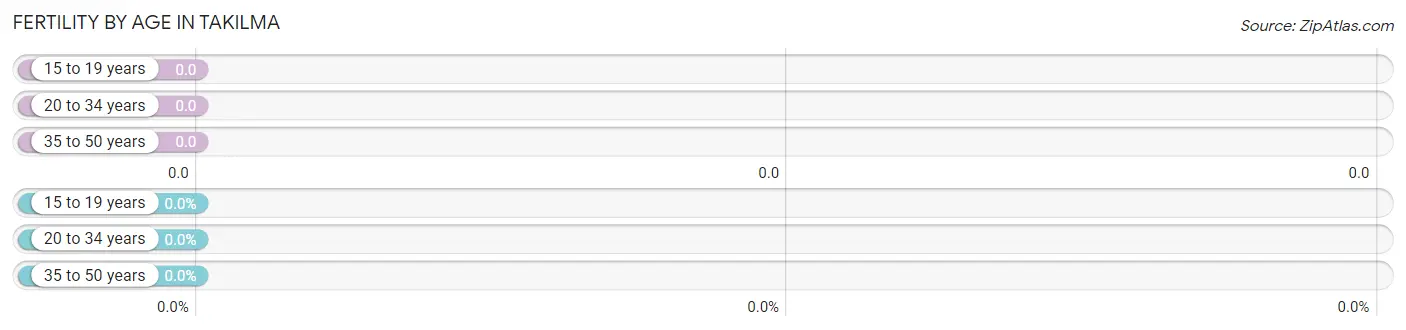
| Age Bracket | Women with Births | Births / 1,000 Women |
| 15 to 19 years | 0 (0.0%) | 0.0 |
| 20 to 34 years | 0 (0.0%) | 0.0 |
| 35 to 50 years | 0 (0.0%) | 0.0 |
| Total | 0 (0.0%) | 0.0 |
Fertility by Age by Marriage Status in Takilma
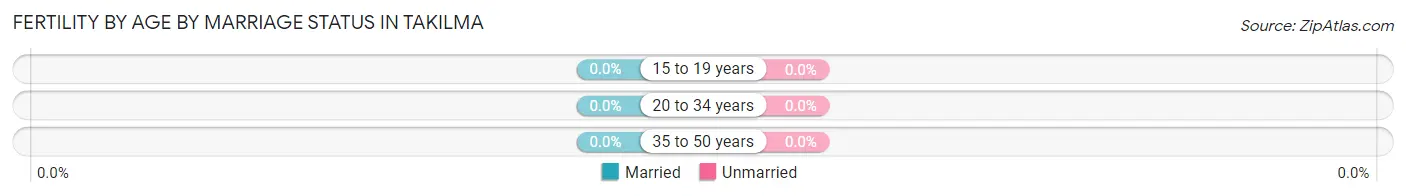
| Age Bracket | Married | Unmarried |
| 15 to 19 years | 0 (0.0%) | 0 (0.0%) |
| 20 to 34 years | 0 (0.0%) | 0 (0.0%) |
| 35 to 50 years | 0 (0.0%) | 0 (0.0%) |
| Total | 0 (0.0%) | 0 (0.0%) |
Fertility by Education in Takilma
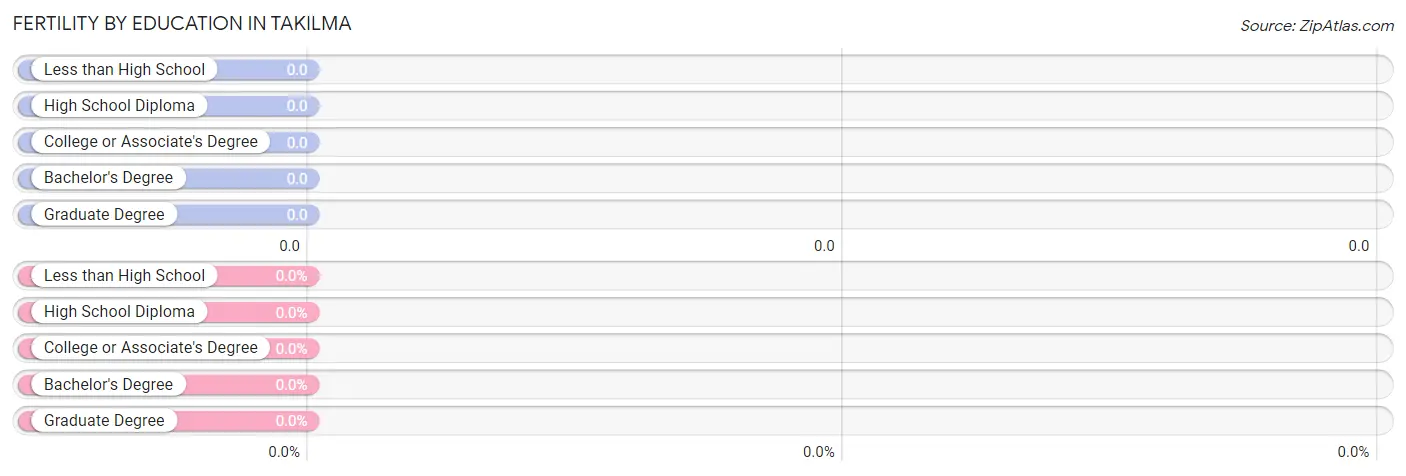
| Educational Attainment | Women with Births | Births / 1,000 Women |
| Less than High School | 0 (0.0%) | 0.0 |
| High School Diploma | 0 (0.0%) | 0.0 |
| College or Associate's Degree | 0 (0.0%) | 0.0 |
| Bachelor's Degree | 0 (0.0%) | 0.0 |
| Graduate Degree | 0 (0.0%) | 0.0 |
| Total | 0 (0.0%) | 0.0 |
Fertility by Education by Marriage Status in Takilma
| Educational Attainment | Married | Unmarried |
| Less than High School | 0 (0.0%) | 0 (0.0%) |
| High School Diploma | 0 (0.0%) | 0 (0.0%) |
| College or Associate's Degree | 0 (0.0%) | 0 (0.0%) |
| Bachelor's Degree | 0 (0.0%) | 0 (0.0%) |
| Graduate Degree | 0 (0.0%) | 0 (0.0%) |
| Total | 0 (0.0%) | 0 (0.0%) |
Employment Characteristics in Takilma
Employment by Class of Employer in Takilma
Among the 244 employed individuals in Takilma, private company employees (122 | 50.0%), not-for-profit organizations (62 | 25.4%), and state government employees (46 | 18.9%) make up the most common classes of employment.
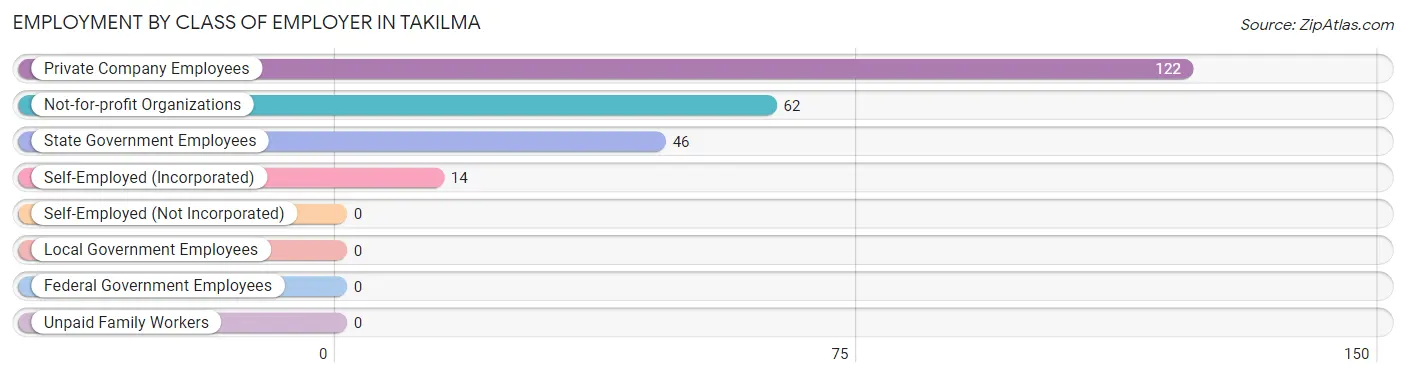
| Employer Class | # Employees | % Employees |
| Private Company Employees | 122 | 50.0% |
| Self-Employed (Incorporated) | 14 | 5.7% |
| Self-Employed (Not Incorporated) | 0 | 0.0% |
| Not-for-profit Organizations | 62 | 25.4% |
| Local Government Employees | 0 | 0.0% |
| State Government Employees | 46 | 18.9% |
| Federal Government Employees | 0 | 0.0% |
| Unpaid Family Workers | 0 | 0.0% |
| Total | 244 | 100.0% |
Employment Status by Age in Takilma
According to the labor force statistics for Takilma, out of the total population over 16 years of age (443), 58.5% or 259 individuals are in the labor force, with 5.8% or 15 of them unemployed. The age group with the highest labor force participation rate is 30 to 34 years, with 100.0% or 27 individuals in the labor force. Within the labor force, the 45 to 54 years age range has the highest percentage of unemployed individuals, with 31.9% or 15 of them being unemployed.
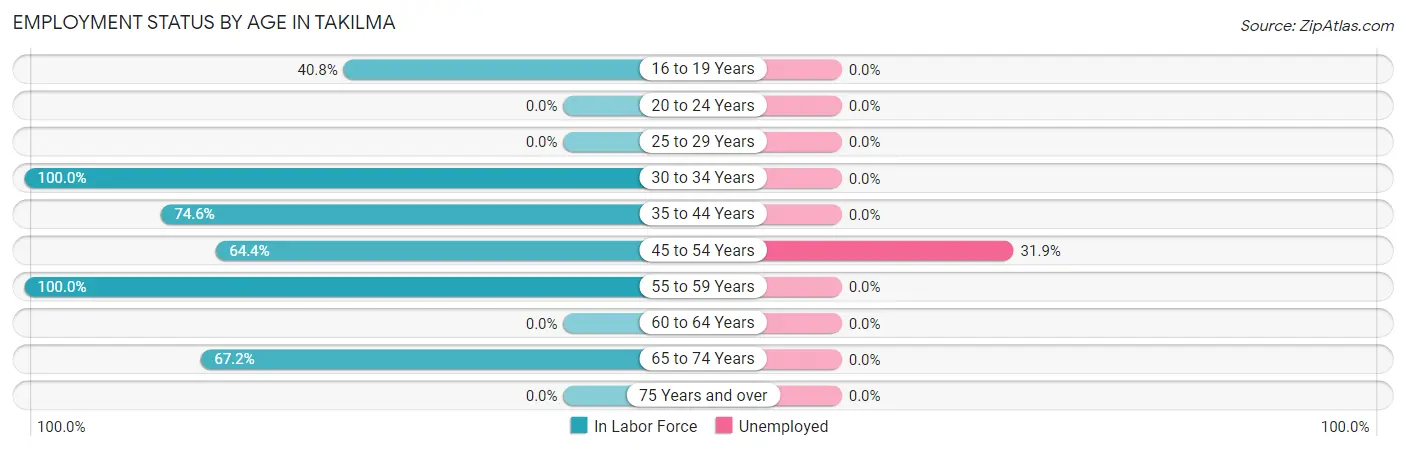
| Age Bracket | In Labor Force | Unemployed |
| 16 to 19 Years | 20 (40.8%) | 0 (0.0%) |
| 20 to 24 Years | 0 (0.0%) | 0 (0.0%) |
| 25 to 29 Years | 0 (0.0%) | 0 (0.0%) |
| 30 to 34 Years | 27 (100.0%) | 0 (0.0%) |
| 35 to 44 Years | 53 (74.6%) | 0 (0.0%) |
| 45 to 54 Years | 47 (64.4%) | 15 (31.9%) |
| 55 to 59 Years | 22 (100.0%) | 0 (0.0%) |
| 60 to 64 Years | 0 (0.0%) | 0 (0.0%) |
| 65 to 74 Years | 90 (67.2%) | 0 (0.0%) |
| 75 Years and over | 0 (0.0%) | 0 (0.0%) |
| Total | 259 (58.5%) | 15 (5.8%) |
Employment Status by Educational Attainment in Takilma
According to labor force statistics for Takilma, 77.2% of individuals (149) out of the total population between 25 and 64 years of age (193) are in the labor force, with 10.1% or 15 of them being unemployed. The group with the highest labor force participation rate are those with the educational attainment of less than high school, with 100.0% or 18 individuals in the labor force. Within the labor force, individuals with college / associate degree education have the highest percentage of unemployment, with 24.2% or 15 of them being unemployed.
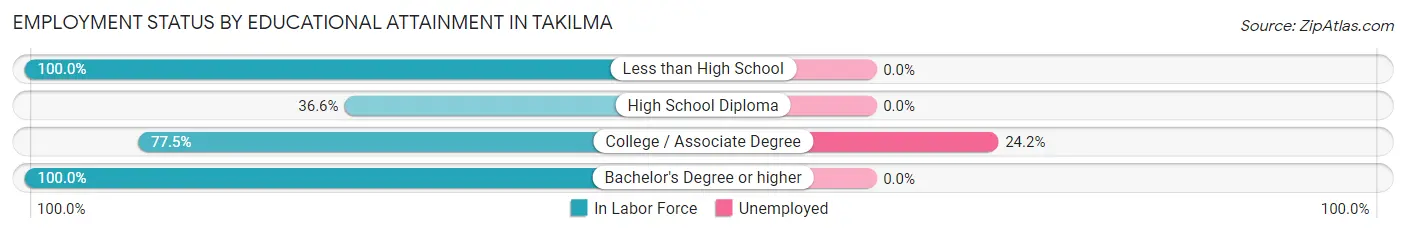
| Educational Attainment | In Labor Force | Unemployed |
| Less than High School | 18 (100.0%) | 0 (0.0%) |
| High School Diploma | 15 (36.6%) | 0 (0.0%) |
| College / Associate Degree | 62 (77.5%) | 19 (24.2%) |
| Bachelor's Degree or higher | 54 (100.0%) | 0 (0.0%) |
| Total | 149 (77.2%) | 19 (10.1%) |
Employment Occupations by Sex in Takilma
Management, Business, Science and Arts Occupations
The most common Management, Business, Science and Arts occupations in Takilma are Business & Financial (49 | 20.1%), Community & Social Service (19 | 7.8%), Arts, Media & Entertainment (19 | 7.8%), and Management (13 | 5.3%).
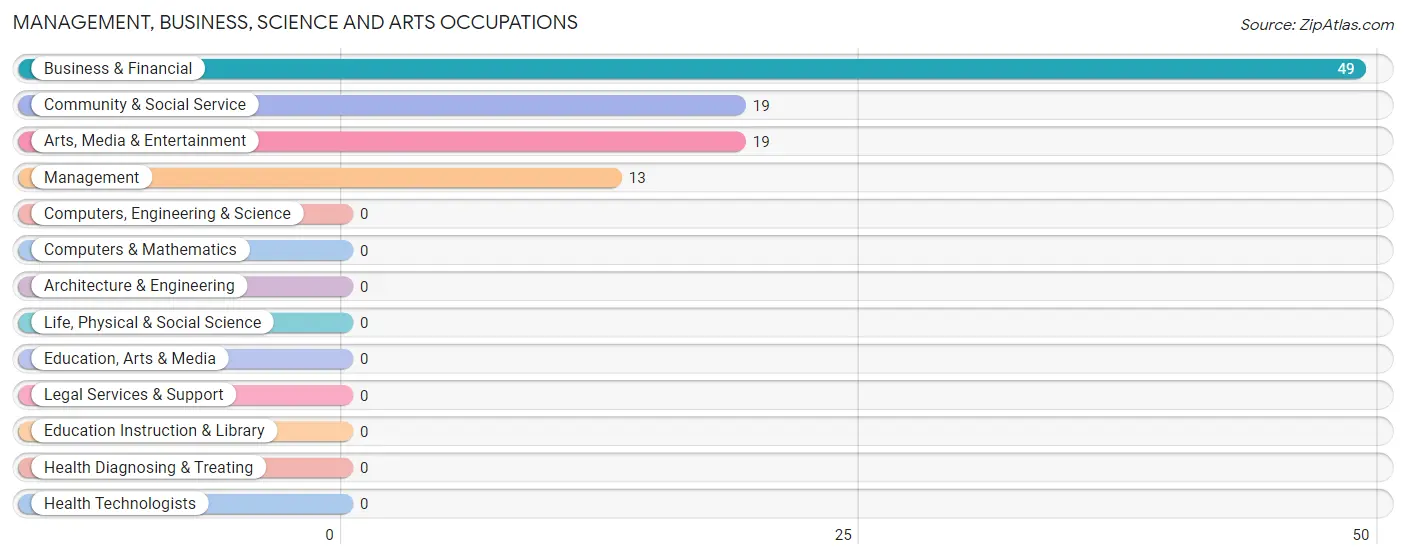
Management, Business, Science and Arts Occupations by Sex
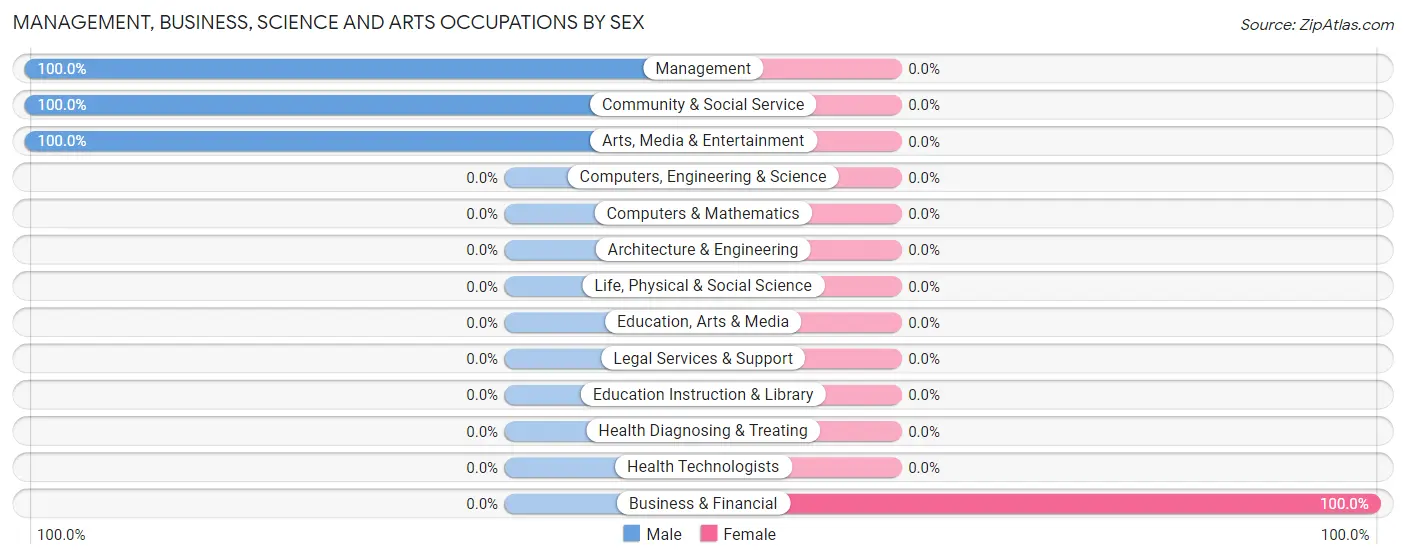
| Occupation | Male | Female |
| Management | 13 (100.0%) | 0 (0.0%) |
| Business & Financial | 0 (0.0%) | 49 (100.0%) |
| Computers, Engineering & Science | 0 (0.0%) | 0 (0.0%) |
| Computers & Mathematics | 0 (0.0%) | 0 (0.0%) |
| Architecture & Engineering | 0 (0.0%) | 0 (0.0%) |
| Life, Physical & Social Science | 0 (0.0%) | 0 (0.0%) |
| Community & Social Service | 19 (100.0%) | 0 (0.0%) |
| Education, Arts & Media | 0 (0.0%) | 0 (0.0%) |
| Legal Services & Support | 0 (0.0%) | 0 (0.0%) |
| Education Instruction & Library | 0 (0.0%) | 0 (0.0%) |
| Arts, Media & Entertainment | 19 (100.0%) | 0 (0.0%) |
| Health Diagnosing & Treating | 0 (0.0%) | 0 (0.0%) |
| Health Technologists | 0 (0.0%) | 0 (0.0%) |
| Total (Category) | 32 (39.5%) | 49 (60.5%) |
| Total (Overall) | 82 (33.6%) | 162 (66.4%) |
Services Occupations
The most common Services occupations in Takilma are Healthcare Support (61 | 25.0%), and Food Preparation & Serving (36 | 14.7%).
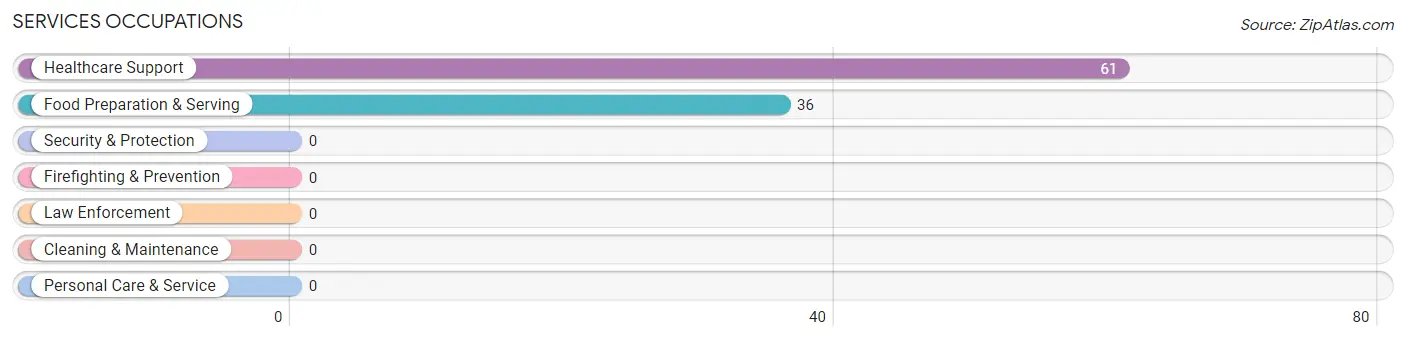
Services Occupations by Sex
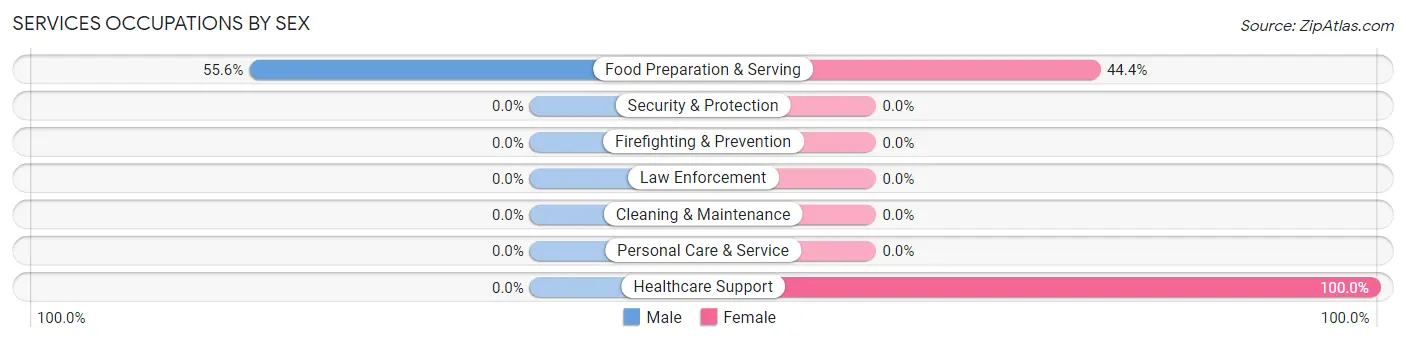
| Occupation | Male | Female |
| Healthcare Support | 0 (0.0%) | 61 (100.0%) |
| Security & Protection | 0 (0.0%) | 0 (0.0%) |
| Firefighting & Prevention | 0 (0.0%) | 0 (0.0%) |
| Law Enforcement | 0 (0.0%) | 0 (0.0%) |
| Food Preparation & Serving | 20 (55.6%) | 16 (44.4%) |
| Cleaning & Maintenance | 0 (0.0%) | 0 (0.0%) |
| Personal Care & Service | 0 (0.0%) | 0 (0.0%) |
| Total (Category) | 20 (20.6%) | 77 (79.4%) |
| Total (Overall) | 82 (33.6%) | 162 (66.4%) |
Sales and Office Occupations
The most common Sales and Office occupations in Takilma are , and Office & Administration (14 | 5.7%).
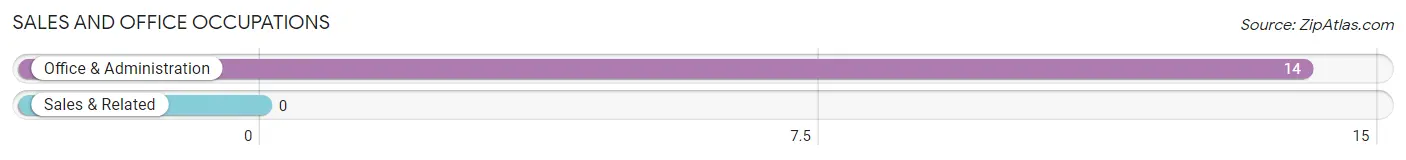
Sales and Office Occupations by Sex
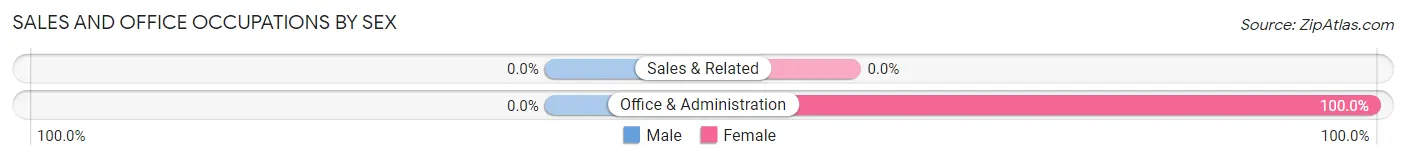
| Occupation | Male | Female |
| Sales & Related | 0 (0.0%) | 0 (0.0%) |
| Office & Administration | 0 (0.0%) | 14 (100.0%) |
| Total (Category) | 0 (0.0%) | 14 (100.0%) |
| Total (Overall) | 82 (33.6%) | 162 (66.4%) |
Natural Resources, Construction and Maintenance Occupations
The most common Natural Resources, Construction and Maintenance occupations in Takilma are Installation, Maintenance & Repair (18 | 7.4%), and Construction & Extraction (12 | 4.9%).
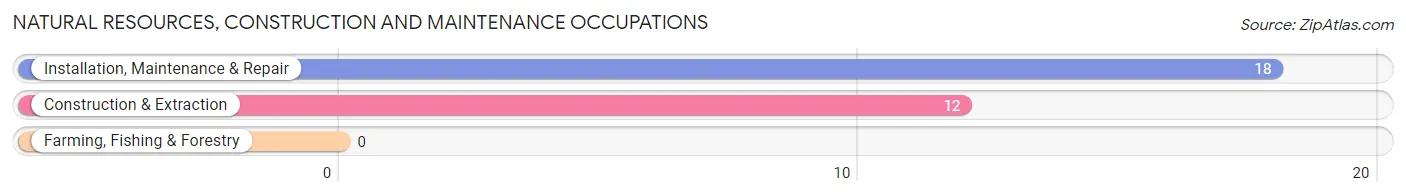
Natural Resources, Construction and Maintenance Occupations by Sex
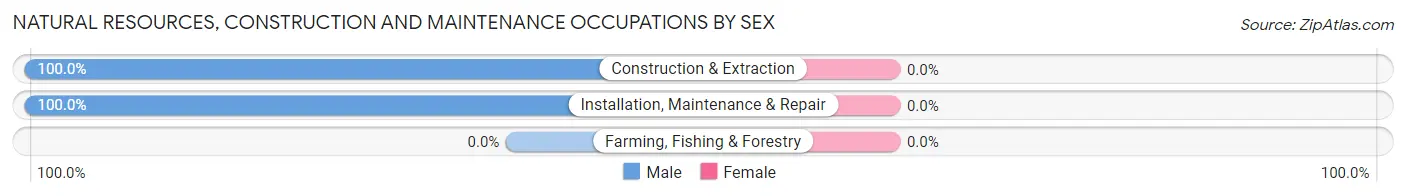
| Occupation | Male | Female |
| Farming, Fishing & Forestry | 0 (0.0%) | 0 (0.0%) |
| Construction & Extraction | 12 (100.0%) | 0 (0.0%) |
| Installation, Maintenance & Repair | 18 (100.0%) | 0 (0.0%) |
| Total (Category) | 30 (100.0%) | 0 (0.0%) |
| Total (Overall) | 82 (33.6%) | 162 (66.4%) |
Production, Transportation and Moving Occupations
The most common Production, Transportation and Moving occupations in Takilma are Production (12 | 4.9%), and Material Moving (10 | 4.1%).
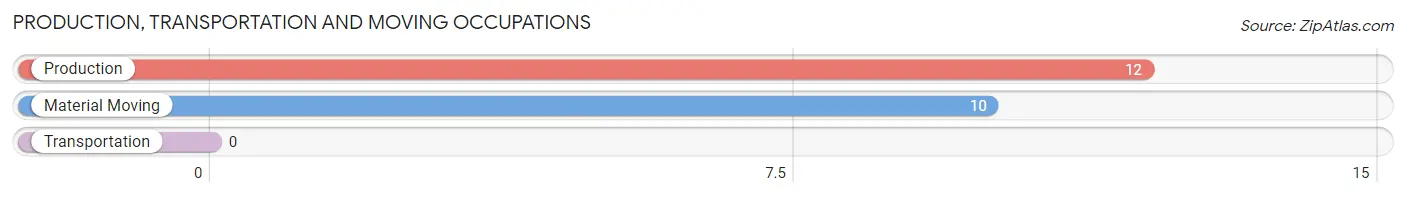
Production, Transportation and Moving Occupations by Sex
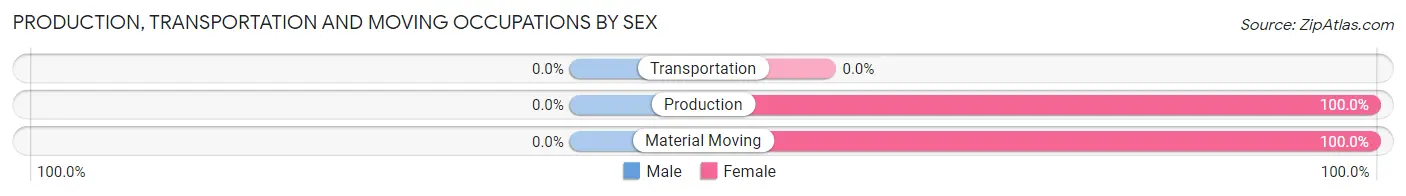
| Occupation | Male | Female |
| Production | 0 (0.0%) | 12 (100.0%) |
| Transportation | 0 (0.0%) | 0 (0.0%) |
| Material Moving | 0 (0.0%) | 10 (100.0%) |
| Total (Category) | 0 (0.0%) | 22 (100.0%) |
| Total (Overall) | 82 (33.6%) | 162 (66.4%) |
Employment Industries by Sex in Takilma
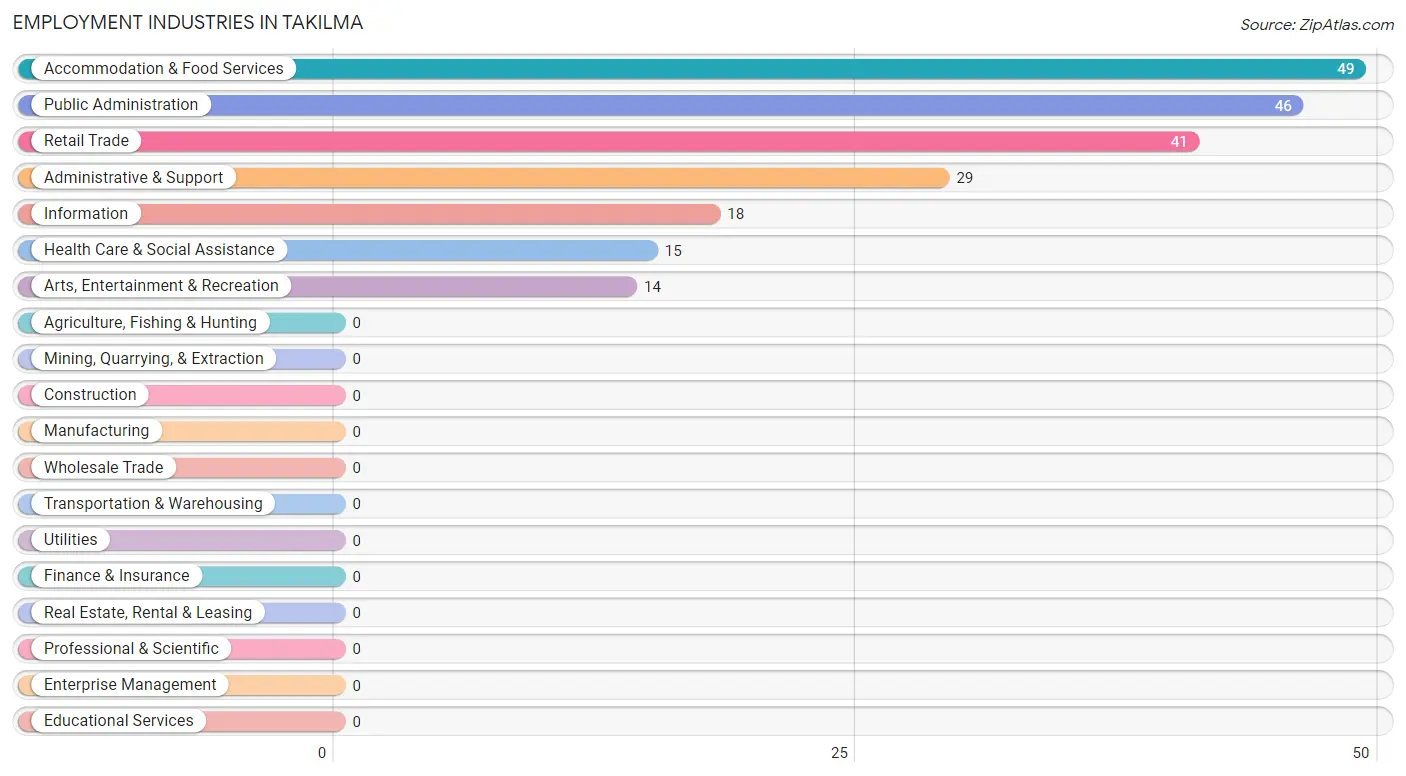
Employment Industries in Takilma
The major employment industries in Takilma include Accommodation & Food Services (49 | 20.1%), Public Administration (46 | 18.9%), Retail Trade (41 | 16.8%), Administrative & Support (29 | 11.9%), and Information (18 | 7.4%).
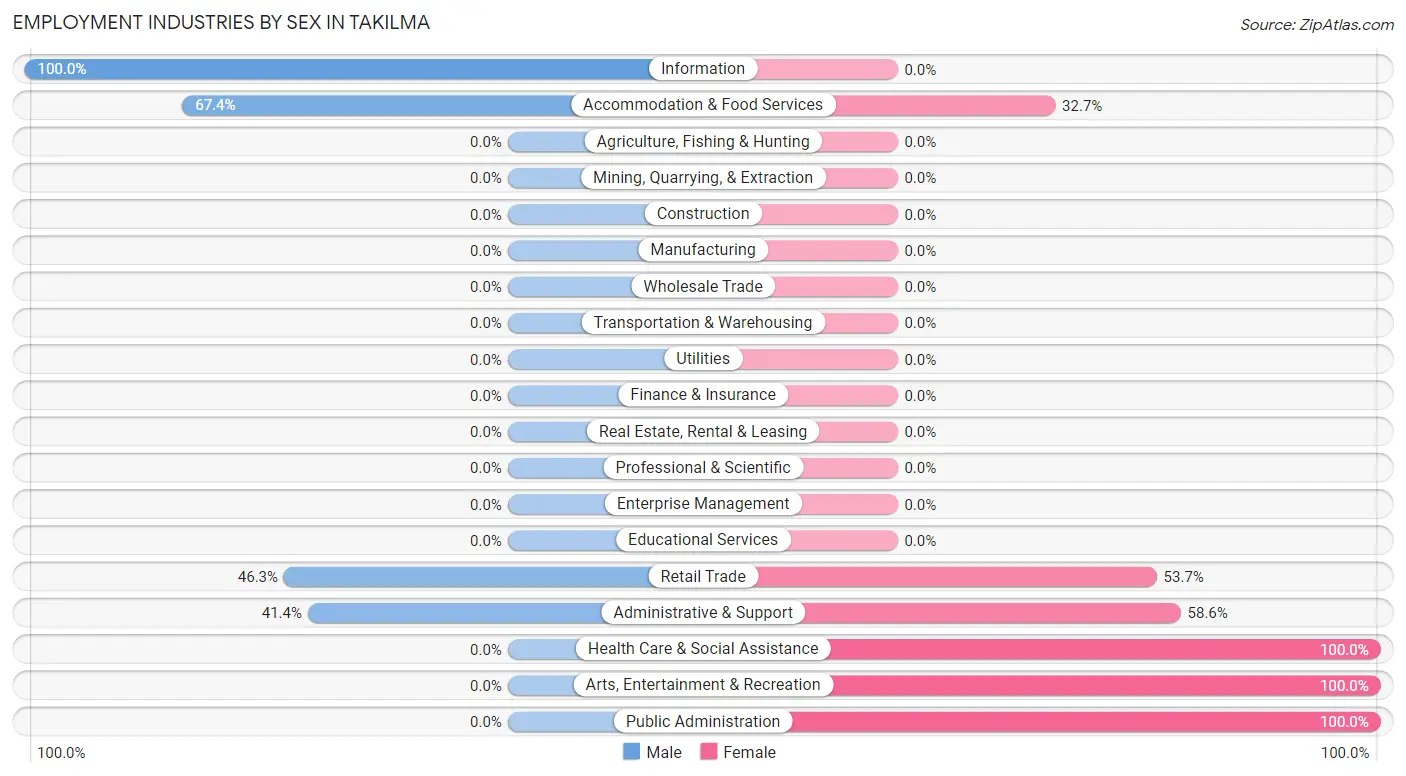
Employment Industries by Sex in Takilma
The Takilma industries that see more men than women are Information (100.0%), Accommodation & Food Services (67.3%), and Retail Trade (46.3%), whereas the industries that tend to have a higher number of women are Health Care & Social Assistance (100.0%), Arts, Entertainment & Recreation (100.0%), and Public Administration (100.0%).
| Industry | Male | Female |
| Agriculture, Fishing & Hunting | 0 (0.0%) | 0 (0.0%) |
| Mining, Quarrying, & Extraction | 0 (0.0%) | 0 (0.0%) |
| Construction | 0 (0.0%) | 0 (0.0%) |
| Manufacturing | 0 (0.0%) | 0 (0.0%) |
| Wholesale Trade | 0 (0.0%) | 0 (0.0%) |
| Retail Trade | 19 (46.3%) | 22 (53.7%) |
| Transportation & Warehousing | 0 (0.0%) | 0 (0.0%) |
| Utilities | 0 (0.0%) | 0 (0.0%) |
| Information | 18 (100.0%) | 0 (0.0%) |
| Finance & Insurance | 0 (0.0%) | 0 (0.0%) |
| Real Estate, Rental & Leasing | 0 (0.0%) | 0 (0.0%) |
| Professional & Scientific | 0 (0.0%) | 0 (0.0%) |
| Enterprise Management | 0 (0.0%) | 0 (0.0%) |
| Administrative & Support | 12 (41.4%) | 17 (58.6%) |
| Educational Services | 0 (0.0%) | 0 (0.0%) |
| Health Care & Social Assistance | 0 (0.0%) | 15 (100.0%) |
| Arts, Entertainment & Recreation | 0 (0.0%) | 14 (100.0%) |
| Accommodation & Food Services | 33 (67.3%) | 16 (32.7%) |
| Public Administration | 0 (0.0%) | 46 (100.0%) |
| Total | 82 (33.6%) | 162 (66.4%) |
Education in Takilma
School Enrollment in Takilma
The most common levels of schooling among the 194 students in Takilma are middle school (75 | 38.7%), high school (64 | 33.0%), and elementary school (55 | 28.3%).
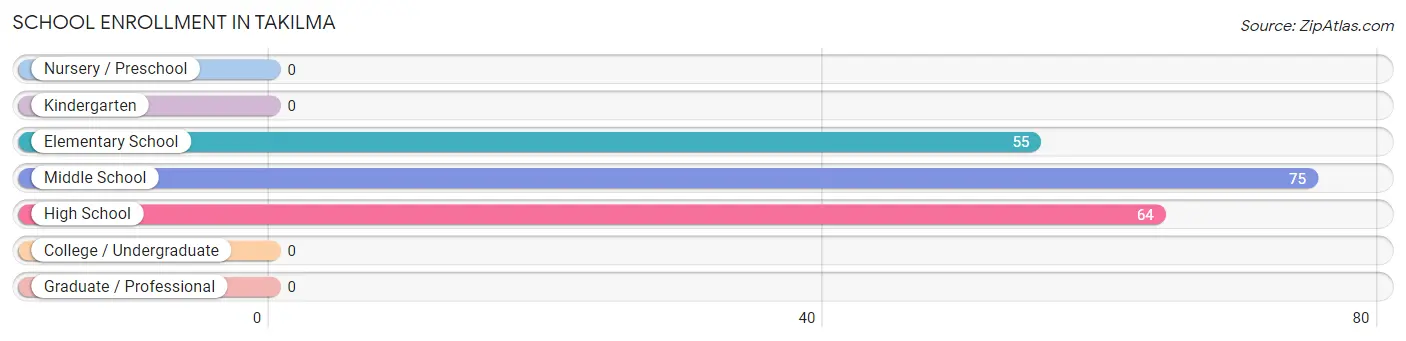
| School Level | # Students | % Students |
| Nursery / Preschool | 0 | 0.0% |
| Kindergarten | 0 | 0.0% |
| Elementary School | 55 | 28.3% |
| Middle School | 75 | 38.7% |
| High School | 64 | 33.0% |
| College / Undergraduate | 0 | 0.0% |
| Graduate / Professional | 0 | 0.0% |
| Total | 194 | 100.0% |
School Enrollment by Age by Funding Source in Takilma
Out of a total of 194 students who are enrolled in schools in Takilma, 80 (41.2%) attend a private institution, while the remaining 114 (58.8%) are enrolled in public schools. The age group of 18 to 19 year olds has the highest likelihood of being enrolled in private schools, with 20 (100.0% in the age bracket) enrolled. Conversely, the age group of 15 to 17 year olds has the lowest likelihood of being enrolled in a private school, with 29 (100.0% in the age bracket) attending a public institution.
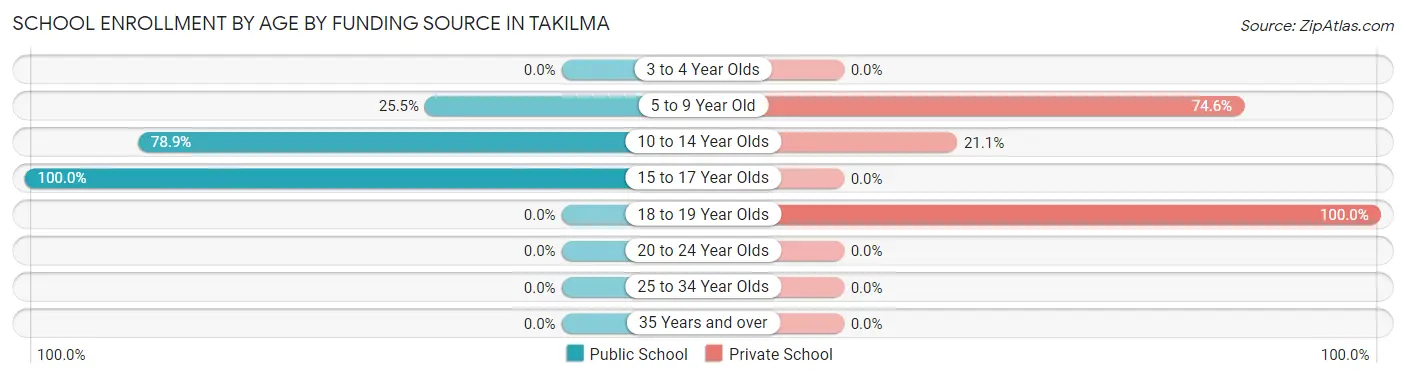
| Age Bracket | Public School | Private School |
| 3 to 4 Year Olds | 0 (0.0%) | 0 (0.0%) |
| 5 to 9 Year Old | 14 (25.5%) | 41 (74.6%) |
| 10 to 14 Year Olds | 71 (78.9%) | 19 (21.1%) |
| 15 to 17 Year Olds | 29 (100.0%) | 0 (0.0%) |
| 18 to 19 Year Olds | 0 (0.0%) | 20 (100.0%) |
| 20 to 24 Year Olds | 0 (0.0%) | 0 (0.0%) |
| 25 to 34 Year Olds | 0 (0.0%) | 0 (0.0%) |
| 35 Years and over | 0 (0.0%) | 0 (0.0%) |
| Total | 114 (58.8%) | 80 (41.2%) |
Educational Attainment by Field of Study in Takilma
Literature & languages (56 | 33.7%), science & technology (50 | 30.1%), visual & performing arts (35 | 21.1%), and education (25 | 15.1%) are the most common fields of study among 166 individuals in Takilma who have obtained a bachelor's degree or higher.
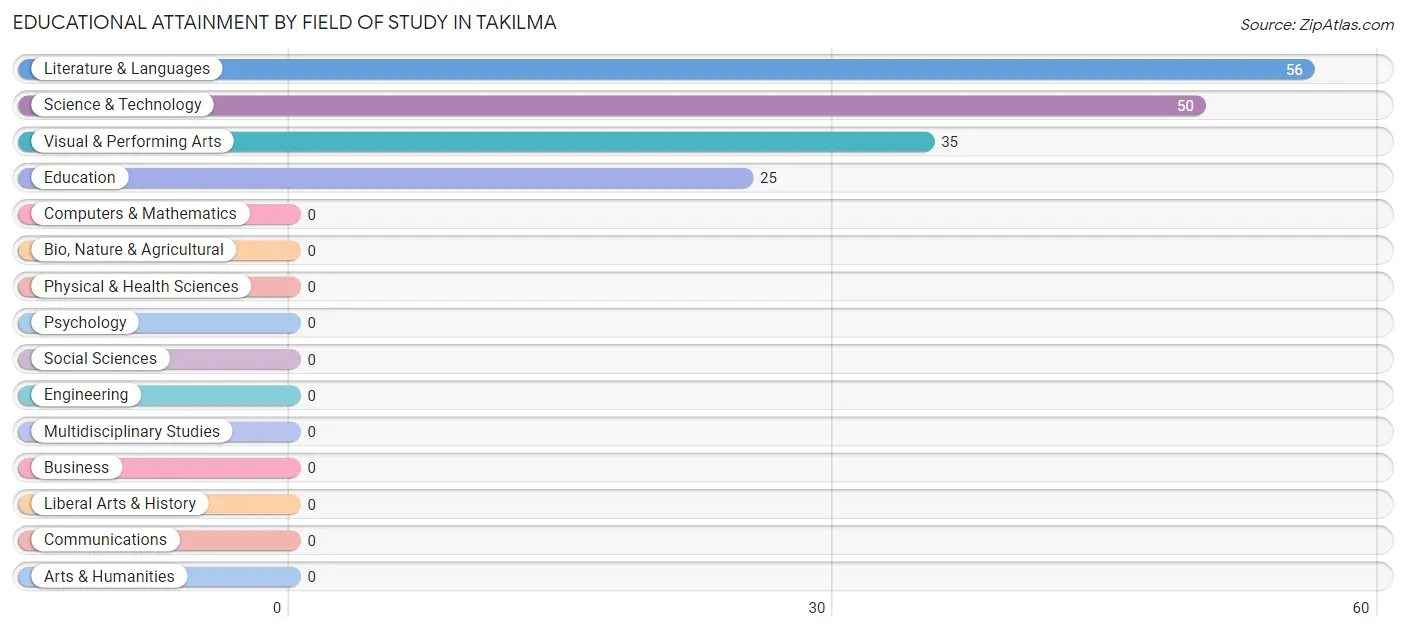
| Field of Study | # Graduates | % Graduates |
| Computers & Mathematics | 0 | 0.0% |
| Bio, Nature & Agricultural | 0 | 0.0% |
| Physical & Health Sciences | 0 | 0.0% |
| Psychology | 0 | 0.0% |
| Social Sciences | 0 | 0.0% |
| Engineering | 0 | 0.0% |
| Multidisciplinary Studies | 0 | 0.0% |
| Science & Technology | 50 | 30.1% |
| Business | 0 | 0.0% |
| Education | 25 | 15.1% |
| Literature & Languages | 56 | 33.7% |
| Liberal Arts & History | 0 | 0.0% |
| Visual & Performing Arts | 35 | 21.1% |
| Communications | 0 | 0.0% |
| Arts & Humanities | 0 | 0.0% |
| Total | 166 | 100.0% |
Transportation & Commute in Takilma
Vehicle Availability by Sex in Takilma
The most prevalent vehicle ownership categories in Takilma are males with 3 vehicles (52, accounting for 63.4%) and females with 3 vehicles (56, making up 32.1%).
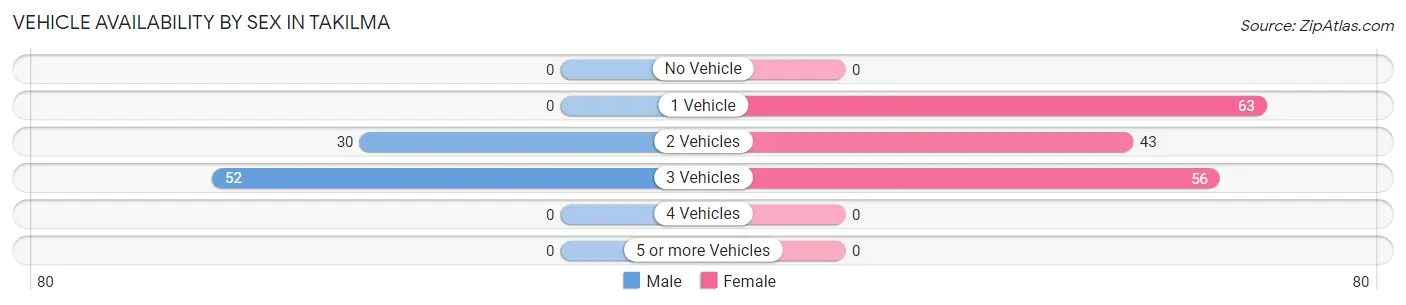
| Vehicles Available | Male | Female |
| No Vehicle | 0 (0.0%) | 0 (0.0%) |
| 1 Vehicle | 0 (0.0%) | 63 (38.9%) |
| 2 Vehicles | 30 (36.6%) | 43 (26.5%) |
| 3 Vehicles | 52 (63.4%) | 56 (34.6%) |
| 4 Vehicles | 0 (0.0%) | 0 (0.0%) |
| 5 or more Vehicles | 0 (0.0%) | 0 (0.0%) |
| Total | 82 (100.0%) | 162 (100.0%) |
Commute Time in Takilma
The most frequently occuring commute durations in Takilma are 15 to 19 minutes (78 commuters, 35.9%), 10 to 14 minutes (61 commuters, 28.1%), and 20 to 24 minutes (25 commuters, 11.5%).
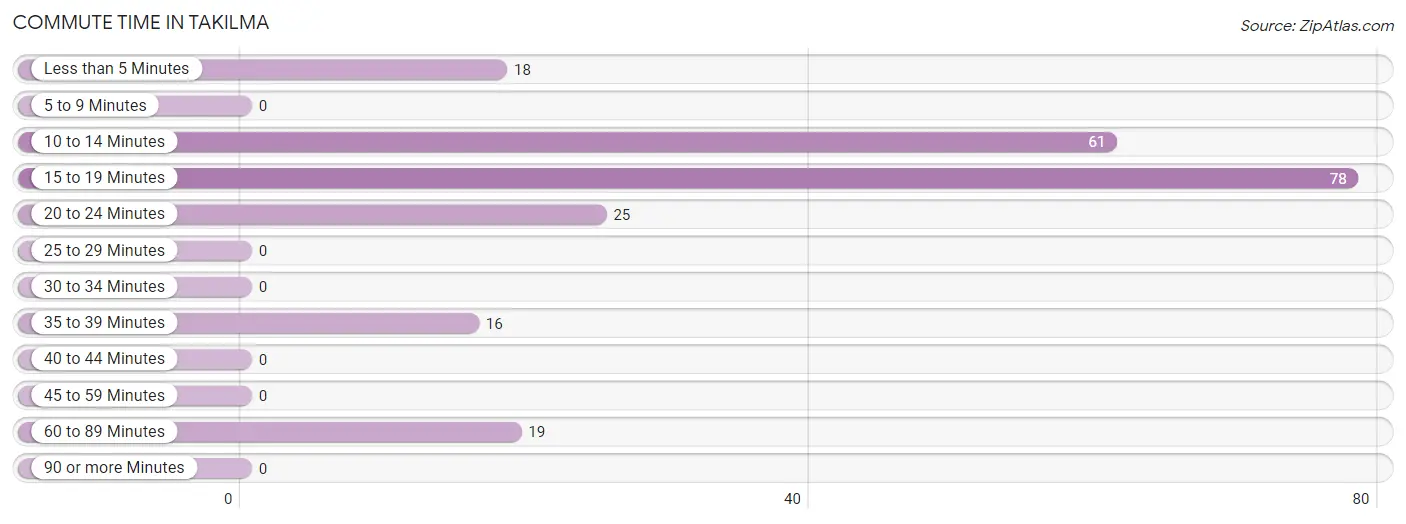
| Commute Time | # Commuters | % Commuters |
| Less than 5 Minutes | 18 | 8.3% |
| 5 to 9 Minutes | 0 | 0.0% |
| 10 to 14 Minutes | 61 | 28.1% |
| 15 to 19 Minutes | 78 | 35.9% |
| 20 to 24 Minutes | 25 | 11.5% |
| 25 to 29 Minutes | 0 | 0.0% |
| 30 to 34 Minutes | 0 | 0.0% |
| 35 to 39 Minutes | 16 | 7.4% |
| 40 to 44 Minutes | 0 | 0.0% |
| 45 to 59 Minutes | 0 | 0.0% |
| 60 to 89 Minutes | 19 | 8.8% |
| 90 or more Minutes | 0 | 0.0% |
Commute Time by Sex in Takilma
The most common commute times in Takilma are 10 to 14 minutes (32 commuters, 46.4%) for males and 15 to 19 minutes (78 commuters, 52.7%) for females.
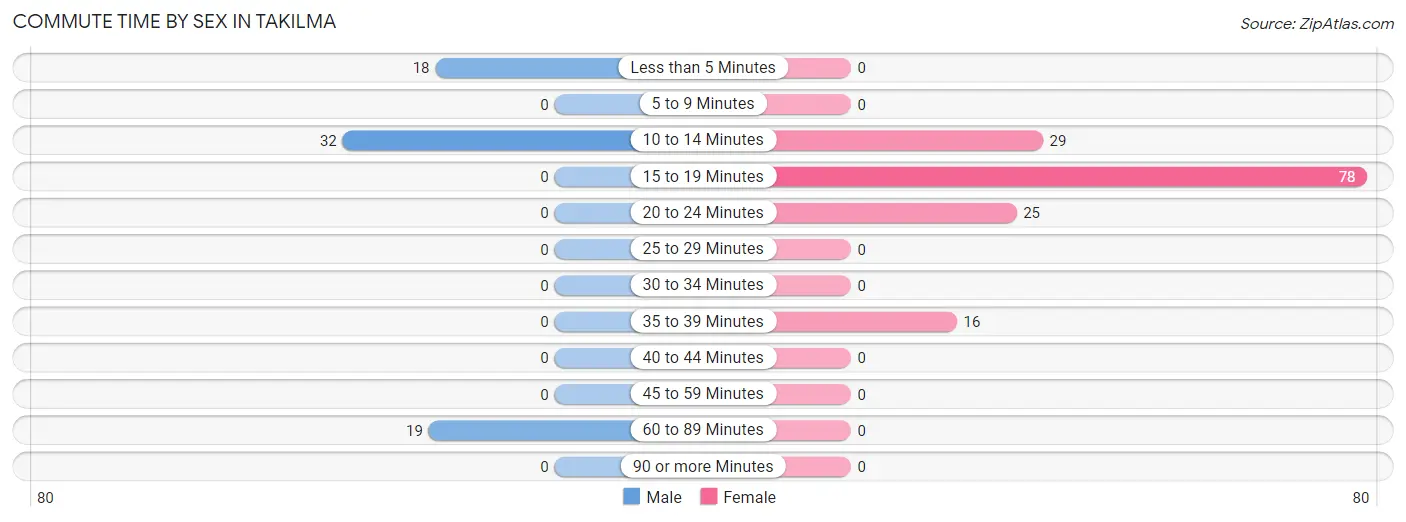
| Commute Time | Male | Female |
| Less than 5 Minutes | 18 (26.1%) | 0 (0.0%) |
| 5 to 9 Minutes | 0 (0.0%) | 0 (0.0%) |
| 10 to 14 Minutes | 32 (46.4%) | 29 (19.6%) |
| 15 to 19 Minutes | 0 (0.0%) | 78 (52.7%) |
| 20 to 24 Minutes | 0 (0.0%) | 25 (16.9%) |
| 25 to 29 Minutes | 0 (0.0%) | 0 (0.0%) |
| 30 to 34 Minutes | 0 (0.0%) | 0 (0.0%) |
| 35 to 39 Minutes | 0 (0.0%) | 16 (10.8%) |
| 40 to 44 Minutes | 0 (0.0%) | 0 (0.0%) |
| 45 to 59 Minutes | 0 (0.0%) | 0 (0.0%) |
| 60 to 89 Minutes | 19 (27.5%) | 0 (0.0%) |
| 90 or more Minutes | 0 (0.0%) | 0 (0.0%) |
Time of Departure to Work by Sex in Takilma
The most frequent times of departure to work in Takilma are 6:00 AM to 6:29 AM (32, 46.4%) for males and 4:00 PM to 11:59 PM (79, 53.4%) for females.
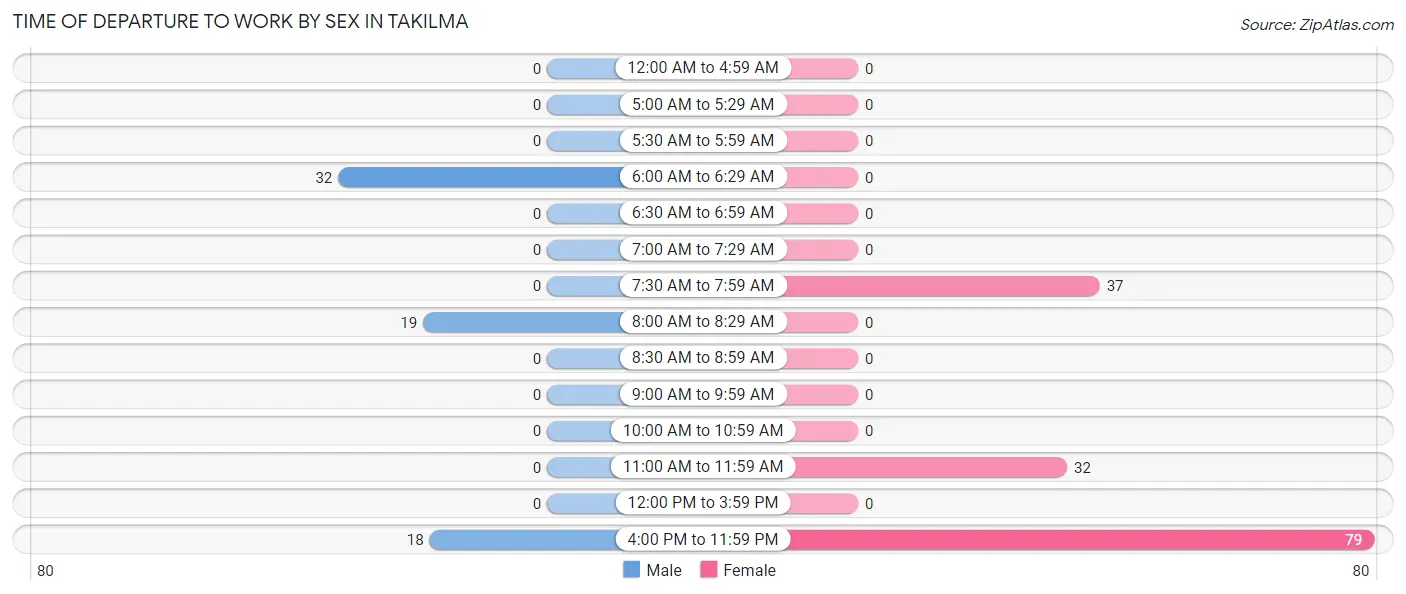
| Time of Departure | Male | Female |
| 12:00 AM to 4:59 AM | 0 (0.0%) | 0 (0.0%) |
| 5:00 AM to 5:29 AM | 0 (0.0%) | 0 (0.0%) |
| 5:30 AM to 5:59 AM | 0 (0.0%) | 0 (0.0%) |
| 6:00 AM to 6:29 AM | 32 (46.4%) | 0 (0.0%) |
| 6:30 AM to 6:59 AM | 0 (0.0%) | 0 (0.0%) |
| 7:00 AM to 7:29 AM | 0 (0.0%) | 0 (0.0%) |
| 7:30 AM to 7:59 AM | 0 (0.0%) | 37 (25.0%) |
| 8:00 AM to 8:29 AM | 19 (27.5%) | 0 (0.0%) |
| 8:30 AM to 8:59 AM | 0 (0.0%) | 0 (0.0%) |
| 9:00 AM to 9:59 AM | 0 (0.0%) | 0 (0.0%) |
| 10:00 AM to 10:59 AM | 0 (0.0%) | 0 (0.0%) |
| 11:00 AM to 11:59 AM | 0 (0.0%) | 32 (21.6%) |
| 12:00 PM to 3:59 PM | 0 (0.0%) | 0 (0.0%) |
| 4:00 PM to 11:59 PM | 18 (26.1%) | 79 (53.4%) |
| Total | 69 (100.0%) | 148 (100.0%) |
Housing Occupancy in Takilma
Occupancy by Ownership in Takilma
Of the total 248 dwellings in Takilma, owner-occupied units account for 193 (77.8%), while renter-occupied units make up 55 (22.2%).
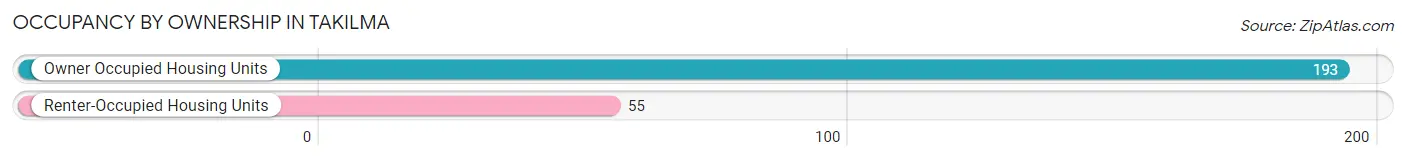
| Occupancy | # Housing Units | % Housing Units |
| Owner Occupied Housing Units | 193 | 77.8% |
| Renter-Occupied Housing Units | 55 | 22.2% |
| Total Occupied Housing Units | 248 | 100.0% |
Occupancy by Household Size in Takilma
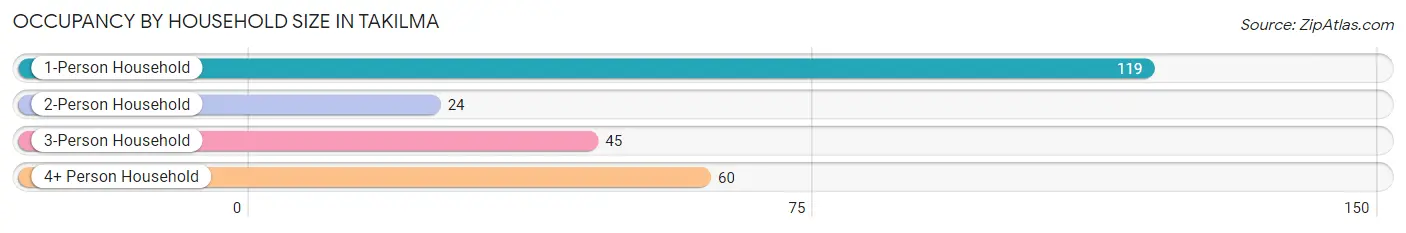
| Household Size | # Housing Units | % Housing Units |
| 1-Person Household | 119 | 48.0% |
| 2-Person Household | 24 | 9.7% |
| 3-Person Household | 45 | 18.1% |
| 4+ Person Household | 60 | 24.2% |
| Total Housing Units | 248 | 100.0% |
Occupancy by Ownership by Household Size in Takilma
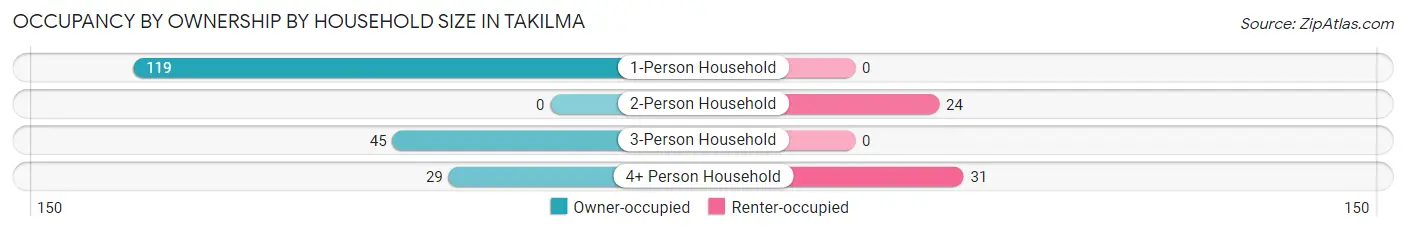
| Household Size | Owner-occupied | Renter-occupied |
| 1-Person Household | 119 (100.0%) | 0 (0.0%) |
| 2-Person Household | 0 (0.0%) | 24 (100.0%) |
| 3-Person Household | 45 (100.0%) | 0 (0.0%) |
| 4+ Person Household | 29 (48.3%) | 31 (51.7%) |
| Total Housing Units | 193 (77.8%) | 55 (22.2%) |
Occupancy by Educational Attainment in Takilma
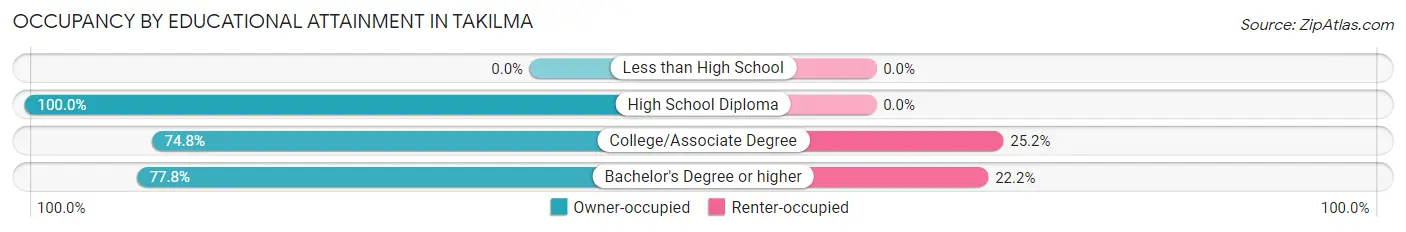
| Household Size | Owner-occupied | Renter-occupied |
| Less than High School | 0 (0.0%) | 0 (0.0%) |
| High School Diploma | 17 (100.0%) | 0 (0.0%) |
| College/Associate Degree | 92 (74.8%) | 31 (25.2%) |
| Bachelor's Degree or higher | 84 (77.8%) | 24 (22.2%) |
Occupancy by Age of Householder in Takilma
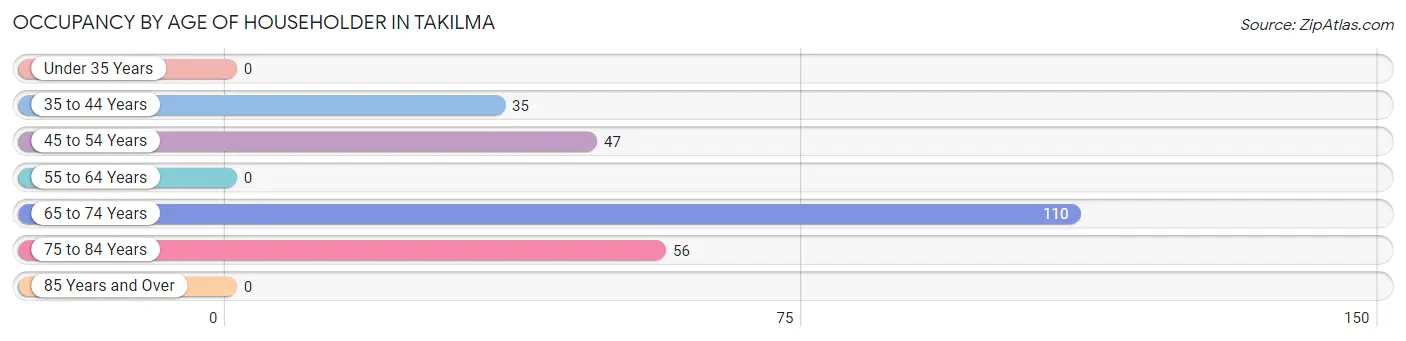
| Age Bracket | # Households | % Households |
| Under 35 Years | 0 | 0.0% |
| 35 to 44 Years | 35 | 14.1% |
| 45 to 54 Years | 47 | 19.0% |
| 55 to 64 Years | 0 | 0.0% |
| 65 to 74 Years | 110 | 44.4% |
| 75 to 84 Years | 56 | 22.6% |
| 85 Years and Over | 0 | 0.0% |
| Total | 248 | 100.0% |
Housing Finances in Takilma
Median Income by Occupancy in Takilma
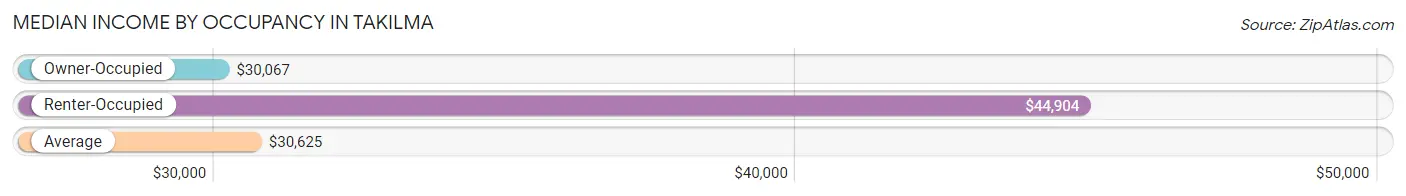
| Occupancy Type | # Households | Median Income |
| Owner-Occupied | 193 (77.8%) | $30,067 |
| Renter-Occupied | 55 (22.2%) | $44,904 |
| Average | 248 (100.0%) | $30,625 |
Occupancy by Householder Income Bracket in Takilma
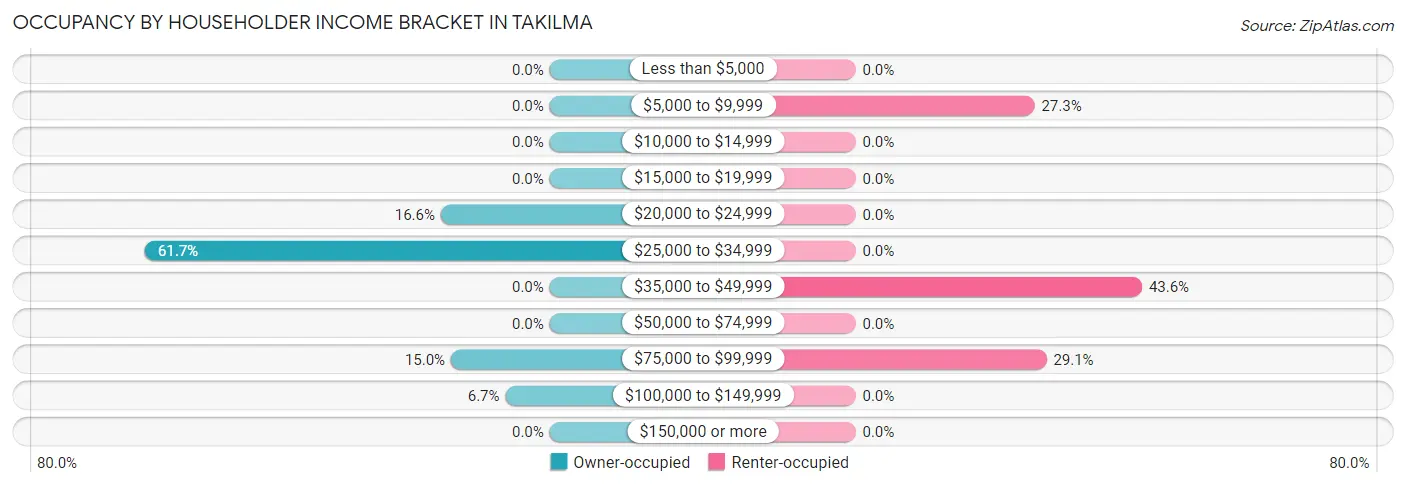
| Income Bracket | Owner-occupied | Renter-occupied |
| Less than $5,000 | 0 (0.0%) | 0 (0.0%) |
| $5,000 to $9,999 | 0 (0.0%) | 15 (27.3%) |
| $10,000 to $14,999 | 0 (0.0%) | 0 (0.0%) |
| $15,000 to $19,999 | 0 (0.0%) | 0 (0.0%) |
| $20,000 to $24,999 | 32 (16.6%) | 0 (0.0%) |
| $25,000 to $34,999 | 119 (61.7%) | 0 (0.0%) |
| $35,000 to $49,999 | 0 (0.0%) | 24 (43.6%) |
| $50,000 to $74,999 | 0 (0.0%) | 0 (0.0%) |
| $75,000 to $99,999 | 29 (15.0%) | 16 (29.1%) |
| $100,000 to $149,999 | 13 (6.7%) | 0 (0.0%) |
| $150,000 or more | 0 (0.0%) | 0 (0.0%) |
| Total | 193 (100.0%) | 55 (100.0%) |
Monthly Housing Cost Tiers in Takilma
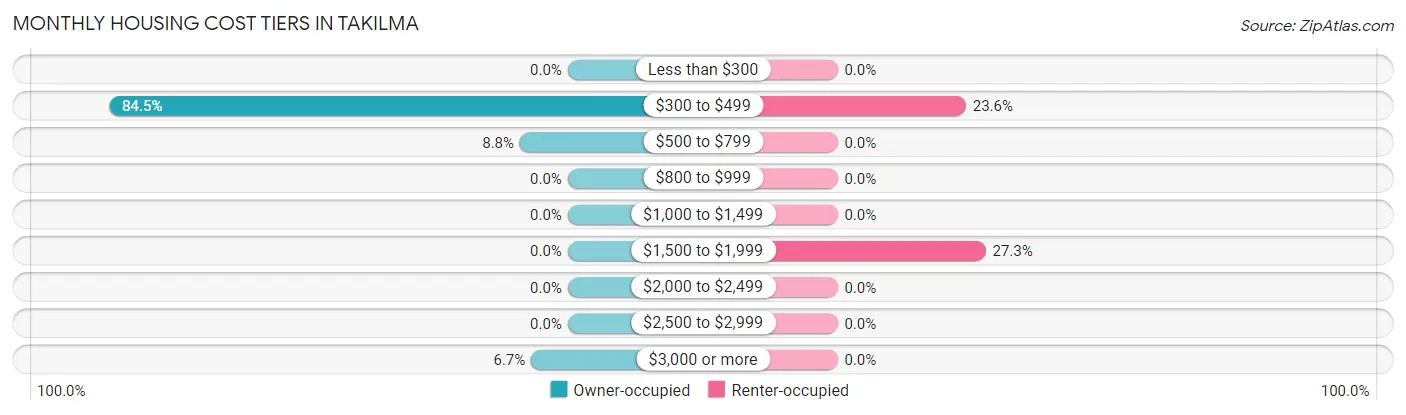
| Monthly Cost | Owner-occupied | Renter-occupied |
| Less than $300 | 0 (0.0%) | 0 (0.0%) |
| $300 to $499 | 163 (84.5%) | 13 (23.6%) |
| $500 to $799 | 17 (8.8%) | 0 (0.0%) |
| $800 to $999 | 0 (0.0%) | 0 (0.0%) |
| $1,000 to $1,499 | 0 (0.0%) | 0 (0.0%) |
| $1,500 to $1,999 | 0 (0.0%) | 15 (27.3%) |
| $2,000 to $2,499 | 0 (0.0%) | 0 (0.0%) |
| $2,500 to $2,999 | 0 (0.0%) | 0 (0.0%) |
| $3,000 or more | 13 (6.7%) | 0 (0.0%) |
| Total | 193 (100.0%) | 55 (100.0%) |
Physical Housing Characteristics in Takilma
Housing Structures in Takilma
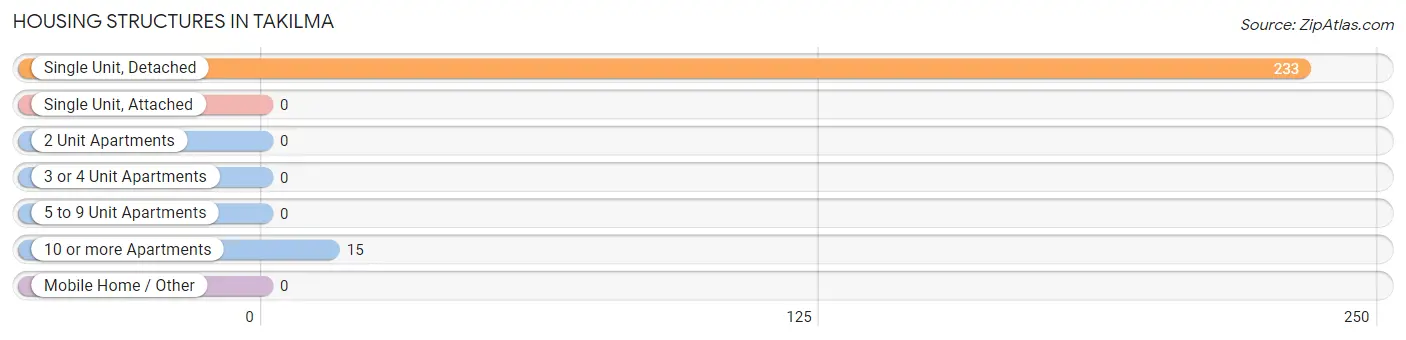
| Structure Type | # Housing Units | % Housing Units |
| Single Unit, Detached | 233 | 94.0% |
| Single Unit, Attached | 0 | 0.0% |
| 2 Unit Apartments | 0 | 0.0% |
| 3 or 4 Unit Apartments | 0 | 0.0% |
| 5 to 9 Unit Apartments | 0 | 0.0% |
| 10 or more Apartments | 15 | 6.0% |
| Mobile Home / Other | 0 | 0.0% |
| Total | 248 | 100.0% |
Housing Structures by Occupancy in Takilma
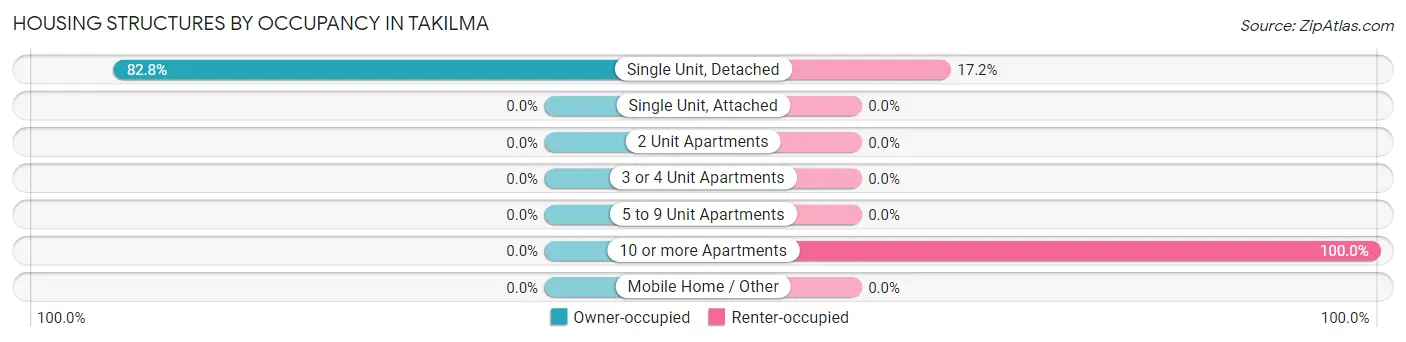
| Structure Type | Owner-occupied | Renter-occupied |
| Single Unit, Detached | 193 (82.8%) | 40 (17.2%) |
| Single Unit, Attached | 0 (0.0%) | 0 (0.0%) |
| 2 Unit Apartments | 0 (0.0%) | 0 (0.0%) |
| 3 or 4 Unit Apartments | 0 (0.0%) | 0 (0.0%) |
| 5 to 9 Unit Apartments | 0 (0.0%) | 0 (0.0%) |
| 10 or more Apartments | 0 (0.0%) | 15 (100.0%) |
| Mobile Home / Other | 0 (0.0%) | 0 (0.0%) |
| Total | 193 (77.8%) | 55 (22.2%) |
Housing Structures by Number of Rooms in Takilma
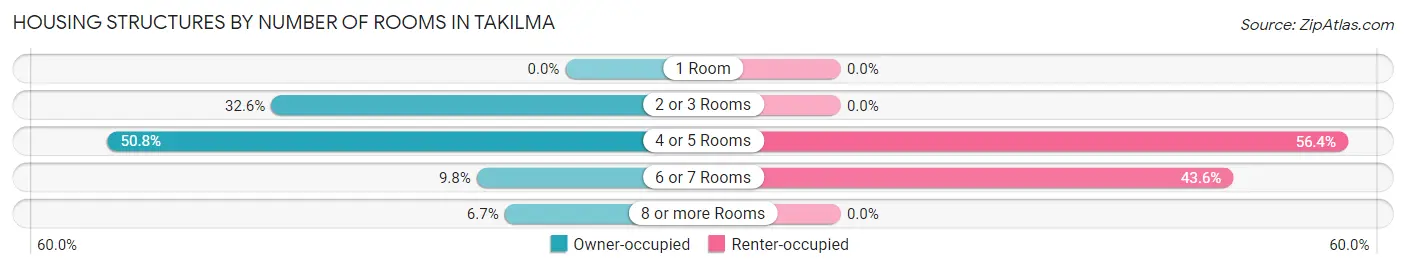
| Number of Rooms | Owner-occupied | Renter-occupied |
| 1 Room | 0 (0.0%) | 0 (0.0%) |
| 2 or 3 Rooms | 63 (32.6%) | 0 (0.0%) |
| 4 or 5 Rooms | 98 (50.8%) | 31 (56.4%) |
| 6 or 7 Rooms | 19 (9.8%) | 24 (43.6%) |
| 8 or more Rooms | 13 (6.7%) | 0 (0.0%) |
| Total | 193 (100.0%) | 55 (100.0%) |
Housing Structure by Heating Type in Takilma
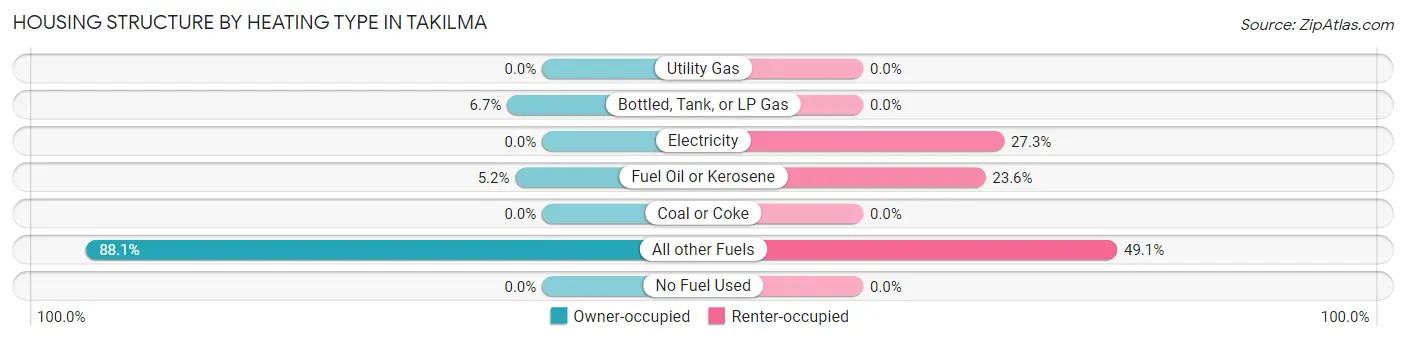
| Heating Type | Owner-occupied | Renter-occupied |
| Utility Gas | 0 (0.0%) | 0 (0.0%) |
| Bottled, Tank, or LP Gas | 13 (6.7%) | 0 (0.0%) |
| Electricity | 0 (0.0%) | 15 (27.3%) |
| Fuel Oil or Kerosene | 10 (5.2%) | 13 (23.6%) |
| Coal or Coke | 0 (0.0%) | 0 (0.0%) |
| All other Fuels | 170 (88.1%) | 27 (49.1%) |
| No Fuel Used | 0 (0.0%) | 0 (0.0%) |
| Total | 193 (100.0%) | 55 (100.0%) |
Household Vehicle Usage in Takilma
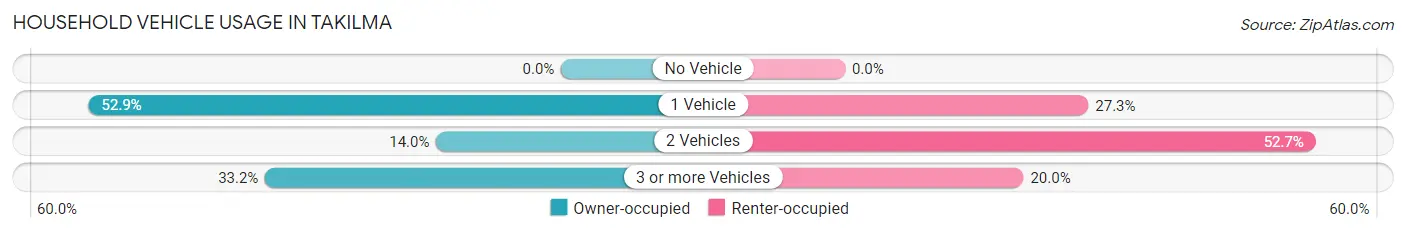
| Vehicles per Household | Owner-occupied | Renter-occupied |
| No Vehicle | 0 (0.0%) | 0 (0.0%) |
| 1 Vehicle | 102 (52.8%) | 15 (27.3%) |
| 2 Vehicles | 27 (14.0%) | 29 (52.7%) |
| 3 or more Vehicles | 64 (33.2%) | 11 (20.0%) |
| Total | 193 (100.0%) | 55 (100.0%) |
Real Estate & Mortgages in Takilma
Real Estate and Mortgage Overview in Takilma
| Characteristic | Without Mortgage | With Mortgage |
| Housing Units | 163 | 30 |
| Median Property Value | $550,200 | $0 |
| Median Household Income | $28,015 | $0 |
| Monthly Housing Costs | $378 | $13 |
| Real Estate Taxes | - | - |
Property Value by Mortgage Status in Takilma
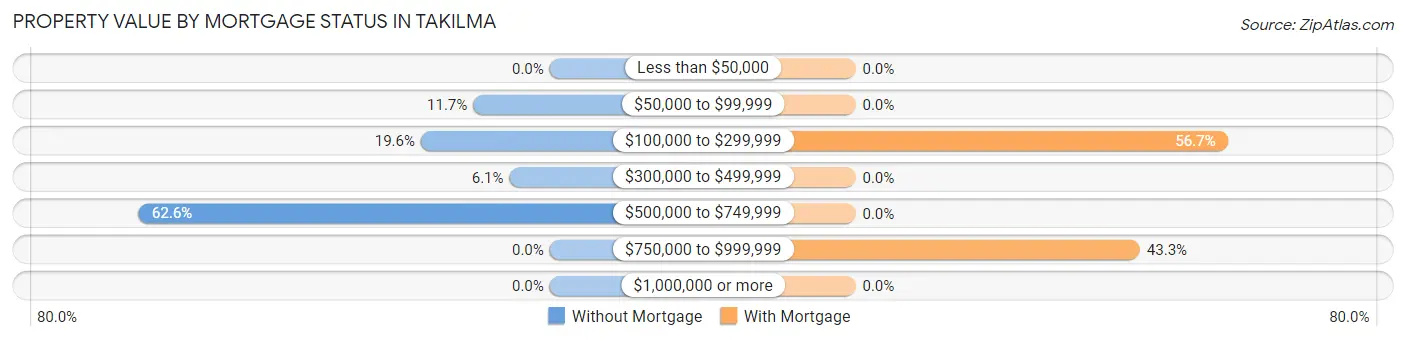
| Property Value | Without Mortgage | With Mortgage |
| Less than $50,000 | 0 (0.0%) | 0 (0.0%) |
| $50,000 to $99,999 | 19 (11.7%) | 0 (0.0%) |
| $100,000 to $299,999 | 32 (19.6%) | 17 (56.7%) |
| $300,000 to $499,999 | 10 (6.1%) | 0 (0.0%) |
| $500,000 to $749,999 | 102 (62.6%) | 0 (0.0%) |
| $750,000 to $999,999 | 0 (0.0%) | 13 (43.3%) |
| $1,000,000 or more | 0 (0.0%) | 0 (0.0%) |
| Total | 163 (100.0%) | 30 (100.0%) |
Household Income by Mortgage Status in Takilma
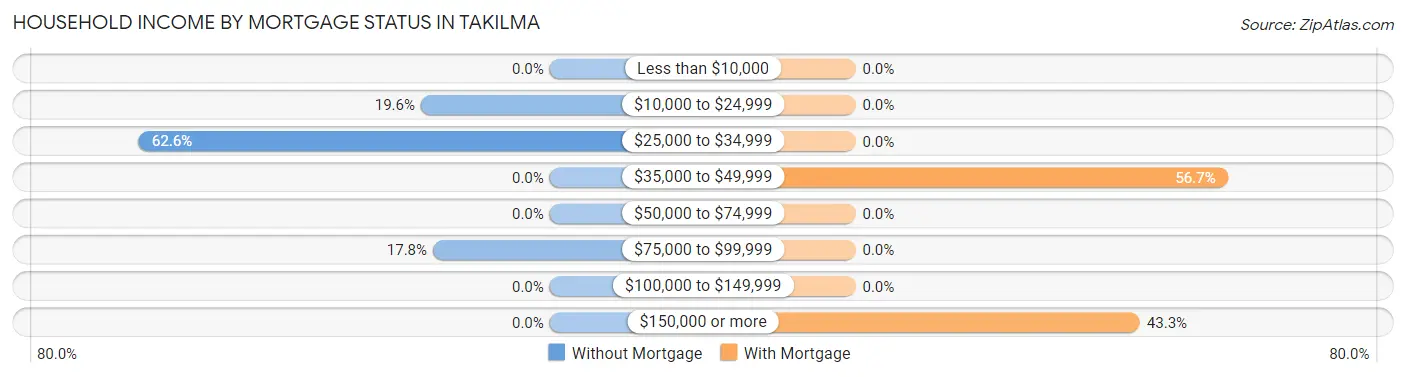
| Household Income | Without Mortgage | With Mortgage |
| Less than $10,000 | 0 (0.0%) | 0 (0.0%) |
| $10,000 to $24,999 | 32 (19.6%) | 0 (0.0%) |
| $25,000 to $34,999 | 102 (62.6%) | 0 (0.0%) |
| $35,000 to $49,999 | 0 (0.0%) | 17 (56.7%) |
| $50,000 to $74,999 | 0 (0.0%) | 0 (0.0%) |
| $75,000 to $99,999 | 29 (17.8%) | 0 (0.0%) |
| $100,000 to $149,999 | 0 (0.0%) | 0 (0.0%) |
| $150,000 or more | 0 (0.0%) | 13 (43.3%) |
| Total | 163 (100.0%) | 30 (100.0%) |
Property Value to Household Income Ratio in Takilma
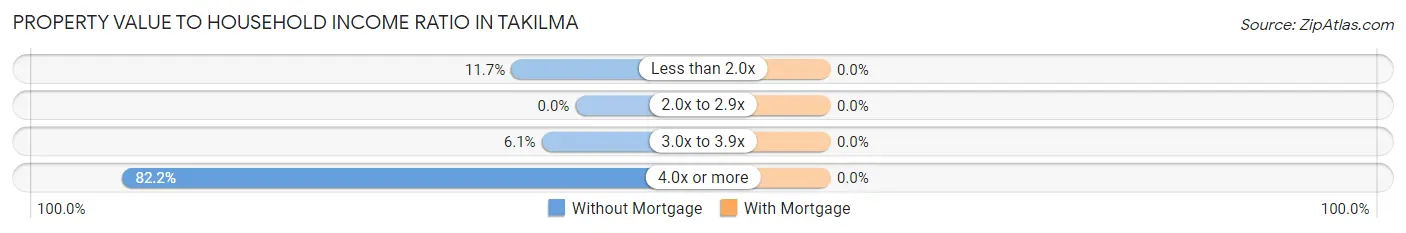
| Value-to-Income Ratio | Without Mortgage | With Mortgage |
| Less than 2.0x | 19 (11.7%) | 0 (0.0%) |
| 2.0x to 2.9x | 0 (0.0%) | 0 (0.0%) |
| 3.0x to 3.9x | 10 (6.1%) | 0 (0.0%) |
| 4.0x or more | 134 (82.2%) | 0 (0.0%) |
| Total | 163 (100.0%) | 30 (100.0%) |
Real Estate Taxes by Mortgage Status in Takilma
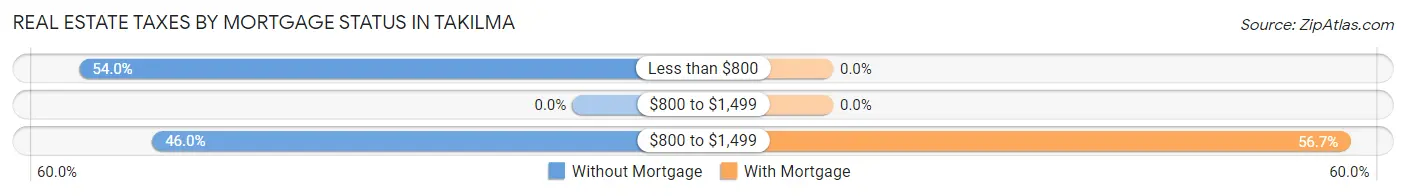
| Property Taxes | Without Mortgage | With Mortgage |
| Less than $800 | 88 (54.0%) | 0 (0.0%) |
| $800 to $1,499 | 0 (0.0%) | 0 (0.0%) |
| $800 to $1,499 | 75 (46.0%) | 17 (56.7%) |
| Total | 163 (100.0%) | 30 (100.0%) |
Health & Disability in Takilma
Health Insurance Coverage by Age in Takilma
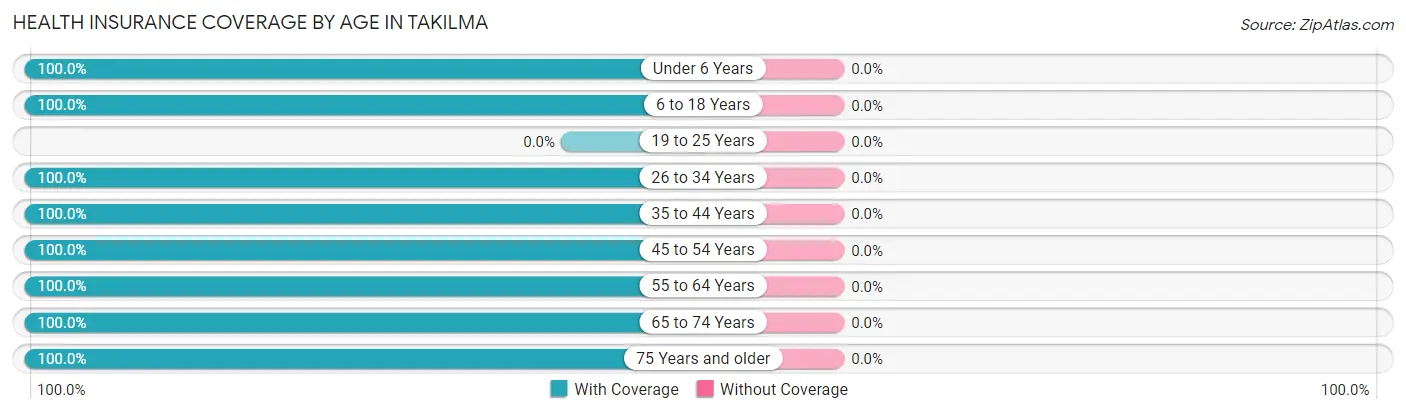
| Age Bracket | With Coverage | Without Coverage |
| Under 6 Years | 68 (100.0%) | 0 (0.0%) |
| 6 to 18 Years | 171 (100.0%) | 0 (0.0%) |
| 19 to 25 Years | 0 (0.0%) | 0 (0.0%) |
| 26 to 34 Years | 27 (100.0%) | 0 (0.0%) |
| 35 to 44 Years | 71 (100.0%) | 0 (0.0%) |
| 45 to 54 Years | 73 (100.0%) | 0 (0.0%) |
| 55 to 64 Years | 22 (100.0%) | 0 (0.0%) |
| 65 to 74 Years | 134 (100.0%) | 0 (0.0%) |
| 75 Years and older | 67 (100.0%) | 0 (0.0%) |
| Total | 633 (100.0%) | 0 (0.0%) |
Health Insurance Coverage by Citizenship Status in Takilma
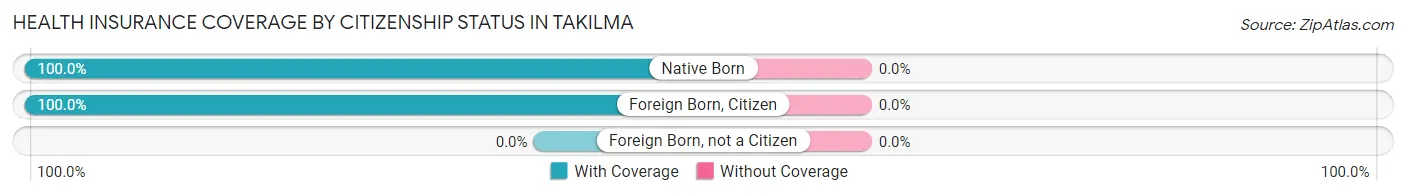
| Citizenship Status | With Coverage | Without Coverage |
| Native Born | 68 (100.0%) | 0 (0.0%) |
| Foreign Born, Citizen | 171 (100.0%) | 0 (0.0%) |
| Foreign Born, not a Citizen | 0 (0.0%) | 0 (0.0%) |
Health Insurance Coverage by Household Income in Takilma
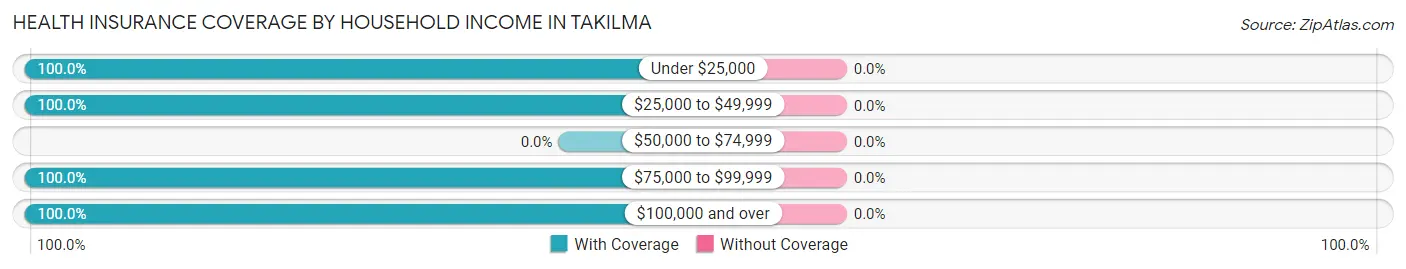
| Household Income | With Coverage | Without Coverage |
| Under $25,000 | 129 (100.0%) | 0 (0.0%) |
| $25,000 to $49,999 | 165 (100.0%) | 0 (0.0%) |
| $50,000 to $74,999 | 0 (0.0%) | 0 (0.0%) |
| $75,000 to $99,999 | 301 (100.0%) | 0 (0.0%) |
| $100,000 and over | 38 (100.0%) | 0 (0.0%) |
Public vs Private Health Insurance Coverage by Age in Takilma
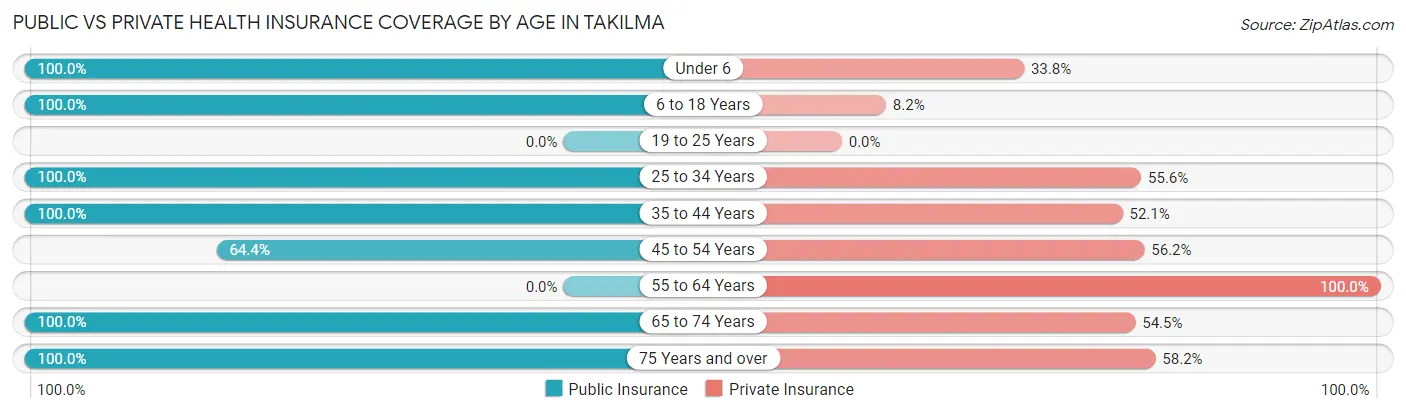
| Age Bracket | Public Insurance | Private Insurance |
| Under 6 | 68 (100.0%) | 23 (33.8%) |
| 6 to 18 Years | 171 (100.0%) | 14 (8.2%) |
| 19 to 25 Years | 0 (0.0%) | 0 (0.0%) |
| 25 to 34 Years | 27 (100.0%) | 15 (55.6%) |
| 35 to 44 Years | 71 (100.0%) | 37 (52.1%) |
| 45 to 54 Years | 47 (64.4%) | 41 (56.2%) |
| 55 to 64 Years | 0 (0.0%) | 22 (100.0%) |
| 65 to 74 Years | 134 (100.0%) | 73 (54.5%) |
| 75 Years and over | 67 (100.0%) | 39 (58.2%) |
| Total | 585 (92.4%) | 264 (41.7%) |
Disability Status by Sex by Age in Takilma
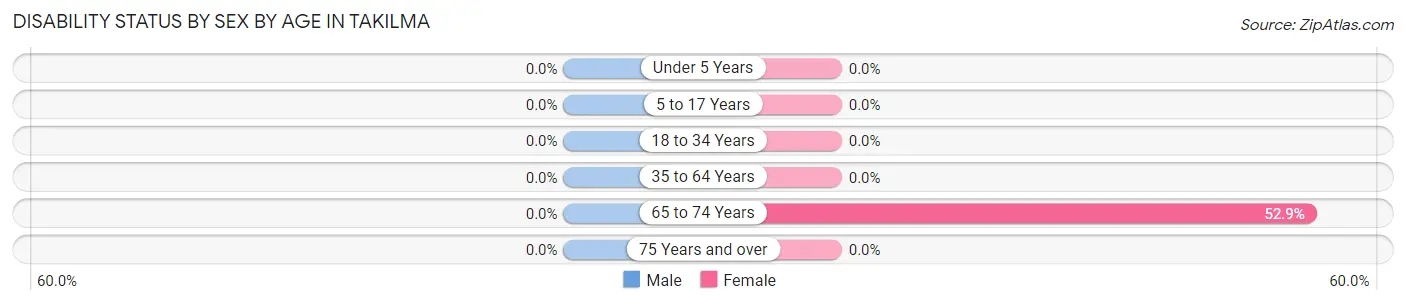
| Age Bracket | Male | Female |
| Under 5 Years | 0 (0.0%) | 0 (0.0%) |
| 5 to 17 Years | 0 (0.0%) | 0 (0.0%) |
| 18 to 34 Years | 0 (0.0%) | 0 (0.0%) |
| 35 to 64 Years | 0 (0.0%) | 0 (0.0%) |
| 65 to 74 Years | 0 (0.0%) | 46 (52.9%) |
| 75 Years and over | 0 (0.0%) | 0 (0.0%) |
Disability Class by Sex by Age in Takilma
Disability Class: Hearing Difficulty
| Age Bracket | Male | Female |
| Under 5 Years | 0 (0.0%) | 0 (0.0%) |
| 5 to 17 Years | 0 (0.0%) | 0 (0.0%) |
| 18 to 34 Years | 0 (0.0%) | 0 (0.0%) |
| 35 to 64 Years | 0 (0.0%) | 0 (0.0%) |
| 65 to 74 Years | 0 (0.0%) | 0 (0.0%) |
| 75 Years and over | 0 (0.0%) | 0 (0.0%) |
Disability Class: Vision Difficulty
| Age Bracket | Male | Female |
| Under 5 Years | 0 (0.0%) | 0 (0.0%) |
| 5 to 17 Years | 0 (0.0%) | 0 (0.0%) |
| 18 to 34 Years | 0 (0.0%) | 0 (0.0%) |
| 35 to 64 Years | 0 (0.0%) | 0 (0.0%) |
| 65 to 74 Years | 0 (0.0%) | 0 (0.0%) |
| 75 Years and over | 0 (0.0%) | 0 (0.0%) |
Disability Class: Cognitive Difficulty
| Age Bracket | Male | Female |
| 5 to 17 Years | 0 (0.0%) | 0 (0.0%) |
| 18 to 34 Years | 0 (0.0%) | 0 (0.0%) |
| 35 to 64 Years | 0 (0.0%) | 0 (0.0%) |
| 65 to 74 Years | 0 (0.0%) | 0 (0.0%) |
| 75 Years and over | 0 (0.0%) | 0 (0.0%) |
Disability Class: Ambulatory Difficulty
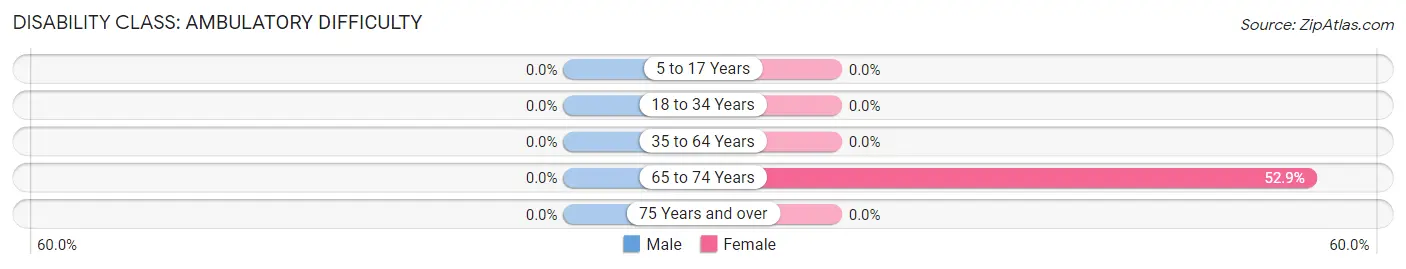
| Age Bracket | Male | Female |
| 5 to 17 Years | 0 (0.0%) | 0 (0.0%) |
| 18 to 34 Years | 0 (0.0%) | 0 (0.0%) |
| 35 to 64 Years | 0 (0.0%) | 0 (0.0%) |
| 65 to 74 Years | 0 (0.0%) | 46 (52.9%) |
| 75 Years and over | 0 (0.0%) | 0 (0.0%) |
Disability Class: Self-Care Difficulty
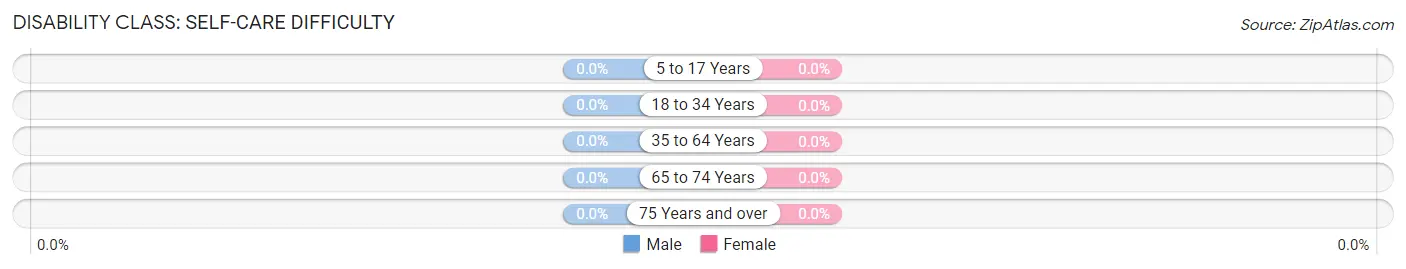
| Age Bracket | Male | Female |
| 5 to 17 Years | 0 (0.0%) | 0 (0.0%) |
| 18 to 34 Years | 0 (0.0%) | 0 (0.0%) |
| 35 to 64 Years | 0 (0.0%) | 0 (0.0%) |
| 65 to 74 Years | 0 (0.0%) | 0 (0.0%) |
| 75 Years and over | 0 (0.0%) | 0 (0.0%) |
Technology Access in Takilma
Computing Device Access in Takilma
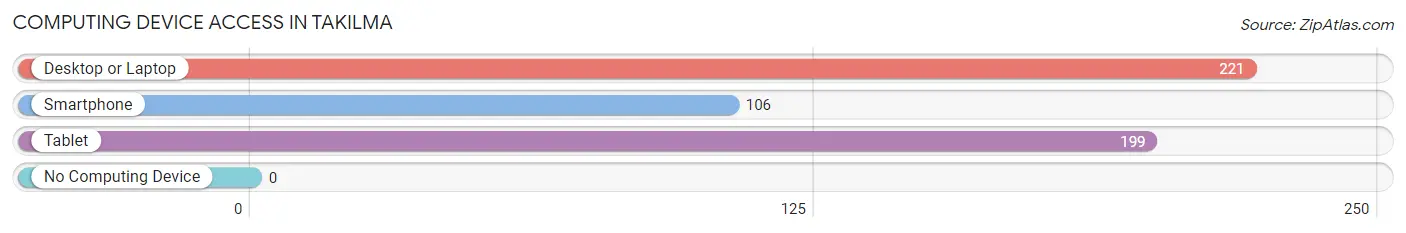
| Device Type | # Households | % Households |
| Desktop or Laptop | 221 | 89.1% |
| Smartphone | 106 | 42.7% |
| Tablet | 199 | 80.2% |
| No Computing Device | 0 | 0.0% |
| Total | 248 | 100.0% |
Internet Access in Takilma
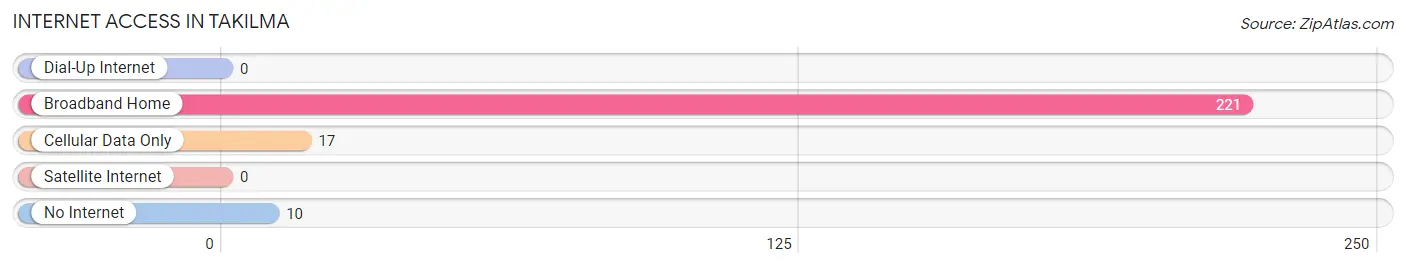
| Internet Type | # Households | % Households |
| Dial-Up Internet | 0 | 0.0% |
| Broadband Home | 221 | 89.1% |
| Cellular Data Only | 17 | 6.9% |
| Satellite Internet | 0 | 0.0% |
| No Internet | 10 | 4.0% |
| Total | 248 | 100.0% |
Takilma Summary
Takilma is an unincorporated community in Josephine County, Oregon, United States. It is located in the foothills of the Siskiyou Mountains, approximately 8 miles east of Cave Junction. The population of Takilma was estimated to be around 200 in 2020.
History
Takilma was founded in the late 1800s by a group of settlers from the Midwest. The settlers were attracted to the area by the abundance of timber and the mild climate. The town was originally called "Takilma City" and was the first incorporated town in Josephine County.
The town was named after the Takilma Indians, a Native American tribe that lived in the area. The tribe was known for its basket weaving and other crafts.
The town was a popular stop for travelers on the stagecoach line between Grants Pass and Crescent City, California. The stagecoach line was eventually replaced by the Oregon and California Railroad in the late 1800s.
Takilma was also home to a number of businesses, including a general store, a blacksmith shop, a hotel, and a saloon. The town also had a post office, which opened in 1891 and closed in 1943.
Geography
Takilma is located in the foothills of the Siskiyou Mountains, approximately 8 miles east of Cave Junction. The town is situated at an elevation of 1,890 feet above sea level.
The climate in Takilma is mild and temperate, with warm summers and cool winters. The average annual temperature is around 55 degrees Fahrenheit.
Economy
Takilma is a rural community with a small economy. The town is home to a number of small businesses, including a general store, a cafe, a gas station, and a few other shops.
The town is also home to a number of small farms and ranches. The main crops grown in the area are hay, apples, and pears.
Demographics
The population of Takilma was estimated to be around 200 in 2020. The town is predominantly white, with a small Hispanic population. The median household income in Takilma is around $35,000.
Conclusion
Takilma is a small, rural community in Josephine County, Oregon. The town was founded in the late 1800s by a group of settlers from the Midwest and was named after the Takilma Indians. The town is home to a number of small businesses and farms, and the population is estimated to be around 200. The climate in Takilma is mild and temperate, with warm summers and cool winters. The median household income in Takilma is around $35,000.
Common Questions
What is Per Capita Income in Takilma?
Per Capita income in Takilma is $18,285.
What is the Median Household income in Takilma?
Median Household Income in Takilma is $30,625.
What is Income or Wage Gap in Takilma?
Income or Wage Gap in Takilma is 82.7%.
Women in Takilma earn 17.3 cents for every dollar earned by a man.
What is Inequality or Gini Index in Takilma?
Inequality or Gini Index in Takilma is 0.37.
What is the Total Population of Takilma?
Total Population of Takilma is 633.
What is the Total Male Population of Takilma?
Total Male Population of Takilma is 245.
What is the Total Female Population of Takilma?
Total Female Population of Takilma is 388.
What is the Ratio of Males per 100 Females in Takilma?
There are 63.14 Males per 100 Females in Takilma.
What is the Ratio of Females per 100 Males in Takilma?
There are 158.37 Females per 100 Males in Takilma.
What is the Median Population Age in Takilma?
Median Population Age in Takilma is 40.9 Years.
What is the Average Family Size in Takilma
Average Family Size in Takilma is 3.8 People.
What is the Average Household Size in Takilma
Average Household Size in Takilma is 2.5 People.
How Large is the Labor Force in Takilma?
There are 259 People in the Labor Forcein in Takilma.
What is the Percentage of People in the Labor Force in Takilma?
58.5% of People are in the Labor Force in Takilma.
What is the Unemployment Rate in Takilma?
Unemployment Rate in Takilma is 5.8%.