Cities with the Highest Percentage of Owner-Occupied Units in Oregon
RELATED REPORTS & OPTIONS
Highest Owner-Occupied
Oregon
Compare Cities
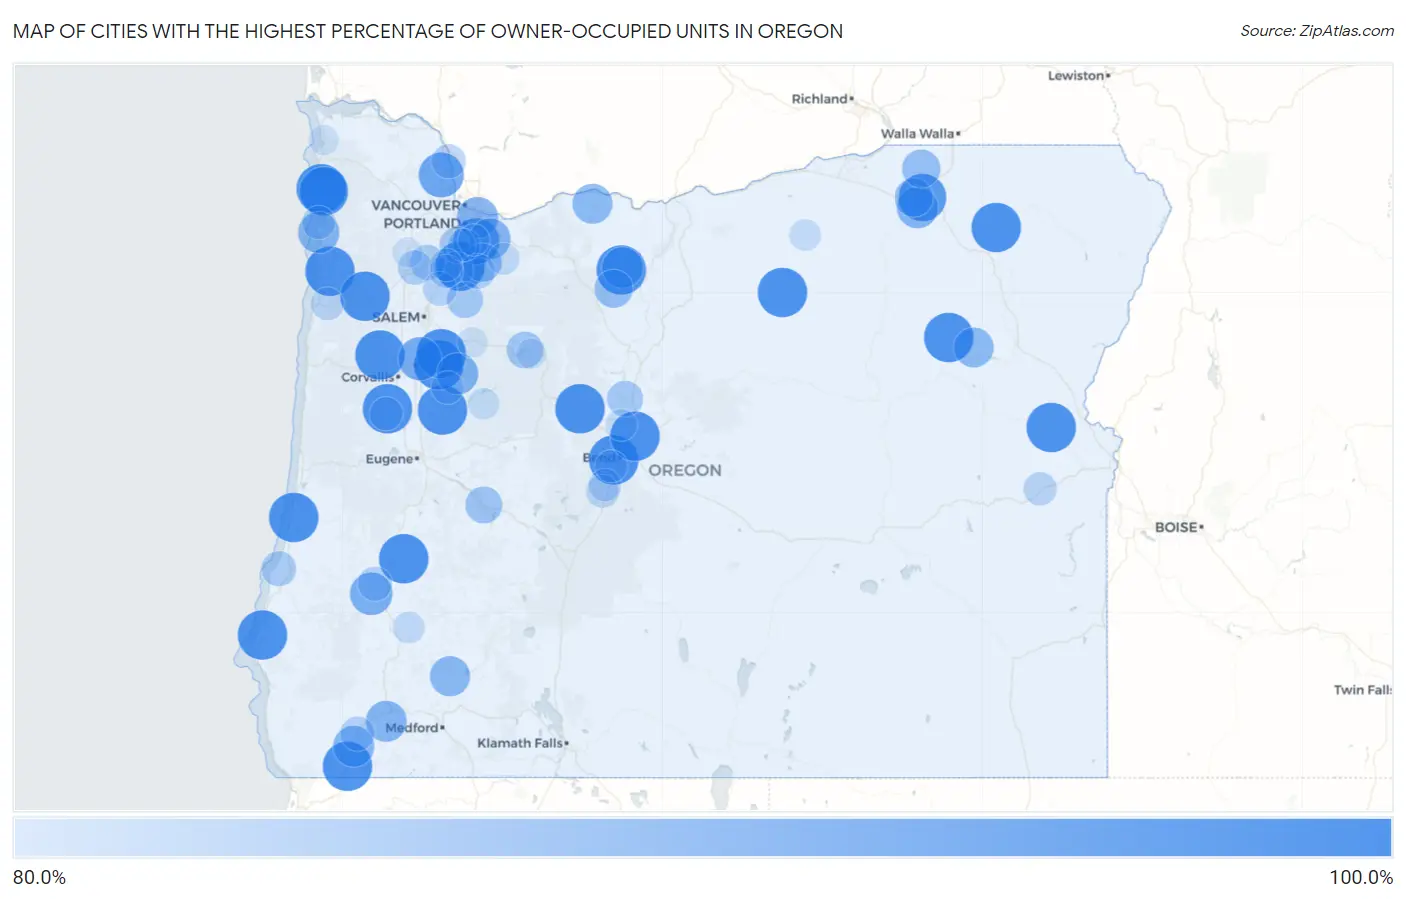
Map of Cities with the Highest Percentage of Owner-Occupied Units in Oregon
0.0%
100.0%
Cities with the Highest Percentage of Owner-Occupied Units in Oregon
| City | % Owner-Occupied | vs State | vs National | |
| 1. | Tetherow | 100.0% | 63.2%(+36.8)#1 | 64.8%(+35.2)#158 |
| 2. | O Brien | 100.0% | 63.2%(+36.8)#2 | 64.8%(+35.2)#191 |
| 3. | Crawfordsville | 100.0% | 63.2%(+36.8)#3 | 64.8%(+35.2)#243 |
| 4. | Pleasant Valley | 100.0% | 63.2%(+36.8)#4 | 64.8%(+35.2)#258 |
| 5. | Crabtree | 100.0% | 63.2%(+36.8)#5 | 64.8%(+35.2)#266 |
| 6. | Neahkahnie | 100.0% | 63.2%(+36.8)#6 | 64.8%(+35.2)#464 |
| 7. | Langlois | 100.0% | 63.2%(+36.8)#7 | 64.8%(+35.2)#470 |
| 8. | Cheshire | 100.0% | 63.2%(+36.8)#8 | 64.8%(+35.2)#533 |
| 9. | Dilley | 100.0% | 63.2%(+36.8)#9 | 64.8%(+35.2)#586 |
| 10. | Hebo | 100.0% | 63.2%(+36.8)#10 | 64.8%(+35.2)#595 |
| 11. | Winchester Bay | 100.0% | 63.2%(+36.8)#11 | 64.8%(+35.2)#599 |
| 12. | Fair Oaks | 100.0% | 63.2%(+36.8)#12 | 64.8%(+35.2)#695 |
| 13. | Pronghorn | 100.0% | 63.2%(+36.8)#13 | 64.8%(+35.2)#772 |
| 14. | Barlow | 100.0% | 63.2%(+36.8)#14 | 64.8%(+35.2)#878 |
| 15. | Rhododendron | 100.0% | 63.2%(+36.8)#16 | 64.8%(+35.2)#932 |
| 16. | Kings Valley | 100.0% | 63.2%(+36.8)#17 | 64.8%(+35.2)#933 |
| 17. | Summerville | 100.0% | 63.2%(+36.8)#18 | 64.8%(+35.2)#1,054 |
| 18. | Black Butte Ranch | 100.0% | 63.2%(+36.8)#19 | 64.8%(+35.2)#1,081 |
| 19. | Sportsmans Park | 100.0% | 63.2%(+36.8)#20 | 64.8%(+35.2)#1,577 |
| 20. | Fort Hill | 100.0% | 63.2%(+36.8)#21 | 64.8%(+35.2)#1,596 |
| 21. | Wamic | 100.0% | 63.2%(+36.8)#22 | 64.8%(+35.2)#1,764 |
| 22. | Bellfountain | 100.0% | 63.2%(+36.8)#23 | 64.8%(+35.2)#1,893 |
| 23. | West Scio | 100.0% | 63.2%(+36.8)#24 | 64.8%(+35.2)#2,034 |
| 24. | Lonerock | 100.0% | 63.2%(+36.8)#25 | 64.8%(+35.2)#2,338 |
| 25. | Brogan | 100.0% | 63.2%(+36.8)#26 | 64.8%(+35.2)#2,383 |
| 26. | Crescent Lake | 100.0% | 63.2%(+36.8)#27 | 64.8%(+35.2)#2,429 |
| 27. | Granite | 100.0% | 63.2%(+36.8)#28 | 64.8%(+35.2)#2,526 |
| 28. | Bayside Gardens | 99.4% | 63.2%(+36.2)#29 | 64.8%(+34.6)#2,656 |
| 29. | Kirkpatrick | 98.5% | 63.2%(+35.3)#30 | 64.8%(+33.7)#2,759 |
| 30. | Johnson City | 97.5% | 63.2%(+34.3)#31 | 64.8%(+32.7)#2,979 |
| 31. | Mckay | 97.2% | 63.2%(+34.0)#32 | 64.8%(+32.4)#3,076 |
| 32. | Rocky Point | 96.9% | 63.2%(+33.6)#33 | 64.8%(+32.0)#3,194 |
| 33. | Warren | 96.6% | 63.2%(+33.4)#34 | 64.8%(+31.8)#3,287 |
| 34. | Green Meadows | 95.6% | 63.2%(+32.3)#35 | 64.8%(+30.7)#3,621 |
| 35. | Millersburg | 95.4% | 63.2%(+32.2)#36 | 64.8%(+30.6)#3,709 |
| 36. | Lookingglass | 94.9% | 63.2%(+31.7)#37 | 64.8%(+30.1)#3,904 |
| 37. | Dunthorpe | 94.4% | 63.2%(+31.2)#38 | 64.8%(+29.6)#4,138 |
| 38. | Lacomb | 94.0% | 63.2%(+30.8)#39 | 64.8%(+29.2)#4,271 |
| 39. | Tutuilla | 94.0% | 63.2%(+30.8)#40 | 64.8%(+29.2)#4,291 |
| 40. | Oceanside | 93.9% | 63.2%(+30.7)#41 | 64.8%(+29.1)#4,323 |
| 41. | Maywood Park | 93.8% | 63.2%(+30.6)#42 | 64.8%(+29.0)#4,352 |
| 42. | Pine Hollow | 93.8% | 63.2%(+30.5)#43 | 64.8%(+28.9)#4,375 |
| 43. | Kerby | 93.7% | 63.2%(+30.5)#44 | 64.8%(+28.9)#4,395 |
| 44. | Damascus | 93.7% | 63.2%(+30.5)#45 | 64.8%(+28.9)#4,406 |
| 45. | New Hope | 93.6% | 63.2%(+30.4)#46 | 64.8%(+28.8)#4,442 |
| 46. | Trail | 93.1% | 63.2%(+29.9)#47 | 64.8%(+28.3)#4,633 |
| 47. | Odell | 93.0% | 63.2%(+29.8)#48 | 64.8%(+28.2)#4,707 |
| 48. | Sumpter | 92.9% | 63.2%(+29.6)#49 | 64.8%(+28.0)#4,769 |
| 49. | Juniper Canyon | 92.8% | 63.2%(+29.5)#50 | 64.8%(+27.9)#4,817 |
| 50. | San Marine | 92.7% | 63.2%(+29.5)#51 | 64.8%(+27.9)#4,829 |
| 51. | Fort Klamath | 92.6% | 63.2%(+29.4)#52 | 64.8%(+27.8)#4,870 |
| 52. | Falcon Heights | 92.1% | 63.2%(+28.9)#53 | 64.8%(+27.3)#5,125 |
| 53. | Riverside | 91.9% | 63.2%(+28.6)#54 | 64.8%(+27.0)#5,245 |
| 54. | Beavercreek | 91.8% | 63.2%(+28.6)#55 | 64.8%(+27.0)#5,288 |
| 55. | Bayshore | 91.7% | 63.2%(+28.5)#56 | 64.8%(+26.9)#5,318 |
| 56. | Helix | 91.7% | 63.2%(+28.5)#57 | 64.8%(+26.9)#5,325 |
| 57. | Pine Grove | 91.7% | 63.2%(+28.5)#58 | 64.8%(+26.9)#5,341 |
| 58. | Saunders Lake | 90.9% | 63.2%(+27.7)#59 | 64.8%(+26.1)#5,725 |
| 59. | Cherry Grove | 90.8% | 63.2%(+27.6)#60 | 64.8%(+26.0)#5,813 |
| 60. | Westfir | 90.7% | 63.2%(+27.5)#61 | 64.8%(+25.9)#5,840 |
| 61. | Detroit | 90.6% | 63.2%(+27.4)#62 | 64.8%(+25.7)#5,922 |
| 62. | Aurora | 90.3% | 63.2%(+27.1)#63 | 64.8%(+25.4)#6,073 |
| 63. | Rivergrove | 90.2% | 63.2%(+27.0)#64 | 64.8%(+25.4)#6,093 |
| 64. | Scotts Mills | 90.1% | 63.2%(+26.9)#65 | 64.8%(+25.3)#6,176 |
| 65. | Crooked River Ranch | 90.0% | 63.2%(+26.8)#66 | 64.8%(+25.2)#6,244 |
| 66. | Running Y Ranch | 89.7% | 63.2%(+26.5)#67 | 64.8%(+24.9)#6,400 |
| 67. | Dundee | 89.4% | 63.2%(+26.2)#68 | 64.8%(+24.6)#6,513 |
| 68. | Barview | 89.3% | 63.2%(+26.1)#69 | 64.8%(+24.5)#6,583 |
| 69. | Mulino | 89.3% | 63.2%(+26.1)#70 | 64.8%(+24.5)#6,587 |
| 70. | Neotsu | 89.1% | 63.2%(+25.9)#71 | 64.8%(+24.3)#6,708 |
| 71. | Lafayette | 88.9% | 63.2%(+25.7)#72 | 64.8%(+24.1)#6,806 |
| 72. | Selma | 88.8% | 63.2%(+25.6)#73 | 64.8%(+24.0)#6,865 |
| 73. | Columbia City | 88.7% | 63.2%(+25.5)#74 | 64.8%(+23.9)#6,915 |
| 74. | Melrose | 88.7% | 63.2%(+25.4)#75 | 64.8%(+23.8)#6,935 |
| 75. | Gervais | 88.6% | 63.2%(+25.4)#76 | 64.8%(+23.8)#6,971 |
| 76. | Cape Meares | 88.2% | 63.2%(+25.0)#77 | 64.8%(+23.4)#7,207 |
| 77. | Harper | 88.1% | 63.2%(+24.9)#78 | 64.8%(+23.3)#7,230 |
| 78. | Donald | 88.1% | 63.2%(+24.9)#79 | 64.8%(+23.3)#7,248 |
| 79. | Alpine | 88.1% | 63.2%(+24.9)#80 | 64.8%(+23.3)#7,252 |
| 80. | Rose Lodge | 87.8% | 63.2%(+24.6)#81 | 64.8%(+23.0)#7,402 |
| 81. | Three Rivers | 87.8% | 63.2%(+24.6)#82 | 64.8%(+23.0)#7,422 |
| 82. | Waterloo | 87.7% | 63.2%(+24.5)#83 | 64.8%(+22.9)#7,509 |
| 83. | Sunriver | 87.7% | 63.2%(+24.4)#84 | 64.8%(+22.8)#7,523 |
| 84. | Stafford | 87.6% | 63.2%(+24.4)#85 | 64.8%(+22.8)#7,530 |
| 85. | Butteville | 87.6% | 63.2%(+24.4)#86 | 64.8%(+22.8)#7,545 |
| 86. | Seventh Mountain | 87.4% | 63.2%(+24.2)#87 | 64.8%(+22.6)#7,682 |
| 87. | Knappa | 87.3% | 63.2%(+24.0)#88 | 64.8%(+22.4)#7,767 |
| 88. | Oregon Shores | 87.1% | 63.2%(+23.9)#89 | 64.8%(+22.3)#7,880 |
| 89. | Estacada | 87.1% | 63.2%(+23.9)#90 | 64.8%(+22.3)#7,883 |
| 90. | Days Creek | 87.1% | 63.2%(+23.8)#91 | 64.8%(+22.2)#7,892 |
| 91. | Eagle Crest | 87.0% | 63.2%(+23.7)#92 | 64.8%(+22.1)#7,955 |
| 92. | Lexington | 87.0% | 63.2%(+23.7)#93 | 64.8%(+22.1)#7,967 |
| 93. | Oatfield | 86.8% | 63.2%(+23.6)#94 | 64.8%(+22.0)#8,032 |
| 94. | Cascadia | 86.7% | 63.2%(+23.5)#95 | 64.8%(+21.9)#8,136 |
| 95. | Keno | 86.5% | 63.2%(+23.2)#96 | 64.8%(+21.6)#8,265 |
| 96. | Svensen | 86.3% | 63.2%(+23.1)#97 | 64.8%(+21.5)#8,329 |
| 97. | Lyons | 86.0% | 63.2%(+22.8)#98 | 64.8%(+21.2)#8,540 |
| 98. | Gearhart | 86.0% | 63.2%(+22.7)#99 | 64.8%(+21.1)#8,580 |
| 99. | Idanha | 85.9% | 63.2%(+22.7)#100 | 64.8%(+21.1)#8,601 |
| 100. | Yamhill | 85.9% | 63.2%(+22.7)#101 | 64.8%(+21.1)#8,613 |
Common Questions
What are the Top 10 Cities with the Highest Percentage of Owner-Occupied Units in Oregon?
Top 10 Cities with the Highest Percentage of Owner-Occupied Units in Oregon are:
#1
100.0%
#2
100.0%
#3
100.0%
#4
100.0%
#5
100.0%
#6
100.0%
#7
100.0%
#8
100.0%
#9
100.0%
#10
100.0%
What city has the Highest Percentage of Owner-Occupied Units in Oregon?
Tetherow has the Highest Percentage of Owner-Occupied Units in Oregon with 100.0%.
What is the Percentage of Owner-Occupied Units in the State of Oregon?
Percentage of Owner-Occupied Units in Oregon is 63.2%.
What is the Percentage of Owner-Occupied Units in the United States?
Percentage of Owner-Occupied Units in the United States is 64.8%.