Myrtle Creek, OR Map & Demographics
Myrtle Creek Map
Myrtle Creek Overview
$30,305
PER CAPITA INCOME
$64,135
AVG FAMILY INCOME
$56,842
AVG HOUSEHOLD INCOME
38.2%
WAGE / INCOME GAP [ % ]
61.8¢/ $1
WAGE / INCOME GAP [ $ ]
0.47
INEQUALITY / GINI INDEX
3,488
TOTAL POPULATION
1,774
MALE POPULATION
1,714
FEMALE POPULATION
103.50
MALES / 100 FEMALES
96.62
FEMALES / 100 MALES
41.4
MEDIAN AGE
3.0
AVG FAMILY SIZE
2.5
AVG HOUSEHOLD SIZE
1,628
LABOR FORCE [ PEOPLE ]
58.2%
PERCENT IN LABOR FORCE
8.7%
UNEMPLOYMENT RATE
Myrtle Creek Zip Codes
Myrtle Creek Area Codes
Income in Myrtle Creek
Income Overview in Myrtle Creek
Per Capita Income in Myrtle Creek is $30,305, while median incomes of families and households are $64,135 and $56,842 respectively.
| Characteristic | Number | Measure |
| Per Capita Income | 3,488 | $30,305 |
| Median Family Income | 941 | $64,135 |
| Mean Family Income | 941 | $86,864 |
| Median Household Income | 1,348 | $56,842 |
| Mean Household Income | 1,348 | $74,591 |
| Income Deficit | 941 | $0 |
| Wage / Income Gap (%) | 3,488 | 38.23% |
| Wage / Income Gap ($) | 3,488 | 61.77¢ per $1 |
| Gini / Inequality Index | 3,488 | 0.47 |
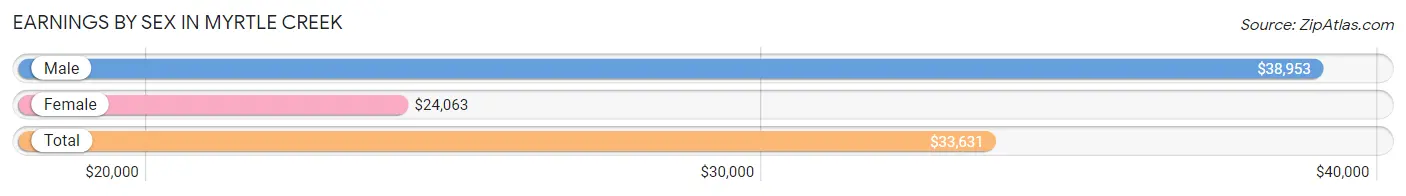
Earnings by Sex in Myrtle Creek
Average Earnings in Myrtle Creek are $33,631, $38,953 for men and $24,063 for women, a difference of 38.2%.
| Sex | Number | Average Earnings |
| Male | 874 (52.1%) | $38,953 |
| Female | 803 (47.9%) | $24,063 |
| Total | 1,677 (100.0%) | $33,631 |
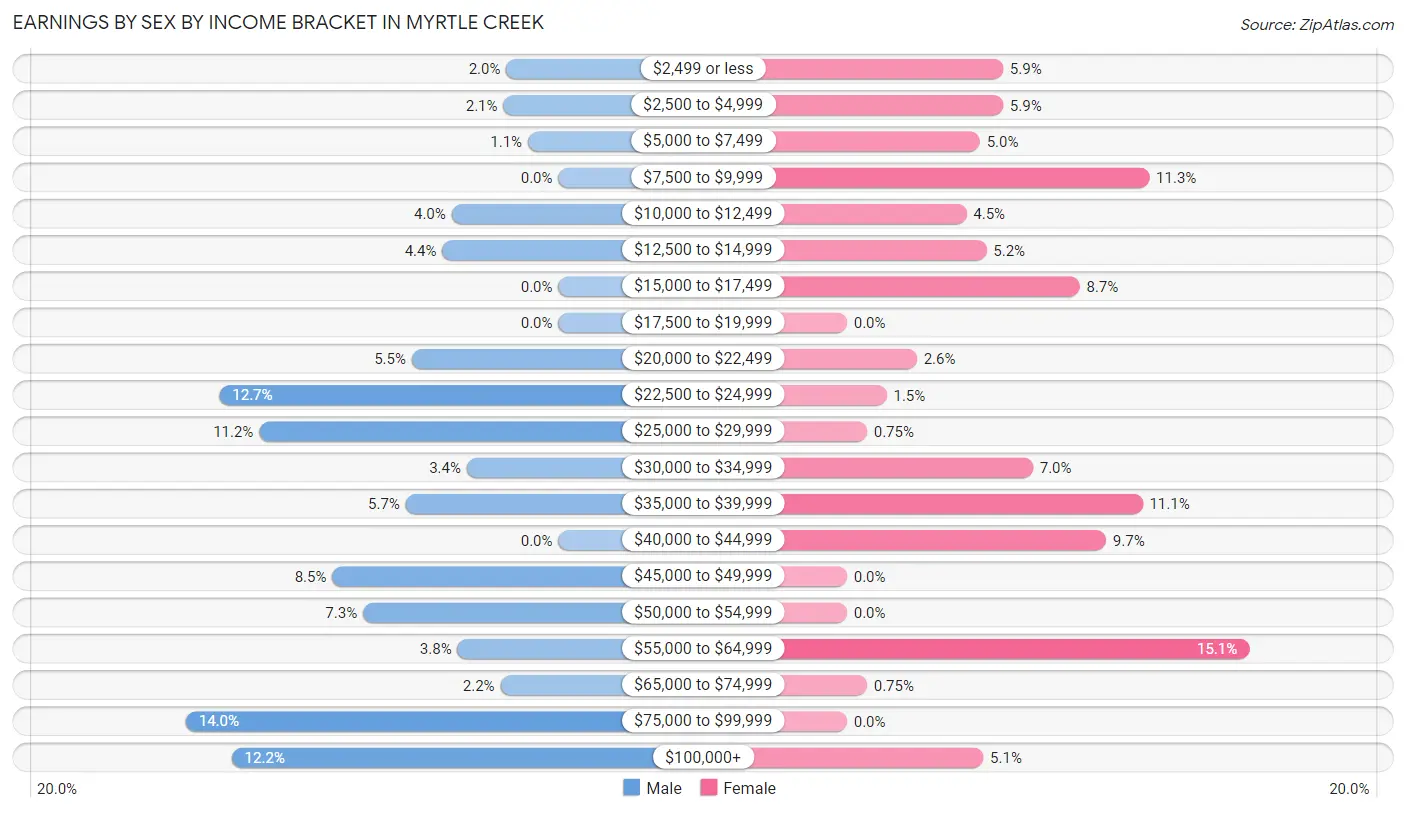
Earnings by Sex by Income Bracket in Myrtle Creek
The most common earnings brackets in Myrtle Creek are $75,000 to $99,999 for men (122 | 14.0%) and $55,000 to $64,999 for women (121 | 15.1%).
| Income | Male | Female |
| $2,499 or less | 17 (1.9%) | 47 (5.9%) |
| $2,500 to $4,999 | 18 (2.1%) | 47 (5.9%) |
| $5,000 to $7,499 | 10 (1.1%) | 40 (5.0%) |
| $7,500 to $9,999 | 0 (0.0%) | 91 (11.3%) |
| $10,000 to $12,499 | 35 (4.0%) | 36 (4.5%) |
| $12,500 to $14,999 | 38 (4.3%) | 42 (5.2%) |
| $15,000 to $17,499 | 0 (0.0%) | 70 (8.7%) |
| $17,500 to $19,999 | 0 (0.0%) | 0 (0.0%) |
| $20,000 to $22,499 | 48 (5.5%) | 21 (2.6%) |
| $22,500 to $24,999 | 111 (12.7%) | 12 (1.5%) |
| $25,000 to $29,999 | 98 (11.2%) | 6 (0.7%) |
| $30,000 to $34,999 | 30 (3.4%) | 56 (7.0%) |
| $35,000 to $39,999 | 50 (5.7%) | 89 (11.1%) |
| $40,000 to $44,999 | 0 (0.0%) | 78 (9.7%) |
| $45,000 to $49,999 | 74 (8.5%) | 0 (0.0%) |
| $50,000 to $54,999 | 64 (7.3%) | 0 (0.0%) |
| $55,000 to $64,999 | 33 (3.8%) | 121 (15.1%) |
| $65,000 to $74,999 | 19 (2.2%) | 6 (0.7%) |
| $75,000 to $99,999 | 122 (14.0%) | 0 (0.0%) |
| $100,000+ | 107 (12.2%) | 41 (5.1%) |
| Total | 874 (100.0%) | 803 (100.0%) |
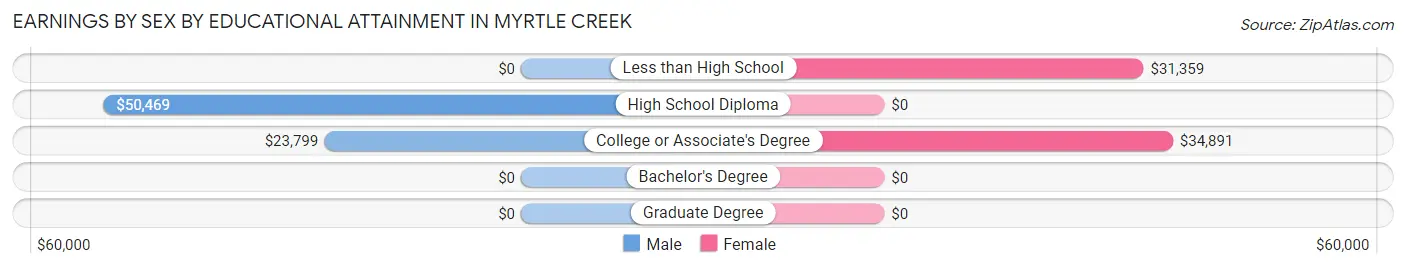
Earnings by Sex by Educational Attainment in Myrtle Creek
Average earnings in Myrtle Creek are $39,448 for men and $30,217 for women, a difference of 23.4%. Men with an educational attainment of high school diploma enjoy the highest average annual earnings of $50,469, while those with college or associate's degree education earn the least with $23,799. Women with an educational attainment of college or associate's degree earn the most with the average annual earnings of $34,891, while those with less than high school education have the smallest earnings of $31,359.
| Educational Attainment | Male Income | Female Income |
| Less than High School | - | - |
| High School Diploma | $50,469 | $0 |
| College or Associate's Degree | $23,799 | $34,891 |
| Bachelor's Degree | - | - |
| Graduate Degree | - | - |
| Total | $39,448 | $30,217 |
Family Income in Myrtle Creek
Family Income Brackets in Myrtle Creek
According to the Myrtle Creek family income data, there are 267 families falling into the $50,000 to $74,999 income range, which is the most common income bracket and makes up 28.4% of all families. Conversely, the less than $10,000 income bracket is the least frequent group with only 6 families (0.6%) belonging to this category.
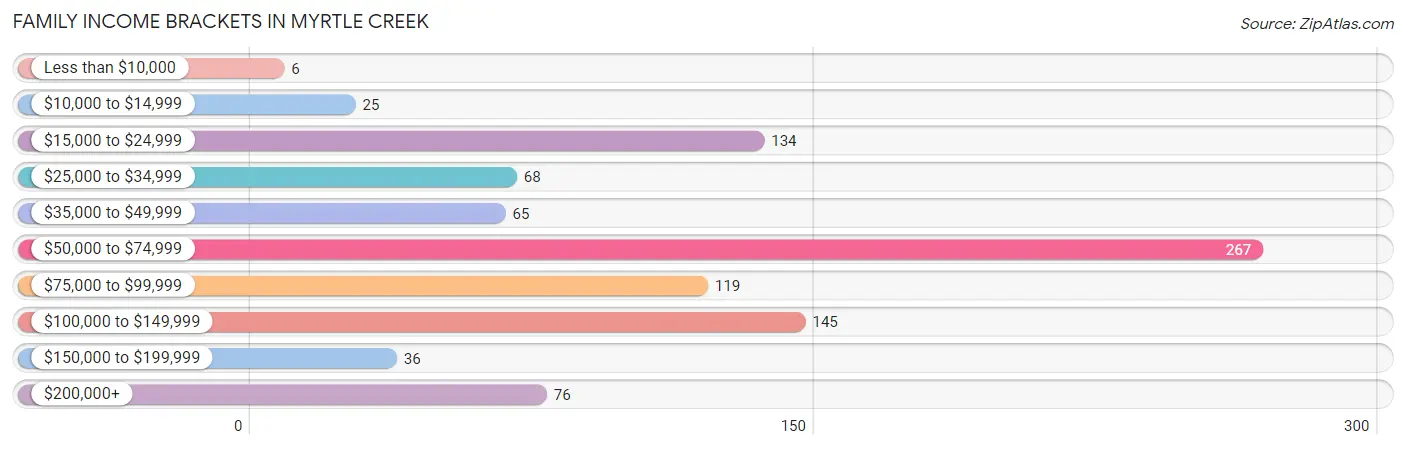
| Income Bracket | # Families | % Families |
| Less than $10,000 | 6 | 0.6% |
| $10,000 to $14,999 | 25 | 2.7% |
| $15,000 to $24,999 | 134 | 14.2% |
| $25,000 to $34,999 | 68 | 7.2% |
| $35,000 to $49,999 | 65 | 6.9% |
| $50,000 to $74,999 | 267 | 28.4% |
| $75,000 to $99,999 | 119 | 12.6% |
| $100,000 to $149,999 | 145 | 15.4% |
| $150,000 to $199,999 | 36 | 3.8% |
| $200,000+ | 76 | 8.1% |
Family Income by Famaliy Size in Myrtle Creek
5-person families (96 | 10.2%) account for the highest median family income in Myrtle Creek with $250,001 per family, while 5-person families (96 | 10.2%) have the highest median income of $50,000 per family member.
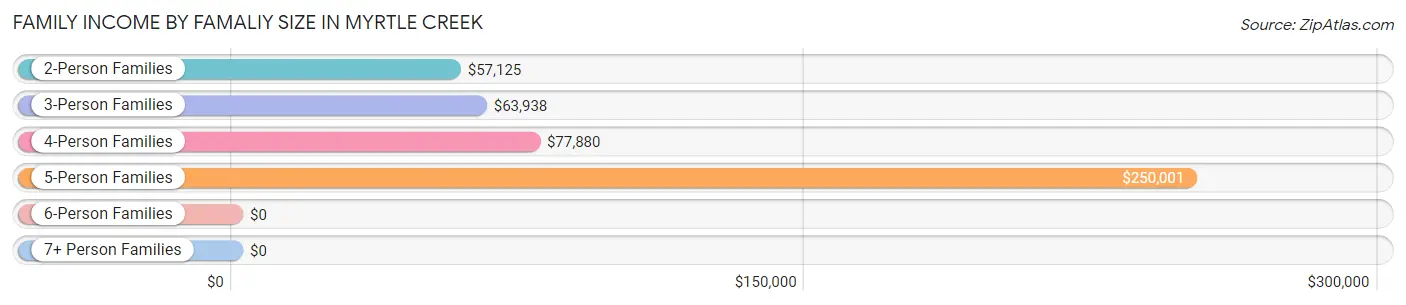
| Income Bracket | # Families | Median Income |
| 2-Person Families | 443 (47.1%) | $57,125 |
| 3-Person Families | 341 (36.2%) | $63,938 |
| 4-Person Families | 51 (5.4%) | $77,880 |
| 5-Person Families | 96 (10.2%) | $250,001 |
| 6-Person Families | 0 (0.0%) | $0 |
| 7+ Person Families | 10 (1.1%) | $0 |
| Total | 941 (100.0%) | $64,135 |
Family Income by Number of Earners in Myrtle Creek
The median family income in Myrtle Creek is $64,135, with families comprising 3+ earners (49) having the highest median family income of $121,422, while families with no earners (189) have the lowest median family income of $39,792, accounting for 5.2% and 20.1% of families, respectively.
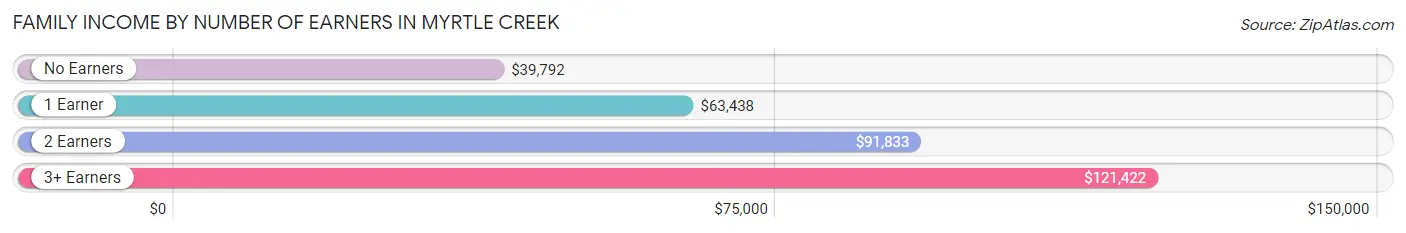
| Number of Earners | # Families | Median Income |
| No Earners | 189 (20.1%) | $39,792 |
| 1 Earner | 453 (48.1%) | $63,438 |
| 2 Earners | 250 (26.6%) | $91,833 |
| 3+ Earners | 49 (5.2%) | $121,422 |
| Total | 941 (100.0%) | $64,135 |
Household Income in Myrtle Creek
Household Income Brackets in Myrtle Creek
With 342 households falling in the category, the $50,000 to $74,999 income range is the most frequent in Myrtle Creek, accounting for 25.4% of all households. In contrast, only 32 households (2.4%) fall into the less than $10,000 income bracket, making it the least populous group.
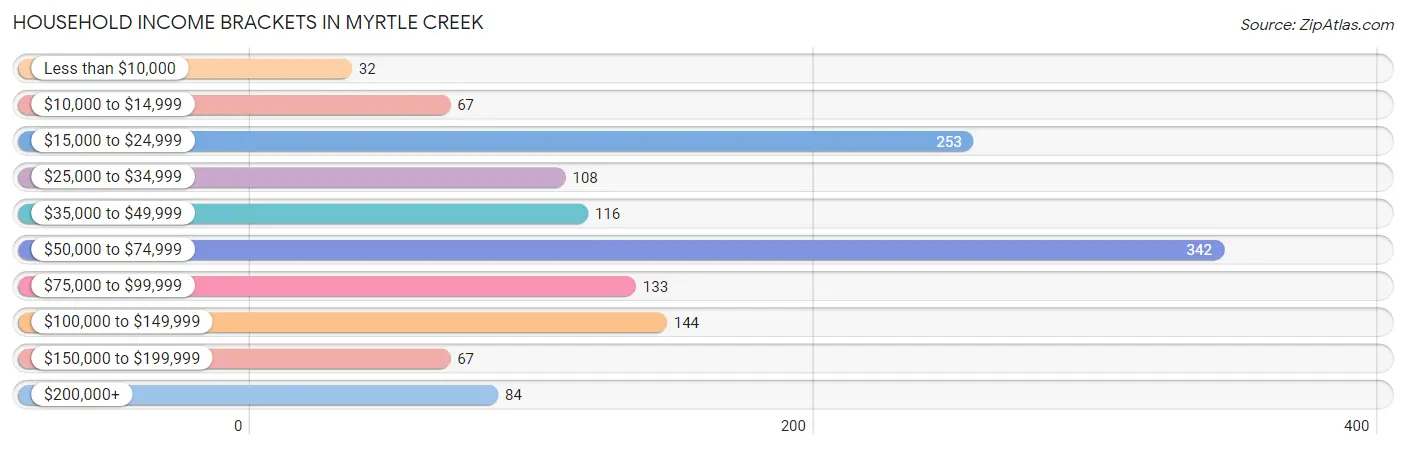
| Income Bracket | # Households | % Households |
| Less than $10,000 | 32 | 2.4% |
| $10,000 to $14,999 | 67 | 5.0% |
| $15,000 to $24,999 | 253 | 18.8% |
| $25,000 to $34,999 | 108 | 8.0% |
| $35,000 to $49,999 | 116 | 8.6% |
| $50,000 to $74,999 | 342 | 25.4% |
| $75,000 to $99,999 | 133 | 9.9% |
| $100,000 to $149,999 | 144 | 10.7% |
| $150,000 to $199,999 | 67 | 5.0% |
| $200,000+ | 84 | 6.2% |
Household Income by Householder Age in Myrtle Creek
The median household income in Myrtle Creek is $56,842, with the highest median household income of $58,889 found in the 25 to 44 years age bracket for the primary householder. A total of 446 households (33.1%) fall into this category.
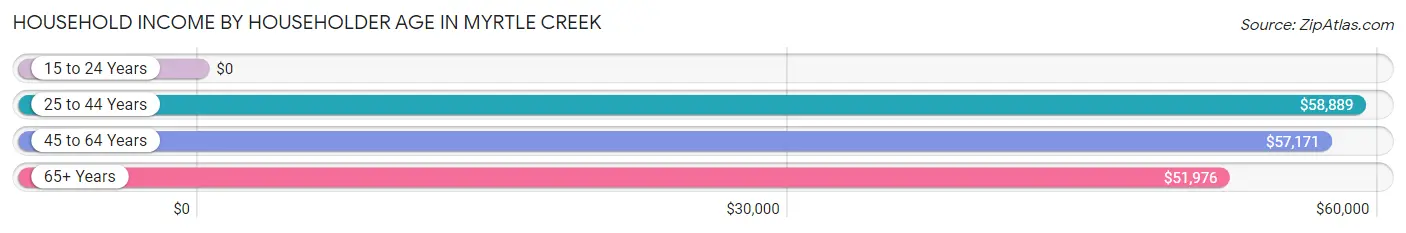
| Income Bracket | # Households | Median Income |
| 15 to 24 Years | 0 (0.0%) | $0 |
| 25 to 44 Years | 446 (33.1%) | $58,889 |
| 45 to 64 Years | 417 (30.9%) | $57,171 |
| 65+ Years | 485 (36.0%) | $51,976 |
| Total | 1,348 (100.0%) | $56,842 |
Poverty in Myrtle Creek
Income Below Poverty by Sex and Age in Myrtle Creek
With 12.8% poverty level for males and 17.8% for females among the residents of Myrtle Creek, under 5 year old males and 25 to 34 year old females are the most vulnerable to poverty, with 74 males (64.9%) and 161 females (67.1%) in their respective age groups living below the poverty level.
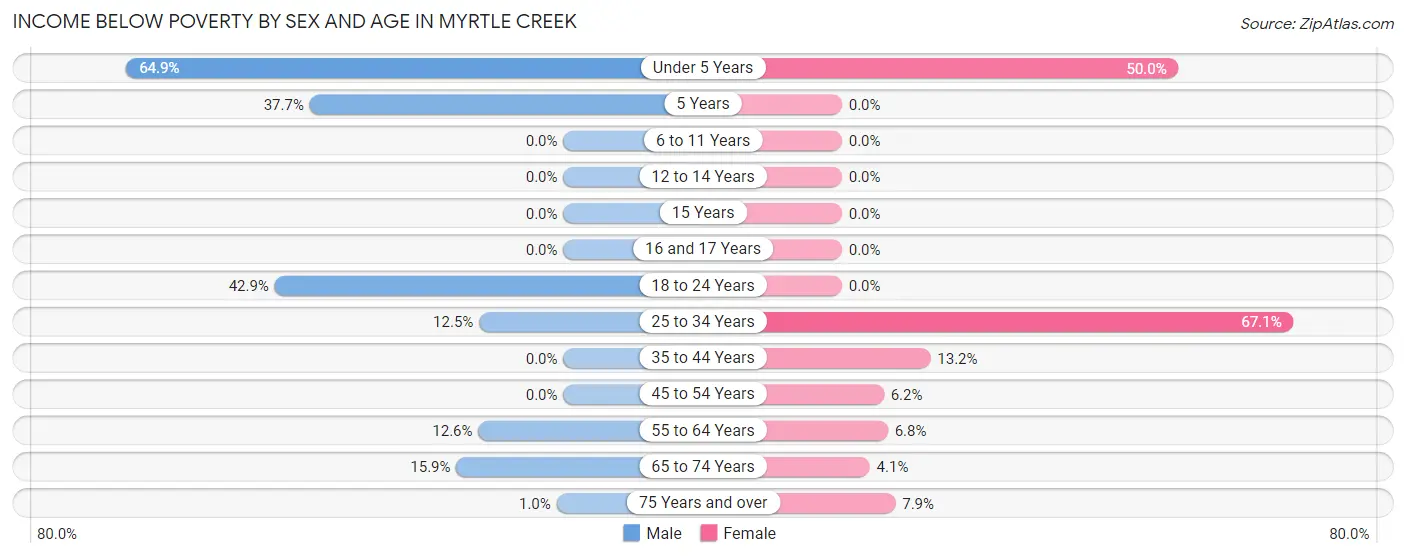
| Age Bracket | Male | Female |
| Under 5 Years | 74 (64.9%) | 51 (50.0%) |
| 5 Years | 29 (37.7%) | 0 (0.0%) |
| 6 to 11 Years | 0 (0.0%) | 0 (0.0%) |
| 12 to 14 Years | 0 (0.0%) | 0 (0.0%) |
| 15 Years | 0 (0.0%) | 0 (0.0%) |
| 16 and 17 Years | 0 (0.0%) | 0 (0.0%) |
| 18 to 24 Years | 12 (42.9%) | 0 (0.0%) |
| 25 to 34 Years | 35 (12.5%) | 161 (67.1%) |
| 35 to 44 Years | 0 (0.0%) | 38 (13.2%) |
| 45 to 54 Years | 0 (0.0%) | 12 (6.2%) |
| 55 to 64 Years | 40 (12.6%) | 18 (6.8%) |
| 65 to 74 Years | 34 (15.9%) | 7 (4.1%) |
| 75 Years and over | 1 (1.0%) | 17 (7.9%) |
| Total | 225 (12.8%) | 304 (17.8%) |
Income Above Poverty by Sex and Age in Myrtle Creek
According to the poverty statistics in Myrtle Creek, males aged 6 to 11 years and females aged 6 to 11 years are the age groups that are most secure financially, with 100.0% of males and 100.0% of females in these age groups living above the poverty line.
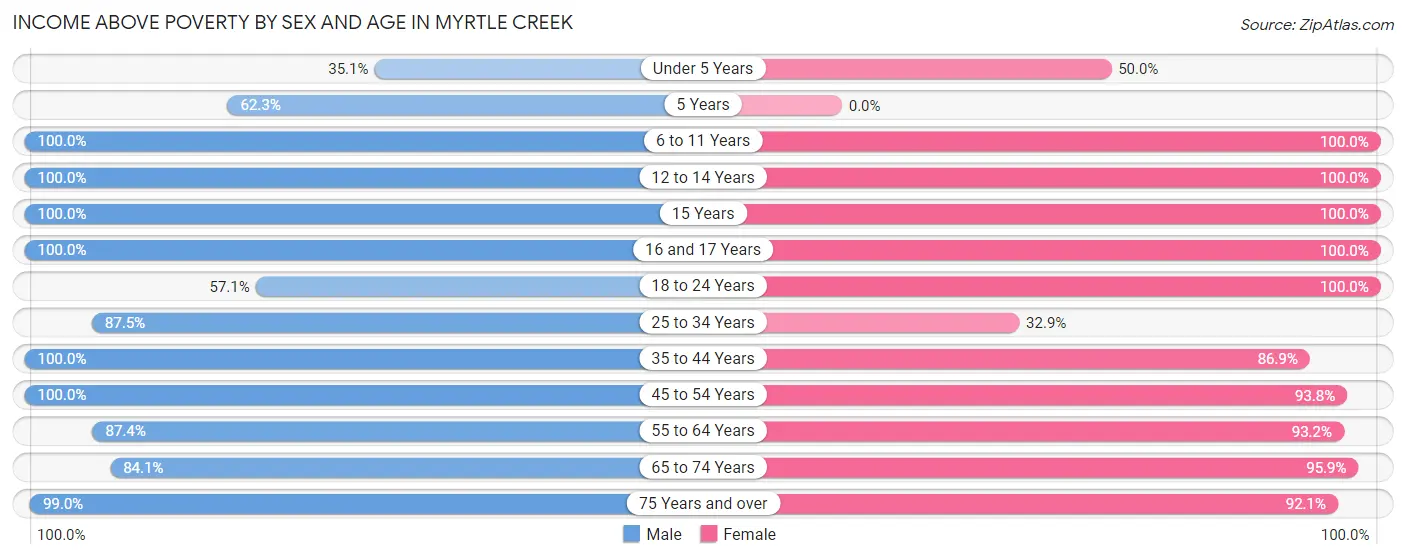
| Age Bracket | Male | Female |
| Under 5 Years | 40 (35.1%) | 51 (50.0%) |
| 5 Years | 48 (62.3%) | 0 (0.0%) |
| 6 to 11 Years | 104 (100.0%) | 37 (100.0%) |
| 12 to 14 Years | 91 (100.0%) | 76 (100.0%) |
| 15 Years | 45 (100.0%) | 30 (100.0%) |
| 16 and 17 Years | 12 (100.0%) | 37 (100.0%) |
| 18 to 24 Years | 16 (57.1%) | 56 (100.0%) |
| 25 to 34 Years | 245 (87.5%) | 79 (32.9%) |
| 35 to 44 Years | 243 (100.0%) | 251 (86.9%) |
| 45 to 54 Years | 129 (100.0%) | 181 (93.8%) |
| 55 to 64 Years | 277 (87.4%) | 246 (93.2%) |
| 65 to 74 Years | 180 (84.1%) | 162 (95.9%) |
| 75 Years and over | 99 (99.0%) | 197 (92.1%) |
| Total | 1,529 (87.2%) | 1,403 (82.2%) |
Income Below Poverty Among Married-Couple Families in Myrtle Creek
The poverty statistics for married-couple families in Myrtle Creek show that 3.2% or 18 of the total 567 families live below the poverty line. Families with no children have the highest poverty rate of 4.4%, comprising of 18 families. On the other hand, families with 1 or 2 children have the lowest poverty rate of 0.0%, which includes 0 families.
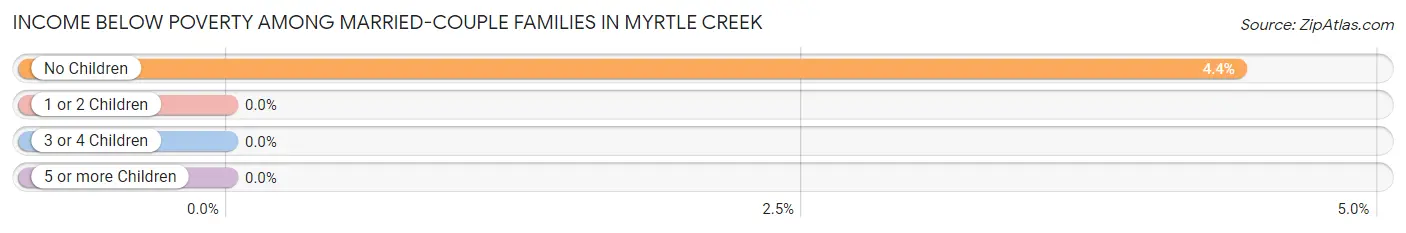
| Children | Above Poverty | Below Poverty |
| No Children | 392 (95.6%) | 18 (4.4%) |
| 1 or 2 Children | 147 (100.0%) | 0 (0.0%) |
| 3 or 4 Children | 0 (0.0%) | 0 (0.0%) |
| 5 or more Children | 10 (100.0%) | 0 (0.0%) |
| Total | 549 (96.8%) | 18 (3.2%) |
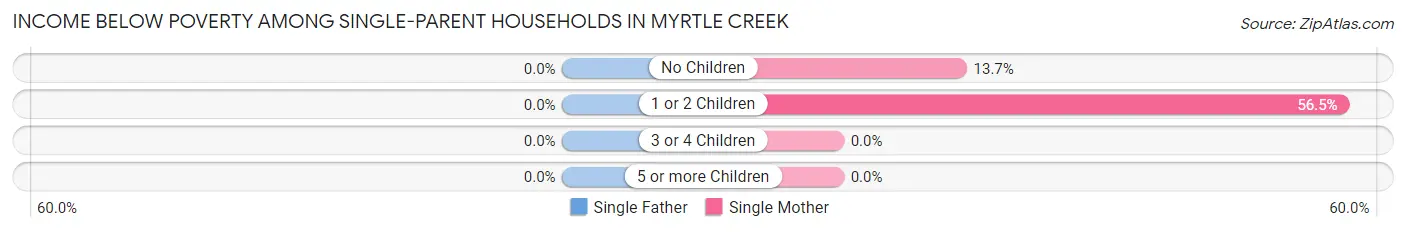
Income Below Poverty Among Single-Parent Households in Myrtle Creek
| Children | Single Father | Single Mother |
| No Children | 0 (0.0%) | 18 (13.7%) |
| 1 or 2 Children | 0 (0.0%) | 78 (56.5%) |
| 3 or 4 Children | 0 (0.0%) | 0 (0.0%) |
| 5 or more Children | 0 (0.0%) | 0 (0.0%) |
| Total | 0 (0.0%) | 96 (34.4%) |
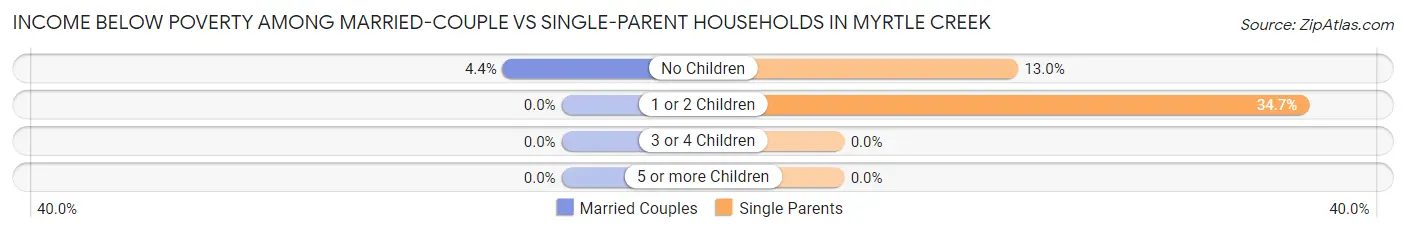
Income Below Poverty Among Married-Couple vs Single-Parent Households in Myrtle Creek
The poverty data for Myrtle Creek shows that 18 of the married-couple family households (3.2%) and 96 of the single-parent households (25.7%) are living below the poverty level. Within the married-couple family households, those with no children have the highest poverty rate, with 18 households (4.4%) falling below the poverty line. Among the single-parent households, those with 1 or 2 children have the highest poverty rate, with 78 household (34.7%) living below poverty.
| Children | Married-Couple Families | Single-Parent Households |
| No Children | 18 (4.4%) | 18 (13.0%) |
| 1 or 2 Children | 0 (0.0%) | 78 (34.7%) |
| 3 or 4 Children | 0 (0.0%) | 0 (0.0%) |
| 5 or more Children | 0 (0.0%) | 0 (0.0%) |
| Total | 18 (3.2%) | 96 (25.7%) |
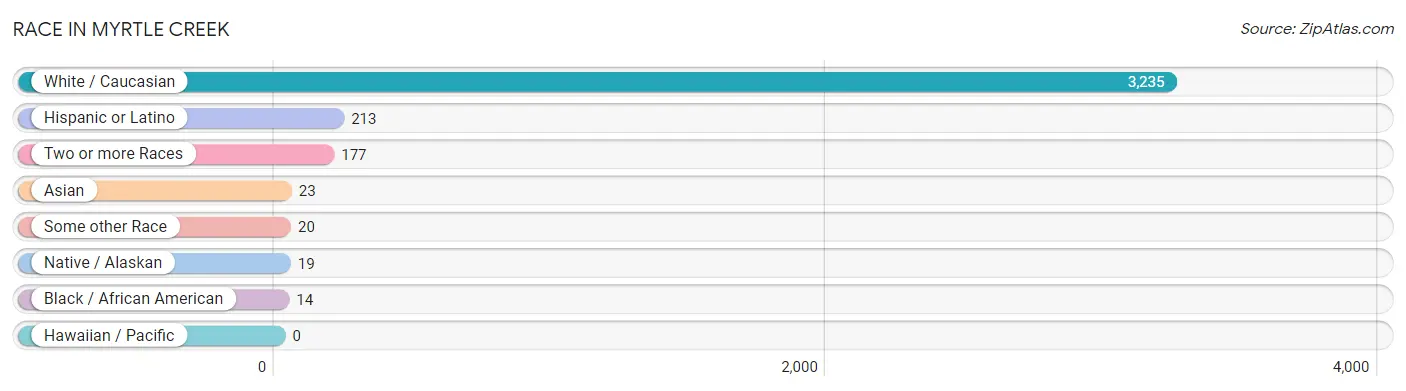
Race in Myrtle Creek
The most populous races in Myrtle Creek are White / Caucasian (3,235 | 92.7%), Hispanic or Latino (213 | 6.1%), and Two or more Races (177 | 5.1%).
| Race | # Population | % Population |
| Asian | 23 | 0.7% |
| Black / African American | 14 | 0.4% |
| Hawaiian / Pacific | 0 | 0.0% |
| Hispanic or Latino | 213 | 6.1% |
| Native / Alaskan | 19 | 0.5% |
| White / Caucasian | 3,235 | 92.7% |
| Two or more Races | 177 | 5.1% |
| Some other Race | 20 | 0.6% |
| Total | 3,488 | 100.0% |
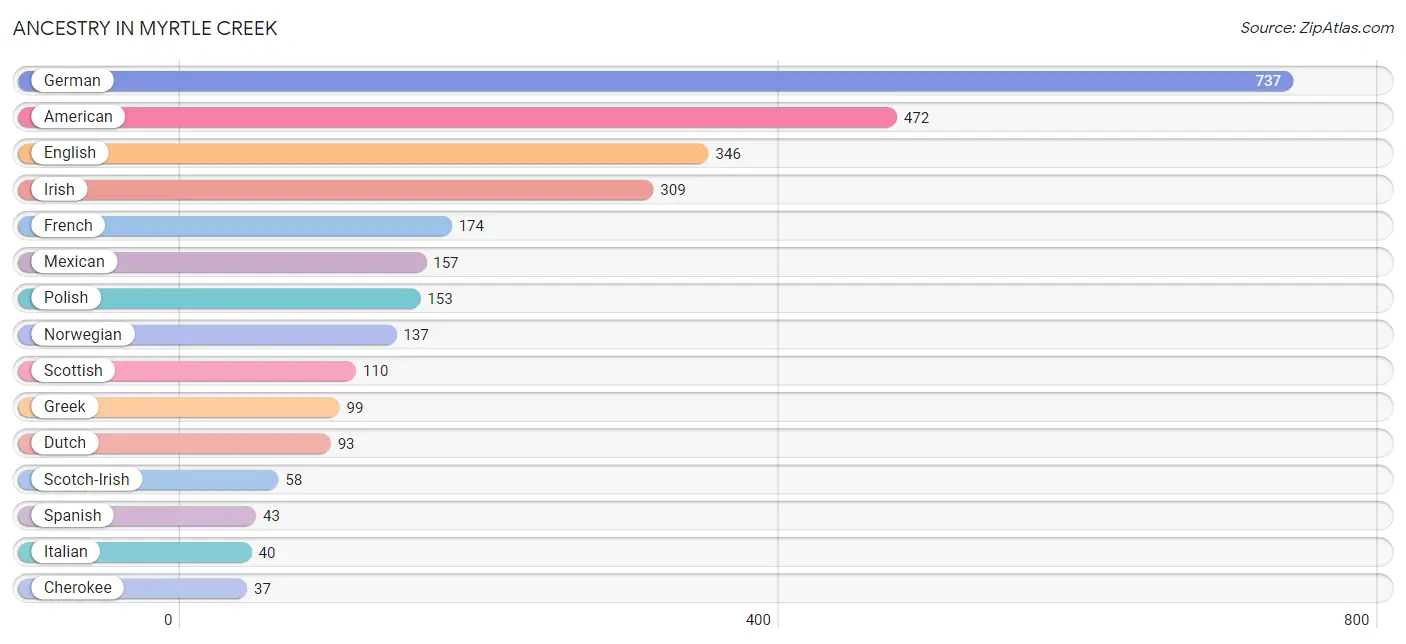
Ancestry in Myrtle Creek
The most populous ancestries reported in Myrtle Creek are German (737 | 21.1%), American (472 | 13.5%), English (346 | 9.9%), Irish (309 | 8.9%), and French (174 | 5.0%), together accounting for 58.4% of all Myrtle Creek residents.
| Ancestry | # Population | % Population |
| African | 14 | 0.4% |
| American | 472 | 13.5% |
| Austrian | 23 | 0.7% |
| Blackfeet | 1 | 0.0% |
| British | 13 | 0.4% |
| Burmese | 18 | 0.5% |
| Cajun | 6 | 0.2% |
| Central American | 13 | 0.4% |
| Cherokee | 37 | 1.1% |
| Czech | 9 | 0.3% |
| Dutch | 93 | 2.7% |
| Eastern European | 5 | 0.1% |
| English | 346 | 9.9% |
| European | 32 | 0.9% |
| French | 174 | 5.0% |
| French Canadian | 22 | 0.6% |
| German | 737 | 21.1% |
| Greek | 99 | 2.8% |
| Irish | 309 | 8.9% |
| Italian | 40 | 1.1% |
| Korean | 5 | 0.1% |
| Mexican | 157 | 4.5% |
| Norwegian | 137 | 3.9% |
| Ottawa | 3 | 0.1% |
| Polish | 153 | 4.4% |
| Salvadoran | 13 | 0.4% |
| Scandinavian | 25 | 0.7% |
| Scotch-Irish | 58 | 1.7% |
| Scottish | 110 | 3.2% |
| Seminole | 18 | 0.5% |
| Spanish | 43 | 1.2% |
| Subsaharan African | 14 | 0.4% |
| Swedish | 33 | 0.9% | View All 33 Rows |
Immigrants in Myrtle Creek
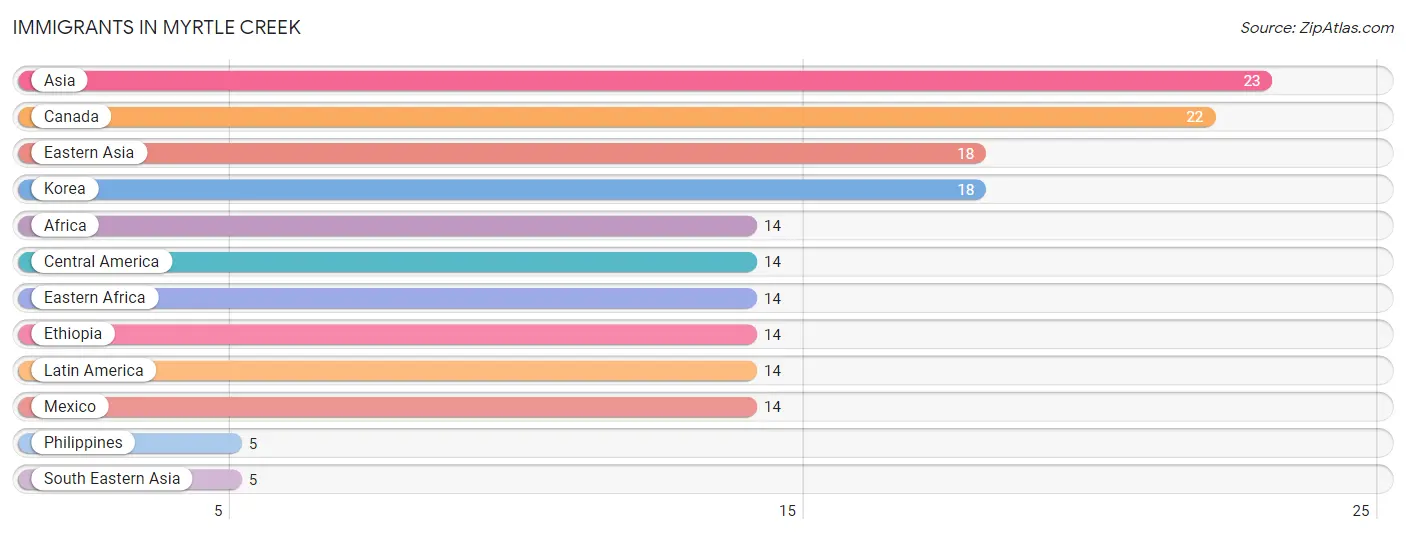
The most numerous immigrant groups reported in Myrtle Creek came from Asia (23 | 0.7%), Canada (22 | 0.6%), Eastern Asia (18 | 0.5%), Korea (18 | 0.5%), and Africa (14 | 0.4%), together accounting for 2.7% of all Myrtle Creek residents.
| Immigration Origin | # Population | % Population |
| Africa | 14 | 0.4% |
| Asia | 23 | 0.7% |
| Canada | 22 | 0.6% |
| Central America | 14 | 0.4% |
| Eastern Africa | 14 | 0.4% |
| Eastern Asia | 18 | 0.5% |
| Ethiopia | 14 | 0.4% |
| Korea | 18 | 0.5% |
| Latin America | 14 | 0.4% |
| Mexico | 14 | 0.4% |
| Philippines | 5 | 0.1% |
| South Eastern Asia | 5 | 0.1% | View All 12 Rows |
Sex and Age in Myrtle Creek
Sex and Age in Myrtle Creek
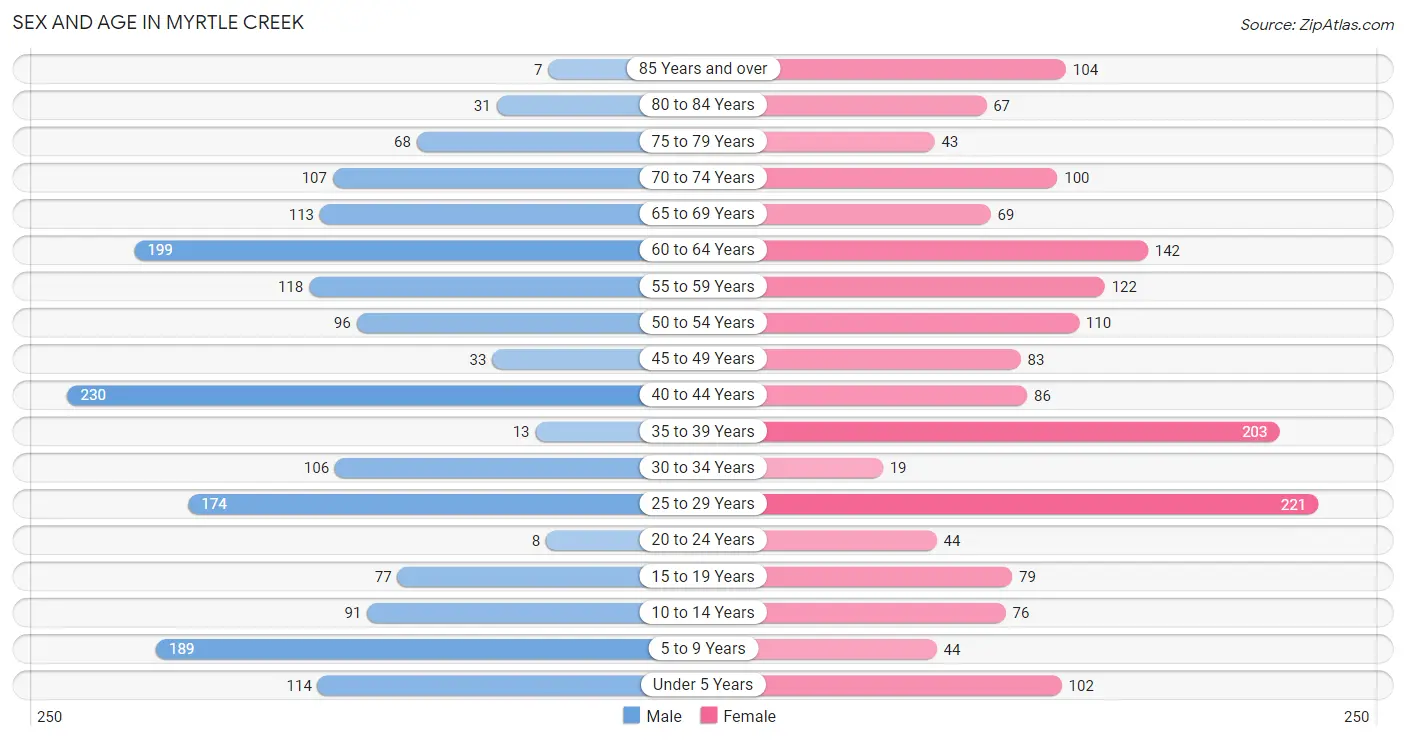
The most populous age groups in Myrtle Creek are 40 to 44 Years (230 | 13.0%) for men and 25 to 29 Years (221 | 12.9%) for women.
| Age Bracket | Male | Female |
| Under 5 Years | 114 (6.4%) | 102 (5.9%) |
| 5 to 9 Years | 189 (10.6%) | 44 (2.6%) |
| 10 to 14 Years | 91 (5.1%) | 76 (4.4%) |
| 15 to 19 Years | 77 (4.3%) | 79 (4.6%) |
| 20 to 24 Years | 8 (0.4%) | 44 (2.6%) |
| 25 to 29 Years | 174 (9.8%) | 221 (12.9%) |
| 30 to 34 Years | 106 (6.0%) | 19 (1.1%) |
| 35 to 39 Years | 13 (0.7%) | 203 (11.8%) |
| 40 to 44 Years | 230 (13.0%) | 86 (5.0%) |
| 45 to 49 Years | 33 (1.9%) | 83 (4.8%) |
| 50 to 54 Years | 96 (5.4%) | 110 (6.4%) |
| 55 to 59 Years | 118 (6.7%) | 122 (7.1%) |
| 60 to 64 Years | 199 (11.2%) | 142 (8.3%) |
| 65 to 69 Years | 113 (6.4%) | 69 (4.0%) |
| 70 to 74 Years | 107 (6.0%) | 100 (5.8%) |
| 75 to 79 Years | 68 (3.8%) | 43 (2.5%) |
| 80 to 84 Years | 31 (1.8%) | 67 (3.9%) |
| 85 Years and over | 7 (0.4%) | 104 (6.1%) |
| Total | 1,774 (100.0%) | 1,714 (100.0%) |
Families and Households in Myrtle Creek
Median Family Size in Myrtle Creek
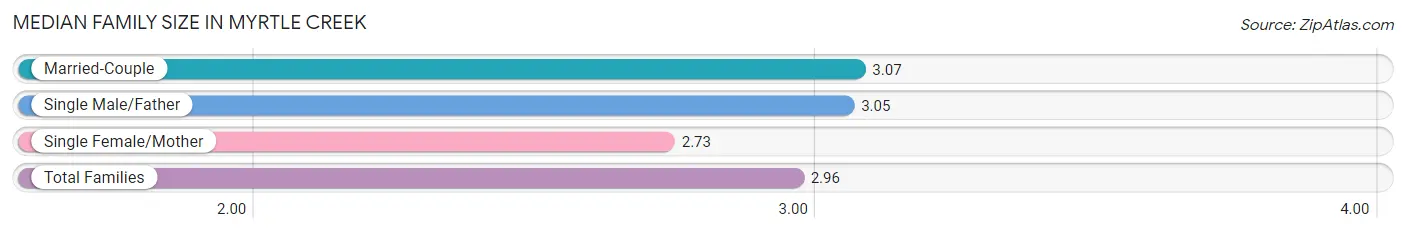
The median family size in Myrtle Creek is 2.96 persons per family, with married-couple families (567 | 60.3%) accounting for the largest median family size of 3.07 persons per family. On the other hand, single female/mother families (279 | 29.6%) represent the smallest median family size with 2.73 persons per family.
| Family Type | # Families | Family Size |
| Married-Couple | 567 (60.3%) | 3.07 |
| Single Male/Father | 95 (10.1%) | 3.05 |
| Single Female/Mother | 279 (29.6%) | 2.73 |
| Total Families | 941 (100.0%) | 2.96 |
Median Household Size in Myrtle Creek
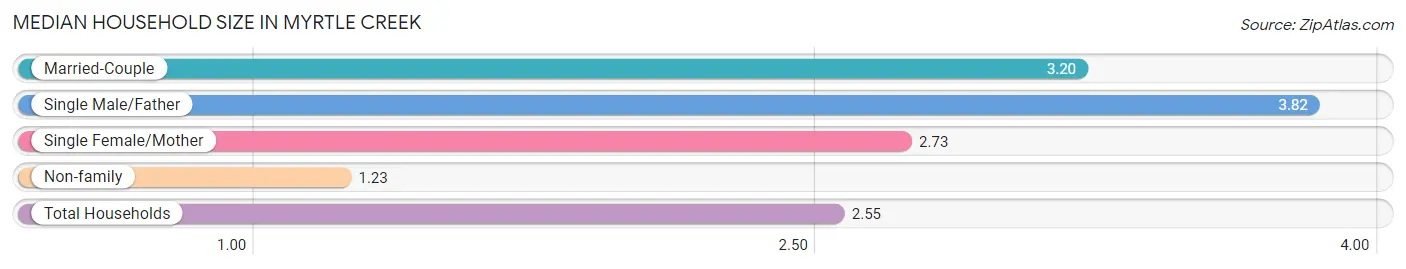
The median household size in Myrtle Creek is 2.55 persons per household, with single male/father households (95 | 7.0%) accounting for the largest median household size of 3.82 persons per household. non-family households (407 | 30.2%) represent the smallest median household size with 1.23 persons per household.
| Household Type | # Households | Household Size |
| Married-Couple | 567 (42.1%) | 3.20 |
| Single Male/Father | 95 (7.0%) | 3.82 |
| Single Female/Mother | 279 (20.7%) | 2.73 |
| Non-family | 407 (30.2%) | 1.23 |
| Total Households | 1,348 (100.0%) | 2.55 |
Household Size by Marriage Status in Myrtle Creek
Out of a total of 1,348 households in Myrtle Creek, 941 (69.8%) are family households, while 407 (30.2%) are nonfamily households. The most numerous type of family households are 2-person households, comprising 435, and the most common type of nonfamily households are 1-person households, comprising 342.
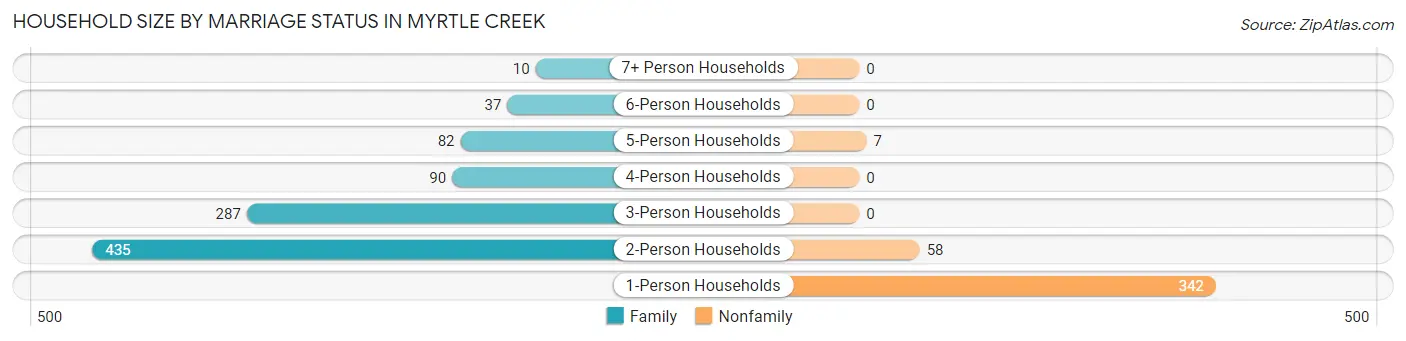
| Household Size | Family Households | Nonfamily Households |
| 1-Person Households | - | 342 (25.4%) |
| 2-Person Households | 435 (32.3%) | 58 (4.3%) |
| 3-Person Households | 287 (21.3%) | 0 (0.0%) |
| 4-Person Households | 90 (6.7%) | 0 (0.0%) |
| 5-Person Households | 82 (6.1%) | 7 (0.5%) |
| 6-Person Households | 37 (2.7%) | 0 (0.0%) |
| 7+ Person Households | 10 (0.7%) | 0 (0.0%) |
| Total | 941 (69.8%) | 407 (30.2%) |
Female Fertility in Myrtle Creek
Fertility by Age in Myrtle Creek
| Age Bracket | Women with Births | Births / 1,000 Women |
| 15 to 19 years | 0 (0.0%) | 0.0 |
| 20 to 34 years | 0 (0.0%) | 0.0 |
| 35 to 50 years | 0 (0.0%) | 0.0 |
| Total | 0 (0.0%) | 0.0 |
Fertility by Age by Marriage Status in Myrtle Creek
| Age Bracket | Married | Unmarried |
| 15 to 19 years | 0 (0.0%) | 0 (0.0%) |
| 20 to 34 years | 0 (0.0%) | 0 (0.0%) |
| 35 to 50 years | 0 (0.0%) | 0 (0.0%) |
| Total | 0 (0.0%) | 0 (0.0%) |
Fertility by Education in Myrtle Creek
| Educational Attainment | Women with Births | Births / 1,000 Women |
| Less than High School | 0 (0.0%) | 0.0 |
| High School Diploma | 0 (0.0%) | 0.0 |
| College or Associate's Degree | 0 (0.0%) | 0.0 |
| Bachelor's Degree | 0 (0.0%) | 0.0 |
| Graduate Degree | 0 (0.0%) | 0.0 |
| Total | 0 (0.0%) | 0.0 |
Fertility by Education by Marriage Status in Myrtle Creek
| Educational Attainment | Married | Unmarried |
| Less than High School | 0 (0.0%) | 0 (0.0%) |
| High School Diploma | 0 (0.0%) | 0 (0.0%) |
| College or Associate's Degree | 0 (0.0%) | 0 (0.0%) |
| Bachelor's Degree | 0 (0.0%) | 0 (0.0%) |
| Graduate Degree | 0 (0.0%) | 0 (0.0%) |
| Total | 0 (0.0%) | 0 (0.0%) |
Employment Characteristics in Myrtle Creek
Employment by Class of Employer in Myrtle Creek
Among the 1,428 employed individuals in Myrtle Creek, private company employees (940 | 65.8%), not-for-profit organizations (165 | 11.6%), and federal government employees (127 | 8.9%) make up the most common classes of employment.
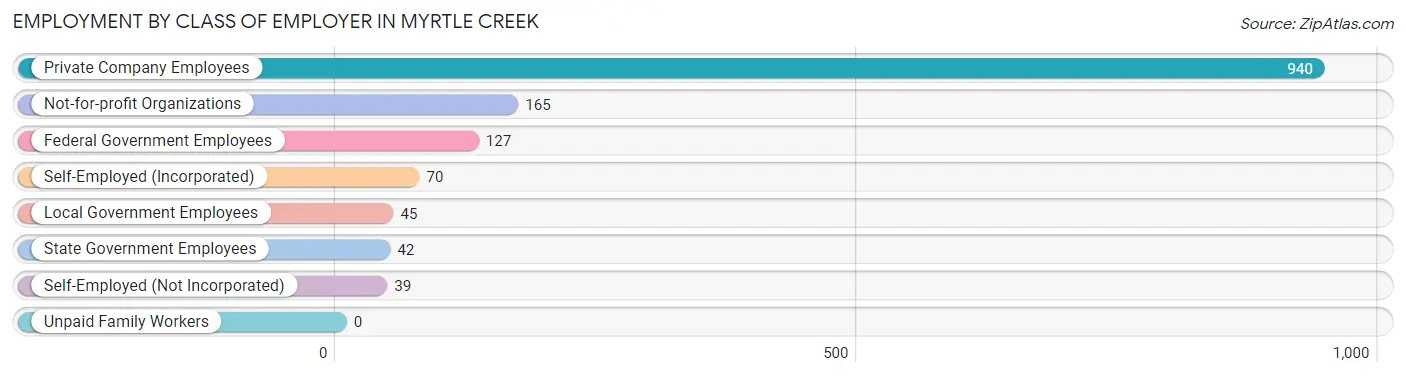
| Employer Class | # Employees | % Employees |
| Private Company Employees | 940 | 65.8% |
| Self-Employed (Incorporated) | 70 | 4.9% |
| Self-Employed (Not Incorporated) | 39 | 2.7% |
| Not-for-profit Organizations | 165 | 11.6% |
| Local Government Employees | 45 | 3.2% |
| State Government Employees | 42 | 2.9% |
| Federal Government Employees | 127 | 8.9% |
| Unpaid Family Workers | 0 | 0.0% |
| Total | 1,428 | 100.0% |
Employment Status by Age in Myrtle Creek
According to the labor force statistics for Myrtle Creek, out of the total population over 16 years of age (2,797), 58.2% or 1,628 individuals are in the labor force, with 8.7% or 142 of them unemployed. The age group with the highest labor force participation rate is 35 to 44 years, with 94.2% or 501 individuals in the labor force. Within the labor force, the 16 to 19 years age range has the highest percentage of unemployed individuals, with 29.0% or 9 of them being unemployed.
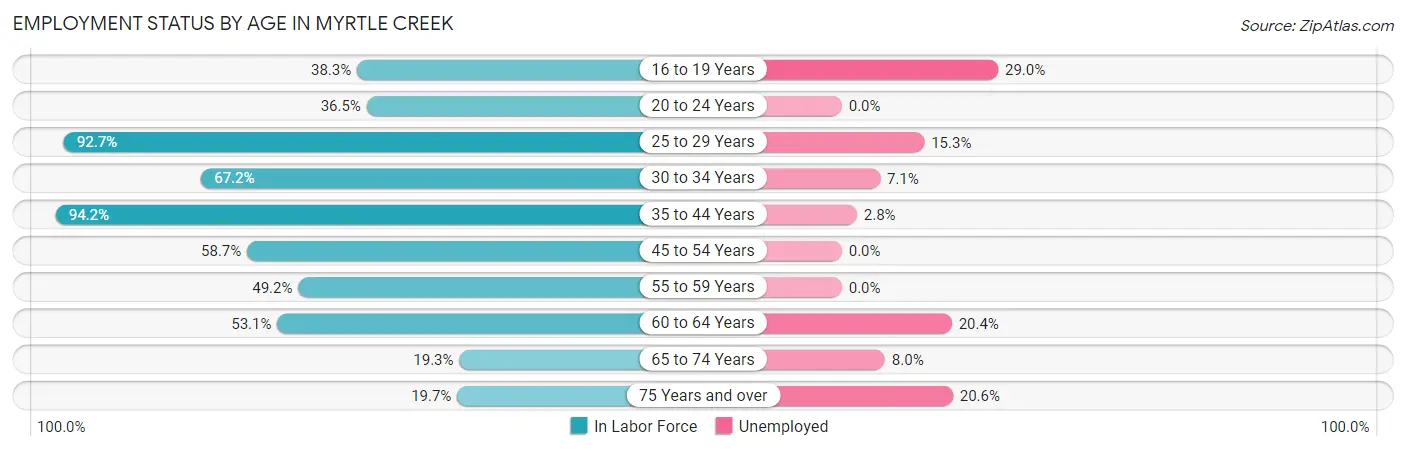
| Age Bracket | In Labor Force | Unemployed |
| 16 to 19 Years | 31 (38.3%) | 9 (29.0%) |
| 20 to 24 Years | 19 (36.5%) | 0 (0.0%) |
| 25 to 29 Years | 366 (92.7%) | 56 (15.3%) |
| 30 to 34 Years | 84 (67.2%) | 6 (7.1%) |
| 35 to 44 Years | 501 (94.2%) | 14 (2.8%) |
| 45 to 54 Years | 189 (58.7%) | 0 (0.0%) |
| 55 to 59 Years | 118 (49.2%) | 0 (0.0%) |
| 60 to 64 Years | 181 (53.1%) | 37 (20.4%) |
| 65 to 74 Years | 75 (19.3%) | 6 (8.0%) |
| 75 Years and over | 63 (19.7%) | 13 (20.6%) |
| Total | 1,628 (58.2%) | 142 (8.7%) |
Employment Status by Educational Attainment in Myrtle Creek
According to labor force statistics for Myrtle Creek, 73.6% of individuals (1,439) out of the total population between 25 and 64 years of age (1,955) are in the labor force, with 7.9% or 114 of them being unemployed. The group with the highest labor force participation rate are those with the educational attainment of bachelor's degree or higher, with 87.4% or 194 individuals in the labor force. Within the labor force, individuals with less than high school education have the highest percentage of unemployment, with 65.2% or 43 of them being unemployed.
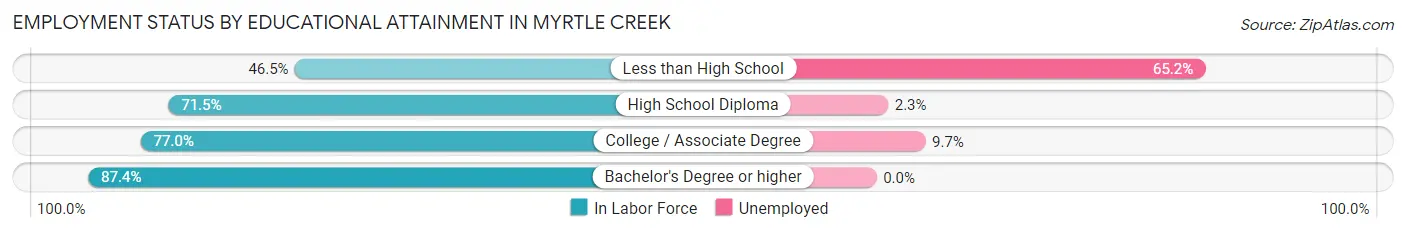
| Educational Attainment | In Labor Force | Unemployed |
| Less than High School | 66 (46.5%) | 93 (65.2%) |
| High School Diploma | 601 (71.5%) | 19 (2.3%) |
| College / Associate Degree | 578 (77.0%) | 73 (9.7%) |
| Bachelor's Degree or higher | 194 (87.4%) | 0 (0.0%) |
| Total | 1,439 (73.6%) | 154 (7.9%) |
Employment Occupations by Sex in Myrtle Creek
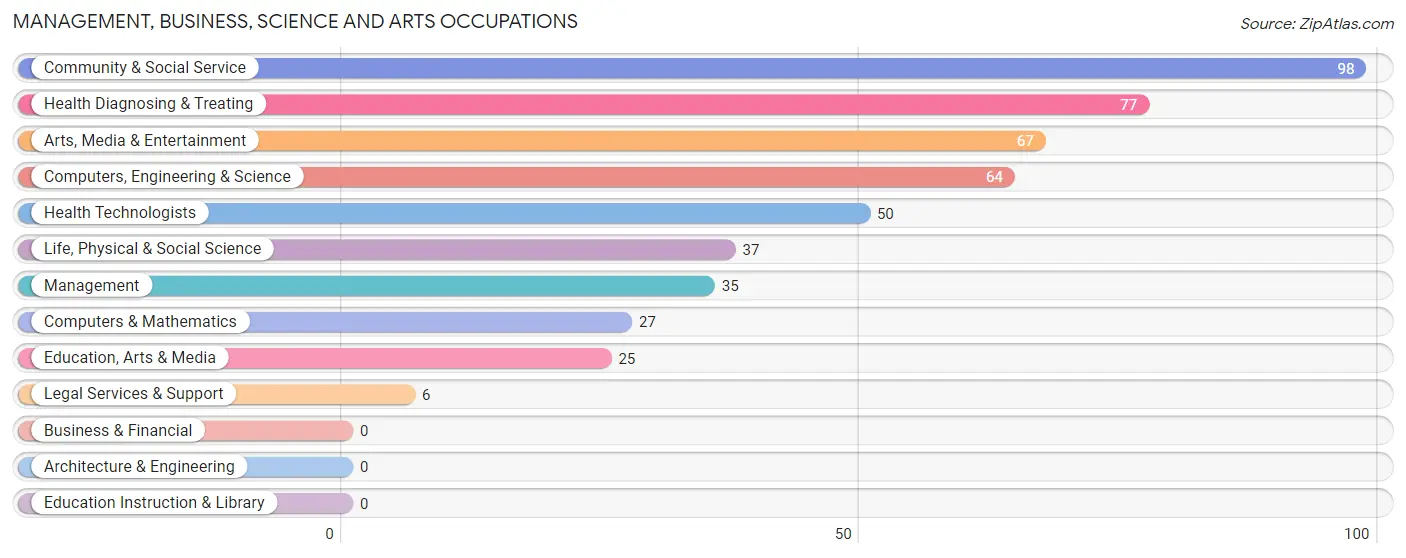
Management, Business, Science and Arts Occupations
The most common Management, Business, Science and Arts occupations in Myrtle Creek are Community & Social Service (98 | 6.6%), Health Diagnosing & Treating (77 | 5.2%), Arts, Media & Entertainment (67 | 4.5%), Computers, Engineering & Science (64 | 4.3%), and Health Technologists (50 | 3.4%).
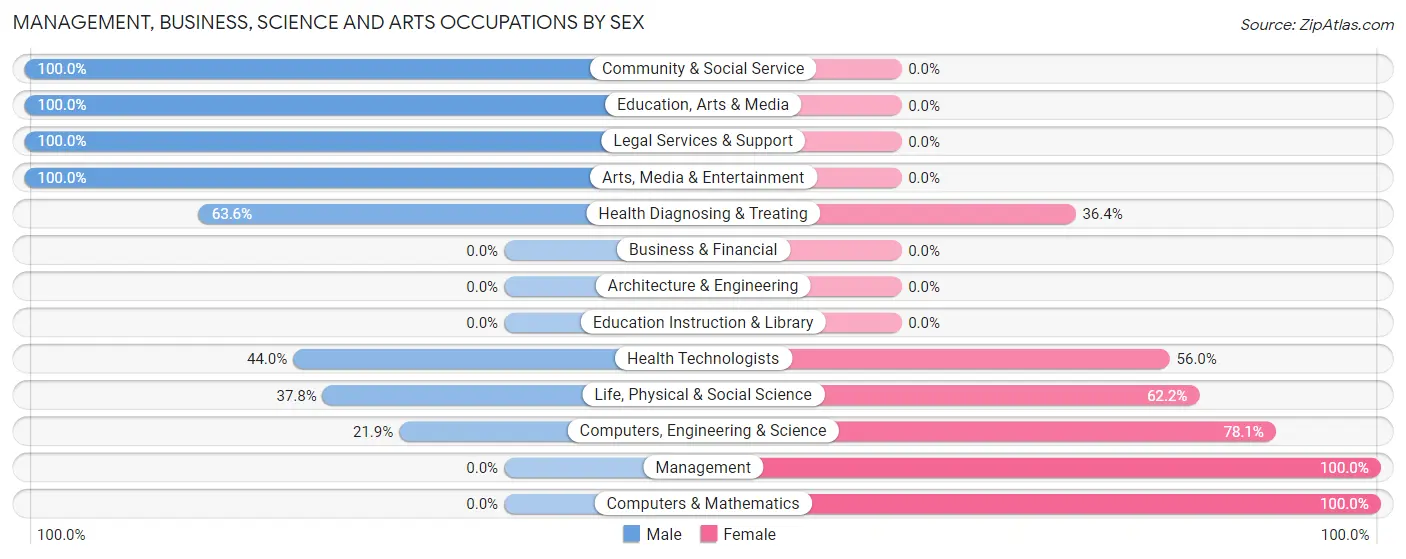
Management, Business, Science and Arts Occupations by Sex
Within the Management, Business, Science and Arts occupations in Myrtle Creek, the most male-oriented occupations are Community & Social Service (100.0%), Education, Arts & Media (100.0%), and Legal Services & Support (100.0%), while the most female-oriented occupations are Management (100.0%), Computers & Mathematics (100.0%), and Computers, Engineering & Science (78.1%).
| Occupation | Male | Female |
| Management | 0 (0.0%) | 35 (100.0%) |
| Business & Financial | 0 (0.0%) | 0 (0.0%) |
| Computers, Engineering & Science | 14 (21.9%) | 50 (78.1%) |
| Computers & Mathematics | 0 (0.0%) | 27 (100.0%) |
| Architecture & Engineering | 0 (0.0%) | 0 (0.0%) |
| Life, Physical & Social Science | 14 (37.8%) | 23 (62.2%) |
| Community & Social Service | 98 (100.0%) | 0 (0.0%) |
| Education, Arts & Media | 25 (100.0%) | 0 (0.0%) |
| Legal Services & Support | 6 (100.0%) | 0 (0.0%) |
| Education Instruction & Library | 0 (0.0%) | 0 (0.0%) |
| Arts, Media & Entertainment | 67 (100.0%) | 0 (0.0%) |
| Health Diagnosing & Treating | 49 (63.6%) | 28 (36.4%) |
| Health Technologists | 22 (44.0%) | 28 (56.0%) |
| Total (Category) | 161 (58.8%) | 113 (41.2%) |
| Total (Overall) | 720 (48.4%) | 766 (51.5%) |
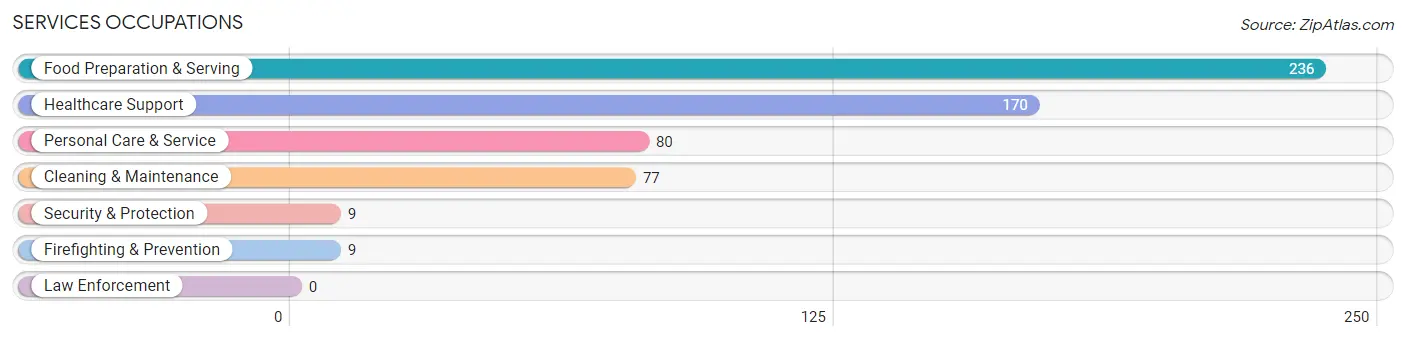
Services Occupations
The most common Services occupations in Myrtle Creek are Food Preparation & Serving (236 | 15.9%), Healthcare Support (170 | 11.4%), Personal Care & Service (80 | 5.4%), Cleaning & Maintenance (77 | 5.2%), and Security & Protection (9 | 0.6%).
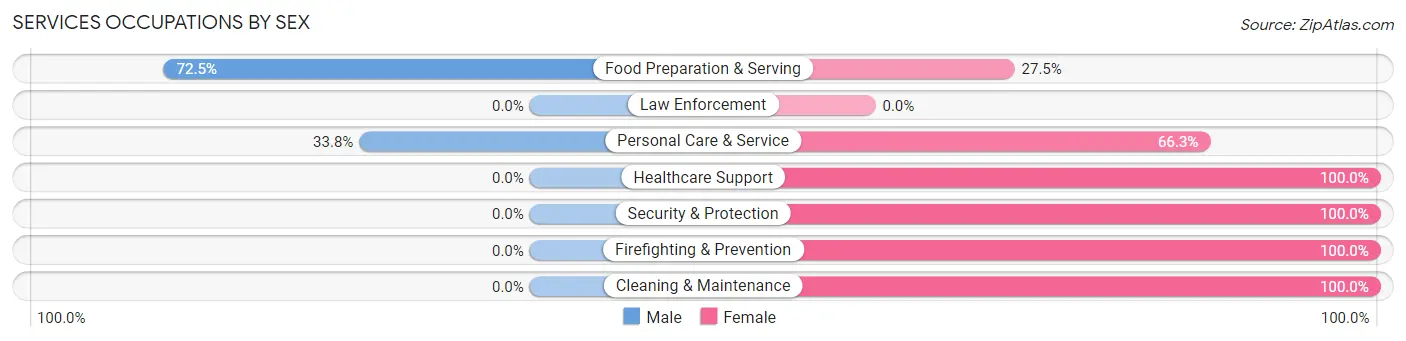
Services Occupations by Sex
Within the Services occupations in Myrtle Creek, the most male-oriented occupations are Food Preparation & Serving (72.5%), and Personal Care & Service (33.8%), while the most female-oriented occupations are Healthcare Support (100.0%), Security & Protection (100.0%), and Firefighting & Prevention (100.0%).
| Occupation | Male | Female |
| Healthcare Support | 0 (0.0%) | 170 (100.0%) |
| Security & Protection | 0 (0.0%) | 9 (100.0%) |
| Firefighting & Prevention | 0 (0.0%) | 9 (100.0%) |
| Law Enforcement | 0 (0.0%) | 0 (0.0%) |
| Food Preparation & Serving | 171 (72.5%) | 65 (27.5%) |
| Cleaning & Maintenance | 0 (0.0%) | 77 (100.0%) |
| Personal Care & Service | 27 (33.8%) | 53 (66.2%) |
| Total (Category) | 198 (34.6%) | 374 (65.4%) |
| Total (Overall) | 720 (48.4%) | 766 (51.5%) |
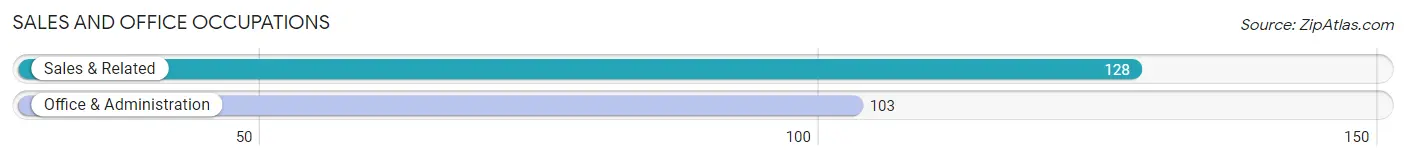
Sales and Office Occupations
The most common Sales and Office occupations in Myrtle Creek are Sales & Related (128 | 8.6%), and Office & Administration (103 | 6.9%).
Sales and Office Occupations by Sex
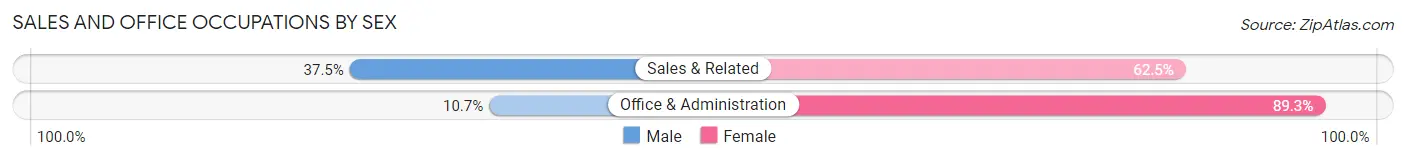
| Occupation | Male | Female |
| Sales & Related | 48 (37.5%) | 80 (62.5%) |
| Office & Administration | 11 (10.7%) | 92 (89.3%) |
| Total (Category) | 59 (25.5%) | 172 (74.5%) |
| Total (Overall) | 720 (48.4%) | 766 (51.5%) |
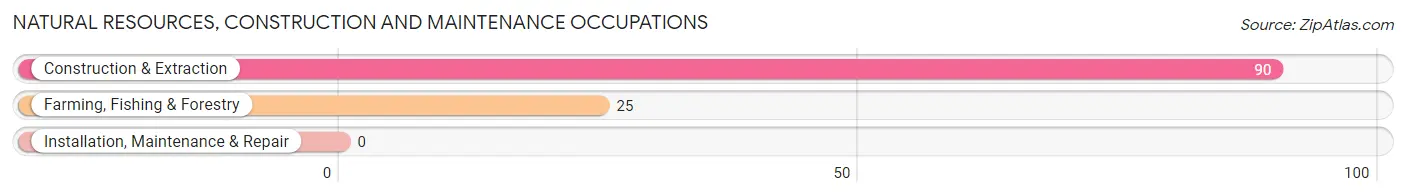
Natural Resources, Construction and Maintenance Occupations
The most common Natural Resources, Construction and Maintenance occupations in Myrtle Creek are Construction & Extraction (90 | 6.1%), and Farming, Fishing & Forestry (25 | 1.7%).
Natural Resources, Construction and Maintenance Occupations by Sex
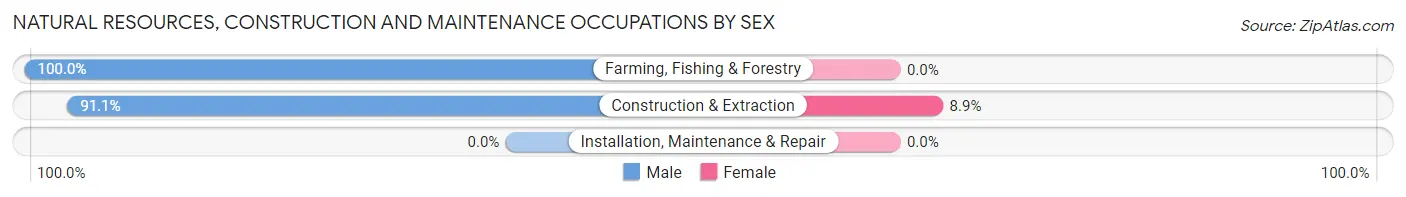
| Occupation | Male | Female |
| Farming, Fishing & Forestry | 25 (100.0%) | 0 (0.0%) |
| Construction & Extraction | 82 (91.1%) | 8 (8.9%) |
| Installation, Maintenance & Repair | 0 (0.0%) | 0 (0.0%) |
| Total (Category) | 107 (93.0%) | 8 (7.0%) |
| Total (Overall) | 720 (48.4%) | 766 (51.5%) |
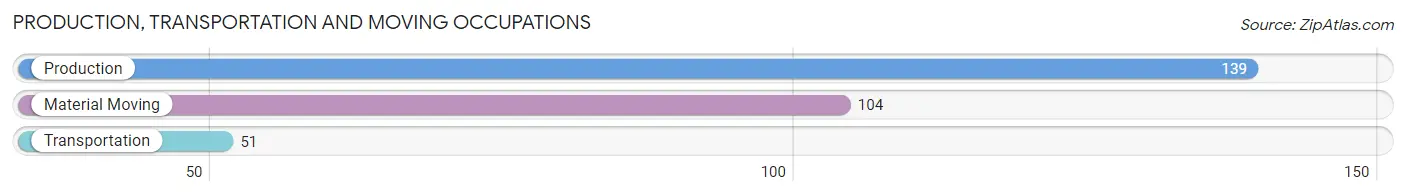
Production, Transportation and Moving Occupations
The most common Production, Transportation and Moving occupations in Myrtle Creek are Production (139 | 9.3%), Material Moving (104 | 7.0%), and Transportation (51 | 3.4%).
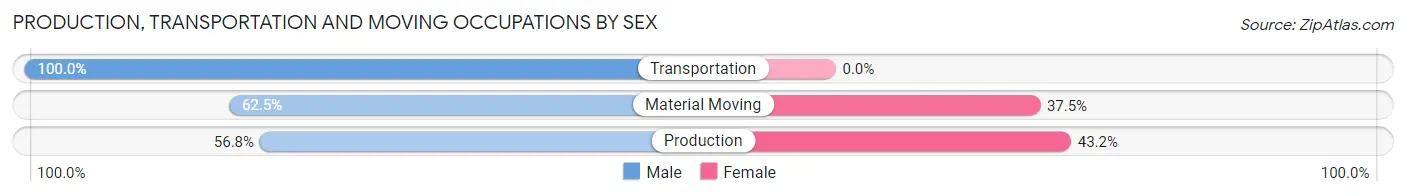
Production, Transportation and Moving Occupations by Sex
| Occupation | Male | Female |
| Production | 79 (56.8%) | 60 (43.2%) |
| Transportation | 51 (100.0%) | 0 (0.0%) |
| Material Moving | 65 (62.5%) | 39 (37.5%) |
| Total (Category) | 195 (66.3%) | 99 (33.7%) |
| Total (Overall) | 720 (48.4%) | 766 (51.5%) |
Employment Industries by Sex in Myrtle Creek
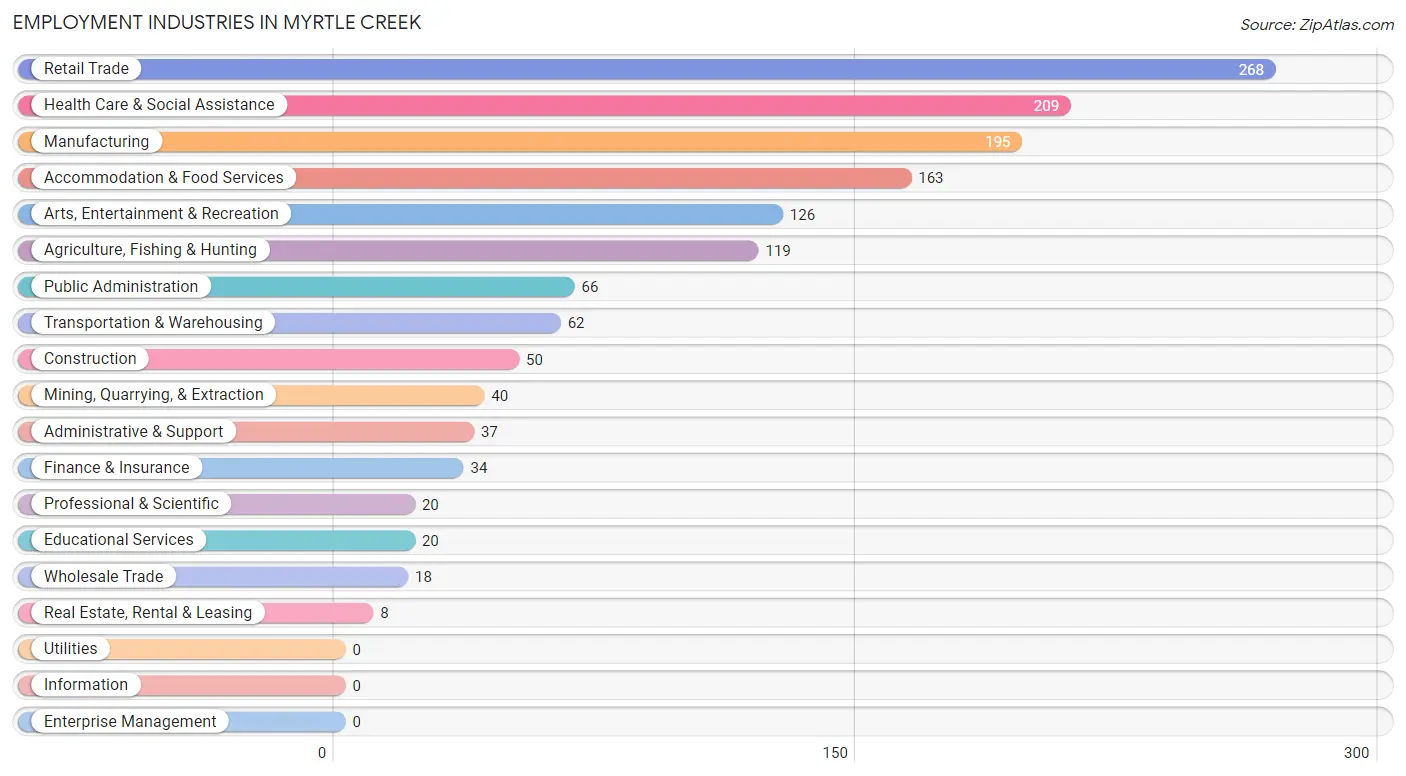
Employment Industries in Myrtle Creek
The major employment industries in Myrtle Creek include Retail Trade (268 | 18.0%), Health Care & Social Assistance (209 | 14.1%), Manufacturing (195 | 13.1%), Accommodation & Food Services (163 | 11.0%), and Arts, Entertainment & Recreation (126 | 8.5%).
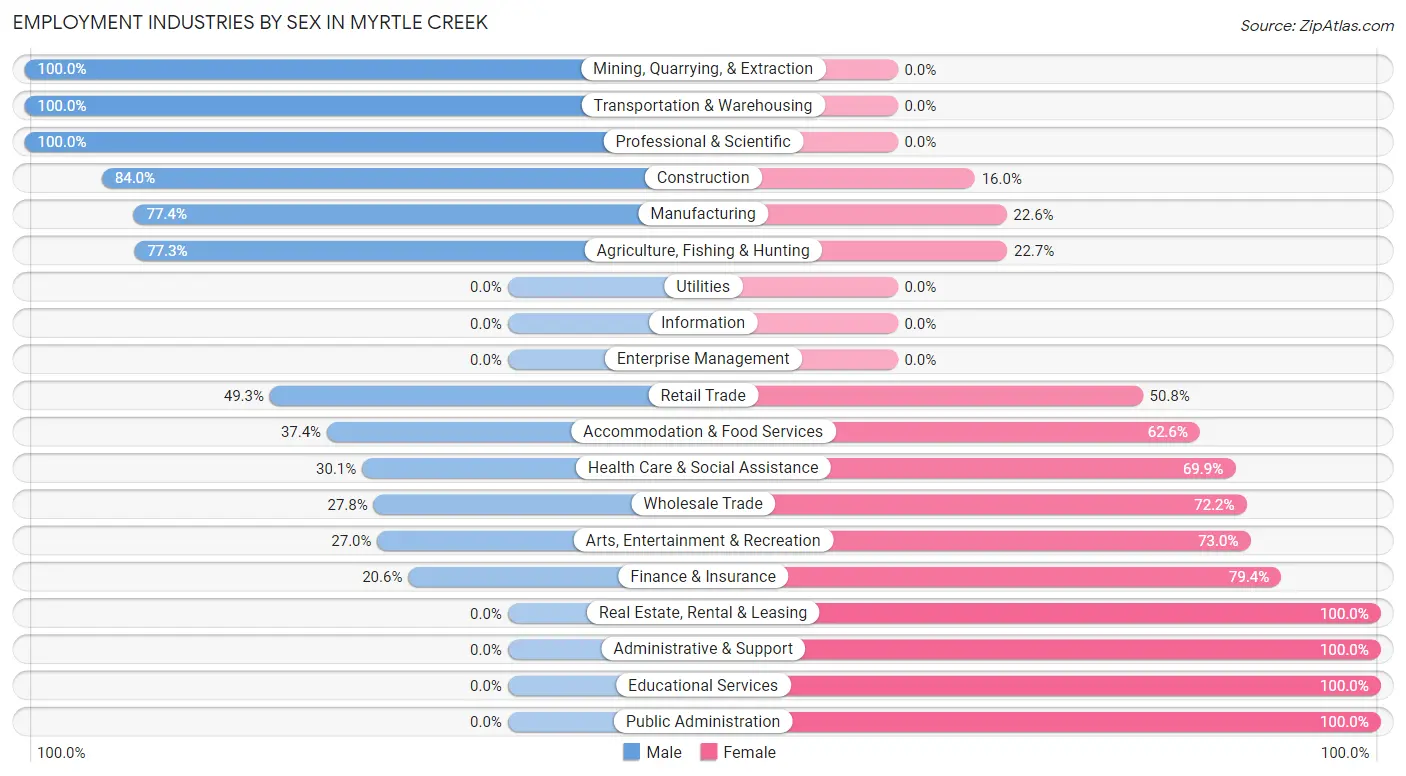
Employment Industries by Sex in Myrtle Creek
The Myrtle Creek industries that see more men than women are Mining, Quarrying, & Extraction (100.0%), Transportation & Warehousing (100.0%), and Professional & Scientific (100.0%), whereas the industries that tend to have a higher number of women are Real Estate, Rental & Leasing (100.0%), Administrative & Support (100.0%), and Educational Services (100.0%).
| Industry | Male | Female |
| Agriculture, Fishing & Hunting | 92 (77.3%) | 27 (22.7%) |
| Mining, Quarrying, & Extraction | 40 (100.0%) | 0 (0.0%) |
| Construction | 42 (84.0%) | 8 (16.0%) |
| Manufacturing | 151 (77.4%) | 44 (22.6%) |
| Wholesale Trade | 5 (27.8%) | 13 (72.2%) |
| Retail Trade | 132 (49.2%) | 136 (50.7%) |
| Transportation & Warehousing | 62 (100.0%) | 0 (0.0%) |
| Utilities | 0 (0.0%) | 0 (0.0%) |
| Information | 0 (0.0%) | 0 (0.0%) |
| Finance & Insurance | 7 (20.6%) | 27 (79.4%) |
| Real Estate, Rental & Leasing | 0 (0.0%) | 8 (100.0%) |
| Professional & Scientific | 20 (100.0%) | 0 (0.0%) |
| Enterprise Management | 0 (0.0%) | 0 (0.0%) |
| Administrative & Support | 0 (0.0%) | 37 (100.0%) |
| Educational Services | 0 (0.0%) | 20 (100.0%) |
| Health Care & Social Assistance | 63 (30.1%) | 146 (69.9%) |
| Arts, Entertainment & Recreation | 34 (27.0%) | 92 (73.0%) |
| Accommodation & Food Services | 61 (37.4%) | 102 (62.6%) |
| Public Administration | 0 (0.0%) | 66 (100.0%) |
| Total | 720 (48.4%) | 766 (51.5%) |
Education in Myrtle Creek
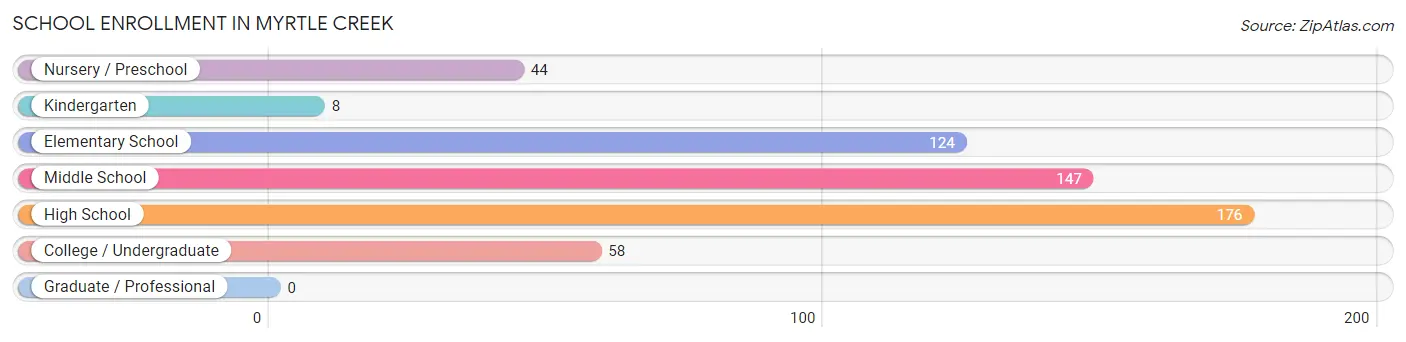
School Enrollment in Myrtle Creek
The most common levels of schooling among the 557 students in Myrtle Creek are high school (176 | 31.6%), middle school (147 | 26.4%), and elementary school (124 | 22.3%).
| School Level | # Students | % Students |
| Nursery / Preschool | 44 | 7.9% |
| Kindergarten | 8 | 1.4% |
| Elementary School | 124 | 22.3% |
| Middle School | 147 | 26.4% |
| High School | 176 | 31.6% |
| College / Undergraduate | 58 | 10.4% |
| Graduate / Professional | 0 | 0.0% |
| Total | 557 | 100.0% |
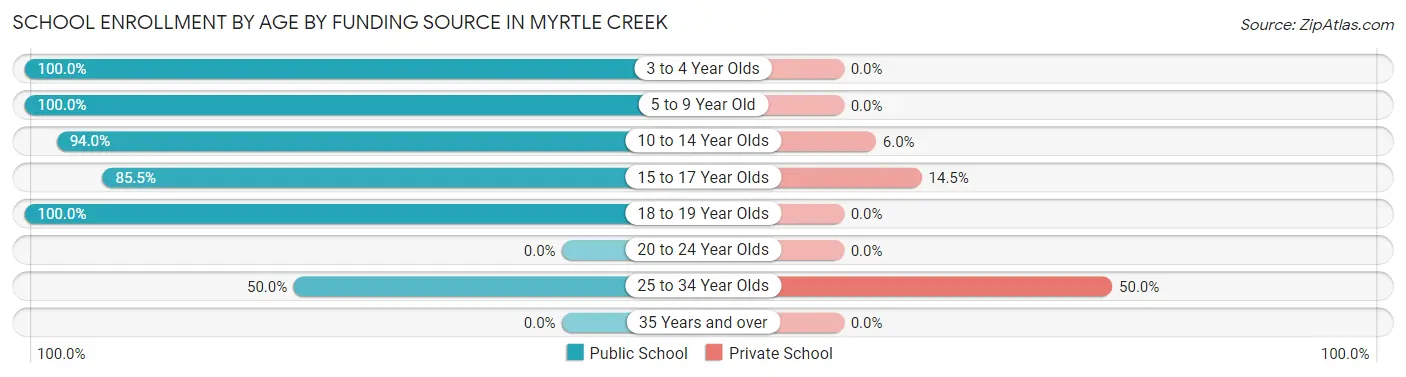
School Enrollment by Age by Funding Source in Myrtle Creek
Out of a total of 557 students who are enrolled in schools in Myrtle Creek, 57 (10.2%) attend a private institution, while the remaining 500 (89.8%) are enrolled in public schools. The age group of 25 to 34 year olds has the highest likelihood of being enrolled in private schools, with 29 (50.0% in the age bracket) enrolled. Conversely, the age group of 3 to 4 year olds has the lowest likelihood of being enrolled in a private school, with 44 (100.0% in the age bracket) attending a public institution.
| Age Bracket | Public School | Private School |
| 3 to 4 Year Olds | 44 (100.0%) | 0 (0.0%) |
| 5 to 9 Year Old | 132 (100.0%) | 0 (0.0%) |
| 10 to 14 Year Olds | 157 (94.0%) | 10 (6.0%) |
| 15 to 17 Year Olds | 106 (85.5%) | 18 (14.5%) |
| 18 to 19 Year Olds | 32 (100.0%) | 0 (0.0%) |
| 20 to 24 Year Olds | 0 (0.0%) | 0 (0.0%) |
| 25 to 34 Year Olds | 29 (50.0%) | 29 (50.0%) |
| 35 Years and over | 0 (0.0%) | 0 (0.0%) |
| Total | 500 (89.8%) | 57 (10.2%) |
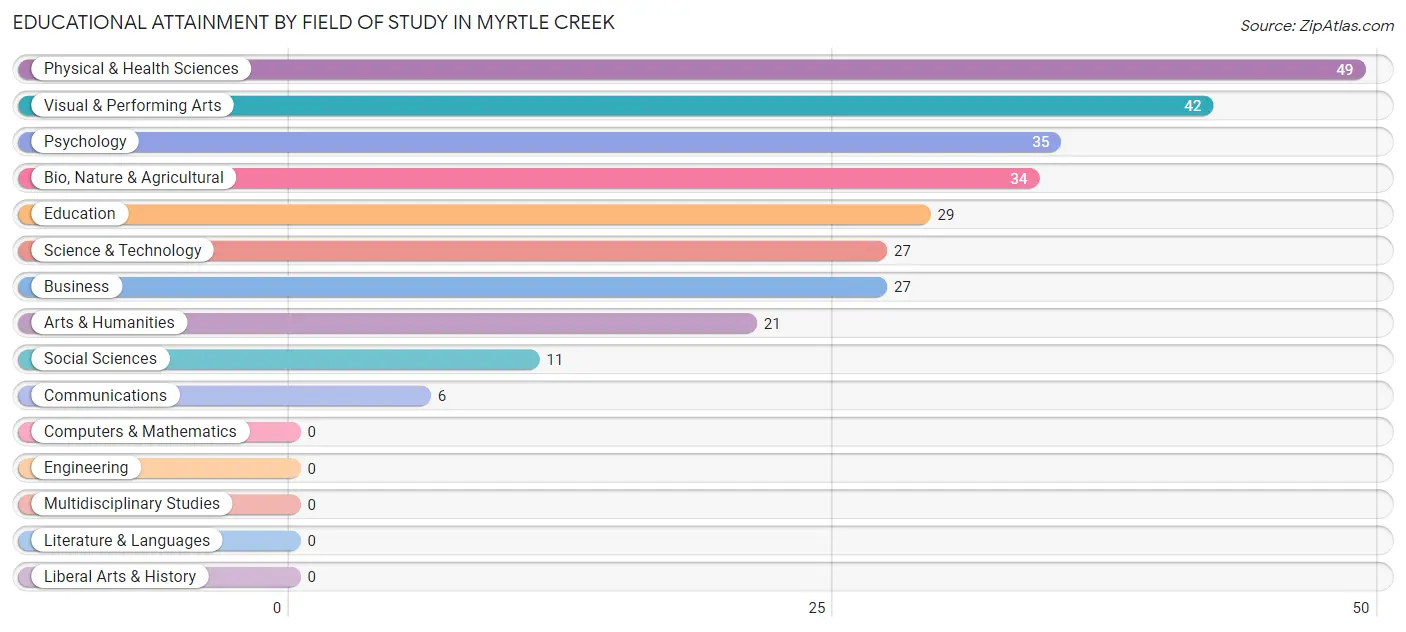
Educational Attainment by Field of Study in Myrtle Creek
Physical & health sciences (49 | 17.4%), visual & performing arts (42 | 14.9%), psychology (35 | 12.5%), bio, nature & agricultural (34 | 12.1%), and education (29 | 10.3%) are the most common fields of study among 281 individuals in Myrtle Creek who have obtained a bachelor's degree or higher.
| Field of Study | # Graduates | % Graduates |
| Computers & Mathematics | 0 | 0.0% |
| Bio, Nature & Agricultural | 34 | 12.1% |
| Physical & Health Sciences | 49 | 17.4% |
| Psychology | 35 | 12.5% |
| Social Sciences | 11 | 3.9% |
| Engineering | 0 | 0.0% |
| Multidisciplinary Studies | 0 | 0.0% |
| Science & Technology | 27 | 9.6% |
| Business | 27 | 9.6% |
| Education | 29 | 10.3% |
| Literature & Languages | 0 | 0.0% |
| Liberal Arts & History | 0 | 0.0% |
| Visual & Performing Arts | 42 | 14.9% |
| Communications | 6 | 2.1% |
| Arts & Humanities | 21 | 7.5% |
| Total | 281 | 100.0% |
Transportation & Commute in Myrtle Creek
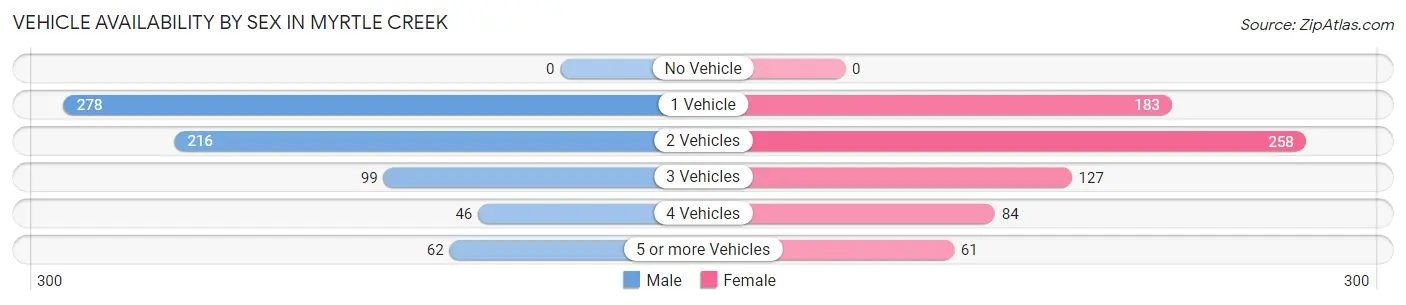
Vehicle Availability by Sex in Myrtle Creek
The most prevalent vehicle ownership categories in Myrtle Creek are males with 1 vehicle (278, accounting for 39.7%) and females with 1 vehicle (183, making up 39.0%).
| Vehicles Available | Male | Female |
| No Vehicle | 0 (0.0%) | 0 (0.0%) |
| 1 Vehicle | 278 (39.7%) | 183 (25.7%) |
| 2 Vehicles | 216 (30.8%) | 258 (36.2%) |
| 3 Vehicles | 99 (14.1%) | 127 (17.8%) |
| 4 Vehicles | 46 (6.6%) | 84 (11.8%) |
| 5 or more Vehicles | 62 (8.8%) | 61 (8.6%) |
| Total | 701 (100.0%) | 713 (100.0%) |
Commute Time in Myrtle Creek
The most frequently occuring commute durations in Myrtle Creek are 10 to 14 minutes (277 commuters, 20.5%), 20 to 24 minutes (274 commuters, 20.3%), and 30 to 34 minutes (243 commuters, 18.0%).
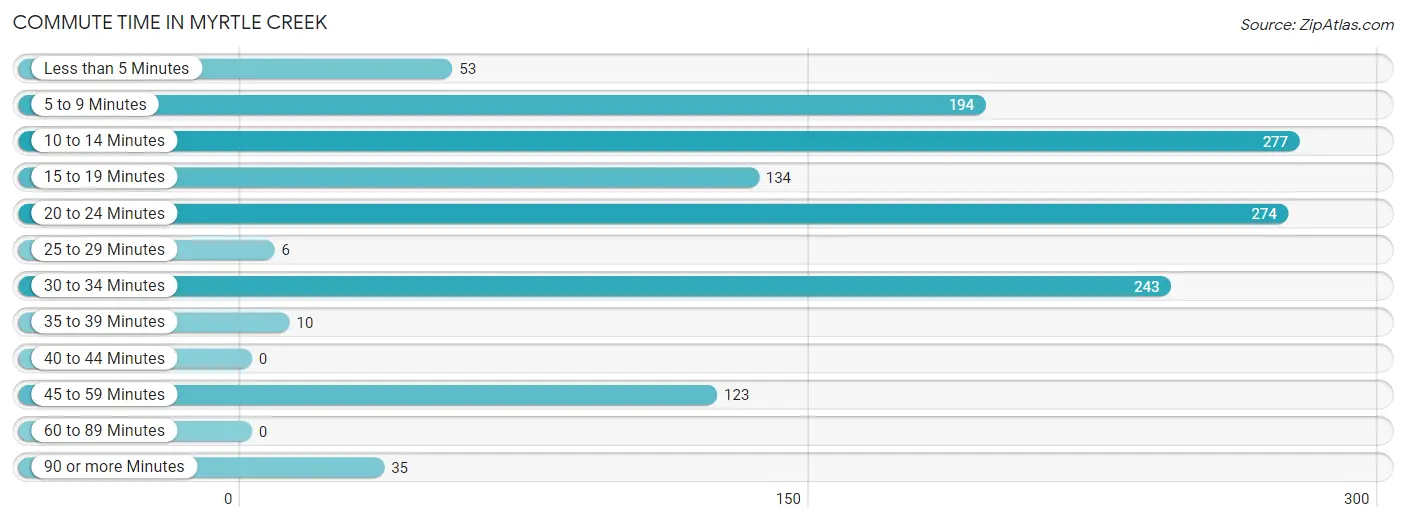
| Commute Time | # Commuters | % Commuters |
| Less than 5 Minutes | 53 | 3.9% |
| 5 to 9 Minutes | 194 | 14.4% |
| 10 to 14 Minutes | 277 | 20.5% |
| 15 to 19 Minutes | 134 | 9.9% |
| 20 to 24 Minutes | 274 | 20.3% |
| 25 to 29 Minutes | 6 | 0.4% |
| 30 to 34 Minutes | 243 | 18.0% |
| 35 to 39 Minutes | 10 | 0.7% |
| 40 to 44 Minutes | 0 | 0.0% |
| 45 to 59 Minutes | 123 | 9.1% |
| 60 to 89 Minutes | 0 | 0.0% |
| 90 or more Minutes | 35 | 2.6% |
Commute Time by Sex in Myrtle Creek
The most common commute times in Myrtle Creek are 10 to 14 minutes (258 commuters, 36.7%) for males and 30 to 34 minutes (181 commuters, 28.0%) for females.
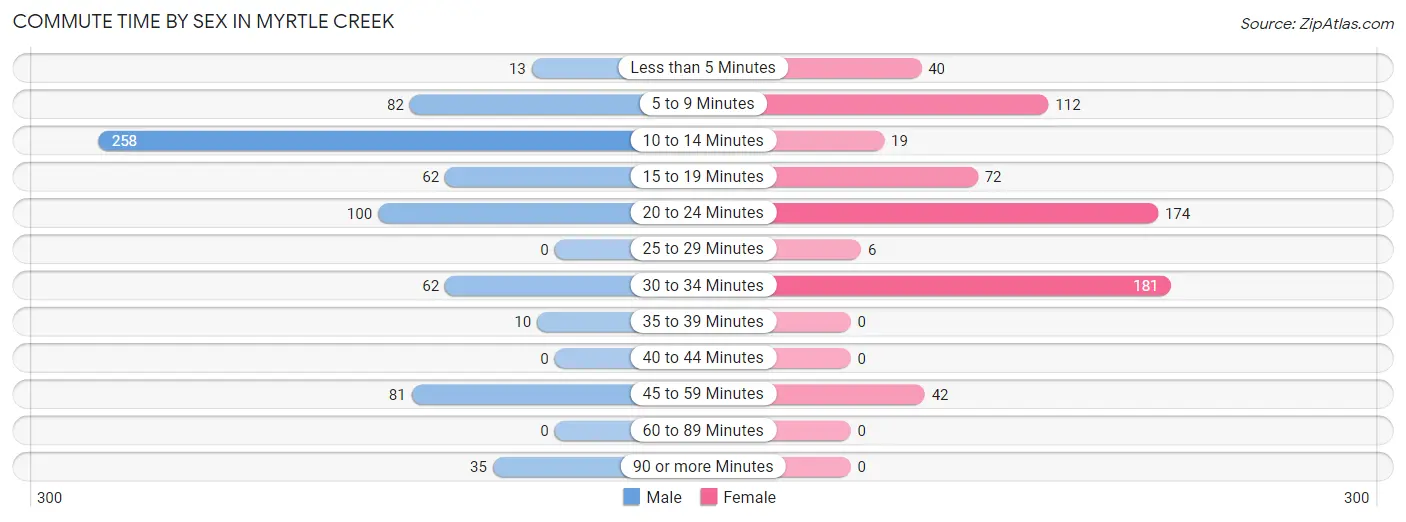
| Commute Time | Male | Female |
| Less than 5 Minutes | 13 (1.8%) | 40 (6.2%) |
| 5 to 9 Minutes | 82 (11.7%) | 112 (17.3%) |
| 10 to 14 Minutes | 258 (36.7%) | 19 (2.9%) |
| 15 to 19 Minutes | 62 (8.8%) | 72 (11.2%) |
| 20 to 24 Minutes | 100 (14.2%) | 174 (26.9%) |
| 25 to 29 Minutes | 0 (0.0%) | 6 (0.9%) |
| 30 to 34 Minutes | 62 (8.8%) | 181 (28.0%) |
| 35 to 39 Minutes | 10 (1.4%) | 0 (0.0%) |
| 40 to 44 Minutes | 0 (0.0%) | 0 (0.0%) |
| 45 to 59 Minutes | 81 (11.5%) | 42 (6.5%) |
| 60 to 89 Minutes | 0 (0.0%) | 0 (0.0%) |
| 90 or more Minutes | 35 (5.0%) | 0 (0.0%) |
Time of Departure to Work by Sex in Myrtle Creek
The most frequent times of departure to work in Myrtle Creek are 12:00 PM to 3:59 PM (165, 23.5%) for males and 7:30 AM to 7:59 AM (112, 17.3%) for females.
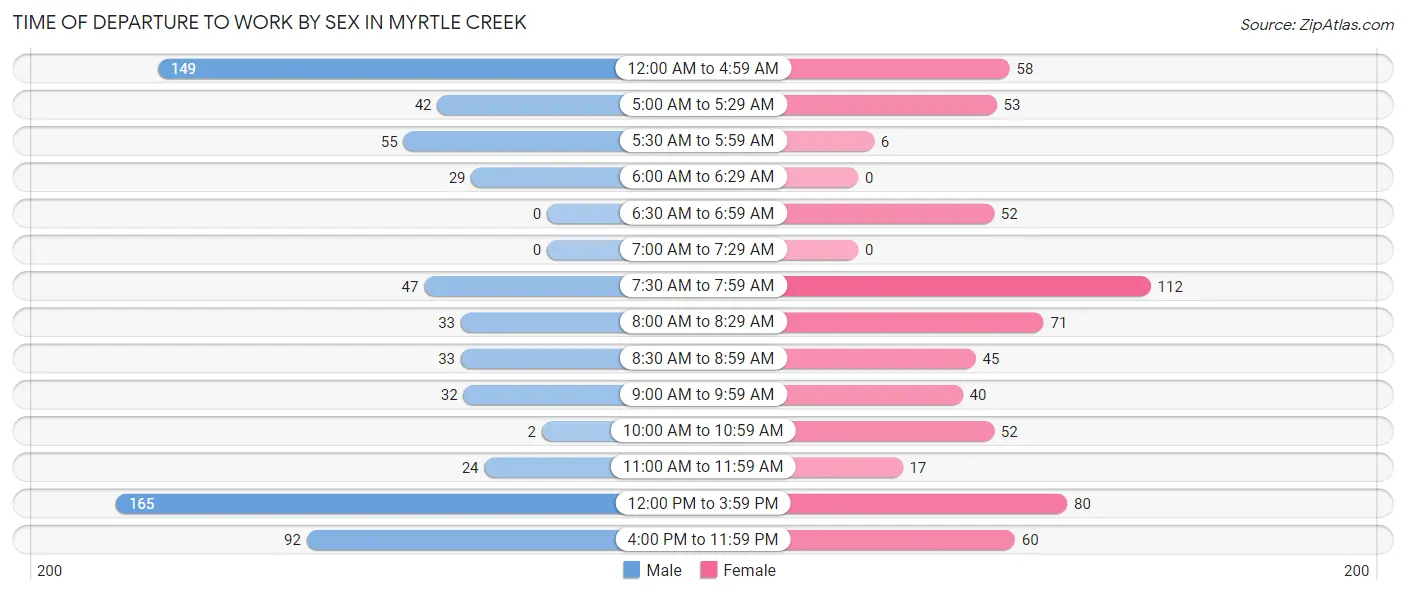
| Time of Departure | Male | Female |
| 12:00 AM to 4:59 AM | 149 (21.2%) | 58 (9.0%) |
| 5:00 AM to 5:29 AM | 42 (6.0%) | 53 (8.2%) |
| 5:30 AM to 5:59 AM | 55 (7.8%) | 6 (0.9%) |
| 6:00 AM to 6:29 AM | 29 (4.1%) | 0 (0.0%) |
| 6:30 AM to 6:59 AM | 0 (0.0%) | 52 (8.1%) |
| 7:00 AM to 7:29 AM | 0 (0.0%) | 0 (0.0%) |
| 7:30 AM to 7:59 AM | 47 (6.7%) | 112 (17.3%) |
| 8:00 AM to 8:29 AM | 33 (4.7%) | 71 (11.0%) |
| 8:30 AM to 8:59 AM | 33 (4.7%) | 45 (7.0%) |
| 9:00 AM to 9:59 AM | 32 (4.5%) | 40 (6.2%) |
| 10:00 AM to 10:59 AM | 2 (0.3%) | 52 (8.1%) |
| 11:00 AM to 11:59 AM | 24 (3.4%) | 17 (2.6%) |
| 12:00 PM to 3:59 PM | 165 (23.5%) | 80 (12.4%) |
| 4:00 PM to 11:59 PM | 92 (13.1%) | 60 (9.3%) |
| Total | 703 (100.0%) | 646 (100.0%) |
Housing Occupancy in Myrtle Creek
Occupancy by Ownership in Myrtle Creek
Of the total 1,348 dwellings in Myrtle Creek, owner-occupied units account for 752 (55.8%), while renter-occupied units make up 596 (44.2%).
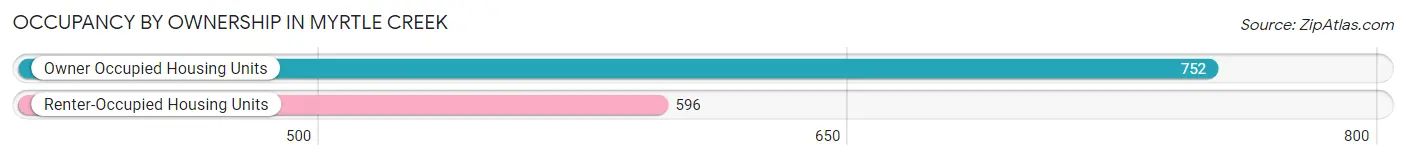
| Occupancy | # Housing Units | % Housing Units |
| Owner Occupied Housing Units | 752 | 55.8% |
| Renter-Occupied Housing Units | 596 | 44.2% |
| Total Occupied Housing Units | 1,348 | 100.0% |
Occupancy by Household Size in Myrtle Creek
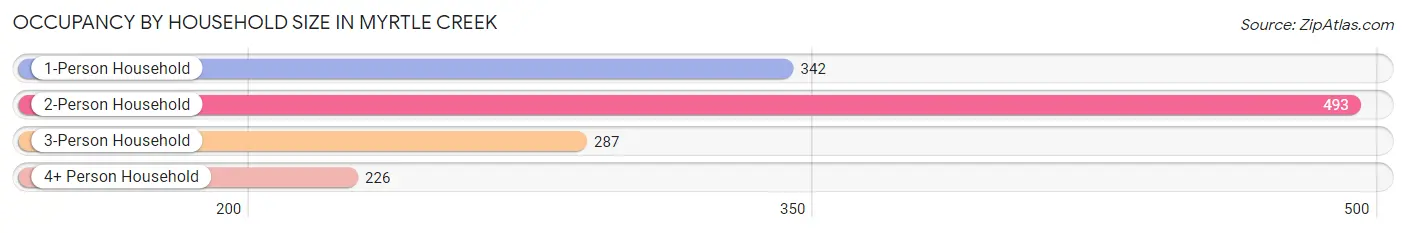
| Household Size | # Housing Units | % Housing Units |
| 1-Person Household | 342 | 25.4% |
| 2-Person Household | 493 | 36.6% |
| 3-Person Household | 287 | 21.3% |
| 4+ Person Household | 226 | 16.8% |
| Total Housing Units | 1,348 | 100.0% |
Occupancy by Ownership by Household Size in Myrtle Creek
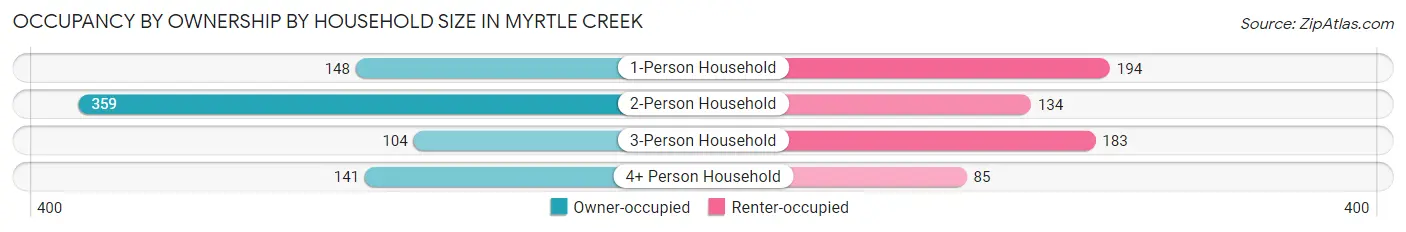
| Household Size | Owner-occupied | Renter-occupied |
| 1-Person Household | 148 (43.3%) | 194 (56.7%) |
| 2-Person Household | 359 (72.8%) | 134 (27.2%) |
| 3-Person Household | 104 (36.2%) | 183 (63.8%) |
| 4+ Person Household | 141 (62.4%) | 85 (37.6%) |
| Total Housing Units | 752 (55.8%) | 596 (44.2%) |
Occupancy by Educational Attainment in Myrtle Creek
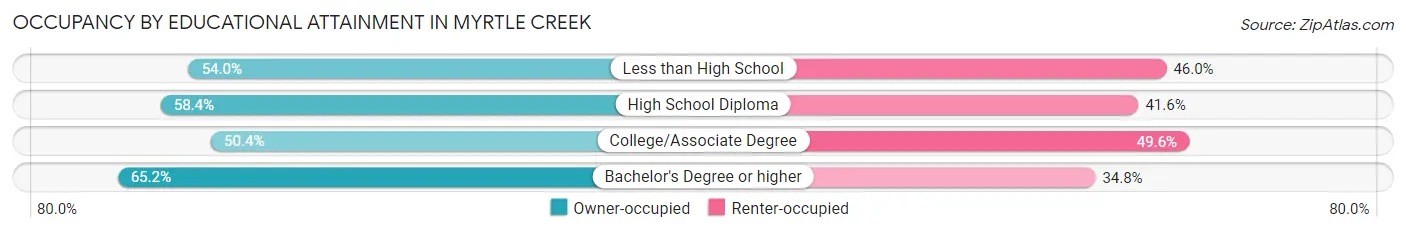
| Household Size | Owner-occupied | Renter-occupied |
| Less than High School | 75 (54.0%) | 64 (46.0%) |
| High School Diploma | 320 (58.4%) | 228 (41.6%) |
| College/Associate Degree | 252 (50.4%) | 248 (49.6%) |
| Bachelor's Degree or higher | 105 (65.2%) | 56 (34.8%) |
Occupancy by Age of Householder in Myrtle Creek
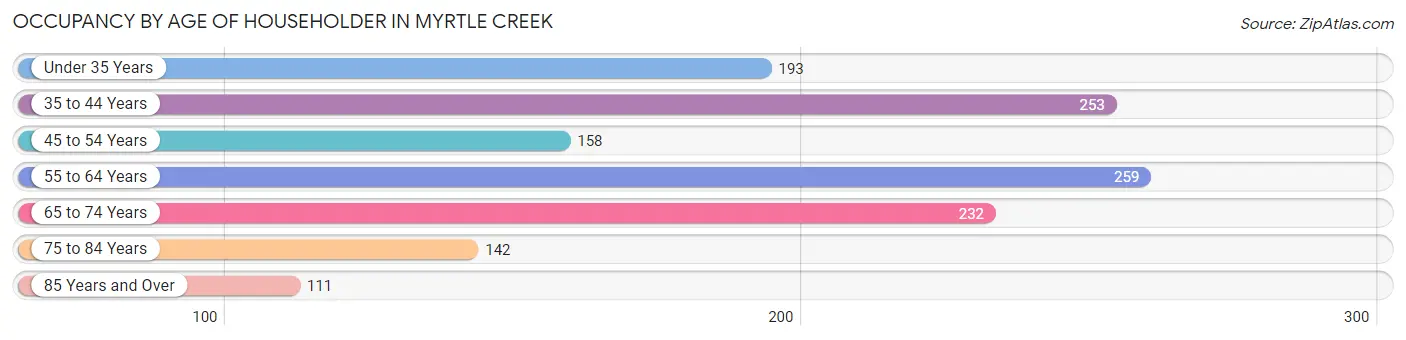
| Age Bracket | # Households | % Households |
| Under 35 Years | 193 | 14.3% |
| 35 to 44 Years | 253 | 18.8% |
| 45 to 54 Years | 158 | 11.7% |
| 55 to 64 Years | 259 | 19.2% |
| 65 to 74 Years | 232 | 17.2% |
| 75 to 84 Years | 142 | 10.5% |
| 85 Years and Over | 111 | 8.2% |
| Total | 1,348 | 100.0% |
Housing Finances in Myrtle Creek
Median Income by Occupancy in Myrtle Creek
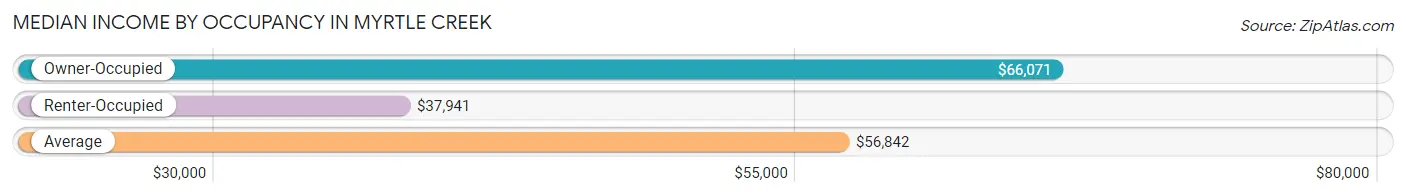
| Occupancy Type | # Households | Median Income |
| Owner-Occupied | 752 (55.8%) | $66,071 |
| Renter-Occupied | 596 (44.2%) | $37,941 |
| Average | 1,348 (100.0%) | $56,842 |
Occupancy by Householder Income Bracket in Myrtle Creek
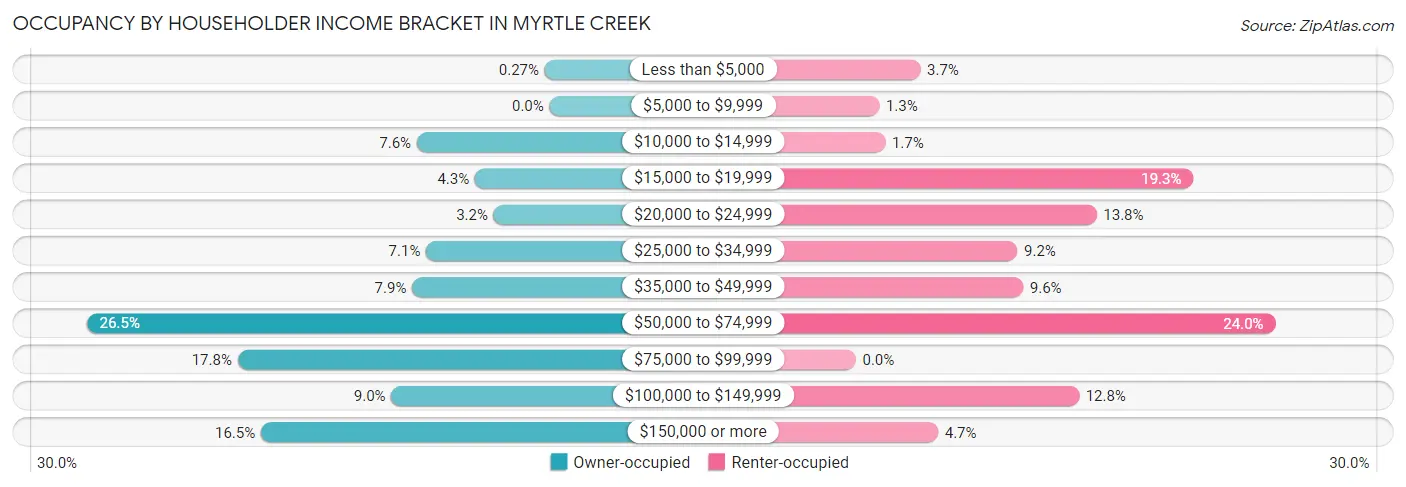
| Income Bracket | Owner-occupied | Renter-occupied |
| Less than $5,000 | 2 (0.3%) | 22 (3.7%) |
| $5,000 to $9,999 | 0 (0.0%) | 8 (1.3%) |
| $10,000 to $14,999 | 57 (7.6%) | 10 (1.7%) |
| $15,000 to $19,999 | 32 (4.3%) | 115 (19.3%) |
| $20,000 to $24,999 | 24 (3.2%) | 82 (13.8%) |
| $25,000 to $34,999 | 53 (7.0%) | 55 (9.2%) |
| $35,000 to $49,999 | 59 (7.9%) | 57 (9.6%) |
| $50,000 to $74,999 | 199 (26.5%) | 143 (24.0%) |
| $75,000 to $99,999 | 134 (17.8%) | 0 (0.0%) |
| $100,000 to $149,999 | 68 (9.0%) | 76 (12.8%) |
| $150,000 or more | 124 (16.5%) | 28 (4.7%) |
| Total | 752 (100.0%) | 596 (100.0%) |
Monthly Housing Cost Tiers in Myrtle Creek
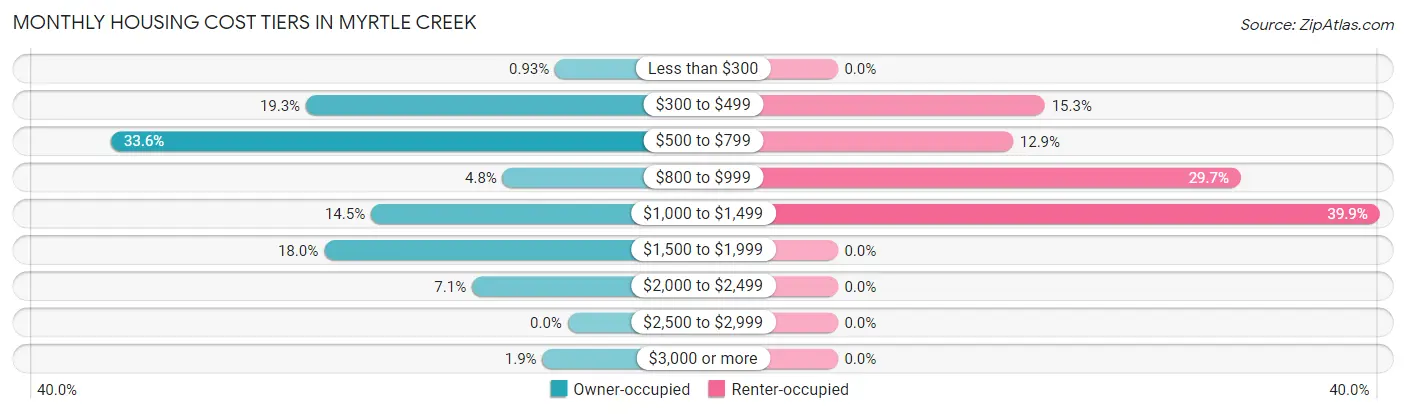
| Monthly Cost | Owner-occupied | Renter-occupied |
| Less than $300 | 7 (0.9%) | 0 (0.0%) |
| $300 to $499 | 145 (19.3%) | 91 (15.3%) |
| $500 to $799 | 253 (33.6%) | 77 (12.9%) |
| $800 to $999 | 36 (4.8%) | 177 (29.7%) |
| $1,000 to $1,499 | 109 (14.5%) | 238 (39.9%) |
| $1,500 to $1,999 | 135 (17.9%) | 0 (0.0%) |
| $2,000 to $2,499 | 53 (7.0%) | 0 (0.0%) |
| $2,500 to $2,999 | 0 (0.0%) | 0 (0.0%) |
| $3,000 or more | 14 (1.9%) | 0 (0.0%) |
| Total | 752 (100.0%) | 596 (100.0%) |
Physical Housing Characteristics in Myrtle Creek
Housing Structures in Myrtle Creek
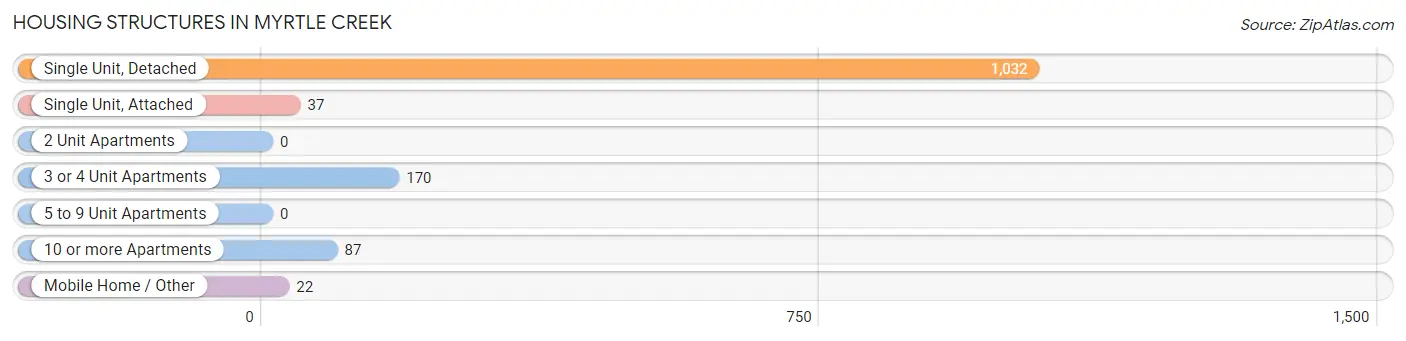
| Structure Type | # Housing Units | % Housing Units |
| Single Unit, Detached | 1,032 | 76.6% |
| Single Unit, Attached | 37 | 2.7% |
| 2 Unit Apartments | 0 | 0.0% |
| 3 or 4 Unit Apartments | 170 | 12.6% |
| 5 to 9 Unit Apartments | 0 | 0.0% |
| 10 or more Apartments | 87 | 6.5% |
| Mobile Home / Other | 22 | 1.6% |
| Total | 1,348 | 100.0% |
Housing Structures by Occupancy in Myrtle Creek
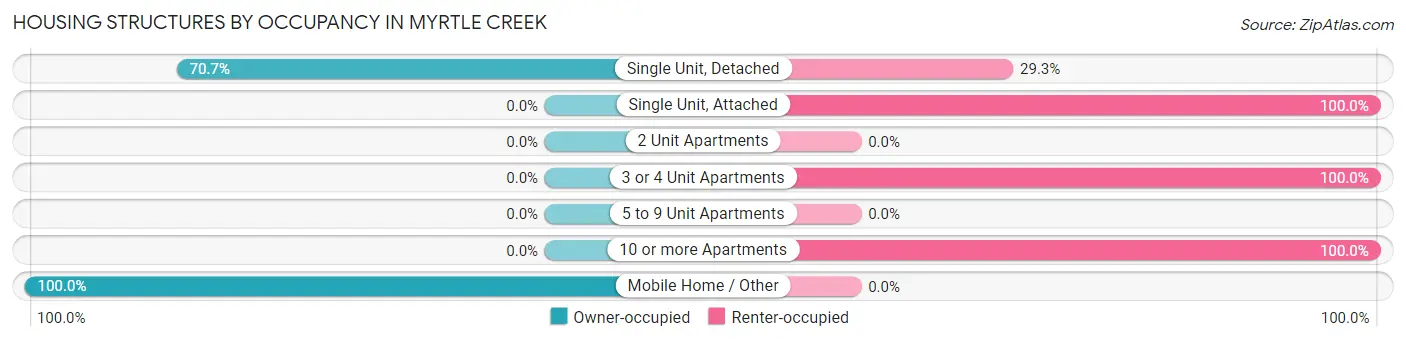
| Structure Type | Owner-occupied | Renter-occupied |
| Single Unit, Detached | 730 (70.7%) | 302 (29.3%) |
| Single Unit, Attached | 0 (0.0%) | 37 (100.0%) |
| 2 Unit Apartments | 0 (0.0%) | 0 (0.0%) |
| 3 or 4 Unit Apartments | 0 (0.0%) | 170 (100.0%) |
| 5 to 9 Unit Apartments | 0 (0.0%) | 0 (0.0%) |
| 10 or more Apartments | 0 (0.0%) | 87 (100.0%) |
| Mobile Home / Other | 22 (100.0%) | 0 (0.0%) |
| Total | 752 (55.8%) | 596 (44.2%) |
Housing Structures by Number of Rooms in Myrtle Creek
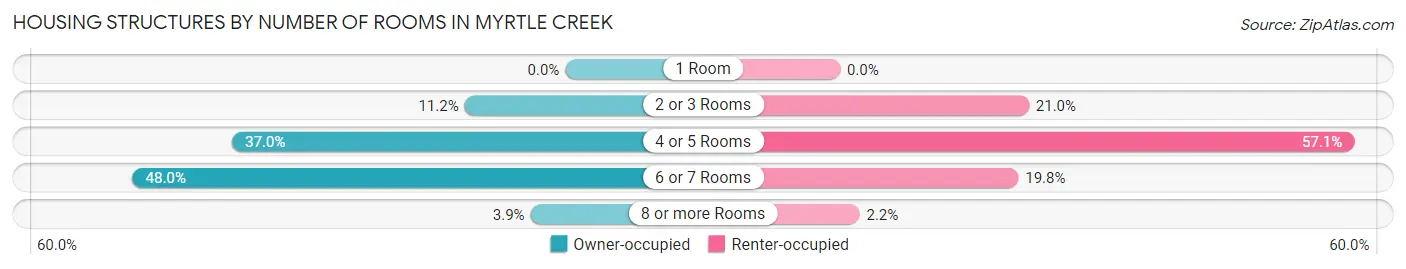
| Number of Rooms | Owner-occupied | Renter-occupied |
| 1 Room | 0 (0.0%) | 0 (0.0%) |
| 2 or 3 Rooms | 84 (11.2%) | 125 (21.0%) |
| 4 or 5 Rooms | 278 (37.0%) | 340 (57.1%) |
| 6 or 7 Rooms | 361 (48.0%) | 118 (19.8%) |
| 8 or more Rooms | 29 (3.9%) | 13 (2.2%) |
| Total | 752 (100.0%) | 596 (100.0%) |
Housing Structure by Heating Type in Myrtle Creek
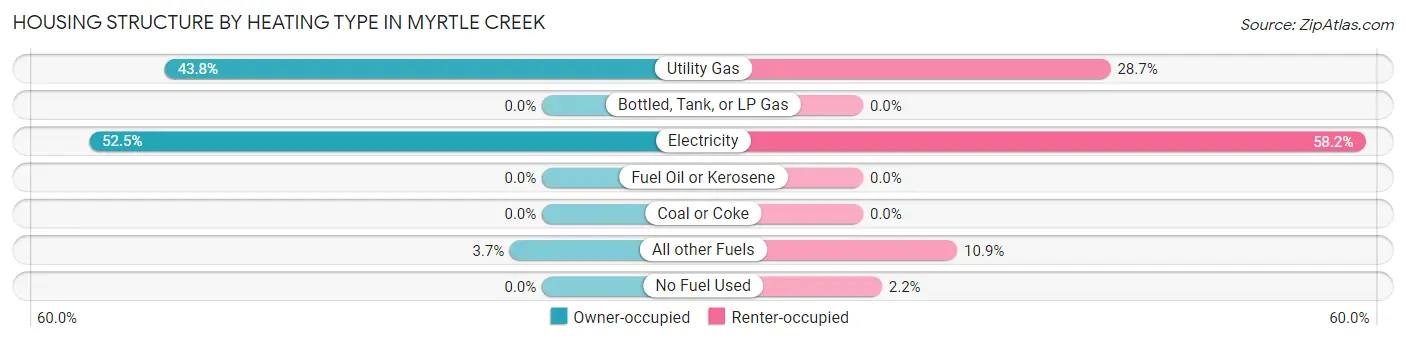
| Heating Type | Owner-occupied | Renter-occupied |
| Utility Gas | 329 (43.8%) | 171 (28.7%) |
| Bottled, Tank, or LP Gas | 0 (0.0%) | 0 (0.0%) |
| Electricity | 395 (52.5%) | 347 (58.2%) |
| Fuel Oil or Kerosene | 0 (0.0%) | 0 (0.0%) |
| Coal or Coke | 0 (0.0%) | 0 (0.0%) |
| All other Fuels | 28 (3.7%) | 65 (10.9%) |
| No Fuel Used | 0 (0.0%) | 13 (2.2%) |
| Total | 752 (100.0%) | 596 (100.0%) |
Household Vehicle Usage in Myrtle Creek
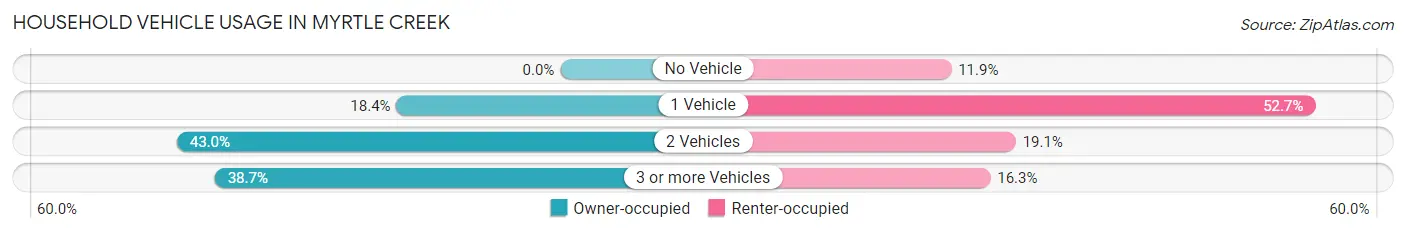
| Vehicles per Household | Owner-occupied | Renter-occupied |
| No Vehicle | 0 (0.0%) | 71 (11.9%) |
| 1 Vehicle | 138 (18.3%) | 314 (52.7%) |
| 2 Vehicles | 323 (42.9%) | 114 (19.1%) |
| 3 or more Vehicles | 291 (38.7%) | 97 (16.3%) |
| Total | 752 (100.0%) | 596 (100.0%) |
Real Estate & Mortgages in Myrtle Creek
Real Estate and Mortgage Overview in Myrtle Creek
| Characteristic | Without Mortgage | With Mortgage |
| Housing Units | 261 | 491 |
| Median Property Value | $195,800 | $215,600 |
| Median Household Income | $59,159 | $88 |
| Monthly Housing Costs | $531 | $14 |
| Real Estate Taxes | $1,928 | $7 |
Property Value by Mortgage Status in Myrtle Creek
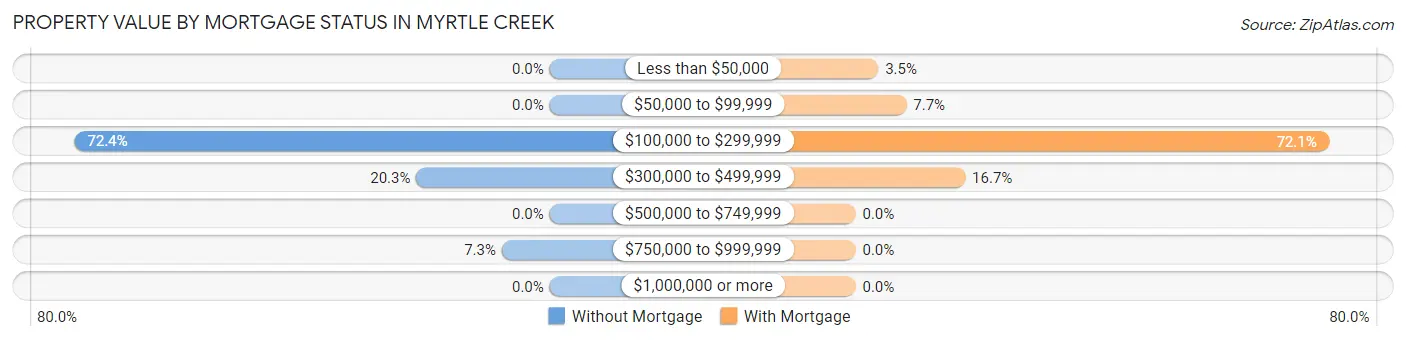
| Property Value | Without Mortgage | With Mortgage |
| Less than $50,000 | 0 (0.0%) | 17 (3.5%) |
| $50,000 to $99,999 | 0 (0.0%) | 38 (7.7%) |
| $100,000 to $299,999 | 189 (72.4%) | 354 (72.1%) |
| $300,000 to $499,999 | 53 (20.3%) | 82 (16.7%) |
| $500,000 to $749,999 | 0 (0.0%) | 0 (0.0%) |
| $750,000 to $999,999 | 19 (7.3%) | 0 (0.0%) |
| $1,000,000 or more | 0 (0.0%) | 0 (0.0%) |
| Total | 261 (100.0%) | 491 (100.0%) |
Household Income by Mortgage Status in Myrtle Creek
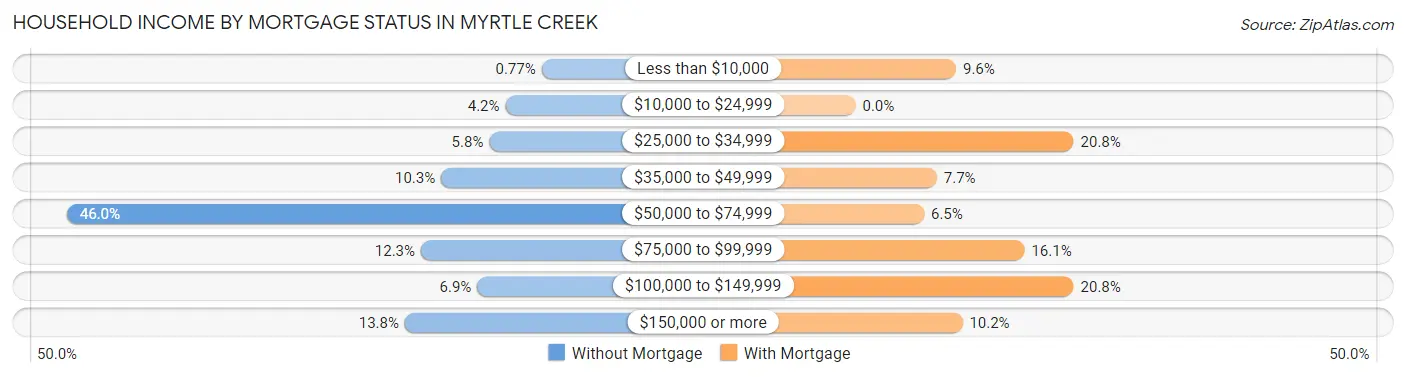
| Household Income | Without Mortgage | With Mortgage |
| Less than $10,000 | 2 (0.8%) | 47 (9.6%) |
| $10,000 to $24,999 | 11 (4.2%) | 0 (0.0%) |
| $25,000 to $34,999 | 15 (5.8%) | 102 (20.8%) |
| $35,000 to $49,999 | 27 (10.3%) | 38 (7.7%) |
| $50,000 to $74,999 | 120 (46.0%) | 32 (6.5%) |
| $75,000 to $99,999 | 32 (12.3%) | 79 (16.1%) |
| $100,000 to $149,999 | 18 (6.9%) | 102 (20.8%) |
| $150,000 or more | 36 (13.8%) | 50 (10.2%) |
| Total | 261 (100.0%) | 491 (100.0%) |
Property Value to Household Income Ratio in Myrtle Creek
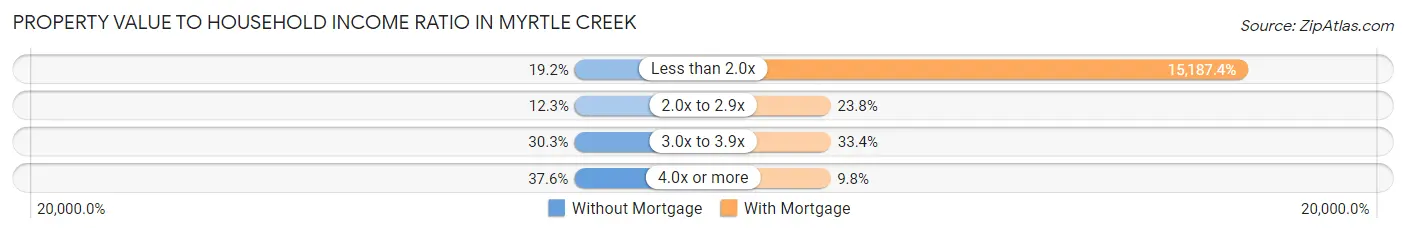
| Value-to-Income Ratio | Without Mortgage | With Mortgage |
| Less than 2.0x | 50 (19.2%) | 74,570 (15,187.4%) |
| 2.0x to 2.9x | 32 (12.3%) | 117 (23.8%) |
| 3.0x to 3.9x | 79 (30.3%) | 164 (33.4%) |
| 4.0x or more | 98 (37.6%) | 48 (9.8%) |
| Total | 261 (100.0%) | 491 (100.0%) |
Real Estate Taxes by Mortgage Status in Myrtle Creek
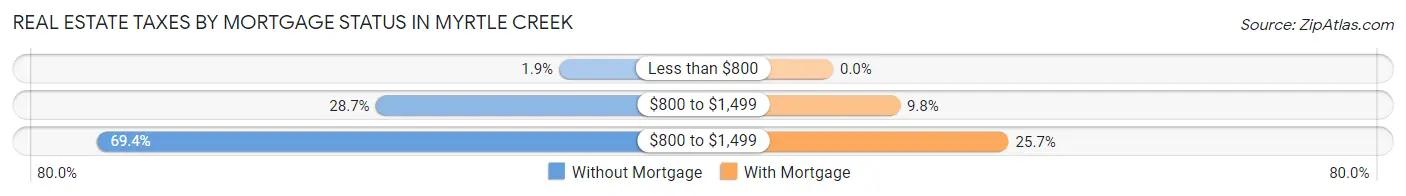
| Property Taxes | Without Mortgage | With Mortgage |
| Less than $800 | 5 (1.9%) | 0 (0.0%) |
| $800 to $1,499 | 75 (28.7%) | 48 (9.8%) |
| $800 to $1,499 | 181 (69.4%) | 126 (25.7%) |
| Total | 261 (100.0%) | 491 (100.0%) |
Health & Disability in Myrtle Creek
Health Insurance Coverage by Age in Myrtle Creek
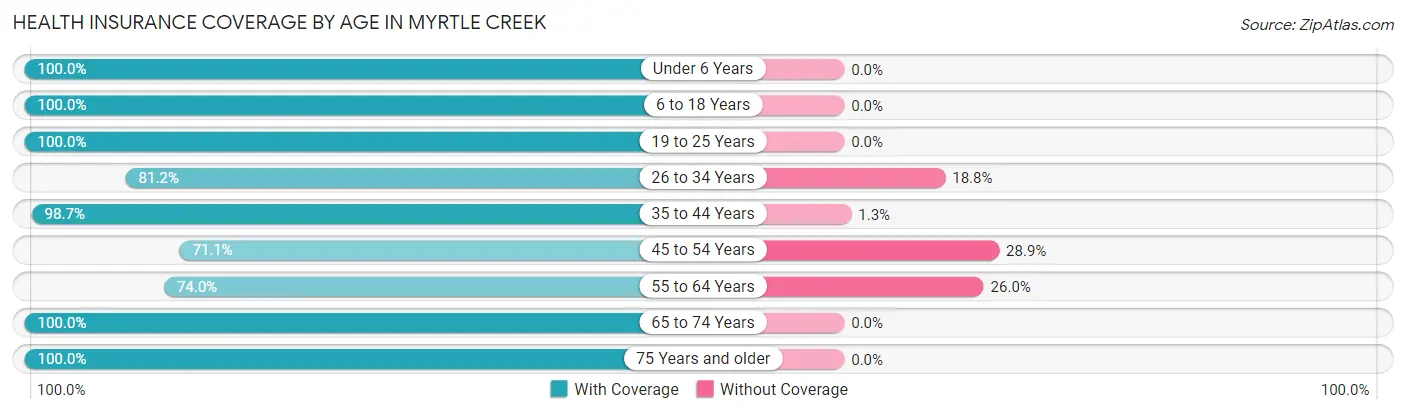
| Age Bracket | With Coverage | Without Coverage |
| Under 6 Years | 301 (100.0%) | 0 (0.0%) |
| 6 to 18 Years | 449 (100.0%) | 0 (0.0%) |
| 19 to 25 Years | 111 (100.0%) | 0 (0.0%) |
| 26 to 34 Years | 392 (81.2%) | 91 (18.8%) |
| 35 to 44 Years | 525 (98.7%) | 7 (1.3%) |
| 45 to 54 Years | 229 (71.1%) | 93 (28.9%) |
| 55 to 64 Years | 430 (74.0%) | 151 (26.0%) |
| 65 to 74 Years | 383 (100.0%) | 0 (0.0%) |
| 75 Years and older | 314 (100.0%) | 0 (0.0%) |
| Total | 3,134 (90.2%) | 342 (9.8%) |
Health Insurance Coverage by Citizenship Status in Myrtle Creek
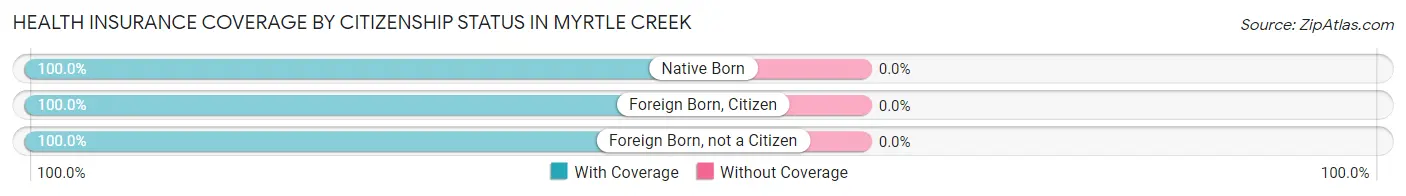
| Citizenship Status | With Coverage | Without Coverage |
| Native Born | 301 (100.0%) | 0 (0.0%) |
| Foreign Born, Citizen | 449 (100.0%) | 0 (0.0%) |
| Foreign Born, not a Citizen | 111 (100.0%) | 0 (0.0%) |
Health Insurance Coverage by Household Income in Myrtle Creek
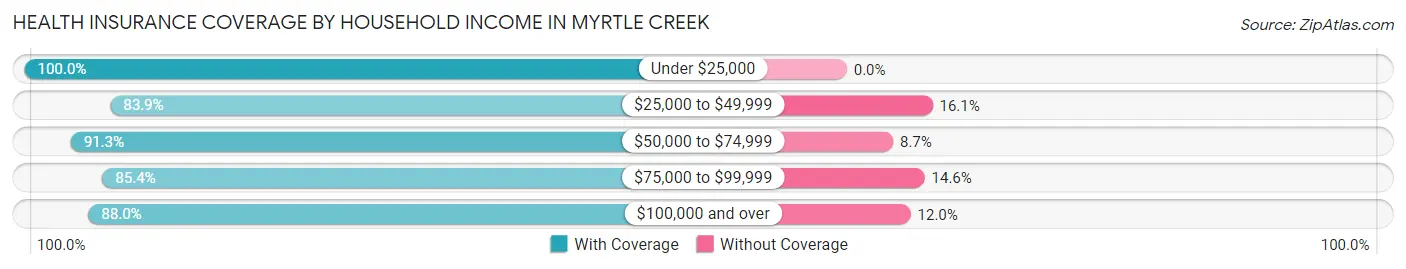
| Household Income | With Coverage | Without Coverage |
| Under $25,000 | 616 (100.0%) | 0 (0.0%) |
| $25,000 to $49,999 | 423 (83.9%) | 81 (16.1%) |
| $50,000 to $74,999 | 728 (91.3%) | 69 (8.7%) |
| $75,000 to $99,999 | 328 (85.4%) | 56 (14.6%) |
| $100,000 and over | 1,001 (88.0%) | 136 (12.0%) |
Public vs Private Health Insurance Coverage by Age in Myrtle Creek
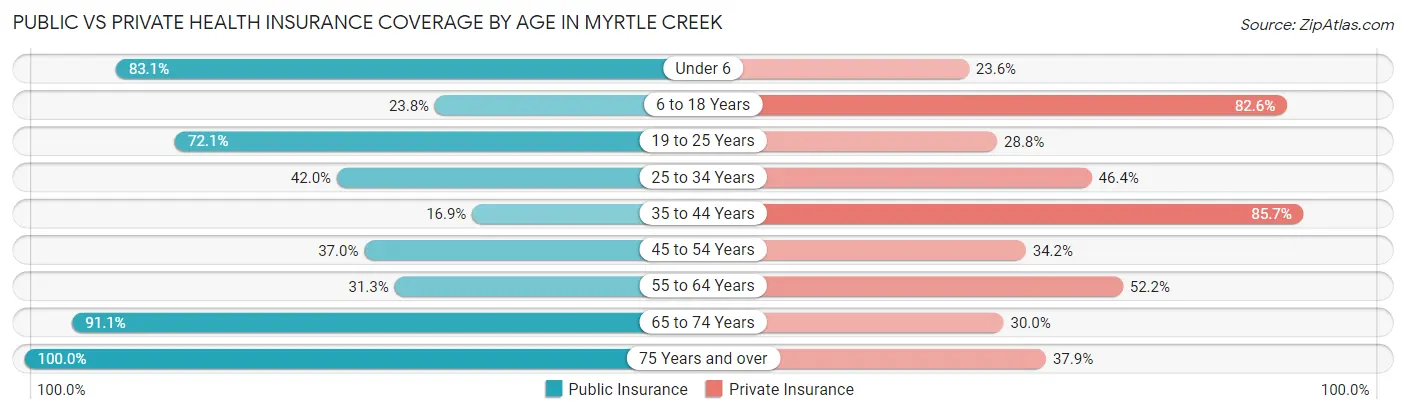
| Age Bracket | Public Insurance | Private Insurance |
| Under 6 | 250 (83.1%) | 71 (23.6%) |
| 6 to 18 Years | 107 (23.8%) | 371 (82.6%) |
| 19 to 25 Years | 80 (72.1%) | 32 (28.8%) |
| 25 to 34 Years | 203 (42.0%) | 224 (46.4%) |
| 35 to 44 Years | 90 (16.9%) | 456 (85.7%) |
| 45 to 54 Years | 119 (37.0%) | 110 (34.2%) |
| 55 to 64 Years | 182 (31.3%) | 303 (52.1%) |
| 65 to 74 Years | 349 (91.1%) | 115 (30.0%) |
| 75 Years and over | 314 (100.0%) | 119 (37.9%) |
| Total | 1,694 (48.7%) | 1,801 (51.8%) |
Disability Status by Sex by Age in Myrtle Creek
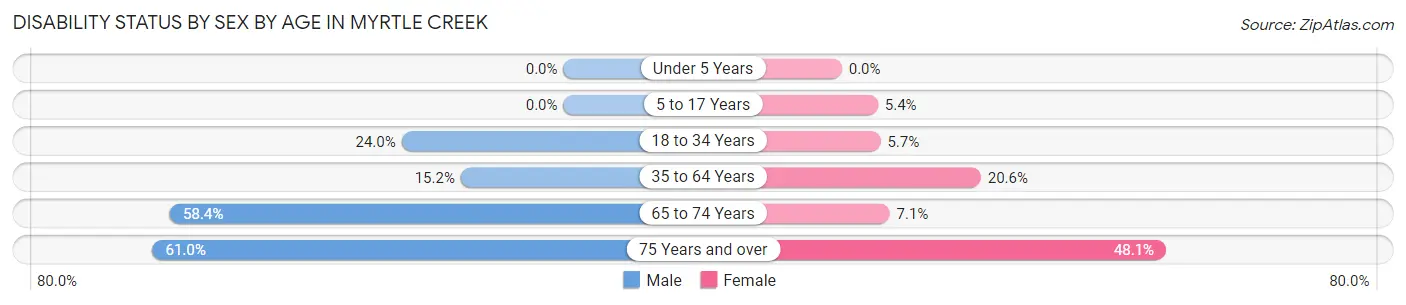
| Age Bracket | Male | Female |
| Under 5 Years | 0 (0.0%) | 0 (0.0%) |
| 5 to 17 Years | 0 (0.0%) | 10 (5.3%) |
| 18 to 34 Years | 74 (24.0%) | 17 (5.7%) |
| 35 to 64 Years | 105 (15.2%) | 154 (20.6%) |
| 65 to 74 Years | 125 (58.4%) | 12 (7.1%) |
| 75 Years and over | 61 (61.0%) | 103 (48.1%) |
Disability Class by Sex by Age in Myrtle Creek
Disability Class: Hearing Difficulty
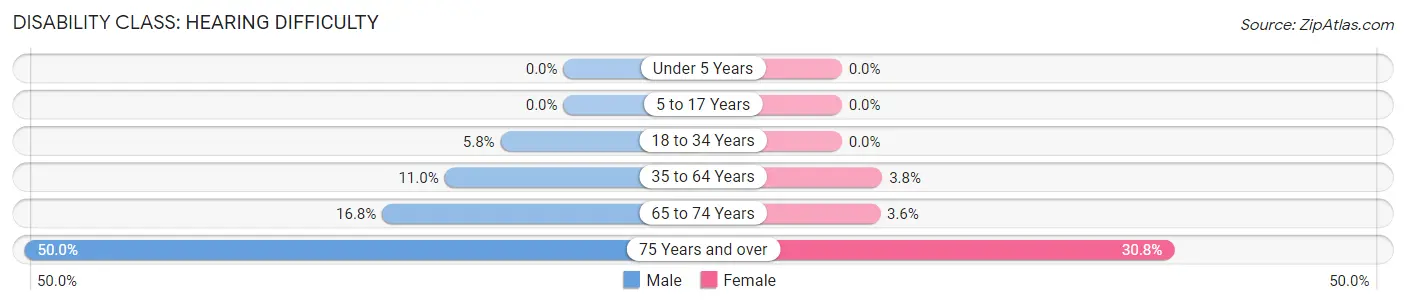
| Age Bracket | Male | Female |
| Under 5 Years | 0 (0.0%) | 0 (0.0%) |
| 5 to 17 Years | 0 (0.0%) | 0 (0.0%) |
| 18 to 34 Years | 18 (5.8%) | 0 (0.0%) |
| 35 to 64 Years | 76 (11.0%) | 28 (3.7%) |
| 65 to 74 Years | 36 (16.8%) | 6 (3.5%) |
| 75 Years and over | 50 (50.0%) | 66 (30.8%) |
Disability Class: Vision Difficulty
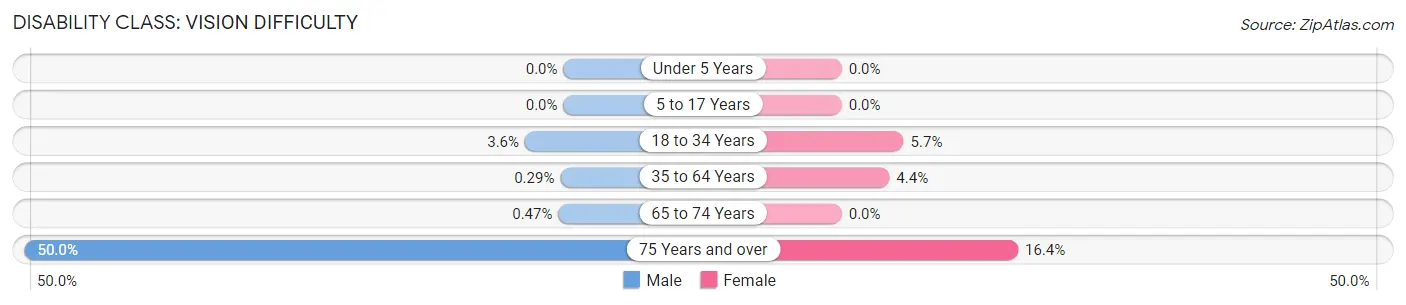
| Age Bracket | Male | Female |
| Under 5 Years | 0 (0.0%) | 0 (0.0%) |
| 5 to 17 Years | 0 (0.0%) | 0 (0.0%) |
| 18 to 34 Years | 11 (3.6%) | 17 (5.7%) |
| 35 to 64 Years | 2 (0.3%) | 33 (4.4%) |
| 65 to 74 Years | 1 (0.5%) | 0 (0.0%) |
| 75 Years and over | 50 (50.0%) | 35 (16.4%) |
Disability Class: Cognitive Difficulty
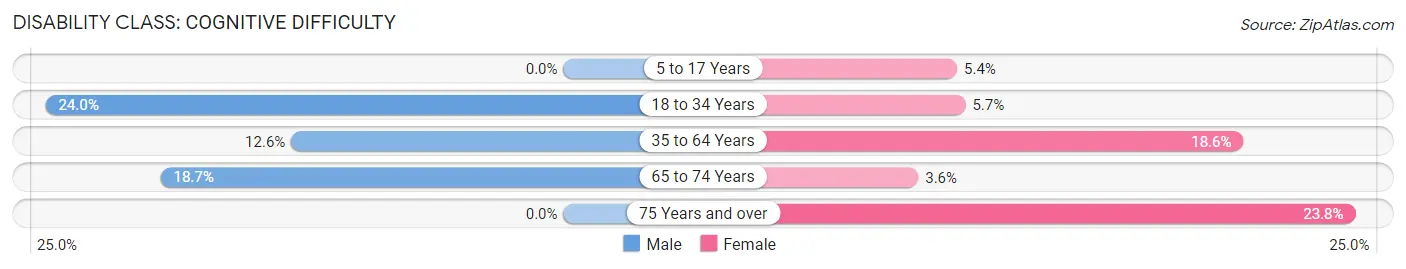
| Age Bracket | Male | Female |
| 5 to 17 Years | 0 (0.0%) | 10 (5.3%) |
| 18 to 34 Years | 74 (24.0%) | 17 (5.7%) |
| 35 to 64 Years | 87 (12.6%) | 139 (18.6%) |
| 65 to 74 Years | 40 (18.7%) | 6 (3.5%) |
| 75 Years and over | 0 (0.0%) | 51 (23.8%) |
Disability Class: Ambulatory Difficulty
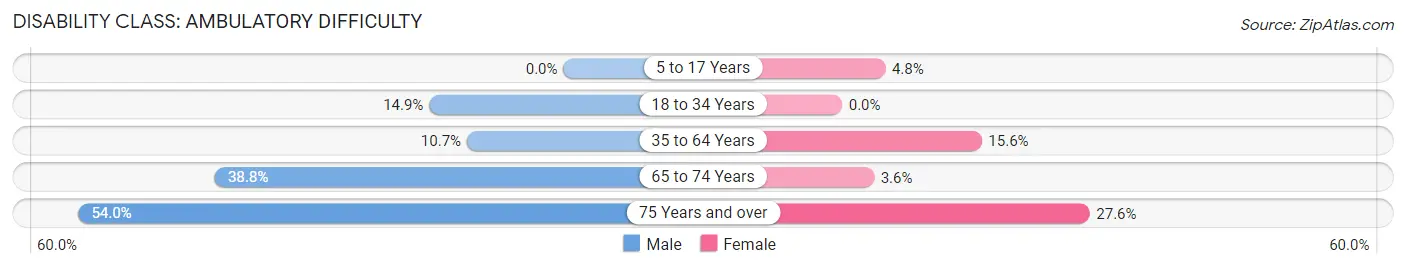
| Age Bracket | Male | Female |
| 5 to 17 Years | 0 (0.0%) | 9 (4.8%) |
| 18 to 34 Years | 46 (14.9%) | 0 (0.0%) |
| 35 to 64 Years | 74 (10.7%) | 116 (15.5%) |
| 65 to 74 Years | 83 (38.8%) | 6 (3.5%) |
| 75 Years and over | 54 (54.0%) | 59 (27.6%) |
Disability Class: Self-Care Difficulty
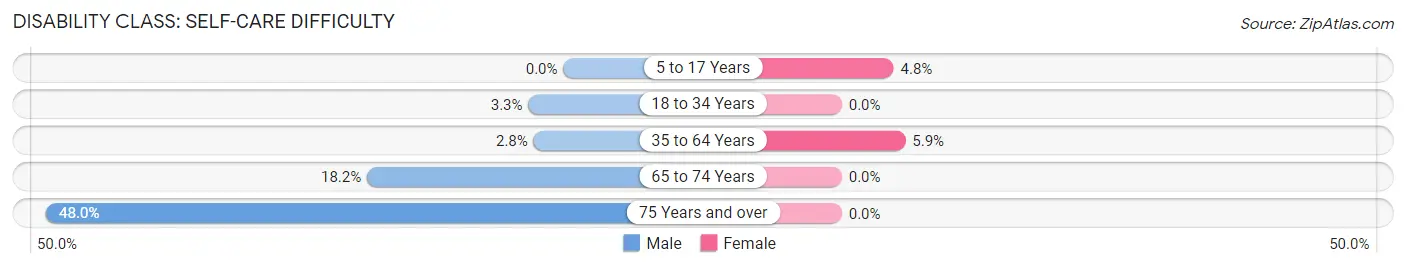
| Age Bracket | Male | Female |
| 5 to 17 Years | 0 (0.0%) | 9 (4.8%) |
| 18 to 34 Years | 10 (3.3%) | 0 (0.0%) |
| 35 to 64 Years | 19 (2.8%) | 44 (5.9%) |
| 65 to 74 Years | 39 (18.2%) | 0 (0.0%) |
| 75 Years and over | 48 (48.0%) | 0 (0.0%) |
Technology Access in Myrtle Creek
Computing Device Access in Myrtle Creek
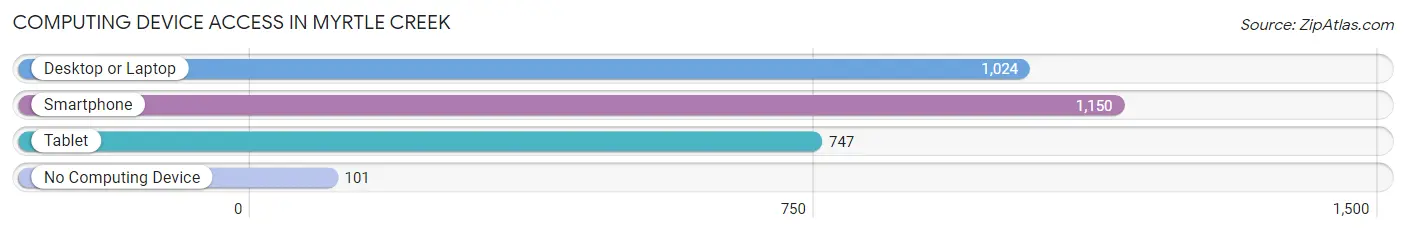
| Device Type | # Households | % Households |
| Desktop or Laptop | 1,024 | 76.0% |
| Smartphone | 1,150 | 85.3% |
| Tablet | 747 | 55.4% |
| No Computing Device | 101 | 7.5% |
| Total | 1,348 | 100.0% |
Internet Access in Myrtle Creek
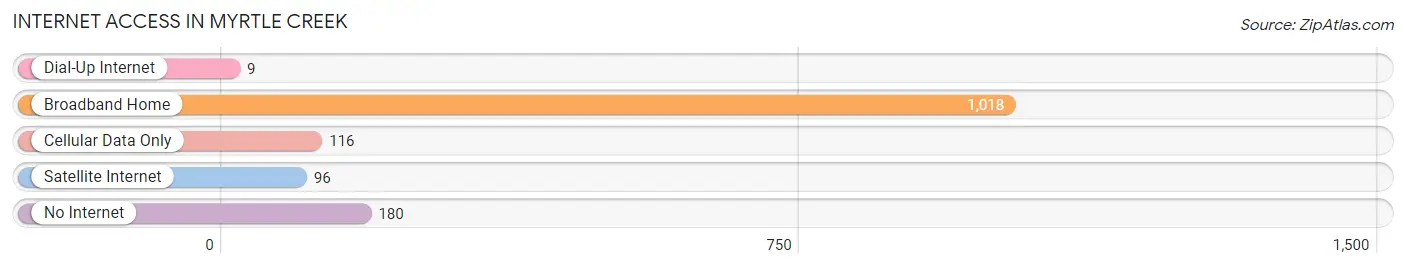
| Internet Type | # Households | % Households |
| Dial-Up Internet | 9 | 0.7% |
| Broadband Home | 1,018 | 75.5% |
| Cellular Data Only | 116 | 8.6% |
| Satellite Internet | 96 | 7.1% |
| No Internet | 180 | 13.4% |
| Total | 1,348 | 100.0% |
Myrtle Creek Summary
Myrtle Creek is a small city located in Douglas County, Oregon, United States. It is situated in the Umpqua Valley, approximately 40 miles south of Roseburg. The city is home to a population of approximately 3,000 people, and is the county seat of Douglas County.
History
Myrtle Creek was founded in 1851 by a group of settlers from the Oregon Trail. The settlers named the area after the myrtle trees that grew along the banks of the creek. The first post office was established in 1854, and the town was officially incorporated in 1891.
The city was originally a logging and farming community, and the timber industry was the main source of income for many of the residents. In the early 1900s, the city began to grow and develop, and by the 1950s, it had become a popular tourist destination.
Geography
Myrtle Creek is located in the Umpqua Valley, approximately 40 miles south of Roseburg. The city is situated at the confluence of the South Umpqua and Myrtle Creek rivers. The city is surrounded by rolling hills and is home to several parks and recreational areas.
The climate in Myrtle Creek is mild and temperate, with warm summers and cool winters. The average annual temperature is around 50 degrees Fahrenheit, and the average annual precipitation is around 40 inches.
Economy
Myrtle Creek’s economy is largely based on the timber industry. The city is home to several lumber mills, and the timber industry is the main source of employment for many of the residents.
In addition to the timber industry, Myrtle Creek is also home to several small businesses, including restaurants, retail stores, and service providers. The city is also home to a number of manufacturing companies, including a furniture factory and a plastics factory.
Demographics
As of the 2010 census, the population of Myrtle Creek was 3,039. The racial makeup of the city was 90.3% White, 0.7% African American, 0.7% Native American, 0.7% Asian, 0.2% Pacific Islander, and 6.2% from other races. The median household income was $37,917, and the median family income was $45,938.
Myrtle Creek is home to a number of churches, including the First Baptist Church, the Church of Jesus Christ of Latter-day Saints, and the Myrtle Creek United Methodist Church. The city is also home to a number of schools, including Myrtle Creek Elementary School, Myrtle Creek Middle School, and Myrtle Creek High School.
Conclusion
Myrtle Creek is a small city located in Douglas County, Oregon. It is situated in the Umpqua Valley, approximately 40 miles south of Roseburg. The city is home to a population of approximately 3,000 people, and is the county seat of Douglas County. The economy of Myrtle Creek is largely based on the timber industry, and the city is also home to several small businesses, manufacturing companies, and churches. The racial makeup of the city is 90.3% White, 0.7% African American, 0.7% Native American, 0.7% Asian, 0.2% Pacific Islander, and 6.2% from other races. The median household income was $37,917, and the median family income was $45,938. Myrtle Creek is a small city with a rich history and a vibrant economy.
Common Questions
What is Per Capita Income in Myrtle Creek?
Per Capita income in Myrtle Creek is $30,305.
What is the Median Family Income in Myrtle Creek?
Median Family Income in Myrtle Creek is $64,135.
What is the Median Household income in Myrtle Creek?
Median Household Income in Myrtle Creek is $56,842.
What is Income or Wage Gap in Myrtle Creek?
Income or Wage Gap in Myrtle Creek is 38.2%.
Women in Myrtle Creek earn 61.8 cents for every dollar earned by a man.
What is Inequality or Gini Index in Myrtle Creek?
Inequality or Gini Index in Myrtle Creek is 0.47.
What is the Total Population of Myrtle Creek?
Total Population of Myrtle Creek is 3,488.
What is the Total Male Population of Myrtle Creek?
Total Male Population of Myrtle Creek is 1,774.
What is the Total Female Population of Myrtle Creek?
Total Female Population of Myrtle Creek is 1,714.
What is the Ratio of Males per 100 Females in Myrtle Creek?
There are 103.50 Males per 100 Females in Myrtle Creek.
What is the Ratio of Females per 100 Males in Myrtle Creek?
There are 96.62 Females per 100 Males in Myrtle Creek.
What is the Median Population Age in Myrtle Creek?
Median Population Age in Myrtle Creek is 41.4 Years.
What is the Average Family Size in Myrtle Creek
Average Family Size in Myrtle Creek is 3.0 People.
What is the Average Household Size in Myrtle Creek
Average Household Size in Myrtle Creek is 2.5 People.
How Large is the Labor Force in Myrtle Creek?
There are 1,628 People in the Labor Forcein in Myrtle Creek.
What is the Percentage of People in the Labor Force in Myrtle Creek?
58.2% of People are in the Labor Force in Myrtle Creek.
What is the Unemployment Rate in Myrtle Creek?
Unemployment Rate in Myrtle Creek is 8.7%.