Roseburg North, OR Map & Demographics
Roseburg North Map
Roseburg North Overview
$28,387
PER CAPITA INCOME
$66,250
AVG FAMILY INCOME
$55,810
AVG HOUSEHOLD INCOME
37.2%
WAGE / INCOME GAP [ % ]
62.8¢/ $1
WAGE / INCOME GAP [ $ ]
0.39
INEQUALITY / GINI INDEX
4,478
TOTAL POPULATION
2,123
MALE POPULATION
2,355
FEMALE POPULATION
90.15
MALES / 100 FEMALES
110.93
FEMALES / 100 MALES
50.9
MEDIAN AGE
2.6
AVG FAMILY SIZE
2.3
AVG HOUSEHOLD SIZE
1,722
LABOR FORCE [ PEOPLE ]
45.7%
PERCENT IN LABOR FORCE
8.1%
UNEMPLOYMENT RATE
Income in Roseburg North
Income Overview in Roseburg North
Per Capita Income in Roseburg North is $28,387, while median incomes of families and households are $66,250 and $55,810 respectively.
| Characteristic | Number | Measure |
| Per Capita Income | 4,478 | $28,387 |
| Median Family Income | 1,346 | $66,250 |
| Mean Family Income | 1,346 | $71,891 |
| Median Household Income | 1,967 | $55,810 |
| Mean Household Income | 1,967 | $62,847 |
| Income Deficit | 1,346 | $0 |
| Wage / Income Gap (%) | 4,478 | 37.16% |
| Wage / Income Gap ($) | 4,478 | 62.84¢ per $1 |
| Gini / Inequality Index | 4,478 | 0.39 |
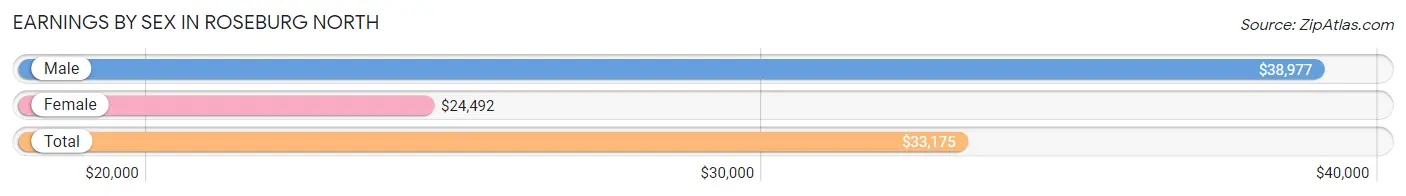
Earnings by Sex in Roseburg North
Average Earnings in Roseburg North are $33,175, $38,977 for men and $24,492 for women, a difference of 37.2%.
| Sex | Number | Average Earnings |
| Male | 817 (46.9%) | $38,977 |
| Female | 924 (53.1%) | $24,492 |
| Total | 1,741 (100.0%) | $33,175 |
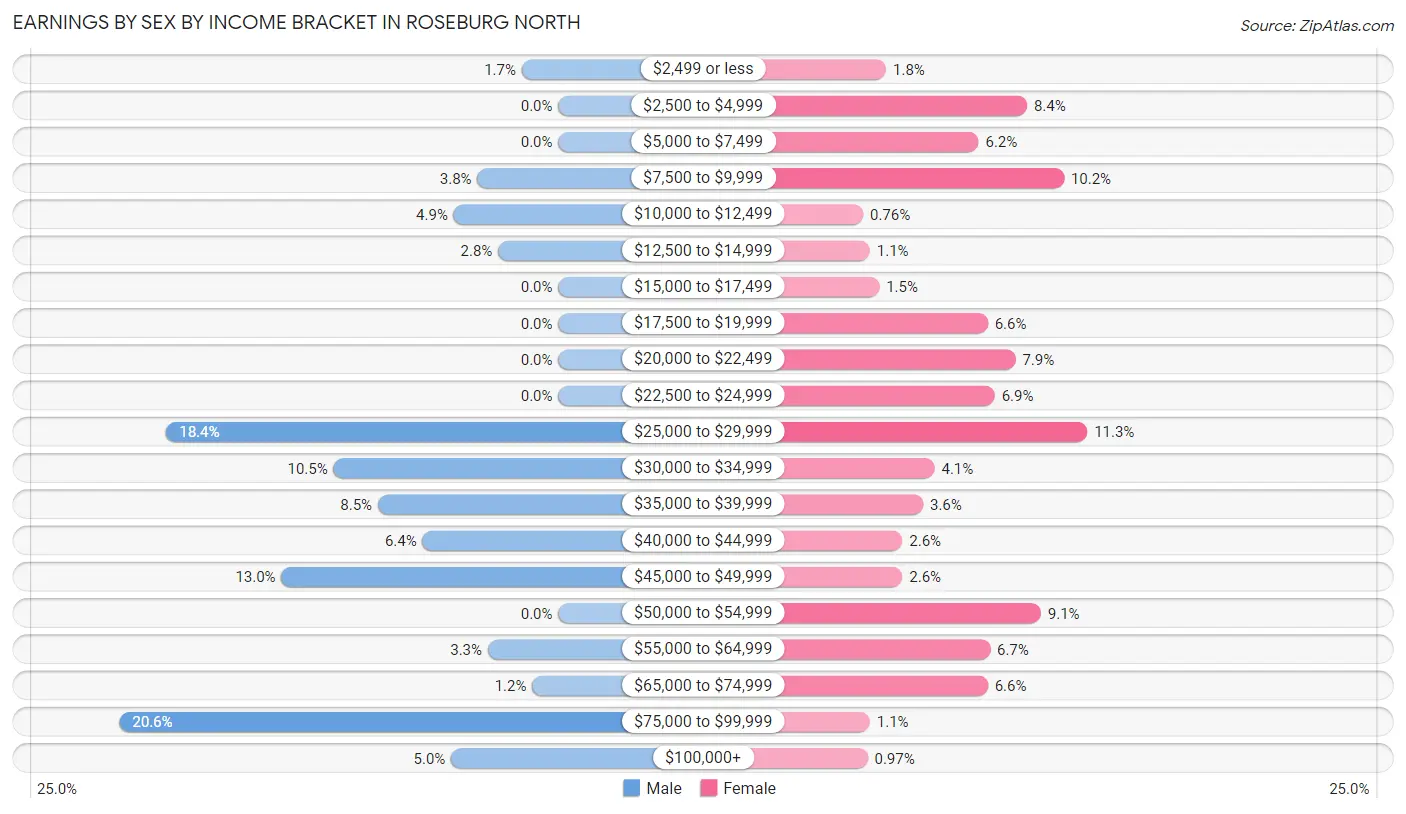
Earnings by Sex by Income Bracket in Roseburg North
The most common earnings brackets in Roseburg North are $75,000 to $99,999 for men (168 | 20.6%) and $25,000 to $29,999 for women (104 | 11.3%).
| Income | Male | Female |
| $2,499 or less | 14 (1.7%) | 17 (1.8%) |
| $2,500 to $4,999 | 0 (0.0%) | 78 (8.4%) |
| $5,000 to $7,499 | 0 (0.0%) | 57 (6.2%) |
| $7,500 to $9,999 | 31 (3.8%) | 94 (10.2%) |
| $10,000 to $12,499 | 40 (4.9%) | 7 (0.8%) |
| $12,500 to $14,999 | 23 (2.8%) | 10 (1.1%) |
| $15,000 to $17,499 | 0 (0.0%) | 14 (1.5%) |
| $17,500 to $19,999 | 0 (0.0%) | 61 (6.6%) |
| $20,000 to $22,499 | 0 (0.0%) | 73 (7.9%) |
| $22,500 to $24,999 | 0 (0.0%) | 64 (6.9%) |
| $25,000 to $29,999 | 150 (18.4%) | 104 (11.3%) |
| $30,000 to $34,999 | 86 (10.5%) | 38 (4.1%) |
| $35,000 to $39,999 | 69 (8.5%) | 33 (3.6%) |
| $40,000 to $44,999 | 52 (6.4%) | 24 (2.6%) |
| $45,000 to $49,999 | 106 (13.0%) | 24 (2.6%) |
| $50,000 to $54,999 | 0 (0.0%) | 84 (9.1%) |
| $55,000 to $64,999 | 27 (3.3%) | 62 (6.7%) |
| $65,000 to $74,999 | 10 (1.2%) | 61 (6.6%) |
| $75,000 to $99,999 | 168 (20.6%) | 10 (1.1%) |
| $100,000+ | 41 (5.0%) | 9 (1.0%) |
| Total | 817 (100.0%) | 924 (100.0%) |
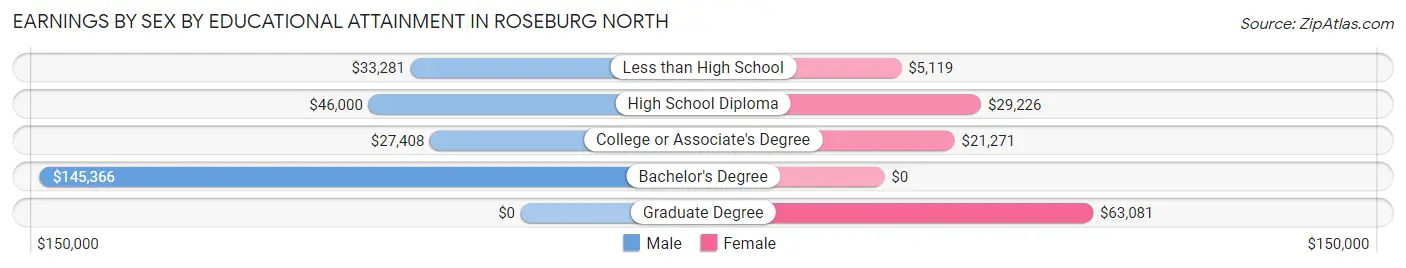
Earnings by Sex by Educational Attainment in Roseburg North
Average earnings in Roseburg North are $37,955 for men and $25,121 for women, a difference of 33.8%. Men with an educational attainment of bachelor's degree enjoy the highest average annual earnings of $145,366, while those with college or associate's degree education earn the least with $27,408. Women with an educational attainment of graduate degree earn the most with the average annual earnings of $63,081, while those with less than high school education have the smallest earnings of $5,119.
| Educational Attainment | Male Income | Female Income |
| Less than High School | $33,281 | $5,119 |
| High School Diploma | $46,000 | $29,226 |
| College or Associate's Degree | $27,408 | $21,271 |
| Bachelor's Degree | $145,366 | $0 |
| Graduate Degree | - | - |
| Total | $37,955 | $25,121 |
Family Income in Roseburg North
Family Income Brackets in Roseburg North
According to the Roseburg North family income data, there are 295 families falling into the $100,000 to $149,999 income range, which is the most common income bracket and makes up 21.9% of all families.
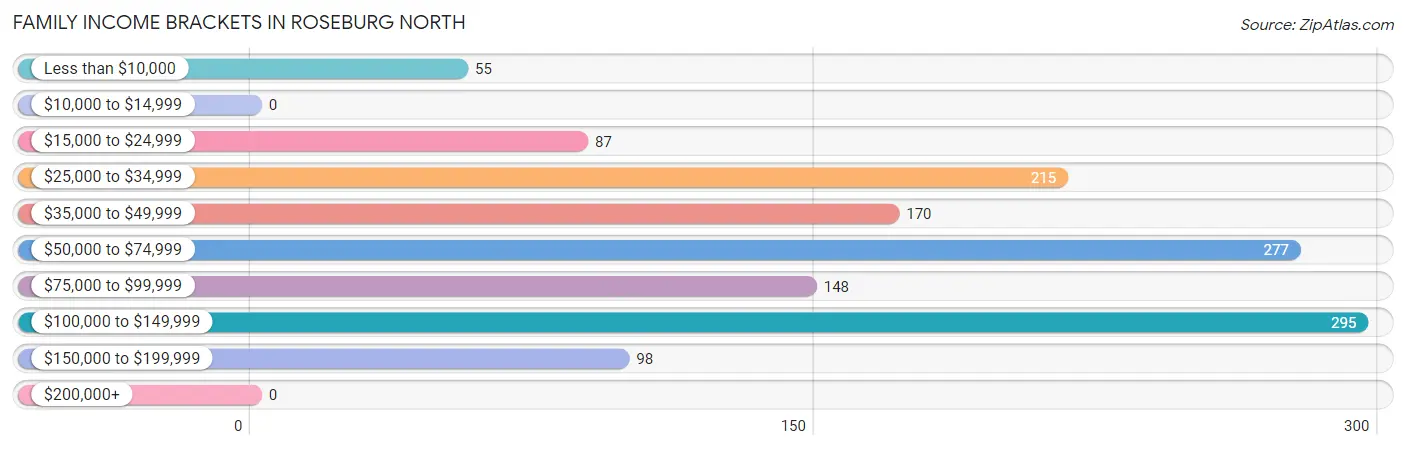
| Income Bracket | # Families | % Families |
| Less than $10,000 | 55 | 4.1% |
| $10,000 to $14,999 | 0 | 0.0% |
| $15,000 to $24,999 | 87 | 6.5% |
| $25,000 to $34,999 | 215 | 16.0% |
| $35,000 to $49,999 | 170 | 12.6% |
| $50,000 to $74,999 | 277 | 20.6% |
| $75,000 to $99,999 | 148 | 11.0% |
| $100,000 to $149,999 | 295 | 21.9% |
| $150,000 to $199,999 | 98 | 7.3% |
| $200,000+ | 0 | 0.0% |
Family Income by Famaliy Size in Roseburg North
3-person families (248 | 18.4%) account for the highest median family income in Roseburg North with $133,952 per family, while 3-person families (248 | 18.4%) have the highest median income of $44,651 per family member.
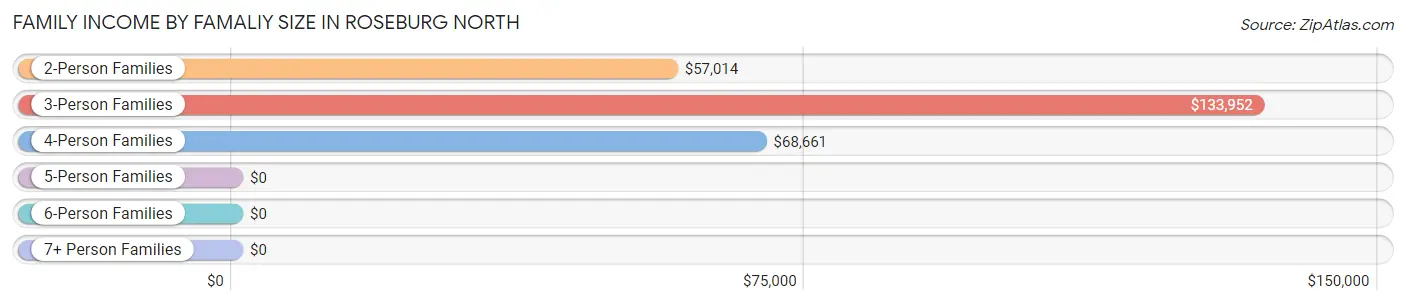
| Income Bracket | # Families | Median Income |
| 2-Person Families | 935 (69.5%) | $57,014 |
| 3-Person Families | 248 (18.4%) | $133,952 |
| 4-Person Families | 143 (10.6%) | $68,661 |
| 5-Person Families | 20 (1.5%) | $0 |
| 6-Person Families | 0 (0.0%) | $0 |
| 7+ Person Families | 0 (0.0%) | $0 |
| Total | 1,346 (100.0%) | $66,250 |
Family Income by Number of Earners in Roseburg North
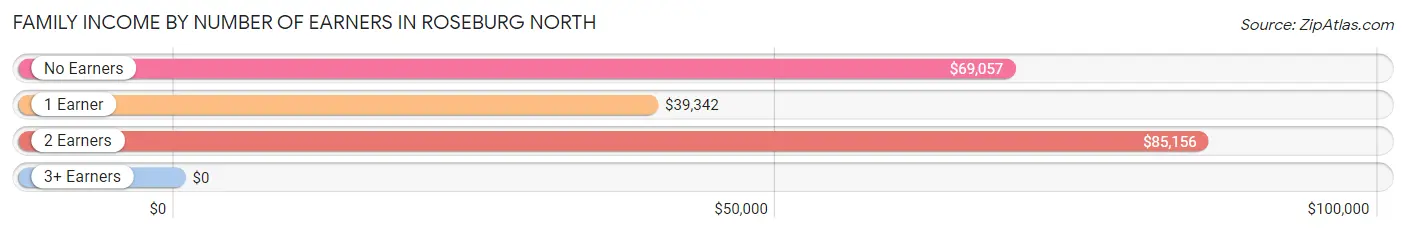
| Number of Earners | # Families | Median Income |
| No Earners | 482 (35.8%) | $69,057 |
| 1 Earner | 482 (35.8%) | $39,342 |
| 2 Earners | 366 (27.2%) | $85,156 |
| 3+ Earners | 16 (1.2%) | $0 |
| Total | 1,346 (100.0%) | $66,250 |
Household Income in Roseburg North
Household Income Brackets in Roseburg North
With 401 households falling in the category, the $50,000 to $74,999 income range is the most frequent in Roseburg North, accounting for 20.4% of all households.
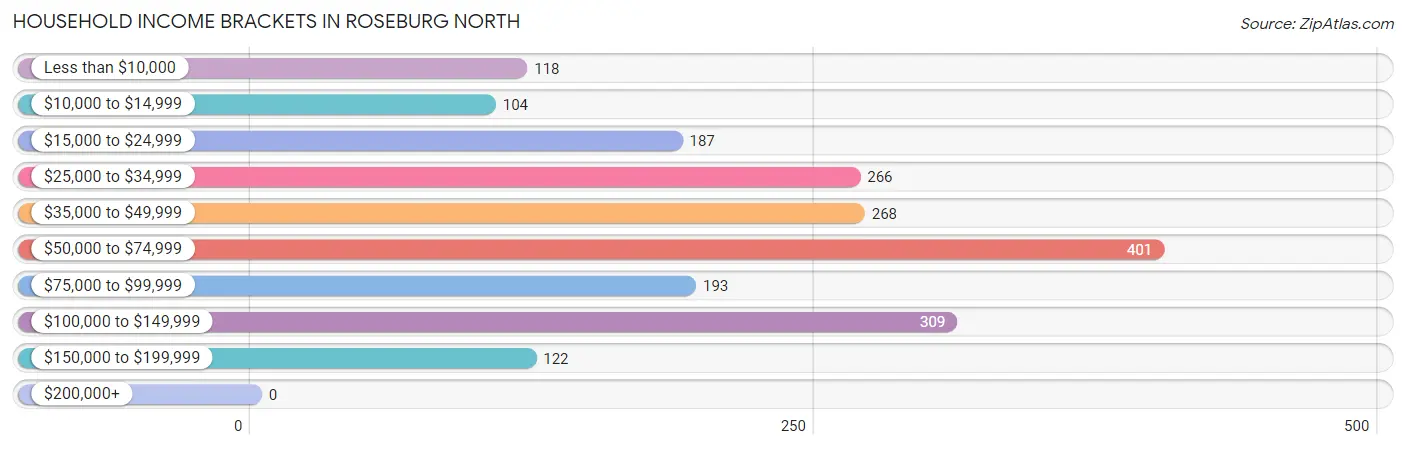
| Income Bracket | # Households | % Households |
| Less than $10,000 | 118 | 6.0% |
| $10,000 to $14,999 | 104 | 5.3% |
| $15,000 to $24,999 | 187 | 9.5% |
| $25,000 to $34,999 | 266 | 13.5% |
| $35,000 to $49,999 | 268 | 13.6% |
| $50,000 to $74,999 | 401 | 20.4% |
| $75,000 to $99,999 | 193 | 9.8% |
| $100,000 to $149,999 | 309 | 15.7% |
| $150,000 to $199,999 | 122 | 6.2% |
| $200,000+ | 0 | 0.0% |
Household Income by Householder Age in Roseburg North
The median household income in Roseburg North is $55,810, with the highest median household income of $66,121 found in the 25 to 44 years age bracket for the primary householder. A total of 454 households (23.1%) fall into this category. Meanwhile, the 15 to 24 years age bracket for the primary householder has the lowest median household income of $0, with 84 households (4.3%) in this group.
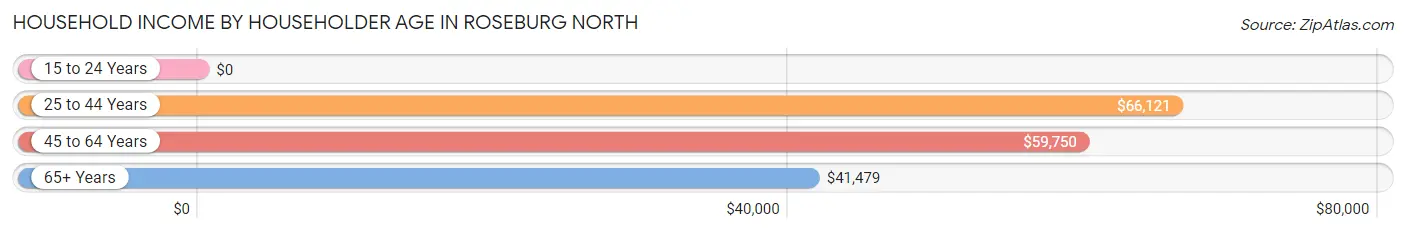
| Income Bracket | # Households | Median Income |
| 15 to 24 Years | 84 (4.3%) | $0 |
| 25 to 44 Years | 454 (23.1%) | $66,121 |
| 45 to 64 Years | 568 (28.9%) | $59,750 |
| 65+ Years | 861 (43.8%) | $41,479 |
| Total | 1,967 (100.0%) | $55,810 |
Poverty in Roseburg North
Income Below Poverty by Sex and Age in Roseburg North
With 6.1% poverty level for males and 21.0% for females among the residents of Roseburg North, 6 to 11 year old males and 16 and 17 year old females are the most vulnerable to poverty, with 23 males (71.9%) and 15 females (100.0%) in their respective age groups living below the poverty level.
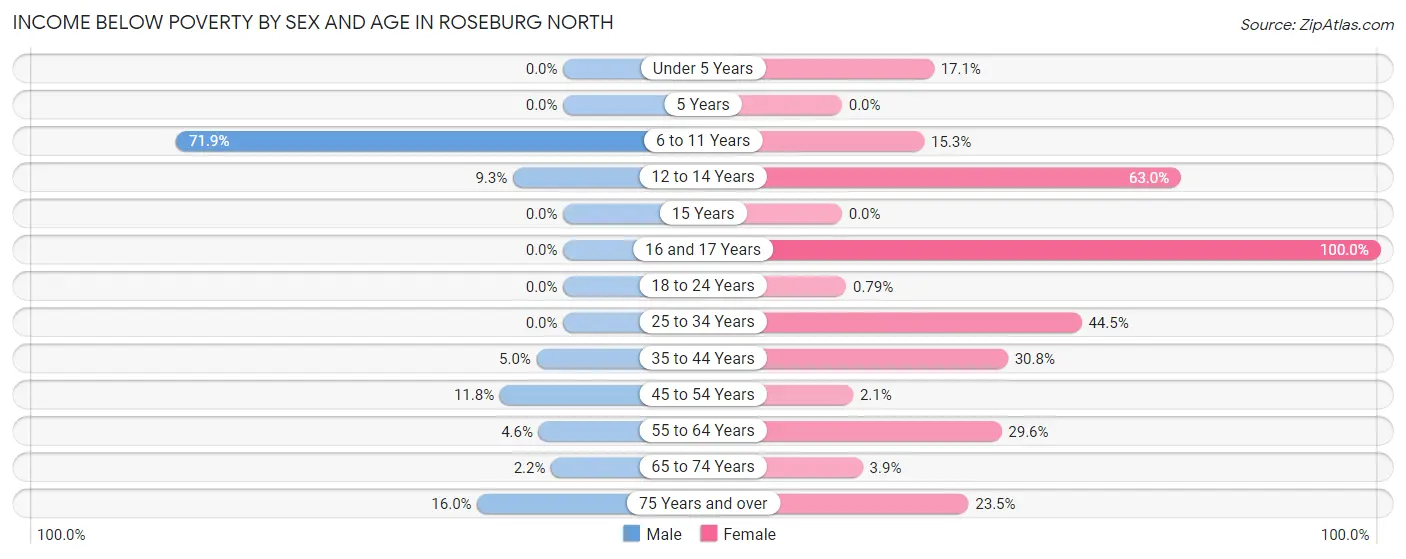
| Age Bracket | Male | Female |
| Under 5 Years | 0 (0.0%) | 29 (17.1%) |
| 5 Years | 0 (0.0%) | 0 (0.0%) |
| 6 to 11 Years | 23 (71.9%) | 20 (15.3%) |
| 12 to 14 Years | 7 (9.3%) | 17 (63.0%) |
| 15 Years | 0 (0.0%) | 0 (0.0%) |
| 16 and 17 Years | 0 (0.0%) | 15 (100.0%) |
| 18 to 24 Years | 0 (0.0%) | 1 (0.8%) |
| 25 to 34 Years | 0 (0.0%) | 109 (44.5%) |
| 35 to 44 Years | 10 (5.0%) | 77 (30.8%) |
| 45 to 54 Years | 26 (11.8%) | 4 (2.1%) |
| 55 to 64 Years | 11 (4.5%) | 141 (29.6%) |
| 65 to 74 Years | 11 (2.2%) | 16 (3.9%) |
| 75 Years and over | 41 (16.0%) | 66 (23.5%) |
| Total | 129 (6.1%) | 495 (21.0%) |
Income Above Poverty by Sex and Age in Roseburg North
According to the poverty statistics in Roseburg North, males aged under 5 years and females aged 5 years are the age groups that are most secure financially, with 100.0% of males and 100.0% of females in these age groups living above the poverty line.
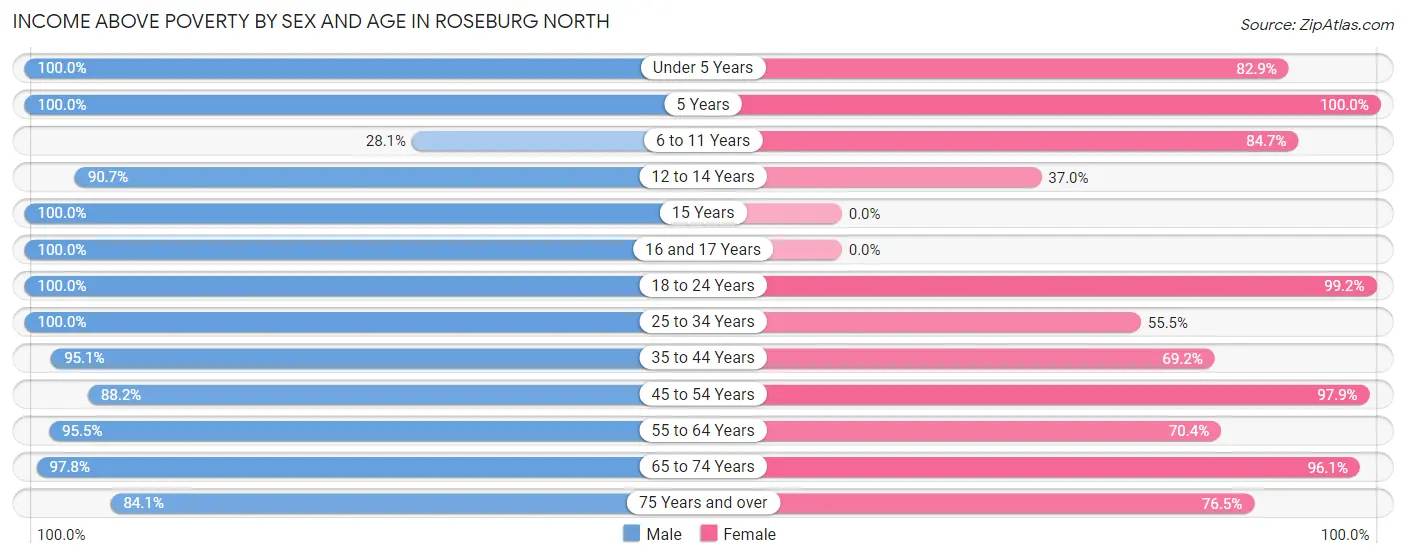
| Age Bracket | Male | Female |
| Under 5 Years | 207 (100.0%) | 141 (82.9%) |
| 5 Years | 15 (100.0%) | 27 (100.0%) |
| 6 to 11 Years | 9 (28.1%) | 111 (84.7%) |
| 12 to 14 Years | 68 (90.7%) | 10 (37.0%) |
| 15 Years | 27 (100.0%) | 0 (0.0%) |
| 16 and 17 Years | 7 (100.0%) | 0 (0.0%) |
| 18 to 24 Years | 162 (100.0%) | 126 (99.2%) |
| 25 to 34 Years | 186 (100.0%) | 136 (55.5%) |
| 35 to 44 Years | 192 (95.1%) | 173 (69.2%) |
| 45 to 54 Years | 195 (88.2%) | 189 (97.9%) |
| 55 to 64 Years | 231 (95.5%) | 335 (70.4%) |
| 65 to 74 Years | 479 (97.8%) | 397 (96.1%) |
| 75 Years and over | 216 (84.1%) | 215 (76.5%) |
| Total | 1,994 (93.9%) | 1,860 (79.0%) |
Income Below Poverty Among Married-Couple Families in Roseburg North
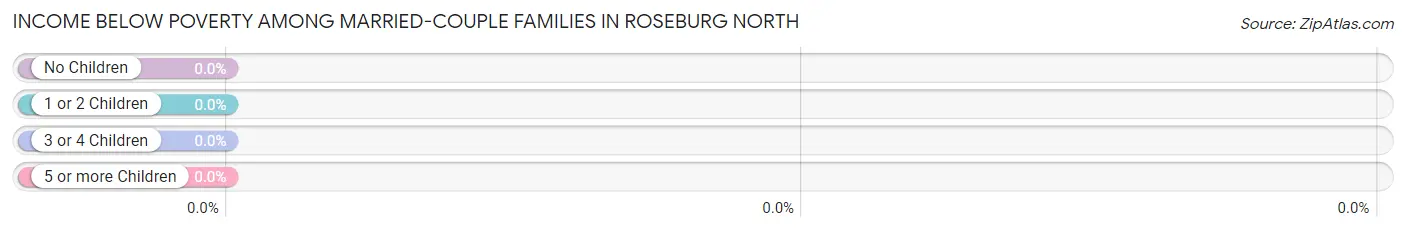
| Children | Above Poverty | Below Poverty |
| No Children | 745 (100.0%) | 0 (0.0%) |
| 1 or 2 Children | 213 (100.0%) | 0 (0.0%) |
| 3 or 4 Children | 20 (100.0%) | 0 (0.0%) |
| 5 or more Children | 0 (0.0%) | 0 (0.0%) |
| Total | 978 (100.0%) | 0 (0.0%) |
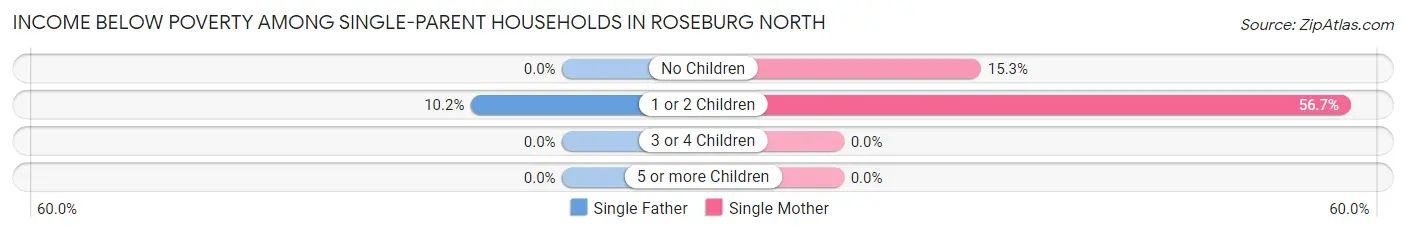
Income Below Poverty Among Single-Parent Households in Roseburg North
According to the poverty data in Roseburg North, 10.2% or 10 single-father households and 33.7% or 91 single-mother households are living below the poverty line. Among single-father households, those with 1 or 2 children have the highest poverty rate, with 10 households (10.2%) experiencing poverty. Likewise, among single-mother households, those with 1 or 2 children have the highest poverty rate, with 68 households (56.7%) falling below the poverty line.
| Children | Single Father | Single Mother |
| No Children | 0 (0.0%) | 23 (15.3%) |
| 1 or 2 Children | 10 (10.2%) | 68 (56.7%) |
| 3 or 4 Children | 0 (0.0%) | 0 (0.0%) |
| 5 or more Children | 0 (0.0%) | 0 (0.0%) |
| Total | 10 (10.2%) | 91 (33.7%) |
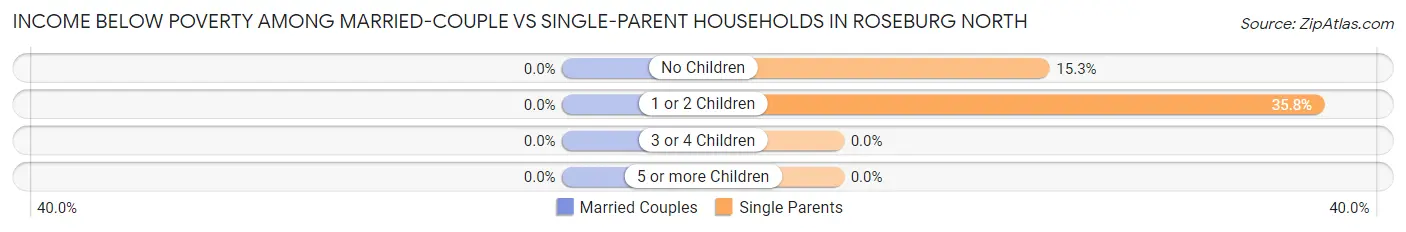
Income Below Poverty Among Married-Couple vs Single-Parent Households in Roseburg North
| Children | Married-Couple Families | Single-Parent Households |
| No Children | 0 (0.0%) | 23 (15.3%) |
| 1 or 2 Children | 0 (0.0%) | 78 (35.8%) |
| 3 or 4 Children | 0 (0.0%) | 0 (0.0%) |
| 5 or more Children | 0 (0.0%) | 0 (0.0%) |
| Total | 0 (0.0%) | 101 (27.5%) |
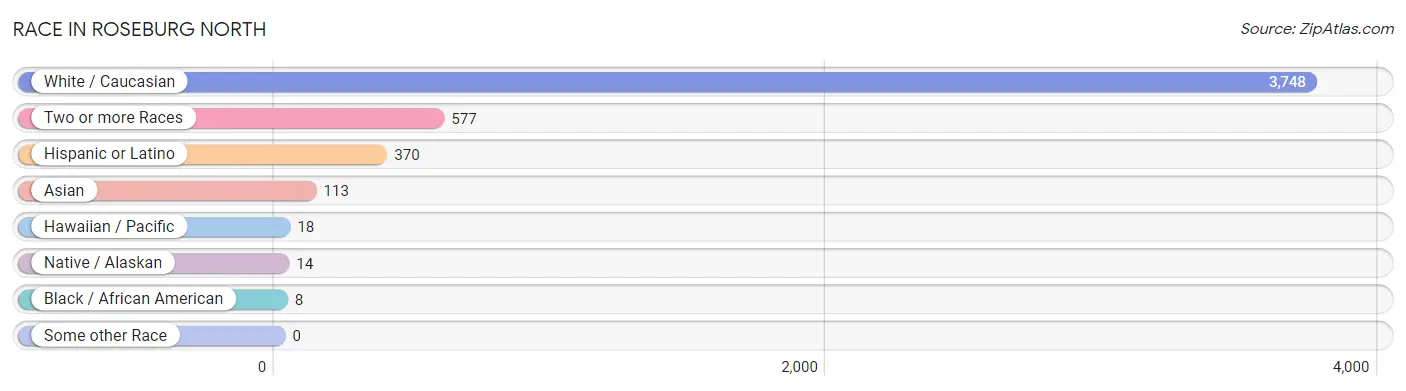
Race in Roseburg North
The most populous races in Roseburg North are White / Caucasian (3,748 | 83.7%), Two or more Races (577 | 12.9%), and Hispanic or Latino (370 | 8.3%).
| Race | # Population | % Population |
| Asian | 113 | 2.5% |
| Black / African American | 8 | 0.2% |
| Hawaiian / Pacific | 18 | 0.4% |
| Hispanic or Latino | 370 | 8.3% |
| Native / Alaskan | 14 | 0.3% |
| White / Caucasian | 3,748 | 83.7% |
| Two or more Races | 577 | 12.9% |
| Some other Race | 0 | 0.0% |
| Total | 4,478 | 100.0% |
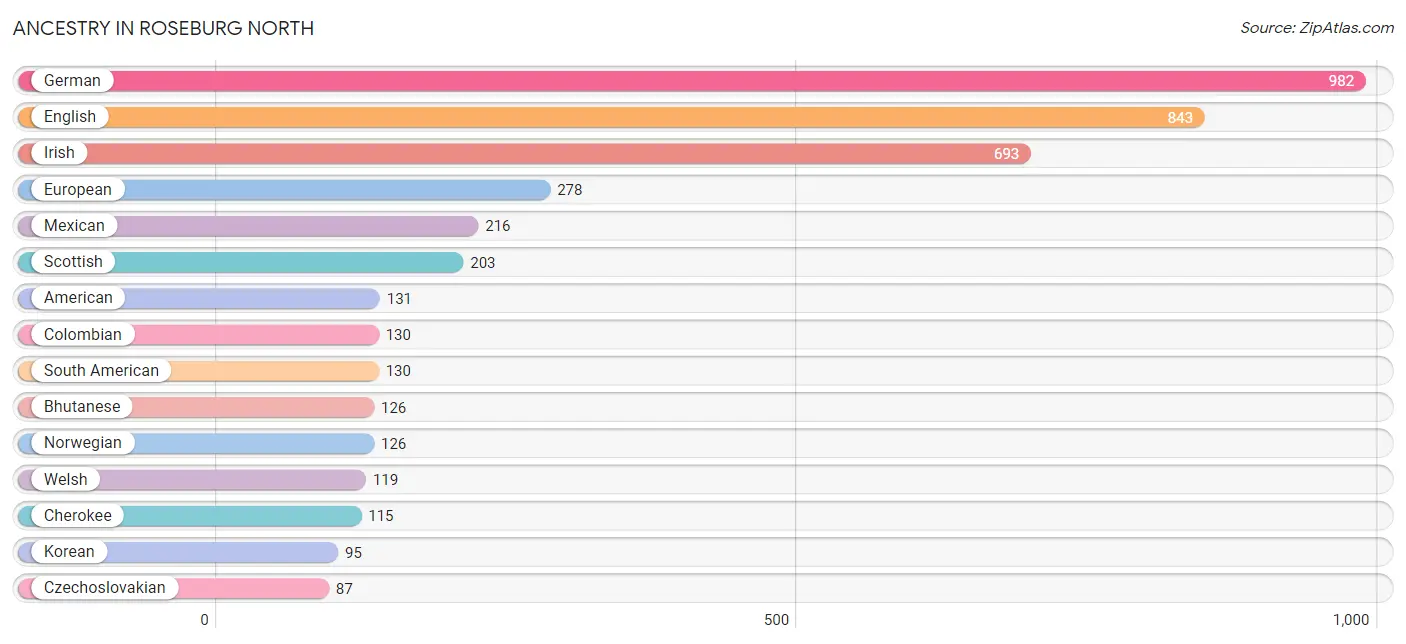
Ancestry in Roseburg North
The most populous ancestries reported in Roseburg North are German (982 | 21.9%), English (843 | 18.8%), Irish (693 | 15.5%), European (278 | 6.2%), and Mexican (216 | 4.8%), together accounting for 67.3% of all Roseburg North residents.
| Ancestry | # Population | % Population |
| American | 131 | 2.9% |
| Austrian | 43 | 1.0% |
| Bhutanese | 126 | 2.8% |
| Blackfeet | 53 | 1.2% |
| British | 21 | 0.5% |
| Central American Indian | 39 | 0.9% |
| Cherokee | 115 | 2.6% |
| Colombian | 130 | 2.9% |
| Czech | 11 | 0.3% |
| Czechoslovakian | 87 | 1.9% |
| Danish | 42 | 0.9% |
| Dutch | 79 | 1.8% |
| English | 843 | 18.8% |
| European | 278 | 6.2% |
| Finnish | 40 | 0.9% |
| French | 77 | 1.7% |
| French American Indian | 11 | 0.3% |
| French Canadian | 11 | 0.3% |
| German | 982 | 21.9% |
| Indian (Asian) | 18 | 0.4% |
| Irish | 693 | 15.5% |
| Italian | 53 | 1.2% |
| Korean | 95 | 2.1% |
| Mexican | 216 | 4.8% |
| Northern European | 38 | 0.9% |
| Norwegian | 126 | 2.8% |
| Pennsylvania German | 37 | 0.8% |
| Polish | 43 | 1.0% |
| Portuguese | 38 | 0.9% |
| Russian | 78 | 1.7% |
| Samoan | 18 | 0.4% |
| Scandinavian | 33 | 0.7% |
| Scotch-Irish | 14 | 0.3% |
| Scottish | 203 | 4.5% |
| South American | 130 | 2.9% |
| Spanish | 24 | 0.5% |
| Swedish | 35 | 0.8% |
| Welsh | 119 | 2.7% | View All 38 Rows |
Immigrants in Roseburg North
The most numerous immigrant groups reported in Roseburg North came from Europe (116 | 2.6%), Northern Europe (102 | 2.3%), Central America (69 | 1.5%), Latin America (69 | 1.5%), and Mexico (69 | 1.5%), together accounting for 9.5% of all Roseburg North residents.
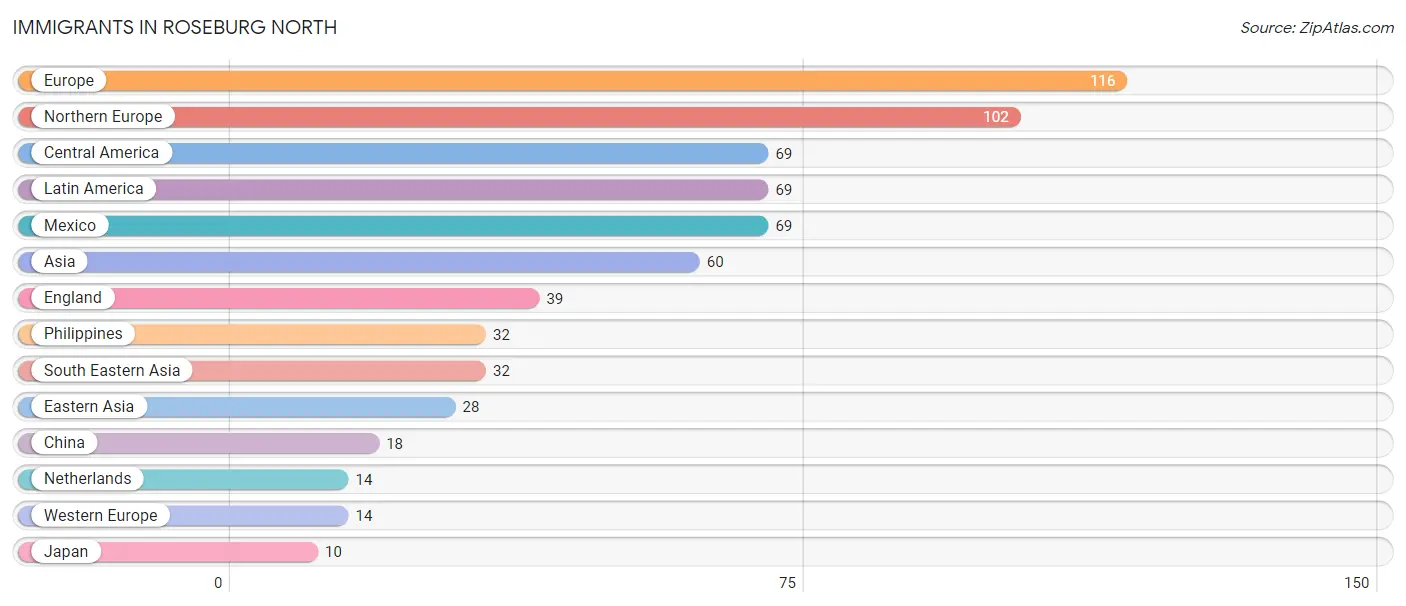
| Immigration Origin | # Population | % Population |
| Asia | 60 | 1.3% |
| Central America | 69 | 1.5% |
| China | 18 | 0.4% |
| Eastern Asia | 28 | 0.6% |
| England | 39 | 0.9% |
| Europe | 116 | 2.6% |
| Japan | 10 | 0.2% |
| Latin America | 69 | 1.5% |
| Mexico | 69 | 1.5% |
| Netherlands | 14 | 0.3% |
| Northern Europe | 102 | 2.3% |
| Philippines | 32 | 0.7% |
| South Eastern Asia | 32 | 0.7% |
| Western Europe | 14 | 0.3% | View All 14 Rows |
Sex and Age in Roseburg North
Sex and Age in Roseburg North
The most populous age groups in Roseburg North are 70 to 74 Years (266 | 12.5%) for men and 60 to 64 Years (278 | 11.8%) for women.
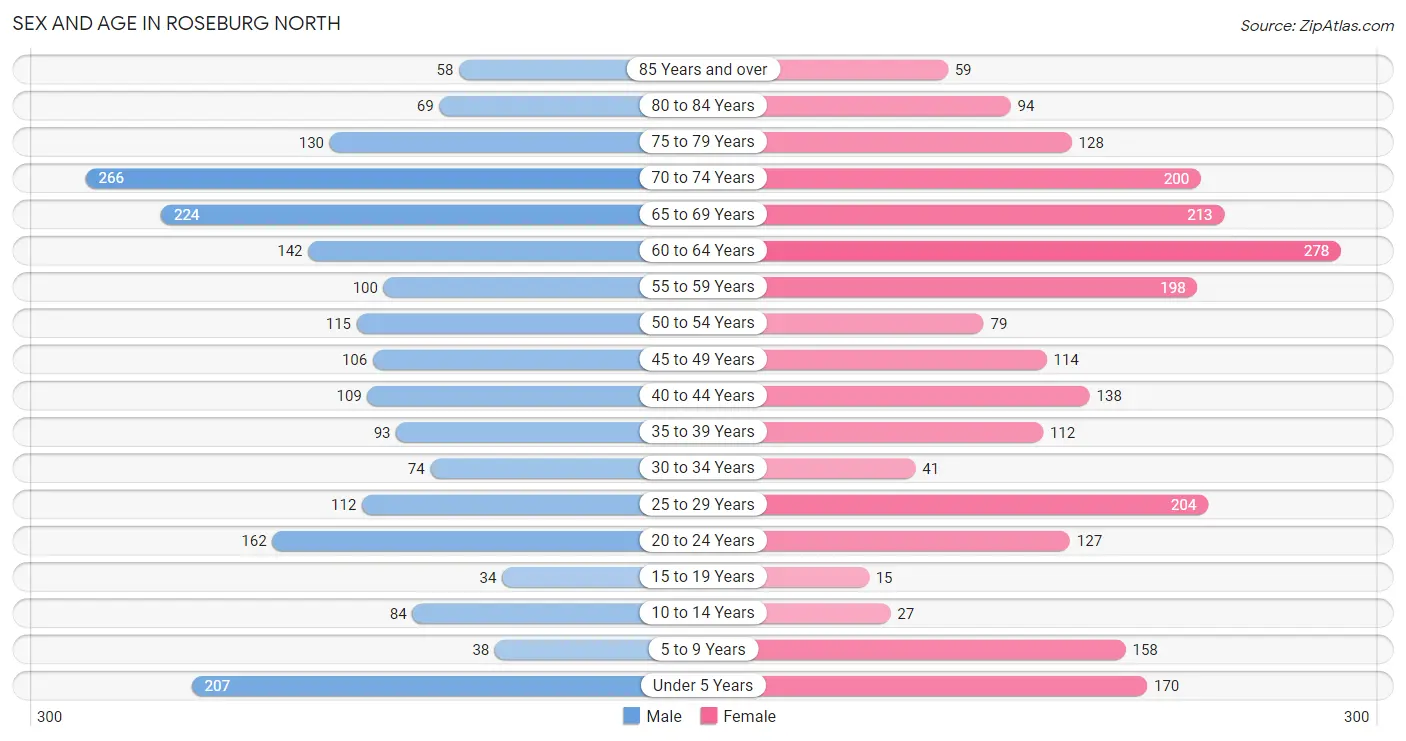
| Age Bracket | Male | Female |
| Under 5 Years | 207 (9.8%) | 170 (7.2%) |
| 5 to 9 Years | 38 (1.8%) | 158 (6.7%) |
| 10 to 14 Years | 84 (4.0%) | 27 (1.1%) |
| 15 to 19 Years | 34 (1.6%) | 15 (0.6%) |
| 20 to 24 Years | 162 (7.6%) | 127 (5.4%) |
| 25 to 29 Years | 112 (5.3%) | 204 (8.7%) |
| 30 to 34 Years | 74 (3.5%) | 41 (1.7%) |
| 35 to 39 Years | 93 (4.4%) | 112 (4.8%) |
| 40 to 44 Years | 109 (5.1%) | 138 (5.9%) |
| 45 to 49 Years | 106 (5.0%) | 114 (4.8%) |
| 50 to 54 Years | 115 (5.4%) | 79 (3.4%) |
| 55 to 59 Years | 100 (4.7%) | 198 (8.4%) |
| 60 to 64 Years | 142 (6.7%) | 278 (11.8%) |
| 65 to 69 Years | 224 (10.5%) | 213 (9.0%) |
| 70 to 74 Years | 266 (12.5%) | 200 (8.5%) |
| 75 to 79 Years | 130 (6.1%) | 128 (5.4%) |
| 80 to 84 Years | 69 (3.3%) | 94 (4.0%) |
| 85 Years and over | 58 (2.7%) | 59 (2.5%) |
| Total | 2,123 (100.0%) | 2,355 (100.0%) |
Families and Households in Roseburg North
Median Family Size in Roseburg North
The median family size in Roseburg North is 2.57 persons per family, with single female/mother families (270 | 20.1%) accounting for the largest median family size of 2.66 persons per family. On the other hand, single male/father families (98 | 7.3%) represent the smallest median family size with 1.97 persons per family.
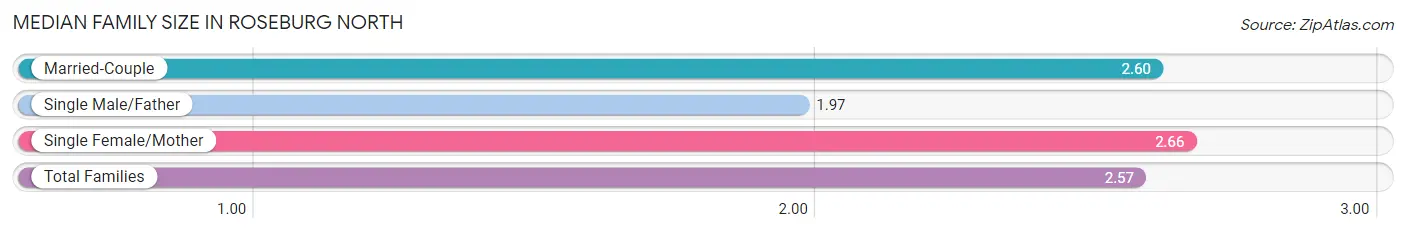
| Family Type | # Families | Family Size |
| Married-Couple | 978 (72.7%) | 2.60 |
| Single Male/Father | 98 (7.3%) | 1.97 |
| Single Female/Mother | 270 (20.1%) | 2.66 |
| Total Families | 1,346 (100.0%) | 2.57 |
Median Household Size in Roseburg North
The median household size in Roseburg North is 2.28 persons per household, with single male/father households (98 | 5.0%) accounting for the largest median household size of 2.88 persons per household. non-family households (621 | 31.6%) represent the smallest median household size with 1.31 persons per household.
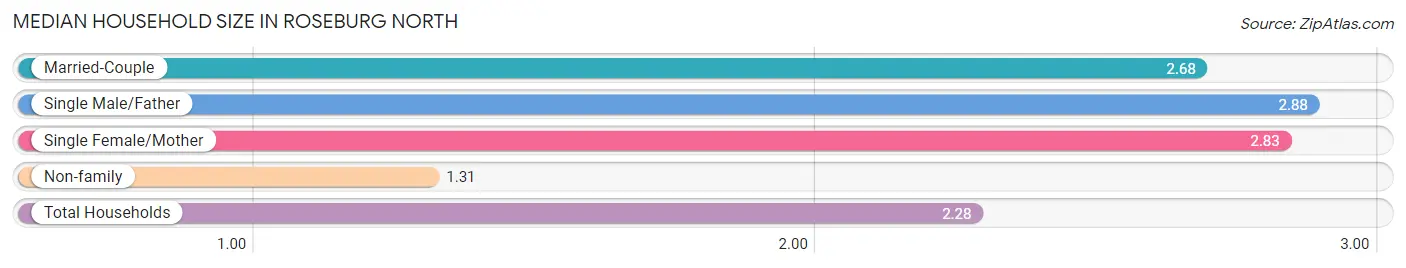
| Household Type | # Households | Household Size |
| Married-Couple | 978 (49.7%) | 2.68 |
| Single Male/Father | 98 (5.0%) | 2.88 |
| Single Female/Mother | 270 (13.7%) | 2.83 |
| Non-family | 621 (31.6%) | 1.31 |
| Total Households | 1,967 (100.0%) | 2.28 |
Household Size by Marriage Status in Roseburg North
Out of a total of 1,967 households in Roseburg North, 1,346 (68.4%) are family households, while 621 (31.6%) are nonfamily households. The most numerous type of family households are 2-person households, comprising 801, and the most common type of nonfamily households are 1-person households, comprising 462.
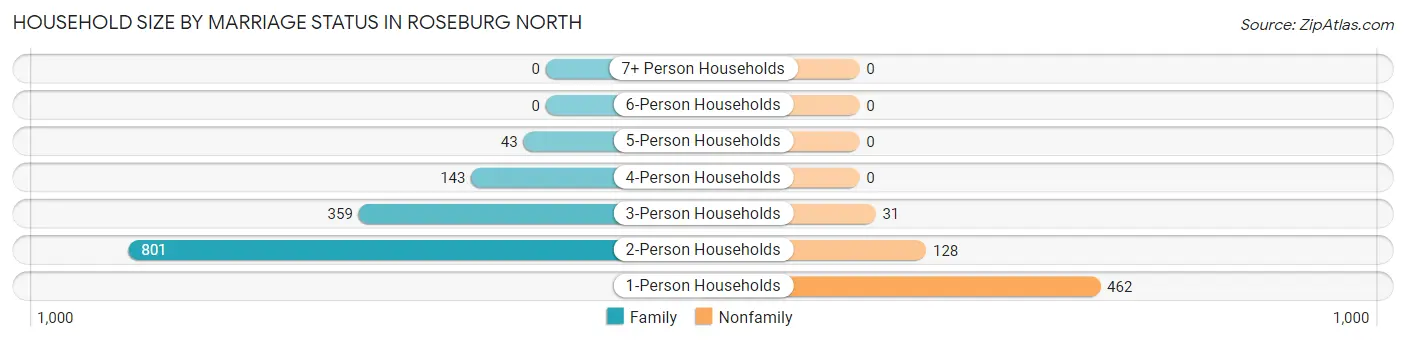
| Household Size | Family Households | Nonfamily Households |
| 1-Person Households | - | 462 (23.5%) |
| 2-Person Households | 801 (40.7%) | 128 (6.5%) |
| 3-Person Households | 359 (18.2%) | 31 (1.6%) |
| 4-Person Households | 143 (7.3%) | 0 (0.0%) |
| 5-Person Households | 43 (2.2%) | 0 (0.0%) |
| 6-Person Households | 0 (0.0%) | 0 (0.0%) |
| 7+ Person Households | 0 (0.0%) | 0 (0.0%) |
| Total | 1,346 (68.4%) | 621 (31.6%) |
Female Fertility in Roseburg North
Fertility by Age in Roseburg North
Average fertility rate in Roseburg North is 106.0 births per 1,000 women. Women in the age bracket of 20 to 34 years have the highest fertility rate with 194.0 births per 1,000 women. Women in the age bracket of 20 to 34 years acount for 87.8% of all women with births.
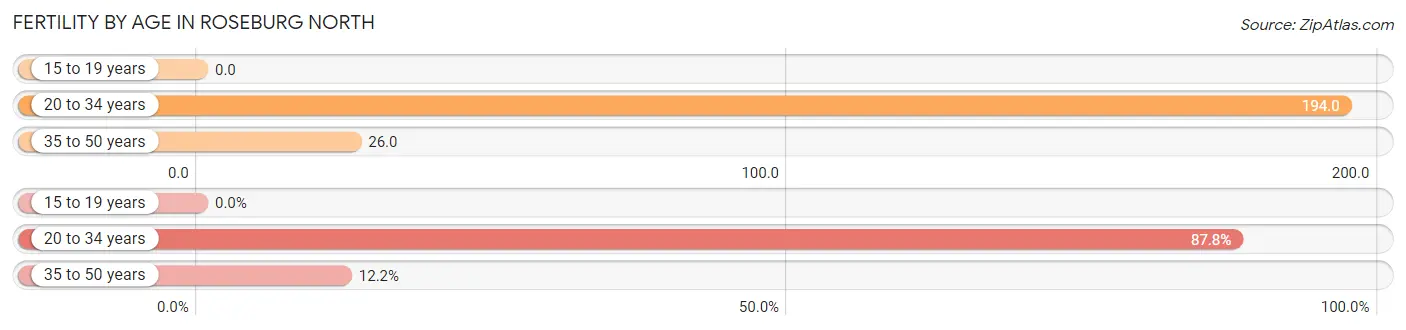
| Age Bracket | Women with Births | Births / 1,000 Women |
| 15 to 19 years | 0 (0.0%) | 0.0 |
| 20 to 34 years | 72 (87.8%) | 194.0 |
| 35 to 50 years | 10 (12.2%) | 26.0 |
| Total | 82 (100.0%) | 106.0 |
Fertility by Age by Marriage Status in Roseburg North
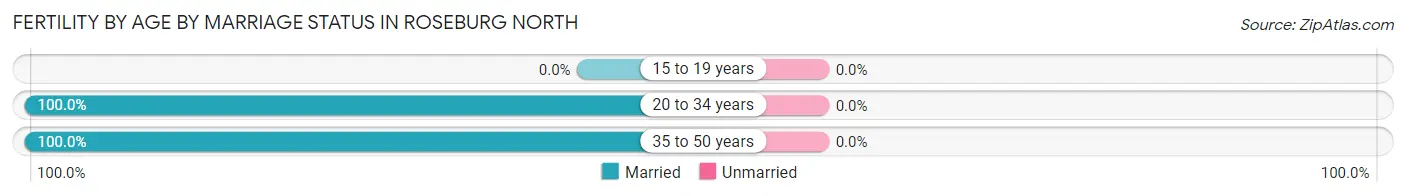
| Age Bracket | Married | Unmarried |
| 15 to 19 years | 0 (0.0%) | 0 (0.0%) |
| 20 to 34 years | 72 (100.0%) | 0 (0.0%) |
| 35 to 50 years | 10 (100.0%) | 0 (0.0%) |
| Total | 82 (100.0%) | 0 (0.0%) |
Fertility by Education in Roseburg North
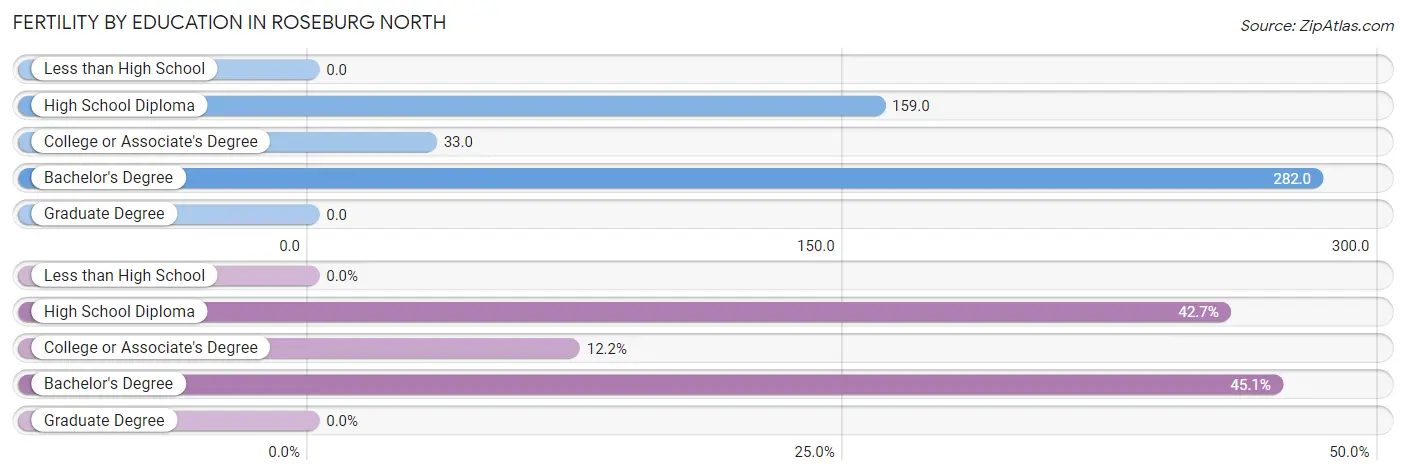
| Educational Attainment | Women with Births | Births / 1,000 Women |
| Less than High School | 0 (0.0%) | 0.0 |
| High School Diploma | 35 (42.7%) | 159.0 |
| College or Associate's Degree | 10 (12.2%) | 33.0 |
| Bachelor's Degree | 37 (45.1%) | 282.0 |
| Graduate Degree | 0 (0.0%) | 0.0 |
| Total | 82 (100.0%) | 106.0 |
Fertility by Education by Marriage Status in Roseburg North
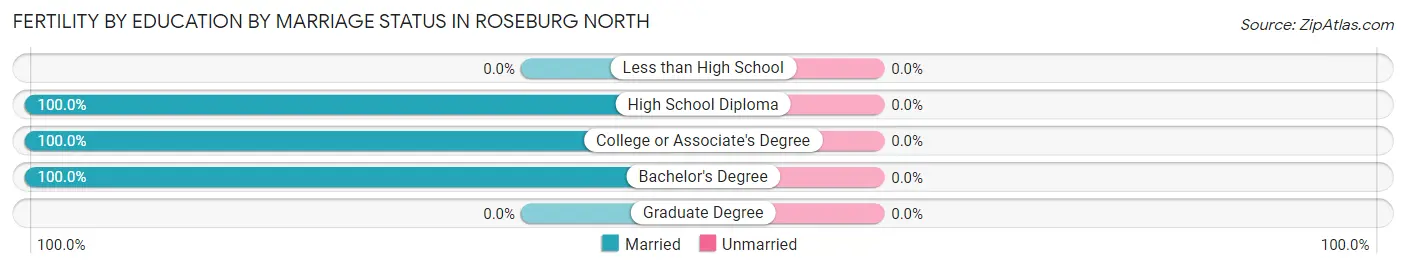
| Educational Attainment | Married | Unmarried |
| Less than High School | 0 (0.0%) | 0 (0.0%) |
| High School Diploma | 35 (100.0%) | 0 (0.0%) |
| College or Associate's Degree | 10 (100.0%) | 0 (0.0%) |
| Bachelor's Degree | 37 (100.0%) | 0 (0.0%) |
| Graduate Degree | 0 (0.0%) | 0 (0.0%) |
| Total | 82 (100.0%) | 0 (0.0%) |
Employment Characteristics in Roseburg North
Employment by Class of Employer in Roseburg North
Among the 1,564 employed individuals in Roseburg North, private company employees (957 | 61.2%), self-employed (not incorporated) (167 | 10.7%), and federal government employees (152 | 9.7%) make up the most common classes of employment.
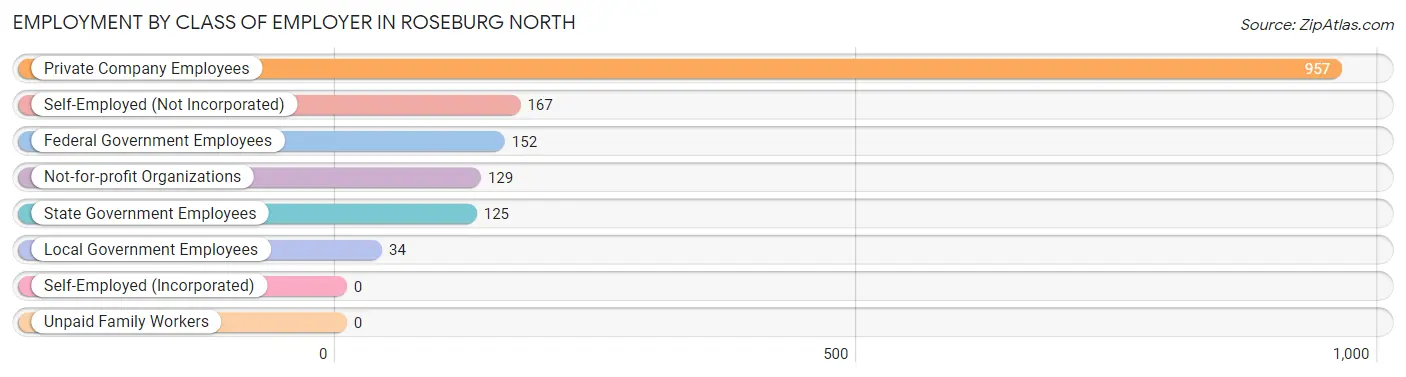
| Employer Class | # Employees | % Employees |
| Private Company Employees | 957 | 61.2% |
| Self-Employed (Incorporated) | 0 | 0.0% |
| Self-Employed (Not Incorporated) | 167 | 10.7% |
| Not-for-profit Organizations | 129 | 8.3% |
| Local Government Employees | 34 | 2.2% |
| State Government Employees | 125 | 8.0% |
| Federal Government Employees | 152 | 9.7% |
| Unpaid Family Workers | 0 | 0.0% |
| Total | 1,564 | 100.0% |
Employment Status by Age in Roseburg North
According to the labor force statistics for Roseburg North, out of the total population over 16 years of age (3,767), 45.7% or 1,722 individuals are in the labor force, with 8.1% or 139 of them unemployed. The age group with the highest labor force participation rate is 35 to 44 years, with 93.4% or 422 individuals in the labor force. Within the labor force, the 65 to 74 years age range has the highest percentage of unemployed individuals, with 31.5% or 35 of them being unemployed.
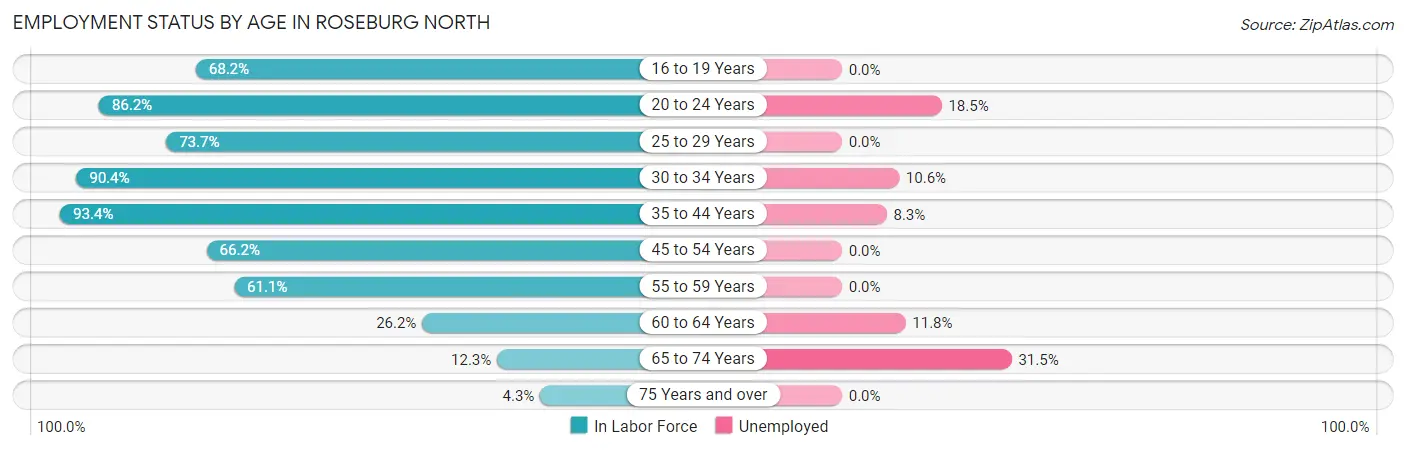
| Age Bracket | In Labor Force | Unemployed |
| 16 to 19 Years | 15 (68.2%) | 0 (0.0%) |
| 20 to 24 Years | 249 (86.2%) | 46 (18.5%) |
| 25 to 29 Years | 233 (73.7%) | 0 (0.0%) |
| 30 to 34 Years | 104 (90.4%) | 11 (10.6%) |
| 35 to 44 Years | 422 (93.4%) | 35 (8.3%) |
| 45 to 54 Years | 274 (66.2%) | 0 (0.0%) |
| 55 to 59 Years | 182 (61.1%) | 0 (0.0%) |
| 60 to 64 Years | 110 (26.2%) | 13 (11.8%) |
| 65 to 74 Years | 111 (12.3%) | 35 (31.5%) |
| 75 Years and over | 23 (4.3%) | 0 (0.0%) |
| Total | 1,722 (45.7%) | 139 (8.1%) |
Employment Status by Educational Attainment in Roseburg North
According to labor force statistics for Roseburg North, 65.8% of individuals (1,326) out of the total population between 25 and 64 years of age (2,015) are in the labor force, with 4.5% or 60 of them being unemployed. The group with the highest labor force participation rate are those with the educational attainment of bachelor's degree or higher, with 92.2% or 270 individuals in the labor force. Within the labor force, individuals with bachelor's degree or higher education have the highest percentage of unemployment, with 9.6% or 26 of them being unemployed.
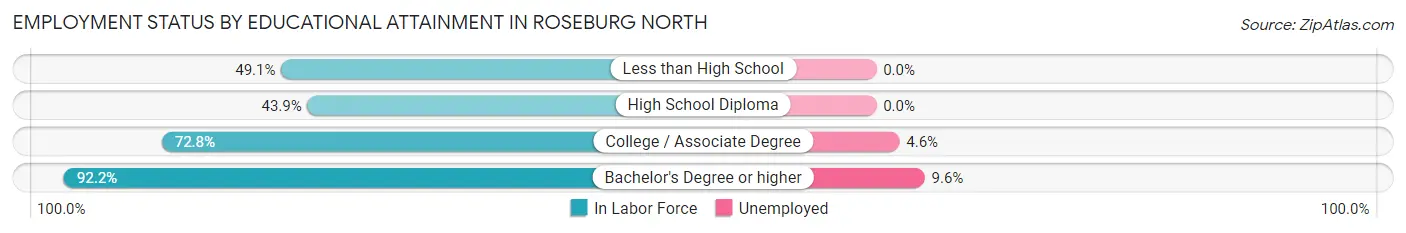
| Educational Attainment | In Labor Force | Unemployed |
| Less than High School | 108 (49.1%) | 0 (0.0%) |
| High School Diploma | 222 (43.9%) | 0 (0.0%) |
| College / Associate Degree | 725 (72.8%) | 46 (4.6%) |
| Bachelor's Degree or higher | 270 (92.2%) | 28 (9.6%) |
| Total | 1,326 (65.8%) | 91 (4.5%) |
Employment Occupations by Sex in Roseburg North
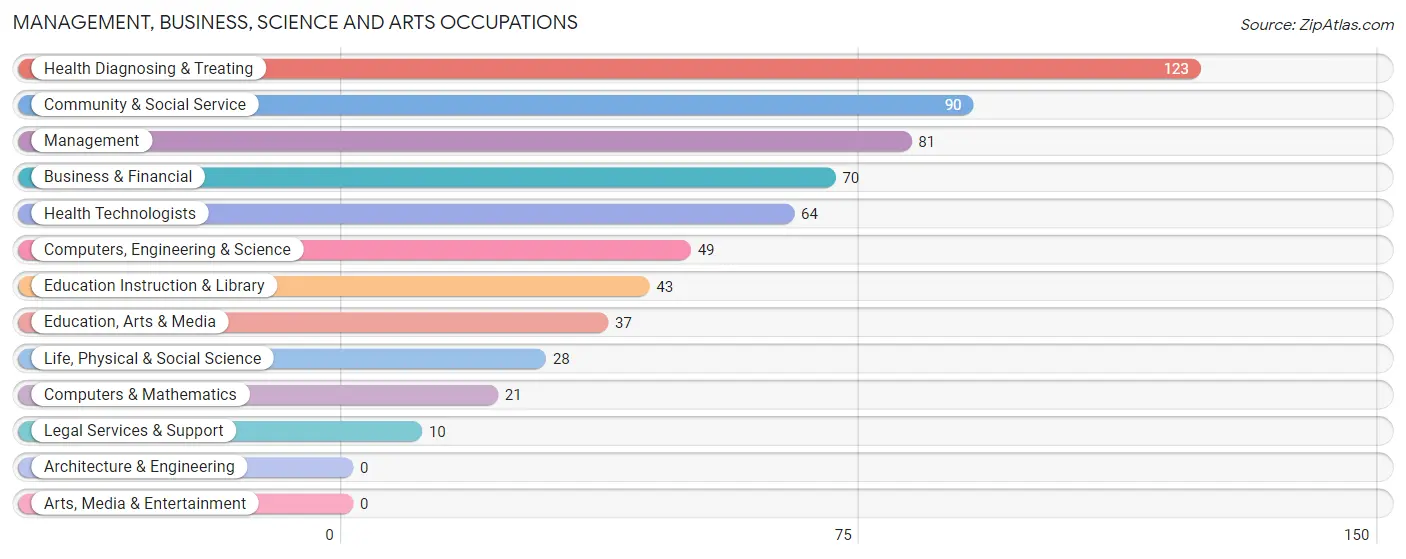
Management, Business, Science and Arts Occupations
The most common Management, Business, Science and Arts occupations in Roseburg North are Health Diagnosing & Treating (123 | 7.8%), Community & Social Service (90 | 5.7%), Management (81 | 5.1%), Business & Financial (70 | 4.4%), and Health Technologists (64 | 4.0%).
Management, Business, Science and Arts Occupations by Sex
Within the Management, Business, Science and Arts occupations in Roseburg North, the most male-oriented occupations are Computers & Mathematics (100.0%), Legal Services & Support (100.0%), and Management (56.8%), while the most female-oriented occupations are Life, Physical & Social Science (100.0%), Education, Arts & Media (100.0%), and Education Instruction & Library (100.0%).
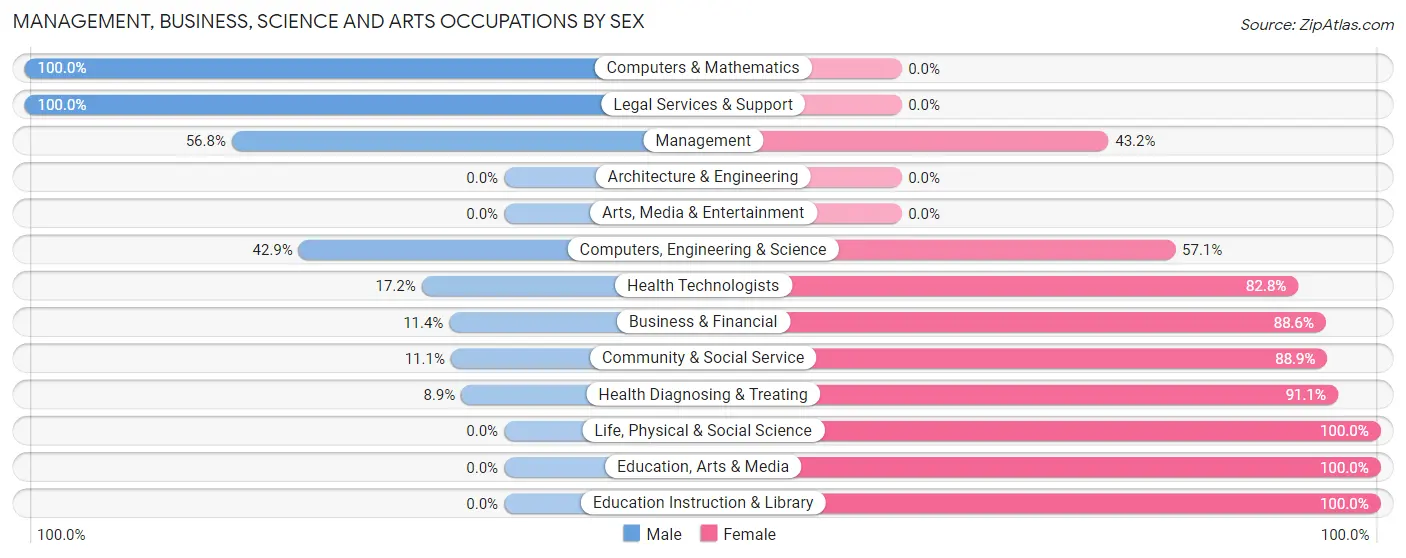
| Occupation | Male | Female |
| Management | 46 (56.8%) | 35 (43.2%) |
| Business & Financial | 8 (11.4%) | 62 (88.6%) |
| Computers, Engineering & Science | 21 (42.9%) | 28 (57.1%) |
| Computers & Mathematics | 21 (100.0%) | 0 (0.0%) |
| Architecture & Engineering | 0 (0.0%) | 0 (0.0%) |
| Life, Physical & Social Science | 0 (0.0%) | 28 (100.0%) |
| Community & Social Service | 10 (11.1%) | 80 (88.9%) |
| Education, Arts & Media | 0 (0.0%) | 37 (100.0%) |
| Legal Services & Support | 10 (100.0%) | 0 (0.0%) |
| Education Instruction & Library | 0 (0.0%) | 43 (100.0%) |
| Arts, Media & Entertainment | 0 (0.0%) | 0 (0.0%) |
| Health Diagnosing & Treating | 11 (8.9%) | 112 (91.1%) |
| Health Technologists | 11 (17.2%) | 53 (82.8%) |
| Total (Category) | 96 (23.2%) | 317 (76.8%) |
| Total (Overall) | 704 (44.5%) | 879 (55.5%) |
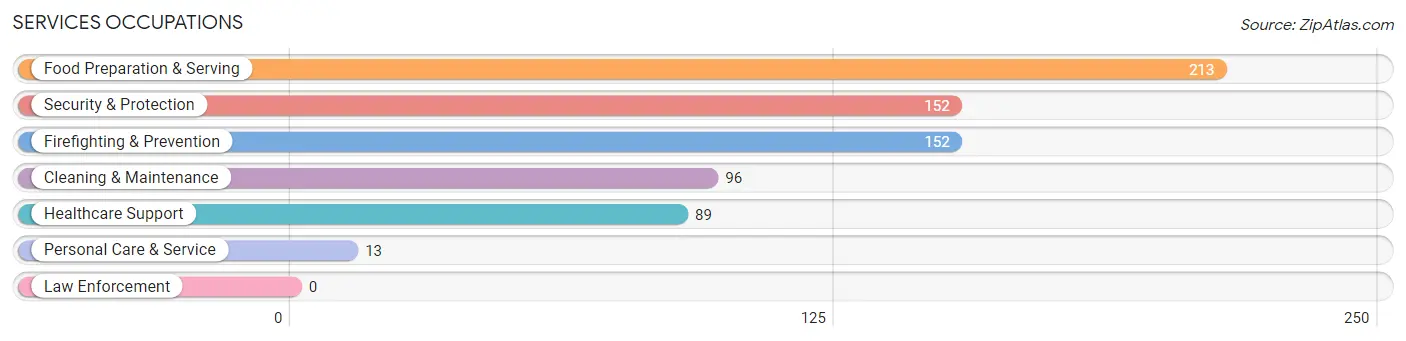
Services Occupations
The most common Services occupations in Roseburg North are Food Preparation & Serving (213 | 13.5%), Security & Protection (152 | 9.6%), Firefighting & Prevention (152 | 9.6%), Cleaning & Maintenance (96 | 6.1%), and Healthcare Support (89 | 5.6%).
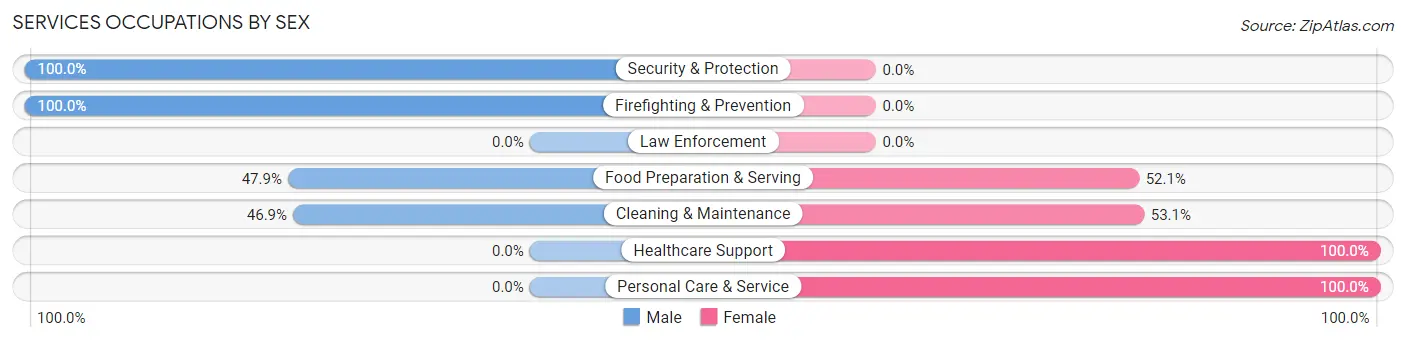
Services Occupations by Sex
Within the Services occupations in Roseburg North, the most male-oriented occupations are Security & Protection (100.0%), Firefighting & Prevention (100.0%), and Food Preparation & Serving (47.9%), while the most female-oriented occupations are Healthcare Support (100.0%), Personal Care & Service (100.0%), and Cleaning & Maintenance (53.1%).
| Occupation | Male | Female |
| Healthcare Support | 0 (0.0%) | 89 (100.0%) |
| Security & Protection | 152 (100.0%) | 0 (0.0%) |
| Firefighting & Prevention | 152 (100.0%) | 0 (0.0%) |
| Law Enforcement | 0 (0.0%) | 0 (0.0%) |
| Food Preparation & Serving | 102 (47.9%) | 111 (52.1%) |
| Cleaning & Maintenance | 45 (46.9%) | 51 (53.1%) |
| Personal Care & Service | 0 (0.0%) | 13 (100.0%) |
| Total (Category) | 299 (53.1%) | 264 (46.9%) |
| Total (Overall) | 704 (44.5%) | 879 (55.5%) |
Sales and Office Occupations
The most common Sales and Office occupations in Roseburg North are Sales & Related (222 | 14.0%), and Office & Administration (156 | 9.9%).
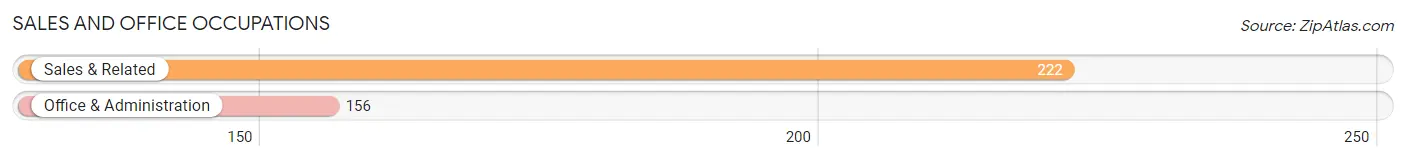
Sales and Office Occupations by Sex
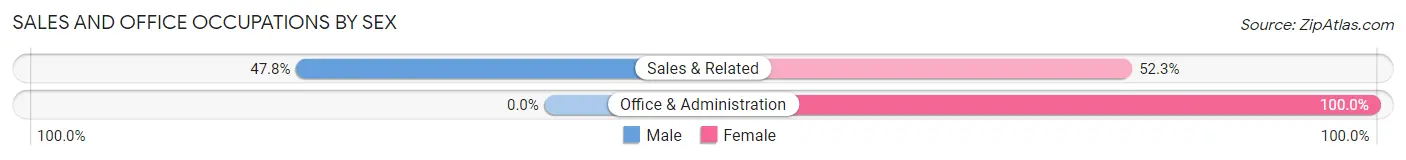
| Occupation | Male | Female |
| Sales & Related | 106 (47.7%) | 116 (52.2%) |
| Office & Administration | 0 (0.0%) | 156 (100.0%) |
| Total (Category) | 106 (28.0%) | 272 (72.0%) |
| Total (Overall) | 704 (44.5%) | 879 (55.5%) |
Natural Resources, Construction and Maintenance Occupations
The most common Natural Resources, Construction and Maintenance occupations in Roseburg North are Installation, Maintenance & Repair (41 | 2.6%), and Construction & Extraction (14 | 0.9%).
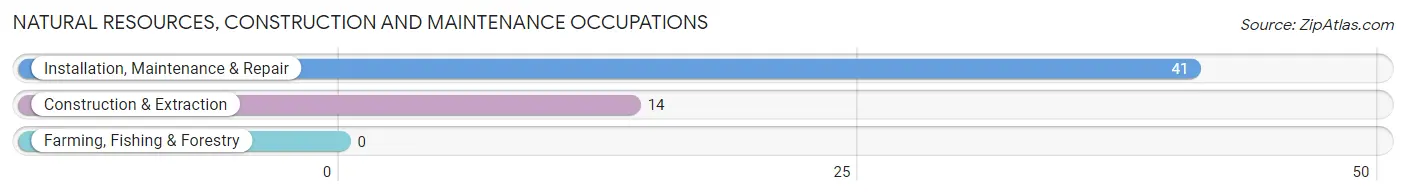
Natural Resources, Construction and Maintenance Occupations by Sex
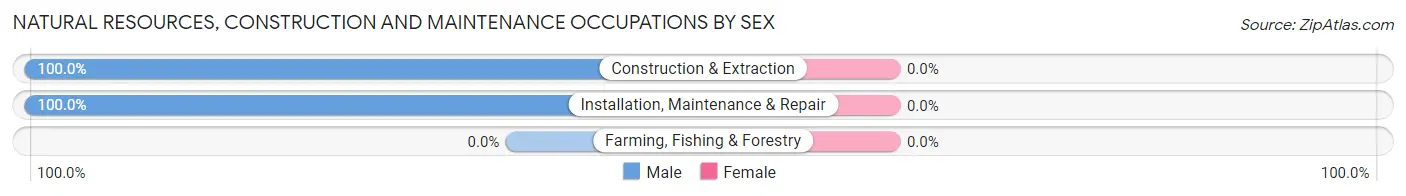
| Occupation | Male | Female |
| Farming, Fishing & Forestry | 0 (0.0%) | 0 (0.0%) |
| Construction & Extraction | 14 (100.0%) | 0 (0.0%) |
| Installation, Maintenance & Repair | 41 (100.0%) | 0 (0.0%) |
| Total (Category) | 55 (100.0%) | 0 (0.0%) |
| Total (Overall) | 704 (44.5%) | 879 (55.5%) |
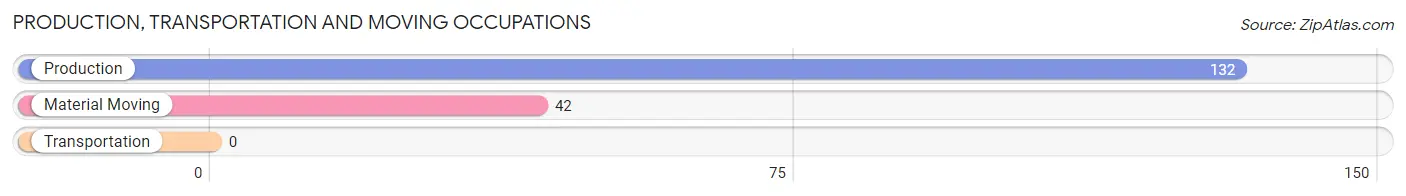
Production, Transportation and Moving Occupations
The most common Production, Transportation and Moving occupations in Roseburg North are Production (132 | 8.3%), and Material Moving (42 | 2.6%).
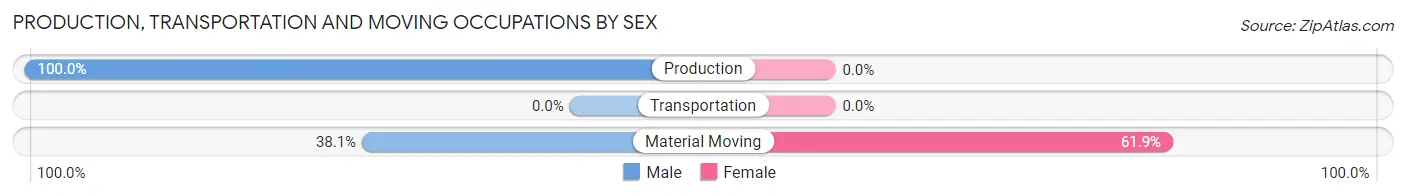
Production, Transportation and Moving Occupations by Sex
| Occupation | Male | Female |
| Production | 132 (100.0%) | 0 (0.0%) |
| Transportation | 0 (0.0%) | 0 (0.0%) |
| Material Moving | 16 (38.1%) | 26 (61.9%) |
| Total (Category) | 148 (85.1%) | 26 (14.9%) |
| Total (Overall) | 704 (44.5%) | 879 (55.5%) |
Employment Industries by Sex in Roseburg North
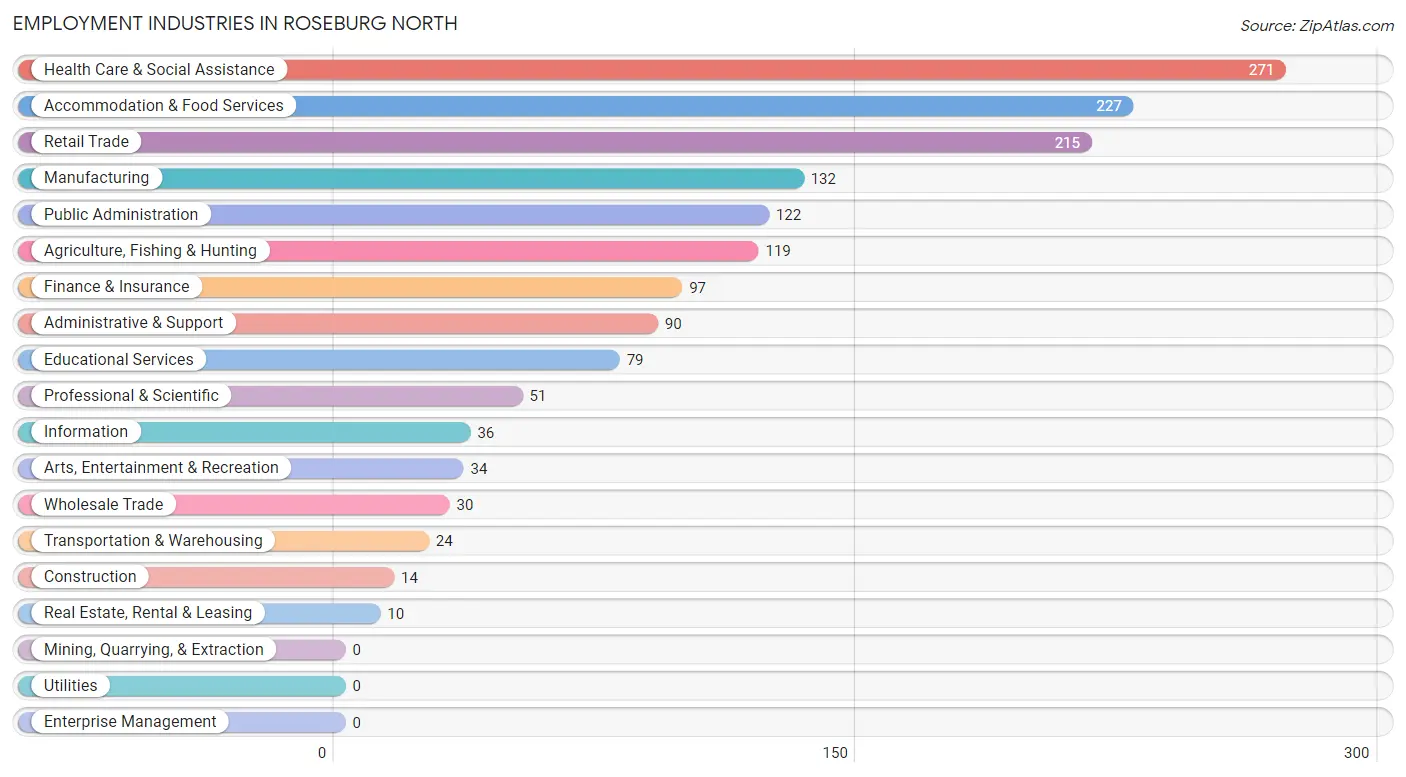
Employment Industries in Roseburg North
The major employment industries in Roseburg North include Health Care & Social Assistance (271 | 17.1%), Accommodation & Food Services (227 | 14.3%), Retail Trade (215 | 13.6%), Manufacturing (132 | 8.3%), and Public Administration (122 | 7.7%).
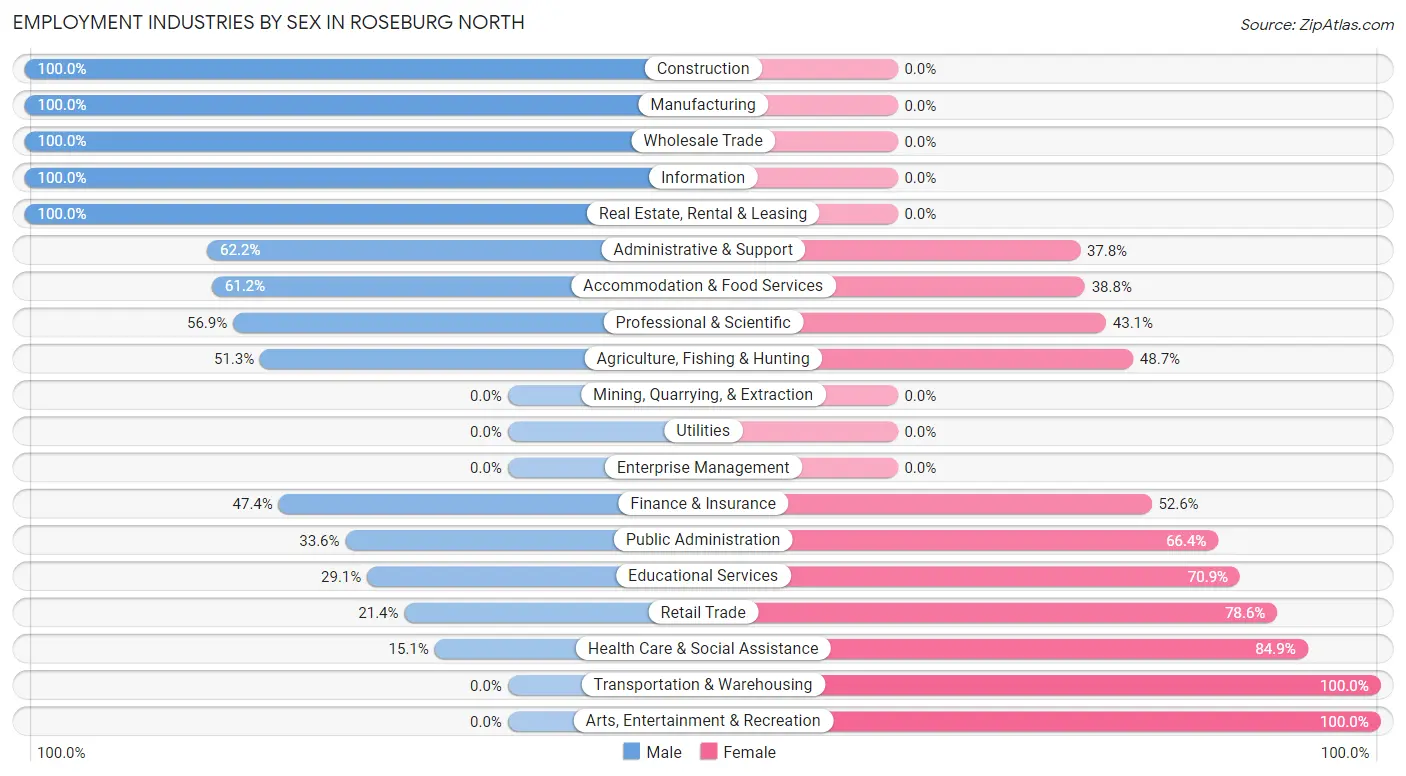
Employment Industries by Sex in Roseburg North
The Roseburg North industries that see more men than women are Construction (100.0%), Manufacturing (100.0%), and Wholesale Trade (100.0%), whereas the industries that tend to have a higher number of women are Transportation & Warehousing (100.0%), Arts, Entertainment & Recreation (100.0%), and Health Care & Social Assistance (84.9%).
| Industry | Male | Female |
| Agriculture, Fishing & Hunting | 61 (51.3%) | 58 (48.7%) |
| Mining, Quarrying, & Extraction | 0 (0.0%) | 0 (0.0%) |
| Construction | 14 (100.0%) | 0 (0.0%) |
| Manufacturing | 132 (100.0%) | 0 (0.0%) |
| Wholesale Trade | 30 (100.0%) | 0 (0.0%) |
| Retail Trade | 46 (21.4%) | 169 (78.6%) |
| Transportation & Warehousing | 0 (0.0%) | 24 (100.0%) |
| Utilities | 0 (0.0%) | 0 (0.0%) |
| Information | 36 (100.0%) | 0 (0.0%) |
| Finance & Insurance | 46 (47.4%) | 51 (52.6%) |
| Real Estate, Rental & Leasing | 10 (100.0%) | 0 (0.0%) |
| Professional & Scientific | 29 (56.9%) | 22 (43.1%) |
| Enterprise Management | 0 (0.0%) | 0 (0.0%) |
| Administrative & Support | 56 (62.2%) | 34 (37.8%) |
| Educational Services | 23 (29.1%) | 56 (70.9%) |
| Health Care & Social Assistance | 41 (15.1%) | 230 (84.9%) |
| Arts, Entertainment & Recreation | 0 (0.0%) | 34 (100.0%) |
| Accommodation & Food Services | 139 (61.2%) | 88 (38.8%) |
| Public Administration | 41 (33.6%) | 81 (66.4%) |
| Total | 704 (44.5%) | 879 (55.5%) |
Education in Roseburg North
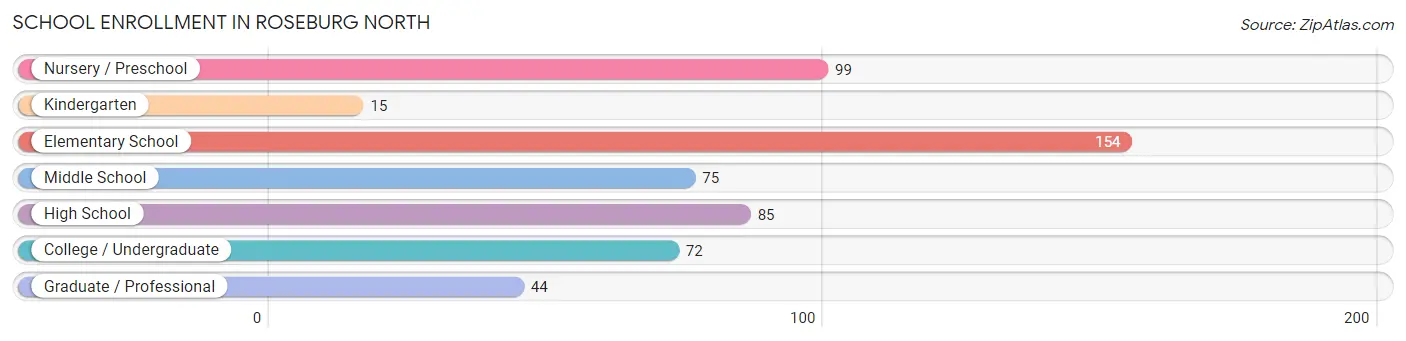
School Enrollment in Roseburg North
The most common levels of schooling among the 544 students in Roseburg North are elementary school (154 | 28.3%), nursery / preschool (99 | 18.2%), and high school (85 | 15.6%).
| School Level | # Students | % Students |
| Nursery / Preschool | 99 | 18.2% |
| Kindergarten | 15 | 2.8% |
| Elementary School | 154 | 28.3% |
| Middle School | 75 | 13.8% |
| High School | 85 | 15.6% |
| College / Undergraduate | 72 | 13.2% |
| Graduate / Professional | 44 | 8.1% |
| Total | 544 | 100.0% |
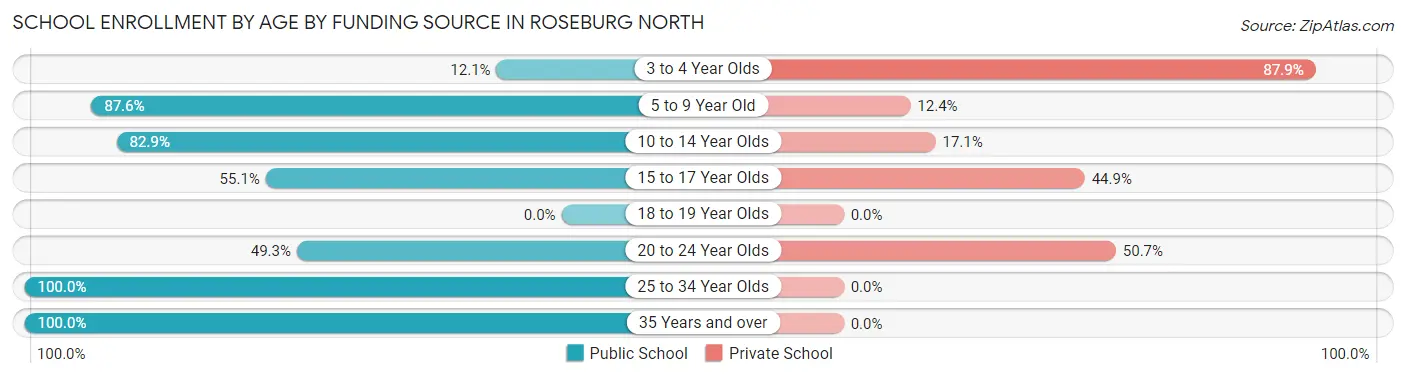
School Enrollment by Age by Funding Source in Roseburg North
Out of a total of 544 students who are enrolled in schools in Roseburg North, 185 (34.0%) attend a private institution, while the remaining 359 (66.0%) are enrolled in public schools. The age group of 3 to 4 year olds has the highest likelihood of being enrolled in private schools, with 87 (87.9% in the age bracket) enrolled. Conversely, the age group of 25 to 34 year olds has the lowest likelihood of being enrolled in a private school, with 14 (100.0% in the age bracket) attending a public institution.
| Age Bracket | Public School | Private School |
| 3 to 4 Year Olds | 12 (12.1%) | 87 (87.9%) |
| 5 to 9 Year Old | 148 (87.6%) | 21 (12.4%) |
| 10 to 14 Year Olds | 92 (82.9%) | 19 (17.1%) |
| 15 to 17 Year Olds | 27 (55.1%) | 22 (44.9%) |
| 18 to 19 Year Olds | 0 (0.0%) | 0 (0.0%) |
| 20 to 24 Year Olds | 35 (49.3%) | 36 (50.7%) |
| 25 to 34 Year Olds | 14 (100.0%) | 0 (0.0%) |
| 35 Years and over | 31 (100.0%) | 0 (0.0%) |
| Total | 359 (66.0%) | 185 (34.0%) |
Educational Attainment by Field of Study in Roseburg North
Education (116 | 15.5%), bio, nature & agricultural (84 | 11.3%), engineering (82 | 11.0%), psychology (80 | 10.7%), and literature & languages (77 | 10.3%) are the most common fields of study among 746 individuals in Roseburg North who have obtained a bachelor's degree or higher.
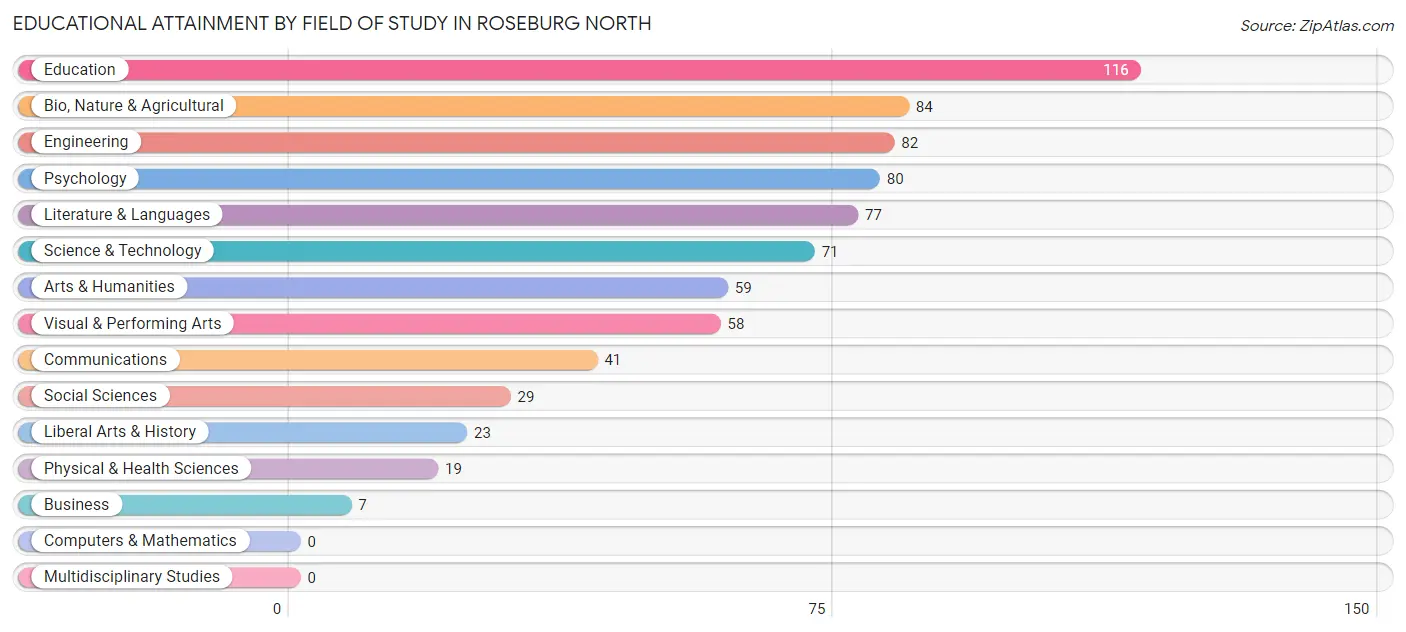
| Field of Study | # Graduates | % Graduates |
| Computers & Mathematics | 0 | 0.0% |
| Bio, Nature & Agricultural | 84 | 11.3% |
| Physical & Health Sciences | 19 | 2.5% |
| Psychology | 80 | 10.7% |
| Social Sciences | 29 | 3.9% |
| Engineering | 82 | 11.0% |
| Multidisciplinary Studies | 0 | 0.0% |
| Science & Technology | 71 | 9.5% |
| Business | 7 | 0.9% |
| Education | 116 | 15.5% |
| Literature & Languages | 77 | 10.3% |
| Liberal Arts & History | 23 | 3.1% |
| Visual & Performing Arts | 58 | 7.8% |
| Communications | 41 | 5.5% |
| Arts & Humanities | 59 | 7.9% |
| Total | 746 | 100.0% |
Transportation & Commute in Roseburg North
Vehicle Availability by Sex in Roseburg North
The most prevalent vehicle ownership categories in Roseburg North are males with 2 vehicles (435, accounting for 61.8%) and females with 2 vehicles (430, making up 50.6%).
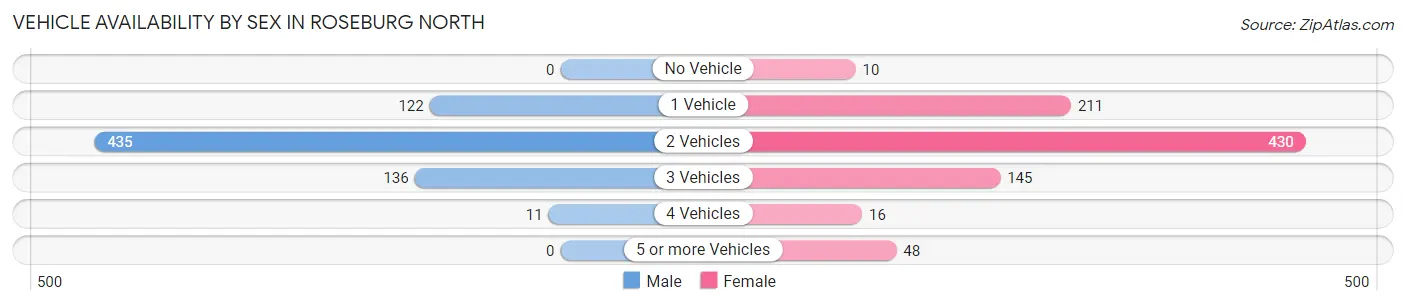
| Vehicles Available | Male | Female |
| No Vehicle | 0 (0.0%) | 10 (1.2%) |
| 1 Vehicle | 122 (17.3%) | 211 (24.5%) |
| 2 Vehicles | 435 (61.8%) | 430 (50.0%) |
| 3 Vehicles | 136 (19.3%) | 145 (16.9%) |
| 4 Vehicles | 11 (1.6%) | 16 (1.9%) |
| 5 or more Vehicles | 0 (0.0%) | 48 (5.6%) |
| Total | 704 (100.0%) | 860 (100.0%) |
Commute Time in Roseburg North
The most frequently occuring commute durations in Roseburg North are 10 to 14 minutes (471 commuters, 32.0%), 5 to 9 minutes (342 commuters, 23.2%), and 15 to 19 minutes (322 commuters, 21.9%).
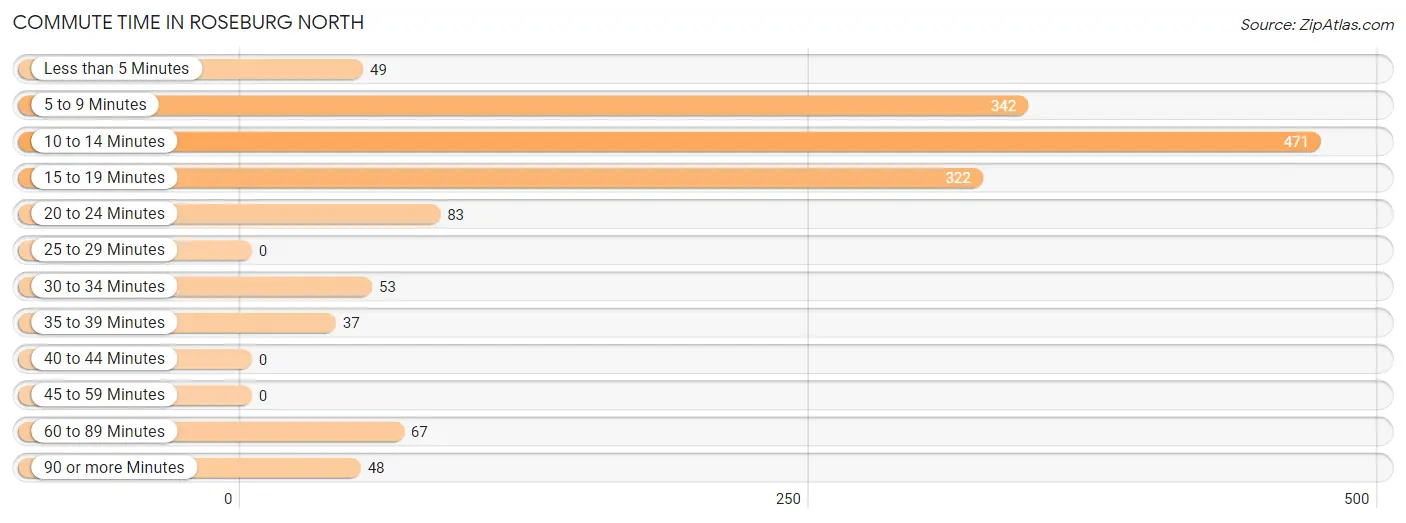
| Commute Time | # Commuters | % Commuters |
| Less than 5 Minutes | 49 | 3.3% |
| 5 to 9 Minutes | 342 | 23.2% |
| 10 to 14 Minutes | 471 | 32.0% |
| 15 to 19 Minutes | 322 | 21.9% |
| 20 to 24 Minutes | 83 | 5.6% |
| 25 to 29 Minutes | 0 | 0.0% |
| 30 to 34 Minutes | 53 | 3.6% |
| 35 to 39 Minutes | 37 | 2.5% |
| 40 to 44 Minutes | 0 | 0.0% |
| 45 to 59 Minutes | 0 | 0.0% |
| 60 to 89 Minutes | 67 | 4.5% |
| 90 or more Minutes | 48 | 3.3% |
Commute Time by Sex in Roseburg North
The most common commute times in Roseburg North are 10 to 14 minutes (238 commuters, 34.5%) for males and 10 to 14 minutes (233 commuters, 29.8%) for females.
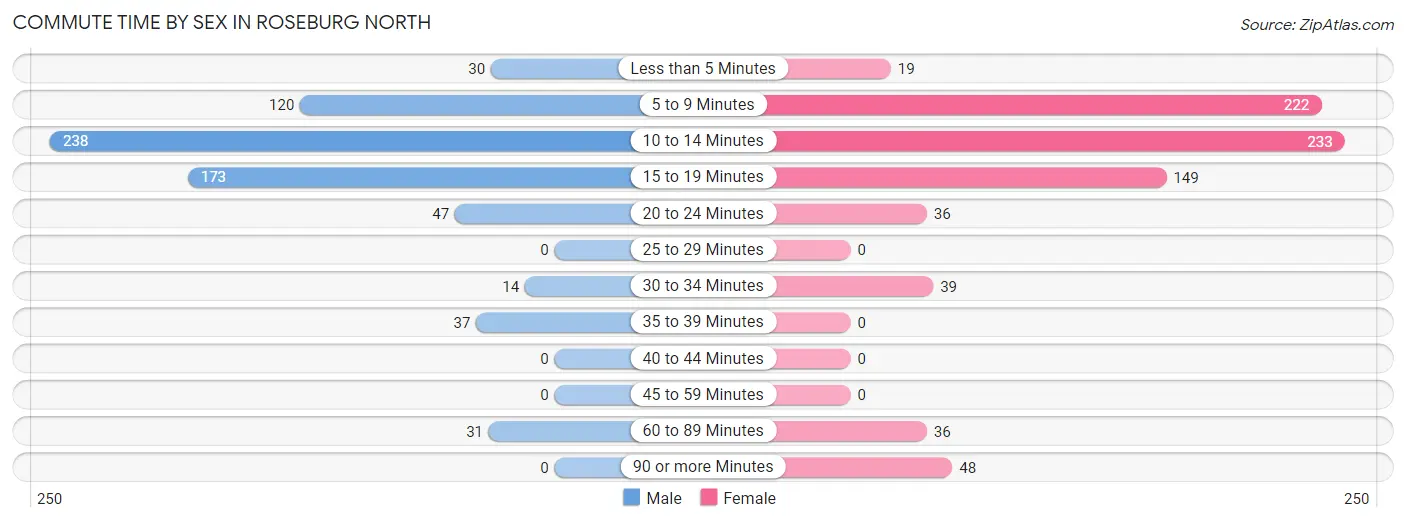
| Commute Time | Male | Female |
| Less than 5 Minutes | 30 (4.3%) | 19 (2.4%) |
| 5 to 9 Minutes | 120 (17.4%) | 222 (28.4%) |
| 10 to 14 Minutes | 238 (34.5%) | 233 (29.8%) |
| 15 to 19 Minutes | 173 (25.1%) | 149 (19.1%) |
| 20 to 24 Minutes | 47 (6.8%) | 36 (4.6%) |
| 25 to 29 Minutes | 0 (0.0%) | 0 (0.0%) |
| 30 to 34 Minutes | 14 (2.0%) | 39 (5.0%) |
| 35 to 39 Minutes | 37 (5.4%) | 0 (0.0%) |
| 40 to 44 Minutes | 0 (0.0%) | 0 (0.0%) |
| 45 to 59 Minutes | 0 (0.0%) | 0 (0.0%) |
| 60 to 89 Minutes | 31 (4.5%) | 36 (4.6%) |
| 90 or more Minutes | 0 (0.0%) | 48 (6.1%) |
Time of Departure to Work by Sex in Roseburg North
The most frequent times of departure to work in Roseburg North are 9:00 AM to 9:59 AM (119, 17.2%) for males and 4:00 PM to 11:59 PM (144, 18.4%) for females.
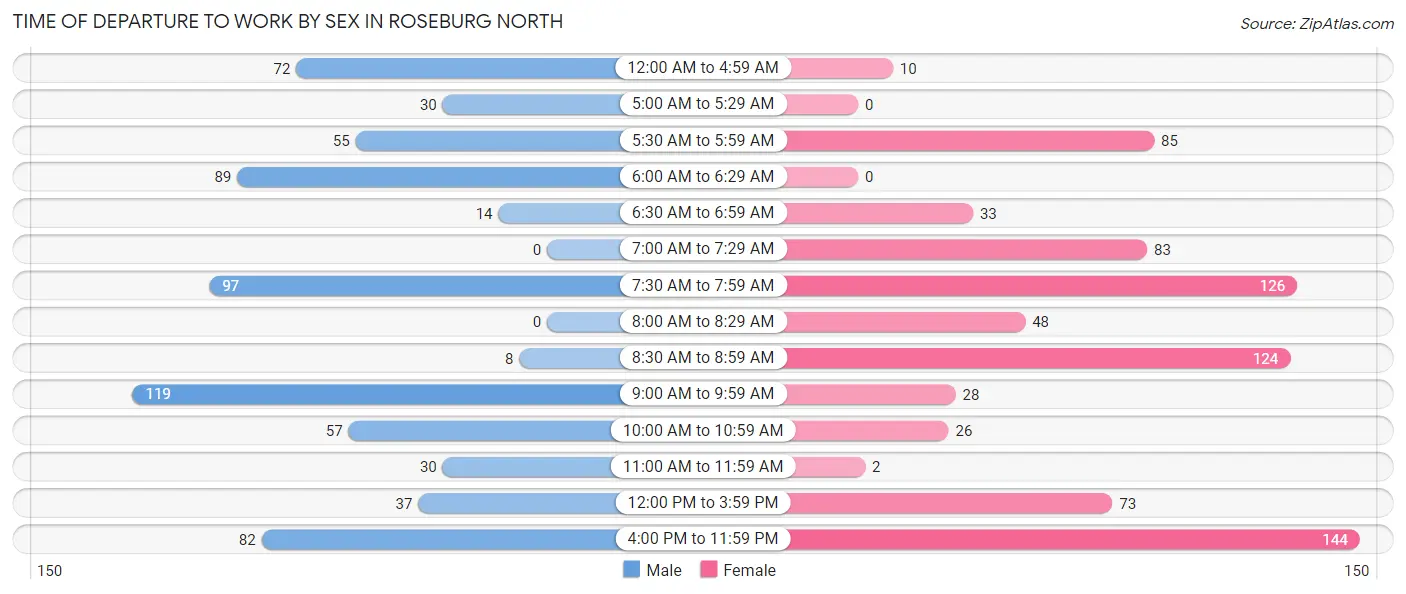
| Time of Departure | Male | Female |
| 12:00 AM to 4:59 AM | 72 (10.4%) | 10 (1.3%) |
| 5:00 AM to 5:29 AM | 30 (4.3%) | 0 (0.0%) |
| 5:30 AM to 5:59 AM | 55 (8.0%) | 85 (10.9%) |
| 6:00 AM to 6:29 AM | 89 (12.9%) | 0 (0.0%) |
| 6:30 AM to 6:59 AM | 14 (2.0%) | 33 (4.2%) |
| 7:00 AM to 7:29 AM | 0 (0.0%) | 83 (10.6%) |
| 7:30 AM to 7:59 AM | 97 (14.1%) | 126 (16.1%) |
| 8:00 AM to 8:29 AM | 0 (0.0%) | 48 (6.1%) |
| 8:30 AM to 8:59 AM | 8 (1.2%) | 124 (15.9%) |
| 9:00 AM to 9:59 AM | 119 (17.2%) | 28 (3.6%) |
| 10:00 AM to 10:59 AM | 57 (8.3%) | 26 (3.3%) |
| 11:00 AM to 11:59 AM | 30 (4.3%) | 2 (0.3%) |
| 12:00 PM to 3:59 PM | 37 (5.4%) | 73 (9.3%) |
| 4:00 PM to 11:59 PM | 82 (11.9%) | 144 (18.4%) |
| Total | 690 (100.0%) | 782 (100.0%) |
Housing Occupancy in Roseburg North
Occupancy by Ownership in Roseburg North
Of the total 1,967 dwellings in Roseburg North, owner-occupied units account for 1,589 (80.8%), while renter-occupied units make up 378 (19.2%).
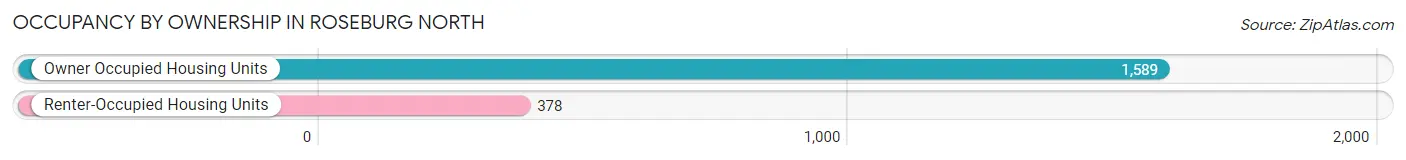
| Occupancy | # Housing Units | % Housing Units |
| Owner Occupied Housing Units | 1,589 | 80.8% |
| Renter-Occupied Housing Units | 378 | 19.2% |
| Total Occupied Housing Units | 1,967 | 100.0% |
Occupancy by Household Size in Roseburg North
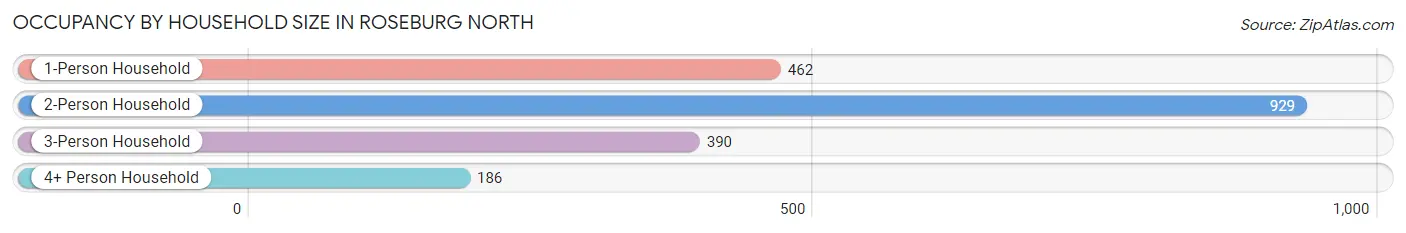
| Household Size | # Housing Units | % Housing Units |
| 1-Person Household | 462 | 23.5% |
| 2-Person Household | 929 | 47.2% |
| 3-Person Household | 390 | 19.8% |
| 4+ Person Household | 186 | 9.5% |
| Total Housing Units | 1,967 | 100.0% |
Occupancy by Ownership by Household Size in Roseburg North
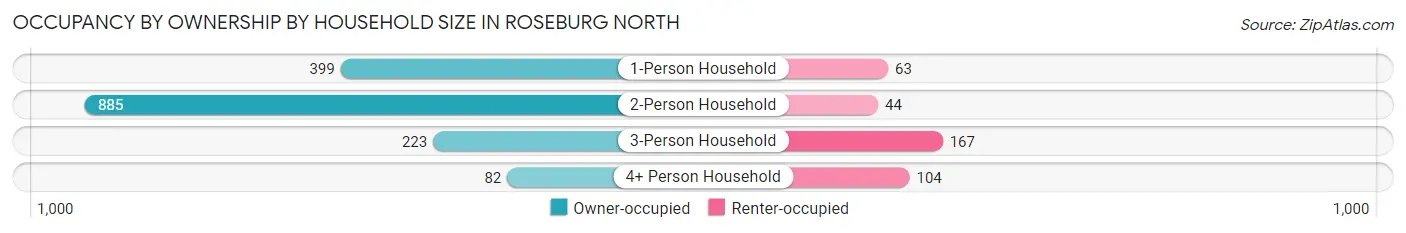
| Household Size | Owner-occupied | Renter-occupied |
| 1-Person Household | 399 (86.4%) | 63 (13.6%) |
| 2-Person Household | 885 (95.3%) | 44 (4.7%) |
| 3-Person Household | 223 (57.2%) | 167 (42.8%) |
| 4+ Person Household | 82 (44.1%) | 104 (55.9%) |
| Total Housing Units | 1,589 (80.8%) | 378 (19.2%) |
Occupancy by Educational Attainment in Roseburg North
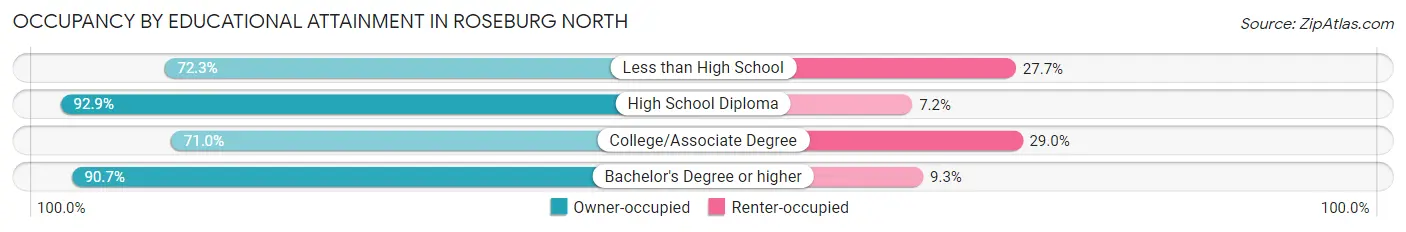
| Household Size | Owner-occupied | Renter-occupied |
| Less than High School | 107 (72.3%) | 41 (27.7%) |
| High School Diploma | 558 (92.8%) | 43 (7.1%) |
| College/Associate Degree | 651 (71.0%) | 266 (29.0%) |
| Bachelor's Degree or higher | 273 (90.7%) | 28 (9.3%) |
Occupancy by Age of Householder in Roseburg North
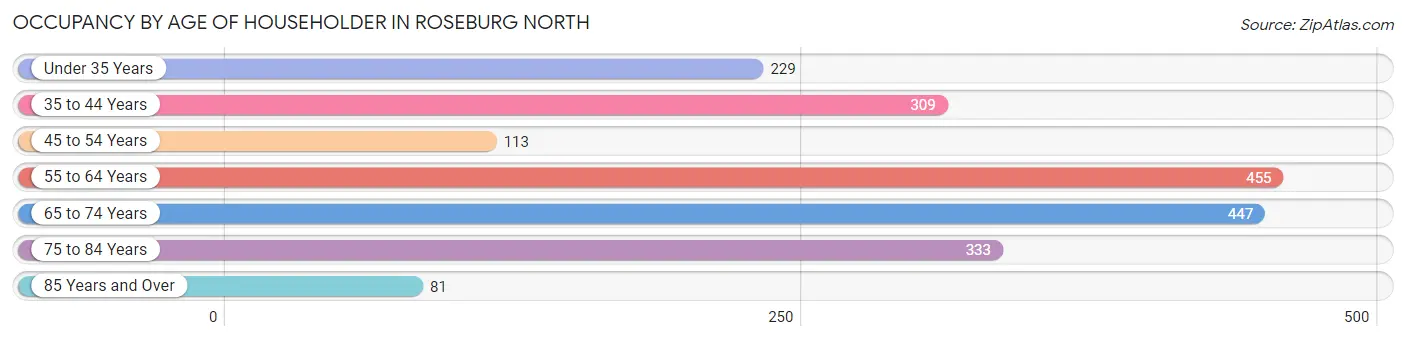
| Age Bracket | # Households | % Households |
| Under 35 Years | 229 | 11.6% |
| 35 to 44 Years | 309 | 15.7% |
| 45 to 54 Years | 113 | 5.7% |
| 55 to 64 Years | 455 | 23.1% |
| 65 to 74 Years | 447 | 22.7% |
| 75 to 84 Years | 333 | 16.9% |
| 85 Years and Over | 81 | 4.1% |
| Total | 1,967 | 100.0% |
Housing Finances in Roseburg North
Median Income by Occupancy in Roseburg North
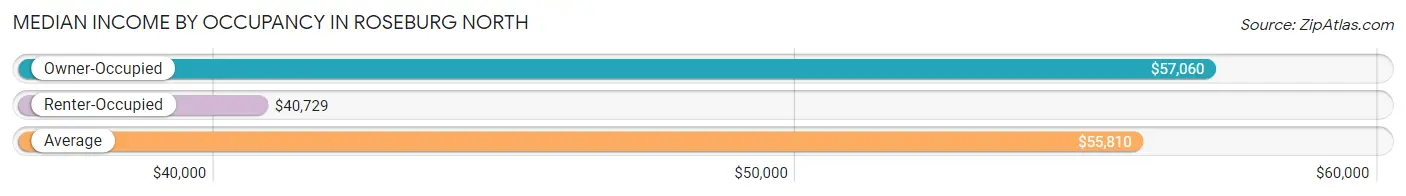
| Occupancy Type | # Households | Median Income |
| Owner-Occupied | 1,589 (80.8%) | $57,060 |
| Renter-Occupied | 378 (19.2%) | $40,729 |
| Average | 1,967 (100.0%) | $55,810 |
Occupancy by Householder Income Bracket in Roseburg North
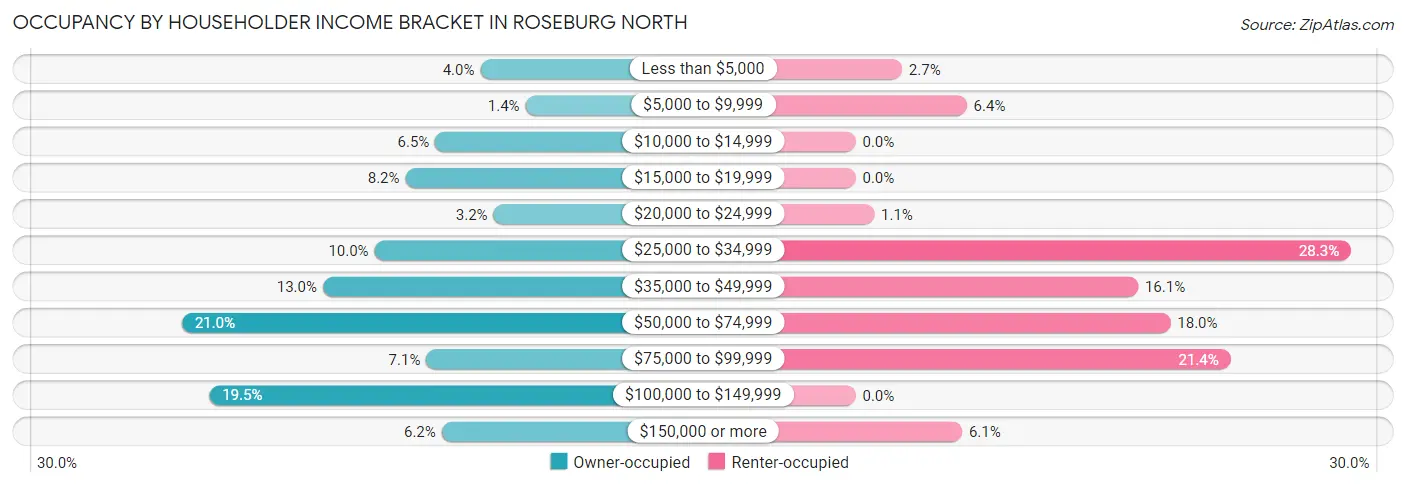
| Income Bracket | Owner-occupied | Renter-occupied |
| Less than $5,000 | 63 (4.0%) | 10 (2.6%) |
| $5,000 to $9,999 | 22 (1.4%) | 24 (6.4%) |
| $10,000 to $14,999 | 104 (6.5%) | 0 (0.0%) |
| $15,000 to $19,999 | 131 (8.2%) | 0 (0.0%) |
| $20,000 to $24,999 | 51 (3.2%) | 4 (1.1%) |
| $25,000 to $34,999 | 159 (10.0%) | 107 (28.3%) |
| $35,000 to $49,999 | 206 (13.0%) | 61 (16.1%) |
| $50,000 to $74,999 | 334 (21.0%) | 68 (18.0%) |
| $75,000 to $99,999 | 112 (7.0%) | 81 (21.4%) |
| $100,000 to $149,999 | 309 (19.5%) | 0 (0.0%) |
| $150,000 or more | 98 (6.2%) | 23 (6.1%) |
| Total | 1,589 (100.0%) | 378 (100.0%) |
Monthly Housing Cost Tiers in Roseburg North
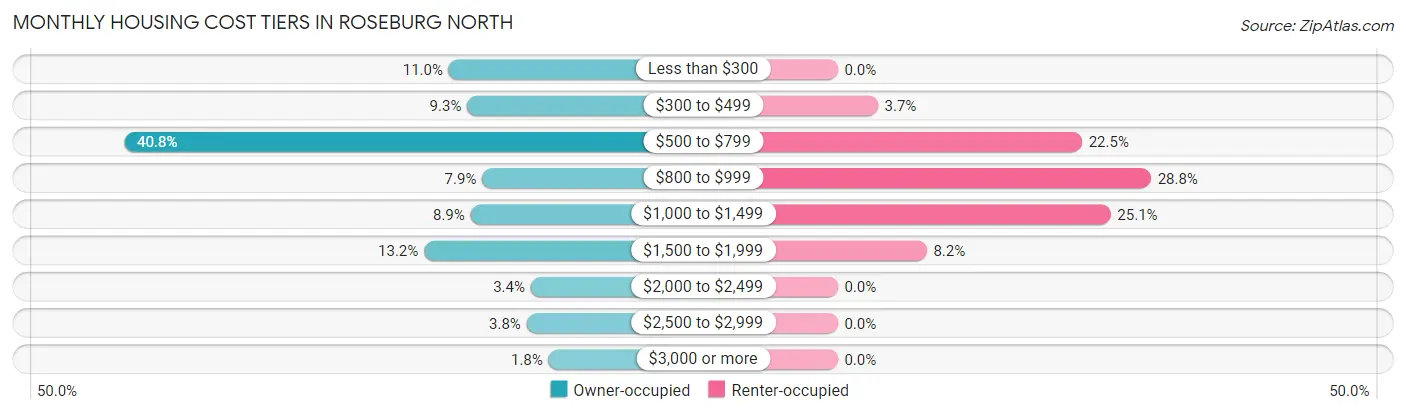
| Monthly Cost | Owner-occupied | Renter-occupied |
| Less than $300 | 174 (11.0%) | 0 (0.0%) |
| $300 to $499 | 147 (9.2%) | 14 (3.7%) |
| $500 to $799 | 649 (40.8%) | 85 (22.5%) |
| $800 to $999 | 125 (7.9%) | 109 (28.8%) |
| $1,000 to $1,499 | 142 (8.9%) | 95 (25.1%) |
| $1,500 to $1,999 | 210 (13.2%) | 31 (8.2%) |
| $2,000 to $2,499 | 54 (3.4%) | 0 (0.0%) |
| $2,500 to $2,999 | 60 (3.8%) | 0 (0.0%) |
| $3,000 or more | 28 (1.8%) | 0 (0.0%) |
| Total | 1,589 (100.0%) | 378 (100.0%) |
Physical Housing Characteristics in Roseburg North
Housing Structures in Roseburg North
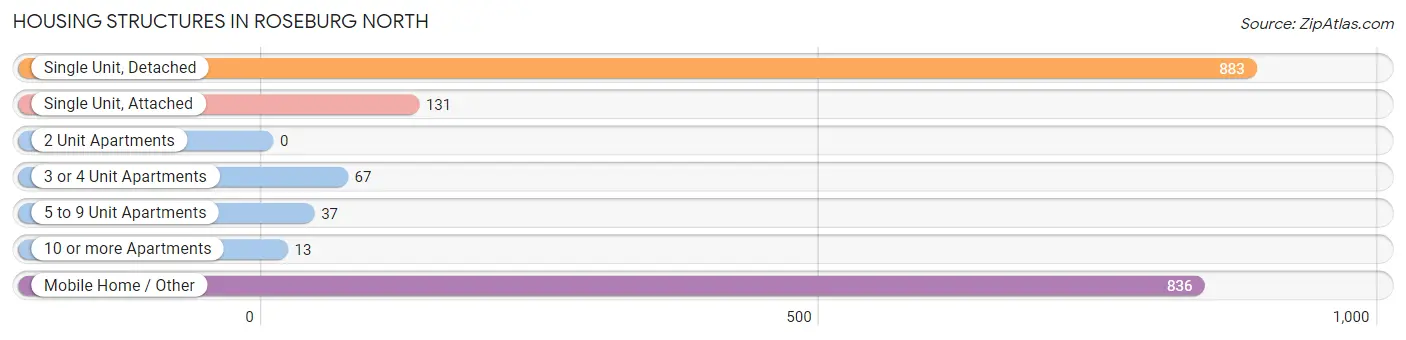
| Structure Type | # Housing Units | % Housing Units |
| Single Unit, Detached | 883 | 44.9% |
| Single Unit, Attached | 131 | 6.7% |
| 2 Unit Apartments | 0 | 0.0% |
| 3 or 4 Unit Apartments | 67 | 3.4% |
| 5 to 9 Unit Apartments | 37 | 1.9% |
| 10 or more Apartments | 13 | 0.7% |
| Mobile Home / Other | 836 | 42.5% |
| Total | 1,967 | 100.0% |
Housing Structures by Occupancy in Roseburg North
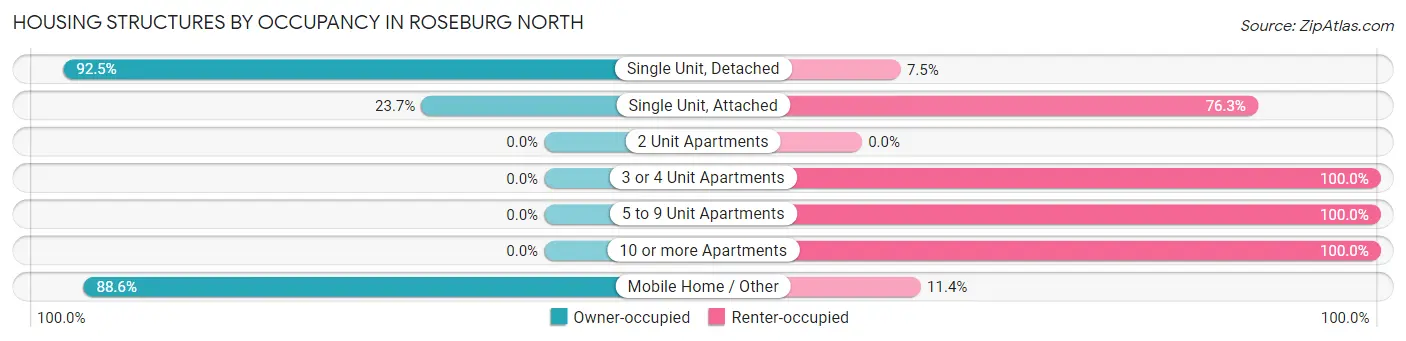
| Structure Type | Owner-occupied | Renter-occupied |
| Single Unit, Detached | 817 (92.5%) | 66 (7.5%) |
| Single Unit, Attached | 31 (23.7%) | 100 (76.3%) |
| 2 Unit Apartments | 0 (0.0%) | 0 (0.0%) |
| 3 or 4 Unit Apartments | 0 (0.0%) | 67 (100.0%) |
| 5 to 9 Unit Apartments | 0 (0.0%) | 37 (100.0%) |
| 10 or more Apartments | 0 (0.0%) | 13 (100.0%) |
| Mobile Home / Other | 741 (88.6%) | 95 (11.4%) |
| Total | 1,589 (80.8%) | 378 (19.2%) |
Housing Structures by Number of Rooms in Roseburg North
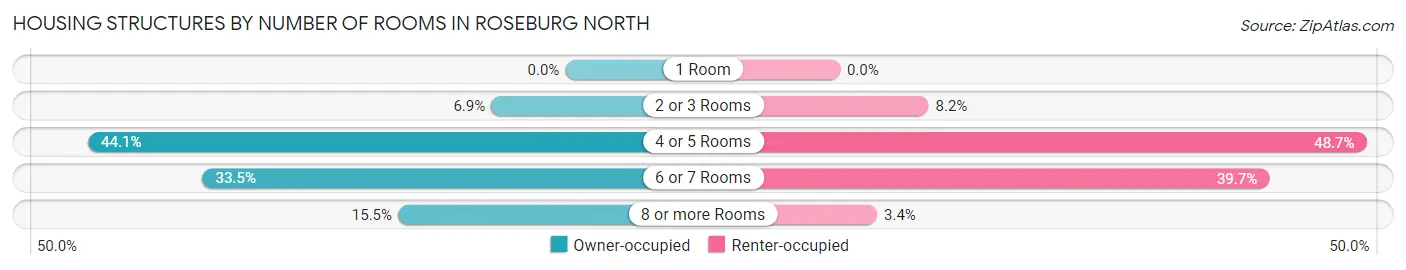
| Number of Rooms | Owner-occupied | Renter-occupied |
| 1 Room | 0 (0.0%) | 0 (0.0%) |
| 2 or 3 Rooms | 109 (6.9%) | 31 (8.2%) |
| 4 or 5 Rooms | 701 (44.1%) | 184 (48.7%) |
| 6 or 7 Rooms | 533 (33.5%) | 150 (39.7%) |
| 8 or more Rooms | 246 (15.5%) | 13 (3.4%) |
| Total | 1,589 (100.0%) | 378 (100.0%) |
Housing Structure by Heating Type in Roseburg North
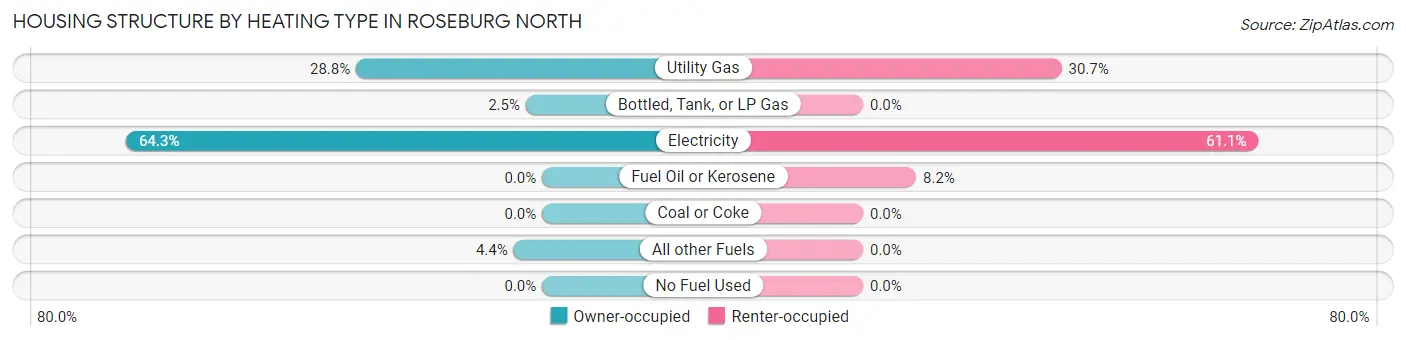
| Heating Type | Owner-occupied | Renter-occupied |
| Utility Gas | 457 (28.8%) | 116 (30.7%) |
| Bottled, Tank, or LP Gas | 40 (2.5%) | 0 (0.0%) |
| Electricity | 1,022 (64.3%) | 231 (61.1%) |
| Fuel Oil or Kerosene | 0 (0.0%) | 31 (8.2%) |
| Coal or Coke | 0 (0.0%) | 0 (0.0%) |
| All other Fuels | 70 (4.4%) | 0 (0.0%) |
| No Fuel Used | 0 (0.0%) | 0 (0.0%) |
| Total | 1,589 (100.0%) | 378 (100.0%) |
Household Vehicle Usage in Roseburg North
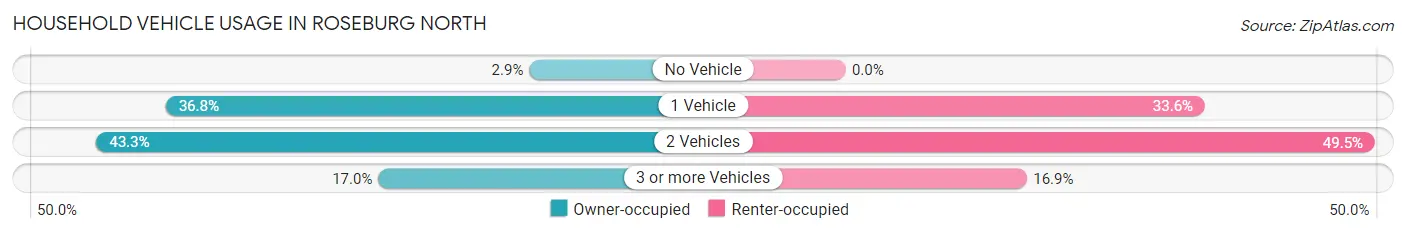
| Vehicles per Household | Owner-occupied | Renter-occupied |
| No Vehicle | 46 (2.9%) | 0 (0.0%) |
| 1 Vehicle | 585 (36.8%) | 127 (33.6%) |
| 2 Vehicles | 688 (43.3%) | 187 (49.5%) |
| 3 or more Vehicles | 270 (17.0%) | 64 (16.9%) |
| Total | 1,589 (100.0%) | 378 (100.0%) |
Real Estate & Mortgages in Roseburg North
Real Estate and Mortgage Overview in Roseburg North
| Characteristic | Without Mortgage | With Mortgage |
| Housing Units | 904 | 685 |
| Median Property Value | $33,100 | $335,600 |
| Median Household Income | $38,289 | $84 |
| Monthly Housing Costs | $560 | $28 |
| Real Estate Taxes | $262 | $14 |
Property Value by Mortgage Status in Roseburg North
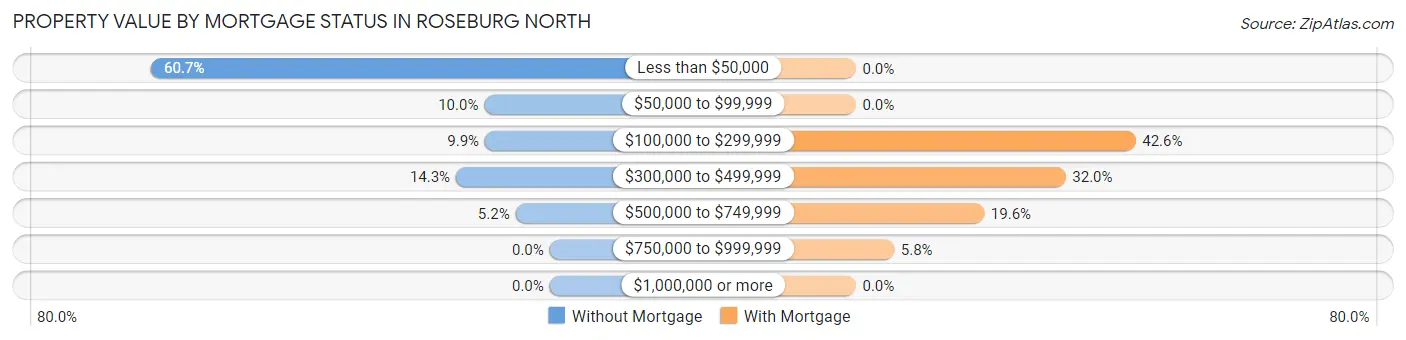
| Property Value | Without Mortgage | With Mortgage |
| Less than $50,000 | 549 (60.7%) | 0 (0.0%) |
| $50,000 to $99,999 | 90 (10.0%) | 0 (0.0%) |
| $100,000 to $299,999 | 89 (9.9%) | 292 (42.6%) |
| $300,000 to $499,999 | 129 (14.3%) | 219 (32.0%) |
| $500,000 to $749,999 | 47 (5.2%) | 134 (19.6%) |
| $750,000 to $999,999 | 0 (0.0%) | 40 (5.8%) |
| $1,000,000 or more | 0 (0.0%) | 0 (0.0%) |
| Total | 904 (100.0%) | 685 (100.0%) |
Household Income by Mortgage Status in Roseburg North
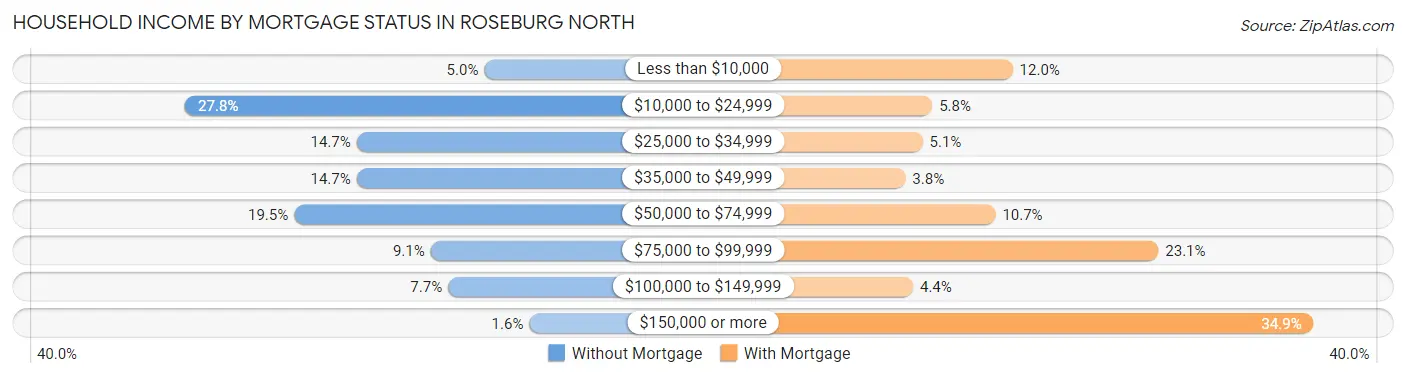
| Household Income | Without Mortgage | With Mortgage |
| Less than $10,000 | 45 (5.0%) | 82 (12.0%) |
| $10,000 to $24,999 | 251 (27.8%) | 40 (5.8%) |
| $25,000 to $34,999 | 133 (14.7%) | 35 (5.1%) |
| $35,000 to $49,999 | 133 (14.7%) | 26 (3.8%) |
| $50,000 to $74,999 | 176 (19.5%) | 73 (10.7%) |
| $75,000 to $99,999 | 82 (9.1%) | 158 (23.1%) |
| $100,000 to $149,999 | 70 (7.7%) | 30 (4.4%) |
| $150,000 or more | 14 (1.5%) | 239 (34.9%) |
| Total | 904 (100.0%) | 685 (100.0%) |
Property Value to Household Income Ratio in Roseburg North
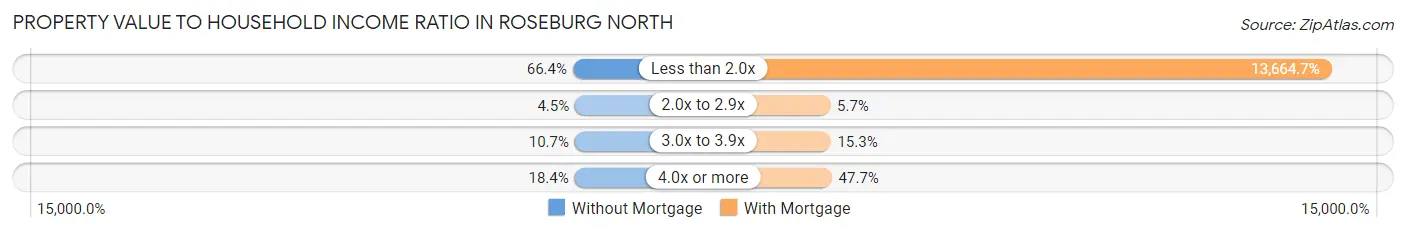
| Value-to-Income Ratio | Without Mortgage | With Mortgage |
| Less than 2.0x | 600 (66.4%) | 93,603 (13,664.7%) |
| 2.0x to 2.9x | 41 (4.5%) | 39 (5.7%) |
| 3.0x to 3.9x | 97 (10.7%) | 105 (15.3%) |
| 4.0x or more | 166 (18.4%) | 327 (47.7%) |
| Total | 904 (100.0%) | 685 (100.0%) |
Real Estate Taxes by Mortgage Status in Roseburg North
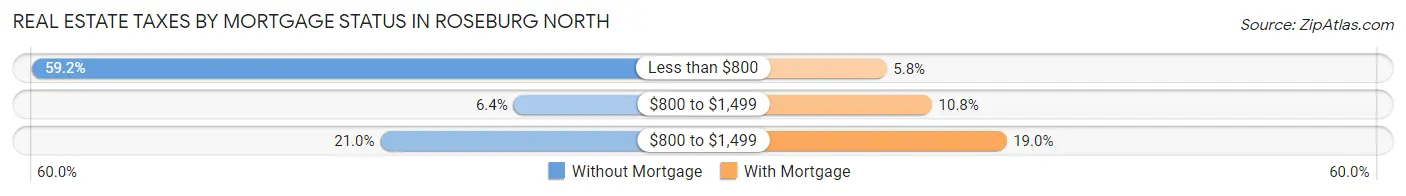
| Property Taxes | Without Mortgage | With Mortgage |
| Less than $800 | 535 (59.2%) | 40 (5.8%) |
| $800 to $1,499 | 58 (6.4%) | 74 (10.8%) |
| $800 to $1,499 | 190 (21.0%) | 130 (19.0%) |
| Total | 904 (100.0%) | 685 (100.0%) |
Health & Disability in Roseburg North
Health Insurance Coverage by Age in Roseburg North
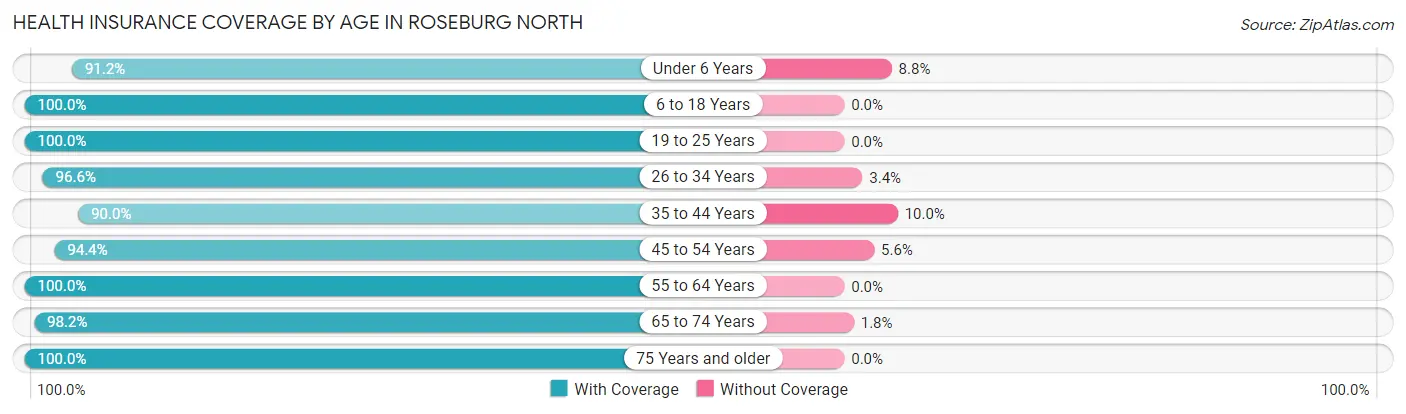
| Age Bracket | With Coverage | Without Coverage |
| Under 6 Years | 382 (91.2%) | 37 (8.8%) |
| 6 to 18 Years | 314 (100.0%) | 0 (0.0%) |
| 19 to 25 Years | 334 (100.0%) | 0 (0.0%) |
| 26 to 34 Years | 373 (96.6%) | 13 (3.4%) |
| 35 to 44 Years | 407 (90.0%) | 45 (10.0%) |
| 45 to 54 Years | 391 (94.4%) | 23 (5.6%) |
| 55 to 64 Years | 718 (100.0%) | 0 (0.0%) |
| 65 to 74 Years | 887 (98.2%) | 16 (1.8%) |
| 75 Years and older | 538 (100.0%) | 0 (0.0%) |
| Total | 4,344 (97.0%) | 134 (3.0%) |
Health Insurance Coverage by Citizenship Status in Roseburg North
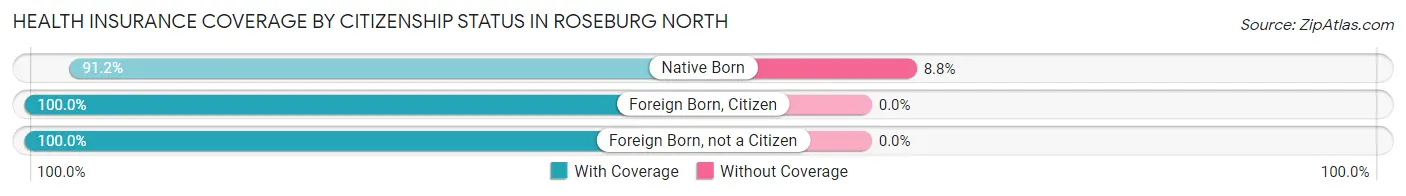
| Citizenship Status | With Coverage | Without Coverage |
| Native Born | 382 (91.2%) | 37 (8.8%) |
| Foreign Born, Citizen | 314 (100.0%) | 0 (0.0%) |
| Foreign Born, not a Citizen | 334 (100.0%) | 0 (0.0%) |
Health Insurance Coverage by Household Income in Roseburg North
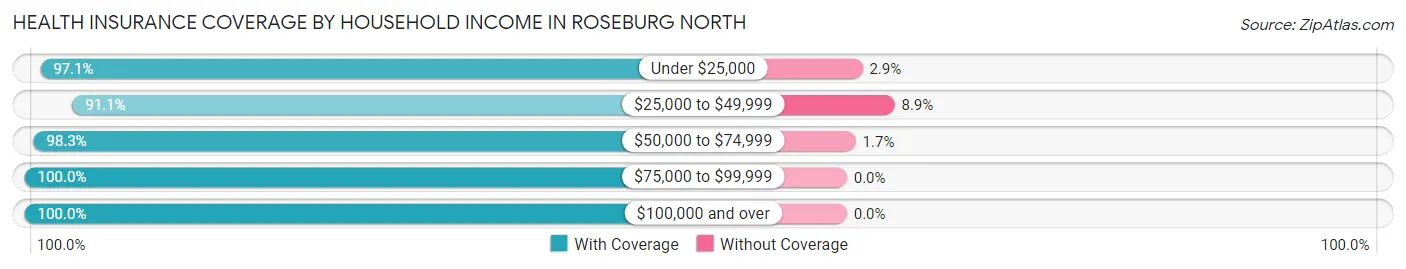
| Household Income | With Coverage | Without Coverage |
| Under $25,000 | 596 (97.1%) | 18 (2.9%) |
| $25,000 to $49,999 | 1,019 (91.1%) | 100 (8.9%) |
| $50,000 to $74,999 | 947 (98.3%) | 16 (1.7%) |
| $75,000 to $99,999 | 508 (100.0%) | 0 (0.0%) |
| $100,000 and over | 1,273 (100.0%) | 0 (0.0%) |
Public vs Private Health Insurance Coverage by Age in Roseburg North
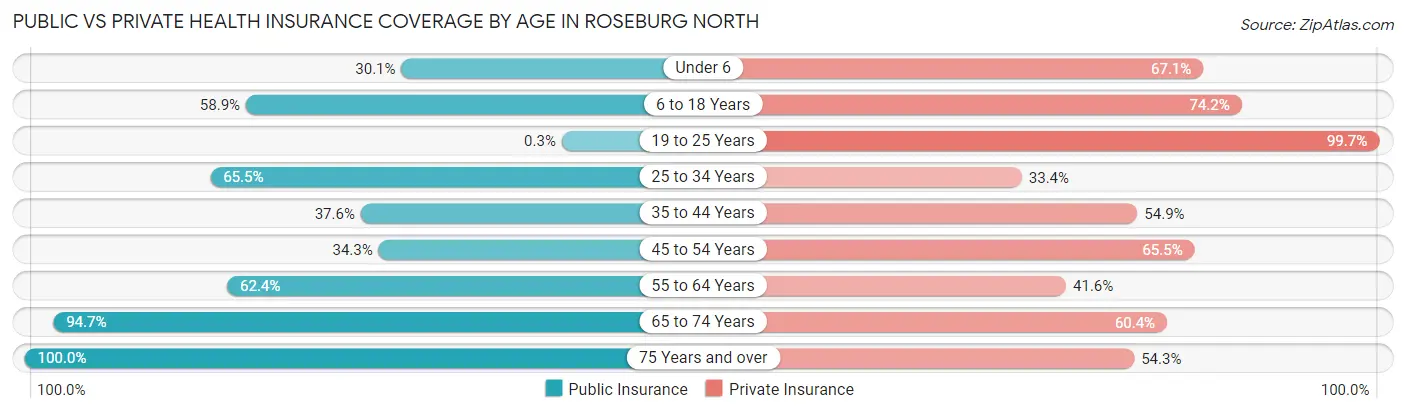
| Age Bracket | Public Insurance | Private Insurance |
| Under 6 | 126 (30.1%) | 281 (67.1%) |
| 6 to 18 Years | 185 (58.9%) | 233 (74.2%) |
| 19 to 25 Years | 1 (0.3%) | 333 (99.7%) |
| 25 to 34 Years | 253 (65.5%) | 129 (33.4%) |
| 35 to 44 Years | 170 (37.6%) | 248 (54.9%) |
| 45 to 54 Years | 142 (34.3%) | 271 (65.5%) |
| 55 to 64 Years | 448 (62.4%) | 299 (41.6%) |
| 65 to 74 Years | 855 (94.7%) | 545 (60.4%) |
| 75 Years and over | 538 (100.0%) | 292 (54.3%) |
| Total | 2,718 (60.7%) | 2,631 (58.8%) |
Disability Status by Sex by Age in Roseburg North
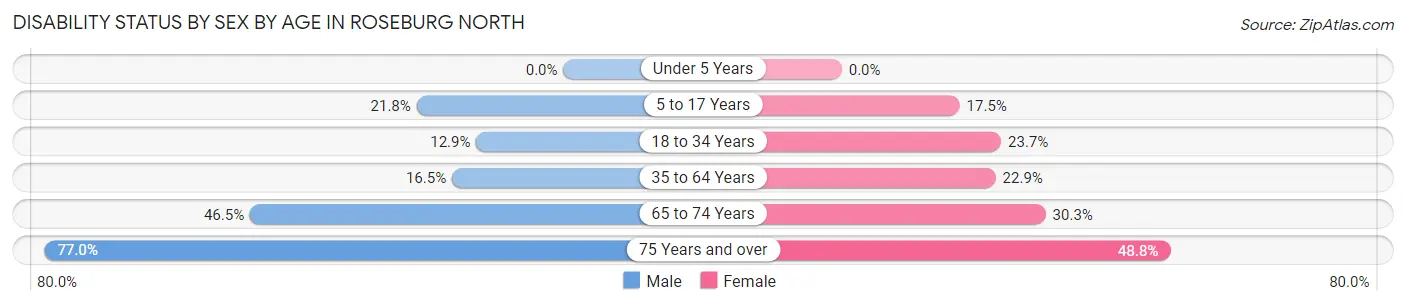
| Age Bracket | Male | Female |
| Under 5 Years | 0 (0.0%) | 0 (0.0%) |
| 5 to 17 Years | 34 (21.8%) | 35 (17.5%) |
| 18 to 34 Years | 45 (12.9%) | 88 (23.7%) |
| 35 to 64 Years | 110 (16.5%) | 210 (22.9%) |
| 65 to 74 Years | 228 (46.5%) | 125 (30.3%) |
| 75 Years and over | 198 (77.0%) | 137 (48.7%) |
Disability Class by Sex by Age in Roseburg North
Disability Class: Hearing Difficulty
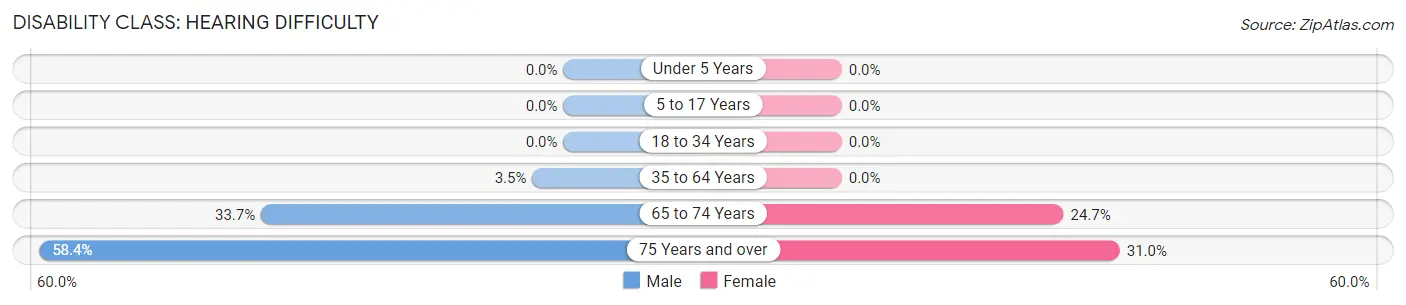
| Age Bracket | Male | Female |
| Under 5 Years | 0 (0.0%) | 0 (0.0%) |
| 5 to 17 Years | 0 (0.0%) | 0 (0.0%) |
| 18 to 34 Years | 0 (0.0%) | 0 (0.0%) |
| 35 to 64 Years | 23 (3.5%) | 0 (0.0%) |
| 65 to 74 Years | 165 (33.7%) | 102 (24.7%) |
| 75 Years and over | 150 (58.4%) | 87 (31.0%) |
Disability Class: Vision Difficulty
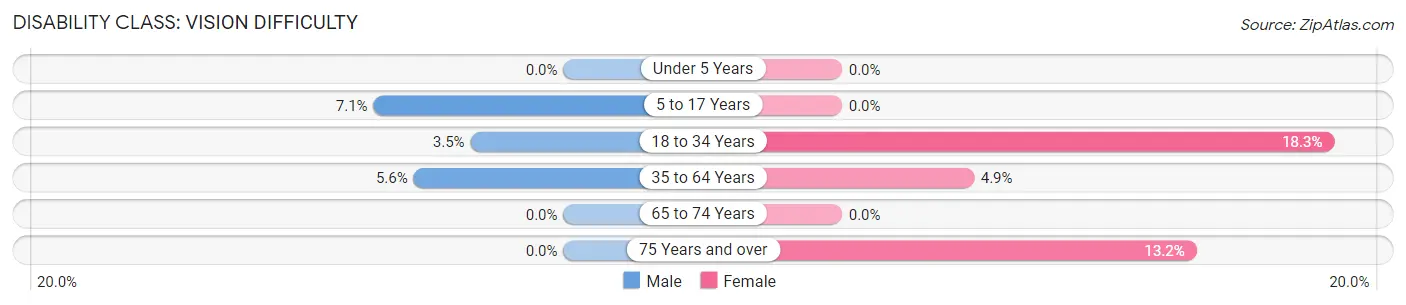
| Age Bracket | Male | Female |
| Under 5 Years | 0 (0.0%) | 0 (0.0%) |
| 5 to 17 Years | 11 (7.0%) | 0 (0.0%) |
| 18 to 34 Years | 12 (3.5%) | 68 (18.3%) |
| 35 to 64 Years | 37 (5.6%) | 45 (4.9%) |
| 65 to 74 Years | 0 (0.0%) | 0 (0.0%) |
| 75 Years and over | 0 (0.0%) | 37 (13.2%) |
Disability Class: Cognitive Difficulty
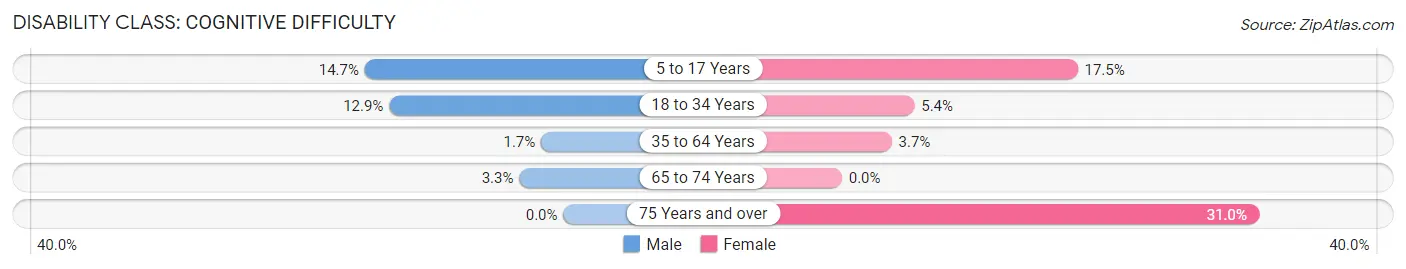
| Age Bracket | Male | Female |
| 5 to 17 Years | 23 (14.7%) | 35 (17.5%) |
| 18 to 34 Years | 45 (12.9%) | 20 (5.4%) |
| 35 to 64 Years | 11 (1.7%) | 34 (3.7%) |
| 65 to 74 Years | 16 (3.3%) | 0 (0.0%) |
| 75 Years and over | 0 (0.0%) | 87 (31.0%) |
Disability Class: Ambulatory Difficulty
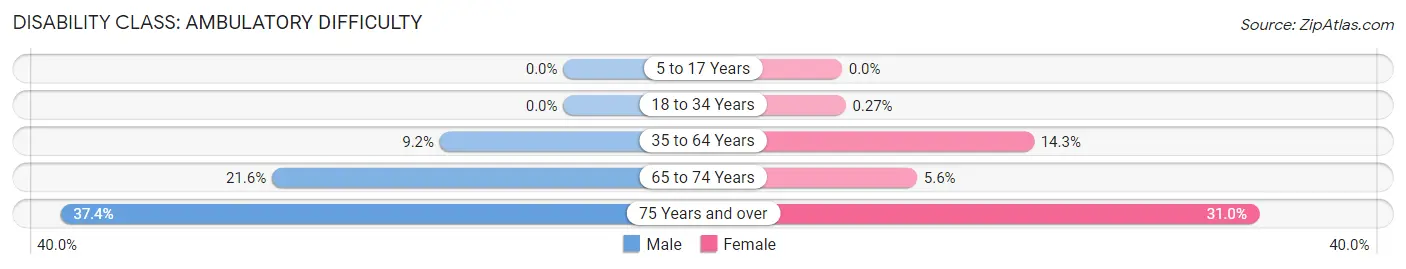
| Age Bracket | Male | Female |
| 5 to 17 Years | 0 (0.0%) | 0 (0.0%) |
| 18 to 34 Years | 0 (0.0%) | 1 (0.3%) |
| 35 to 64 Years | 61 (9.2%) | 131 (14.2%) |
| 65 to 74 Years | 106 (21.6%) | 23 (5.6%) |
| 75 Years and over | 96 (37.3%) | 87 (31.0%) |
Disability Class: Self-Care Difficulty
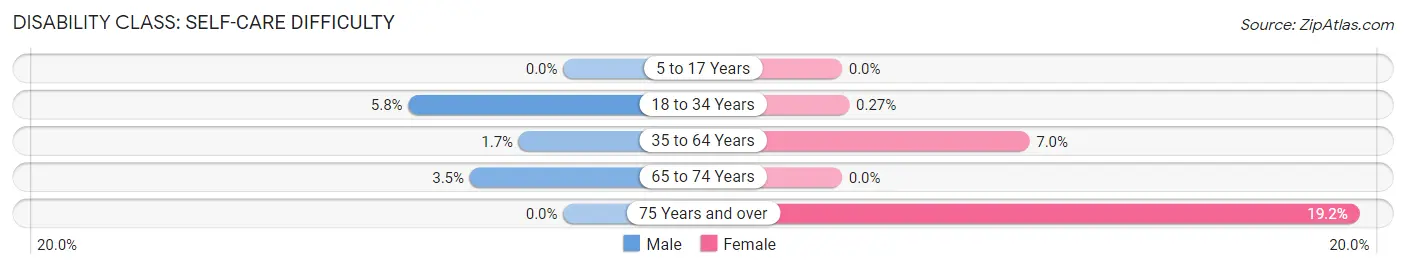
| Age Bracket | Male | Female |
| 5 to 17 Years | 0 (0.0%) | 0 (0.0%) |
| 18 to 34 Years | 20 (5.8%) | 1 (0.3%) |
| 35 to 64 Years | 11 (1.7%) | 64 (7.0%) |
| 65 to 74 Years | 17 (3.5%) | 0 (0.0%) |
| 75 Years and over | 0 (0.0%) | 54 (19.2%) |
Technology Access in Roseburg North
Computing Device Access in Roseburg North
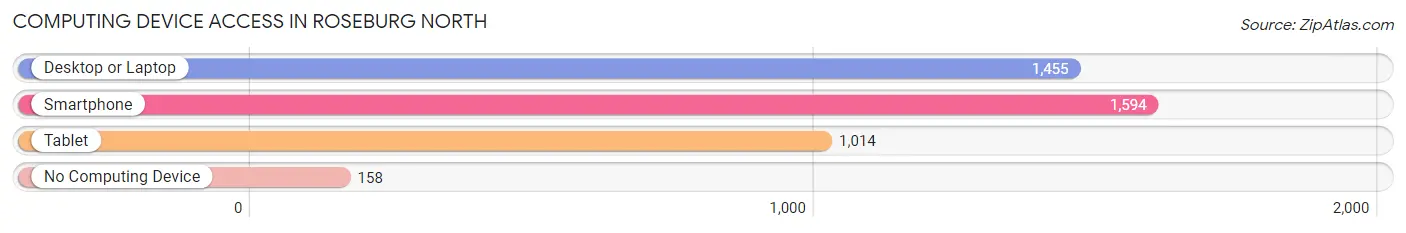
| Device Type | # Households | % Households |
| Desktop or Laptop | 1,455 | 74.0% |
| Smartphone | 1,594 | 81.0% |
| Tablet | 1,014 | 51.5% |
| No Computing Device | 158 | 8.0% |
| Total | 1,967 | 100.0% |
Internet Access in Roseburg North
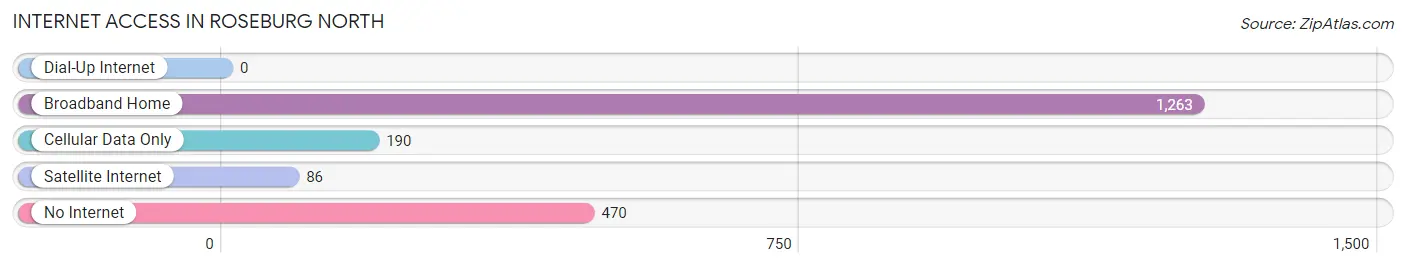
| Internet Type | # Households | % Households |
| Dial-Up Internet | 0 | 0.0% |
| Broadband Home | 1,263 | 64.2% |
| Cellular Data Only | 190 | 9.7% |
| Satellite Internet | 86 | 4.4% |
| No Internet | 470 | 23.9% |
| Total | 1,967 | 100.0% |
Roseburg North Summary
History
The city of Roseburg North, Oregon is located in the Umpqua Valley in the southern part of the state. The area was first inhabited by the Umpqua Tribe of Native Americans, who lived in the area for thousands of years before the arrival of European settlers. The first Europeans to settle in the area were fur traders, who arrived in the early 1800s. The first permanent settlement was established in 1851, when the town of Roseburg was founded. The town was named after settler Aaron Rose, who had arrived in the area in 1848.
In the late 1800s, the area began to experience rapid growth due to the timber industry. The city of Roseburg North was established in 1891, when the Oregon and California Railroad arrived in the area. The railroad connected the city to the rest of the state, and allowed for the transportation of timber and other goods. The city quickly grew, and by the early 1900s, it had become a major hub for the timber industry.
In the mid-1900s, the timber industry began to decline, and the city began to diversify its economy. Today, Roseburg North is home to a variety of industries, including manufacturing, healthcare, and retail. The city is also home to several educational institutions, including the University of Oregon, Umpqua Community College, and Roseburg North High School.
Geography
Roseburg North is located in the Umpqua Valley in the southern part of Oregon. The city is situated on the banks of the Umpqua River, and is surrounded by the Cascade Mountains to the east and the Coast Range to the west. The city is located approximately 80 miles south of Eugene, and is approximately 200 miles south of Portland.
The city has a total area of 8.3 square miles, of which 8.2 square miles is land and 0.1 square miles is water. The city is located at an elevation of approximately 500 feet above sea level. The climate in Roseburg North is mild and temperate, with warm summers and cool winters.
Economy
Roseburg North is home to a variety of industries, including manufacturing, healthcare, and retail. The city is also home to several educational institutions, including the University of Oregon, Umpqua Community College, and Roseburg North High School.
The city’s largest employer is Roseburg Forest Products, which is a major producer of lumber and other wood products. Other major employers in the city include Roseburg Public Schools, Roseburg VA Medical Center, and Roseburg North Medical Center.
Demographics
As of the 2010 census, the population of Roseburg North was 21,845. The population is predominantly white (90.2%), with smaller percentages of Hispanic (3.7%), African American (2.2%), and Asian (1.7%) residents. The median household income in the city is $41,945, and the median age is 38.7 years. The city has a higher-than-average rate of poverty, with 17.3% of the population living below the poverty line.
Common Questions
What is Per Capita Income in Roseburg North?
Per Capita income in Roseburg North is $28,387.
What is the Median Family Income in Roseburg North?
Median Family Income in Roseburg North is $66,250.
What is the Median Household income in Roseburg North?
Median Household Income in Roseburg North is $55,810.
What is Income or Wage Gap in Roseburg North?
Income or Wage Gap in Roseburg North is 37.2%.
Women in Roseburg North earn 62.8 cents for every dollar earned by a man.
What is Inequality or Gini Index in Roseburg North?
Inequality or Gini Index in Roseburg North is 0.39.
What is the Total Population of Roseburg North?
Total Population of Roseburg North is 4,478.
What is the Total Male Population of Roseburg North?
Total Male Population of Roseburg North is 2,123.
What is the Total Female Population of Roseburg North?
Total Female Population of Roseburg North is 2,355.
What is the Ratio of Males per 100 Females in Roseburg North?
There are 90.15 Males per 100 Females in Roseburg North.
What is the Ratio of Females per 100 Males in Roseburg North?
There are 110.93 Females per 100 Males in Roseburg North.
What is the Median Population Age in Roseburg North?
Median Population Age in Roseburg North is 50.9 Years.
What is the Average Family Size in Roseburg North
Average Family Size in Roseburg North is 2.6 People.
What is the Average Household Size in Roseburg North
Average Household Size in Roseburg North is 2.3 People.
How Large is the Labor Force in Roseburg North?
There are 1,722 People in the Labor Forcein in Roseburg North.
What is the Percentage of People in the Labor Force in Roseburg North?
45.7% of People are in the Labor Force in Roseburg North.
What is the Unemployment Rate in Roseburg North?
Unemployment Rate in Roseburg North is 8.1%.