Cities with the Highest Percentage of Immigrants from India in Oregon
RELATED REPORTS & OPTIONS
India
Oregon
Compare Cities
Map of Cities with the Highest Percentage of Immigrants from India in Oregon
0.00%
15.00%
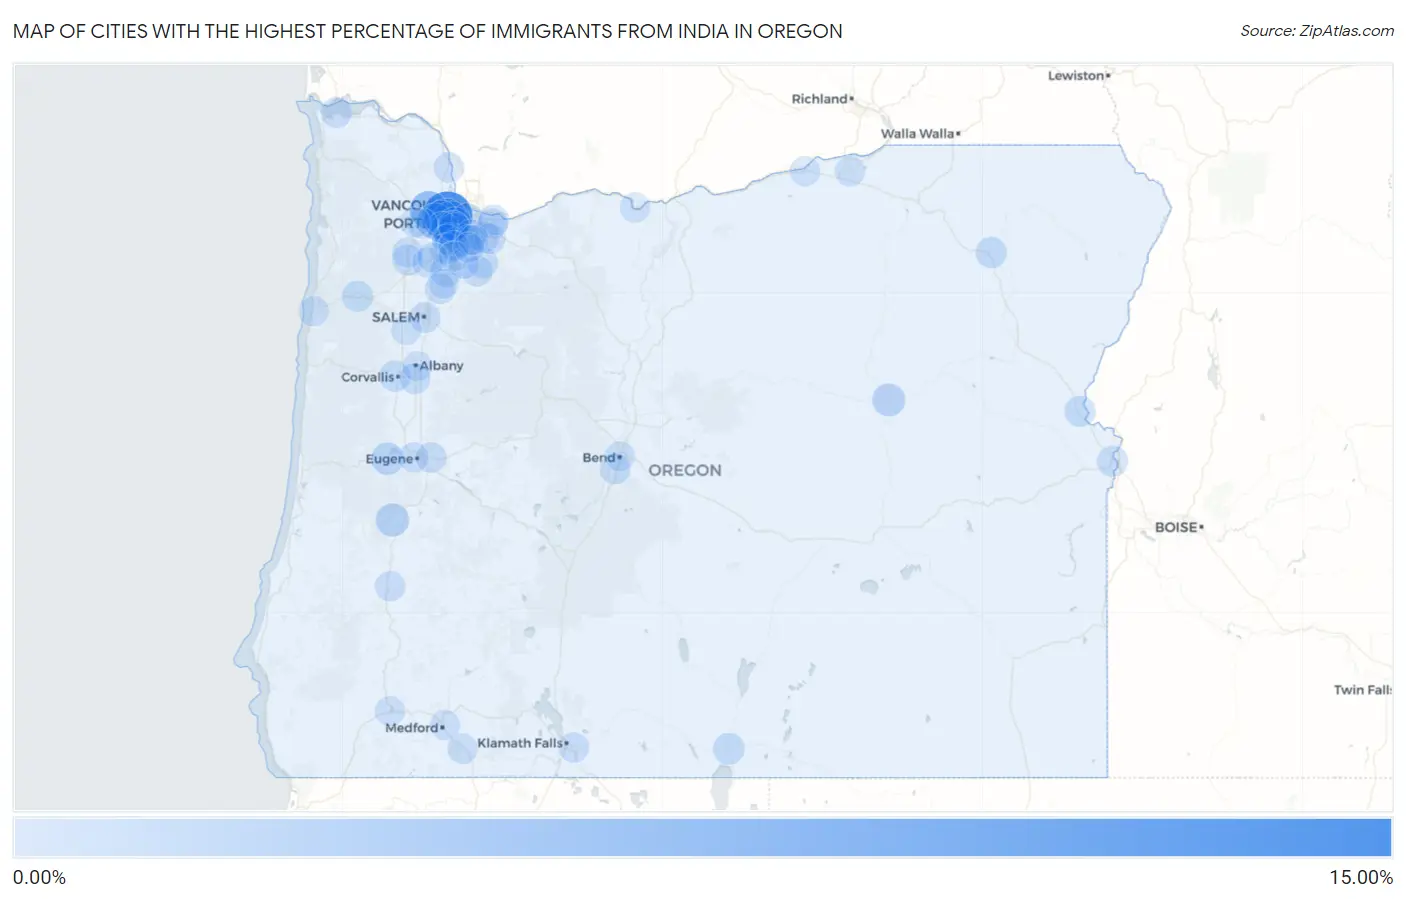
Cities with the Highest Percentage of Immigrants from India in Oregon
| City | India | vs State | vs National | |
| 1. | Bethany | 11.75% | 0.46%(+11.3)#-1 | 0.83%(+10.9)#0 |
| 2. | Oak Hills | 6.23% | 0.46%(+5.77)#0 | 0.83%(+5.41)#1 |
| 3. | North Plains | 4.52% | 0.46%(+4.05)#1 | 0.83%(+3.69)#2 |
| 4. | Cedar Mill | 4.28% | 0.46%(+3.82)#2 | 0.83%(+3.46)#3 |
| 5. | Hillsboro | 3.38% | 0.46%(+2.91)#3 | 0.83%(+2.55)#4 |
| 6. | Beaverton | 2.66% | 0.46%(+2.19)#4 | 0.83%(+1.83)#5 |
| 7. | Rockcreek | 2.28% | 0.46%(+1.81)#5 | 0.83%(+1.45)#6 |
| 8. | Drain | 1.80% | 0.46%(+1.34)#6 | 0.83%(+0.976)#7 |
| 9. | West Haven Sylvan | 1.71% | 0.46%(+1.24)#7 | 0.83%(+0.882)#8 |
| 10. | John Day | 1.54% | 0.46%(+1.07)#8 | 0.83%(+0.712)#9 |
| 11. | Veneta | 1.31% | 0.46%(+0.850)#9 | 0.83%(+0.488)#10 |
| 12. | Svensen | 1.23% | 0.46%(+0.768)#10 | 0.83%(+0.406)#11 |
| 13. | Dunthorpe | 1.13% | 0.46%(+0.668)#11 | 0.83%(+0.307)#12 |
| 14. | Lake Oswego | 1.05% | 0.46%(+0.589)#12 | 0.83%(+0.228)#13 |
| 15. | Cherry Grove | 1.02% | 0.46%(+0.559)#13 | 0.83%(+0.197)#14 |
| 16. | Tigard | 0.86% | 0.46%(+0.399)#14 | 0.83%(+0.038)#15 |
| 17. | Lakeview | 0.85% | 0.46%(+0.385)#15 | 0.83%(+0.023)#16 |
| 18. | Donald | 0.78% | 0.46%(+0.318)#16 | 0.83%(-0.043)#17 |
| 19. | Island City | 0.76% | 0.46%(+0.295)#17 | 0.83%(-0.066)#18 |
| 20. | Durham | 0.75% | 0.46%(+0.289)#18 | 0.83%(-0.073)#19 |
| 21. | Raleigh Hills | 0.73% | 0.46%(+0.264)#19 | 0.83%(-0.098)#20 |
| 22. | Marlene | 0.72% | 0.46%(+0.255)#20 | 0.83%(-0.106)#21 |
| 23. | Aloha | 0.70% | 0.46%(+0.239)#21 | 0.83%(-0.123)#22 |
| 24. | Huntington | 0.59% | 0.46%(+0.123)#22 | 0.83%(-0.239)#23 |
| 25. | Corvallis | 0.58% | 0.46%(+0.119)#23 | 0.83%(-0.242)#24 |
| 26. | Sherwood | 0.50% | 0.46%(+0.034)#24 | 0.83%(-0.327)#25 |
| 27. | Grand Ronde | 0.50% | 0.46%(+0.033)#25 | 0.83%(-0.329)#26 |
| 28. | Deschutes River Woods | 0.48% | 0.46%(+0.019)#26 | 0.83%(-0.343)#27 |
| 29. | Ontario | 0.47% | 0.46%(+0.002)#27 | 0.83%(-0.360)#28 |
| 30. | Bull Mountain | 0.46% | 0.46%(-0.002)#28 | 0.83%(-0.364)#29 |
| 31. | Salem | 0.45% | 0.46%(-0.009)#29 | 0.83%(-0.371)#30 |
| 32. | Beavercreek | 0.44% | 0.46%(-0.022)#30 | 0.83%(-0.384)#31 |
| 33. | Astoria | 0.42% | 0.46%(-0.041)#31 | 0.83%(-0.403)#32 |
| 34. | Carlton | 0.38% | 0.46%(-0.079)#32 | 0.83%(-0.441)#33 |
| 35. | Milwaukie | 0.35% | 0.46%(-0.110)#33 | 0.83%(-0.471)#34 |
| 36. | Happy Valley | 0.35% | 0.46%(-0.111)#34 | 0.83%(-0.473)#183 |
| 37. | Portland | 0.35% | 0.46%(-0.118)#35 | 0.83%(-0.479)#202 |
| 38. | Mulino | 0.32% | 0.46%(-0.146)#36 | 0.83%(-0.508)#203 |
| 39. | Tangent | 0.31% | 0.46%(-0.156)#37 | 0.83%(-0.517)#204 |
| 40. | Gervais | 0.31% | 0.46%(-0.156)#38 | 0.83%(-0.518)#205 |
| 41. | Damascus | 0.26% | 0.46%(-0.208)#39 | 0.83%(-0.569)#206 |
| 42. | Tualatin | 0.26% | 0.46%(-0.208)#40 | 0.83%(-0.570)#207 |
| 43. | Yamhill | 0.25% | 0.46%(-0.210)#41 | 0.83%(-0.572)#208 |
| 44. | Dundee | 0.25% | 0.46%(-0.215)#42 | 0.83%(-0.577)#209 |
| 45. | Wood Village | 0.22% | 0.46%(-0.244)#43 | 0.83%(-0.605)#210 |
| 46. | Springfield | 0.21% | 0.46%(-0.256)#44 | 0.83%(-0.618)#211 |
| 47. | Canby | 0.18% | 0.46%(-0.281)#45 | 0.83%(-0.643)#212 |
| 48. | West Slope | 0.18% | 0.46%(-0.283)#46 | 0.83%(-0.645)#213 |
| 49. | Oak Grove | 0.15% | 0.46%(-0.310)#47 | 0.83%(-0.671)#214 |
| 50. | Roseburg | 0.14% | 0.46%(-0.320)#48 | 0.83%(-0.682)#215 |
| 51. | Cornelius | 0.14% | 0.46%(-0.320)#49 | 0.83%(-0.682)#216 |
| 52. | Ashland | 0.13% | 0.46%(-0.333)#50 | 0.83%(-0.694)#217 |
| 53. | Eugene | 0.12% | 0.46%(-0.340)#51 | 0.83%(-0.702)#218 |
| 54. | Altamont | 0.12% | 0.46%(-0.341)#52 | 0.83%(-0.702)#219 |
| 55. | St Helens | 0.12% | 0.46%(-0.342)#53 | 0.83%(-0.704)#220 |
| 56. | Wilsonville | 0.12% | 0.46%(-0.344)#54 | 0.83%(-0.706)#221 |
| 57. | Gresham | 0.087% | 0.46%(-0.376)#55 | 0.83%(-0.738)#222 |
| 58. | Lincoln City | 0.082% | 0.46%(-0.382)#56 | 0.83%(-0.744)#223 |
| 59. | Forest Grove | 0.080% | 0.46%(-0.383)#57 | 0.83%(-0.745)#224 |
| 60. | Boardman | 0.078% | 0.46%(-0.385)#58 | 0.83%(-0.747)#225 |
| 61. | Oatfield | 0.076% | 0.46%(-0.387)#59 | 0.83%(-0.749)#226 |
| 62. | Newberg | 0.075% | 0.46%(-0.389)#60 | 0.83%(-0.750)#227 |
| 63. | Albany | 0.075% | 0.46%(-0.389)#61 | 0.83%(-0.751)#228 |
| 64. | Hermiston | 0.067% | 0.46%(-0.396)#62 | 0.83%(-0.758)#229 |
| 65. | The Dalles | 0.063% | 0.46%(-0.401)#63 | 0.83%(-0.763)#230 |
| 66. | Medford | 0.046% | 0.46%(-0.418)#64 | 0.83%(-0.780)#231 |
| 67. | West Linn | 0.040% | 0.46%(-0.423)#65 | 0.83%(-0.785)#232 |
| 68. | Grants Pass | 0.038% | 0.46%(-0.425)#66 | 0.83%(-0.787)#233 |
| 69. | Independence | 0.030% | 0.46%(-0.433)#67 | 0.83%(-0.795)#234 |
| 70. | Bend | 0.013% | 0.46%(-0.450)#68 | 0.83%(-0.812)#235 |
| 71. | Woodburn | 0.0076% | 0.46%(-0.456)#69 | 0.83%(-0.818)#236 |
Common Questions
What are the Top 10 Cities with the Highest Percentage of Immigrants from India in Oregon?
Top 10 Cities with the Highest Percentage of Immigrants from India in Oregon are:
#1
11.75%
#2
6.23%
#3
4.52%
#4
4.28%
#5
3.38%
#6
2.66%
#7
2.28%
#8
1.80%
#9
1.71%
#10
1.54%
What city has the Highest Percentage of Immigrants from India in Oregon?
Bethany has the Highest Percentage of Immigrants from India in Oregon with 11.75%.
What is the Percentage of Immigrants from India in the State of Oregon?
Percentage of Immigrants from India in Oregon is 0.46%.
What is the Percentage of Immigrants from India in the United States?
Percentage of Immigrants from India in the United States is 0.83%.