Zip Codes with the Highest Percentage of Population Employed in Food Preparation & Serving in Gresham, OR
RELATED REPORTS & OPTIONS
Food Preparation & Serving
Gresham
Compare Zip Codes
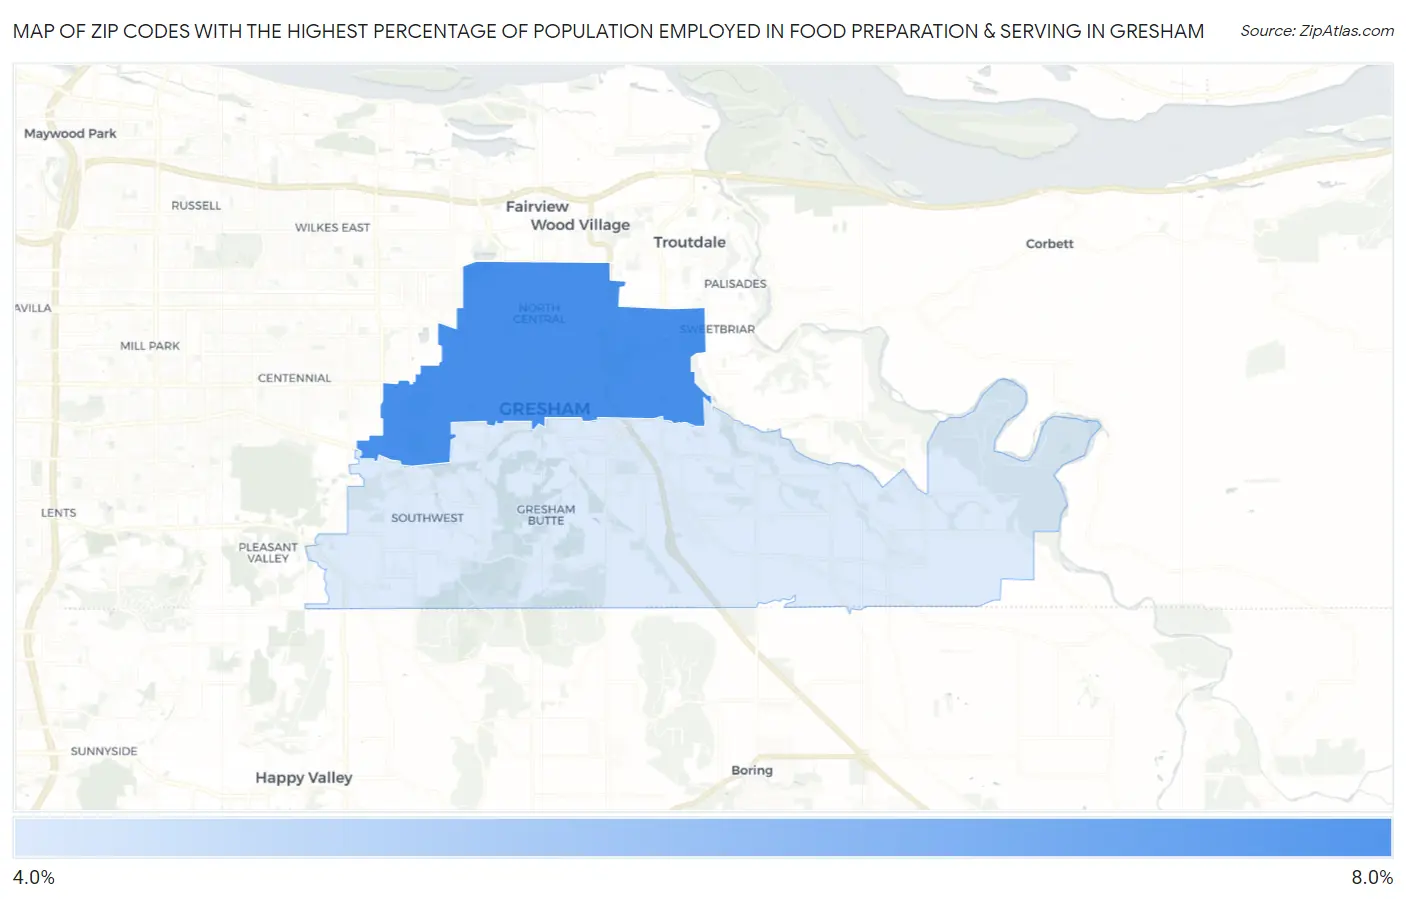
Map of Zip Codes with the Highest Percentage of Population Employed in Food Preparation & Serving in Gresham
4.9%
6.0%
Zip Codes with the Highest Percentage of Population Employed in Food Preparation & Serving in Gresham, OR
| Zip Code | % Employed | vs State | vs National | |
| 1. | 97030 | 6.0% | 5.9%(+0.082)#153 | 5.3%(+0.723)#9,316 |
| 2. | 97080 | 4.9% | 5.9%(-1.01)#200 | 5.3%(-0.373)#13,295 |
1
Common Questions
What are the Top Zip Codes with the Highest Percentage of Population Employed in Food Preparation & Serving in Gresham, OR?
Top Zip Codes with the Highest Percentage of Population Employed in Food Preparation & Serving in Gresham, OR are:
What zip code has the Highest Percentage of Population Employed in Food Preparation & Serving in Gresham, OR?
97030 has the Highest Percentage of Population Employed in Food Preparation & Serving in Gresham, OR with 6.0%.
What is the Percentage of Population Employed in Food Preparation & Serving in Gresham, OR?
Percentage of Population Employed in Food Preparation & Serving in Gresham is 6.4%.
What is the Percentage of Population Employed in Food Preparation & Serving in Oregon?
Percentage of Population Employed in Food Preparation & Serving in Oregon is 5.9%.
What is the Percentage of Population Employed in Food Preparation & Serving in the United States?
Percentage of Population Employed in Food Preparation & Serving in the United States is 5.3%.