Waldport, OR Map & Demographics
Waldport Map
Waldport Overview
$38,686
PER CAPITA INCOME
$59,913
AVG FAMILY INCOME
$49,659
AVG HOUSEHOLD INCOME
31.6%
WAGE / INCOME GAP [ % ]
68.4¢/ $1
WAGE / INCOME GAP [ $ ]
0.48
INEQUALITY / GINI INDEX
1,950
TOTAL POPULATION
949
MALE POPULATION
1,001
FEMALE POPULATION
94.81
MALES / 100 FEMALES
105.48
FEMALES / 100 MALES
59.9
MEDIAN AGE
2.6
AVG FAMILY SIZE
1.8
AVG HOUSEHOLD SIZE
801
LABOR FORCE [ PEOPLE ]
44.4%
PERCENT IN LABOR FORCE
17.3%
UNEMPLOYMENT RATE
Waldport Zip Codes
Waldport Area Codes
Income in Waldport
Income Overview in Waldport
Per Capita Income in Waldport is $38,686, while median incomes of families and households are $59,913 and $49,659 respectively.
| Characteristic | Number | Measure |
| Per Capita Income | 1,950 | $38,686 |
| Median Family Income | 523 | $59,913 |
| Mean Family Income | 523 | $84,774 |
| Median Household Income | 1,058 | $49,659 |
| Mean Household Income | 1,058 | $69,498 |
| Income Deficit | 523 | $0 |
| Wage / Income Gap (%) | 1,950 | 31.56% |
| Wage / Income Gap ($) | 1,950 | 68.44¢ per $1 |
| Gini / Inequality Index | 1,950 | 0.48 |
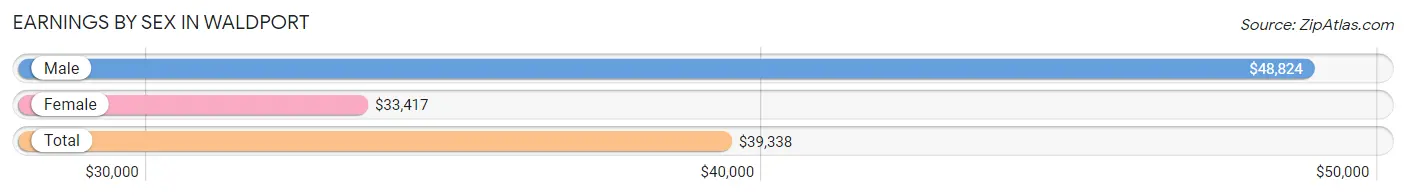
Earnings by Sex in Waldport
Average Earnings in Waldport are $39,338, $48,824 for men and $33,417 for women, a difference of 31.6%.
| Sex | Number | Average Earnings |
| Male | 412 (47.6%) | $48,824 |
| Female | 453 (52.4%) | $33,417 |
| Total | 865 (100.0%) | $39,338 |
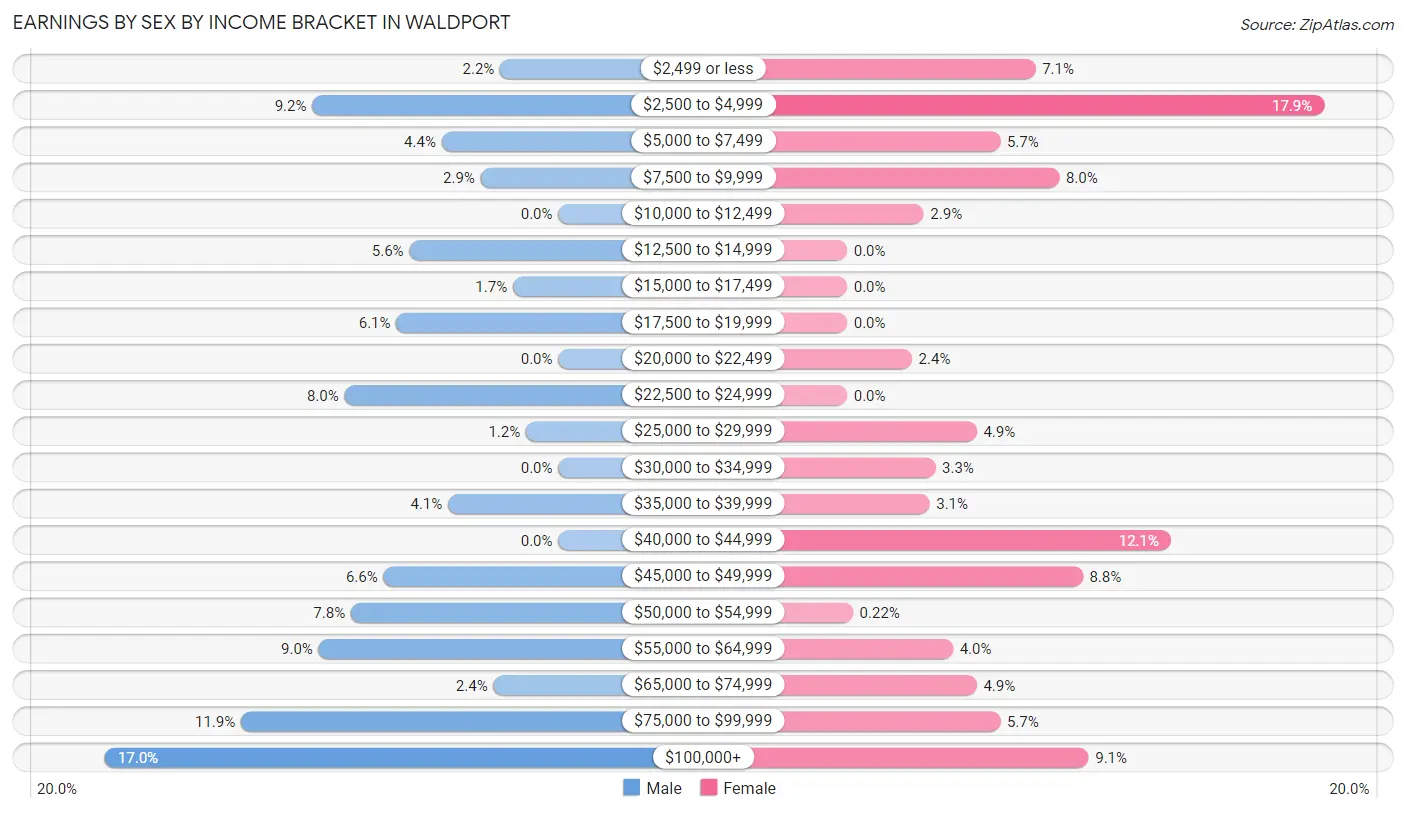
Earnings by Sex by Income Bracket in Waldport
The most common earnings brackets in Waldport are $100,000+ for men (70 | 17.0%) and $2,500 to $4,999 for women (81 | 17.9%).
| Income | Male | Female |
| $2,499 or less | 9 (2.2%) | 32 (7.1%) |
| $2,500 to $4,999 | 38 (9.2%) | 81 (17.9%) |
| $5,000 to $7,499 | 18 (4.4%) | 26 (5.7%) |
| $7,500 to $9,999 | 12 (2.9%) | 36 (8.0%) |
| $10,000 to $12,499 | 0 (0.0%) | 13 (2.9%) |
| $12,500 to $14,999 | 23 (5.6%) | 0 (0.0%) |
| $15,000 to $17,499 | 7 (1.7%) | 0 (0.0%) |
| $17,500 to $19,999 | 25 (6.1%) | 0 (0.0%) |
| $20,000 to $22,499 | 0 (0.0%) | 11 (2.4%) |
| $22,500 to $24,999 | 33 (8.0%) | 0 (0.0%) |
| $25,000 to $29,999 | 5 (1.2%) | 22 (4.9%) |
| $30,000 to $34,999 | 0 (0.0%) | 15 (3.3%) |
| $35,000 to $39,999 | 17 (4.1%) | 14 (3.1%) |
| $40,000 to $44,999 | 0 (0.0%) | 55 (12.1%) |
| $45,000 to $49,999 | 27 (6.6%) | 40 (8.8%) |
| $50,000 to $54,999 | 32 (7.8%) | 1 (0.2%) |
| $55,000 to $64,999 | 37 (9.0%) | 18 (4.0%) |
| $65,000 to $74,999 | 10 (2.4%) | 22 (4.9%) |
| $75,000 to $99,999 | 49 (11.9%) | 26 (5.7%) |
| $100,000+ | 70 (17.0%) | 41 (9.0%) |
| Total | 412 (100.0%) | 453 (100.0%) |
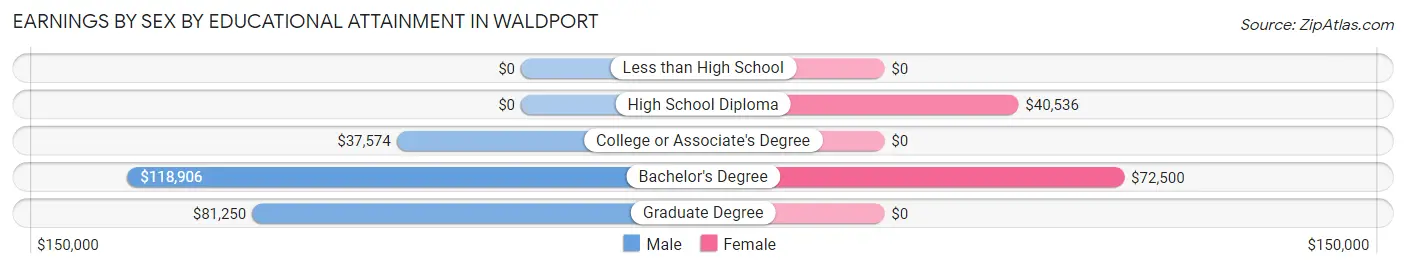
Earnings by Sex by Educational Attainment in Waldport
Average earnings in Waldport are $52,852 for men and $37,321 for women, a difference of 29.4%. Men with an educational attainment of bachelor's degree enjoy the highest average annual earnings of $118,906, while those with college or associate's degree education earn the least with $37,574. Women with an educational attainment of bachelor's degree earn the most with the average annual earnings of $72,500, while those with high school diploma education have the smallest earnings of $40,536.
| Educational Attainment | Male Income | Female Income |
| Less than High School | - | - |
| High School Diploma | - | - |
| College or Associate's Degree | $37,574 | $0 |
| Bachelor's Degree | $118,906 | $72,500 |
| Graduate Degree | $81,250 | $0 |
| Total | $52,852 | $37,321 |
Family Income in Waldport
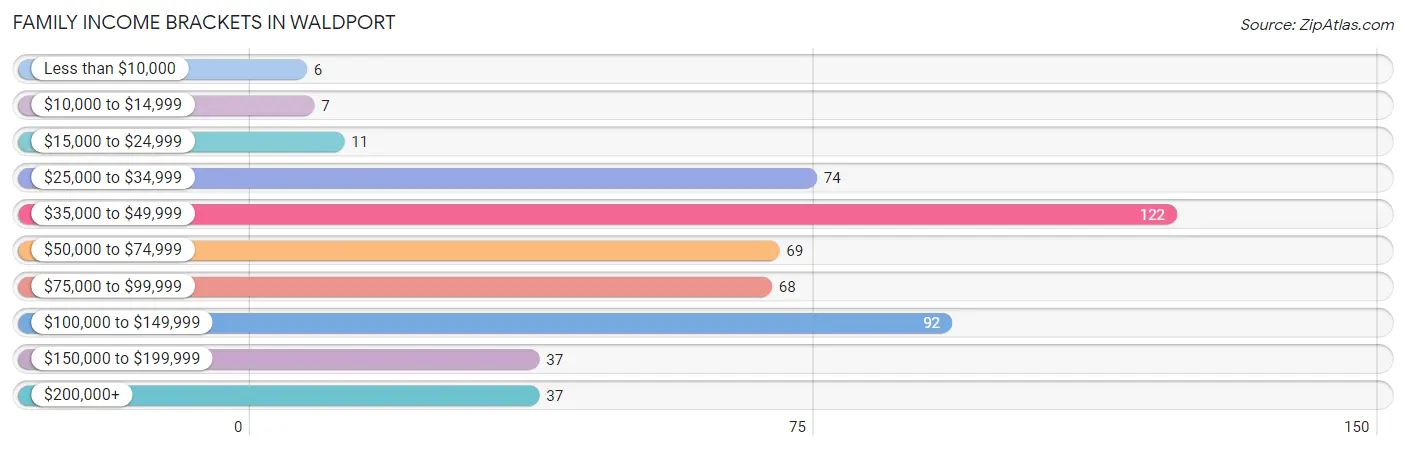
Family Income Brackets in Waldport
According to the Waldport family income data, there are 122 families falling into the $35,000 to $49,999 income range, which is the most common income bracket and makes up 23.3% of all families. Conversely, the less than $10,000 income bracket is the least frequent group with only 6 families (1.1%) belonging to this category.
| Income Bracket | # Families | % Families |
| Less than $10,000 | 6 | 1.1% |
| $10,000 to $14,999 | 7 | 1.3% |
| $15,000 to $24,999 | 11 | 2.1% |
| $25,000 to $34,999 | 74 | 14.1% |
| $35,000 to $49,999 | 122 | 23.3% |
| $50,000 to $74,999 | 69 | 13.2% |
| $75,000 to $99,999 | 68 | 13.0% |
| $100,000 to $149,999 | 92 | 17.6% |
| $150,000 to $199,999 | 37 | 7.1% |
| $200,000+ | 37 | 7.1% |
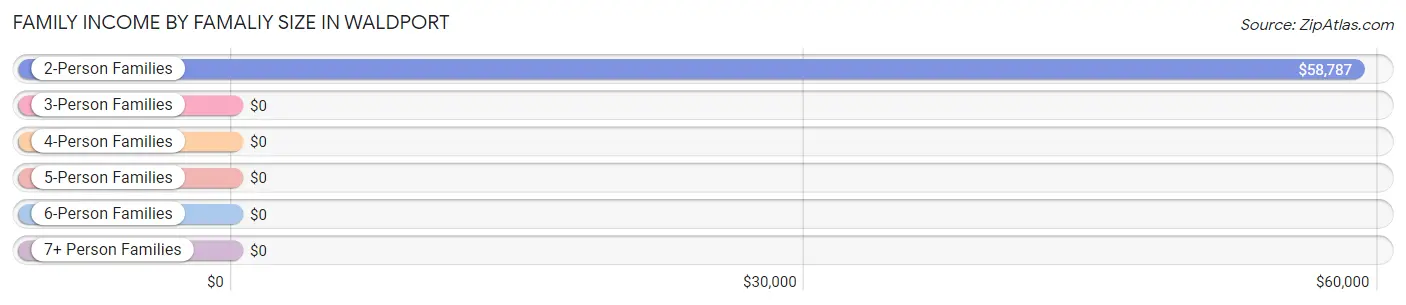
Family Income by Famaliy Size in Waldport
2-person families (369 | 70.6%) account for the highest median family income in Waldport with $58,787 per family, while 2-person families (369 | 70.6%) have the highest median income of $29,394 per family member.
| Income Bracket | # Families | Median Income |
| 2-Person Families | 369 (70.6%) | $58,787 |
| 3-Person Families | 116 (22.2%) | $0 |
| 4-Person Families | 25 (4.8%) | $0 |
| 5-Person Families | 9 (1.7%) | $0 |
| 6-Person Families | 4 (0.8%) | $0 |
| 7+ Person Families | 0 (0.0%) | $0 |
| Total | 523 (100.0%) | $59,913 |
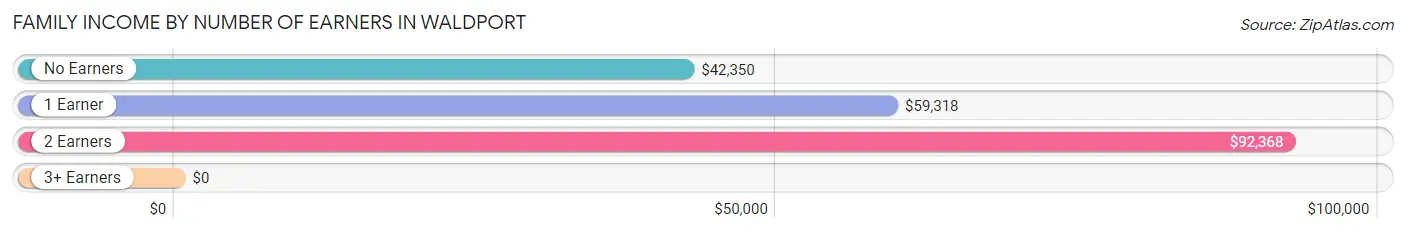
Family Income by Number of Earners in Waldport
| Number of Earners | # Families | Median Income |
| No Earners | 147 (28.1%) | $42,350 |
| 1 Earner | 178 (34.0%) | $59,318 |
| 2 Earners | 178 (34.0%) | $92,368 |
| 3+ Earners | 20 (3.8%) | $0 |
| Total | 523 (100.0%) | $59,913 |
Household Income in Waldport
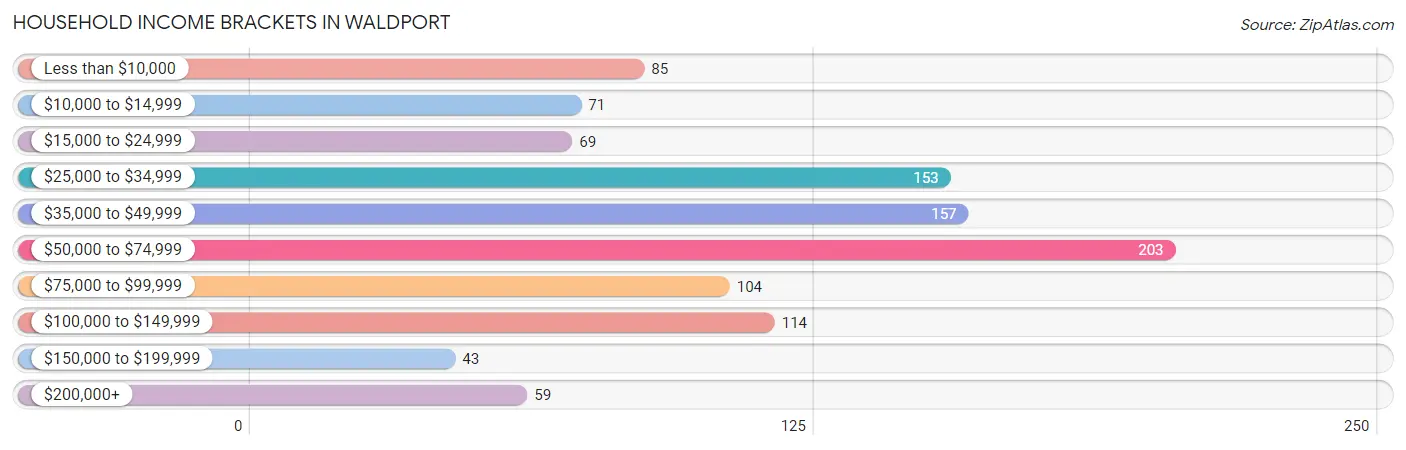
Household Income Brackets in Waldport
With 203 households falling in the category, the $50,000 to $74,999 income range is the most frequent in Waldport, accounting for 19.2% of all households. In contrast, only 43 households (4.1%) fall into the $150,000 to $199,999 income bracket, making it the least populous group.
| Income Bracket | # Households | % Households |
| Less than $10,000 | 85 | 8.0% |
| $10,000 to $14,999 | 71 | 6.7% |
| $15,000 to $24,999 | 69 | 6.5% |
| $25,000 to $34,999 | 153 | 14.5% |
| $35,000 to $49,999 | 157 | 14.8% |
| $50,000 to $74,999 | 203 | 19.2% |
| $75,000 to $99,999 | 104 | 9.8% |
| $100,000 to $149,999 | 114 | 10.8% |
| $150,000 to $199,999 | 43 | 4.1% |
| $200,000+ | 59 | 5.6% |
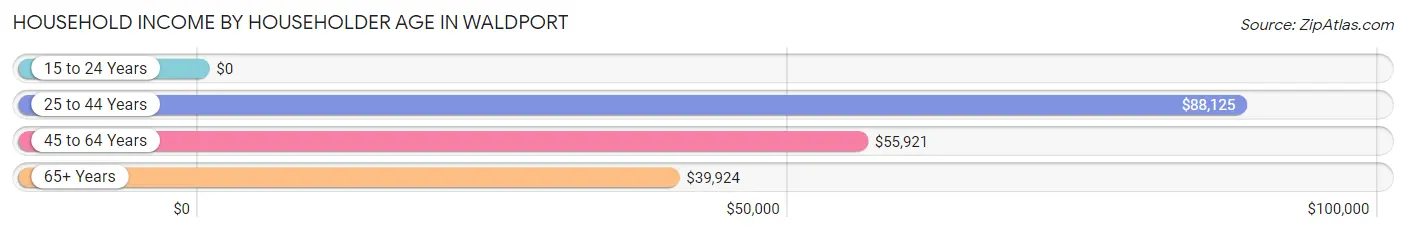
Household Income by Householder Age in Waldport
The median household income in Waldport is $49,659, with the highest median household income of $88,125 found in the 25 to 44 years age bracket for the primary householder. A total of 150 households (14.2%) fall into this category.
| Income Bracket | # Households | Median Income |
| 15 to 24 Years | 0 (0.0%) | $0 |
| 25 to 44 Years | 150 (14.2%) | $88,125 |
| 45 to 64 Years | 410 (38.8%) | $55,921 |
| 65+ Years | 498 (47.1%) | $39,924 |
| Total | 1,058 (100.0%) | $49,659 |
Poverty in Waldport
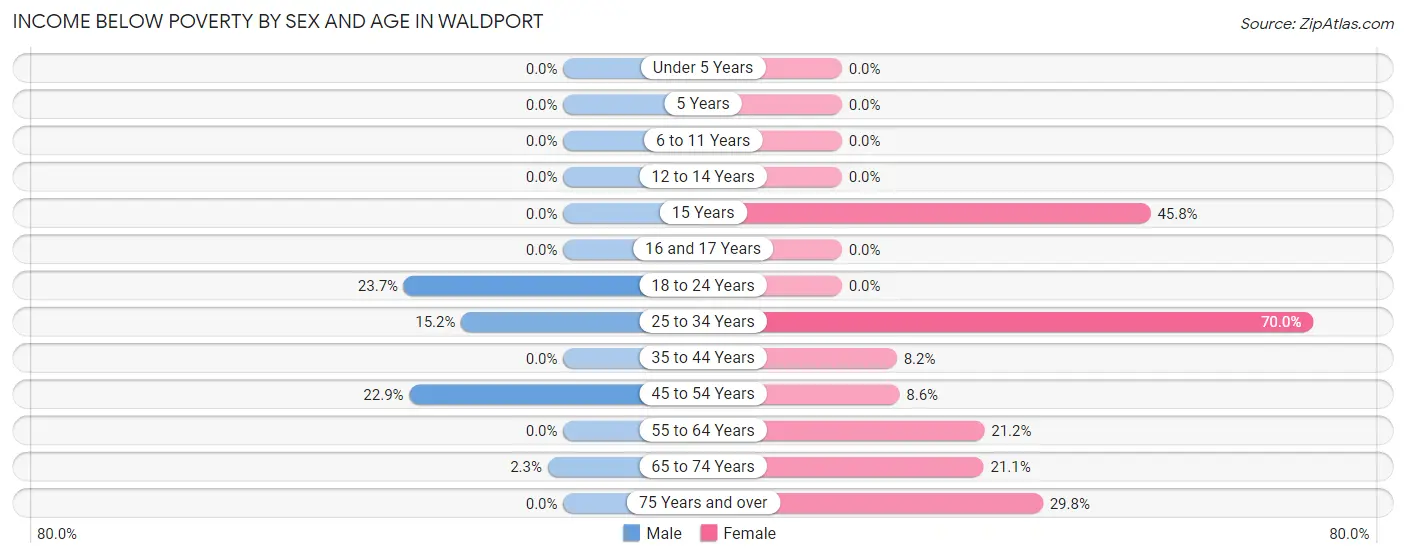
Income Below Poverty by Sex and Age in Waldport
With 5.9% poverty level for males and 18.2% for females among the residents of Waldport, 18 to 24 year old males and 25 to 34 year old females are the most vulnerable to poverty, with 9 males (23.7%) and 14 females (70.0%) in their respective age groups living below the poverty level.
| Age Bracket | Male | Female |
| Under 5 Years | 0 (0.0%) | 0 (0.0%) |
| 5 Years | 0 (0.0%) | 0 (0.0%) |
| 6 to 11 Years | 0 (0.0%) | 0 (0.0%) |
| 12 to 14 Years | 0 (0.0%) | 0 (0.0%) |
| 15 Years | 0 (0.0%) | 11 (45.8%) |
| 16 and 17 Years | 0 (0.0%) | 0 (0.0%) |
| 18 to 24 Years | 9 (23.7%) | 0 (0.0%) |
| 25 to 34 Years | 10 (15.1%) | 14 (70.0%) |
| 35 to 44 Years | 0 (0.0%) | 11 (8.2%) |
| 45 to 54 Years | 32 (22.9%) | 13 (8.6%) |
| 55 to 64 Years | 0 (0.0%) | 40 (21.2%) |
| 65 to 74 Years | 5 (2.3%) | 56 (21.0%) |
| 75 Years and over | 0 (0.0%) | 37 (29.8%) |
| Total | 56 (5.9%) | 182 (18.2%) |
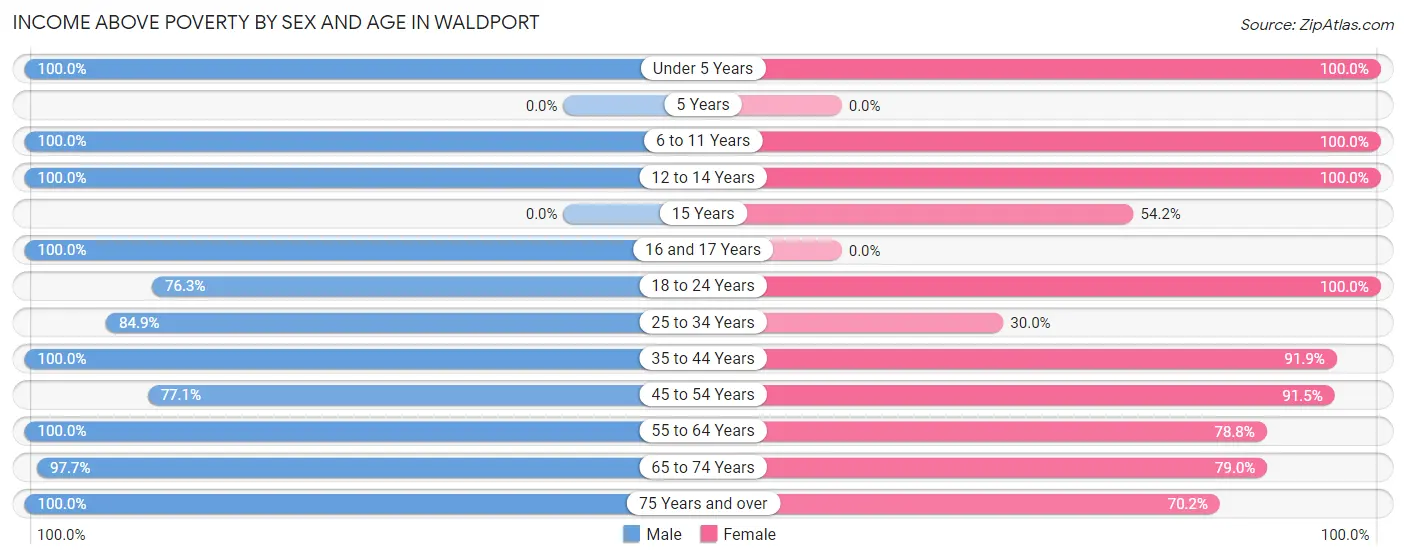
Income Above Poverty by Sex and Age in Waldport
According to the poverty statistics in Waldport, males aged under 5 years and females aged under 5 years are the age groups that are most secure financially, with 100.0% of males and 100.0% of females in these age groups living above the poverty line.
| Age Bracket | Male | Female |
| Under 5 Years | 8 (100.0%) | 5 (100.0%) |
| 5 Years | 0 (0.0%) | 0 (0.0%) |
| 6 to 11 Years | 24 (100.0%) | 16 (100.0%) |
| 12 to 14 Years | 43 (100.0%) | 25 (100.0%) |
| 15 Years | 0 (0.0%) | 13 (54.2%) |
| 16 and 17 Years | 16 (100.0%) | 0 (0.0%) |
| 18 to 24 Years | 29 (76.3%) | 45 (100.0%) |
| 25 to 34 Years | 56 (84.9%) | 6 (30.0%) |
| 35 to 44 Years | 54 (100.0%) | 124 (91.8%) |
| 45 to 54 Years | 108 (77.1%) | 139 (91.4%) |
| 55 to 64 Years | 225 (100.0%) | 149 (78.8%) |
| 65 to 74 Years | 211 (97.7%) | 210 (78.9%) |
| 75 Years and over | 119 (100.0%) | 87 (70.2%) |
| Total | 893 (94.1%) | 819 (81.8%) |
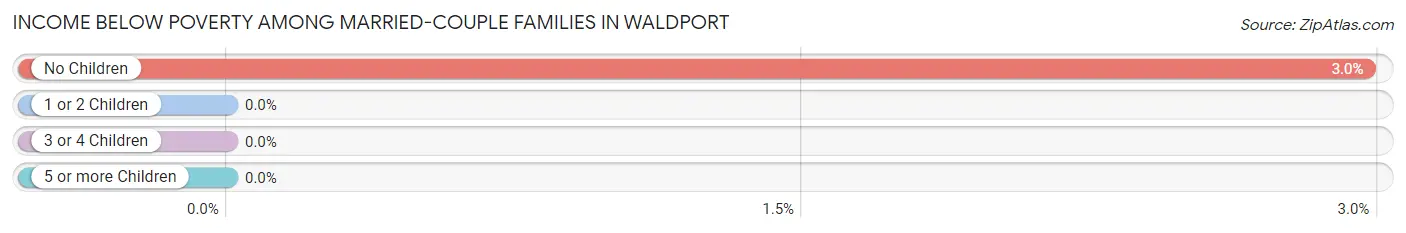
Income Below Poverty Among Married-Couple Families in Waldport
The poverty statistics for married-couple families in Waldport show that 2.5% or 11 of the total 434 families live below the poverty line. Families with no children have the highest poverty rate of 3.0%, comprising of 11 families. On the other hand, families with 1 or 2 children have the lowest poverty rate of 0.0%, which includes 0 families.
| Children | Above Poverty | Below Poverty |
| No Children | 359 (97.0%) | 11 (3.0%) |
| 1 or 2 Children | 55 (100.0%) | 0 (0.0%) |
| 3 or 4 Children | 9 (100.0%) | 0 (0.0%) |
| 5 or more Children | 0 (0.0%) | 0 (0.0%) |
| Total | 423 (97.5%) | 11 (2.5%) |
Income Below Poverty Among Single-Parent Households in Waldport
According to the poverty data in Waldport, 9.4% or 6 single-father households and 28.0% or 7 single-mother households are living below the poverty line. Among single-father households, those with no children have the highest poverty rate, with 6 households (10.0%) experiencing poverty. Likewise, among single-mother households, those with no children have the highest poverty rate, with 7 households (41.2%) falling below the poverty line.
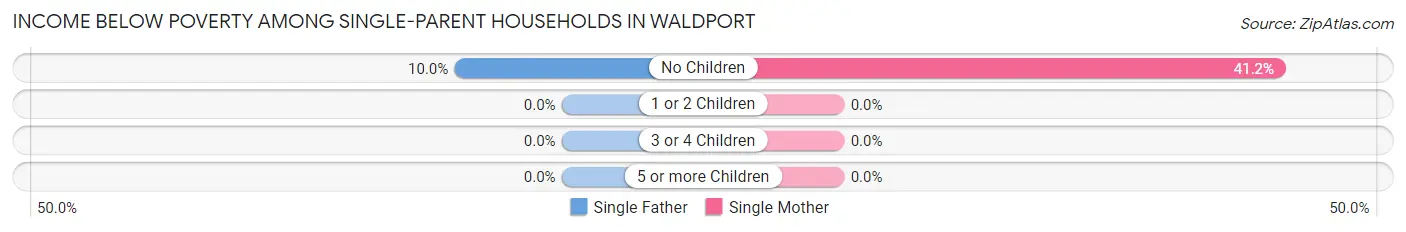
| Children | Single Father | Single Mother |
| No Children | 6 (10.0%) | 7 (41.2%) |
| 1 or 2 Children | 0 (0.0%) | 0 (0.0%) |
| 3 or 4 Children | 0 (0.0%) | 0 (0.0%) |
| 5 or more Children | 0 (0.0%) | 0 (0.0%) |
| Total | 6 (9.4%) | 7 (28.0%) |
Income Below Poverty Among Married-Couple vs Single-Parent Households in Waldport
The poverty data for Waldport shows that 11 of the married-couple family households (2.5%) and 13 of the single-parent households (14.6%) are living below the poverty level. Within the married-couple family households, those with no children have the highest poverty rate, with 11 households (3.0%) falling below the poverty line. Among the single-parent households, those with no children have the highest poverty rate, with 13 household (16.9%) living below poverty.
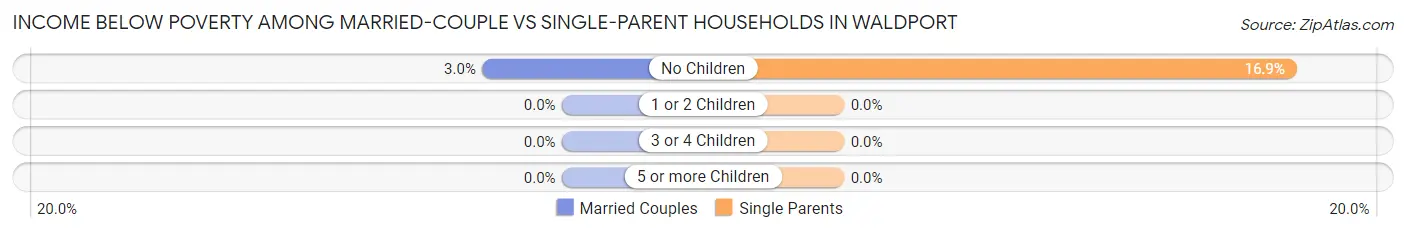
| Children | Married-Couple Families | Single-Parent Households |
| No Children | 11 (3.0%) | 13 (16.9%) |
| 1 or 2 Children | 0 (0.0%) | 0 (0.0%) |
| 3 or 4 Children | 0 (0.0%) | 0 (0.0%) |
| 5 or more Children | 0 (0.0%) | 0 (0.0%) |
| Total | 11 (2.5%) | 13 (14.6%) |
Race in Waldport
The most populous races in Waldport are White / Caucasian (1,743 | 89.4%), Two or more Races (150 | 7.7%), and Hispanic or Latino (119 | 6.1%).
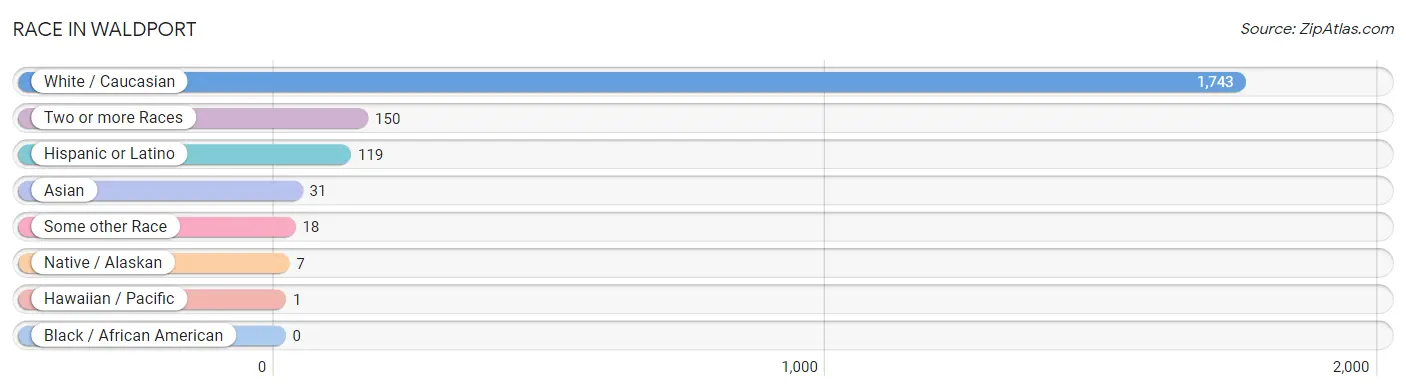
| Race | # Population | % Population |
| Asian | 31 | 1.6% |
| Black / African American | 0 | 0.0% |
| Hawaiian / Pacific | 1 | 0.1% |
| Hispanic or Latino | 119 | 6.1% |
| Native / Alaskan | 7 | 0.4% |
| White / Caucasian | 1,743 | 89.4% |
| Two or more Races | 150 | 7.7% |
| Some other Race | 18 | 0.9% |
| Total | 1,950 | 100.0% |
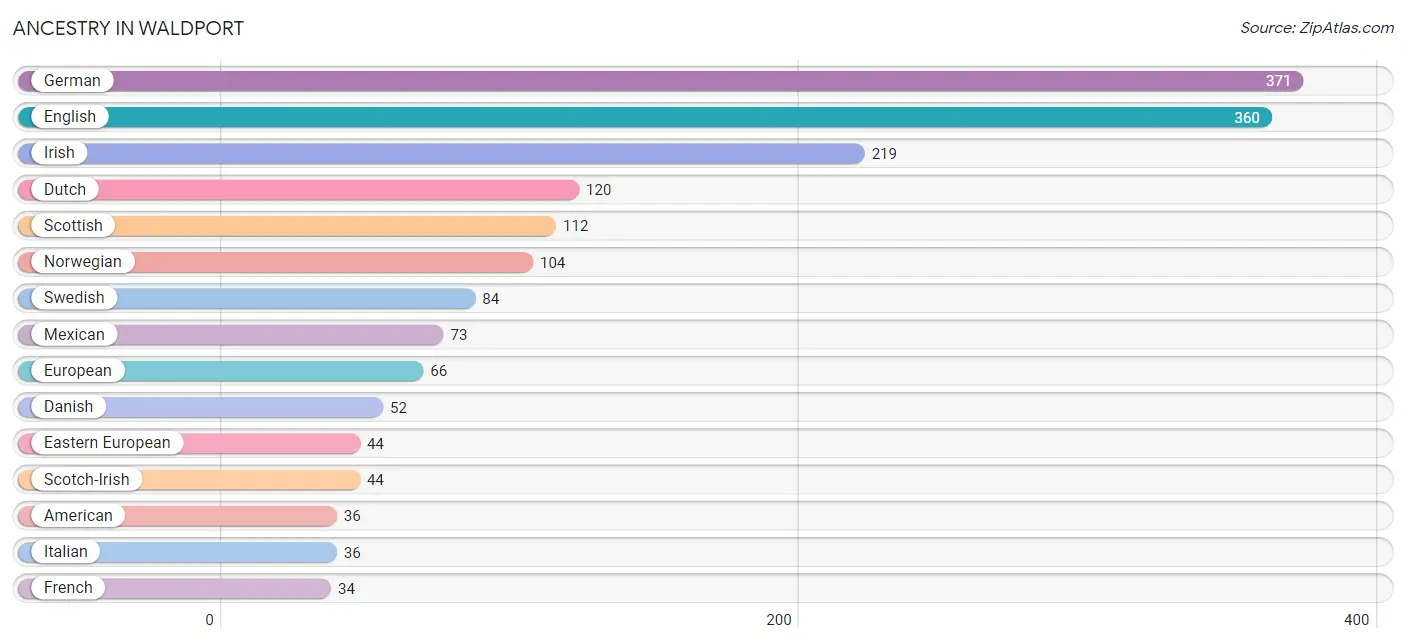
Ancestry in Waldport
The most populous ancestries reported in Waldport are German (371 | 19.0%), English (360 | 18.5%), Irish (219 | 11.2%), Dutch (120 | 6.1%), and Scottish (112 | 5.7%), together accounting for 60.6% of all Waldport residents.
| Ancestry | # Population | % Population |
| American | 36 | 1.8% |
| Austrian | 14 | 0.7% |
| Basque | 7 | 0.4% |
| Belgian | 5 | 0.3% |
| British | 14 | 0.7% |
| Burmese | 9 | 0.5% |
| Canadian | 14 | 0.7% |
| Cherokee | 22 | 1.1% |
| Creek | 7 | 0.4% |
| Czech | 15 | 0.8% |
| Danish | 52 | 2.7% |
| Dutch | 120 | 6.1% |
| Eastern European | 44 | 2.3% |
| English | 360 | 18.5% |
| European | 66 | 3.4% |
| Finnish | 15 | 0.8% |
| French | 34 | 1.7% |
| German | 371 | 19.0% |
| Greek | 6 | 0.3% |
| Indian (Asian) | 10 | 0.5% |
| Irish | 219 | 11.2% |
| Italian | 36 | 1.8% |
| Mexican | 73 | 3.7% |
| Native Hawaiian | 1 | 0.1% |
| Norwegian | 104 | 5.3% |
| Polish | 20 | 1.0% |
| Russian | 5 | 0.3% |
| Scandinavian | 15 | 0.8% |
| Scotch-Irish | 44 | 2.3% |
| Scottish | 112 | 5.7% |
| Spaniard | 7 | 0.4% |
| Sri Lankan | 12 | 0.6% |
| Swedish | 84 | 4.3% |
| Welsh | 22 | 1.1% | View All 34 Rows |
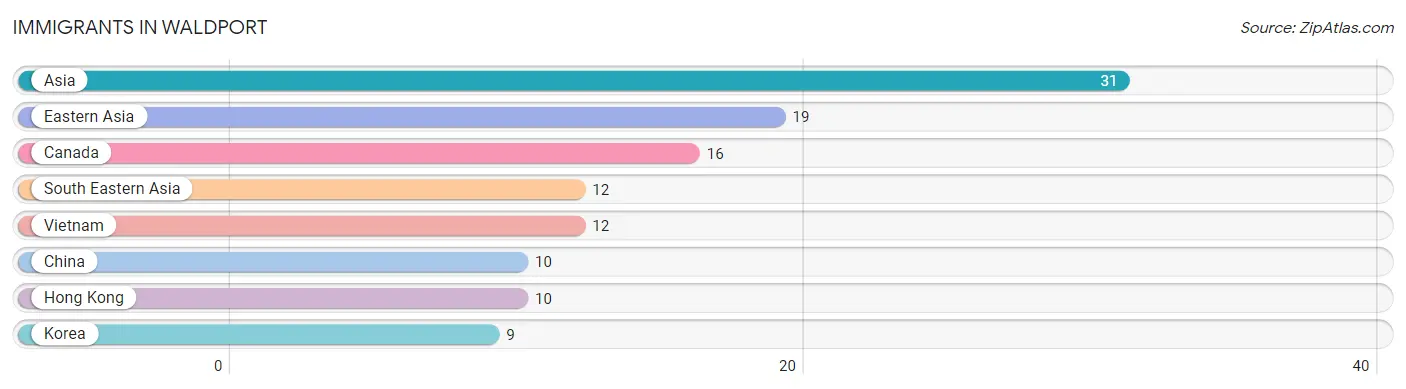
Immigrants in Waldport
The most numerous immigrant groups reported in Waldport came from Asia (31 | 1.6%), Eastern Asia (19 | 1.0%), Canada (16 | 0.8%), South Eastern Asia (12 | 0.6%), and Vietnam (12 | 0.6%), together accounting for 4.6% of all Waldport residents.
| Immigration Origin | # Population | % Population |
| Asia | 31 | 1.6% |
| Canada | 16 | 0.8% |
| China | 10 | 0.5% |
| Eastern Asia | 19 | 1.0% |
| Hong Kong | 10 | 0.5% |
| Korea | 9 | 0.5% |
| South Eastern Asia | 12 | 0.6% |
| Vietnam | 12 | 0.6% | View All 8 Rows |
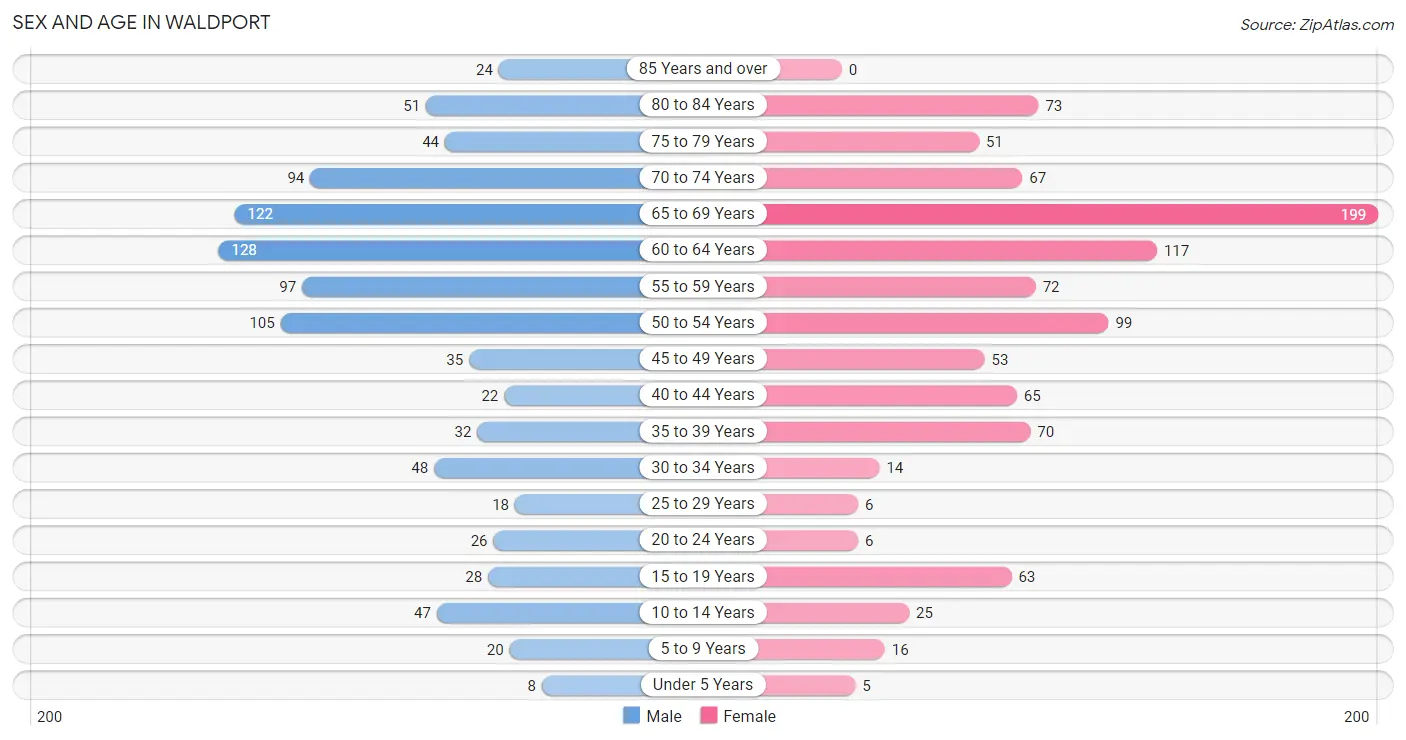
Sex and Age in Waldport
Sex and Age in Waldport
The most populous age groups in Waldport are 60 to 64 Years (128 | 13.5%) for men and 65 to 69 Years (199 | 19.9%) for women.
| Age Bracket | Male | Female |
| Under 5 Years | 8 (0.8%) | 5 (0.5%) |
| 5 to 9 Years | 20 (2.1%) | 16 (1.6%) |
| 10 to 14 Years | 47 (5.0%) | 25 (2.5%) |
| 15 to 19 Years | 28 (2.9%) | 63 (6.3%) |
| 20 to 24 Years | 26 (2.7%) | 6 (0.6%) |
| 25 to 29 Years | 18 (1.9%) | 6 (0.6%) |
| 30 to 34 Years | 48 (5.1%) | 14 (1.4%) |
| 35 to 39 Years | 32 (3.4%) | 70 (7.0%) |
| 40 to 44 Years | 22 (2.3%) | 65 (6.5%) |
| 45 to 49 Years | 35 (3.7%) | 53 (5.3%) |
| 50 to 54 Years | 105 (11.1%) | 99 (9.9%) |
| 55 to 59 Years | 97 (10.2%) | 72 (7.2%) |
| 60 to 64 Years | 128 (13.5%) | 117 (11.7%) |
| 65 to 69 Years | 122 (12.9%) | 199 (19.9%) |
| 70 to 74 Years | 94 (9.9%) | 67 (6.7%) |
| 75 to 79 Years | 44 (4.6%) | 51 (5.1%) |
| 80 to 84 Years | 51 (5.4%) | 73 (7.3%) |
| 85 Years and over | 24 (2.5%) | 0 (0.0%) |
| Total | 949 (100.0%) | 1,001 (100.0%) |
Families and Households in Waldport
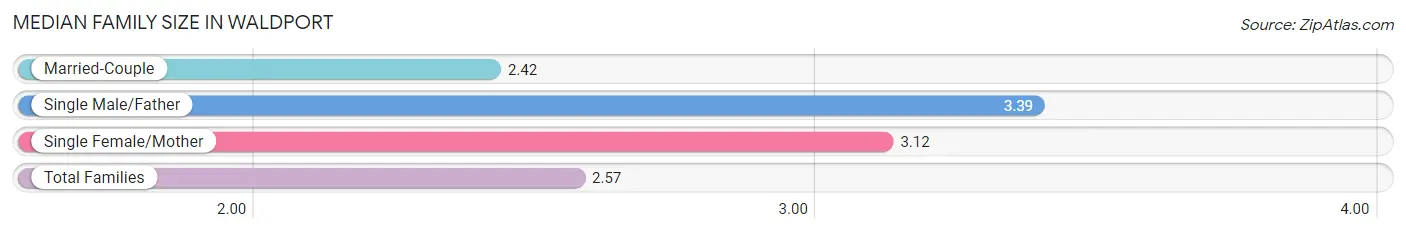
Median Family Size in Waldport
The median family size in Waldport is 2.57 persons per family, with single male/father families (64 | 12.2%) accounting for the largest median family size of 3.39 persons per family. On the other hand, married-couple families (434 | 83.0%) represent the smallest median family size with 2.42 persons per family.
| Family Type | # Families | Family Size |
| Married-Couple | 434 (83.0%) | 2.42 |
| Single Male/Father | 64 (12.2%) | 3.39 |
| Single Female/Mother | 25 (4.8%) | 3.12 |
| Total Families | 523 (100.0%) | 2.57 |
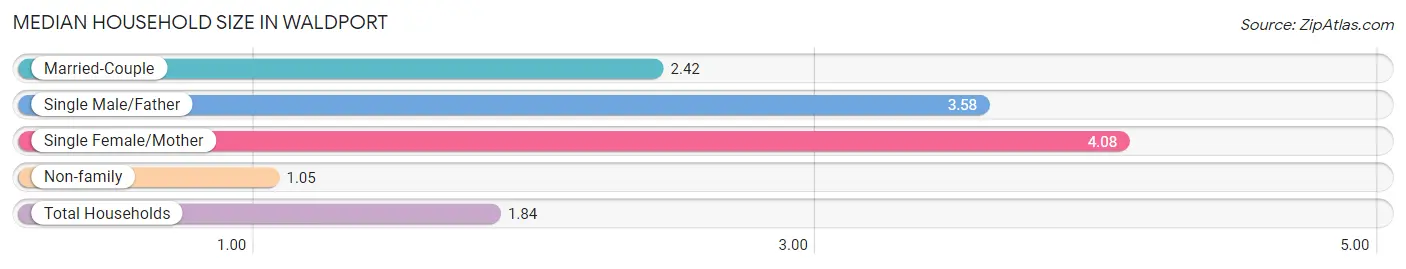
Median Household Size in Waldport
The median household size in Waldport is 1.84 persons per household, with single female/mother households (25 | 2.4%) accounting for the largest median household size of 4.08 persons per household. non-family households (535 | 50.6%) represent the smallest median household size with 1.05 persons per household.
| Household Type | # Households | Household Size |
| Married-Couple | 434 (41.0%) | 2.42 |
| Single Male/Father | 64 (6.0%) | 3.58 |
| Single Female/Mother | 25 (2.4%) | 4.08 |
| Non-family | 535 (50.6%) | 1.05 |
| Total Households | 1,058 (100.0%) | 1.84 |
Household Size by Marriage Status in Waldport
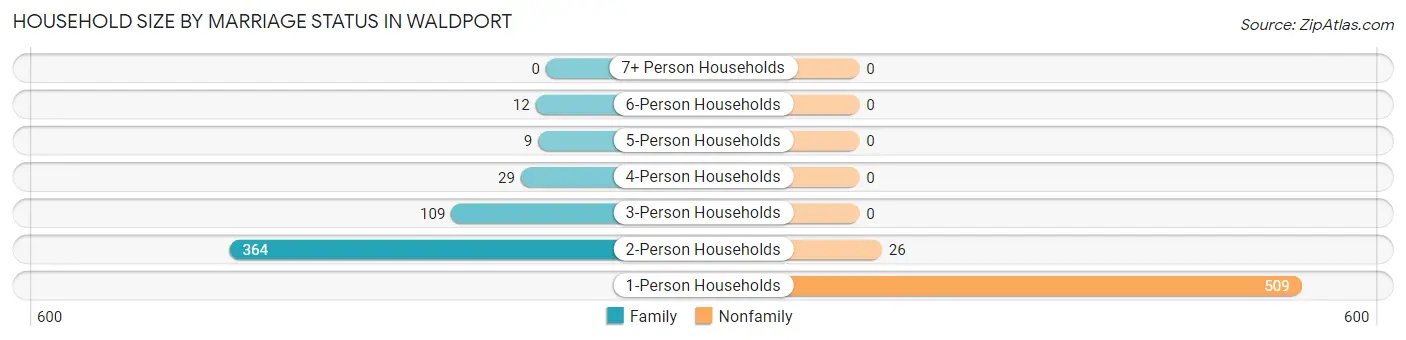
Out of a total of 1,058 households in Waldport, 523 (49.4%) are family households, while 535 (50.6%) are nonfamily households. The most numerous type of family households are 2-person households, comprising 364, and the most common type of nonfamily households are 1-person households, comprising 509.
| Household Size | Family Households | Nonfamily Households |
| 1-Person Households | - | 509 (48.1%) |
| 2-Person Households | 364 (34.4%) | 26 (2.5%) |
| 3-Person Households | 109 (10.3%) | 0 (0.0%) |
| 4-Person Households | 29 (2.7%) | 0 (0.0%) |
| 5-Person Households | 9 (0.9%) | 0 (0.0%) |
| 6-Person Households | 12 (1.1%) | 0 (0.0%) |
| 7+ Person Households | 0 (0.0%) | 0 (0.0%) |
| Total | 523 (49.4%) | 535 (50.6%) |
Female Fertility in Waldport
Fertility by Age in Waldport
| Age Bracket | Women with Births | Births / 1,000 Women |
| 15 to 19 years | 0 (0.0%) | 0.0 |
| 20 to 34 years | 0 (0.0%) | 0.0 |
| 35 to 50 years | 0 (0.0%) | 0.0 |
| Total | 0 (0.0%) | 0.0 |
Fertility by Age by Marriage Status in Waldport
| Age Bracket | Married | Unmarried |
| 15 to 19 years | 0 (0.0%) | 0 (0.0%) |
| 20 to 34 years | 0 (0.0%) | 0 (0.0%) |
| 35 to 50 years | 0 (0.0%) | 0 (0.0%) |
| Total | 0 (0.0%) | 0 (0.0%) |
Fertility by Education in Waldport
| Educational Attainment | Women with Births | Births / 1,000 Women |
| Less than High School | 0 (0.0%) | 0.0 |
| High School Diploma | 0 (0.0%) | 0.0 |
| College or Associate's Degree | 0 (0.0%) | 0.0 |
| Bachelor's Degree | 0 (0.0%) | 0.0 |
| Graduate Degree | 0 (0.0%) | 0.0 |
| Total | 0 (0.0%) | 0.0 |
Fertility by Education by Marriage Status in Waldport
| Educational Attainment | Married | Unmarried |
| Less than High School | 0 (0.0%) | 0 (0.0%) |
| High School Diploma | 0 (0.0%) | 0 (0.0%) |
| College or Associate's Degree | 0 (0.0%) | 0 (0.0%) |
| Bachelor's Degree | 0 (0.0%) | 0 (0.0%) |
| Graduate Degree | 0 (0.0%) | 0 (0.0%) |
| Total | 0 (0.0%) | 0 (0.0%) |
Employment Characteristics in Waldport
Employment by Class of Employer in Waldport
Among the 648 employed individuals in Waldport, private company employees (336 | 51.8%), self-employed (not incorporated) (134 | 20.7%), and local government employees (74 | 11.4%) make up the most common classes of employment.
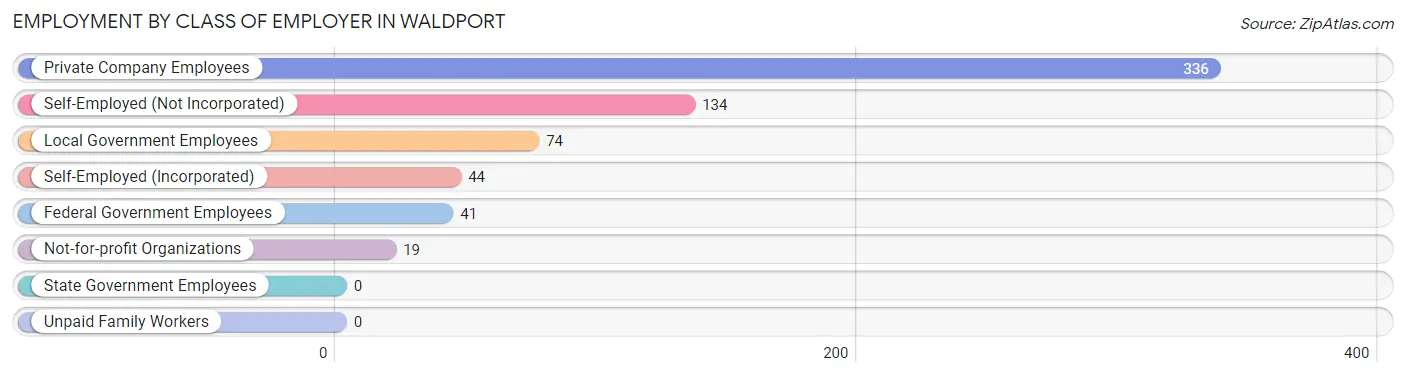
| Employer Class | # Employees | % Employees |
| Private Company Employees | 336 | 51.8% |
| Self-Employed (Incorporated) | 44 | 6.8% |
| Self-Employed (Not Incorporated) | 134 | 20.7% |
| Not-for-profit Organizations | 19 | 2.9% |
| Local Government Employees | 74 | 11.4% |
| State Government Employees | 0 | 0.0% |
| Federal Government Employees | 41 | 6.3% |
| Unpaid Family Workers | 0 | 0.0% |
| Total | 648 | 100.0% |
Employment Status by Age in Waldport
According to the labor force statistics for Waldport, out of the total population over 16 years of age (1,805), 44.4% or 801 individuals are in the labor force, with 17.3% or 139 of them unemployed. The age group with the highest labor force participation rate is 25 to 29 years, with 100.0% or 24 individuals in the labor force. Within the labor force, the 30 to 34 years age range has the highest percentage of unemployed individuals, with 77.4% or 48 of them being unemployed.
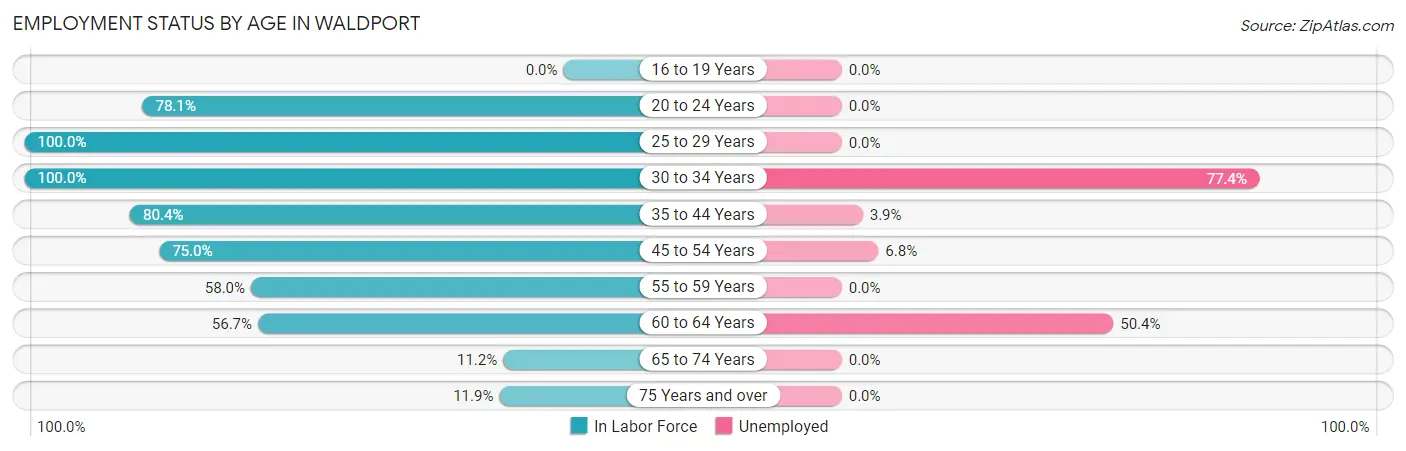
| Age Bracket | In Labor Force | Unemployed |
| 16 to 19 Years | 0 (0.0%) | 0 (0.0%) |
| 20 to 24 Years | 25 (78.1%) | 0 (0.0%) |
| 25 to 29 Years | 24 (100.0%) | 0 (0.0%) |
| 30 to 34 Years | 62 (100.0%) | 48 (77.4%) |
| 35 to 44 Years | 152 (80.4%) | 6 (3.9%) |
| 45 to 54 Years | 219 (75.0%) | 15 (6.8%) |
| 55 to 59 Years | 98 (58.0%) | 0 (0.0%) |
| 60 to 64 Years | 139 (56.7%) | 70 (50.4%) |
| 65 to 74 Years | 54 (11.2%) | 0 (0.0%) |
| 75 Years and over | 29 (11.9%) | 0 (0.0%) |
| Total | 801 (44.4%) | 139 (17.3%) |
Employment Status by Educational Attainment in Waldport
According to labor force statistics for Waldport, 70.7% of individuals (694) out of the total population between 25 and 64 years of age (981) are in the labor force, with 20.0% or 139 of them being unemployed. The group with the highest labor force participation rate are those with the educational attainment of high school diploma, with 83.2% or 223 individuals in the labor force. Within the labor force, individuals with high school diploma education have the highest percentage of unemployment, with 34.1% or 76 of them being unemployed.
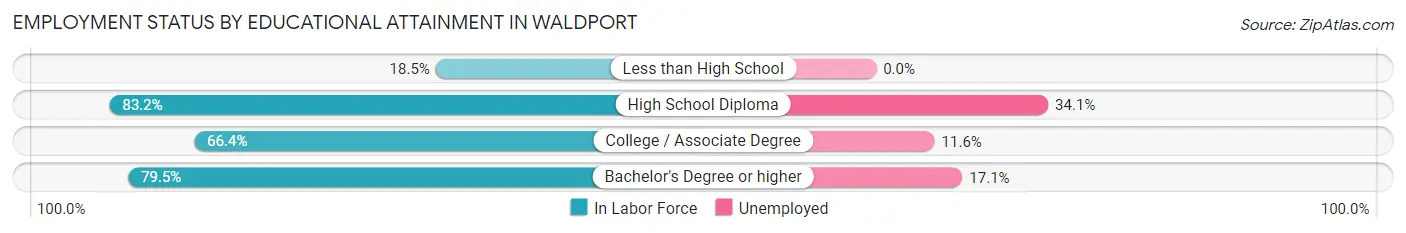
| Educational Attainment | In Labor Force | Unemployed |
| Less than High School | 12 (18.5%) | 0 (0.0%) |
| High School Diploma | 223 (83.2%) | 91 (34.1%) |
| College / Associate Degree | 284 (66.4%) | 50 (11.6%) |
| Bachelor's Degree or higher | 175 (79.5%) | 38 (17.1%) |
| Total | 694 (70.7%) | 196 (20.0%) |
Employment Occupations by Sex in Waldport
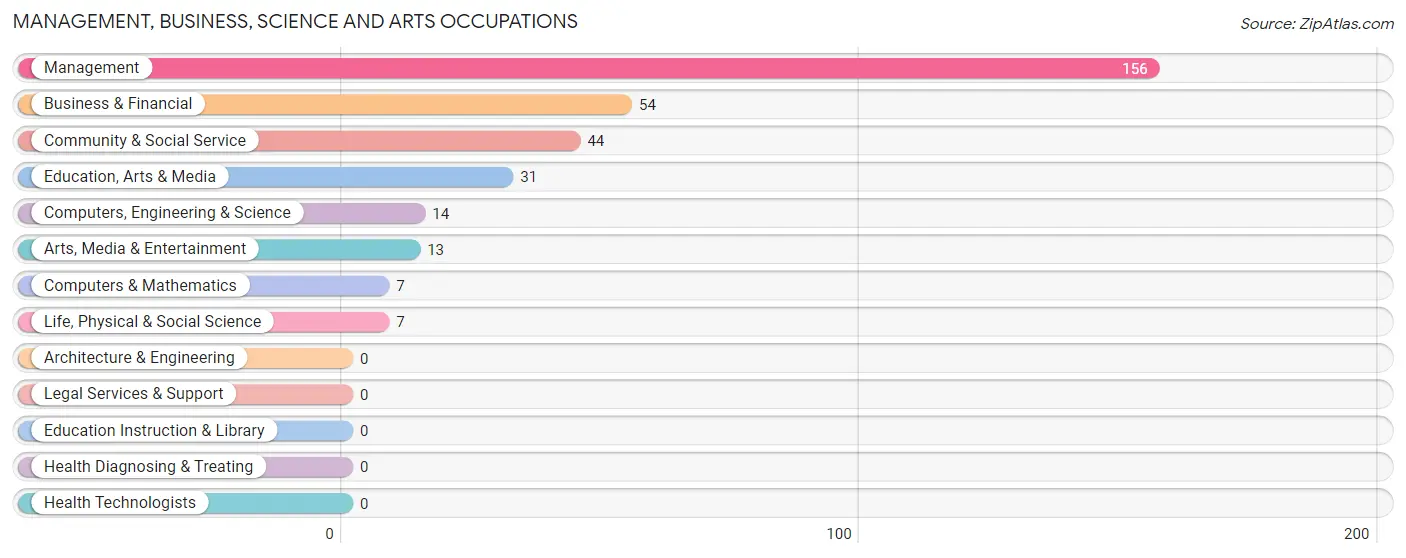
Management, Business, Science and Arts Occupations
The most common Management, Business, Science and Arts occupations in Waldport are Management (156 | 23.5%), Business & Financial (54 | 8.1%), Community & Social Service (44 | 6.6%), Education, Arts & Media (31 | 4.7%), and Computers, Engineering & Science (14 | 2.1%).
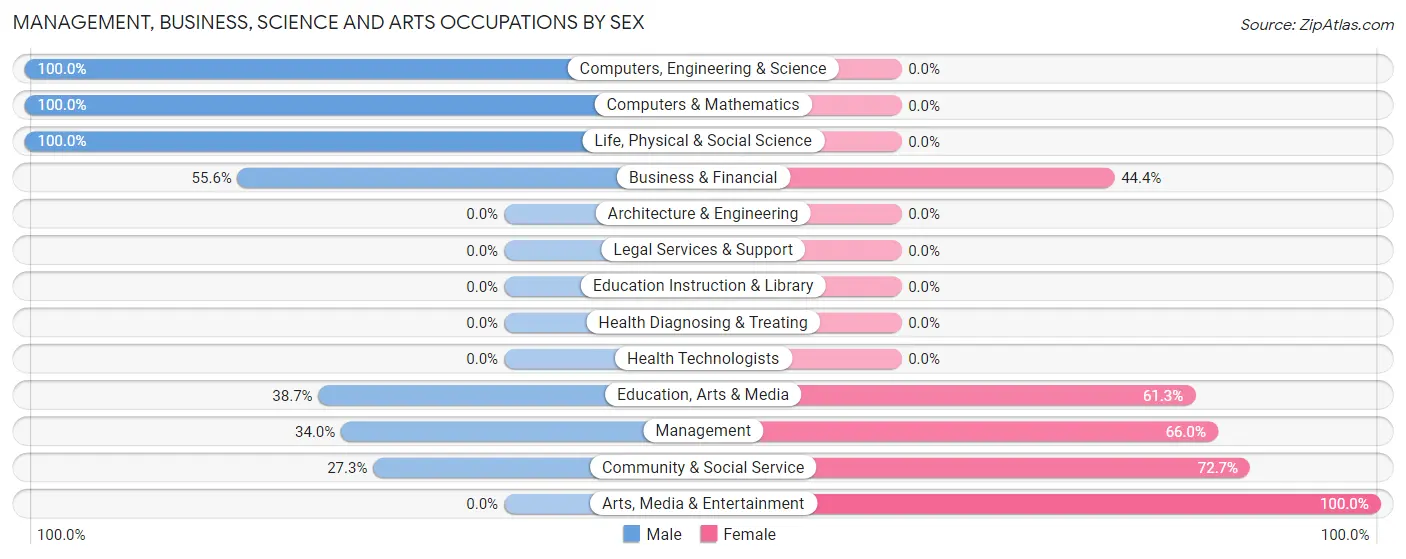
Management, Business, Science and Arts Occupations by Sex
Within the Management, Business, Science and Arts occupations in Waldport, the most male-oriented occupations are Computers, Engineering & Science (100.0%), Computers & Mathematics (100.0%), and Life, Physical & Social Science (100.0%), while the most female-oriented occupations are Arts, Media & Entertainment (100.0%), Community & Social Service (72.7%), and Management (66.0%).
| Occupation | Male | Female |
| Management | 53 (34.0%) | 103 (66.0%) |
| Business & Financial | 30 (55.6%) | 24 (44.4%) |
| Computers, Engineering & Science | 14 (100.0%) | 0 (0.0%) |
| Computers & Mathematics | 7 (100.0%) | 0 (0.0%) |
| Architecture & Engineering | 0 (0.0%) | 0 (0.0%) |
| Life, Physical & Social Science | 7 (100.0%) | 0 (0.0%) |
| Community & Social Service | 12 (27.3%) | 32 (72.7%) |
| Education, Arts & Media | 12 (38.7%) | 19 (61.3%) |
| Legal Services & Support | 0 (0.0%) | 0 (0.0%) |
| Education Instruction & Library | 0 (0.0%) | 0 (0.0%) |
| Arts, Media & Entertainment | 0 (0.0%) | 13 (100.0%) |
| Health Diagnosing & Treating | 0 (0.0%) | 0 (0.0%) |
| Health Technologists | 0 (0.0%) | 0 (0.0%) |
| Total (Category) | 109 (40.7%) | 159 (59.3%) |
| Total (Overall) | 290 (43.7%) | 373 (56.3%) |
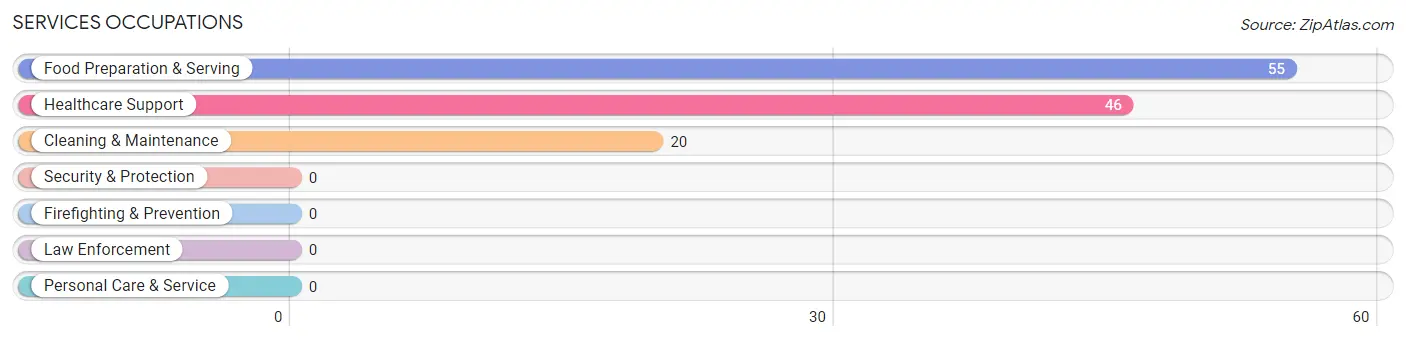
Services Occupations
The most common Services occupations in Waldport are Food Preparation & Serving (55 | 8.3%), Healthcare Support (46 | 6.9%), and Cleaning & Maintenance (20 | 3.0%).
Services Occupations by Sex
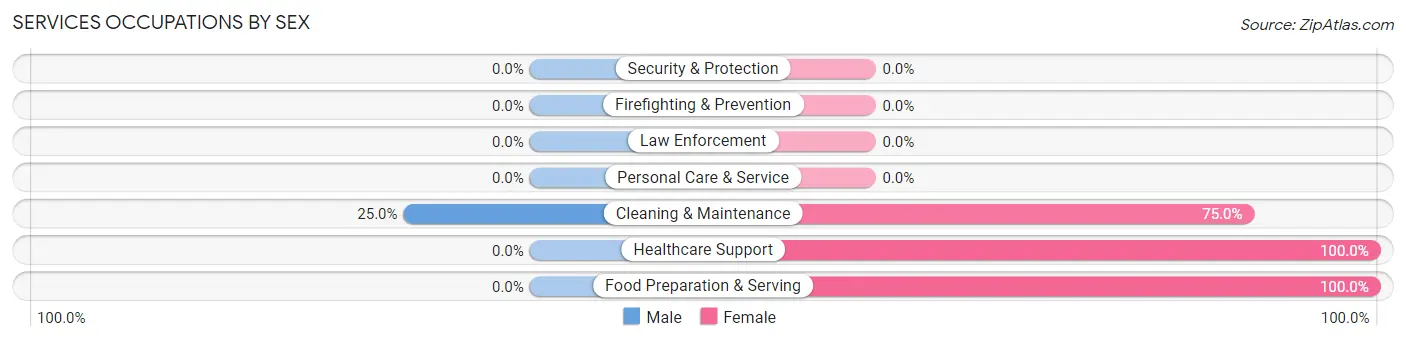
| Occupation | Male | Female |
| Healthcare Support | 0 (0.0%) | 46 (100.0%) |
| Security & Protection | 0 (0.0%) | 0 (0.0%) |
| Firefighting & Prevention | 0 (0.0%) | 0 (0.0%) |
| Law Enforcement | 0 (0.0%) | 0 (0.0%) |
| Food Preparation & Serving | 0 (0.0%) | 55 (100.0%) |
| Cleaning & Maintenance | 5 (25.0%) | 15 (75.0%) |
| Personal Care & Service | 0 (0.0%) | 0 (0.0%) |
| Total (Category) | 5 (4.1%) | 116 (95.9%) |
| Total (Overall) | 290 (43.7%) | 373 (56.3%) |
Sales and Office Occupations
The most common Sales and Office occupations in Waldport are Office & Administration (81 | 12.2%), and Sales & Related (56 | 8.5%).
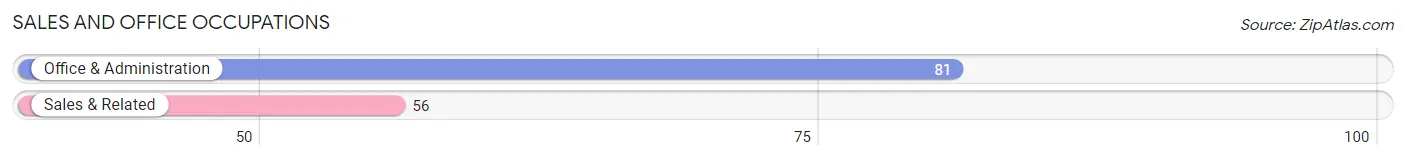
Sales and Office Occupations by Sex

| Occupation | Male | Female |
| Sales & Related | 29 (51.8%) | 27 (48.2%) |
| Office & Administration | 10 (12.3%) | 71 (87.6%) |
| Total (Category) | 39 (28.5%) | 98 (71.5%) |
| Total (Overall) | 290 (43.7%) | 373 (56.3%) |
Natural Resources, Construction and Maintenance Occupations
The most common Natural Resources, Construction and Maintenance occupations in Waldport are Construction & Extraction (67 | 10.1%), and Installation, Maintenance & Repair (21 | 3.2%).
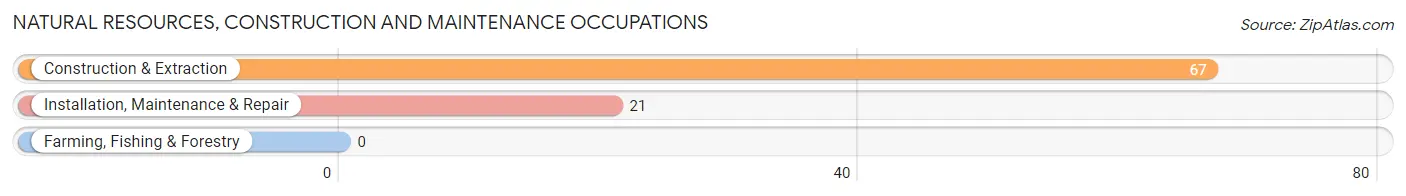
Natural Resources, Construction and Maintenance Occupations by Sex
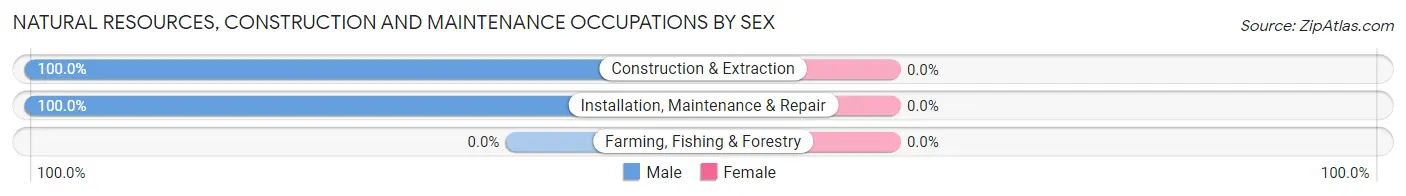
| Occupation | Male | Female |
| Farming, Fishing & Forestry | 0 (0.0%) | 0 (0.0%) |
| Construction & Extraction | 67 (100.0%) | 0 (0.0%) |
| Installation, Maintenance & Repair | 21 (100.0%) | 0 (0.0%) |
| Total (Category) | 88 (100.0%) | 0 (0.0%) |
| Total (Overall) | 290 (43.7%) | 373 (56.3%) |
Production, Transportation and Moving Occupations
The most common Production, Transportation and Moving occupations in Waldport are Transportation (37 | 5.6%), and Production (12 | 1.8%).
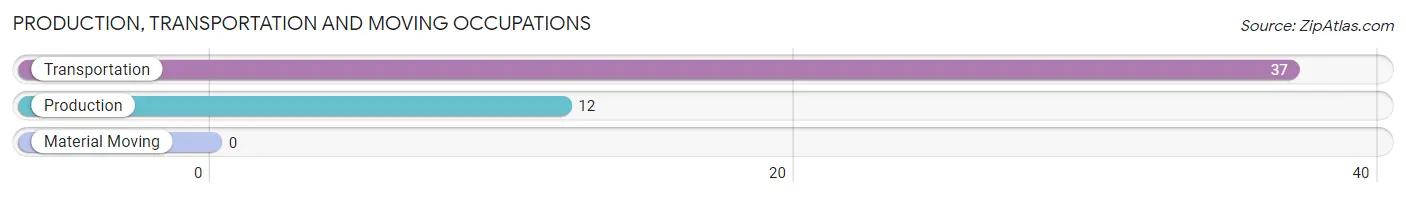
Production, Transportation and Moving Occupations by Sex
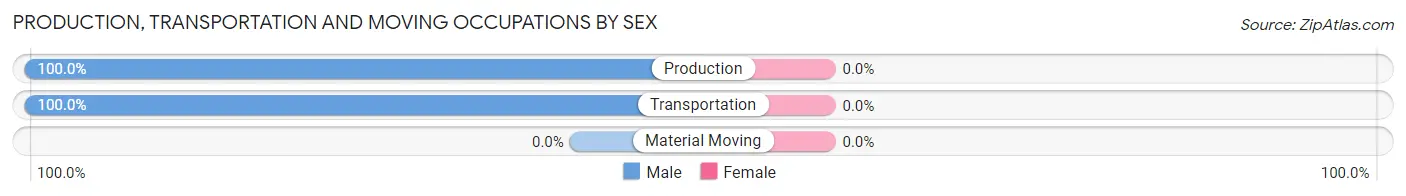
| Occupation | Male | Female |
| Production | 12 (100.0%) | 0 (0.0%) |
| Transportation | 37 (100.0%) | 0 (0.0%) |
| Material Moving | 0 (0.0%) | 0 (0.0%) |
| Total (Category) | 49 (100.0%) | 0 (0.0%) |
| Total (Overall) | 290 (43.7%) | 373 (56.3%) |
Employment Industries by Sex in Waldport
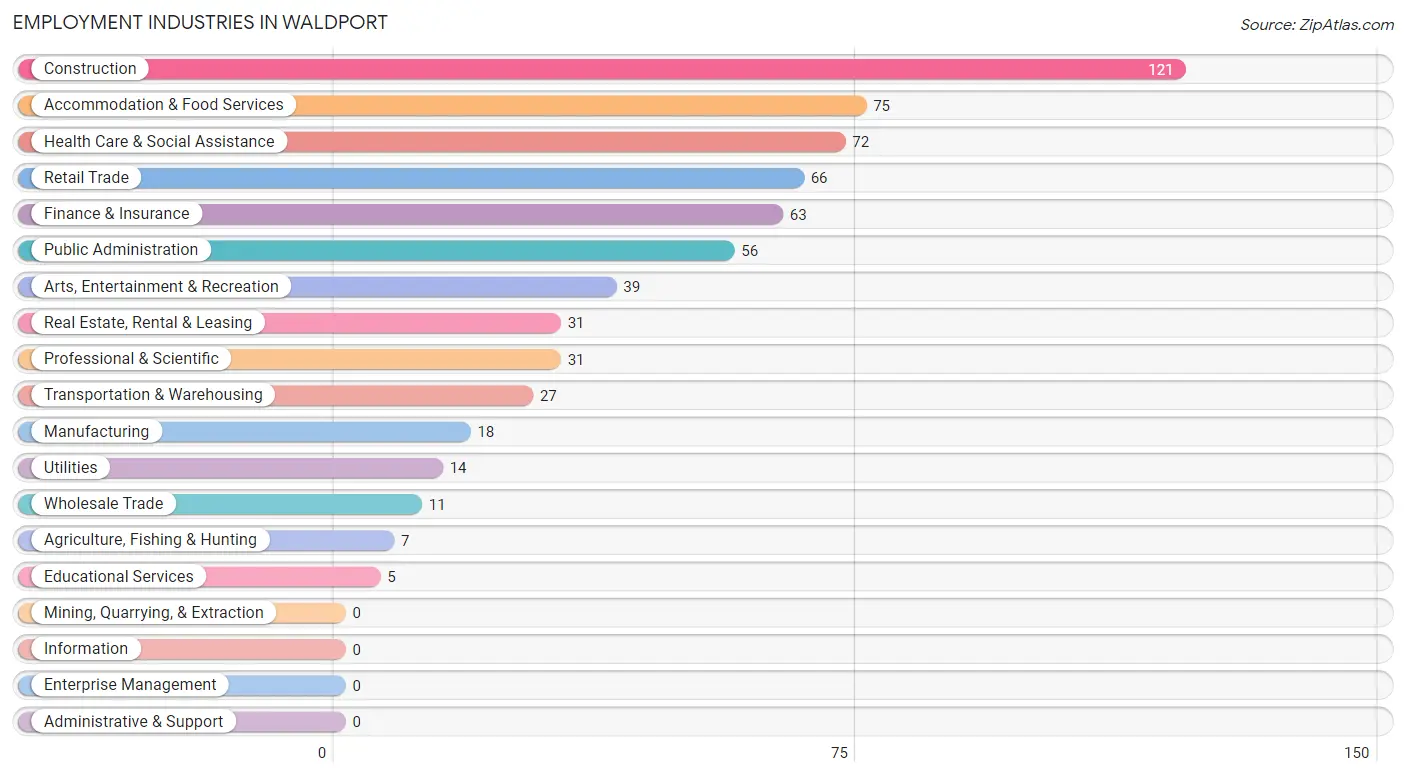
Employment Industries in Waldport
The major employment industries in Waldport include Construction (121 | 18.2%), Accommodation & Food Services (75 | 11.3%), Health Care & Social Assistance (72 | 10.9%), Retail Trade (66 | 10.0%), and Finance & Insurance (63 | 9.5%).
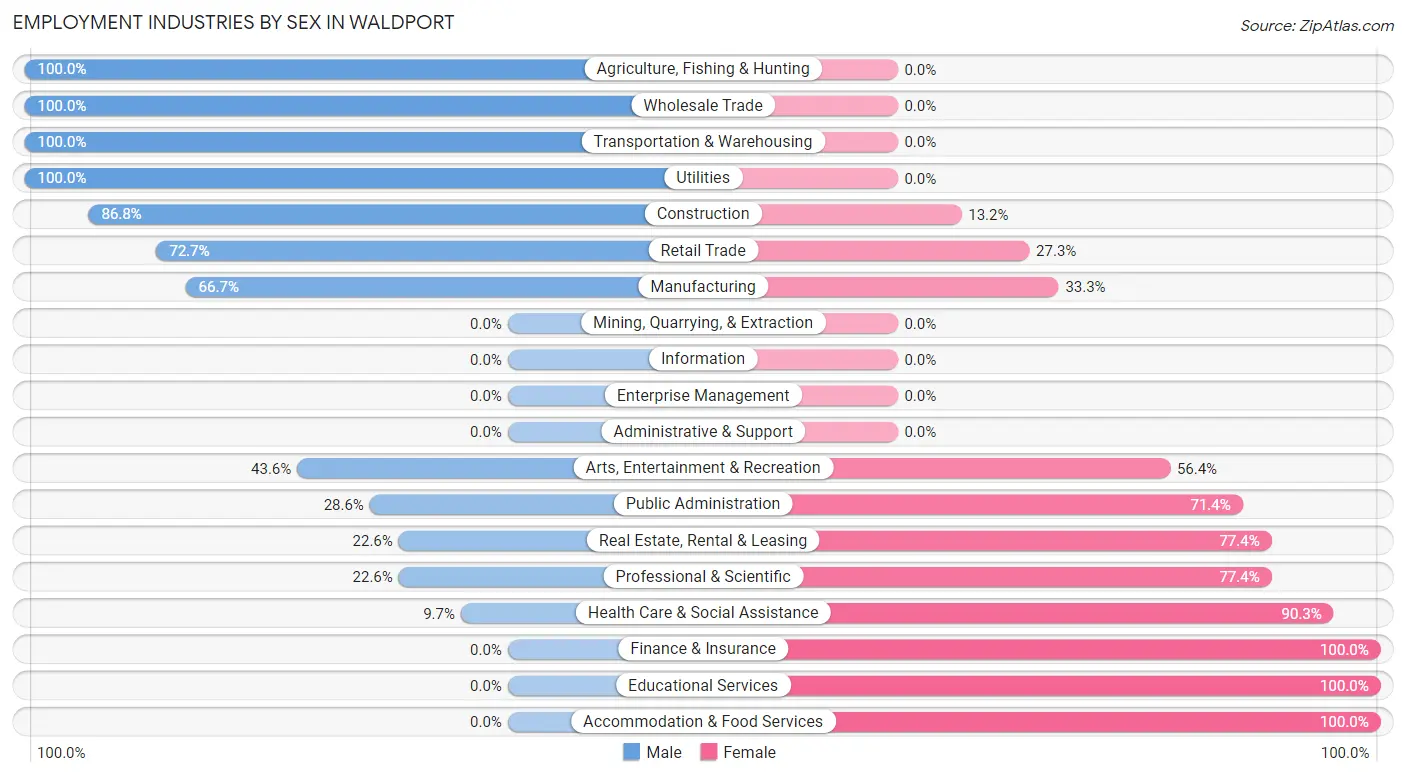
Employment Industries by Sex in Waldport
The Waldport industries that see more men than women are Agriculture, Fishing & Hunting (100.0%), Wholesale Trade (100.0%), and Transportation & Warehousing (100.0%), whereas the industries that tend to have a higher number of women are Finance & Insurance (100.0%), Educational Services (100.0%), and Accommodation & Food Services (100.0%).
| Industry | Male | Female |
| Agriculture, Fishing & Hunting | 7 (100.0%) | 0 (0.0%) |
| Mining, Quarrying, & Extraction | 0 (0.0%) | 0 (0.0%) |
| Construction | 105 (86.8%) | 16 (13.2%) |
| Manufacturing | 12 (66.7%) | 6 (33.3%) |
| Wholesale Trade | 11 (100.0%) | 0 (0.0%) |
| Retail Trade | 48 (72.7%) | 18 (27.3%) |
| Transportation & Warehousing | 27 (100.0%) | 0 (0.0%) |
| Utilities | 14 (100.0%) | 0 (0.0%) |
| Information | 0 (0.0%) | 0 (0.0%) |
| Finance & Insurance | 0 (0.0%) | 63 (100.0%) |
| Real Estate, Rental & Leasing | 7 (22.6%) | 24 (77.4%) |
| Professional & Scientific | 7 (22.6%) | 24 (77.4%) |
| Enterprise Management | 0 (0.0%) | 0 (0.0%) |
| Administrative & Support | 0 (0.0%) | 0 (0.0%) |
| Educational Services | 0 (0.0%) | 5 (100.0%) |
| Health Care & Social Assistance | 7 (9.7%) | 65 (90.3%) |
| Arts, Entertainment & Recreation | 17 (43.6%) | 22 (56.4%) |
| Accommodation & Food Services | 0 (0.0%) | 75 (100.0%) |
| Public Administration | 16 (28.6%) | 40 (71.4%) |
| Total | 290 (43.7%) | 373 (56.3%) |
Education in Waldport
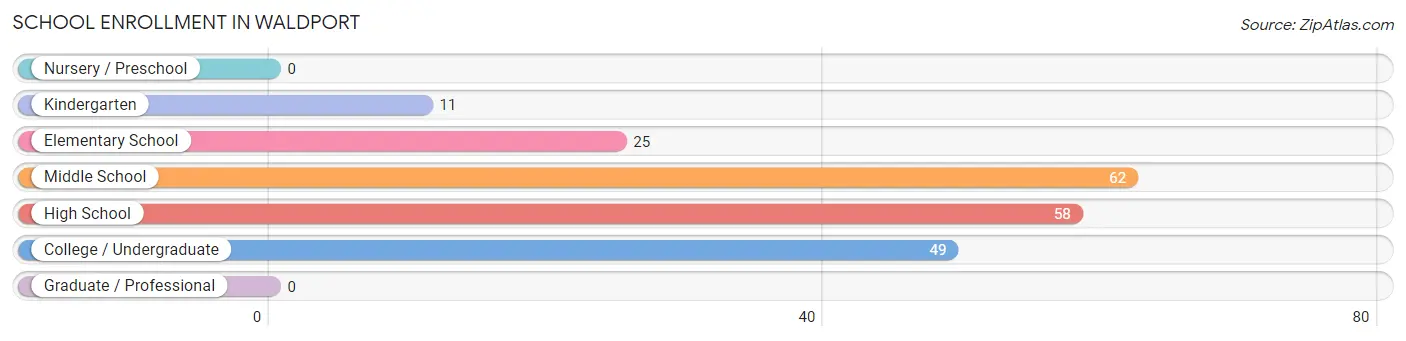
School Enrollment in Waldport
The most common levels of schooling among the 205 students in Waldport are middle school (62 | 30.2%), high school (58 | 28.3%), and college / undergraduate (49 | 23.9%).
| School Level | # Students | % Students |
| Nursery / Preschool | 0 | 0.0% |
| Kindergarten | 11 | 5.4% |
| Elementary School | 25 | 12.2% |
| Middle School | 62 | 30.2% |
| High School | 58 | 28.3% |
| College / Undergraduate | 49 | 23.9% |
| Graduate / Professional | 0 | 0.0% |
| Total | 205 | 100.0% |
School Enrollment by Age by Funding Source in Waldport
Out of a total of 205 students who are enrolled in schools in Waldport, 38 (18.5%) attend a private institution, while the remaining 167 (81.5%) are enrolled in public schools. The age group of 10 to 14 year olds has the highest likelihood of being enrolled in private schools, with 25 (34.7% in the age bracket) enrolled. Conversely, the age group of 5 to 9 year old has the lowest likelihood of being enrolled in a private school, with 36 (100.0% in the age bracket) attending a public institution.
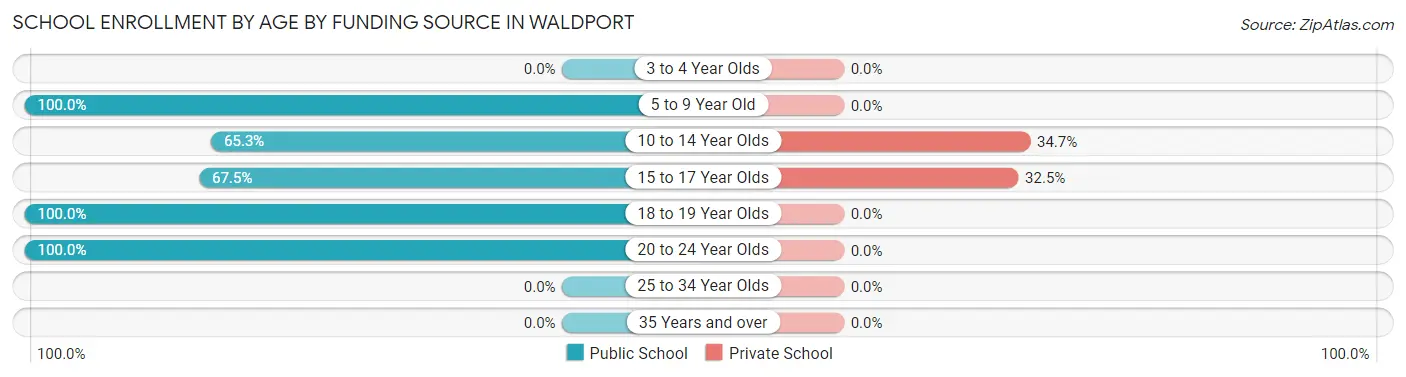
| Age Bracket | Public School | Private School |
| 3 to 4 Year Olds | 0 (0.0%) | 0 (0.0%) |
| 5 to 9 Year Old | 36 (100.0%) | 0 (0.0%) |
| 10 to 14 Year Olds | 47 (65.3%) | 25 (34.7%) |
| 15 to 17 Year Olds | 27 (67.5%) | 13 (32.5%) |
| 18 to 19 Year Olds | 51 (100.0%) | 0 (0.0%) |
| 20 to 24 Year Olds | 6 (100.0%) | 0 (0.0%) |
| 25 to 34 Year Olds | 0 (0.0%) | 0 (0.0%) |
| 35 Years and over | 0 (0.0%) | 0 (0.0%) |
| Total | 167 (81.5%) | 38 (18.5%) |
Educational Attainment by Field of Study in Waldport
Bio, nature & agricultural (93 | 23.6%), education (58 | 14.7%), business (50 | 12.7%), literature & languages (47 | 11.9%), and arts & humanities (40 | 10.2%) are the most common fields of study among 394 individuals in Waldport who have obtained a bachelor's degree or higher.
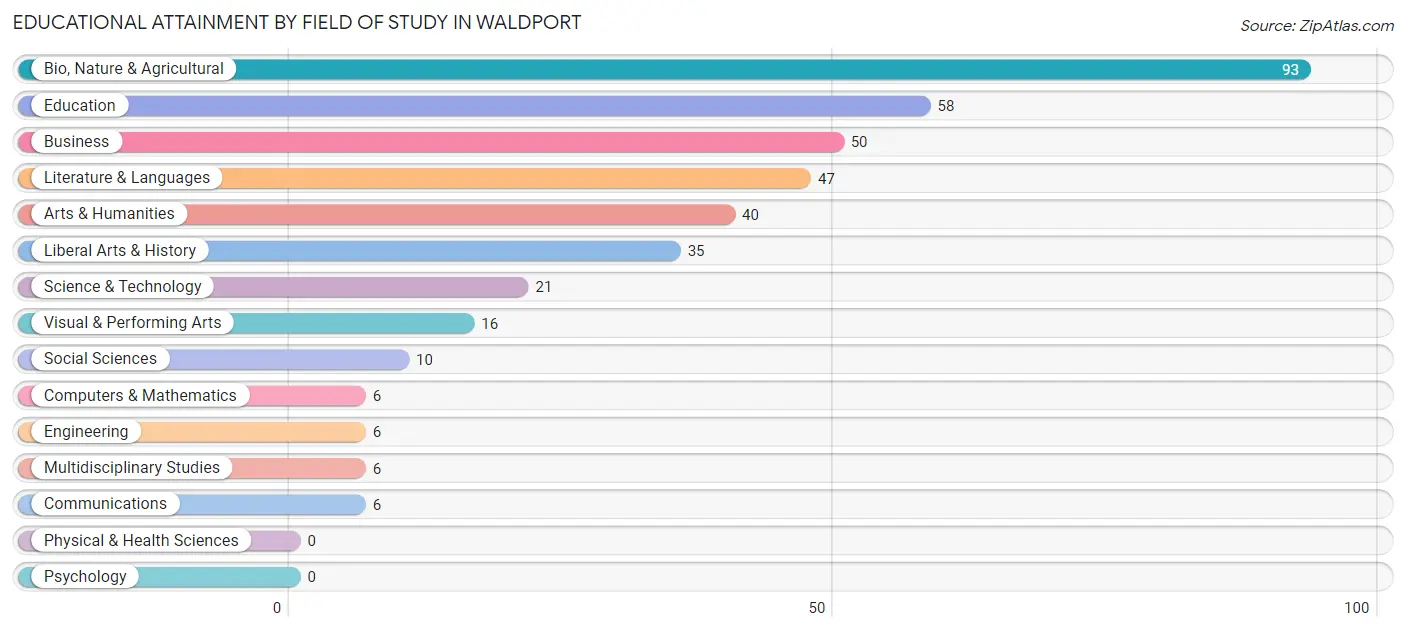
| Field of Study | # Graduates | % Graduates |
| Computers & Mathematics | 6 | 1.5% |
| Bio, Nature & Agricultural | 93 | 23.6% |
| Physical & Health Sciences | 0 | 0.0% |
| Psychology | 0 | 0.0% |
| Social Sciences | 10 | 2.5% |
| Engineering | 6 | 1.5% |
| Multidisciplinary Studies | 6 | 1.5% |
| Science & Technology | 21 | 5.3% |
| Business | 50 | 12.7% |
| Education | 58 | 14.7% |
| Literature & Languages | 47 | 11.9% |
| Liberal Arts & History | 35 | 8.9% |
| Visual & Performing Arts | 16 | 4.1% |
| Communications | 6 | 1.5% |
| Arts & Humanities | 40 | 10.2% |
| Total | 394 | 100.0% |
Transportation & Commute in Waldport
Vehicle Availability by Sex in Waldport
The most prevalent vehicle ownership categories in Waldport are males with 2 vehicles (114, accounting for 40.6%) and females with 2 vehicles (166, making up 31.1%).
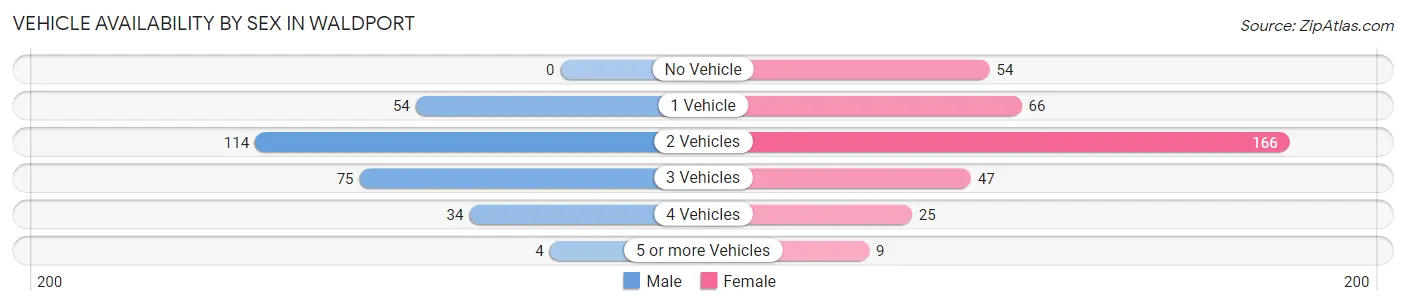
| Vehicles Available | Male | Female |
| No Vehicle | 0 (0.0%) | 54 (14.7%) |
| 1 Vehicle | 54 (19.2%) | 66 (18.0%) |
| 2 Vehicles | 114 (40.6%) | 166 (45.2%) |
| 3 Vehicles | 75 (26.7%) | 47 (12.8%) |
| 4 Vehicles | 34 (12.1%) | 25 (6.8%) |
| 5 or more Vehicles | 4 (1.4%) | 9 (2.5%) |
| Total | 281 (100.0%) | 367 (100.0%) |
Commute Time in Waldport
The most frequently occuring commute durations in Waldport are 5 to 9 minutes (161 commuters, 29.0%), 10 to 14 minutes (91 commuters, 16.4%), and 30 to 34 minutes (77 commuters, 13.9%).
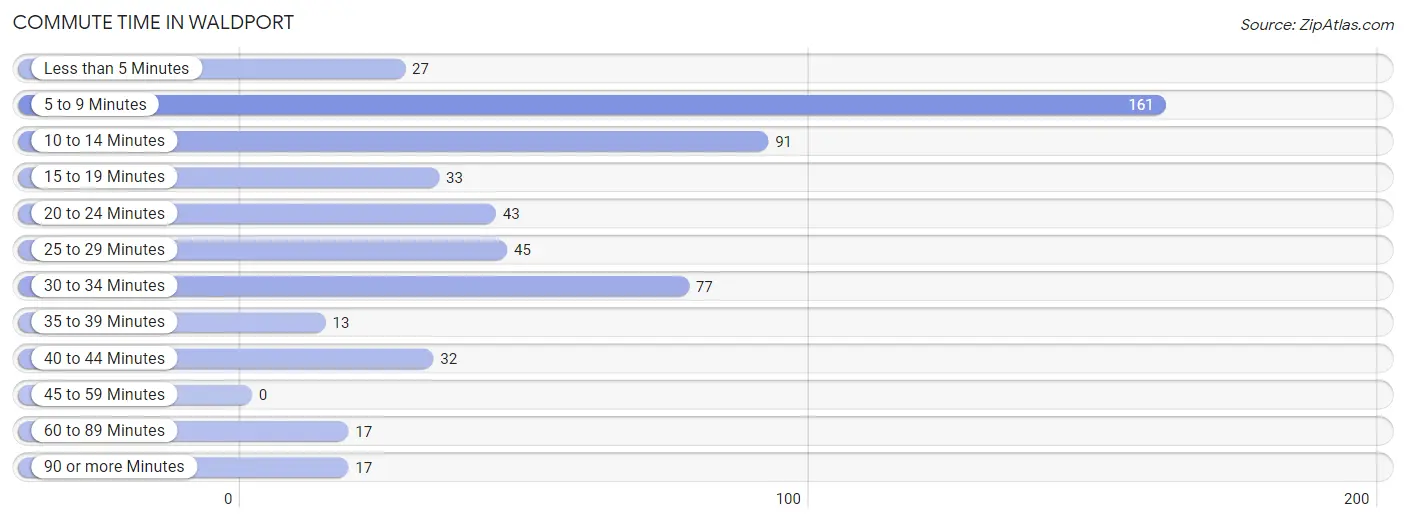
| Commute Time | # Commuters | % Commuters |
| Less than 5 Minutes | 27 | 4.9% |
| 5 to 9 Minutes | 161 | 29.0% |
| 10 to 14 Minutes | 91 | 16.4% |
| 15 to 19 Minutes | 33 | 5.9% |
| 20 to 24 Minutes | 43 | 7.7% |
| 25 to 29 Minutes | 45 | 8.1% |
| 30 to 34 Minutes | 77 | 13.9% |
| 35 to 39 Minutes | 13 | 2.3% |
| 40 to 44 Minutes | 32 | 5.8% |
| 45 to 59 Minutes | 0 | 0.0% |
| 60 to 89 Minutes | 17 | 3.1% |
| 90 or more Minutes | 17 | 3.1% |
Commute Time by Sex in Waldport
The most common commute times in Waldport are 10 to 14 minutes (77 commuters, 29.3%) for males and 5 to 9 minutes (131 commuters, 44.7%) for females.
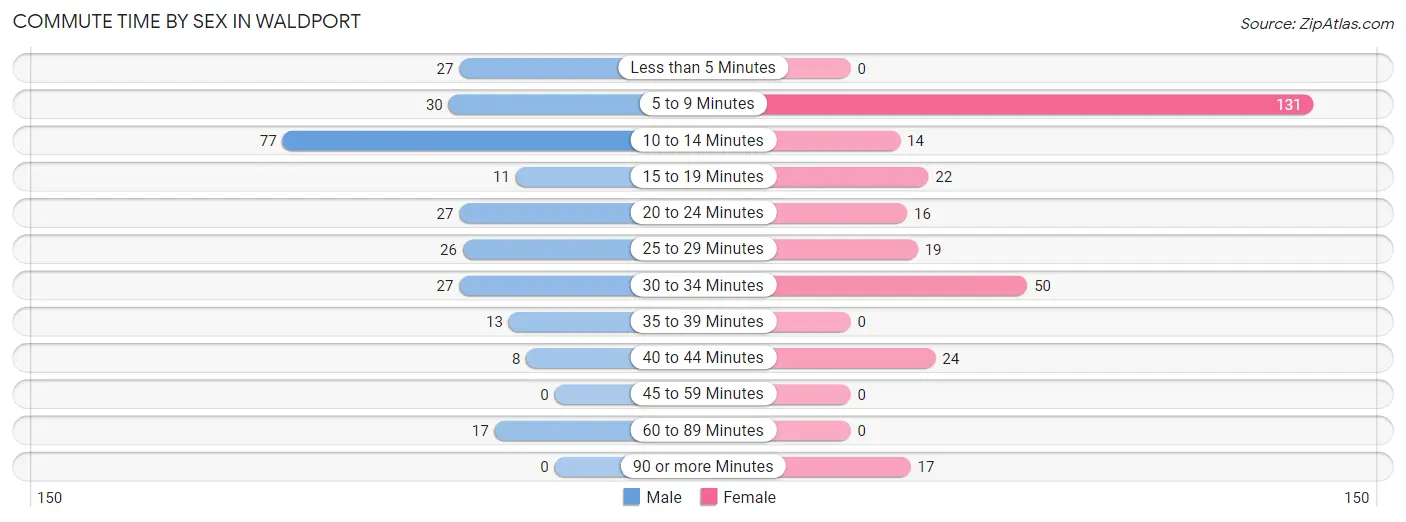
| Commute Time | Male | Female |
| Less than 5 Minutes | 27 (10.3%) | 0 (0.0%) |
| 5 to 9 Minutes | 30 (11.4%) | 131 (44.7%) |
| 10 to 14 Minutes | 77 (29.3%) | 14 (4.8%) |
| 15 to 19 Minutes | 11 (4.2%) | 22 (7.5%) |
| 20 to 24 Minutes | 27 (10.3%) | 16 (5.5%) |
| 25 to 29 Minutes | 26 (9.9%) | 19 (6.5%) |
| 30 to 34 Minutes | 27 (10.3%) | 50 (17.1%) |
| 35 to 39 Minutes | 13 (4.9%) | 0 (0.0%) |
| 40 to 44 Minutes | 8 (3.0%) | 24 (8.2%) |
| 45 to 59 Minutes | 0 (0.0%) | 0 (0.0%) |
| 60 to 89 Minutes | 17 (6.5%) | 0 (0.0%) |
| 90 or more Minutes | 0 (0.0%) | 17 (5.8%) |
Time of Departure to Work by Sex in Waldport
The most frequent times of departure to work in Waldport are 6:00 AM to 6:29 AM (73, 27.8%) for males and 11:00 AM to 11:59 AM (61, 20.8%) for females.
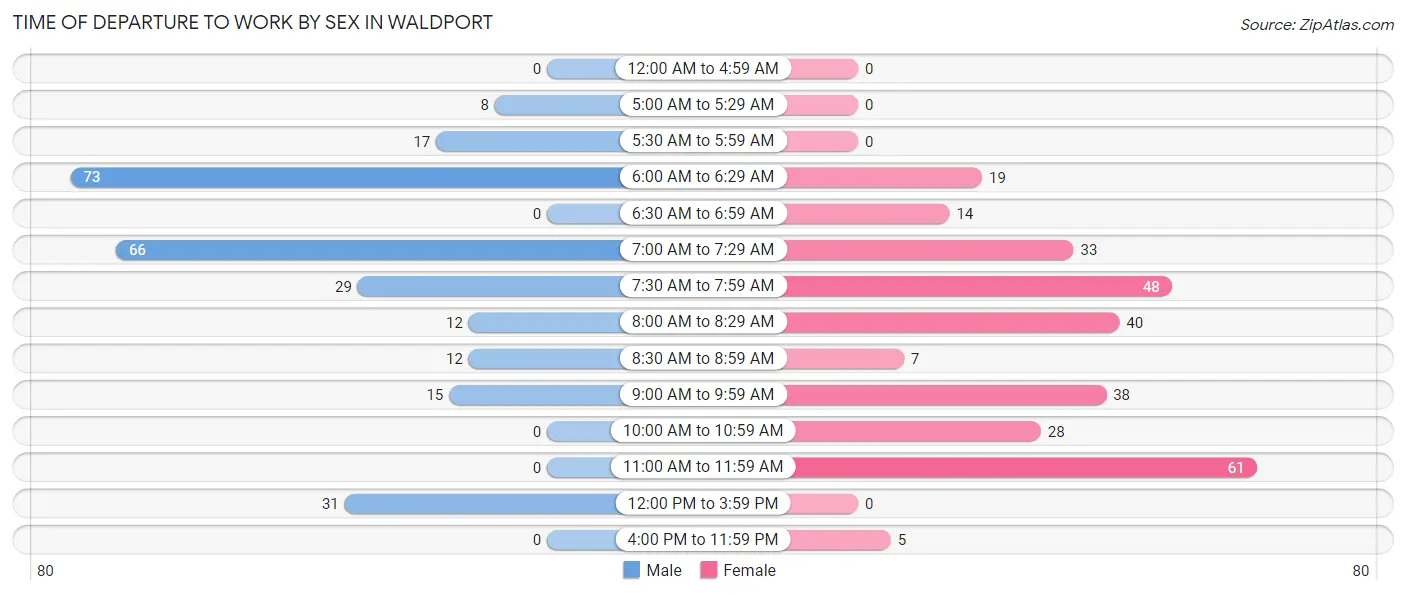
| Time of Departure | Male | Female |
| 12:00 AM to 4:59 AM | 0 (0.0%) | 0 (0.0%) |
| 5:00 AM to 5:29 AM | 8 (3.0%) | 0 (0.0%) |
| 5:30 AM to 5:59 AM | 17 (6.5%) | 0 (0.0%) |
| 6:00 AM to 6:29 AM | 73 (27.8%) | 19 (6.5%) |
| 6:30 AM to 6:59 AM | 0 (0.0%) | 14 (4.8%) |
| 7:00 AM to 7:29 AM | 66 (25.1%) | 33 (11.3%) |
| 7:30 AM to 7:59 AM | 29 (11.0%) | 48 (16.4%) |
| 8:00 AM to 8:29 AM | 12 (4.6%) | 40 (13.7%) |
| 8:30 AM to 8:59 AM | 12 (4.6%) | 7 (2.4%) |
| 9:00 AM to 9:59 AM | 15 (5.7%) | 38 (13.0%) |
| 10:00 AM to 10:59 AM | 0 (0.0%) | 28 (9.6%) |
| 11:00 AM to 11:59 AM | 0 (0.0%) | 61 (20.8%) |
| 12:00 PM to 3:59 PM | 31 (11.8%) | 0 (0.0%) |
| 4:00 PM to 11:59 PM | 0 (0.0%) | 5 (1.7%) |
| Total | 263 (100.0%) | 293 (100.0%) |
Housing Occupancy in Waldport
Occupancy by Ownership in Waldport
Of the total 1,058 dwellings in Waldport, owner-occupied units account for 714 (67.5%), while renter-occupied units make up 344 (32.5%).
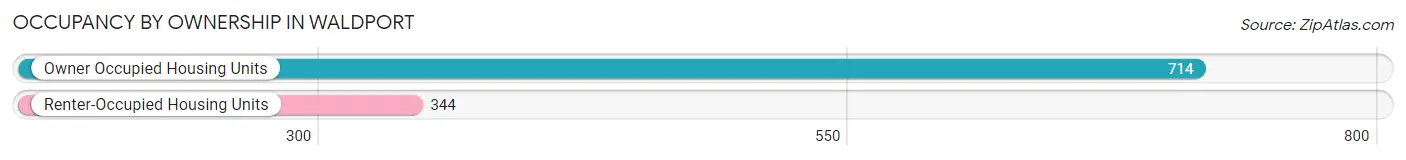
| Occupancy | # Housing Units | % Housing Units |
| Owner Occupied Housing Units | 714 | 67.5% |
| Renter-Occupied Housing Units | 344 | 32.5% |
| Total Occupied Housing Units | 1,058 | 100.0% |
Occupancy by Household Size in Waldport
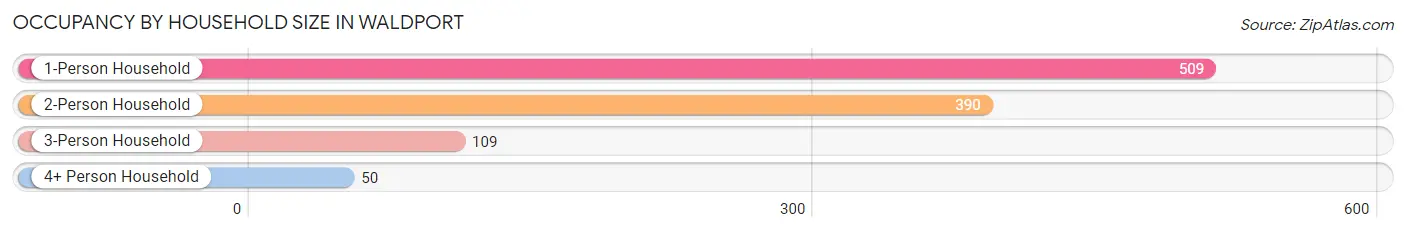
| Household Size | # Housing Units | % Housing Units |
| 1-Person Household | 509 | 48.1% |
| 2-Person Household | 390 | 36.9% |
| 3-Person Household | 109 | 10.3% |
| 4+ Person Household | 50 | 4.7% |
| Total Housing Units | 1,058 | 100.0% |
Occupancy by Ownership by Household Size in Waldport
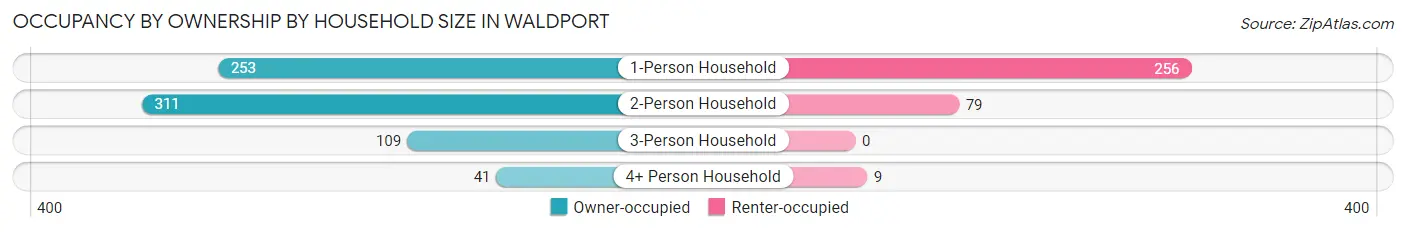
| Household Size | Owner-occupied | Renter-occupied |
| 1-Person Household | 253 (49.7%) | 256 (50.3%) |
| 2-Person Household | 311 (79.7%) | 79 (20.3%) |
| 3-Person Household | 109 (100.0%) | 0 (0.0%) |
| 4+ Person Household | 41 (82.0%) | 9 (18.0%) |
| Total Housing Units | 714 (67.5%) | 344 (32.5%) |
Occupancy by Educational Attainment in Waldport
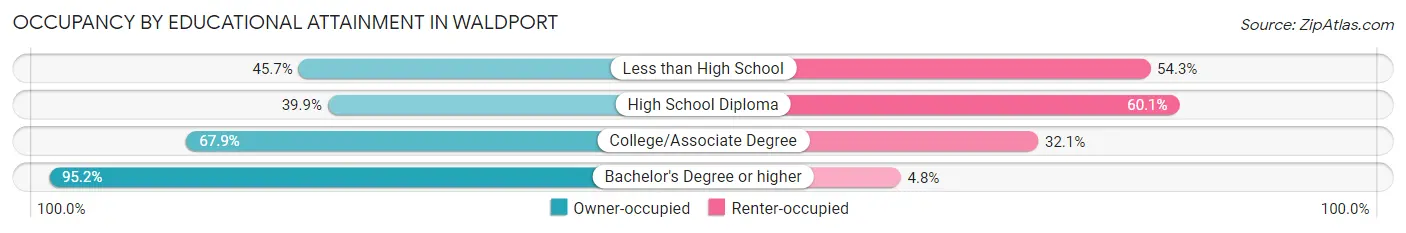
| Household Size | Owner-occupied | Renter-occupied |
| Less than High School | 37 (45.7%) | 44 (54.3%) |
| High School Diploma | 77 (39.9%) | 116 (60.1%) |
| College/Associate Degree | 364 (67.9%) | 172 (32.1%) |
| Bachelor's Degree or higher | 236 (95.2%) | 12 (4.8%) |
Occupancy by Age of Householder in Waldport
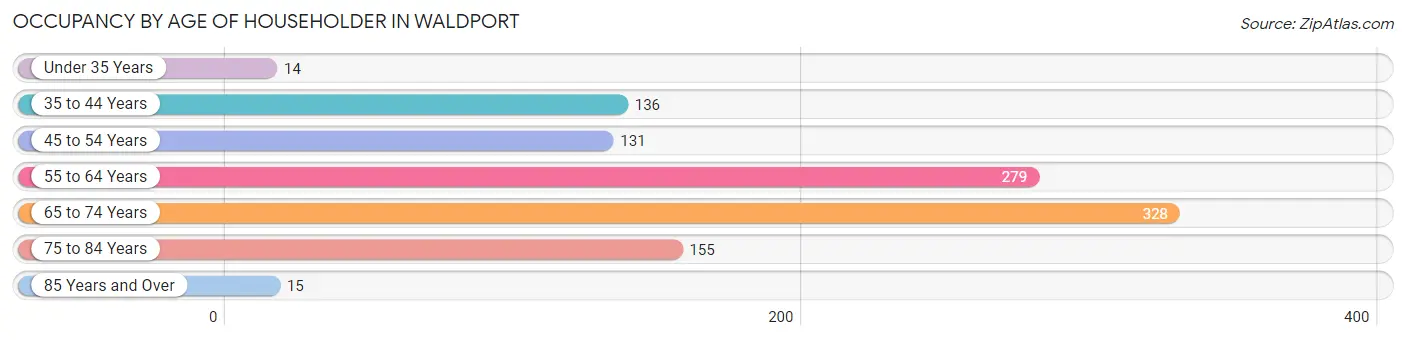
| Age Bracket | # Households | % Households |
| Under 35 Years | 14 | 1.3% |
| 35 to 44 Years | 136 | 12.9% |
| 45 to 54 Years | 131 | 12.4% |
| 55 to 64 Years | 279 | 26.4% |
| 65 to 74 Years | 328 | 31.0% |
| 75 to 84 Years | 155 | 14.6% |
| 85 Years and Over | 15 | 1.4% |
| Total | 1,058 | 100.0% |
Housing Finances in Waldport
Median Income by Occupancy in Waldport
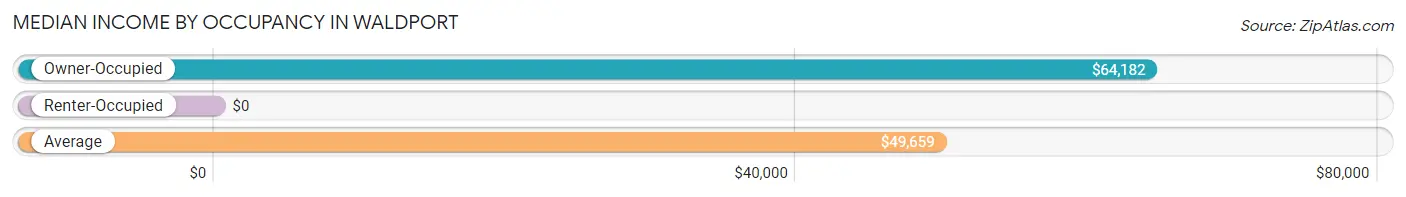
| Occupancy Type | # Households | Median Income |
| Owner-Occupied | 714 (67.5%) | $64,182 |
| Renter-Occupied | 344 (32.5%) | $0 |
| Average | 1,058 (100.0%) | $49,659 |
Occupancy by Householder Income Bracket in Waldport
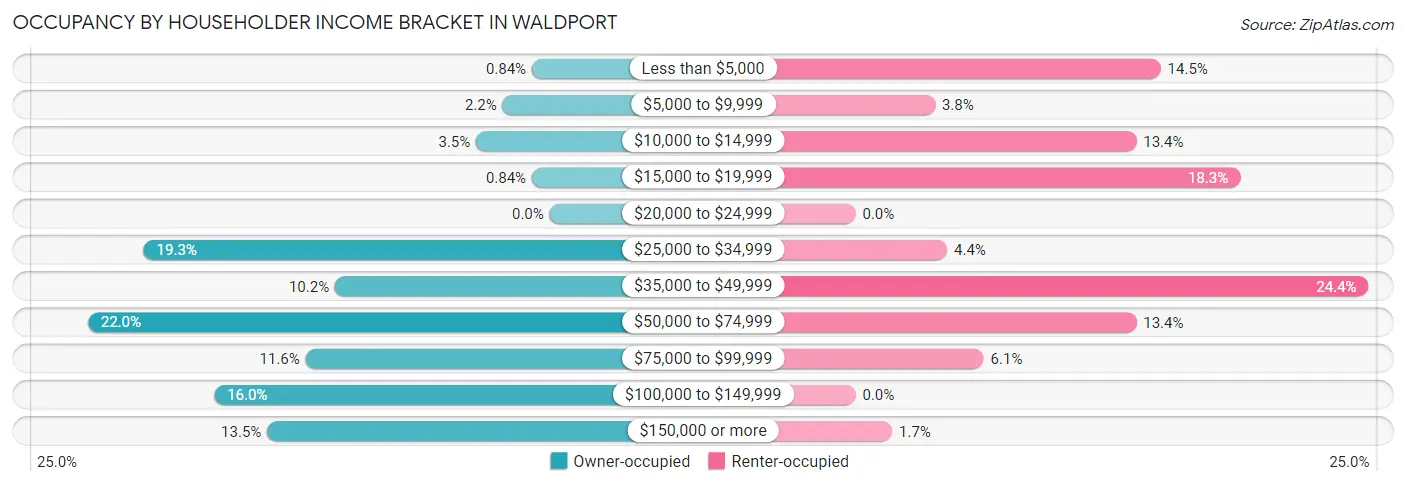
| Income Bracket | Owner-occupied | Renter-occupied |
| Less than $5,000 | 6 (0.8%) | 50 (14.5%) |
| $5,000 to $9,999 | 16 (2.2%) | 13 (3.8%) |
| $10,000 to $14,999 | 25 (3.5%) | 46 (13.4%) |
| $15,000 to $19,999 | 6 (0.8%) | 63 (18.3%) |
| $20,000 to $24,999 | 0 (0.0%) | 0 (0.0%) |
| $25,000 to $34,999 | 138 (19.3%) | 15 (4.4%) |
| $35,000 to $49,999 | 73 (10.2%) | 84 (24.4%) |
| $50,000 to $74,999 | 157 (22.0%) | 46 (13.4%) |
| $75,000 to $99,999 | 83 (11.6%) | 21 (6.1%) |
| $100,000 to $149,999 | 114 (16.0%) | 0 (0.0%) |
| $150,000 or more | 96 (13.5%) | 6 (1.7%) |
| Total | 714 (100.0%) | 344 (100.0%) |
Monthly Housing Cost Tiers in Waldport
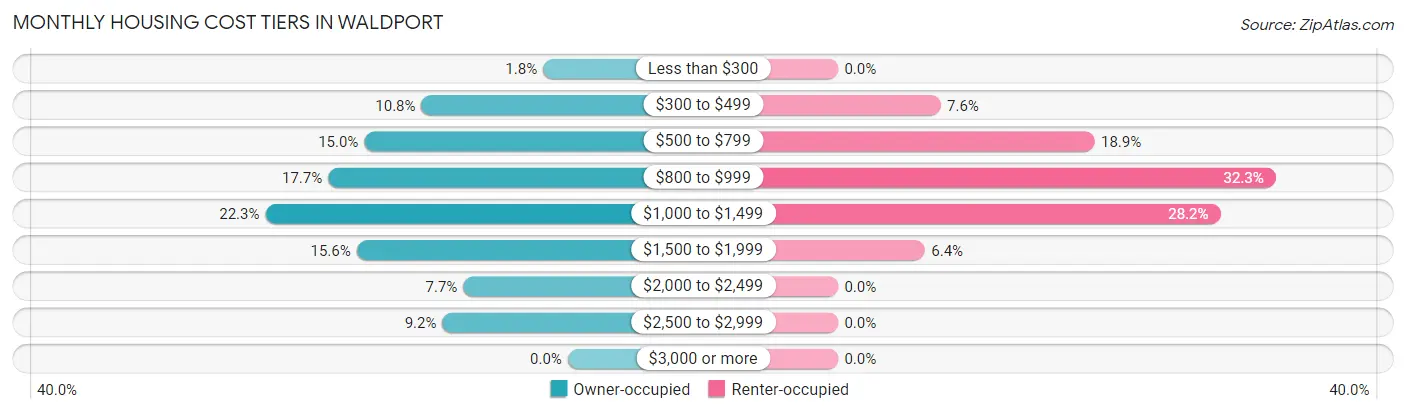
| Monthly Cost | Owner-occupied | Renter-occupied |
| Less than $300 | 13 (1.8%) | 0 (0.0%) |
| $300 to $499 | 77 (10.8%) | 26 (7.6%) |
| $500 to $799 | 107 (15.0%) | 65 (18.9%) |
| $800 to $999 | 126 (17.6%) | 111 (32.3%) |
| $1,000 to $1,499 | 159 (22.3%) | 97 (28.2%) |
| $1,500 to $1,999 | 111 (15.5%) | 22 (6.4%) |
| $2,000 to $2,499 | 55 (7.7%) | 0 (0.0%) |
| $2,500 to $2,999 | 66 (9.2%) | 0 (0.0%) |
| $3,000 or more | 0 (0.0%) | 0 (0.0%) |
| Total | 714 (100.0%) | 344 (100.0%) |
Physical Housing Characteristics in Waldport
Housing Structures in Waldport
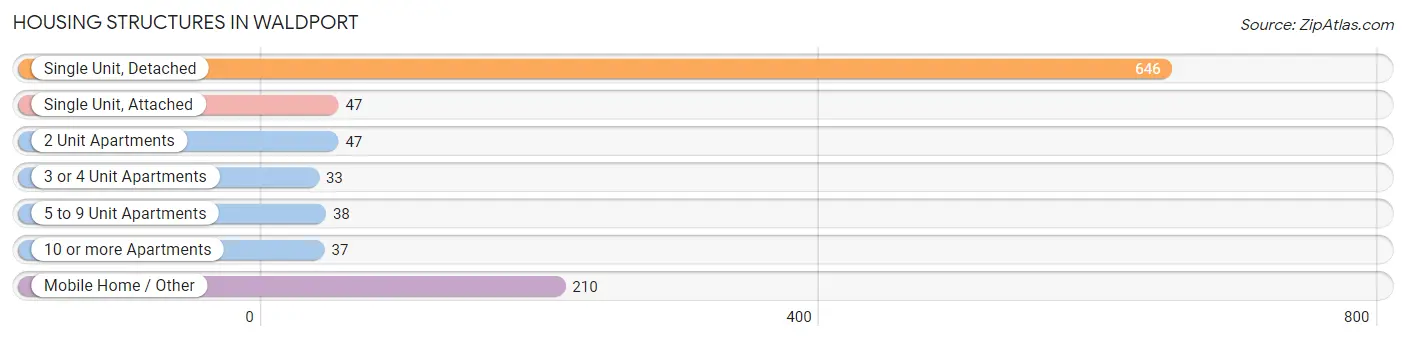
| Structure Type | # Housing Units | % Housing Units |
| Single Unit, Detached | 646 | 61.1% |
| Single Unit, Attached | 47 | 4.4% |
| 2 Unit Apartments | 47 | 4.4% |
| 3 or 4 Unit Apartments | 33 | 3.1% |
| 5 to 9 Unit Apartments | 38 | 3.6% |
| 10 or more Apartments | 37 | 3.5% |
| Mobile Home / Other | 210 | 19.9% |
| Total | 1,058 | 100.0% |
Housing Structures by Occupancy in Waldport
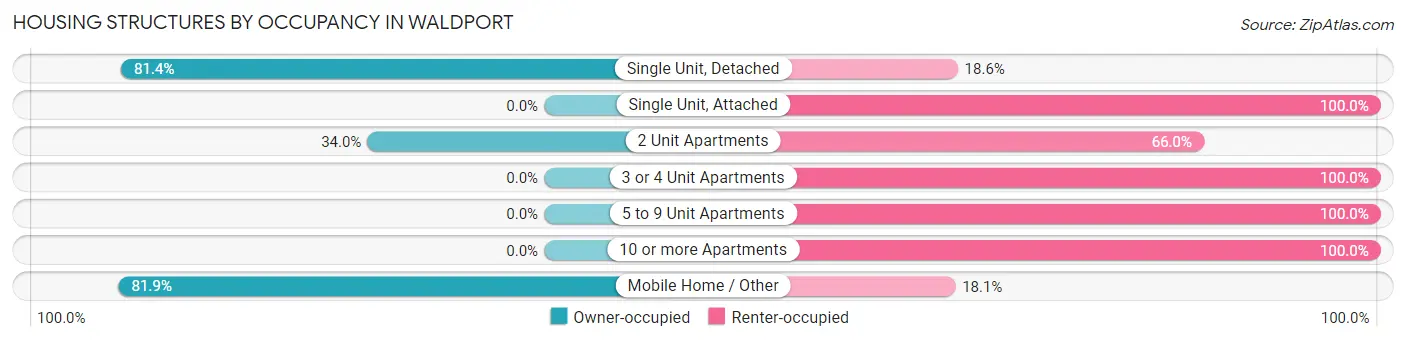
| Structure Type | Owner-occupied | Renter-occupied |
| Single Unit, Detached | 526 (81.4%) | 120 (18.6%) |
| Single Unit, Attached | 0 (0.0%) | 47 (100.0%) |
| 2 Unit Apartments | 16 (34.0%) | 31 (66.0%) |
| 3 or 4 Unit Apartments | 0 (0.0%) | 33 (100.0%) |
| 5 to 9 Unit Apartments | 0 (0.0%) | 38 (100.0%) |
| 10 or more Apartments | 0 (0.0%) | 37 (100.0%) |
| Mobile Home / Other | 172 (81.9%) | 38 (18.1%) |
| Total | 714 (67.5%) | 344 (32.5%) |
Housing Structures by Number of Rooms in Waldport
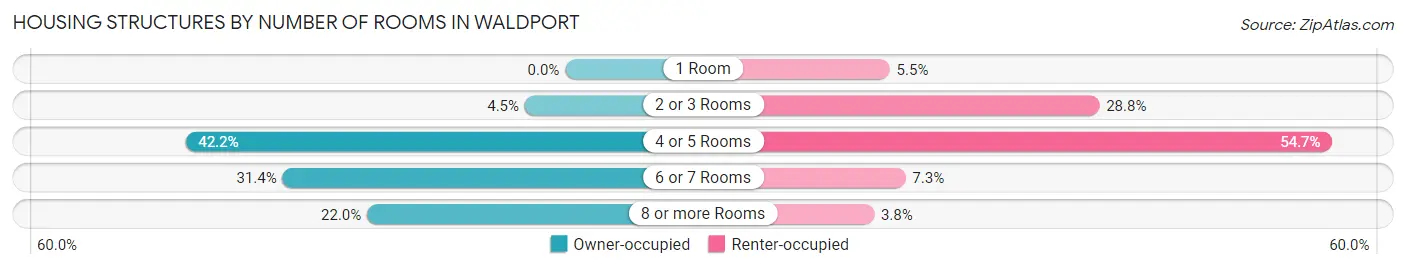
| Number of Rooms | Owner-occupied | Renter-occupied |
| 1 Room | 0 (0.0%) | 19 (5.5%) |
| 2 or 3 Rooms | 32 (4.5%) | 99 (28.8%) |
| 4 or 5 Rooms | 301 (42.2%) | 188 (54.6%) |
| 6 or 7 Rooms | 224 (31.4%) | 25 (7.3%) |
| 8 or more Rooms | 157 (22.0%) | 13 (3.8%) |
| Total | 714 (100.0%) | 344 (100.0%) |
Housing Structure by Heating Type in Waldport
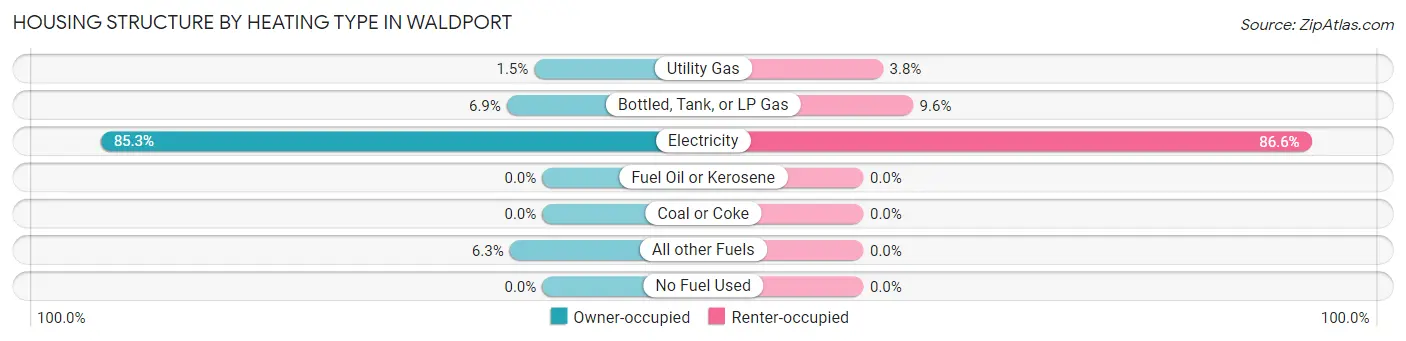
| Heating Type | Owner-occupied | Renter-occupied |
| Utility Gas | 11 (1.5%) | 13 (3.8%) |
| Bottled, Tank, or LP Gas | 49 (6.9%) | 33 (9.6%) |
| Electricity | 609 (85.3%) | 298 (86.6%) |
| Fuel Oil or Kerosene | 0 (0.0%) | 0 (0.0%) |
| Coal or Coke | 0 (0.0%) | 0 (0.0%) |
| All other Fuels | 45 (6.3%) | 0 (0.0%) |
| No Fuel Used | 0 (0.0%) | 0 (0.0%) |
| Total | 714 (100.0%) | 344 (100.0%) |
Household Vehicle Usage in Waldport
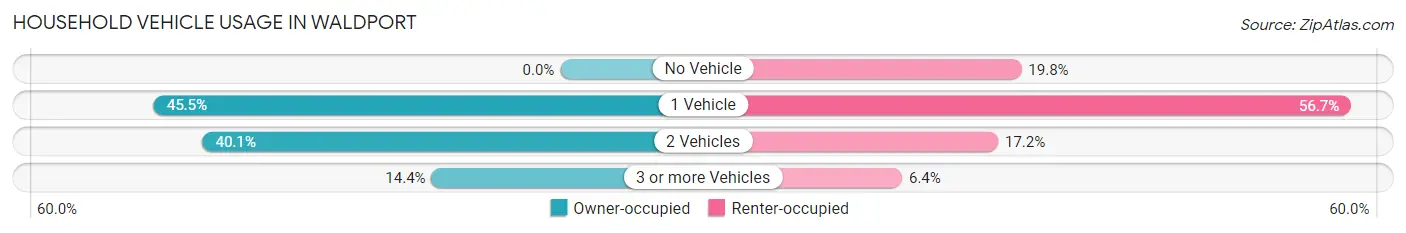
| Vehicles per Household | Owner-occupied | Renter-occupied |
| No Vehicle | 0 (0.0%) | 68 (19.8%) |
| 1 Vehicle | 325 (45.5%) | 195 (56.7%) |
| 2 Vehicles | 286 (40.1%) | 59 (17.2%) |
| 3 or more Vehicles | 103 (14.4%) | 22 (6.4%) |
| Total | 714 (100.0%) | 344 (100.0%) |
Real Estate & Mortgages in Waldport
Real Estate and Mortgage Overview in Waldport
| Characteristic | Without Mortgage | With Mortgage |
| Housing Units | 242 | 472 |
| Median Property Value | $221,400 | $334,600 |
| Median Household Income | $57,083 | $61 |
| Monthly Housing Costs | $594 | $0 |
| Real Estate Taxes | $2,795 | $6 |
Property Value by Mortgage Status in Waldport
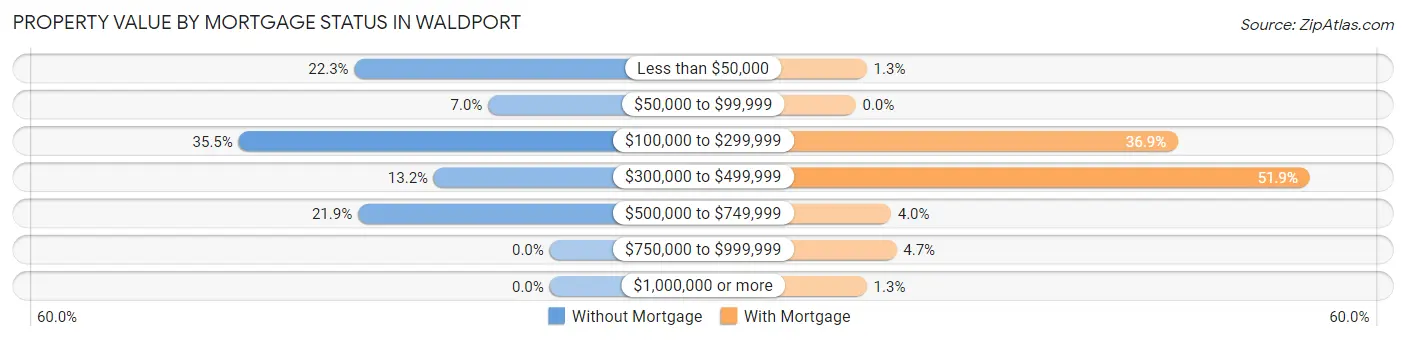
| Property Value | Without Mortgage | With Mortgage |
| Less than $50,000 | 54 (22.3%) | 6 (1.3%) |
| $50,000 to $99,999 | 17 (7.0%) | 0 (0.0%) |
| $100,000 to $299,999 | 86 (35.5%) | 174 (36.9%) |
| $300,000 to $499,999 | 32 (13.2%) | 245 (51.9%) |
| $500,000 to $749,999 | 53 (21.9%) | 19 (4.0%) |
| $750,000 to $999,999 | 0 (0.0%) | 22 (4.7%) |
| $1,000,000 or more | 0 (0.0%) | 6 (1.3%) |
| Total | 242 (100.0%) | 472 (100.0%) |
Household Income by Mortgage Status in Waldport
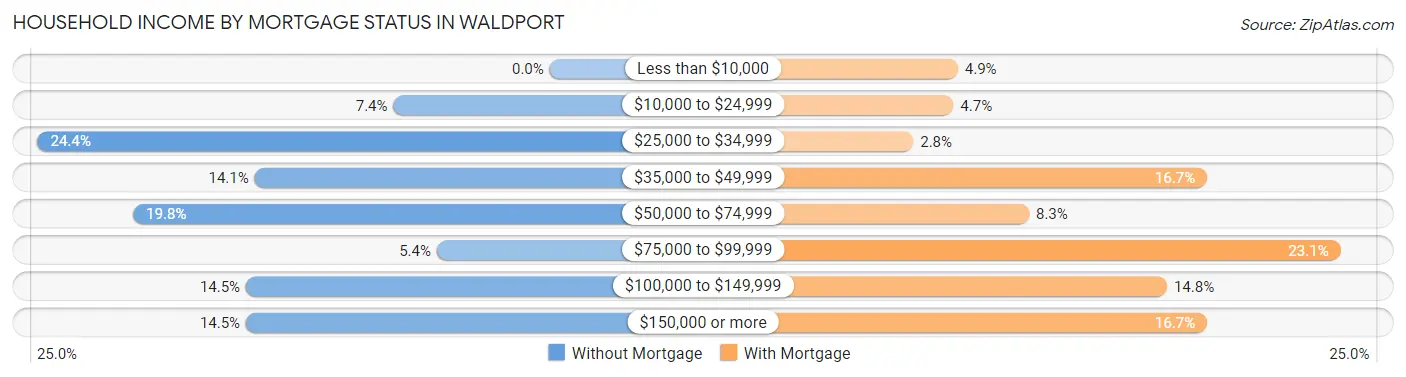
| Household Income | Without Mortgage | With Mortgage |
| Less than $10,000 | 0 (0.0%) | 23 (4.9%) |
| $10,000 to $24,999 | 18 (7.4%) | 22 (4.7%) |
| $25,000 to $34,999 | 59 (24.4%) | 13 (2.8%) |
| $35,000 to $49,999 | 34 (14.1%) | 79 (16.7%) |
| $50,000 to $74,999 | 48 (19.8%) | 39 (8.3%) |
| $75,000 to $99,999 | 13 (5.4%) | 109 (23.1%) |
| $100,000 to $149,999 | 35 (14.5%) | 70 (14.8%) |
| $150,000 or more | 35 (14.5%) | 79 (16.7%) |
| Total | 242 (100.0%) | 472 (100.0%) |
Property Value to Household Income Ratio in Waldport
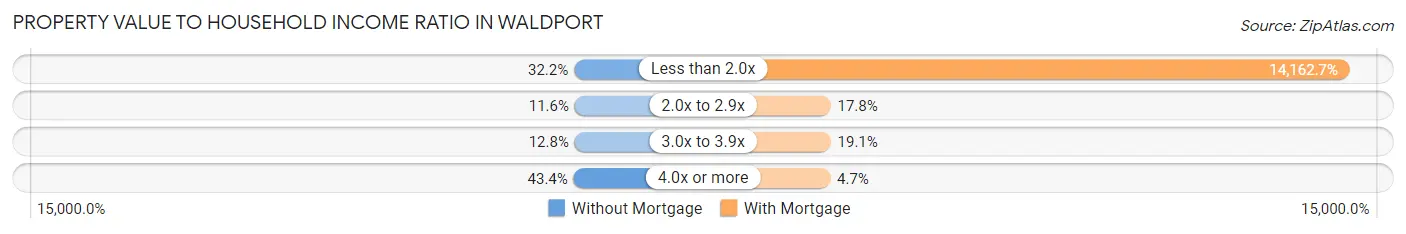
| Value-to-Income Ratio | Without Mortgage | With Mortgage |
| Less than 2.0x | 78 (32.2%) | 66,848 (14,162.7%) |
| 2.0x to 2.9x | 28 (11.6%) | 84 (17.8%) |
| 3.0x to 3.9x | 31 (12.8%) | 90 (19.1%) |
| 4.0x or more | 105 (43.4%) | 22 (4.7%) |
| Total | 242 (100.0%) | 472 (100.0%) |
Real Estate Taxes by Mortgage Status in Waldport
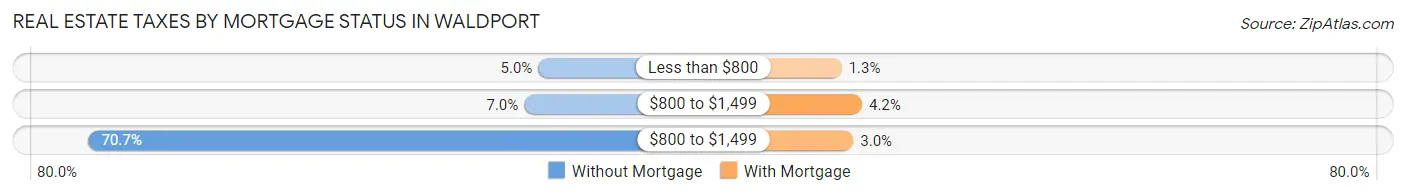
| Property Taxes | Without Mortgage | With Mortgage |
| Less than $800 | 12 (5.0%) | 6 (1.3%) |
| $800 to $1,499 | 17 (7.0%) | 20 (4.2%) |
| $800 to $1,499 | 171 (70.7%) | 14 (3.0%) |
| Total | 242 (100.0%) | 472 (100.0%) |
Health & Disability in Waldport
Health Insurance Coverage by Age in Waldport
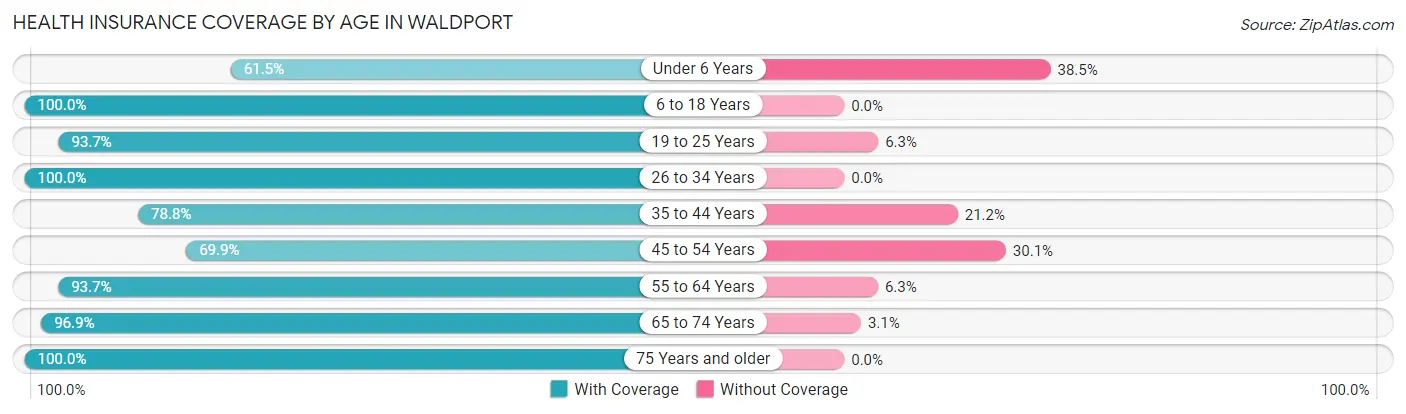
| Age Bracket | With Coverage | Without Coverage |
| Under 6 Years | 8 (61.5%) | 5 (38.5%) |
| 6 to 18 Years | 160 (100.0%) | 0 (0.0%) |
| 19 to 25 Years | 89 (93.7%) | 6 (6.3%) |
| 26 to 34 Years | 62 (100.0%) | 0 (0.0%) |
| 35 to 44 Years | 149 (78.8%) | 40 (21.2%) |
| 45 to 54 Years | 204 (69.9%) | 88 (30.1%) |
| 55 to 64 Years | 388 (93.7%) | 26 (6.3%) |
| 65 to 74 Years | 467 (96.9%) | 15 (3.1%) |
| 75 Years and older | 243 (100.0%) | 0 (0.0%) |
| Total | 1,770 (90.8%) | 180 (9.2%) |
Health Insurance Coverage by Citizenship Status in Waldport

| Citizenship Status | With Coverage | Without Coverage |
| Native Born | 8 (61.5%) | 5 (38.5%) |
| Foreign Born, Citizen | 160 (100.0%) | 0 (0.0%) |
| Foreign Born, not a Citizen | 89 (93.7%) | 6 (6.3%) |
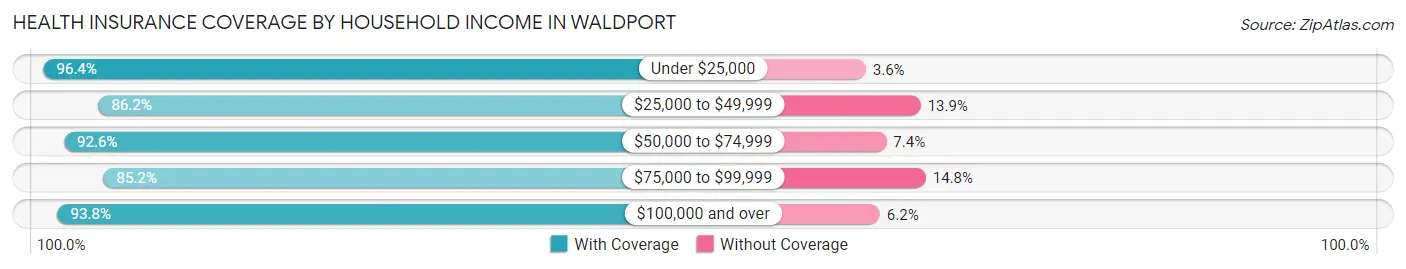
Health Insurance Coverage by Household Income in Waldport
| Household Income | With Coverage | Without Coverage |
| Under $25,000 | 243 (96.4%) | 9 (3.6%) |
| $25,000 to $49,999 | 485 (86.2%) | 78 (13.9%) |
| $50,000 to $74,999 | 337 (92.6%) | 27 (7.4%) |
| $75,000 to $99,999 | 184 (85.2%) | 32 (14.8%) |
| $100,000 and over | 514 (93.8%) | 34 (6.2%) |
Public vs Private Health Insurance Coverage by Age in Waldport
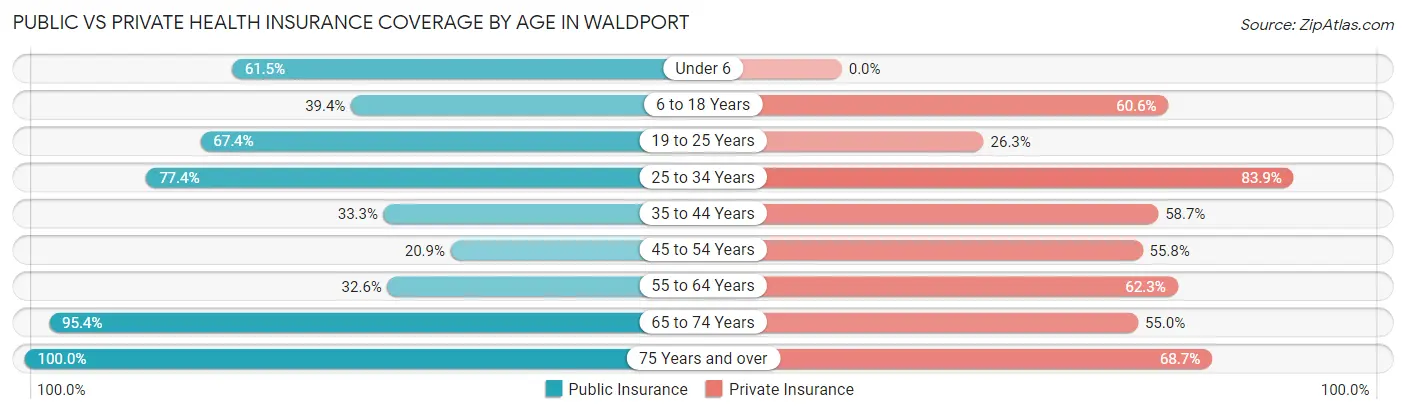
| Age Bracket | Public Insurance | Private Insurance |
| Under 6 | 8 (61.5%) | 0 (0.0%) |
| 6 to 18 Years | 63 (39.4%) | 97 (60.6%) |
| 19 to 25 Years | 64 (67.4%) | 25 (26.3%) |
| 25 to 34 Years | 48 (77.4%) | 52 (83.9%) |
| 35 to 44 Years | 63 (33.3%) | 111 (58.7%) |
| 45 to 54 Years | 61 (20.9%) | 163 (55.8%) |
| 55 to 64 Years | 135 (32.6%) | 258 (62.3%) |
| 65 to 74 Years | 460 (95.4%) | 265 (55.0%) |
| 75 Years and over | 243 (100.0%) | 167 (68.7%) |
| Total | 1,145 (58.7%) | 1,138 (58.4%) |
Disability Status by Sex by Age in Waldport
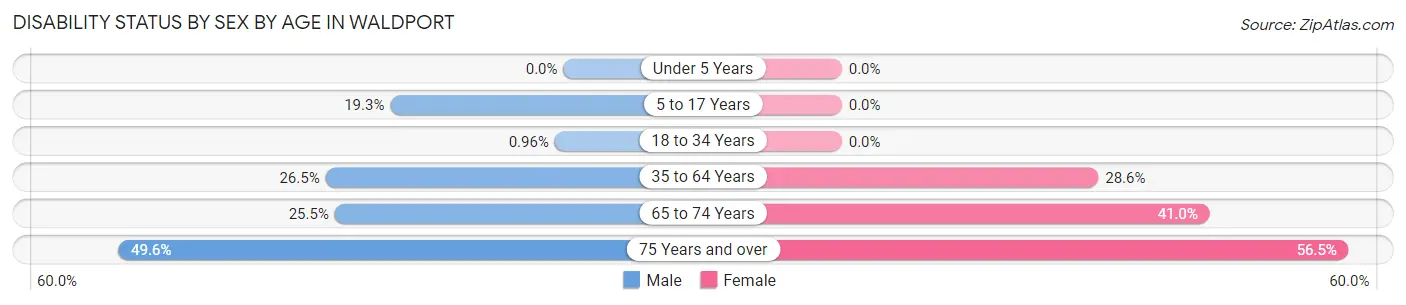
| Age Bracket | Male | Female |
| Under 5 Years | 0 (0.0%) | 0 (0.0%) |
| 5 to 17 Years | 16 (19.3%) | 0 (0.0%) |
| 18 to 34 Years | 1 (1.0%) | 0 (0.0%) |
| 35 to 64 Years | 111 (26.5%) | 136 (28.6%) |
| 65 to 74 Years | 55 (25.5%) | 109 (41.0%) |
| 75 Years and over | 59 (49.6%) | 70 (56.5%) |
Disability Class by Sex by Age in Waldport
Disability Class: Hearing Difficulty
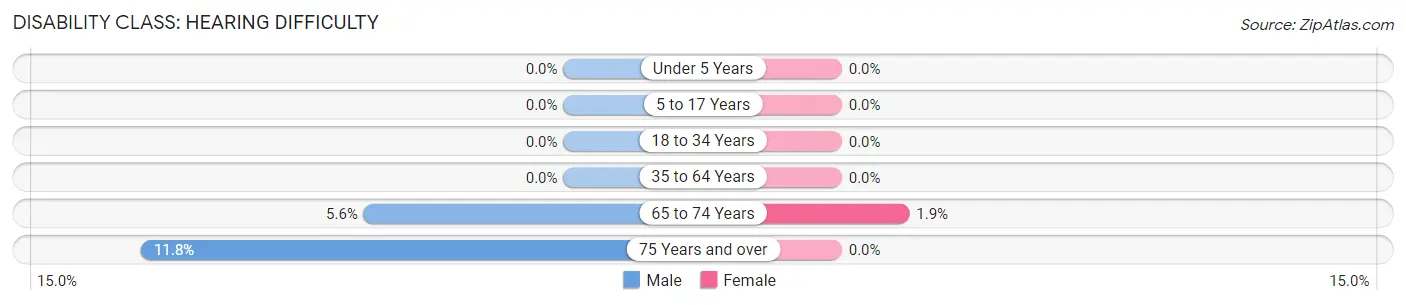
| Age Bracket | Male | Female |
| Under 5 Years | 0 (0.0%) | 0 (0.0%) |
| 5 to 17 Years | 0 (0.0%) | 0 (0.0%) |
| 18 to 34 Years | 0 (0.0%) | 0 (0.0%) |
| 35 to 64 Years | 0 (0.0%) | 0 (0.0%) |
| 65 to 74 Years | 12 (5.6%) | 5 (1.9%) |
| 75 Years and over | 14 (11.8%) | 0 (0.0%) |
Disability Class: Vision Difficulty
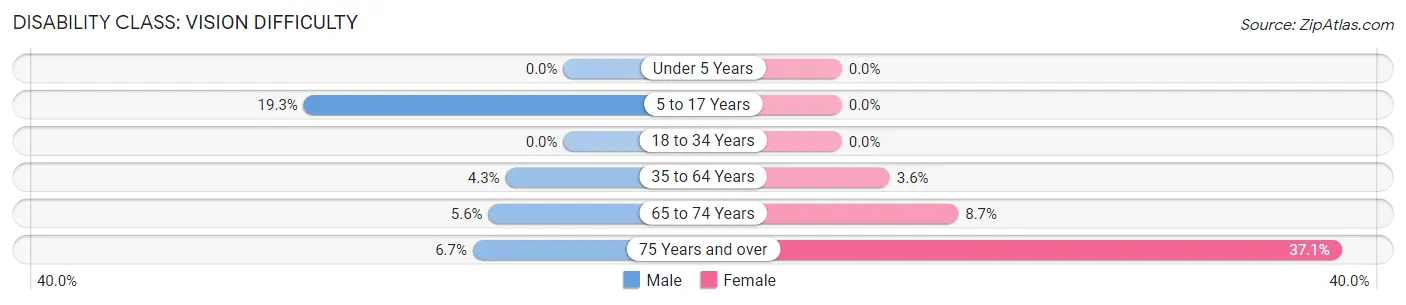
| Age Bracket | Male | Female |
| Under 5 Years | 0 (0.0%) | 0 (0.0%) |
| 5 to 17 Years | 16 (19.3%) | 0 (0.0%) |
| 18 to 34 Years | 0 (0.0%) | 0 (0.0%) |
| 35 to 64 Years | 18 (4.3%) | 17 (3.6%) |
| 65 to 74 Years | 12 (5.6%) | 23 (8.6%) |
| 75 Years and over | 8 (6.7%) | 46 (37.1%) |
Disability Class: Cognitive Difficulty
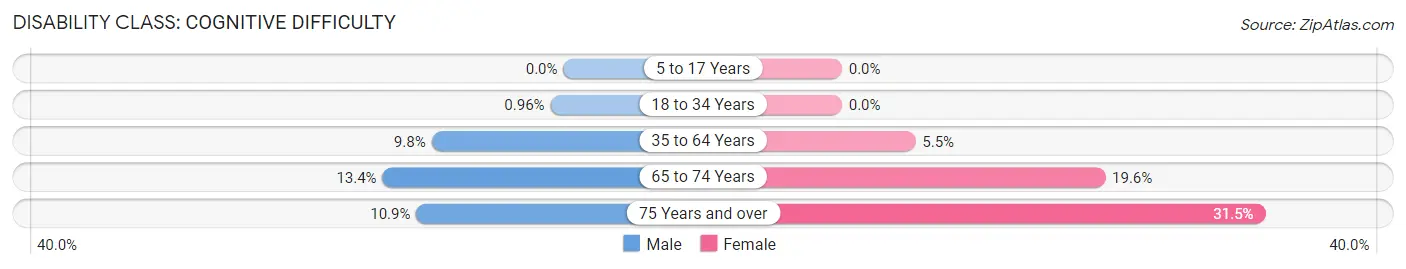
| Age Bracket | Male | Female |
| 5 to 17 Years | 0 (0.0%) | 0 (0.0%) |
| 18 to 34 Years | 1 (1.0%) | 0 (0.0%) |
| 35 to 64 Years | 41 (9.8%) | 26 (5.5%) |
| 65 to 74 Years | 29 (13.4%) | 52 (19.6%) |
| 75 Years and over | 13 (10.9%) | 39 (31.5%) |
Disability Class: Ambulatory Difficulty
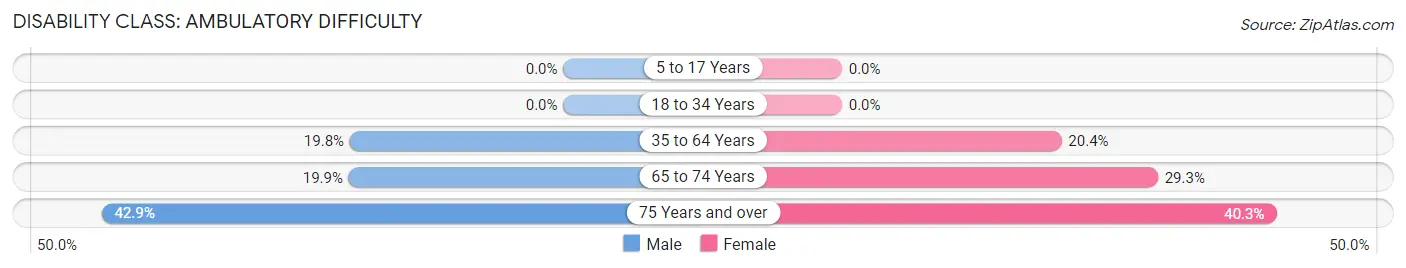
| Age Bracket | Male | Female |
| 5 to 17 Years | 0 (0.0%) | 0 (0.0%) |
| 18 to 34 Years | 0 (0.0%) | 0 (0.0%) |
| 35 to 64 Years | 83 (19.8%) | 97 (20.4%) |
| 65 to 74 Years | 43 (19.9%) | 78 (29.3%) |
| 75 Years and over | 51 (42.9%) | 50 (40.3%) |
Disability Class: Self-Care Difficulty
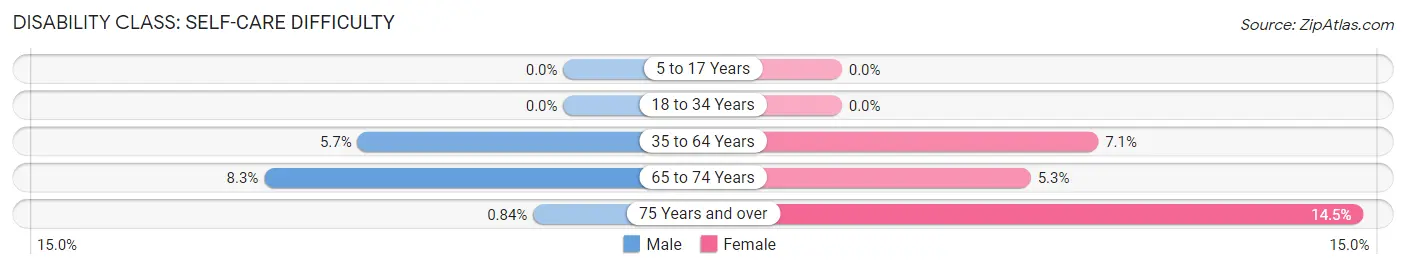
| Age Bracket | Male | Female |
| 5 to 17 Years | 0 (0.0%) | 0 (0.0%) |
| 18 to 34 Years | 0 (0.0%) | 0 (0.0%) |
| 35 to 64 Years | 24 (5.7%) | 34 (7.1%) |
| 65 to 74 Years | 18 (8.3%) | 14 (5.3%) |
| 75 Years and over | 1 (0.8%) | 18 (14.5%) |
Technology Access in Waldport
Computing Device Access in Waldport
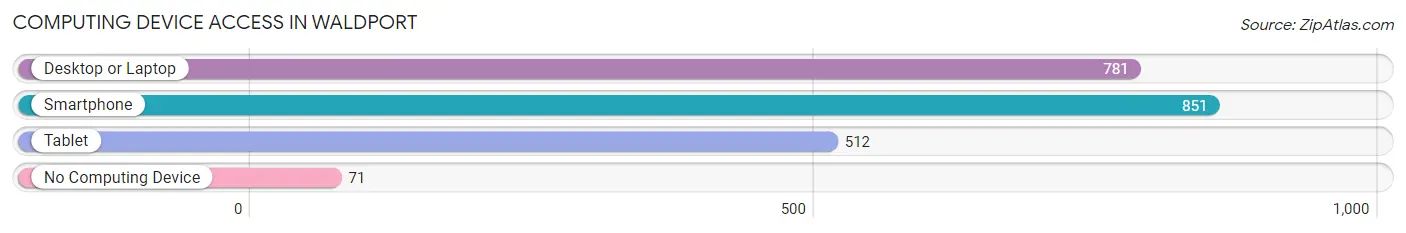
| Device Type | # Households | % Households |
| Desktop or Laptop | 781 | 73.8% |
| Smartphone | 851 | 80.4% |
| Tablet | 512 | 48.4% |
| No Computing Device | 71 | 6.7% |
| Total | 1,058 | 100.0% |
Internet Access in Waldport
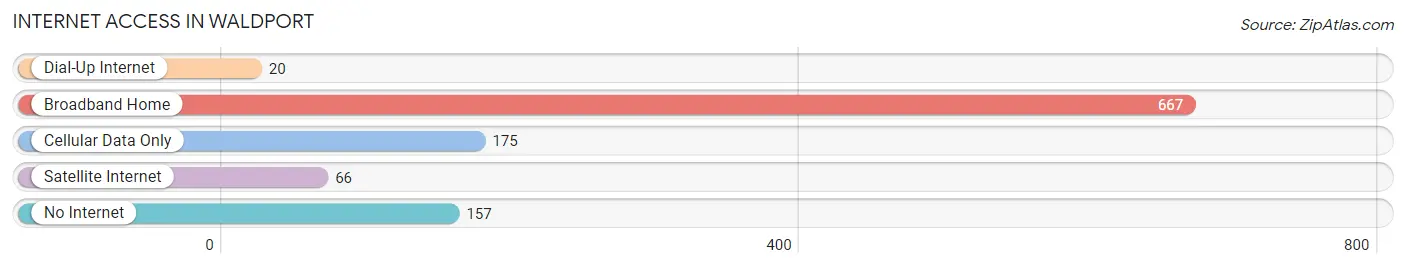
| Internet Type | # Households | % Households |
| Dial-Up Internet | 20 | 1.9% |
| Broadband Home | 667 | 63.0% |
| Cellular Data Only | 175 | 16.5% |
| Satellite Internet | 66 | 6.2% |
| No Internet | 157 | 14.8% |
| Total | 1,058 | 100.0% |
Waldport Summary
Waldport is a small city located in Lincoln County, Oregon, United States. It is situated on the Alsea Bay, an inlet of the Pacific Ocean, and is part of the Oregon Coast. The city has a population of 2,068 as of the 2010 census.
History
The area that is now Waldport was first inhabited by the Alsea Native American tribe. The first European settlers arrived in the area in the late 1850s, and the town was officially founded in 1867. The town was named after Waldport, England, which was the hometown of one of the first settlers.
The town grew slowly, but by the early 1900s, it had become a popular tourist destination. The town was home to several hotels, a casino, and a boardwalk. The town also had a thriving fishing industry, and was home to several canneries.
In the 1950s, the town began to decline as the fishing industry declined and tourism shifted to other parts of the Oregon Coast. The town was further impacted by the construction of the Alsea Bay Bridge in the 1960s, which diverted traffic away from the town.
Geography
Waldport is located at the mouth of the Alsea River, on the Alsea Bay. The city is situated on a peninsula, with the Alsea Bay to the west and the Alsea River to the east. The city is surrounded by forests and mountains, and is located approximately 10 miles south of Newport and 25 miles north of Florence.
The city has a total area of 2.2 square miles, all of which is land. The city has a mild climate, with temperatures ranging from the mid-30s in the winter to the mid-70s in the summer.
Economy
The economy of Waldport is largely based on tourism and fishing. The city is home to several hotels, restaurants, and other tourist attractions. The city is also home to several seafood processing plants, which process fish and shellfish caught in the Alsea Bay.
The city is also home to several small businesses, including a grocery store, a hardware store, and a lumber yard. The city is also home to several art galleries, which feature the work of local artists.
Demographics
As of the 2010 census, the population of Waldport was 2,068. The racial makeup of the city was 94.3% White, 0.7% African American, 0.7% Native American, 0.7% Asian, 0.2% Pacific Islander, 0.7% from other races, and 2.5% from two or more races. Hispanic or Latino of any race were 3.2% of the population.
The median income for a household in the city was $35,938, and the median income for a family was $41,250. The per capita income for the city was $19,945. About 11.3% of families and 14.2% of the population were below the poverty line, including 19.2% of those under age 18 and 8.2% of those age 65 or over.
Common Questions
What is Per Capita Income in Waldport?
Per Capita income in Waldport is $38,686.
What is the Median Family Income in Waldport?
Median Family Income in Waldport is $59,913.
What is the Median Household income in Waldport?
Median Household Income in Waldport is $49,659.
What is Income or Wage Gap in Waldport?
Income or Wage Gap in Waldport is 31.6%.
Women in Waldport earn 68.4 cents for every dollar earned by a man.
What is Inequality or Gini Index in Waldport?
Inequality or Gini Index in Waldport is 0.48.
What is the Total Population of Waldport?
Total Population of Waldport is 1,950.
What is the Total Male Population of Waldport?
Total Male Population of Waldport is 949.
What is the Total Female Population of Waldport?
Total Female Population of Waldport is 1,001.
What is the Ratio of Males per 100 Females in Waldport?
There are 94.81 Males per 100 Females in Waldport.
What is the Ratio of Females per 100 Males in Waldport?
There are 105.48 Females per 100 Males in Waldport.
What is the Median Population Age in Waldport?
Median Population Age in Waldport is 59.9 Years.
What is the Average Family Size in Waldport
Average Family Size in Waldport is 2.6 People.
What is the Average Household Size in Waldport
Average Household Size in Waldport is 1.8 People.
How Large is the Labor Force in Waldport?
There are 801 People in the Labor Forcein in Waldport.
What is the Percentage of People in the Labor Force in Waldport?
44.4% of People are in the Labor Force in Waldport.
What is the Unemployment Rate in Waldport?
Unemployment Rate in Waldport is 17.3%.