Halfway, OR Map & Demographics
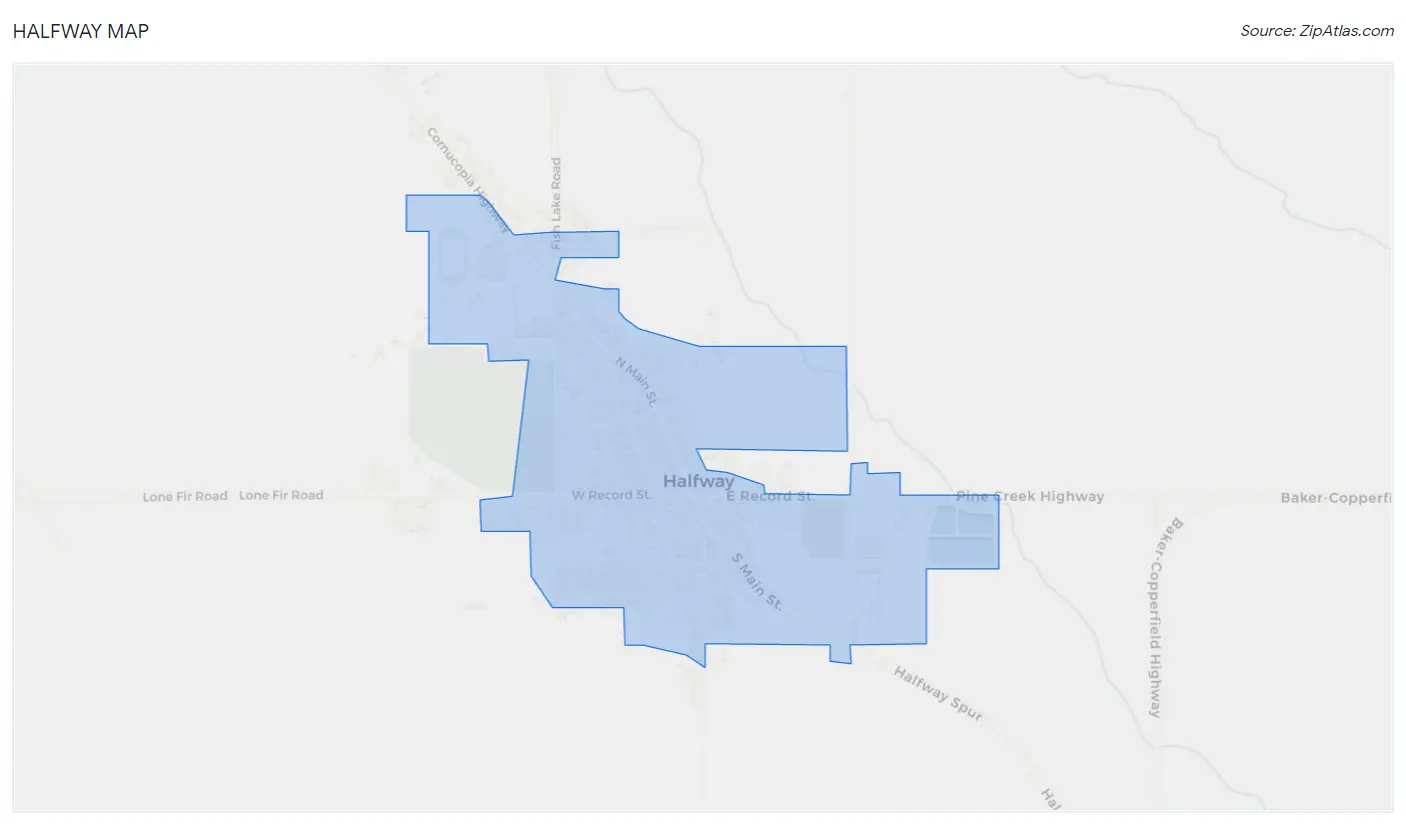
Halfway Map
Halfway Overview
$20,805
PER CAPITA INCOME
$50,278
AVG FAMILY INCOME
$40,781
AVG HOUSEHOLD INCOME
0.39
INEQUALITY / GINI INDEX
415
TOTAL POPULATION
224
MALE POPULATION
191
FEMALE POPULATION
117.28
MALES / 100 FEMALES
85.27
FEMALES / 100 MALES
48.6
MEDIAN AGE
3.9
AVG FAMILY SIZE
2.9
AVG HOUSEHOLD SIZE
135
LABOR FORCE [ PEOPLE ]
41.7%
PERCENT IN LABOR FORCE
6.7%
UNEMPLOYMENT RATE
Halfway Zip Codes
Halfway Area Codes
Income in Halfway
Income Overview in Halfway
Per Capita Income in Halfway is $20,805, while median incomes of families and households are $50,278 and $40,781 respectively.
| Characteristic | Number | Measure |
| Per Capita Income | 415 | $20,805 |
| Median Family Income | 88 | $50,278 |
| Mean Family Income | 88 | $73,678 |
| Median Household Income | 141 | $40,781 |
| Mean Household Income | 141 | $61,558 |
| Income Deficit | 88 | $0 |
| Wage / Income Gap (%) | 415 | 0.00% |
| Wage / Income Gap ($) | 415 | 100.00¢ per $1 |
| Gini / Inequality Index | 415 | 0.39 |
Earnings by Sex in Halfway
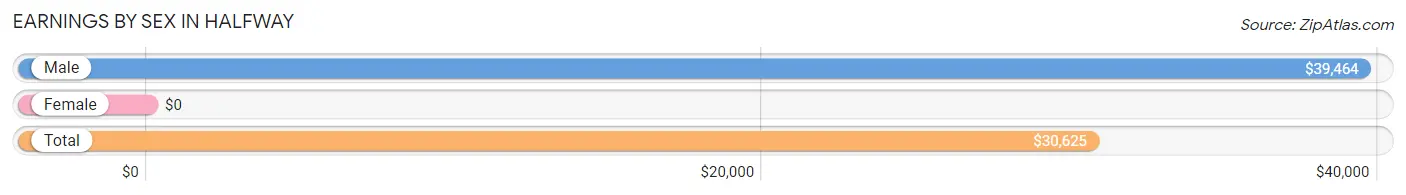
| Sex | Number | Average Earnings |
| Male | 59 (43.4%) | $39,464 |
| Female | 77 (56.6%) | $0 |
| Total | 136 (100.0%) | $30,625 |
Earnings by Sex by Income Bracket in Halfway
The most common earnings brackets in Halfway are $75,000 to $99,999 for men (13 | 22.0%) and $10,000 to $12,499 for women (13 | 16.9%).
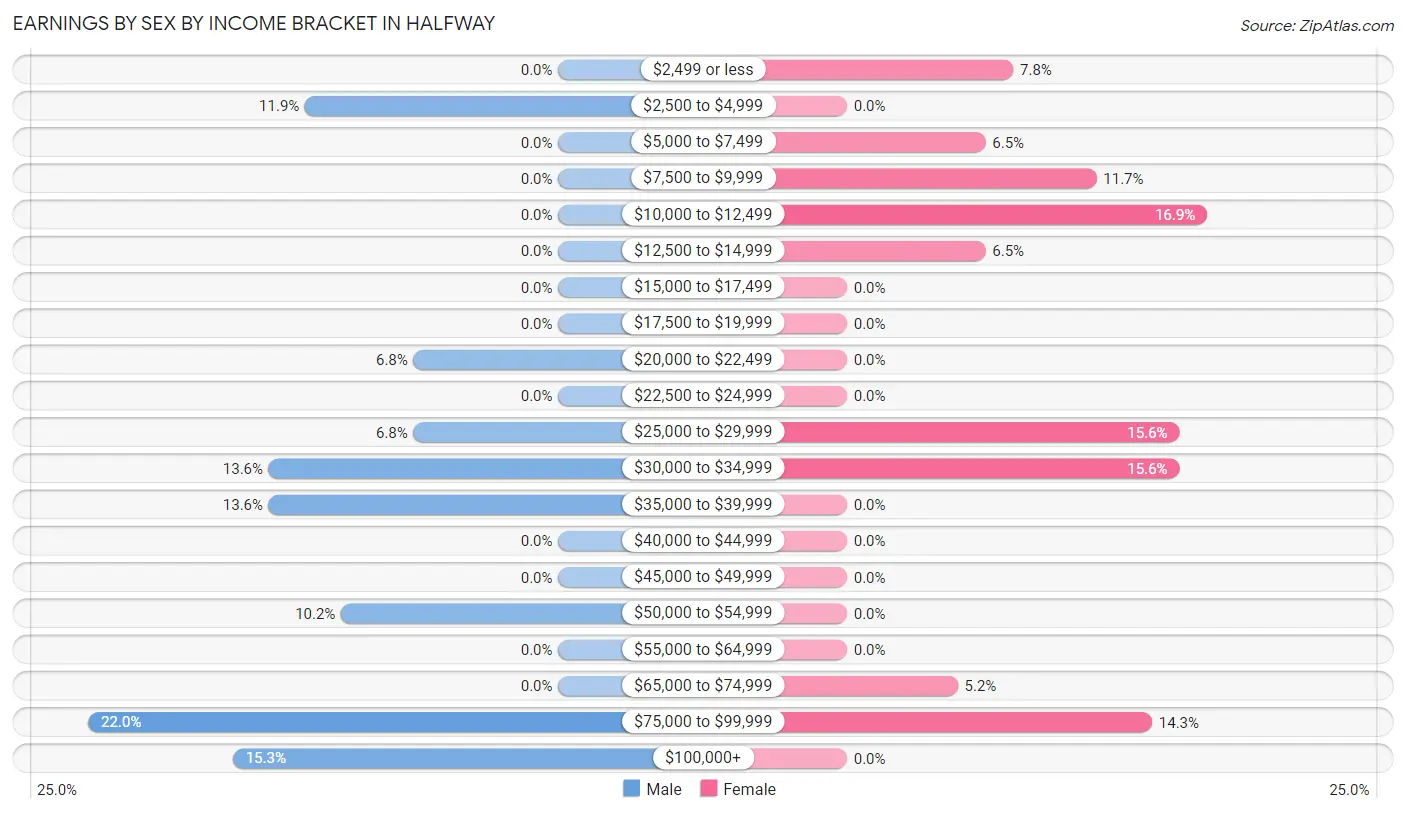
| Income | Male | Female |
| $2,499 or less | 0 (0.0%) | 6 (7.8%) |
| $2,500 to $4,999 | 7 (11.9%) | 0 (0.0%) |
| $5,000 to $7,499 | 0 (0.0%) | 5 (6.5%) |
| $7,500 to $9,999 | 0 (0.0%) | 9 (11.7%) |
| $10,000 to $12,499 | 0 (0.0%) | 13 (16.9%) |
| $12,500 to $14,999 | 0 (0.0%) | 5 (6.5%) |
| $15,000 to $17,499 | 0 (0.0%) | 0 (0.0%) |
| $17,500 to $19,999 | 0 (0.0%) | 0 (0.0%) |
| $20,000 to $22,499 | 4 (6.8%) | 0 (0.0%) |
| $22,500 to $24,999 | 0 (0.0%) | 0 (0.0%) |
| $25,000 to $29,999 | 4 (6.8%) | 12 (15.6%) |
| $30,000 to $34,999 | 8 (13.6%) | 12 (15.6%) |
| $35,000 to $39,999 | 8 (13.6%) | 0 (0.0%) |
| $40,000 to $44,999 | 0 (0.0%) | 0 (0.0%) |
| $45,000 to $49,999 | 0 (0.0%) | 0 (0.0%) |
| $50,000 to $54,999 | 6 (10.2%) | 0 (0.0%) |
| $55,000 to $64,999 | 0 (0.0%) | 0 (0.0%) |
| $65,000 to $74,999 | 0 (0.0%) | 4 (5.2%) |
| $75,000 to $99,999 | 13 (22.0%) | 11 (14.3%) |
| $100,000+ | 9 (15.2%) | 0 (0.0%) |
| Total | 59 (100.0%) | 77 (100.0%) |
Earnings by Sex by Educational Attainment in Halfway
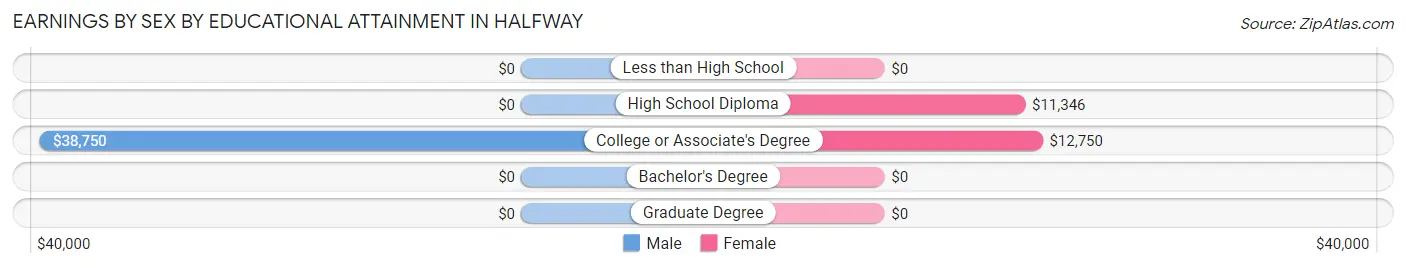
| Educational Attainment | Male Income | Female Income |
| Less than High School | - | - |
| High School Diploma | - | - |
| College or Associate's Degree | $38,750 | $12,750 |
| Bachelor's Degree | - | - |
| Graduate Degree | - | - |
| Total | $39,464 | $0 |
Family Income in Halfway
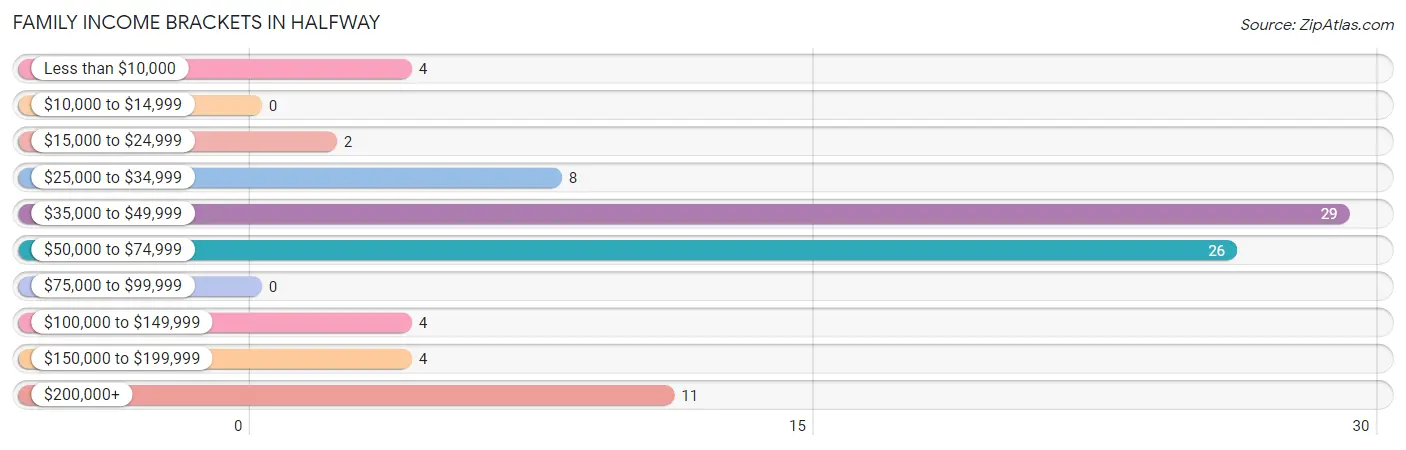
Family Income Brackets in Halfway
According to the Halfway family income data, there are 29 families falling into the $35,000 to $49,999 income range, which is the most common income bracket and makes up 33.0% of all families.
| Income Bracket | # Families | % Families |
| Less than $10,000 | 4 | 4.5% |
| $10,000 to $14,999 | 0 | 0.0% |
| $15,000 to $24,999 | 2 | 2.3% |
| $25,000 to $34,999 | 8 | 9.1% |
| $35,000 to $49,999 | 29 | 33.0% |
| $50,000 to $74,999 | 26 | 29.5% |
| $75,000 to $99,999 | 0 | 0.0% |
| $100,000 to $149,999 | 4 | 4.5% |
| $150,000 to $199,999 | 4 | 4.5% |
| $200,000+ | 11 | 12.5% |
Family Income by Famaliy Size in Halfway
2-person families (60 | 68.2%) account for the highest median family income in Halfway with $41,250 per family, while 2-person families (60 | 68.2%) have the highest median income of $20,625 per family member.
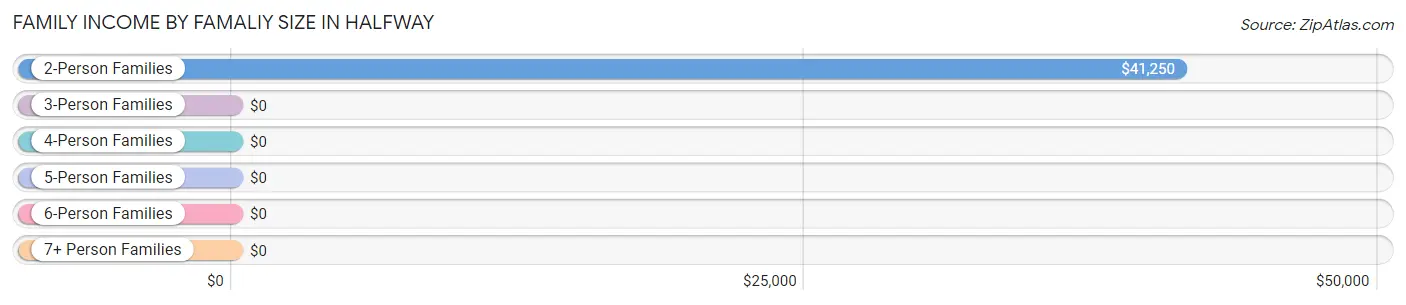
| Income Bracket | # Families | Median Income |
| 2-Person Families | 60 (68.2%) | $41,250 |
| 3-Person Families | 0 (0.0%) | $0 |
| 4-Person Families | 11 (12.5%) | $0 |
| 5-Person Families | 6 (6.8%) | $0 |
| 6-Person Families | 0 (0.0%) | $0 |
| 7+ Person Families | 11 (12.5%) | $0 |
| Total | 88 (100.0%) | $50,278 |
Family Income by Number of Earners in Halfway
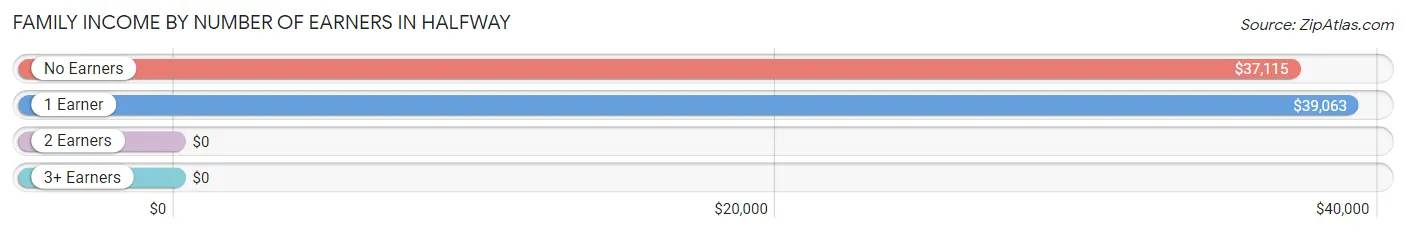
| Number of Earners | # Families | Median Income |
| No Earners | 22 (25.0%) | $37,115 |
| 1 Earner | 25 (28.4%) | $39,063 |
| 2 Earners | 41 (46.6%) | $0 |
| 3+ Earners | 0 (0.0%) | $0 |
| Total | 88 (100.0%) | $50,278 |
Household Income in Halfway
Household Income Brackets in Halfway
With 52 households falling in the category, the $35,000 to $49,999 income range is the most frequent in Halfway, accounting for 36.9% of all households.
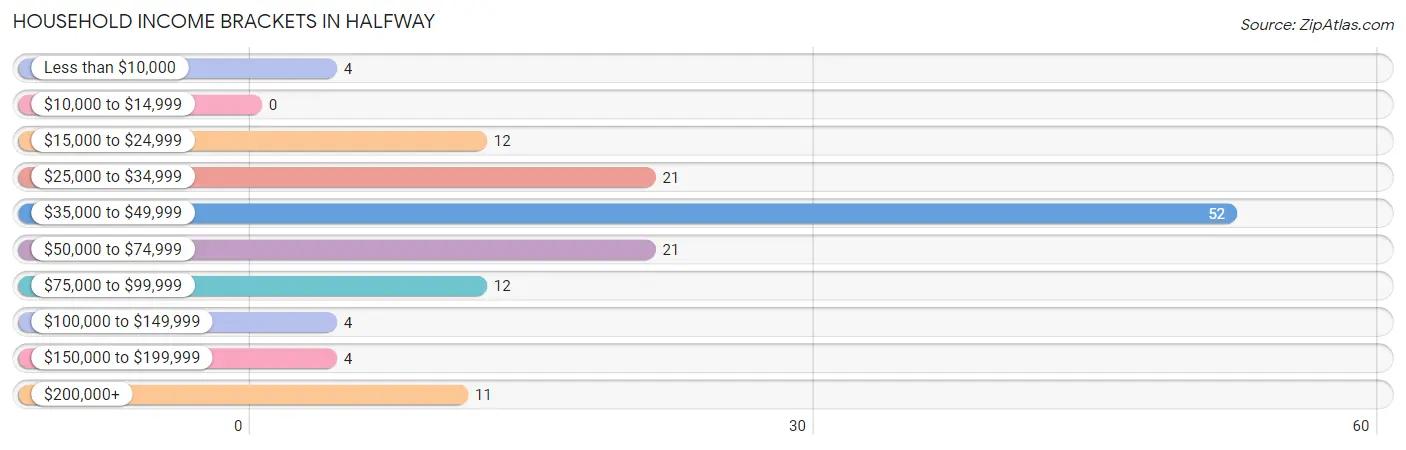
| Income Bracket | # Households | % Households |
| Less than $10,000 | 4 | 2.8% |
| $10,000 to $14,999 | 0 | 0.0% |
| $15,000 to $24,999 | 12 | 8.5% |
| $25,000 to $34,999 | 21 | 14.9% |
| $35,000 to $49,999 | 52 | 36.9% |
| $50,000 to $74,999 | 21 | 14.9% |
| $75,000 to $99,999 | 12 | 8.5% |
| $100,000 to $149,999 | 4 | 2.8% |
| $150,000 to $199,999 | 4 | 2.8% |
| $200,000+ | 11 | 7.8% |
Household Income by Householder Age in Halfway
The median household income in Halfway is $40,781, with the highest median household income of $50,250 found in the 45 to 64 years age bracket for the primary householder. A total of 27 households (19.2%) fall into this category.
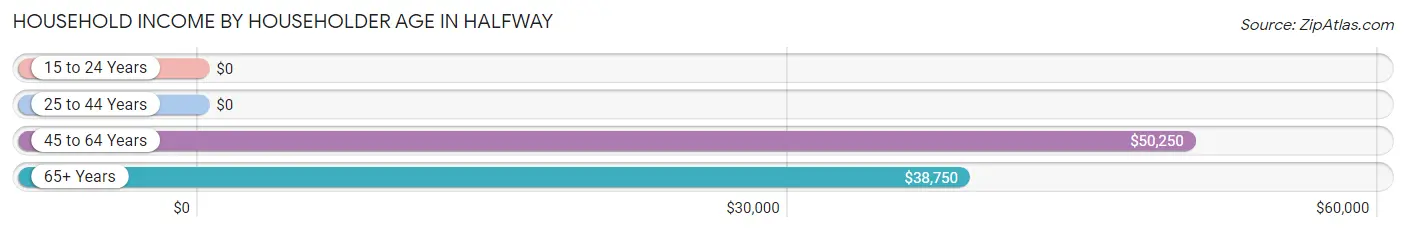
| Income Bracket | # Households | Median Income |
| 15 to 24 Years | 0 (0.0%) | $0 |
| 25 to 44 Years | 40 (28.4%) | $0 |
| 45 to 64 Years | 27 (19.2%) | $50,250 |
| 65+ Years | 74 (52.5%) | $38,750 |
| Total | 141 (100.0%) | $40,781 |
Poverty in Halfway
Income Below Poverty by Sex and Age in Halfway
With 8.9% poverty level for males and 5.8% for females among the residents of Halfway, 18 to 24 year old males and 45 to 54 year old females are the most vulnerable to poverty, with 6 males (100.0%) and 9 females (32.1%) in their respective age groups living below the poverty level.
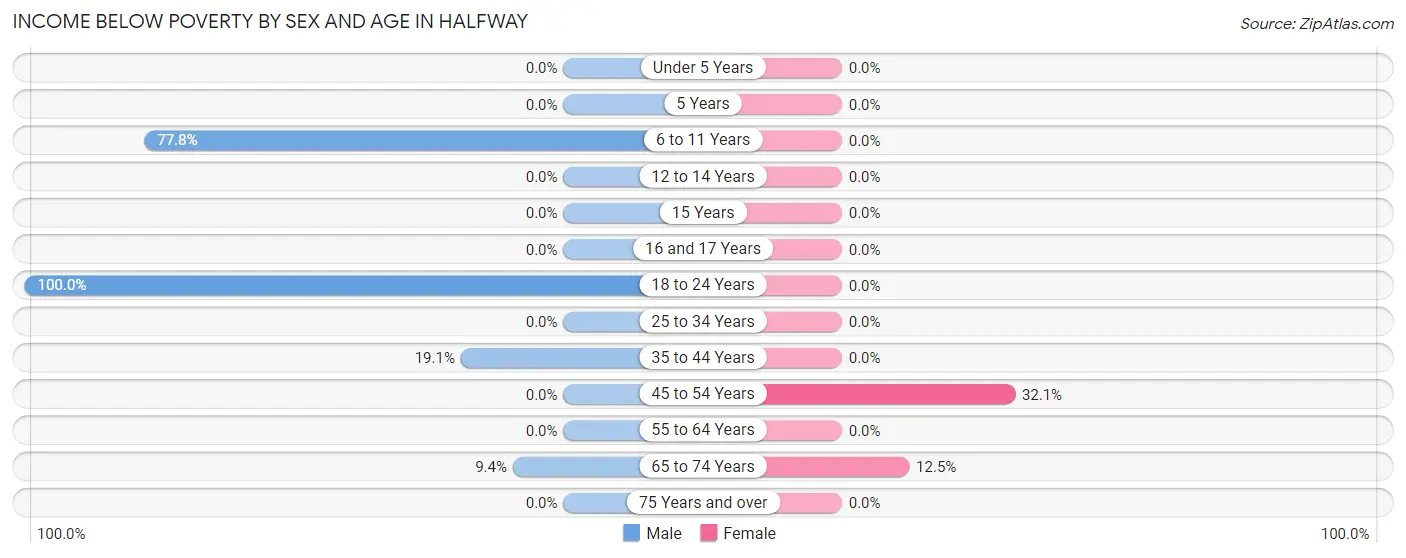
| Age Bracket | Male | Female |
| Under 5 Years | 0 (0.0%) | 0 (0.0%) |
| 5 Years | 0 (0.0%) | 0 (0.0%) |
| 6 to 11 Years | 7 (77.8%) | 0 (0.0%) |
| 12 to 14 Years | 0 (0.0%) | 0 (0.0%) |
| 15 Years | 0 (0.0%) | 0 (0.0%) |
| 16 and 17 Years | 0 (0.0%) | 0 (0.0%) |
| 18 to 24 Years | 6 (100.0%) | 0 (0.0%) |
| 25 to 34 Years | 0 (0.0%) | 0 (0.0%) |
| 35 to 44 Years | 4 (19.1%) | 0 (0.0%) |
| 45 to 54 Years | 0 (0.0%) | 9 (32.1%) |
| 55 to 64 Years | 0 (0.0%) | 0 (0.0%) |
| 65 to 74 Years | 3 (9.4%) | 2 (12.5%) |
| 75 Years and over | 0 (0.0%) | 0 (0.0%) |
| Total | 20 (8.9%) | 11 (5.8%) |
Income Above Poverty by Sex and Age in Halfway
According to the poverty statistics in Halfway, males aged under 5 years and females aged 5 years are the age groups that are most secure financially, with 100.0% of males and 100.0% of females in these age groups living above the poverty line.
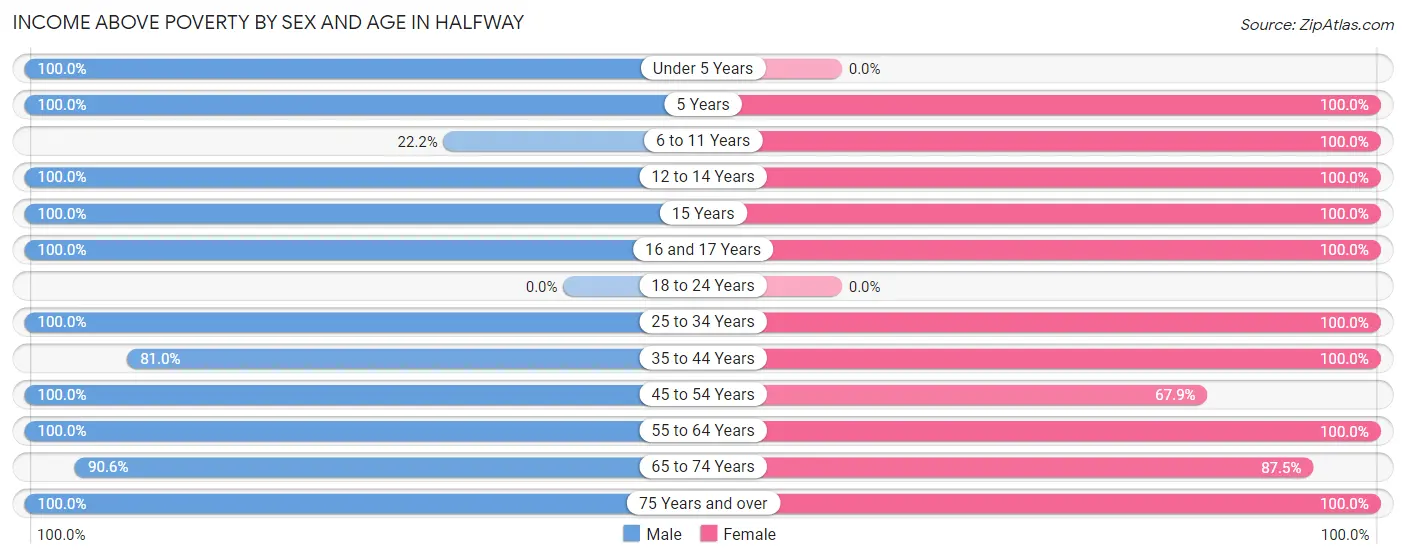
| Age Bracket | Male | Female |
| Under 5 Years | 1 (100.0%) | 0 (0.0%) |
| 5 Years | 6 (100.0%) | 2 (100.0%) |
| 6 to 11 Years | 2 (22.2%) | 31 (100.0%) |
| 12 to 14 Years | 12 (100.0%) | 12 (100.0%) |
| 15 Years | 9 (100.0%) | 9 (100.0%) |
| 16 and 17 Years | 13 (100.0%) | 14 (100.0%) |
| 18 to 24 Years | 0 (0.0%) | 0 (0.0%) |
| 25 to 34 Years | 1 (100.0%) | 18 (100.0%) |
| 35 to 44 Years | 17 (80.9%) | 18 (100.0%) |
| 45 to 54 Years | 15 (100.0%) | 19 (67.9%) |
| 55 to 64 Years | 81 (100.0%) | 17 (100.0%) |
| 65 to 74 Years | 29 (90.6%) | 14 (87.5%) |
| 75 Years and over | 18 (100.0%) | 26 (100.0%) |
| Total | 204 (91.1%) | 180 (94.2%) |
Income Below Poverty Among Married-Couple Families in Halfway
The poverty statistics for married-couple families in Halfway show that 3.1% or 2 of the total 64 families live below the poverty line. Families with no children have the highest poverty rate of 5.6%, comprising of 2 families. On the other hand, families with 1 or 2 children have the lowest poverty rate of 0.0%, which includes 0 families.
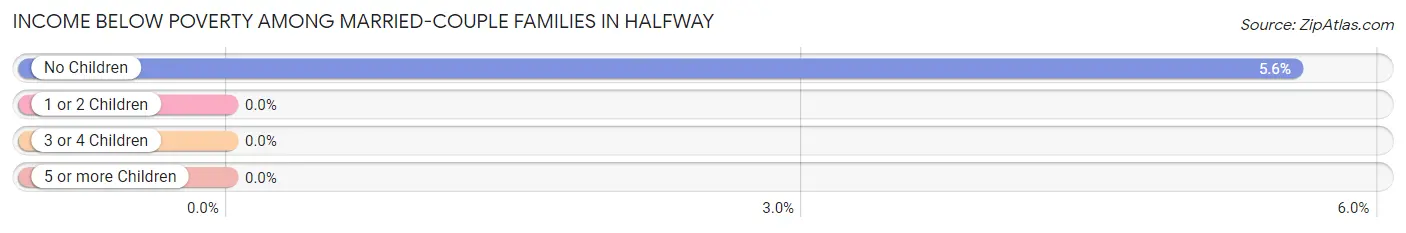
| Children | Above Poverty | Below Poverty |
| No Children | 34 (94.4%) | 2 (5.6%) |
| 1 or 2 Children | 11 (100.0%) | 0 (0.0%) |
| 3 or 4 Children | 6 (100.0%) | 0 (0.0%) |
| 5 or more Children | 11 (100.0%) | 0 (0.0%) |
| Total | 62 (96.9%) | 2 (3.1%) |
Income Below Poverty Among Single-Parent Households in Halfway
| Children | Single Father | Single Mother |
| No Children | 0 (0.0%) | 0 (0.0%) |
| 1 or 2 Children | 4 (100.0%) | 0 (0.0%) |
| 3 or 4 Children | 0 (0.0%) | 0 (0.0%) |
| 5 or more Children | 0 (0.0%) | 0 (0.0%) |
| Total | 4 (100.0%) | 0 (0.0%) |
Income Below Poverty Among Married-Couple vs Single-Parent Households in Halfway
The poverty data for Halfway shows that 2 of the married-couple family households (3.1%) and 4 of the single-parent households (16.7%) are living below the poverty level. Within the married-couple family households, those with no children have the highest poverty rate, with 2 households (5.6%) falling below the poverty line. Among the single-parent households, those with 1 or 2 children have the highest poverty rate, with 4 household (57.1%) living below poverty.
| Children | Married-Couple Families | Single-Parent Households |
| No Children | 2 (5.6%) | 0 (0.0%) |
| 1 or 2 Children | 0 (0.0%) | 4 (57.1%) |
| 3 or 4 Children | 0 (0.0%) | 0 (0.0%) |
| 5 or more Children | 0 (0.0%) | 0 (0.0%) |
| Total | 2 (3.1%) | 4 (16.7%) |
Race in Halfway
The most populous races in Halfway are White / Caucasian (377 | 90.8%), Two or more Races (23 | 5.5%), and Hispanic or Latino (16 | 3.9%).
| Race | # Population | % Population |
| Asian | 9 | 2.2% |
| Black / African American | 0 | 0.0% |
| Hawaiian / Pacific | 0 | 0.0% |
| Hispanic or Latino | 16 | 3.9% |
| Native / Alaskan | 6 | 1.5% |
| White / Caucasian | 377 | 90.8% |
| Two or more Races | 23 | 5.5% |
| Some other Race | 0 | 0.0% |
| Total | 415 | 100.0% |
Ancestry in Halfway
The most populous ancestries reported in Halfway are Swedish (65 | 15.7%), English (48 | 11.6%), Irish (27 | 6.5%), German (22 | 5.3%), and Puerto Rican (11 | 2.6%), together accounting for 41.7% of all Halfway residents.
| Ancestry | # Population | % Population |
| Armenian | 6 | 1.5% |
| Canadian | 2 | 0.5% |
| Danish | 8 | 1.9% |
| Dutch | 5 | 1.2% |
| English | 48 | 11.6% |
| European | 4 | 1.0% |
| French | 6 | 1.5% |
| German | 22 | 5.3% |
| Irish | 27 | 6.5% |
| Korean | 9 | 2.2% |
| Mexican | 5 | 1.2% |
| Norwegian | 9 | 2.2% |
| Polish | 9 | 2.2% |
| Puerto Rican | 11 | 2.6% |
| Scandinavian | 7 | 1.7% |
| Scottish | 6 | 1.5% |
| Shoshone | 4 | 1.0% |
| Swedish | 65 | 15.7% | View All 18 Rows |
Immigrants in Halfway
The most numerous immigrant groups reported in Halfway came from Asia (9 | 2.2%), Philippines (9 | 2.2%), and South Eastern Asia (9 | 2.2%), together accounting for 6.5% of all Halfway residents.
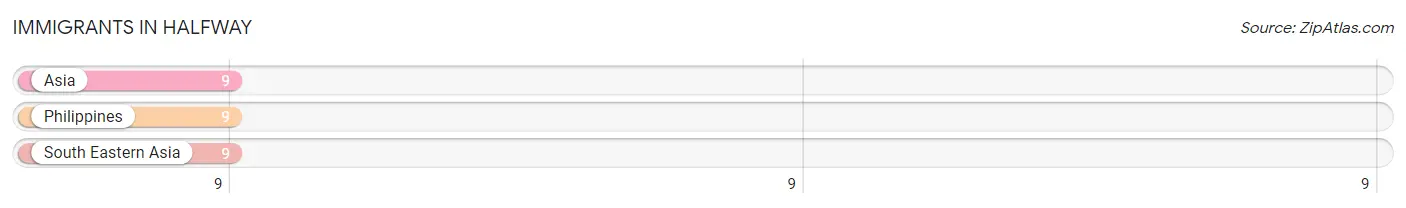
| Immigration Origin | # Population | % Population |
| Asia | 9 | 2.2% |
| Philippines | 9 | 2.2% |
| South Eastern Asia | 9 | 2.2% | View All 3 Rows |
Sex and Age in Halfway
Sex and Age in Halfway
The most populous age groups in Halfway are 55 to 59 Years (76 | 33.9%) for men and 5 to 9 Years (24 | 12.6%) for women.
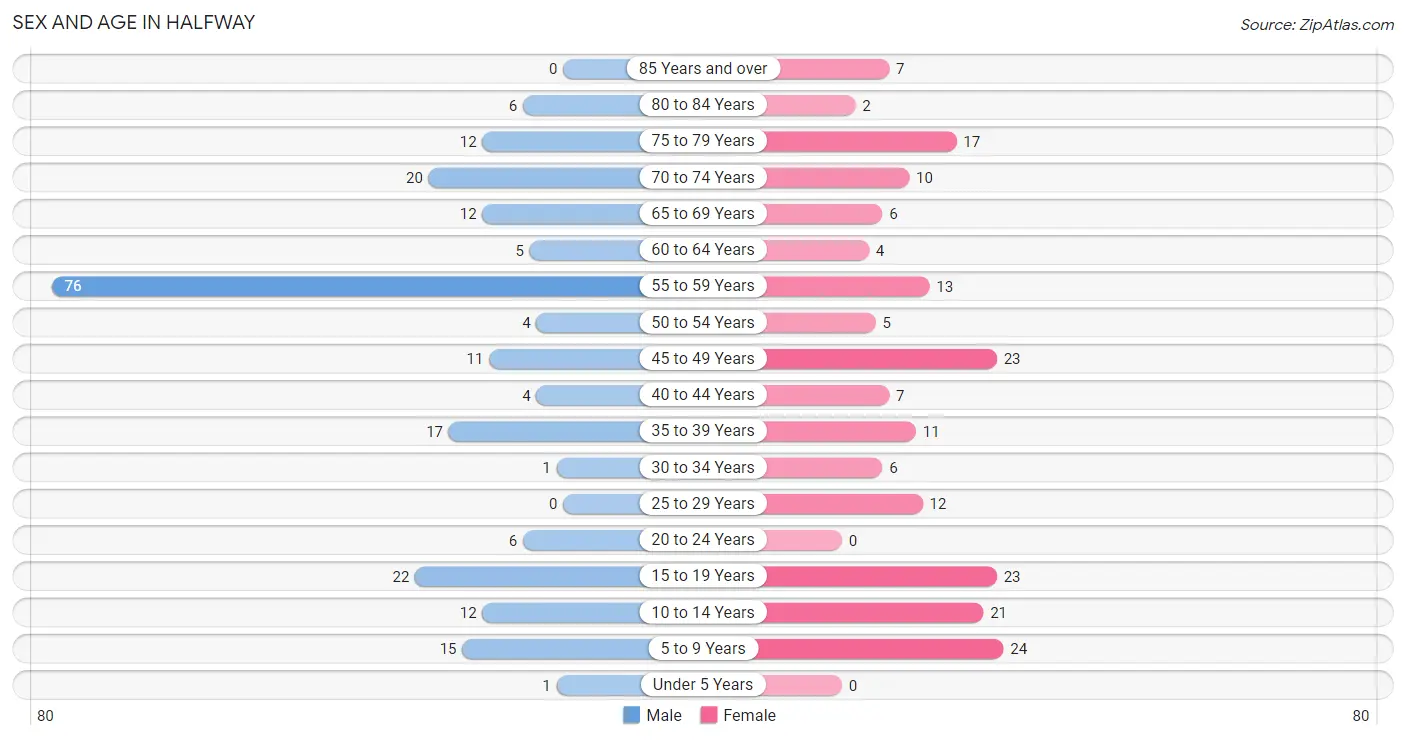
| Age Bracket | Male | Female |
| Under 5 Years | 1 (0.4%) | 0 (0.0%) |
| 5 to 9 Years | 15 (6.7%) | 24 (12.6%) |
| 10 to 14 Years | 12 (5.4%) | 21 (11.0%) |
| 15 to 19 Years | 22 (9.8%) | 23 (12.0%) |
| 20 to 24 Years | 6 (2.7%) | 0 (0.0%) |
| 25 to 29 Years | 0 (0.0%) | 12 (6.3%) |
| 30 to 34 Years | 1 (0.4%) | 6 (3.1%) |
| 35 to 39 Years | 17 (7.6%) | 11 (5.8%) |
| 40 to 44 Years | 4 (1.8%) | 7 (3.7%) |
| 45 to 49 Years | 11 (4.9%) | 23 (12.0%) |
| 50 to 54 Years | 4 (1.8%) | 5 (2.6%) |
| 55 to 59 Years | 76 (33.9%) | 13 (6.8%) |
| 60 to 64 Years | 5 (2.2%) | 4 (2.1%) |
| 65 to 69 Years | 12 (5.4%) | 6 (3.1%) |
| 70 to 74 Years | 20 (8.9%) | 10 (5.2%) |
| 75 to 79 Years | 12 (5.4%) | 17 (8.9%) |
| 80 to 84 Years | 6 (2.7%) | 2 (1.1%) |
| 85 Years and over | 0 (0.0%) | 7 (3.7%) |
| Total | 224 (100.0%) | 191 (100.0%) |
Families and Households in Halfway
Median Family Size in Halfway
The median family size in Halfway is 3.94 persons per family, with single female/mother families (20 | 22.7%) accounting for the largest median family size of 4.8 persons per family. On the other hand, single male/father families (4 | 4.5%) represent the smallest median family size with 2.75 persons per family.
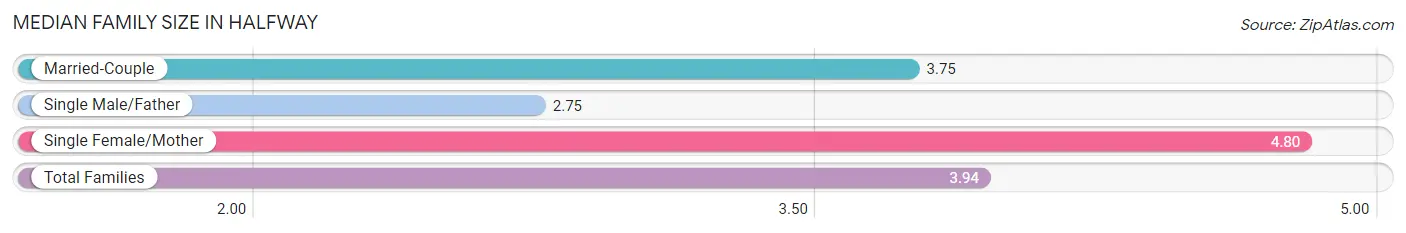
| Family Type | # Families | Family Size |
| Married-Couple | 64 (72.7%) | 3.75 |
| Single Male/Father | 4 (4.5%) | 2.75 |
| Single Female/Mother | 20 (22.7%) | 4.80 |
| Total Families | 88 (100.0%) | 3.94 |
Median Household Size in Halfway
The median household size in Halfway is 2.94 persons per household, with single female/mother households (20 | 14.2%) accounting for the largest median household size of 4.8 persons per household. non-family households (53 | 37.6%) represent the smallest median household size with 1.11 persons per household.
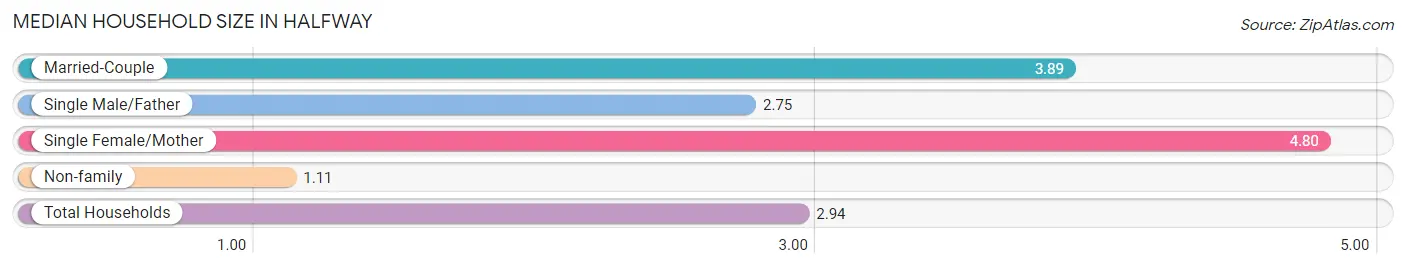
| Household Type | # Households | Household Size |
| Married-Couple | 64 (45.4%) | 3.89 |
| Single Male/Father | 4 (2.8%) | 2.75 |
| Single Female/Mother | 20 (14.2%) | 4.80 |
| Non-family | 53 (37.6%) | 1.11 |
| Total Households | 141 (100.0%) | 2.94 |
Household Size by Marriage Status in Halfway
Out of a total of 141 households in Halfway, 88 (62.4%) are family households, while 53 (37.6%) are nonfamily households. The most numerous type of family households are 2-person households, comprising 60, and the most common type of nonfamily households are 1-person households, comprising 48.
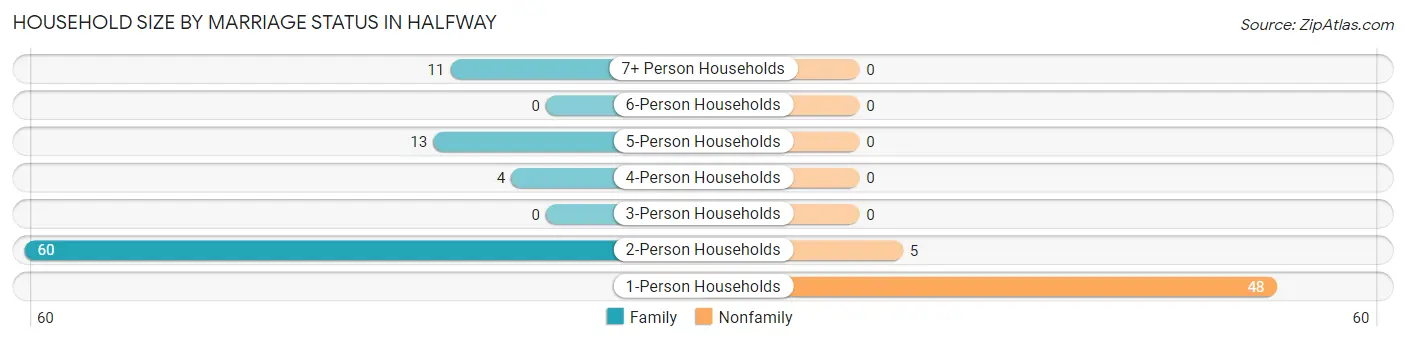
| Household Size | Family Households | Nonfamily Households |
| 1-Person Households | - | 48 (34.0%) |
| 2-Person Households | 60 (42.5%) | 5 (3.5%) |
| 3-Person Households | 0 (0.0%) | 0 (0.0%) |
| 4-Person Households | 4 (2.8%) | 0 (0.0%) |
| 5-Person Households | 13 (9.2%) | 0 (0.0%) |
| 6-Person Households | 0 (0.0%) | 0 (0.0%) |
| 7+ Person Households | 11 (7.8%) | 0 (0.0%) |
| Total | 88 (62.4%) | 53 (37.6%) |
Female Fertility in Halfway
Fertility by Age in Halfway
| Age Bracket | Women with Births | Births / 1,000 Women |
| 15 to 19 years | 0 (0.0%) | 0.0 |
| 20 to 34 years | 0 (0.0%) | 0.0 |
| 35 to 50 years | 0 (0.0%) | 0.0 |
| Total | 0 (0.0%) | 0.0 |
Fertility by Age by Marriage Status in Halfway
| Age Bracket | Married | Unmarried |
| 15 to 19 years | 0 (0.0%) | 0 (0.0%) |
| 20 to 34 years | 0 (0.0%) | 0 (0.0%) |
| 35 to 50 years | 0 (0.0%) | 0 (0.0%) |
| Total | 0 (0.0%) | 0 (0.0%) |
Fertility by Education in Halfway
| Educational Attainment | Women with Births | Births / 1,000 Women |
| Less than High School | 0 (0.0%) | 0.0 |
| High School Diploma | 0 (0.0%) | 0.0 |
| College or Associate's Degree | 0 (0.0%) | 0.0 |
| Bachelor's Degree | 0 (0.0%) | 0.0 |
| Graduate Degree | 0 (0.0%) | 0.0 |
| Total | 0 (0.0%) | 0.0 |
Fertility by Education by Marriage Status in Halfway
| Educational Attainment | Married | Unmarried |
| Less than High School | 0 (0.0%) | 0 (0.0%) |
| High School Diploma | 0 (0.0%) | 0 (0.0%) |
| College or Associate's Degree | 0 (0.0%) | 0 (0.0%) |
| Bachelor's Degree | 0 (0.0%) | 0 (0.0%) |
| Graduate Degree | 0 (0.0%) | 0 (0.0%) |
| Total | 0 (0.0%) | 0 (0.0%) |
Employment Characteristics in Halfway
Employment by Class of Employer in Halfway
Among the 126 employed individuals in Halfway, private company employees (67 | 53.2%), local government employees (37 | 29.4%), and self-employed (incorporated) (9 | 7.1%) make up the most common classes of employment.
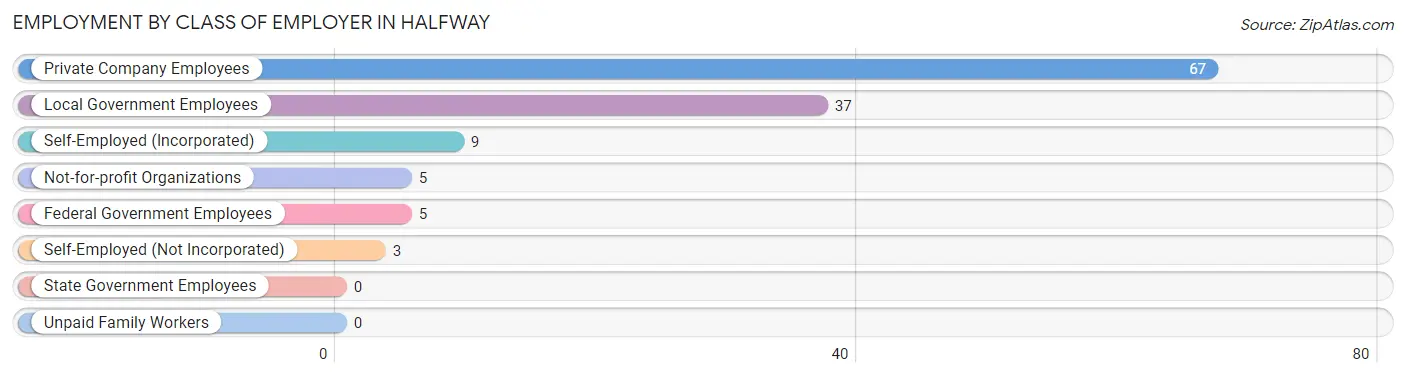
| Employer Class | # Employees | % Employees |
| Private Company Employees | 67 | 53.2% |
| Self-Employed (Incorporated) | 9 | 7.1% |
| Self-Employed (Not Incorporated) | 3 | 2.4% |
| Not-for-profit Organizations | 5 | 4.0% |
| Local Government Employees | 37 | 29.4% |
| State Government Employees | 0 | 0.0% |
| Federal Government Employees | 5 | 4.0% |
| Unpaid Family Workers | 0 | 0.0% |
| Total | 126 | 100.0% |
Employment Status by Age in Halfway
According to the labor force statistics for Halfway, out of the total population over 16 years of age (324), 41.7% or 135 individuals are in the labor force, with 6.7% or 9 of them unemployed. The age group with the highest labor force participation rate is 35 to 44 years, with 100.0% or 39 individuals in the labor force. Within the labor force, the 16 to 19 years age range has the highest percentage of unemployed individuals, with 100.0% or 9 of them being unemployed.
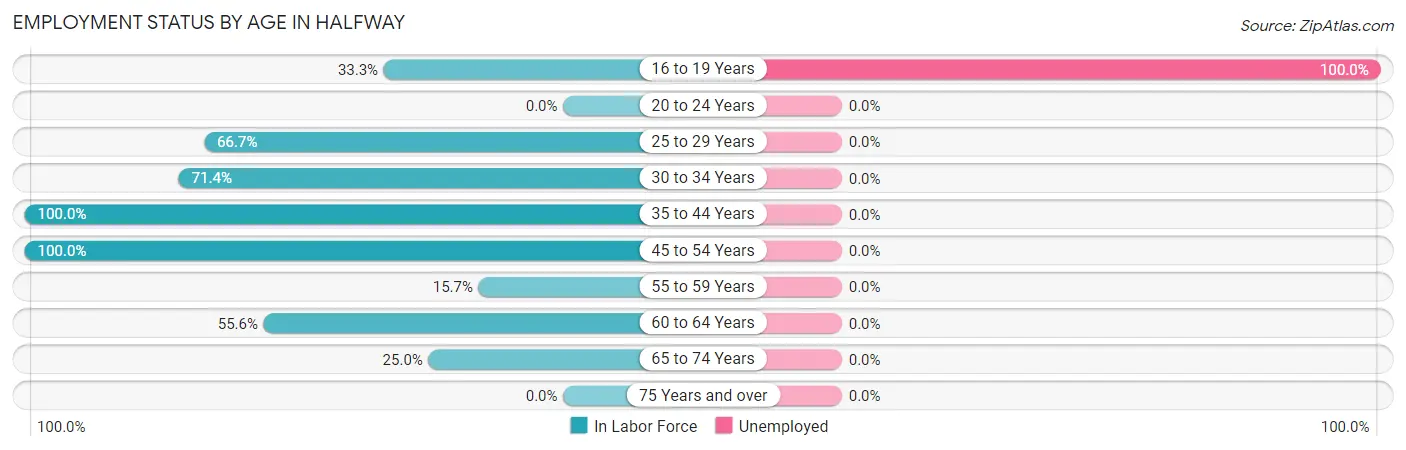
| Age Bracket | In Labor Force | Unemployed |
| 16 to 19 Years | 9 (33.3%) | 9 (100.0%) |
| 20 to 24 Years | 0 (0.0%) | 0 (0.0%) |
| 25 to 29 Years | 8 (66.7%) | 0 (0.0%) |
| 30 to 34 Years | 5 (71.4%) | 0 (0.0%) |
| 35 to 44 Years | 39 (100.0%) | 0 (0.0%) |
| 45 to 54 Years | 43 (100.0%) | 0 (0.0%) |
| 55 to 59 Years | 14 (15.7%) | 0 (0.0%) |
| 60 to 64 Years | 5 (55.6%) | 0 (0.0%) |
| 65 to 74 Years | 12 (25.0%) | 0 (0.0%) |
| 75 Years and over | 0 (0.0%) | 0 (0.0%) |
| Total | 135 (41.7%) | 9 (6.7%) |
Employment Status by Educational Attainment in Halfway
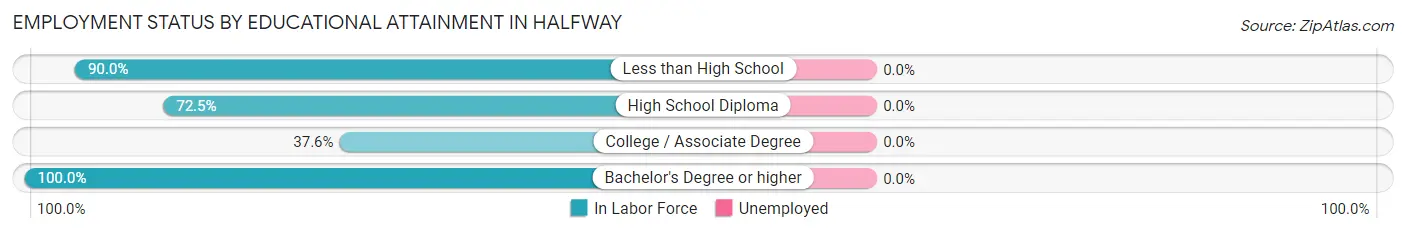
| Educational Attainment | In Labor Force | Unemployed |
| Less than High School | 9 (90.0%) | 0 (0.0%) |
| High School Diploma | 29 (72.5%) | 0 (0.0%) |
| College / Associate Degree | 44 (37.6%) | 0 (0.0%) |
| Bachelor's Degree or higher | 32 (100.0%) | 0 (0.0%) |
| Total | 114 (57.3%) | 0 (0.0%) |
Employment Occupations by Sex in Halfway
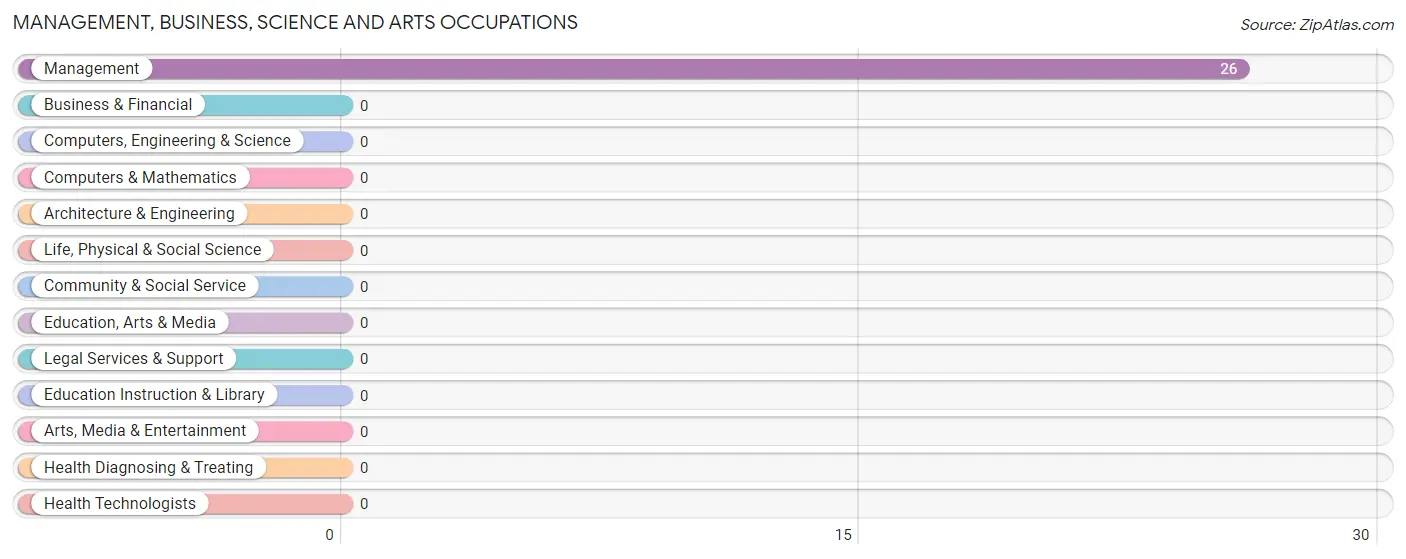
Management, Business, Science and Arts Occupations
The most common Management, Business, Science and Arts occupations in Halfway are , and Management (26 | 20.6%).
Management, Business, Science and Arts Occupations by Sex
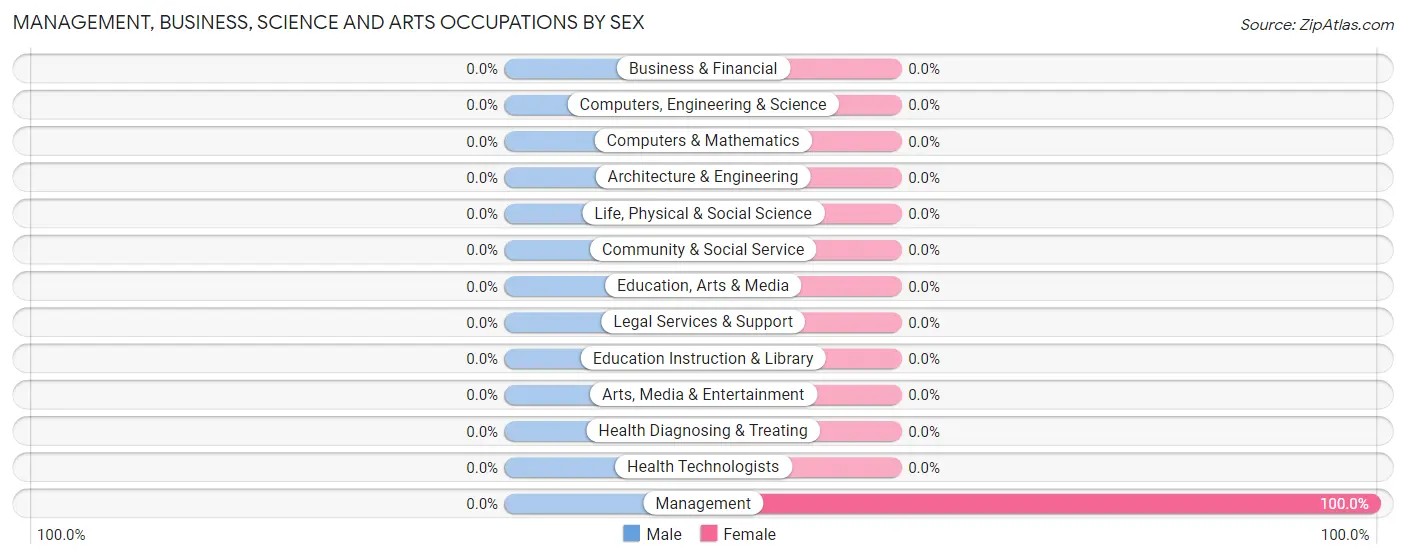
| Occupation | Male | Female |
| Management | 0 (0.0%) | 26 (100.0%) |
| Business & Financial | 0 (0.0%) | 0 (0.0%) |
| Computers, Engineering & Science | 0 (0.0%) | 0 (0.0%) |
| Computers & Mathematics | 0 (0.0%) | 0 (0.0%) |
| Architecture & Engineering | 0 (0.0%) | 0 (0.0%) |
| Life, Physical & Social Science | 0 (0.0%) | 0 (0.0%) |
| Community & Social Service | 0 (0.0%) | 0 (0.0%) |
| Education, Arts & Media | 0 (0.0%) | 0 (0.0%) |
| Legal Services & Support | 0 (0.0%) | 0 (0.0%) |
| Education Instruction & Library | 0 (0.0%) | 0 (0.0%) |
| Arts, Media & Entertainment | 0 (0.0%) | 0 (0.0%) |
| Health Diagnosing & Treating | 0 (0.0%) | 0 (0.0%) |
| Health Technologists | 0 (0.0%) | 0 (0.0%) |
| Total (Category) | 0 (0.0%) | 26 (100.0%) |
| Total (Overall) | 55 (43.6%) | 71 (56.4%) |
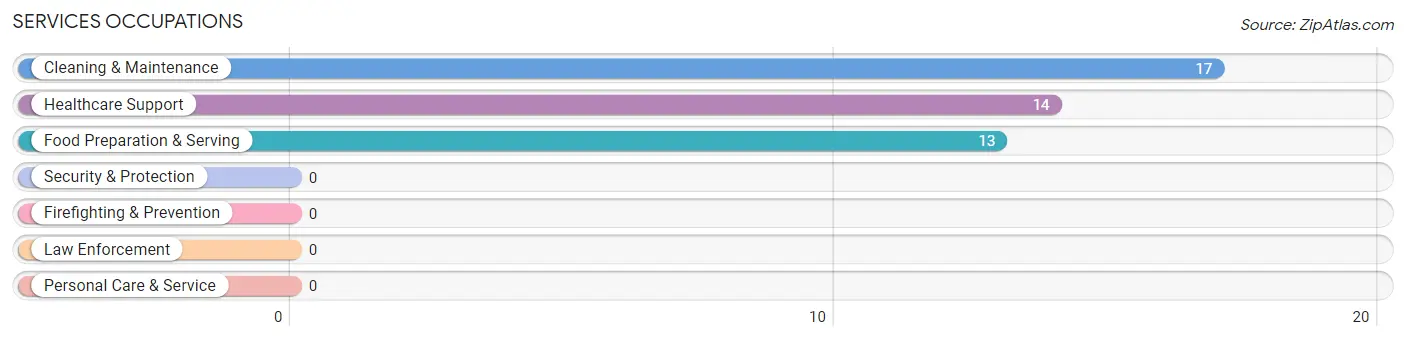
Services Occupations
The most common Services occupations in Halfway are Cleaning & Maintenance (17 | 13.5%), Healthcare Support (14 | 11.1%), and Food Preparation & Serving (13 | 10.3%).
Services Occupations by Sex
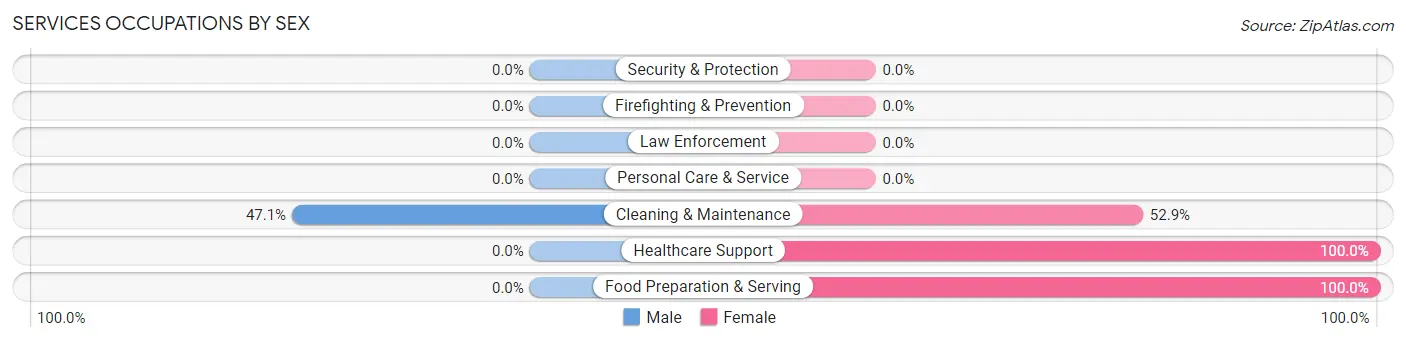
| Occupation | Male | Female |
| Healthcare Support | 0 (0.0%) | 14 (100.0%) |
| Security & Protection | 0 (0.0%) | 0 (0.0%) |
| Firefighting & Prevention | 0 (0.0%) | 0 (0.0%) |
| Law Enforcement | 0 (0.0%) | 0 (0.0%) |
| Food Preparation & Serving | 0 (0.0%) | 13 (100.0%) |
| Cleaning & Maintenance | 8 (47.1%) | 9 (52.9%) |
| Personal Care & Service | 0 (0.0%) | 0 (0.0%) |
| Total (Category) | 8 (18.2%) | 36 (81.8%) |
| Total (Overall) | 55 (43.6%) | 71 (56.4%) |
Sales and Office Occupations
The most common Sales and Office occupations in Halfway are Office & Administration (9 | 7.1%), and Sales & Related (4 | 3.2%).
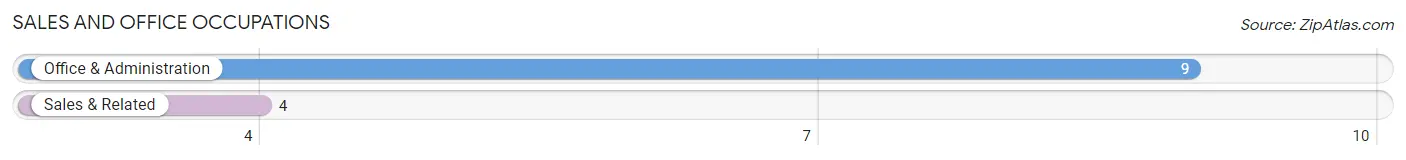
Sales and Office Occupations by Sex
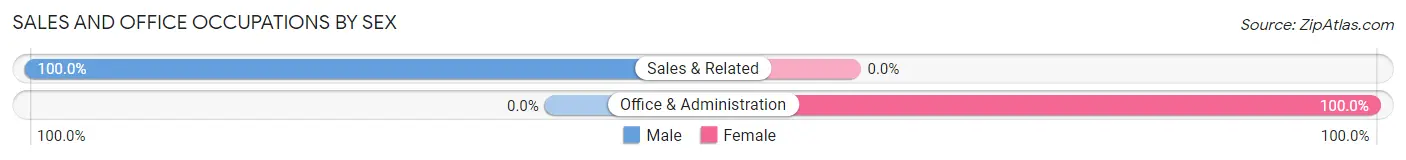
| Occupation | Male | Female |
| Sales & Related | 4 (100.0%) | 0 (0.0%) |
| Office & Administration | 0 (0.0%) | 9 (100.0%) |
| Total (Category) | 4 (30.8%) | 9 (69.2%) |
| Total (Overall) | 55 (43.6%) | 71 (56.4%) |
Natural Resources, Construction and Maintenance Occupations
The most common Natural Resources, Construction and Maintenance occupations in Halfway are Installation, Maintenance & Repair (19 | 15.1%), Construction & Extraction (3 | 2.4%), and Farming, Fishing & Forestry (1 | 0.8%).
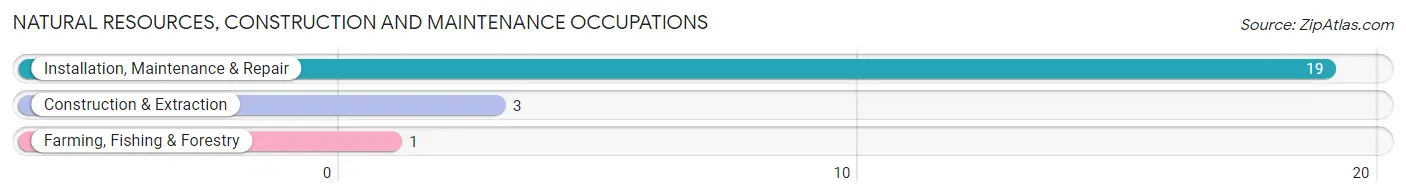
Natural Resources, Construction and Maintenance Occupations by Sex
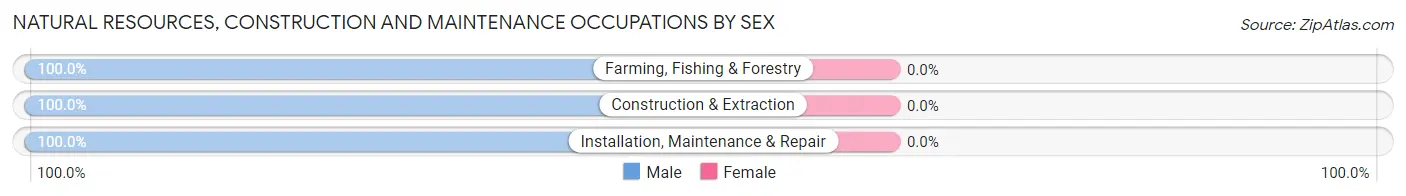
| Occupation | Male | Female |
| Farming, Fishing & Forestry | 1 (100.0%) | 0 (0.0%) |
| Construction & Extraction | 3 (100.0%) | 0 (0.0%) |
| Installation, Maintenance & Repair | 19 (100.0%) | 0 (0.0%) |
| Total (Category) | 23 (100.0%) | 0 (0.0%) |
| Total (Overall) | 55 (43.6%) | 71 (56.4%) |
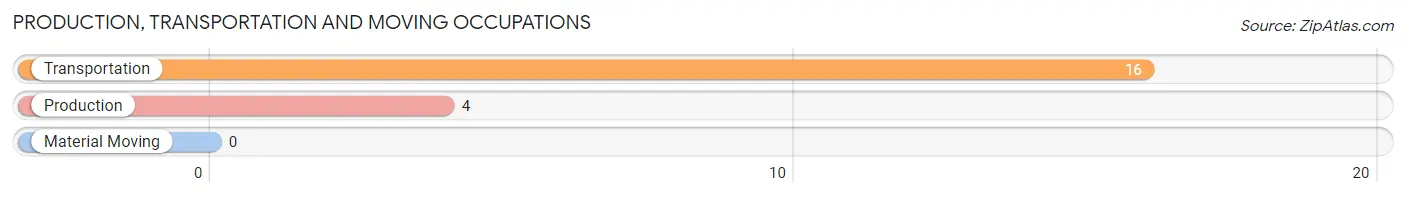
Production, Transportation and Moving Occupations
The most common Production, Transportation and Moving occupations in Halfway are Transportation (16 | 12.7%), and Production (4 | 3.2%).
Production, Transportation and Moving Occupations by Sex
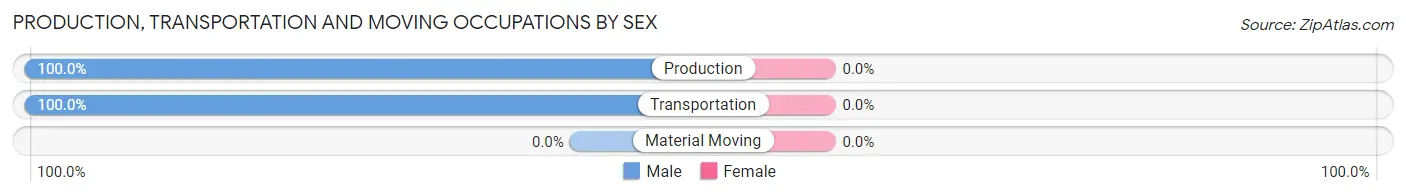
| Occupation | Male | Female |
| Production | 4 (100.0%) | 0 (0.0%) |
| Transportation | 16 (100.0%) | 0 (0.0%) |
| Material Moving | 0 (0.0%) | 0 (0.0%) |
| Total (Category) | 20 (100.0%) | 0 (0.0%) |
| Total (Overall) | 55 (43.6%) | 71 (56.4%) |
Employment Industries by Sex in Halfway
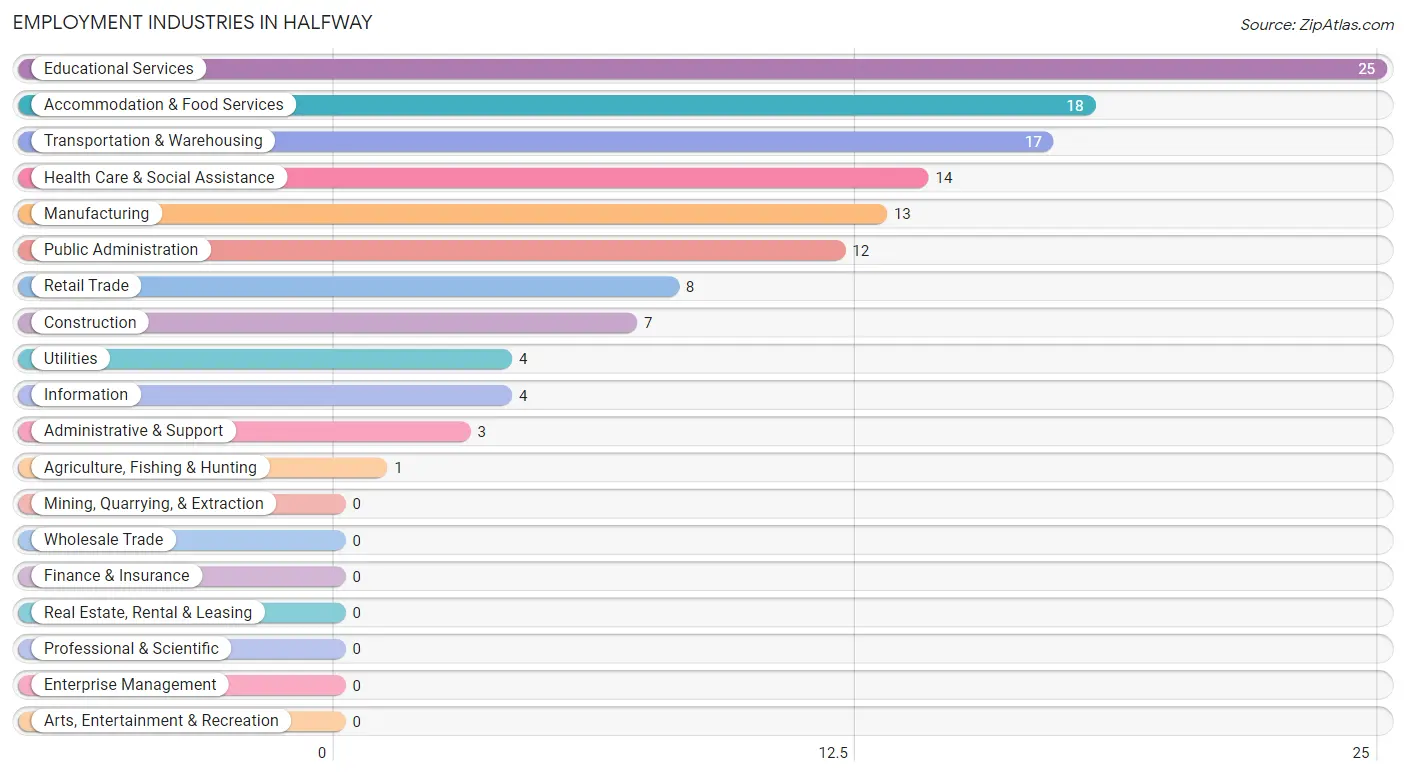
Employment Industries in Halfway
The major employment industries in Halfway include Educational Services (25 | 19.8%), Accommodation & Food Services (18 | 14.3%), Transportation & Warehousing (17 | 13.5%), Health Care & Social Assistance (14 | 11.1%), and Manufacturing (13 | 10.3%).
Employment Industries by Sex in Halfway
The Halfway industries that see more men than women are Agriculture, Fishing & Hunting (100.0%), Construction (100.0%), and Manufacturing (100.0%), whereas the industries that tend to have a higher number of women are Information (100.0%), Administrative & Support (100.0%), and Health Care & Social Assistance (100.0%).
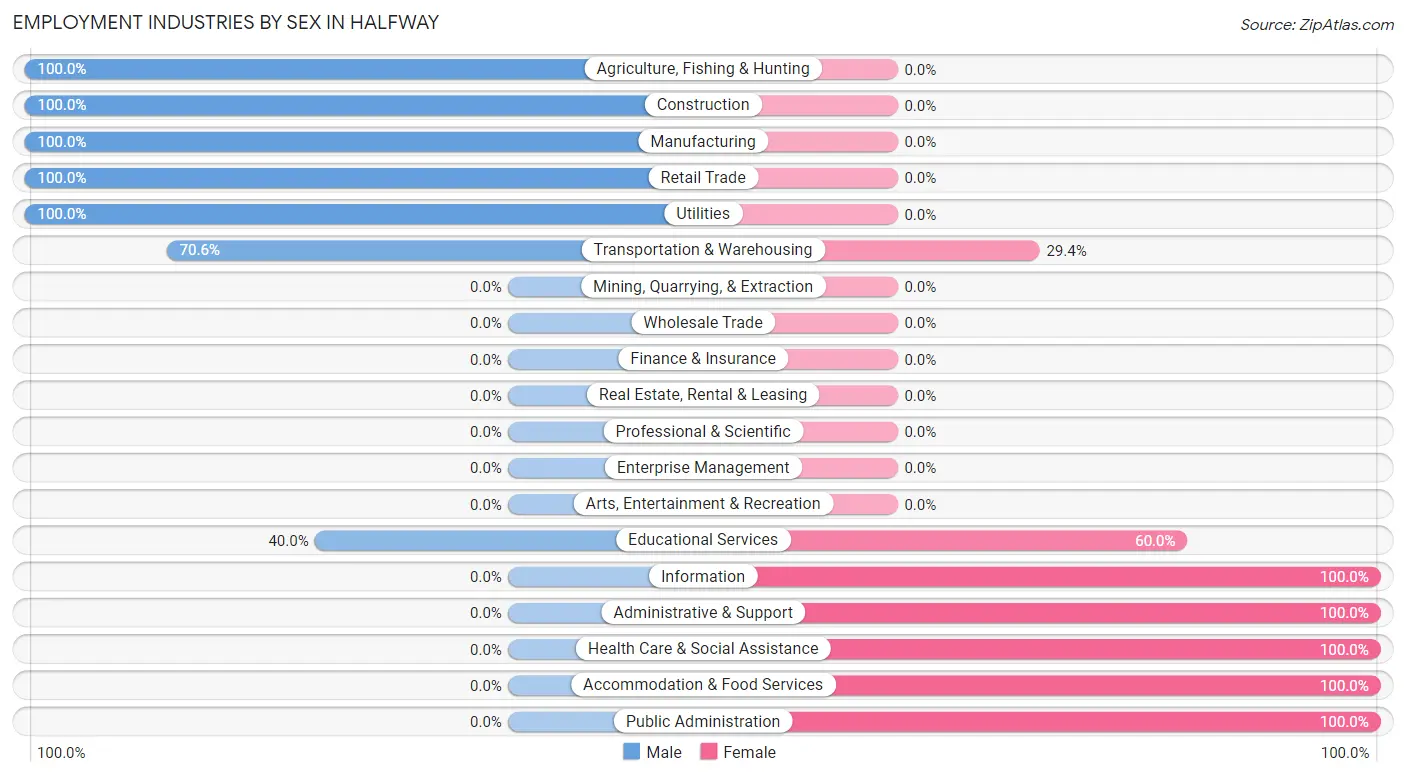
| Industry | Male | Female |
| Agriculture, Fishing & Hunting | 1 (100.0%) | 0 (0.0%) |
| Mining, Quarrying, & Extraction | 0 (0.0%) | 0 (0.0%) |
| Construction | 7 (100.0%) | 0 (0.0%) |
| Manufacturing | 13 (100.0%) | 0 (0.0%) |
| Wholesale Trade | 0 (0.0%) | 0 (0.0%) |
| Retail Trade | 8 (100.0%) | 0 (0.0%) |
| Transportation & Warehousing | 12 (70.6%) | 5 (29.4%) |
| Utilities | 4 (100.0%) | 0 (0.0%) |
| Information | 0 (0.0%) | 4 (100.0%) |
| Finance & Insurance | 0 (0.0%) | 0 (0.0%) |
| Real Estate, Rental & Leasing | 0 (0.0%) | 0 (0.0%) |
| Professional & Scientific | 0 (0.0%) | 0 (0.0%) |
| Enterprise Management | 0 (0.0%) | 0 (0.0%) |
| Administrative & Support | 0 (0.0%) | 3 (100.0%) |
| Educational Services | 10 (40.0%) | 15 (60.0%) |
| Health Care & Social Assistance | 0 (0.0%) | 14 (100.0%) |
| Arts, Entertainment & Recreation | 0 (0.0%) | 0 (0.0%) |
| Accommodation & Food Services | 0 (0.0%) | 18 (100.0%) |
| Public Administration | 0 (0.0%) | 12 (100.0%) |
| Total | 55 (43.6%) | 71 (56.4%) |
Education in Halfway
School Enrollment in Halfway
The most common levels of schooling among the 126 students in Halfway are high school (45 | 35.7%), middle school (33 | 26.2%), and elementary school (27 | 21.4%).
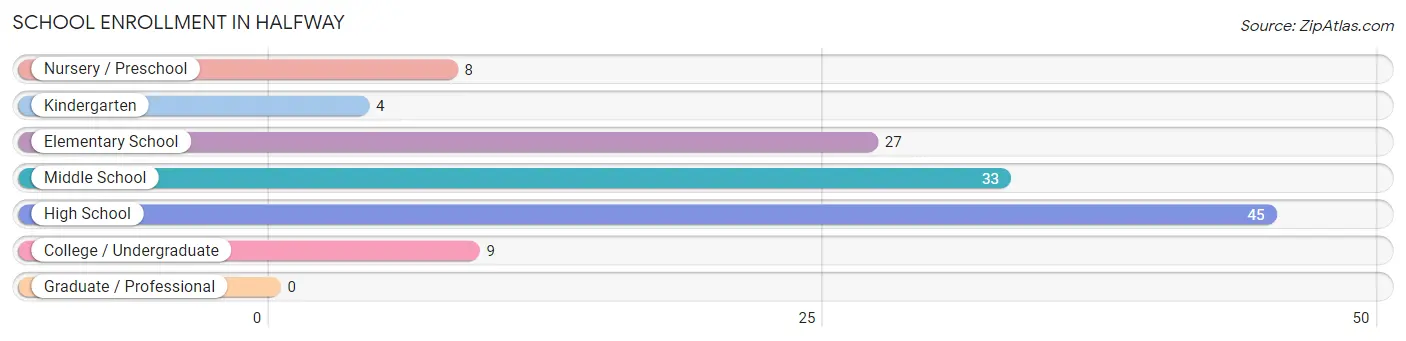
| School Level | # Students | % Students |
| Nursery / Preschool | 8 | 6.4% |
| Kindergarten | 4 | 3.2% |
| Elementary School | 27 | 21.4% |
| Middle School | 33 | 26.2% |
| High School | 45 | 35.7% |
| College / Undergraduate | 9 | 7.1% |
| Graduate / Professional | 0 | 0.0% |
| Total | 126 | 100.0% |
School Enrollment by Age by Funding Source in Halfway
Out of a total of 126 students who are enrolled in schools in Halfway, 17 (13.5%) attend a private institution, while the remaining 109 (86.5%) are enrolled in public schools. The age group of 35 years and over has the highest likelihood of being enrolled in private schools, with 9 (100.0% in the age bracket) enrolled. Conversely, the age group of 15 to 17 year olds has the lowest likelihood of being enrolled in a private school, with 43 (95.6% in the age bracket) attending a public institution.
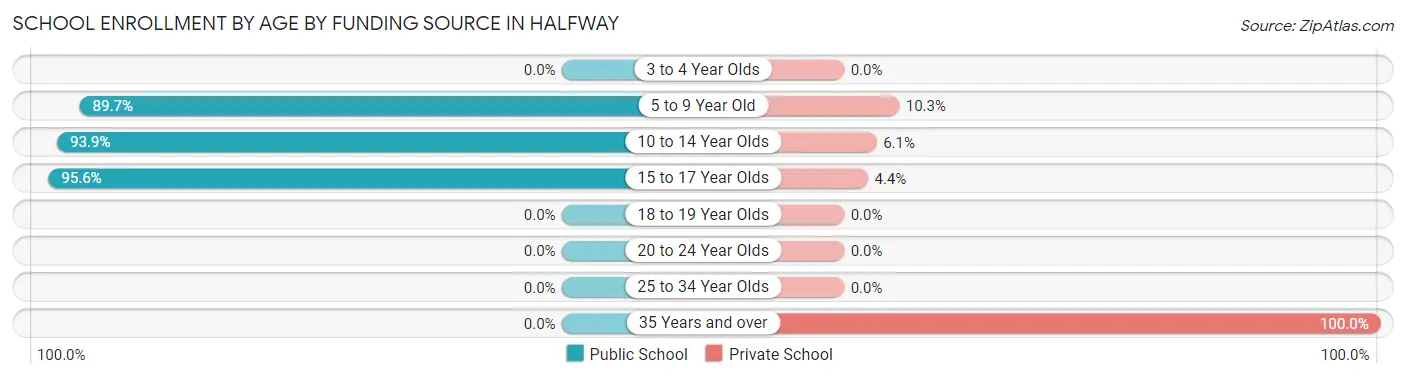
| Age Bracket | Public School | Private School |
| 3 to 4 Year Olds | 0 (0.0%) | 0 (0.0%) |
| 5 to 9 Year Old | 35 (89.7%) | 4 (10.3%) |
| 10 to 14 Year Olds | 31 (93.9%) | 2 (6.1%) |
| 15 to 17 Year Olds | 43 (95.6%) | 2 (4.4%) |
| 18 to 19 Year Olds | 0 (0.0%) | 0 (0.0%) |
| 20 to 24 Year Olds | 0 (0.0%) | 0 (0.0%) |
| 25 to 34 Year Olds | 0 (0.0%) | 0 (0.0%) |
| 35 Years and over | 0 (0.0%) | 9 (100.0%) |
| Total | 109 (86.5%) | 17 (13.5%) |
Educational Attainment by Field of Study in Halfway
Education (11 | 28.2%), bio, nature & agricultural (10 | 25.6%), business (9 | 23.1%), psychology (7 | 17.9%), and science & technology (2 | 5.1%) are the most common fields of study among 39 individuals in Halfway who have obtained a bachelor's degree or higher.
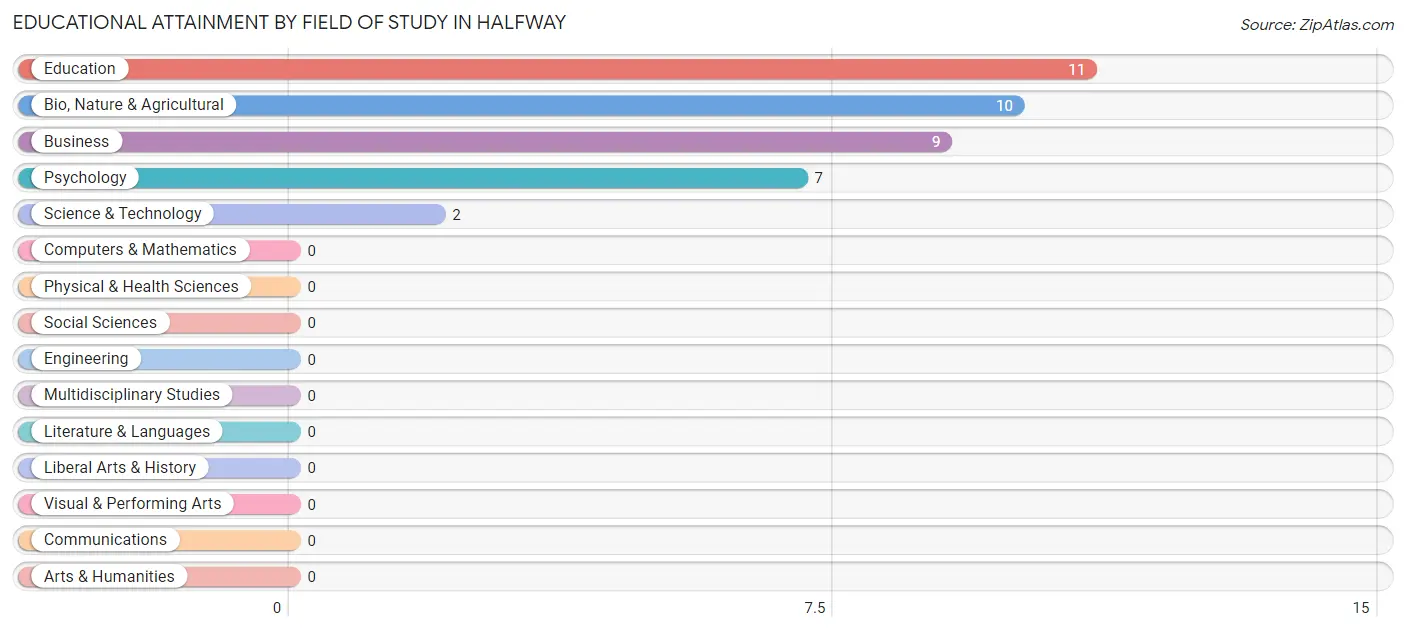
| Field of Study | # Graduates | % Graduates |
| Computers & Mathematics | 0 | 0.0% |
| Bio, Nature & Agricultural | 10 | 25.6% |
| Physical & Health Sciences | 0 | 0.0% |
| Psychology | 7 | 17.9% |
| Social Sciences | 0 | 0.0% |
| Engineering | 0 | 0.0% |
| Multidisciplinary Studies | 0 | 0.0% |
| Science & Technology | 2 | 5.1% |
| Business | 9 | 23.1% |
| Education | 11 | 28.2% |
| Literature & Languages | 0 | 0.0% |
| Liberal Arts & History | 0 | 0.0% |
| Visual & Performing Arts | 0 | 0.0% |
| Communications | 0 | 0.0% |
| Arts & Humanities | 0 | 0.0% |
| Total | 39 | 100.0% |
Transportation & Commute in Halfway
Vehicle Availability by Sex in Halfway
The most prevalent vehicle ownership categories in Halfway are males with 3 vehicles (20, accounting for 36.4%) and females with 3 vehicles (31, making up 28.2%).
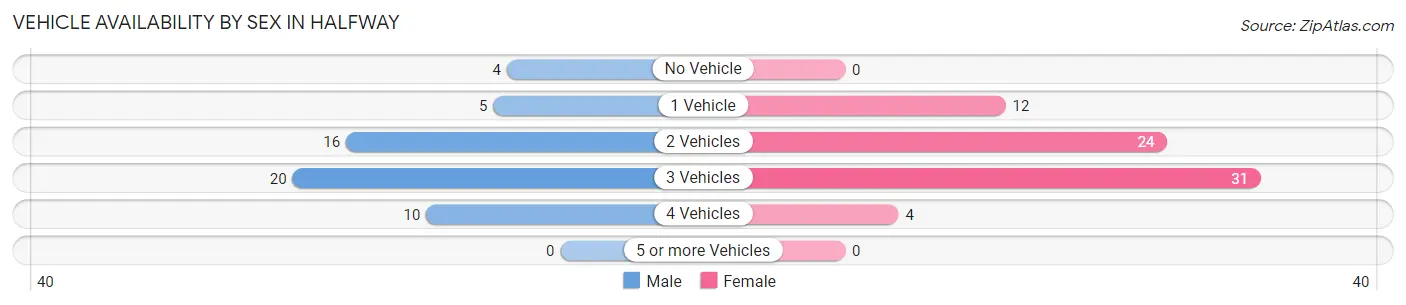
| Vehicles Available | Male | Female |
| No Vehicle | 4 (7.3%) | 0 (0.0%) |
| 1 Vehicle | 5 (9.1%) | 12 (16.9%) |
| 2 Vehicles | 16 (29.1%) | 24 (33.8%) |
| 3 Vehicles | 20 (36.4%) | 31 (43.7%) |
| 4 Vehicles | 10 (18.2%) | 4 (5.6%) |
| 5 or more Vehicles | 0 (0.0%) | 0 (0.0%) |
| Total | 55 (100.0%) | 71 (100.0%) |
Commute Time in Halfway
The most frequently occuring commute durations in Halfway are 5 to 9 minutes (49 commuters, 38.9%), less than 5 minutes (20 commuters, 15.9%), and 25 to 29 minutes (18 commuters, 14.3%).
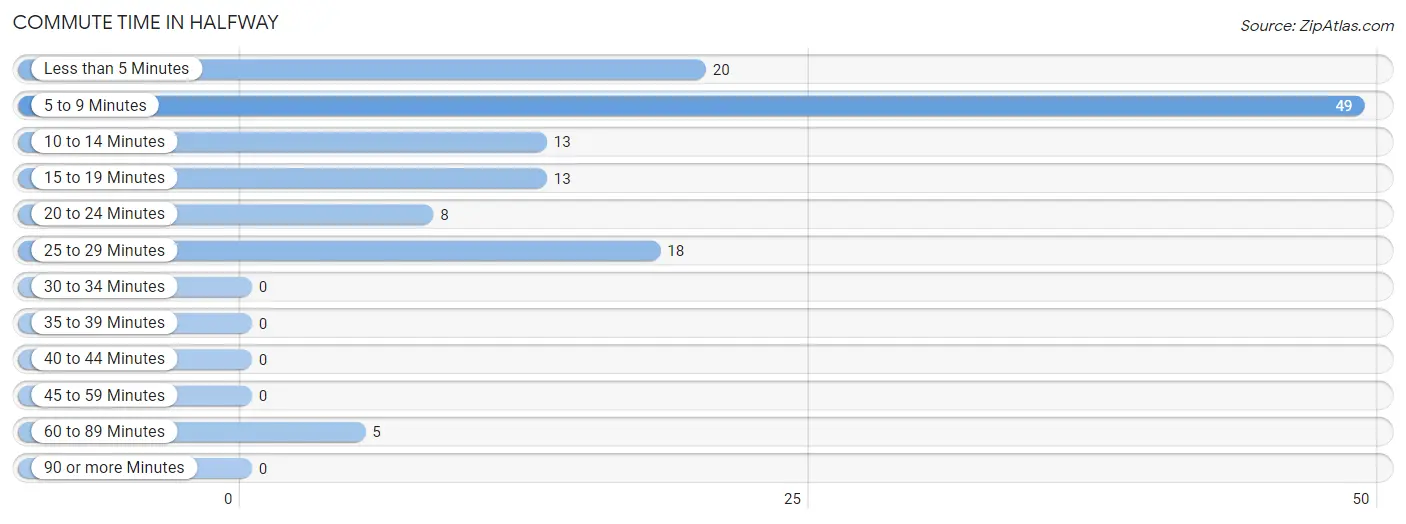
| Commute Time | # Commuters | % Commuters |
| Less than 5 Minutes | 20 | 15.9% |
| 5 to 9 Minutes | 49 | 38.9% |
| 10 to 14 Minutes | 13 | 10.3% |
| 15 to 19 Minutes | 13 | 10.3% |
| 20 to 24 Minutes | 8 | 6.4% |
| 25 to 29 Minutes | 18 | 14.3% |
| 30 to 34 Minutes | 0 | 0.0% |
| 35 to 39 Minutes | 0 | 0.0% |
| 40 to 44 Minutes | 0 | 0.0% |
| 45 to 59 Minutes | 0 | 0.0% |
| 60 to 89 Minutes | 5 | 4.0% |
| 90 or more Minutes | 0 | 0.0% |
Commute Time by Sex in Halfway
The most common commute times in Halfway are less than 5 minutes (15 commuters, 27.3%) for males and 5 to 9 minutes (39 commuters, 54.9%) for females.
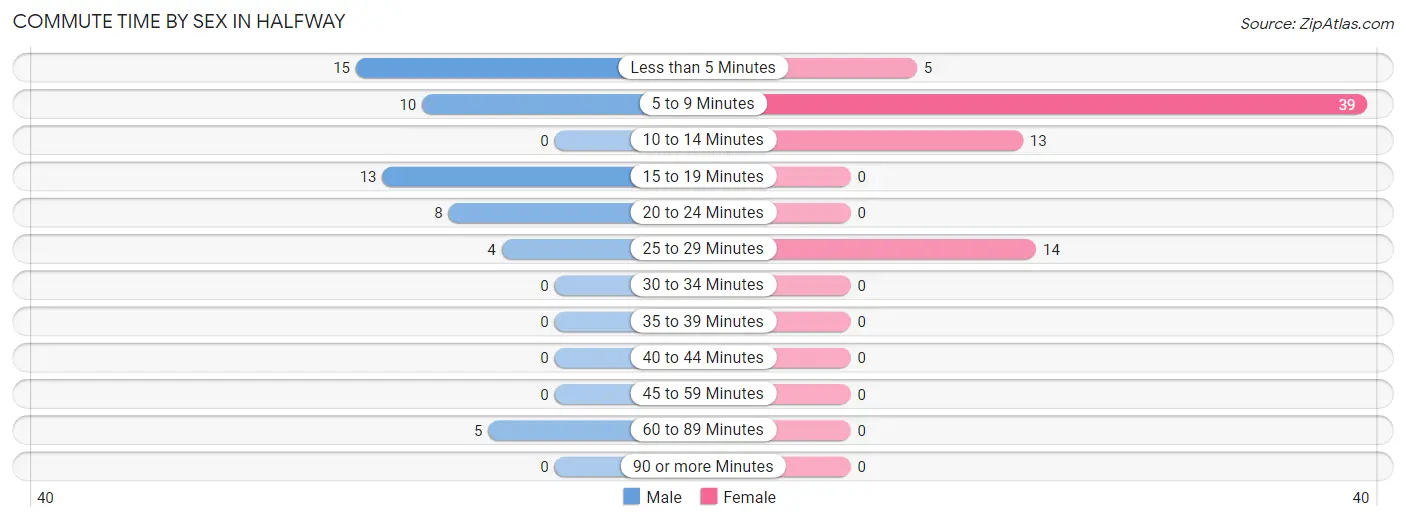
| Commute Time | Male | Female |
| Less than 5 Minutes | 15 (27.3%) | 5 (7.0%) |
| 5 to 9 Minutes | 10 (18.2%) | 39 (54.9%) |
| 10 to 14 Minutes | 0 (0.0%) | 13 (18.3%) |
| 15 to 19 Minutes | 13 (23.6%) | 0 (0.0%) |
| 20 to 24 Minutes | 8 (14.5%) | 0 (0.0%) |
| 25 to 29 Minutes | 4 (7.3%) | 14 (19.7%) |
| 30 to 34 Minutes | 0 (0.0%) | 0 (0.0%) |
| 35 to 39 Minutes | 0 (0.0%) | 0 (0.0%) |
| 40 to 44 Minutes | 0 (0.0%) | 0 (0.0%) |
| 45 to 59 Minutes | 0 (0.0%) | 0 (0.0%) |
| 60 to 89 Minutes | 5 (9.1%) | 0 (0.0%) |
| 90 or more Minutes | 0 (0.0%) | 0 (0.0%) |
Time of Departure to Work by Sex in Halfway
The most frequent times of departure to work in Halfway are 5:30 AM to 5:59 AM (23, 41.8%) for males and 7:30 AM to 7:59 AM (24, 33.8%) for females.
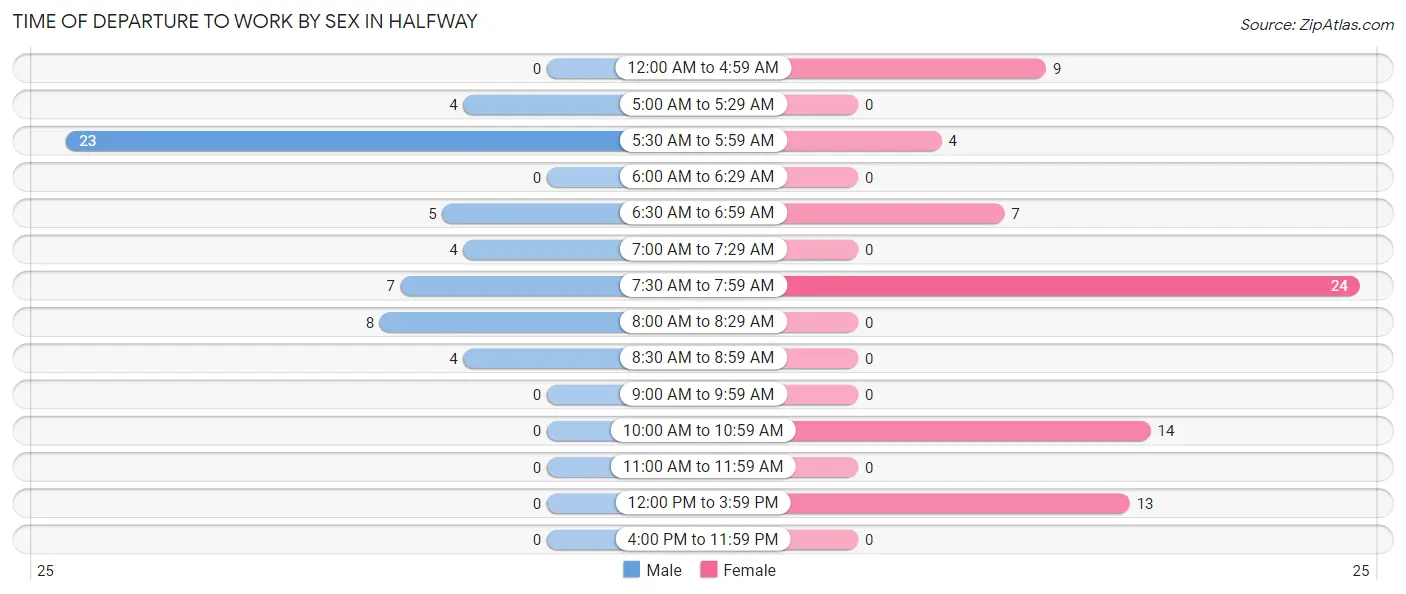
| Time of Departure | Male | Female |
| 12:00 AM to 4:59 AM | 0 (0.0%) | 9 (12.7%) |
| 5:00 AM to 5:29 AM | 4 (7.3%) | 0 (0.0%) |
| 5:30 AM to 5:59 AM | 23 (41.8%) | 4 (5.6%) |
| 6:00 AM to 6:29 AM | 0 (0.0%) | 0 (0.0%) |
| 6:30 AM to 6:59 AM | 5 (9.1%) | 7 (9.9%) |
| 7:00 AM to 7:29 AM | 4 (7.3%) | 0 (0.0%) |
| 7:30 AM to 7:59 AM | 7 (12.7%) | 24 (33.8%) |
| 8:00 AM to 8:29 AM | 8 (14.5%) | 0 (0.0%) |
| 8:30 AM to 8:59 AM | 4 (7.3%) | 0 (0.0%) |
| 9:00 AM to 9:59 AM | 0 (0.0%) | 0 (0.0%) |
| 10:00 AM to 10:59 AM | 0 (0.0%) | 14 (19.7%) |
| 11:00 AM to 11:59 AM | 0 (0.0%) | 0 (0.0%) |
| 12:00 PM to 3:59 PM | 0 (0.0%) | 13 (18.3%) |
| 4:00 PM to 11:59 PM | 0 (0.0%) | 0 (0.0%) |
| Total | 55 (100.0%) | 71 (100.0%) |
Housing Occupancy in Halfway
Occupancy by Ownership in Halfway
Of the total 141 dwellings in Halfway, owner-occupied units account for 82 (58.2%), while renter-occupied units make up 59 (41.8%).
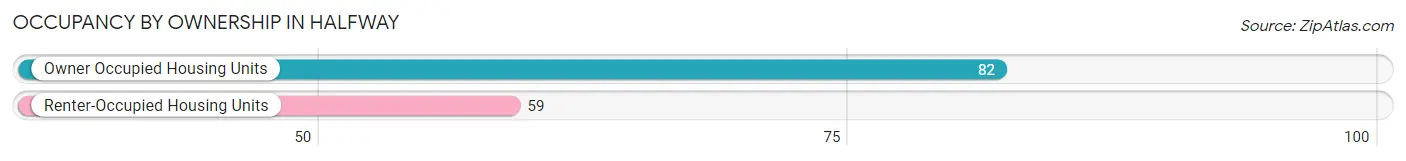
| Occupancy | # Housing Units | % Housing Units |
| Owner Occupied Housing Units | 82 | 58.2% |
| Renter-Occupied Housing Units | 59 | 41.8% |
| Total Occupied Housing Units | 141 | 100.0% |
Occupancy by Household Size in Halfway
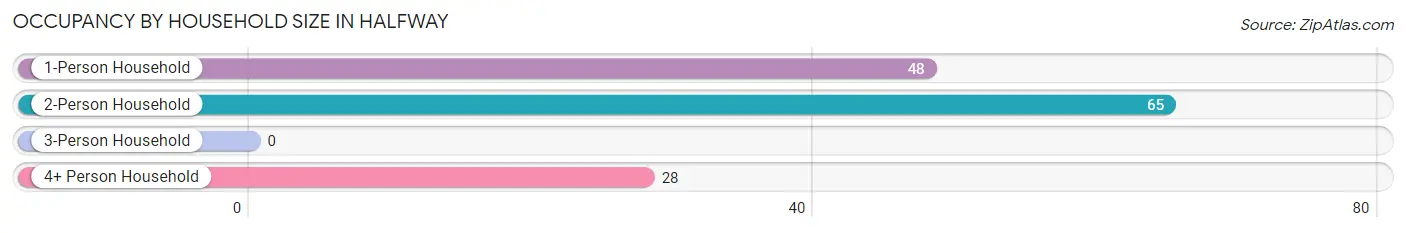
| Household Size | # Housing Units | % Housing Units |
| 1-Person Household | 48 | 34.0% |
| 2-Person Household | 65 | 46.1% |
| 3-Person Household | 0 | 0.0% |
| 4+ Person Household | 28 | 19.9% |
| Total Housing Units | 141 | 100.0% |
Occupancy by Ownership by Household Size in Halfway
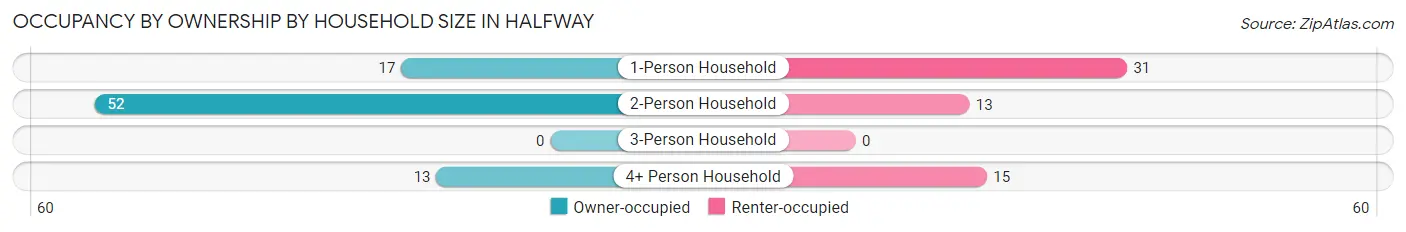
| Household Size | Owner-occupied | Renter-occupied |
| 1-Person Household | 17 (35.4%) | 31 (64.6%) |
| 2-Person Household | 52 (80.0%) | 13 (20.0%) |
| 3-Person Household | 0 (0.0%) | 0 (0.0%) |
| 4+ Person Household | 13 (46.4%) | 15 (53.6%) |
| Total Housing Units | 82 (58.2%) | 59 (41.8%) |
Occupancy by Educational Attainment in Halfway
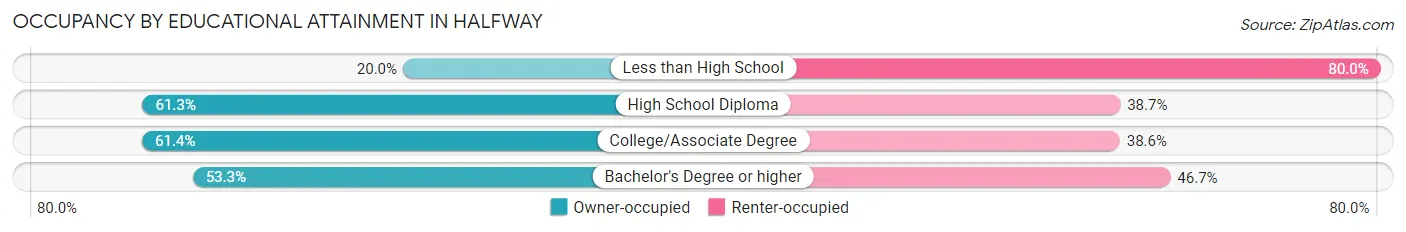
| Household Size | Owner-occupied | Renter-occupied |
| Less than High School | 1 (20.0%) | 4 (80.0%) |
| High School Diploma | 38 (61.3%) | 24 (38.7%) |
| College/Associate Degree | 27 (61.4%) | 17 (38.6%) |
| Bachelor's Degree or higher | 16 (53.3%) | 14 (46.7%) |
Occupancy by Age of Householder in Halfway
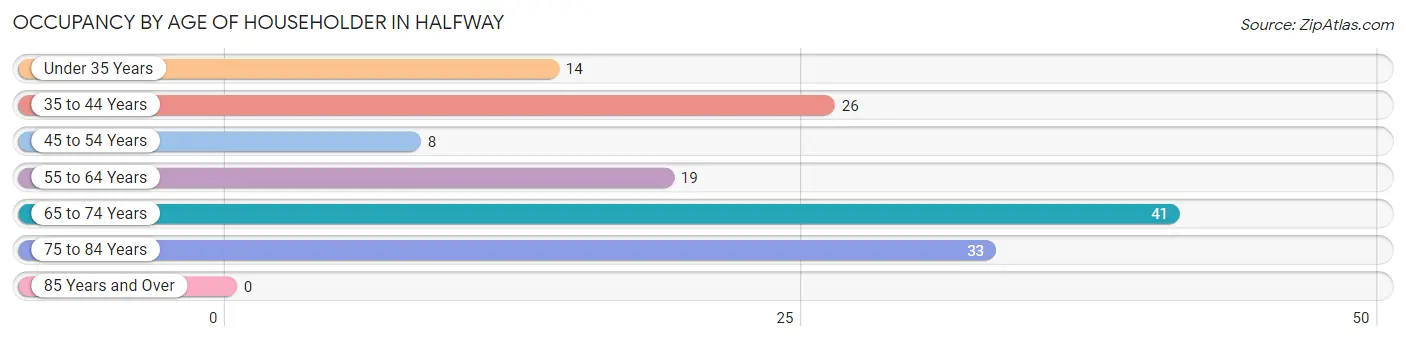
| Age Bracket | # Households | % Households |
| Under 35 Years | 14 | 9.9% |
| 35 to 44 Years | 26 | 18.4% |
| 45 to 54 Years | 8 | 5.7% |
| 55 to 64 Years | 19 | 13.5% |
| 65 to 74 Years | 41 | 29.1% |
| 75 to 84 Years | 33 | 23.4% |
| 85 Years and Over | 0 | 0.0% |
| Total | 141 | 100.0% |
Housing Finances in Halfway
Median Income by Occupancy in Halfway
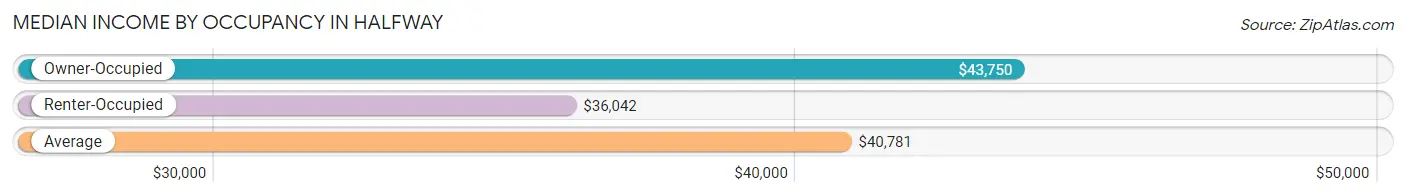
| Occupancy Type | # Households | Median Income |
| Owner-Occupied | 82 (58.2%) | $43,750 |
| Renter-Occupied | 59 (41.8%) | $36,042 |
| Average | 141 (100.0%) | $40,781 |
Occupancy by Householder Income Bracket in Halfway
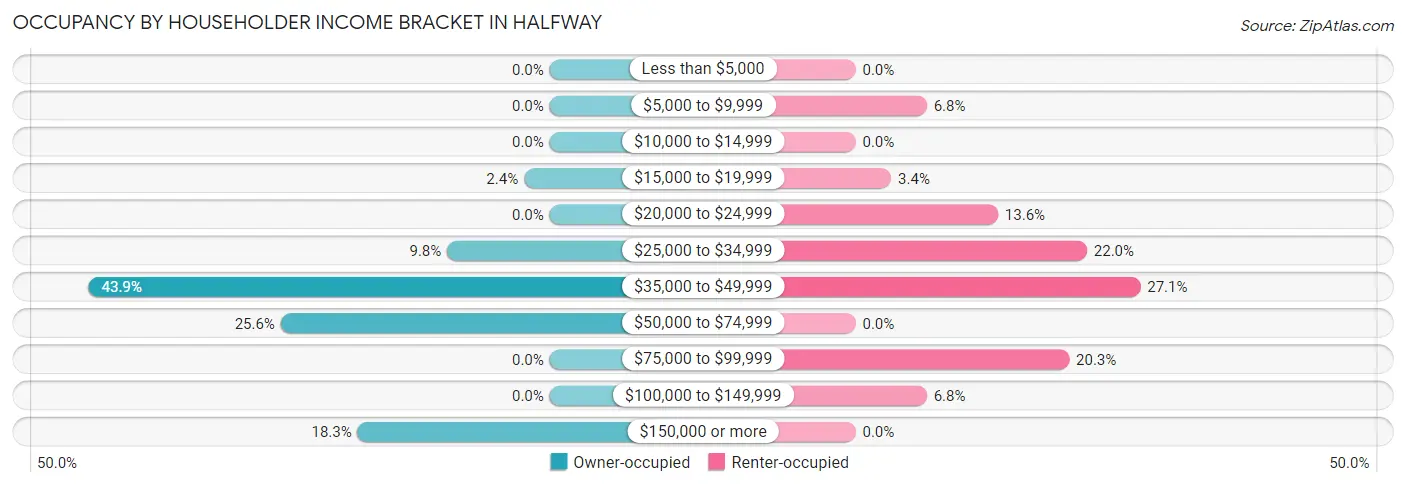
| Income Bracket | Owner-occupied | Renter-occupied |
| Less than $5,000 | 0 (0.0%) | 0 (0.0%) |
| $5,000 to $9,999 | 0 (0.0%) | 4 (6.8%) |
| $10,000 to $14,999 | 0 (0.0%) | 0 (0.0%) |
| $15,000 to $19,999 | 2 (2.4%) | 2 (3.4%) |
| $20,000 to $24,999 | 0 (0.0%) | 8 (13.6%) |
| $25,000 to $34,999 | 8 (9.8%) | 13 (22.0%) |
| $35,000 to $49,999 | 36 (43.9%) | 16 (27.1%) |
| $50,000 to $74,999 | 21 (25.6%) | 0 (0.0%) |
| $75,000 to $99,999 | 0 (0.0%) | 12 (20.3%) |
| $100,000 to $149,999 | 0 (0.0%) | 4 (6.8%) |
| $150,000 or more | 15 (18.3%) | 0 (0.0%) |
| Total | 82 (100.0%) | 59 (100.0%) |
Monthly Housing Cost Tiers in Halfway
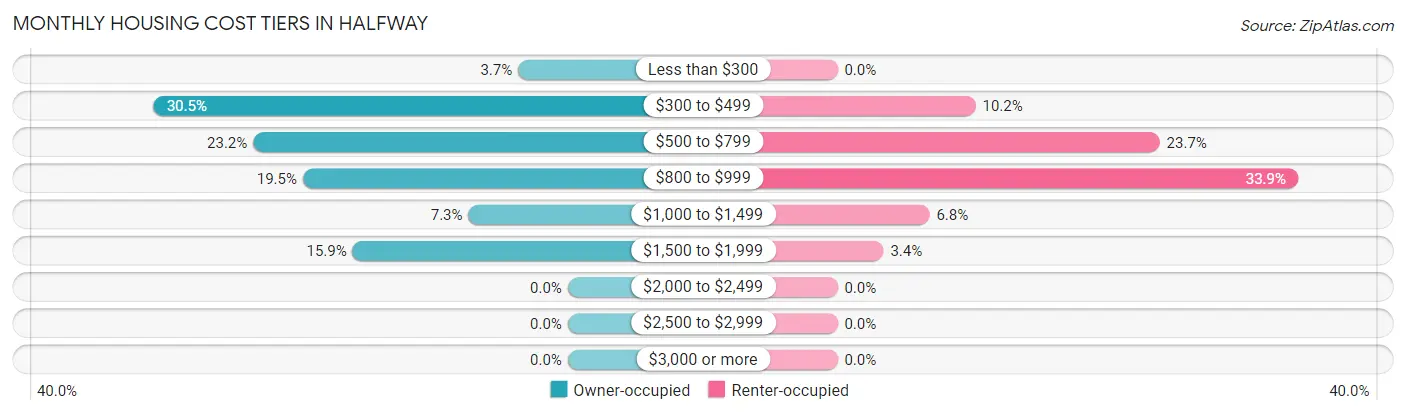
| Monthly Cost | Owner-occupied | Renter-occupied |
| Less than $300 | 3 (3.7%) | 0 (0.0%) |
| $300 to $499 | 25 (30.5%) | 6 (10.2%) |
| $500 to $799 | 19 (23.2%) | 14 (23.7%) |
| $800 to $999 | 16 (19.5%) | 20 (33.9%) |
| $1,000 to $1,499 | 6 (7.3%) | 4 (6.8%) |
| $1,500 to $1,999 | 13 (15.9%) | 2 (3.4%) |
| $2,000 to $2,499 | 0 (0.0%) | 0 (0.0%) |
| $2,500 to $2,999 | 0 (0.0%) | 0 (0.0%) |
| $3,000 or more | 0 (0.0%) | 0 (0.0%) |
| Total | 82 (100.0%) | 59 (100.0%) |
Physical Housing Characteristics in Halfway
Housing Structures in Halfway
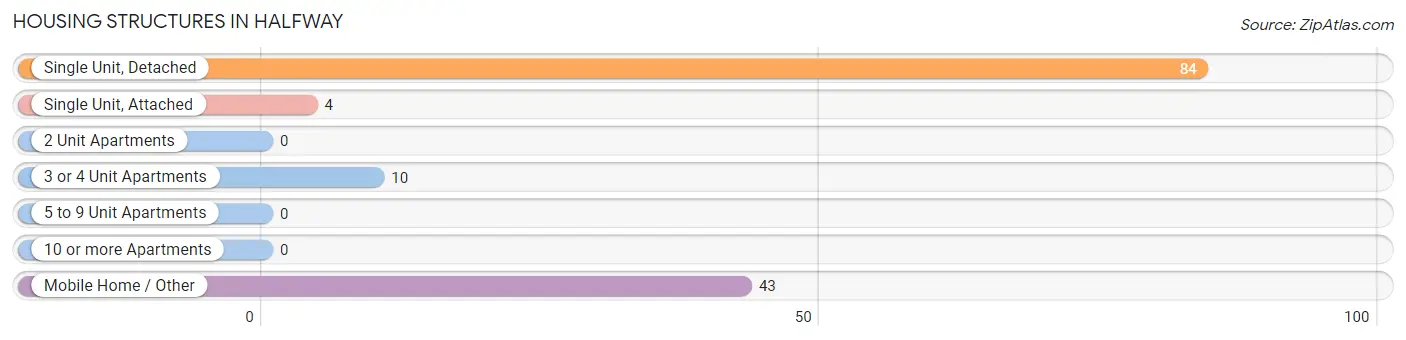
| Structure Type | # Housing Units | % Housing Units |
| Single Unit, Detached | 84 | 59.6% |
| Single Unit, Attached | 4 | 2.8% |
| 2 Unit Apartments | 0 | 0.0% |
| 3 or 4 Unit Apartments | 10 | 7.1% |
| 5 to 9 Unit Apartments | 0 | 0.0% |
| 10 or more Apartments | 0 | 0.0% |
| Mobile Home / Other | 43 | 30.5% |
| Total | 141 | 100.0% |
Housing Structures by Occupancy in Halfway
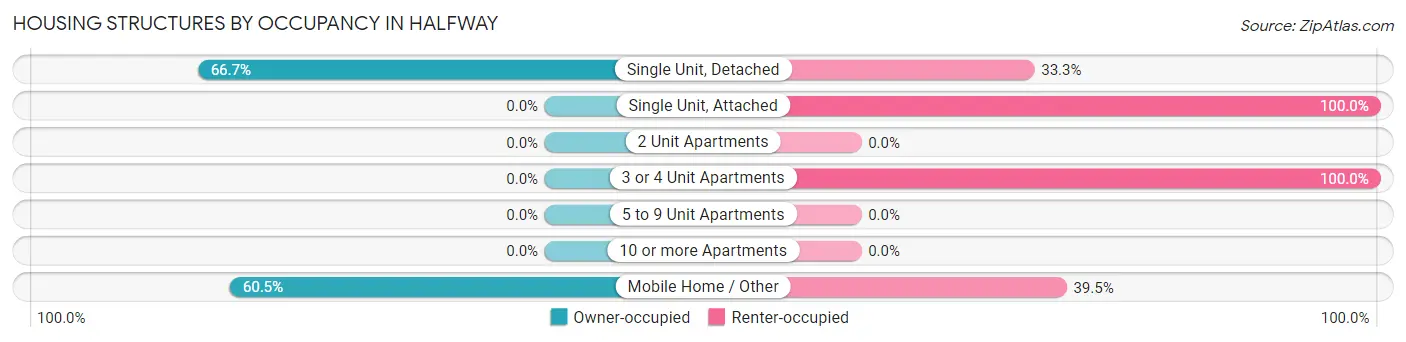
| Structure Type | Owner-occupied | Renter-occupied |
| Single Unit, Detached | 56 (66.7%) | 28 (33.3%) |
| Single Unit, Attached | 0 (0.0%) | 4 (100.0%) |
| 2 Unit Apartments | 0 (0.0%) | 0 (0.0%) |
| 3 or 4 Unit Apartments | 0 (0.0%) | 10 (100.0%) |
| 5 to 9 Unit Apartments | 0 (0.0%) | 0 (0.0%) |
| 10 or more Apartments | 0 (0.0%) | 0 (0.0%) |
| Mobile Home / Other | 26 (60.5%) | 17 (39.5%) |
| Total | 82 (58.2%) | 59 (41.8%) |
Housing Structures by Number of Rooms in Halfway
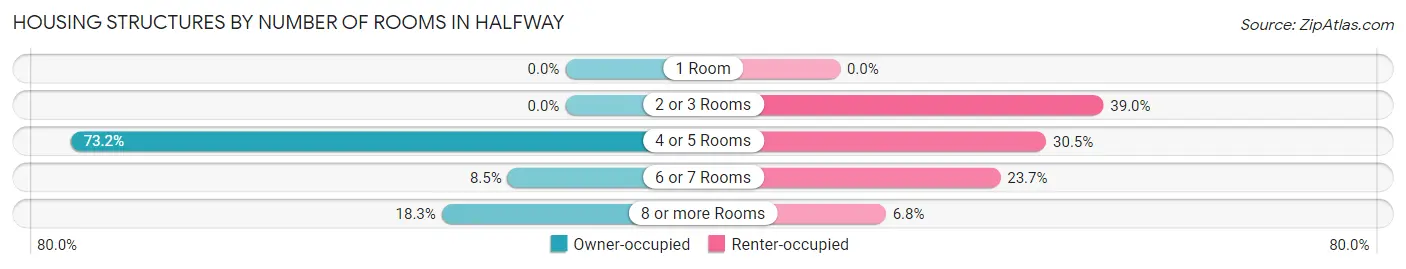
| Number of Rooms | Owner-occupied | Renter-occupied |
| 1 Room | 0 (0.0%) | 0 (0.0%) |
| 2 or 3 Rooms | 0 (0.0%) | 23 (39.0%) |
| 4 or 5 Rooms | 60 (73.2%) | 18 (30.5%) |
| 6 or 7 Rooms | 7 (8.5%) | 14 (23.7%) |
| 8 or more Rooms | 15 (18.3%) | 4 (6.8%) |
| Total | 82 (100.0%) | 59 (100.0%) |
Housing Structure by Heating Type in Halfway
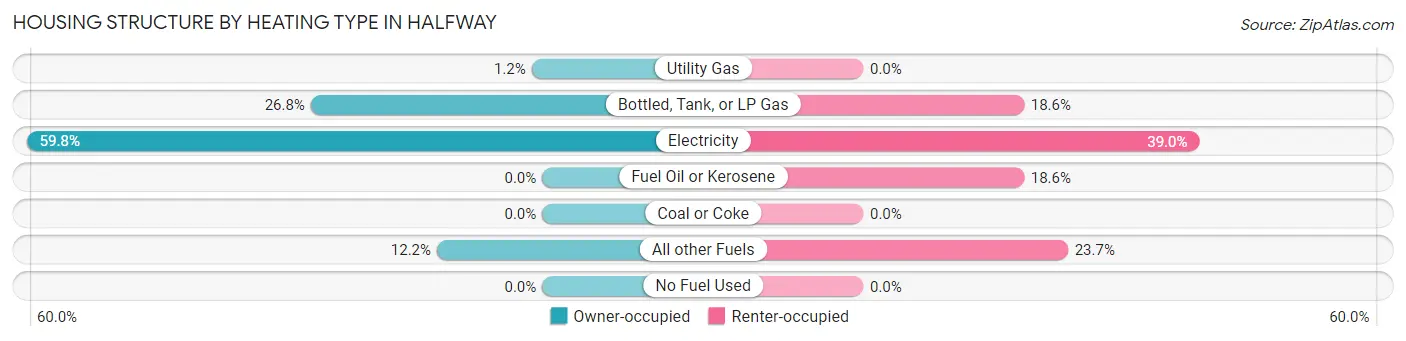
| Heating Type | Owner-occupied | Renter-occupied |
| Utility Gas | 1 (1.2%) | 0 (0.0%) |
| Bottled, Tank, or LP Gas | 22 (26.8%) | 11 (18.6%) |
| Electricity | 49 (59.8%) | 23 (39.0%) |
| Fuel Oil or Kerosene | 0 (0.0%) | 11 (18.6%) |
| Coal or Coke | 0 (0.0%) | 0 (0.0%) |
| All other Fuels | 10 (12.2%) | 14 (23.7%) |
| No Fuel Used | 0 (0.0%) | 0 (0.0%) |
| Total | 82 (100.0%) | 59 (100.0%) |
Household Vehicle Usage in Halfway
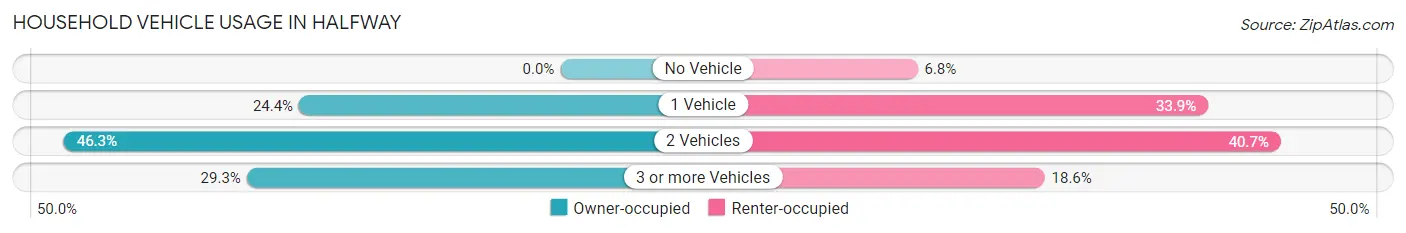
| Vehicles per Household | Owner-occupied | Renter-occupied |
| No Vehicle | 0 (0.0%) | 4 (6.8%) |
| 1 Vehicle | 20 (24.4%) | 20 (33.9%) |
| 2 Vehicles | 38 (46.3%) | 24 (40.7%) |
| 3 or more Vehicles | 24 (29.3%) | 11 (18.6%) |
| Total | 82 (100.0%) | 59 (100.0%) |
Real Estate & Mortgages in Halfway
Real Estate and Mortgage Overview in Halfway
| Characteristic | Without Mortgage | With Mortgage |
| Housing Units | 44 | 38 |
| Median Property Value | $213,600 | $361,500 |
| Median Household Income | $42,083 | $15 |
| Monthly Housing Costs | $482 | $0 |
| Real Estate Taxes | $1,289 | $0 |
Property Value by Mortgage Status in Halfway
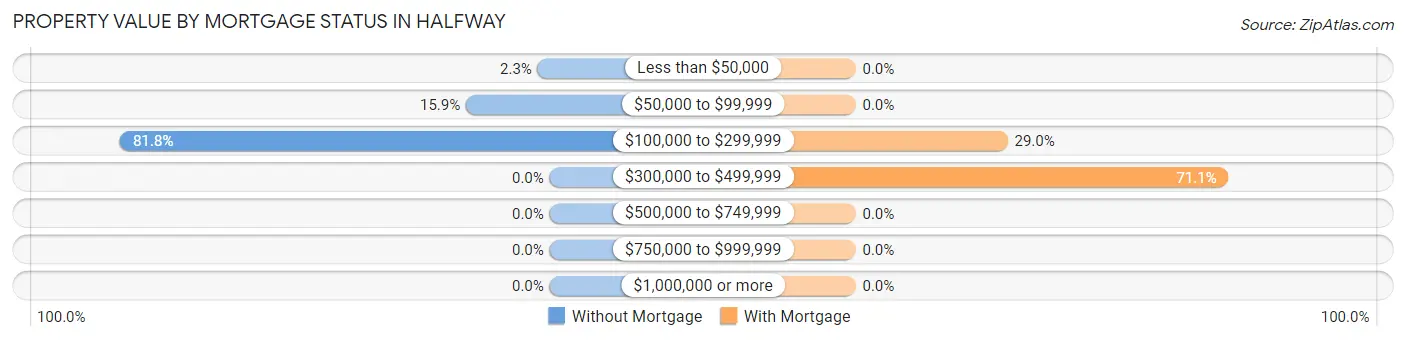
| Property Value | Without Mortgage | With Mortgage |
| Less than $50,000 | 1 (2.3%) | 0 (0.0%) |
| $50,000 to $99,999 | 7 (15.9%) | 0 (0.0%) |
| $100,000 to $299,999 | 36 (81.8%) | 11 (28.9%) |
| $300,000 to $499,999 | 0 (0.0%) | 27 (71.1%) |
| $500,000 to $749,999 | 0 (0.0%) | 0 (0.0%) |
| $750,000 to $999,999 | 0 (0.0%) | 0 (0.0%) |
| $1,000,000 or more | 0 (0.0%) | 0 (0.0%) |
| Total | 44 (100.0%) | 38 (100.0%) |
Household Income by Mortgage Status in Halfway
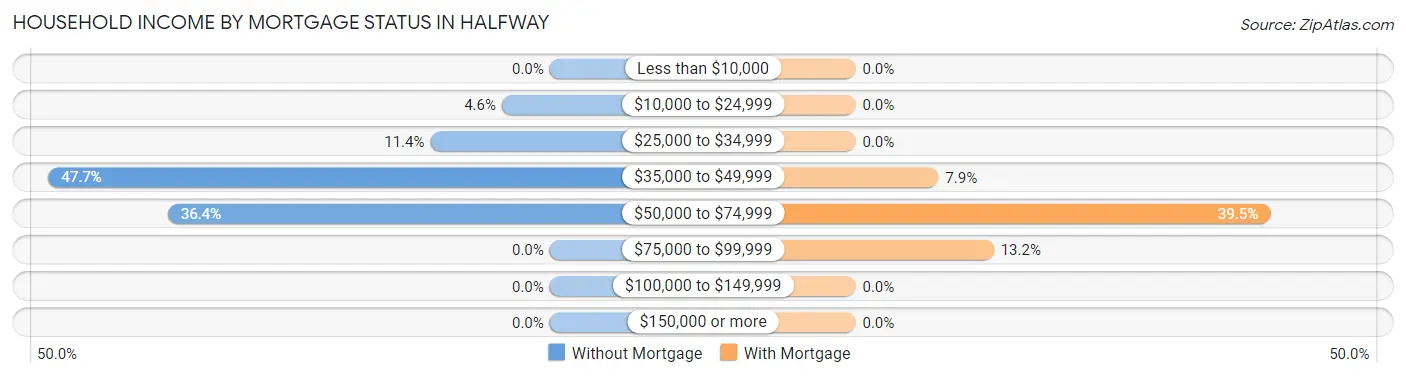
| Household Income | Without Mortgage | With Mortgage |
| Less than $10,000 | 0 (0.0%) | 0 (0.0%) |
| $10,000 to $24,999 | 2 (4.5%) | 0 (0.0%) |
| $25,000 to $34,999 | 5 (11.4%) | 0 (0.0%) |
| $35,000 to $49,999 | 21 (47.7%) | 3 (7.9%) |
| $50,000 to $74,999 | 16 (36.4%) | 15 (39.5%) |
| $75,000 to $99,999 | 0 (0.0%) | 5 (13.2%) |
| $100,000 to $149,999 | 0 (0.0%) | 0 (0.0%) |
| $150,000 or more | 0 (0.0%) | 0 (0.0%) |
| Total | 44 (100.0%) | 38 (100.0%) |
Property Value to Household Income Ratio in Halfway
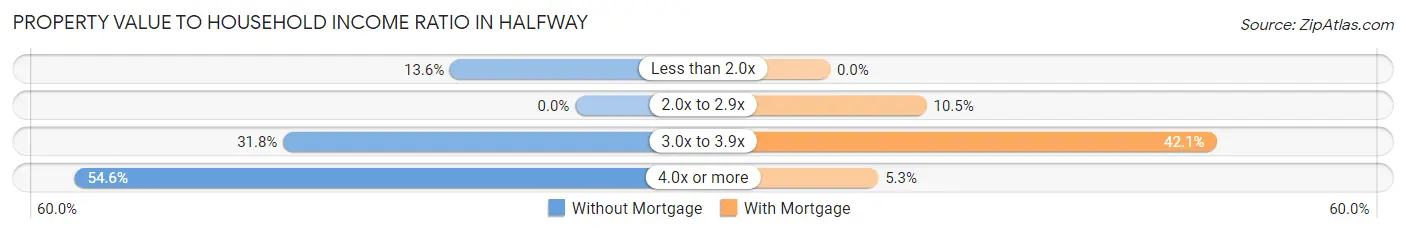
| Value-to-Income Ratio | Without Mortgage | With Mortgage |
| Less than 2.0x | 6 (13.6%) | 0 (0.0%) |
| 2.0x to 2.9x | 0 (0.0%) | 4 (10.5%) |
| 3.0x to 3.9x | 14 (31.8%) | 16 (42.1%) |
| 4.0x or more | 24 (54.5%) | 2 (5.3%) |
| Total | 44 (100.0%) | 38 (100.0%) |
Real Estate Taxes by Mortgage Status in Halfway
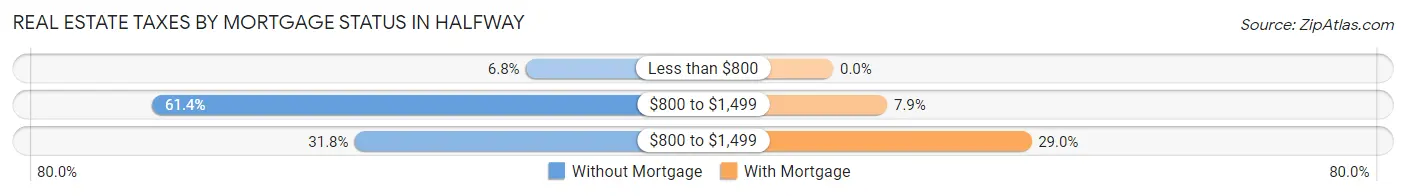
| Property Taxes | Without Mortgage | With Mortgage |
| Less than $800 | 3 (6.8%) | 0 (0.0%) |
| $800 to $1,499 | 27 (61.4%) | 3 (7.9%) |
| $800 to $1,499 | 14 (31.8%) | 11 (28.9%) |
| Total | 44 (100.0%) | 38 (100.0%) |
Health & Disability in Halfway
Health Insurance Coverage by Age in Halfway
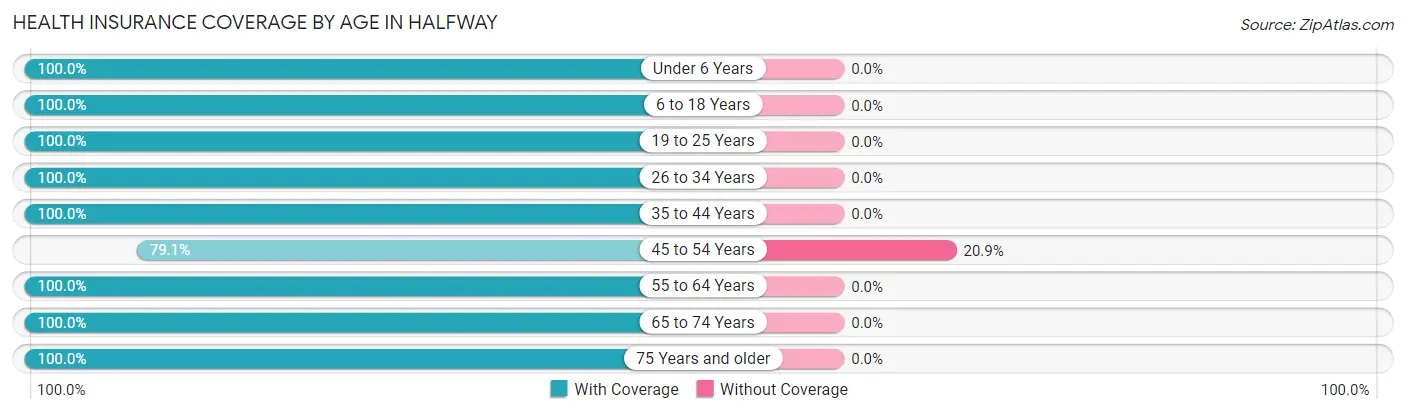
| Age Bracket | With Coverage | Without Coverage |
| Under 6 Years | 9 (100.0%) | 0 (0.0%) |
| 6 to 18 Years | 109 (100.0%) | 0 (0.0%) |
| 19 to 25 Years | 6 (100.0%) | 0 (0.0%) |
| 26 to 34 Years | 19 (100.0%) | 0 (0.0%) |
| 35 to 44 Years | 39 (100.0%) | 0 (0.0%) |
| 45 to 54 Years | 34 (79.1%) | 9 (20.9%) |
| 55 to 64 Years | 98 (100.0%) | 0 (0.0%) |
| 65 to 74 Years | 48 (100.0%) | 0 (0.0%) |
| 75 Years and older | 44 (100.0%) | 0 (0.0%) |
| Total | 406 (97.8%) | 9 (2.2%) |
Health Insurance Coverage by Citizenship Status in Halfway
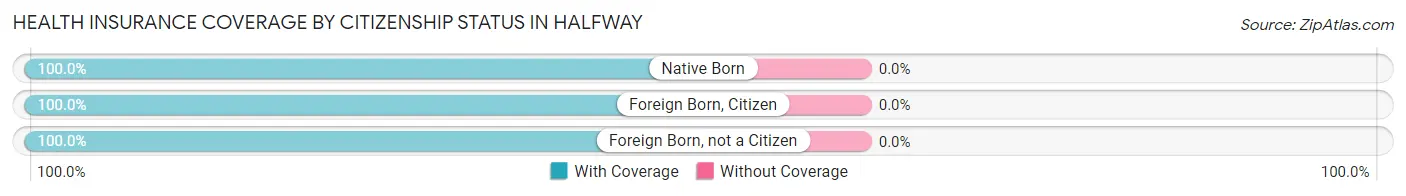
| Citizenship Status | With Coverage | Without Coverage |
| Native Born | 9 (100.0%) | 0 (0.0%) |
| Foreign Born, Citizen | 109 (100.0%) | 0 (0.0%) |
| Foreign Born, not a Citizen | 6 (100.0%) | 0 (0.0%) |
Health Insurance Coverage by Household Income in Halfway
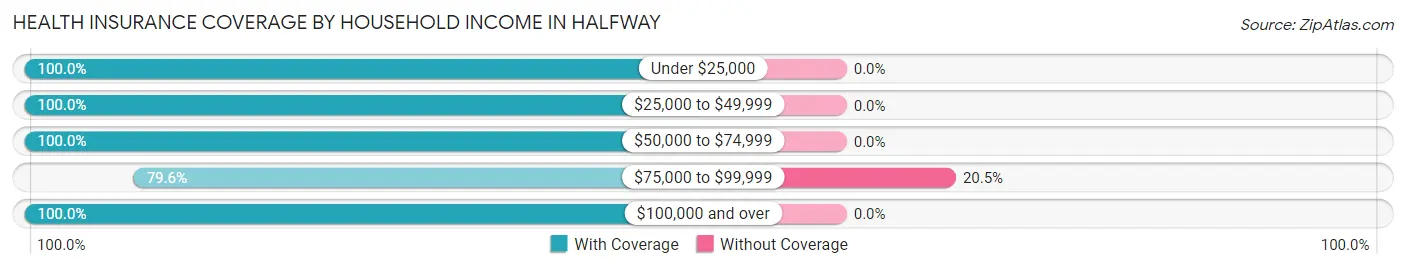
| Household Income | With Coverage | Without Coverage |
| Under $25,000 | 26 (100.0%) | 0 (0.0%) |
| $25,000 to $49,999 | 196 (100.0%) | 0 (0.0%) |
| $50,000 to $74,999 | 39 (100.0%) | 0 (0.0%) |
| $75,000 to $99,999 | 35 (79.5%) | 9 (20.4%) |
| $100,000 and over | 110 (100.0%) | 0 (0.0%) |
Public vs Private Health Insurance Coverage by Age in Halfway
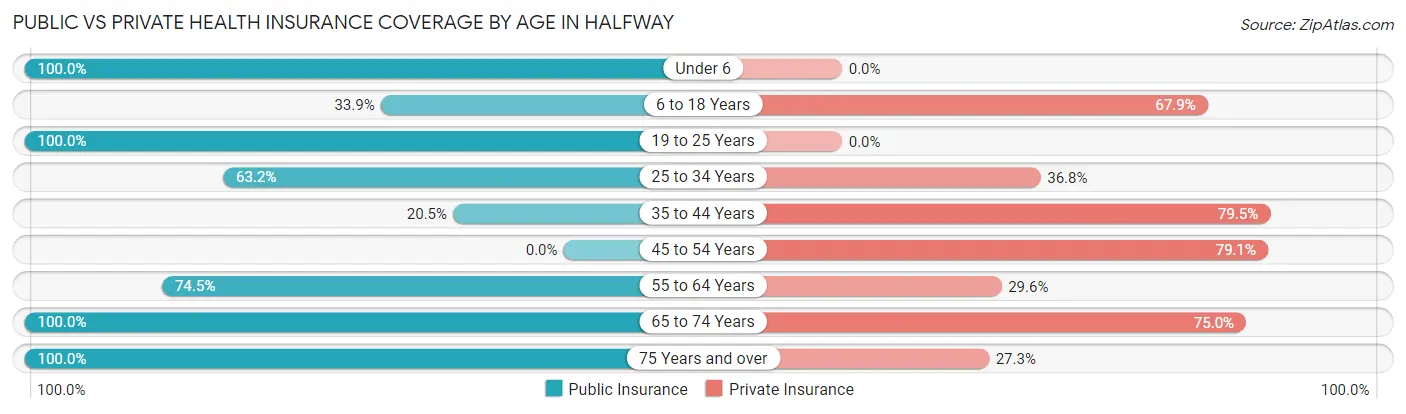
| Age Bracket | Public Insurance | Private Insurance |
| Under 6 | 9 (100.0%) | 0 (0.0%) |
| 6 to 18 Years | 37 (33.9%) | 74 (67.9%) |
| 19 to 25 Years | 6 (100.0%) | 0 (0.0%) |
| 25 to 34 Years | 12 (63.2%) | 7 (36.8%) |
| 35 to 44 Years | 8 (20.5%) | 31 (79.5%) |
| 45 to 54 Years | 0 (0.0%) | 34 (79.1%) |
| 55 to 64 Years | 73 (74.5%) | 29 (29.6%) |
| 65 to 74 Years | 48 (100.0%) | 36 (75.0%) |
| 75 Years and over | 44 (100.0%) | 12 (27.3%) |
| Total | 237 (57.1%) | 223 (53.7%) |
Disability Status by Sex by Age in Halfway
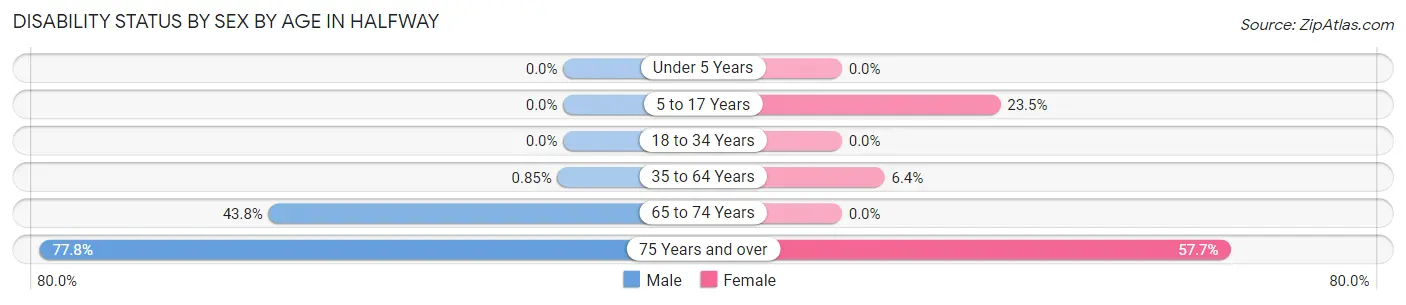
| Age Bracket | Male | Female |
| Under 5 Years | 0 (0.0%) | 0 (0.0%) |
| 5 to 17 Years | 0 (0.0%) | 16 (23.5%) |
| 18 to 34 Years | 0 (0.0%) | 0 (0.0%) |
| 35 to 64 Years | 1 (0.9%) | 4 (6.4%) |
| 65 to 74 Years | 14 (43.8%) | 0 (0.0%) |
| 75 Years and over | 14 (77.8%) | 15 (57.7%) |
Disability Class by Sex by Age in Halfway
Disability Class: Hearing Difficulty
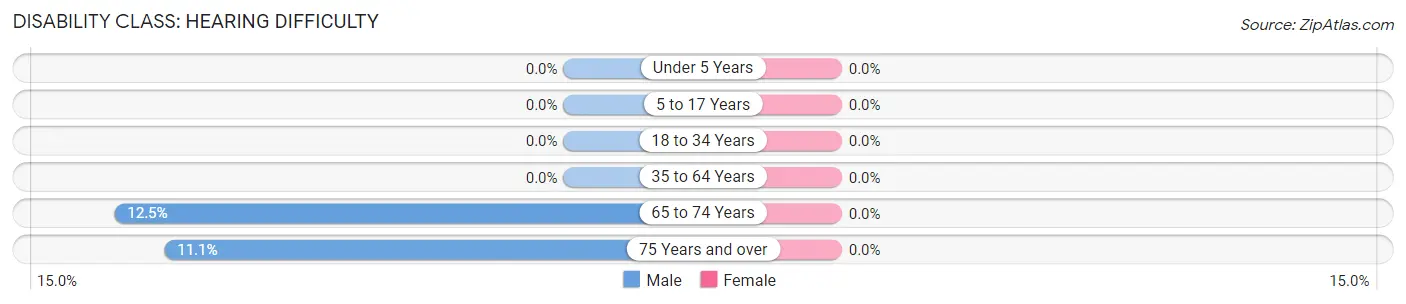
| Age Bracket | Male | Female |
| Under 5 Years | 0 (0.0%) | 0 (0.0%) |
| 5 to 17 Years | 0 (0.0%) | 0 (0.0%) |
| 18 to 34 Years | 0 (0.0%) | 0 (0.0%) |
| 35 to 64 Years | 0 (0.0%) | 0 (0.0%) |
| 65 to 74 Years | 4 (12.5%) | 0 (0.0%) |
| 75 Years and over | 2 (11.1%) | 0 (0.0%) |
Disability Class: Vision Difficulty
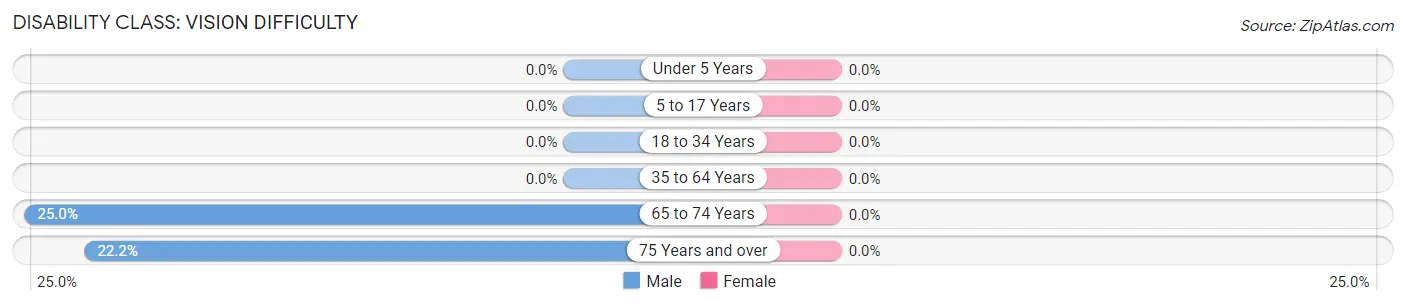
| Age Bracket | Male | Female |
| Under 5 Years | 0 (0.0%) | 0 (0.0%) |
| 5 to 17 Years | 0 (0.0%) | 0 (0.0%) |
| 18 to 34 Years | 0 (0.0%) | 0 (0.0%) |
| 35 to 64 Years | 0 (0.0%) | 0 (0.0%) |
| 65 to 74 Years | 8 (25.0%) | 0 (0.0%) |
| 75 Years and over | 4 (22.2%) | 0 (0.0%) |
Disability Class: Cognitive Difficulty
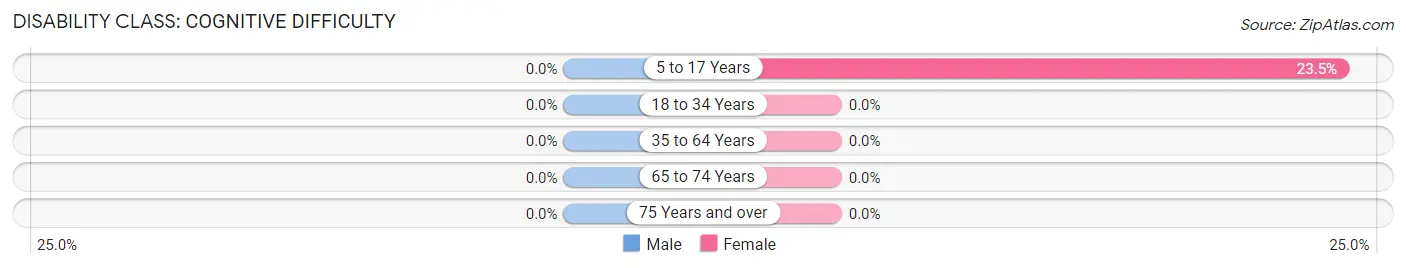
| Age Bracket | Male | Female |
| 5 to 17 Years | 0 (0.0%) | 16 (23.5%) |
| 18 to 34 Years | 0 (0.0%) | 0 (0.0%) |
| 35 to 64 Years | 0 (0.0%) | 0 (0.0%) |
| 65 to 74 Years | 0 (0.0%) | 0 (0.0%) |
| 75 Years and over | 0 (0.0%) | 0 (0.0%) |
Disability Class: Ambulatory Difficulty
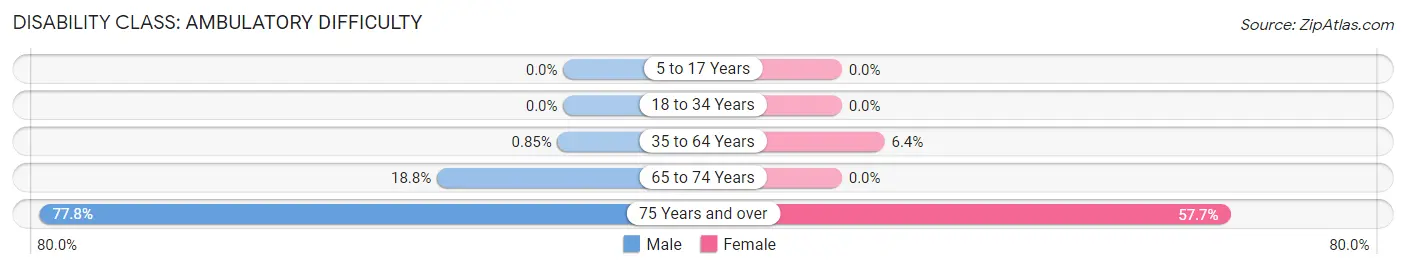
| Age Bracket | Male | Female |
| 5 to 17 Years | 0 (0.0%) | 0 (0.0%) |
| 18 to 34 Years | 0 (0.0%) | 0 (0.0%) |
| 35 to 64 Years | 1 (0.9%) | 4 (6.4%) |
| 65 to 74 Years | 6 (18.8%) | 0 (0.0%) |
| 75 Years and over | 14 (77.8%) | 15 (57.7%) |
Disability Class: Self-Care Difficulty
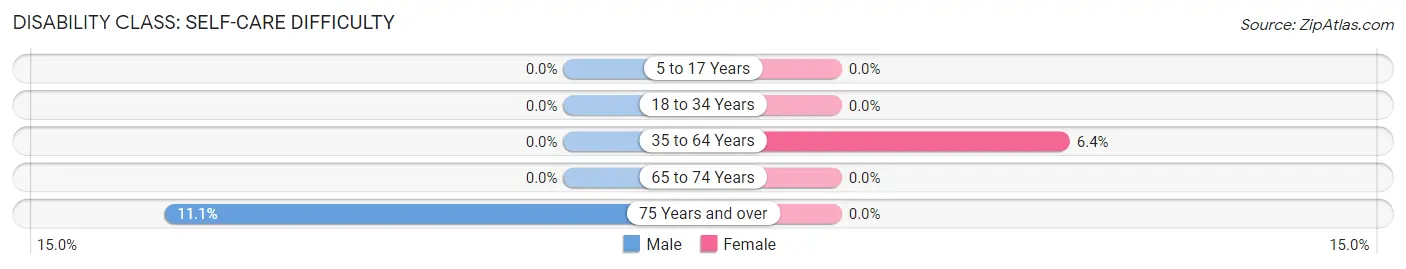
| Age Bracket | Male | Female |
| 5 to 17 Years | 0 (0.0%) | 0 (0.0%) |
| 18 to 34 Years | 0 (0.0%) | 0 (0.0%) |
| 35 to 64 Years | 0 (0.0%) | 4 (6.4%) |
| 65 to 74 Years | 0 (0.0%) | 0 (0.0%) |
| 75 Years and over | 2 (11.1%) | 0 (0.0%) |
Technology Access in Halfway
Computing Device Access in Halfway
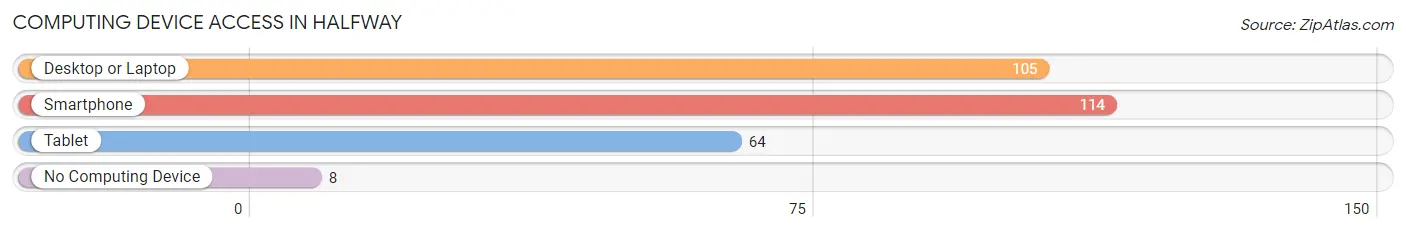
| Device Type | # Households | % Households |
| Desktop or Laptop | 105 | 74.5% |
| Smartphone | 114 | 80.8% |
| Tablet | 64 | 45.4% |
| No Computing Device | 8 | 5.7% |
| Total | 141 | 100.0% |
Internet Access in Halfway
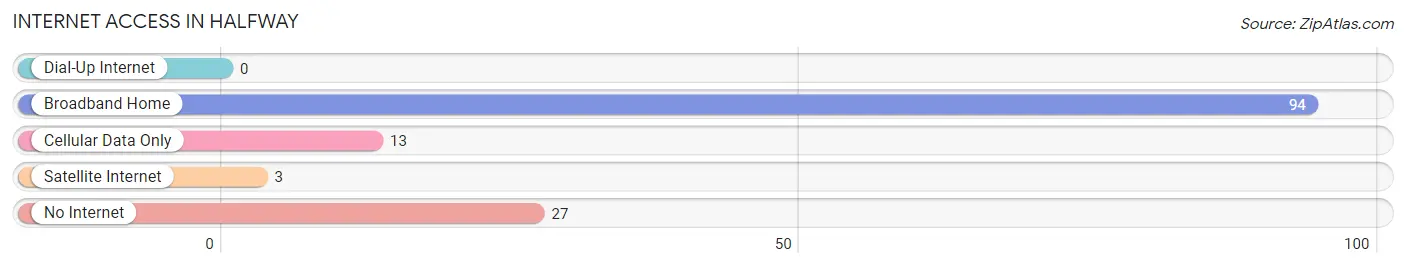
| Internet Type | # Households | % Households |
| Dial-Up Internet | 0 | 0.0% |
| Broadband Home | 94 | 66.7% |
| Cellular Data Only | 13 | 9.2% |
| Satellite Internet | 3 | 2.1% |
| No Internet | 27 | 19.2% |
| Total | 141 | 100.0% |
Halfway Summary
Halfway, Oregon is a small city located in Baker County in the northeastern corner of the state. It is situated in the Blue Mountains, a mountain range that stretches from the Columbia River Gorge to the Snake River Plain. The city is located at the intersection of Oregon Route 86 and Oregon Route 203, and is approximately 30 miles from the Idaho border.
History
Halfway was founded in 1887 by a group of settlers from the nearby town of Baker City. The town was named after the Halfway House, a stagecoach stop located halfway between Baker City and the Idaho border. The Halfway House was built in 1883 and served as a rest stop for travelers on their way to the gold fields of Idaho.
The town of Halfway was officially incorporated in 1895. During the early years of its existence, the town was primarily a farming and ranching community. In the early 1900s, the town began to grow as a result of the timber industry. The town was home to several sawmills and logging camps, and the timber industry provided employment for many of the town’s residents.
In the 1950s, the timber industry began to decline and the town’s economy shifted to tourism. Halfway is now a popular destination for outdoor recreation, such as camping, fishing, hunting, and skiing. The town is also home to several popular restaurants and bars.
Geography
Halfway is located in the Blue Mountains, a mountain range that stretches from the Columbia River Gorge to the Snake River Plain. The city is situated at an elevation of 4,000 feet and is surrounded by the Wallowa-Whitman National Forest. The city is located at the intersection of Oregon Route 86 and Oregon Route 203, and is approximately 30 miles from the Idaho border.
The city is located in a semi-arid climate, with hot summers and cold winters. The average annual temperature is approximately 45 degrees Fahrenheit, and the average annual precipitation is approximately 15 inches.
Economy
The economy of Halfway is primarily based on tourism and outdoor recreation. The city is home to several popular restaurants and bars, as well as several campgrounds and RV parks. The city is also home to several small businesses, such as a grocery store, a hardware store, and a gas station.
The city is also home to several logging and timber companies, as well as several sawmills. The timber industry provides employment for many of the town’s residents.
Demographics
As of the 2010 census, the population of Halfway was 1,092. The racial makeup of the city was 95.3% White, 0.7% Native American, 0.3% Asian, 0.2% African American, and 3.5% from other races. The median household income was $31,250, and the median family income was $37,500.
The city is home to several churches, including the Church of Jesus Christ of Latter-day Saints, the United Methodist Church, and the Church of the Nazarene. The city is also home to several schools, including Halfway Elementary School, Halfway High School, and Halfway Community College.
Common Questions
What is Per Capita Income in Halfway?
Per Capita income in Halfway is $20,805.
What is the Median Family Income in Halfway?
Median Family Income in Halfway is $50,278.
What is the Median Household income in Halfway?
Median Household Income in Halfway is $40,781.
What is Inequality or Gini Index in Halfway?
Inequality or Gini Index in Halfway is 0.39.
What is the Total Population of Halfway?
Total Population of Halfway is 415.
What is the Total Male Population of Halfway?
Total Male Population of Halfway is 224.
What is the Total Female Population of Halfway?
Total Female Population of Halfway is 191.
What is the Ratio of Males per 100 Females in Halfway?
There are 117.28 Males per 100 Females in Halfway.
What is the Ratio of Females per 100 Males in Halfway?
There are 85.27 Females per 100 Males in Halfway.
What is the Median Population Age in Halfway?
Median Population Age in Halfway is 48.6 Years.
What is the Average Family Size in Halfway
Average Family Size in Halfway is 3.9 People.
What is the Average Household Size in Halfway
Average Household Size in Halfway is 2.9 People.
How Large is the Labor Force in Halfway?
There are 135 People in the Labor Forcein in Halfway.
What is the Percentage of People in the Labor Force in Halfway?
41.7% of People are in the Labor Force in Halfway.
What is the Unemployment Rate in Halfway?
Unemployment Rate in Halfway is 6.7%.