Canyonville, OR Map & Demographics
Canyonville Map
Canyonville Overview
$21,162
PER CAPITA INCOME
$44,350
AVG FAMILY INCOME
$41,573
AVG HOUSEHOLD INCOME
40.1%
WAGE / INCOME GAP [ % ]
59.9¢/ $1
WAGE / INCOME GAP [ $ ]
0.36
INEQUALITY / GINI INDEX
1,949
TOTAL POPULATION
845
MALE POPULATION
1,104
FEMALE POPULATION
76.54
MALES / 100 FEMALES
130.65
FEMALES / 100 MALES
42.1
MEDIAN AGE
2.7
AVG FAMILY SIZE
2.1
AVG HOUSEHOLD SIZE
646
LABOR FORCE [ PEOPLE ]
40.4%
PERCENT IN LABOR FORCE
13.2%
UNEMPLOYMENT RATE
Canyonville Zip Codes
Canyonville Area Codes
Income in Canyonville
Income Overview in Canyonville
Per Capita Income in Canyonville is $21,162, while median incomes of families and households are $44,350 and $41,573 respectively.
| Characteristic | Number | Measure |
| Per Capita Income | 1,949 | $21,162 |
| Median Family Income | 476 | $44,350 |
| Mean Family Income | 476 | $53,663 |
| Median Household Income | 877 | $41,573 |
| Mean Household Income | 877 | $45,907 |
| Income Deficit | 476 | $0 |
| Wage / Income Gap (%) | 1,949 | 40.08% |
| Wage / Income Gap ($) | 1,949 | 59.92¢ per $1 |
| Gini / Inequality Index | 1,949 | 0.36 |
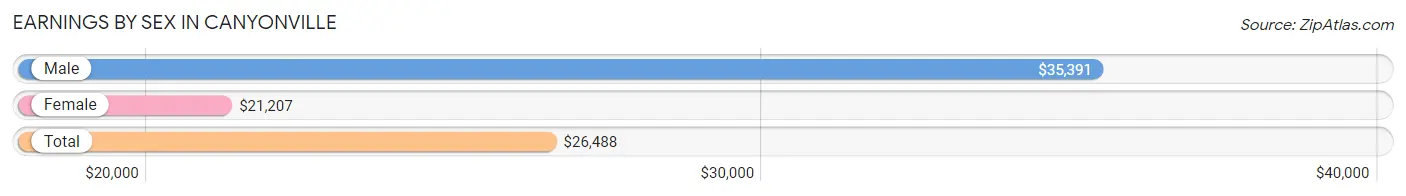
Earnings by Sex in Canyonville
Average Earnings in Canyonville are $26,488, $35,391 for men and $21,207 for women, a difference of 40.1%.
| Sex | Number | Average Earnings |
| Male | 293 (42.4%) | $35,391 |
| Female | 398 (57.6%) | $21,207 |
| Total | 691 (100.0%) | $26,488 |
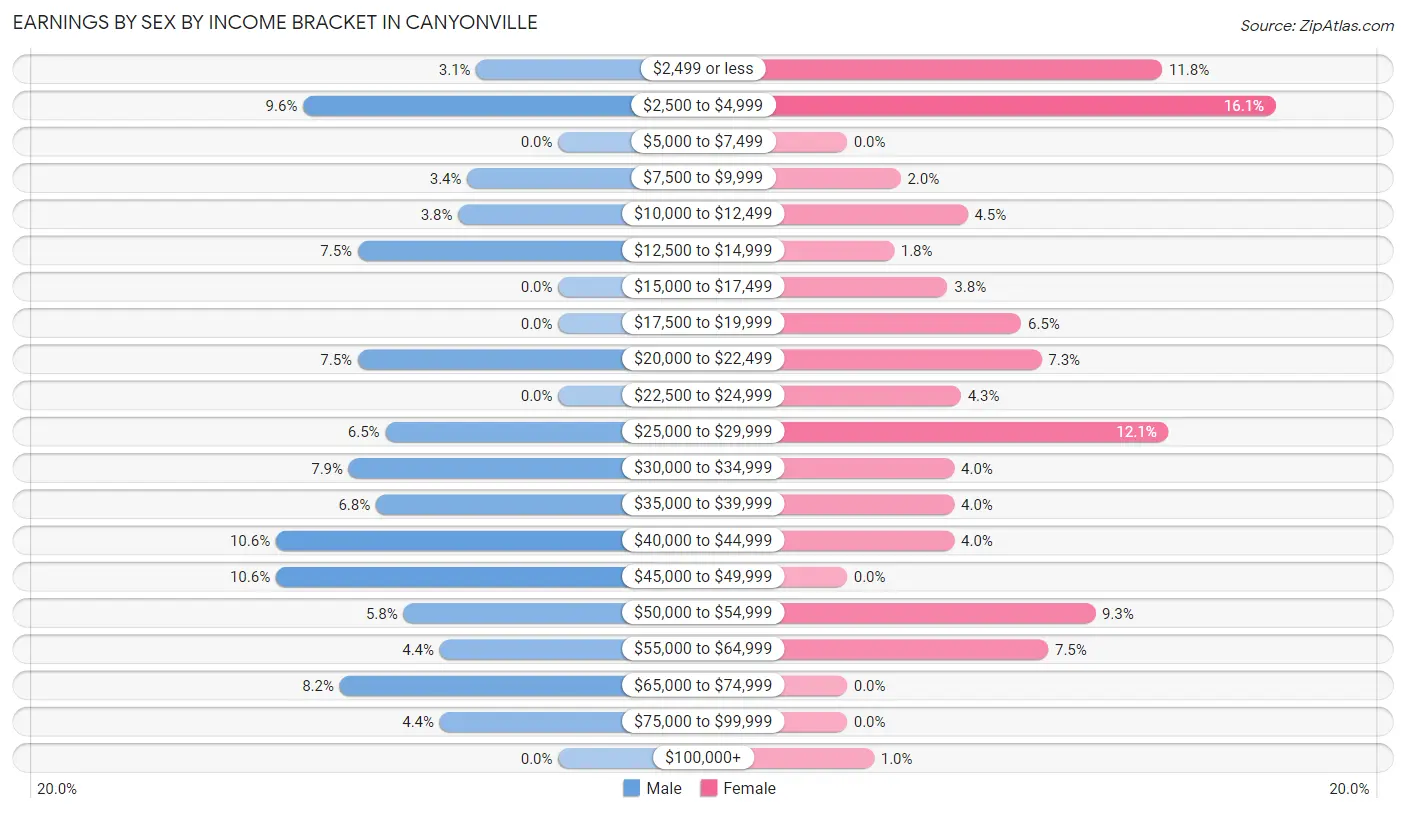
Earnings by Sex by Income Bracket in Canyonville
The most common earnings brackets in Canyonville are $40,000 to $44,999 for men (31 | 10.6%) and $2,500 to $4,999 for women (64 | 16.1%).
| Income | Male | Female |
| $2,499 or less | 9 (3.1%) | 47 (11.8%) |
| $2,500 to $4,999 | 28 (9.6%) | 64 (16.1%) |
| $5,000 to $7,499 | 0 (0.0%) | 0 (0.0%) |
| $7,500 to $9,999 | 10 (3.4%) | 8 (2.0%) |
| $10,000 to $12,499 | 11 (3.7%) | 18 (4.5%) |
| $12,500 to $14,999 | 22 (7.5%) | 7 (1.8%) |
| $15,000 to $17,499 | 0 (0.0%) | 15 (3.8%) |
| $17,500 to $19,999 | 0 (0.0%) | 26 (6.5%) |
| $20,000 to $22,499 | 22 (7.5%) | 29 (7.3%) |
| $22,500 to $24,999 | 0 (0.0%) | 17 (4.3%) |
| $25,000 to $29,999 | 19 (6.5%) | 48 (12.1%) |
| $30,000 to $34,999 | 23 (7.9%) | 16 (4.0%) |
| $35,000 to $39,999 | 20 (6.8%) | 16 (4.0%) |
| $40,000 to $44,999 | 31 (10.6%) | 16 (4.0%) |
| $45,000 to $49,999 | 31 (10.6%) | 0 (0.0%) |
| $50,000 to $54,999 | 17 (5.8%) | 37 (9.3%) |
| $55,000 to $64,999 | 13 (4.4%) | 30 (7.5%) |
| $65,000 to $74,999 | 24 (8.2%) | 0 (0.0%) |
| $75,000 to $99,999 | 13 (4.4%) | 0 (0.0%) |
| $100,000+ | 0 (0.0%) | 4 (1.0%) |
| Total | 293 (100.0%) | 398 (100.0%) |
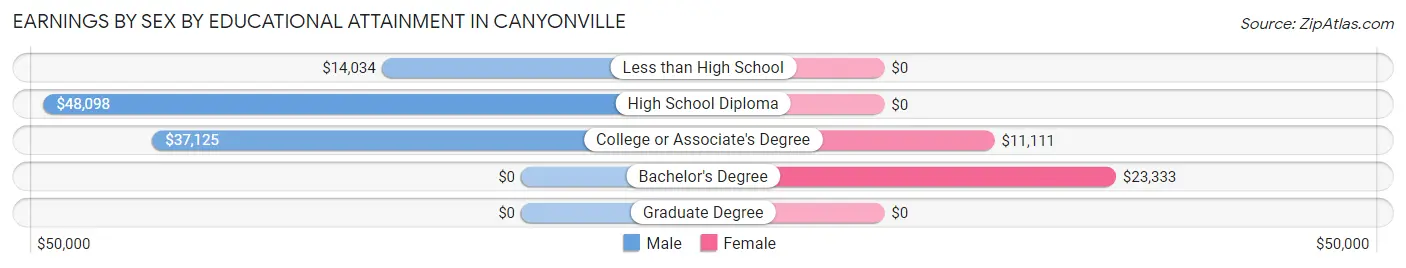
Earnings by Sex by Educational Attainment in Canyonville
Average earnings in Canyonville are $41,845 for men and $21,897 for women, a difference of 47.7%. Men with an educational attainment of high school diploma enjoy the highest average annual earnings of $48,098, while those with less than high school education earn the least with $14,034. Women with an educational attainment of bachelor's degree earn the most with the average annual earnings of $23,333, while those with college or associate's degree education have the smallest earnings of $11,111.
| Educational Attainment | Male Income | Female Income |
| Less than High School | $14,034 | $0 |
| High School Diploma | $48,098 | $0 |
| College or Associate's Degree | $37,125 | $11,111 |
| Bachelor's Degree | - | - |
| Graduate Degree | - | - |
| Total | $41,845 | $21,897 |
Family Income in Canyonville
Family Income Brackets in Canyonville
According to the Canyonville family income data, there are 155 families falling into the $35,000 to $49,999 income range, which is the most common income bracket and makes up 32.6% of all families.
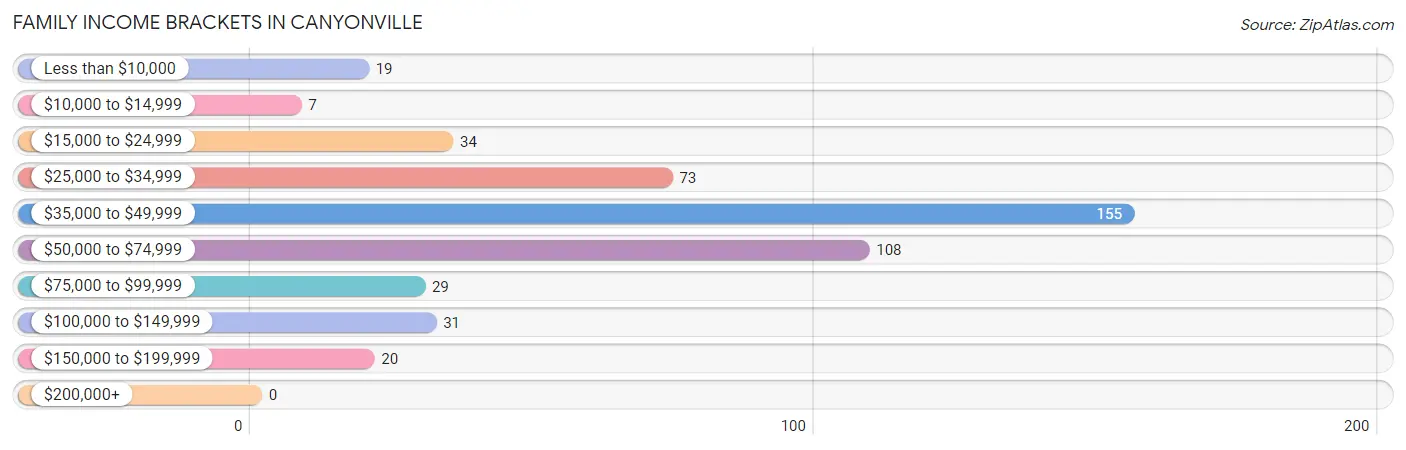
| Income Bracket | # Families | % Families |
| Less than $10,000 | 19 | 4.0% |
| $10,000 to $14,999 | 7 | 1.5% |
| $15,000 to $24,999 | 34 | 7.1% |
| $25,000 to $34,999 | 73 | 15.3% |
| $35,000 to $49,999 | 155 | 32.6% |
| $50,000 to $74,999 | 108 | 22.7% |
| $75,000 to $99,999 | 29 | 6.1% |
| $100,000 to $149,999 | 31 | 6.5% |
| $150,000 to $199,999 | 20 | 4.2% |
| $200,000+ | 0 | 0.0% |
Family Income by Famaliy Size in Canyonville
5-person families (14 | 2.9%) account for the highest median family income in Canyonville with $69,000 per family, while 2-person families (314 | 66.0%) have the highest median income of $22,500 per family member.
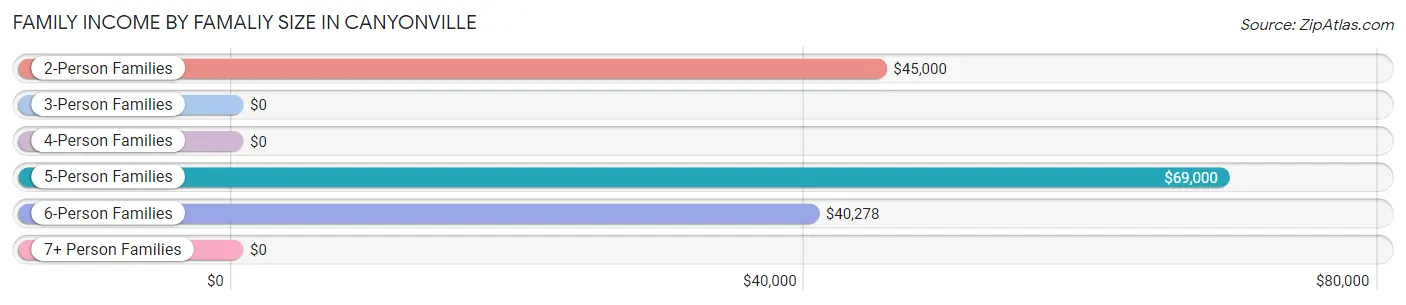
| Income Bracket | # Families | Median Income |
| 2-Person Families | 314 (66.0%) | $45,000 |
| 3-Person Families | 69 (14.5%) | $0 |
| 4-Person Families | 59 (12.4%) | $0 |
| 5-Person Families | 14 (2.9%) | $69,000 |
| 6-Person Families | 20 (4.2%) | $40,278 |
| 7+ Person Families | 0 (0.0%) | $0 |
| Total | 476 (100.0%) | $44,350 |
Family Income by Number of Earners in Canyonville
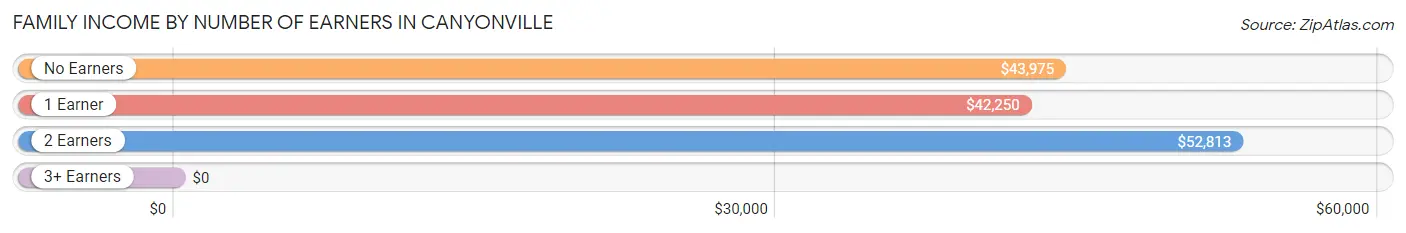
| Number of Earners | # Families | Median Income |
| No Earners | 205 (43.1%) | $43,975 |
| 1 Earner | 200 (42.0%) | $42,250 |
| 2 Earners | 55 (11.6%) | $52,813 |
| 3+ Earners | 16 (3.4%) | $0 |
| Total | 476 (100.0%) | $44,350 |
Household Income in Canyonville
Household Income Brackets in Canyonville
With 222 households falling in the category, the $35,000 to $49,999 income range is the most frequent in Canyonville, accounting for 25.3% of all households.
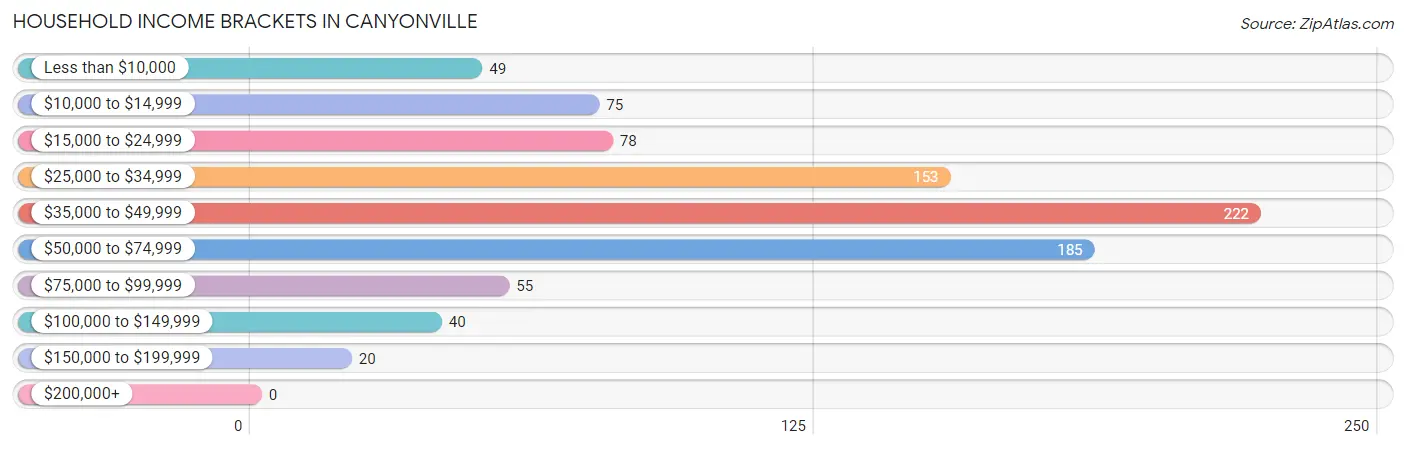
| Income Bracket | # Households | % Households |
| Less than $10,000 | 49 | 5.6% |
| $10,000 to $14,999 | 75 | 8.6% |
| $15,000 to $24,999 | 78 | 8.9% |
| $25,000 to $34,999 | 153 | 17.4% |
| $35,000 to $49,999 | 222 | 25.3% |
| $50,000 to $74,999 | 185 | 21.1% |
| $75,000 to $99,999 | 55 | 6.3% |
| $100,000 to $149,999 | 40 | 4.6% |
| $150,000 to $199,999 | 20 | 2.3% |
| $200,000+ | 0 | 0.0% |
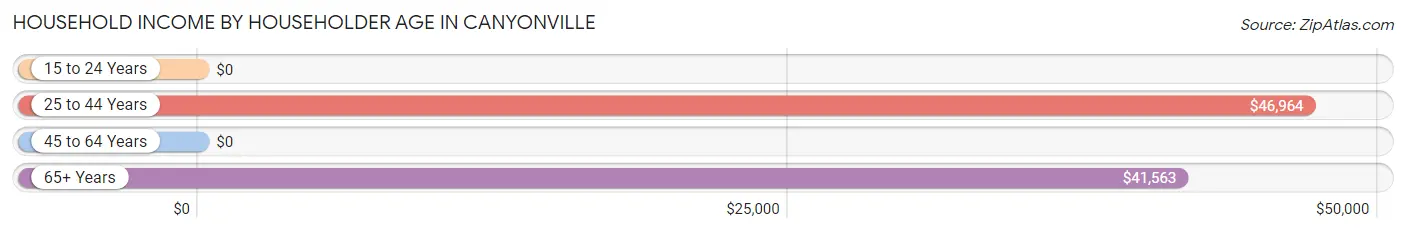
Household Income by Householder Age in Canyonville
The median household income in Canyonville is $41,573, with the highest median household income of $46,964 found in the 25 to 44 years age bracket for the primary householder. A total of 305 households (34.8%) fall into this category. Meanwhile, the 15 to 24 years age bracket for the primary householder has the lowest median household income of $0, with 30 households (3.4%) in this group.
| Income Bracket | # Households | Median Income |
| 15 to 24 Years | 30 (3.4%) | $0 |
| 25 to 44 Years | 305 (34.8%) | $46,964 |
| 45 to 64 Years | 126 (14.4%) | $0 |
| 65+ Years | 416 (47.4%) | $41,563 |
| Total | 877 (100.0%) | $41,573 |
Poverty in Canyonville
Income Below Poverty by Sex and Age in Canyonville
With 17.5% poverty level for males and 24.3% for females among the residents of Canyonville, 15 year old males and 45 to 54 year old females are the most vulnerable to poverty, with 23 males (100.0%) and 65 females (67.7%) in their respective age groups living below the poverty level.
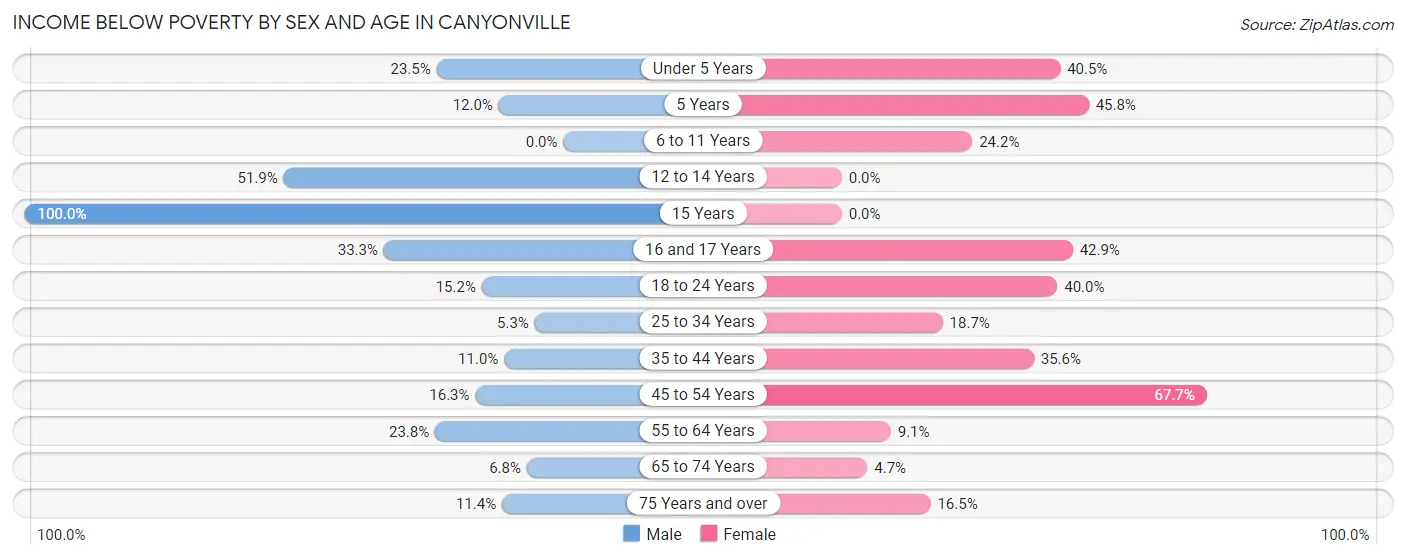
| Age Bracket | Male | Female |
| Under 5 Years | 8 (23.5%) | 15 (40.5%) |
| 5 Years | 3 (12.0%) | 11 (45.8%) |
| 6 to 11 Years | 0 (0.0%) | 23 (24.2%) |
| 12 to 14 Years | 27 (51.9%) | 0 (0.0%) |
| 15 Years | 23 (100.0%) | 0 (0.0%) |
| 16 and 17 Years | 12 (33.3%) | 9 (42.9%) |
| 18 to 24 Years | 5 (15.1%) | 22 (40.0%) |
| 25 to 34 Years | 5 (5.3%) | 41 (18.7%) |
| 35 to 44 Years | 10 (11.0%) | 31 (35.6%) |
| 45 to 54 Years | 8 (16.3%) | 65 (67.7%) |
| 55 to 64 Years | 15 (23.8%) | 5 (9.1%) |
| 65 to 74 Years | 8 (6.8%) | 10 (4.7%) |
| 75 Years and over | 18 (11.4%) | 27 (16.5%) |
| Total | 142 (17.5%) | 259 (24.3%) |
Income Above Poverty by Sex and Age in Canyonville
According to the poverty statistics in Canyonville, males aged 6 to 11 years and females aged 12 to 14 years are the age groups that are most secure financially, with 100.0% of males and 100.0% of females in these age groups living above the poverty line.
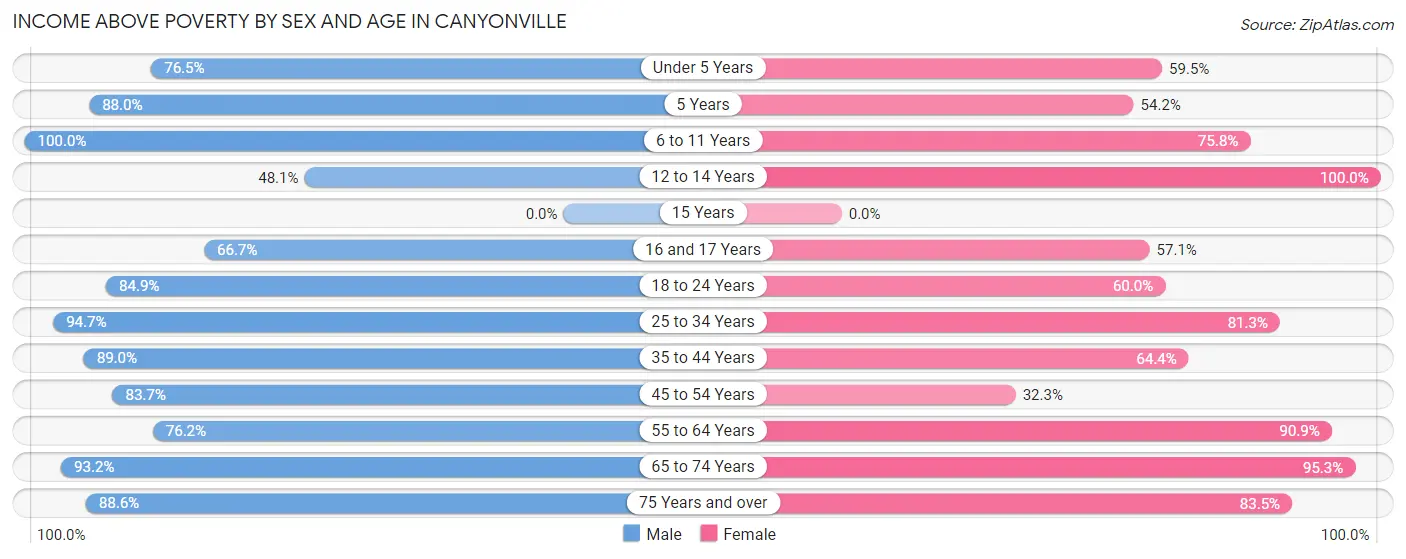
| Age Bracket | Male | Female |
| Under 5 Years | 26 (76.5%) | 22 (59.5%) |
| 5 Years | 22 (88.0%) | 13 (54.2%) |
| 6 to 11 Years | 37 (100.0%) | 72 (75.8%) |
| 12 to 14 Years | 25 (48.1%) | 2 (100.0%) |
| 15 Years | 0 (0.0%) | 0 (0.0%) |
| 16 and 17 Years | 24 (66.7%) | 12 (57.1%) |
| 18 to 24 Years | 28 (84.9%) | 33 (60.0%) |
| 25 to 34 Years | 89 (94.7%) | 178 (81.3%) |
| 35 to 44 Years | 81 (89.0%) | 56 (64.4%) |
| 45 to 54 Years | 41 (83.7%) | 31 (32.3%) |
| 55 to 64 Years | 48 (76.2%) | 50 (90.9%) |
| 65 to 74 Years | 110 (93.2%) | 201 (95.3%) |
| 75 Years and over | 140 (88.6%) | 137 (83.5%) |
| Total | 671 (82.5%) | 807 (75.7%) |
Income Below Poverty Among Married-Couple Families in Canyonville
The poverty statistics for married-couple families in Canyonville show that 2.9% or 9 of the total 305 families live below the poverty line. Families with 3 or 4 children have the highest poverty rate of 36.0%, comprising of 9 families. On the other hand, families with no children have the lowest poverty rate of 0.0%, which includes 0 families.
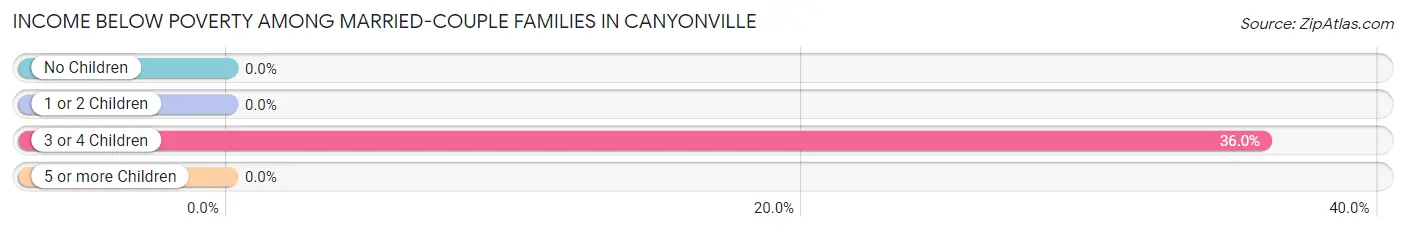
| Children | Above Poverty | Below Poverty |
| No Children | 246 (100.0%) | 0 (0.0%) |
| 1 or 2 Children | 34 (100.0%) | 0 (0.0%) |
| 3 or 4 Children | 16 (64.0%) | 9 (36.0%) |
| 5 or more Children | 0 (0.0%) | 0 (0.0%) |
| Total | 296 (97.1%) | 9 (2.9%) |
Income Below Poverty Among Single-Parent Households in Canyonville
According to the poverty data in Canyonville, 22.6% or 7 single-father households and 20.0% or 28 single-mother households are living below the poverty line. Among single-father households, those with 3 or 4 children have the highest poverty rate, with 7 households (100.0%) experiencing poverty. Likewise, among single-mother households, those with 3 or 4 children have the highest poverty rate, with 8 households (100.0%) falling below the poverty line.
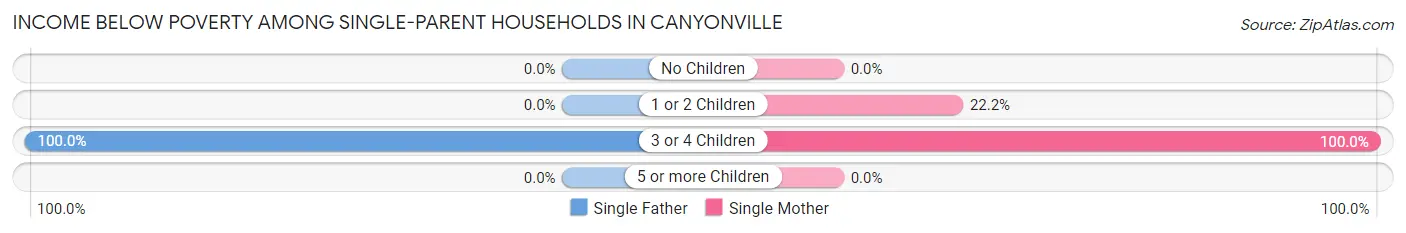
| Children | Single Father | Single Mother |
| No Children | 0 (0.0%) | 0 (0.0%) |
| 1 or 2 Children | 0 (0.0%) | 20 (22.2%) |
| 3 or 4 Children | 7 (100.0%) | 8 (100.0%) |
| 5 or more Children | 0 (0.0%) | 0 (0.0%) |
| Total | 7 (22.6%) | 28 (20.0%) |
Income Below Poverty Among Married-Couple vs Single-Parent Households in Canyonville
The poverty data for Canyonville shows that 9 of the married-couple family households (2.9%) and 35 of the single-parent households (20.5%) are living below the poverty level. Within the married-couple family households, those with 3 or 4 children have the highest poverty rate, with 9 households (36.0%) falling below the poverty line. Among the single-parent households, those with 3 or 4 children have the highest poverty rate, with 15 household (100.0%) living below poverty.
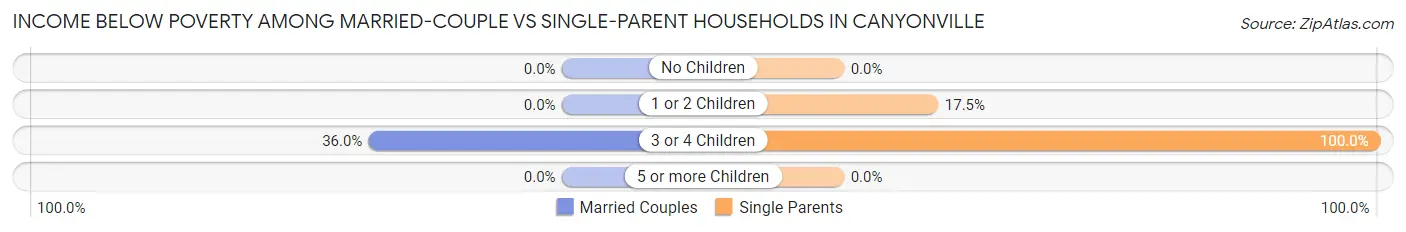
| Children | Married-Couple Families | Single-Parent Households |
| No Children | 0 (0.0%) | 0 (0.0%) |
| 1 or 2 Children | 0 (0.0%) | 20 (17.5%) |
| 3 or 4 Children | 9 (36.0%) | 15 (100.0%) |
| 5 or more Children | 0 (0.0%) | 0 (0.0%) |
| Total | 9 (2.9%) | 35 (20.5%) |
Race in Canyonville
The most populous races in Canyonville are White / Caucasian (1,600 | 82.1%), Two or more Races (219 | 11.2%), and Hispanic or Latino (134 | 6.9%).
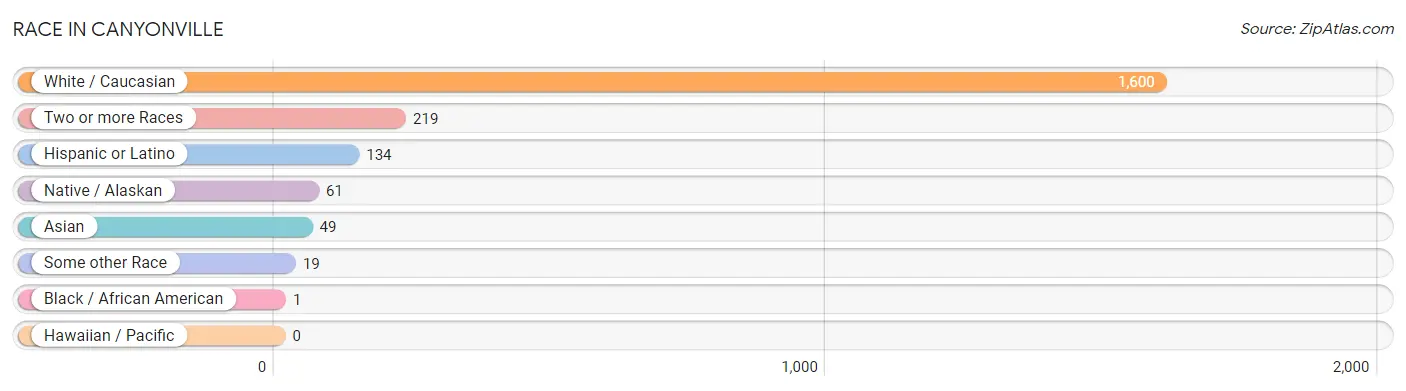
| Race | # Population | % Population |
| Asian | 49 | 2.5% |
| Black / African American | 1 | 0.1% |
| Hawaiian / Pacific | 0 | 0.0% |
| Hispanic or Latino | 134 | 6.9% |
| Native / Alaskan | 61 | 3.1% |
| White / Caucasian | 1,600 | 82.1% |
| Two or more Races | 219 | 11.2% |
| Some other Race | 19 | 1.0% |
| Total | 1,949 | 100.0% |
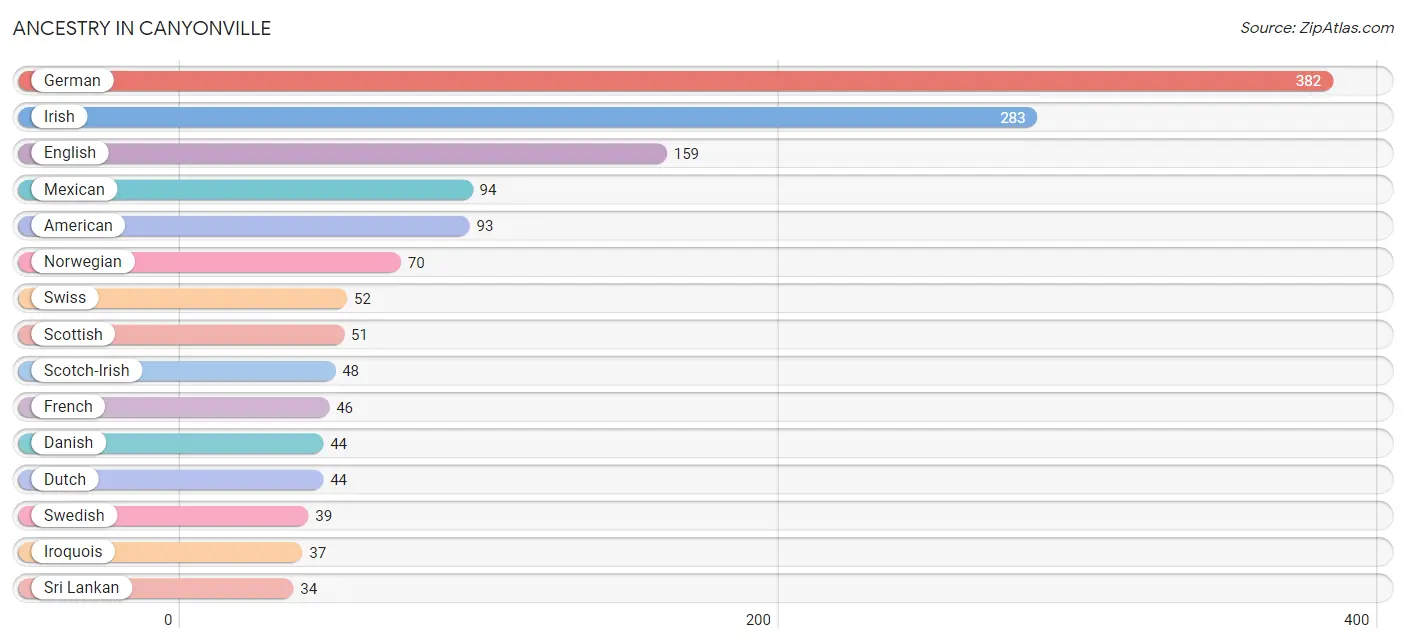
Ancestry in Canyonville
The most populous ancestries reported in Canyonville are German (382 | 19.6%), Irish (283 | 14.5%), English (159 | 8.2%), Mexican (94 | 4.8%), and American (93 | 4.8%), together accounting for 51.9% of all Canyonville residents.
| Ancestry | # Population | % Population |
| Alaska Native | 5 | 0.3% |
| American | 93 | 4.8% |
| Belgian | 9 | 0.5% |
| Bhutanese | 19 | 1.0% |
| Blackfeet | 9 | 0.5% |
| British | 2 | 0.1% |
| Central American | 9 | 0.5% |
| Cherokee | 18 | 0.9% |
| Chickasaw | 3 | 0.2% |
| Creek | 5 | 0.3% |
| Czech | 8 | 0.4% |
| Danish | 44 | 2.3% |
| Dutch | 44 | 2.3% |
| Eastern European | 17 | 0.9% |
| English | 159 | 8.2% |
| Finnish | 20 | 1.0% |
| French | 46 | 2.4% |
| French Canadian | 4 | 0.2% |
| German | 382 | 19.6% |
| Greek | 8 | 0.4% |
| Honduran | 9 | 0.5% |
| Hungarian | 10 | 0.5% |
| Indian (Asian) | 16 | 0.8% |
| Irish | 283 | 14.5% |
| Iroquois | 37 | 1.9% |
| Italian | 23 | 1.2% |
| Korean | 12 | 0.6% |
| Mexican | 94 | 4.8% |
| Mexican American Indian | 9 | 0.5% |
| Navajo | 19 | 1.0% |
| Norwegian | 70 | 3.6% |
| Polish | 31 | 1.6% |
| Portuguese | 27 | 1.4% |
| Puerto Rican | 25 | 1.3% |
| Russian | 21 | 1.1% |
| Scandinavian | 10 | 0.5% |
| Scotch-Irish | 48 | 2.5% |
| Scottish | 51 | 2.6% |
| Sri Lankan | 34 | 1.7% |
| Swedish | 39 | 2.0% |
| Swiss | 52 | 2.7% |
| Tsimshian | 8 | 0.4% |
| Welsh | 9 | 0.5% | View All 43 Rows |
Immigrants in Canyonville
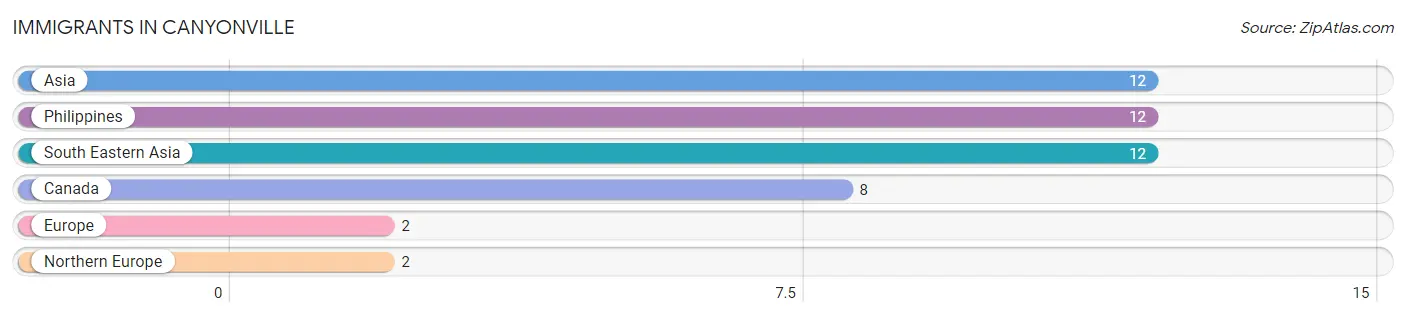
The most numerous immigrant groups reported in Canyonville came from Asia (12 | 0.6%), Philippines (12 | 0.6%), South Eastern Asia (12 | 0.6%), Canada (8 | 0.4%), and Europe (2 | 0.1%), together accounting for 2.4% of all Canyonville residents.
| Immigration Origin | # Population | % Population |
| Asia | 12 | 0.6% |
| Canada | 8 | 0.4% |
| Europe | 2 | 0.1% |
| Northern Europe | 2 | 0.1% |
| Philippines | 12 | 0.6% |
| South Eastern Asia | 12 | 0.6% | View All 6 Rows |
Sex and Age in Canyonville
Sex and Age in Canyonville
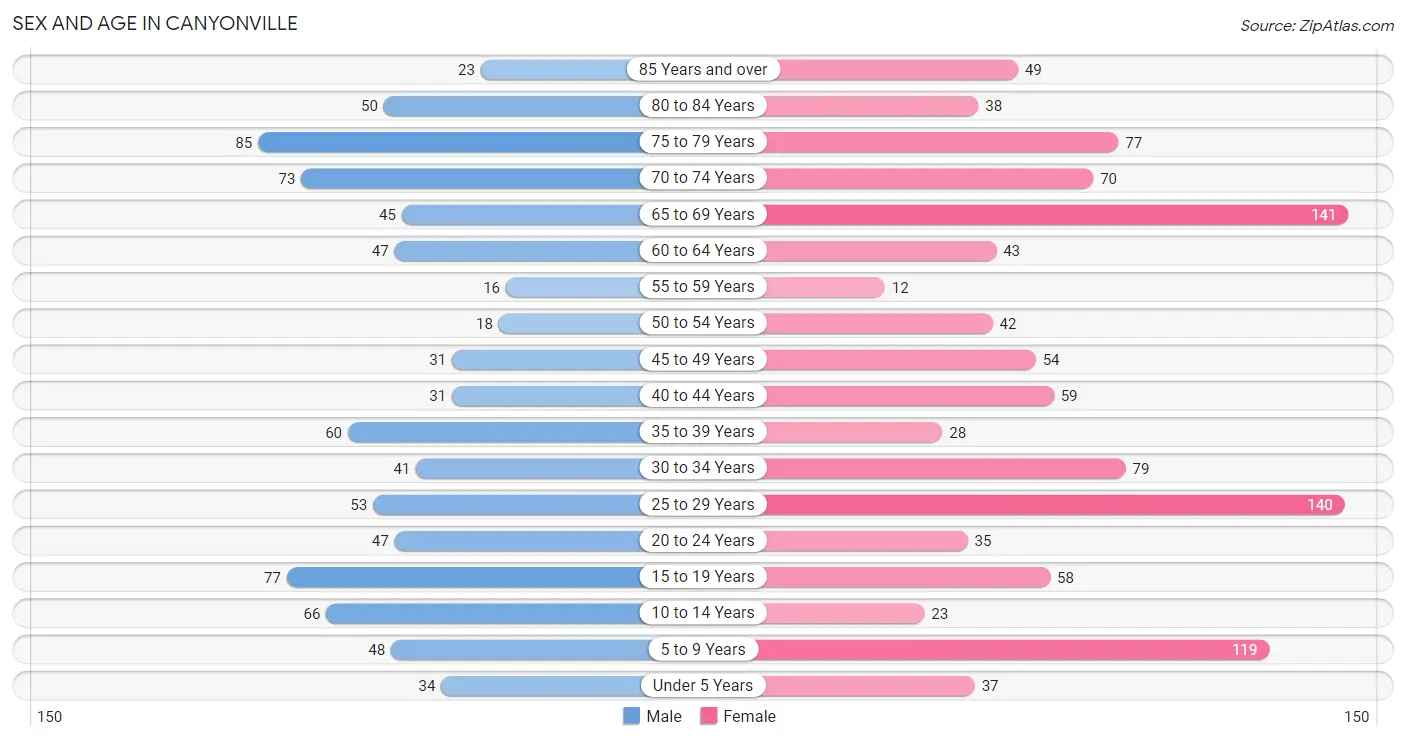
The most populous age groups in Canyonville are 75 to 79 Years (85 | 10.1%) for men and 65 to 69 Years (141 | 12.8%) for women.
| Age Bracket | Male | Female |
| Under 5 Years | 34 (4.0%) | 37 (3.4%) |
| 5 to 9 Years | 48 (5.7%) | 119 (10.8%) |
| 10 to 14 Years | 66 (7.8%) | 23 (2.1%) |
| 15 to 19 Years | 77 (9.1%) | 58 (5.2%) |
| 20 to 24 Years | 47 (5.6%) | 35 (3.2%) |
| 25 to 29 Years | 53 (6.3%) | 140 (12.7%) |
| 30 to 34 Years | 41 (4.9%) | 79 (7.2%) |
| 35 to 39 Years | 60 (7.1%) | 28 (2.5%) |
| 40 to 44 Years | 31 (3.7%) | 59 (5.3%) |
| 45 to 49 Years | 31 (3.7%) | 54 (4.9%) |
| 50 to 54 Years | 18 (2.1%) | 42 (3.8%) |
| 55 to 59 Years | 16 (1.9%) | 12 (1.1%) |
| 60 to 64 Years | 47 (5.6%) | 43 (3.9%) |
| 65 to 69 Years | 45 (5.3%) | 141 (12.8%) |
| 70 to 74 Years | 73 (8.6%) | 70 (6.3%) |
| 75 to 79 Years | 85 (10.1%) | 77 (7.0%) |
| 80 to 84 Years | 50 (5.9%) | 38 (3.4%) |
| 85 Years and over | 23 (2.7%) | 49 (4.4%) |
| Total | 845 (100.0%) | 1,104 (100.0%) |
Families and Households in Canyonville
Median Family Size in Canyonville
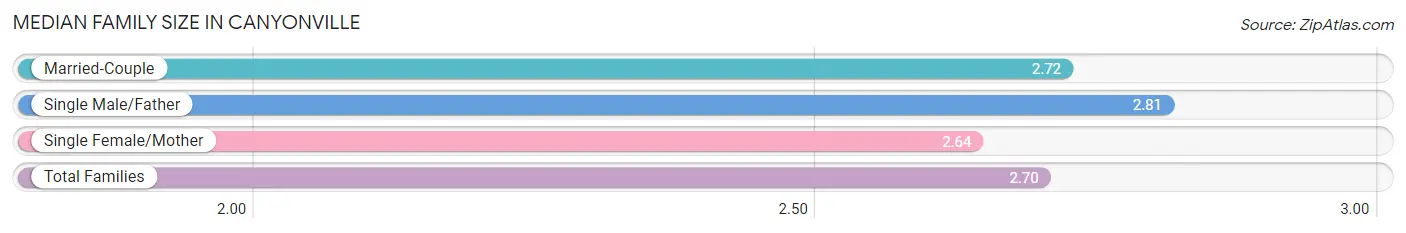
The median family size in Canyonville is 2.70 persons per family, with single male/father families (31 | 6.5%) accounting for the largest median family size of 2.81 persons per family. On the other hand, single female/mother families (140 | 29.4%) represent the smallest median family size with 2.64 persons per family.
| Family Type | # Families | Family Size |
| Married-Couple | 305 (64.1%) | 2.72 |
| Single Male/Father | 31 (6.5%) | 2.81 |
| Single Female/Mother | 140 (29.4%) | 2.64 |
| Total Families | 476 (100.0%) | 2.70 |
Median Household Size in Canyonville
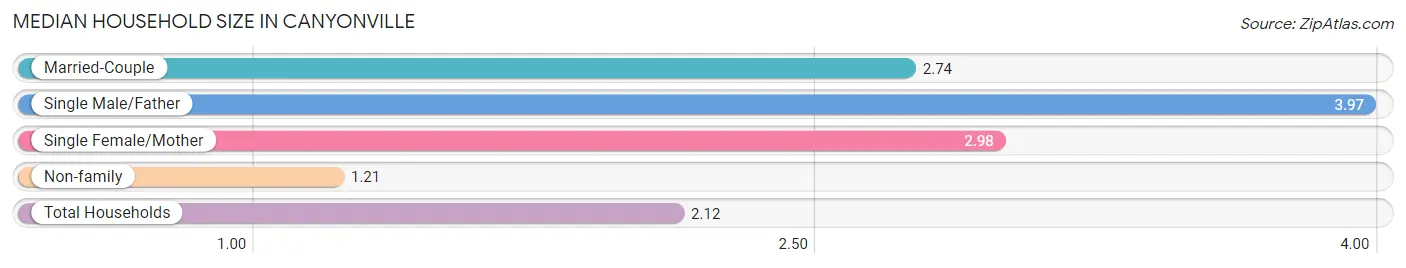
The median household size in Canyonville is 2.12 persons per household, with single male/father households (31 | 3.5%) accounting for the largest median household size of 3.97 persons per household. non-family households (401 | 45.7%) represent the smallest median household size with 1.21 persons per household.
| Household Type | # Households | Household Size |
| Married-Couple | 305 (34.8%) | 2.74 |
| Single Male/Father | 31 (3.5%) | 3.97 |
| Single Female/Mother | 140 (16.0%) | 2.98 |
| Non-family | 401 (45.7%) | 1.21 |
| Total Households | 877 (100.0%) | 2.12 |
Household Size by Marriage Status in Canyonville
Out of a total of 877 households in Canyonville, 476 (54.3%) are family households, while 401 (45.7%) are nonfamily households. The most numerous type of family households are 2-person households, comprising 260, and the most common type of nonfamily households are 1-person households, comprising 329.
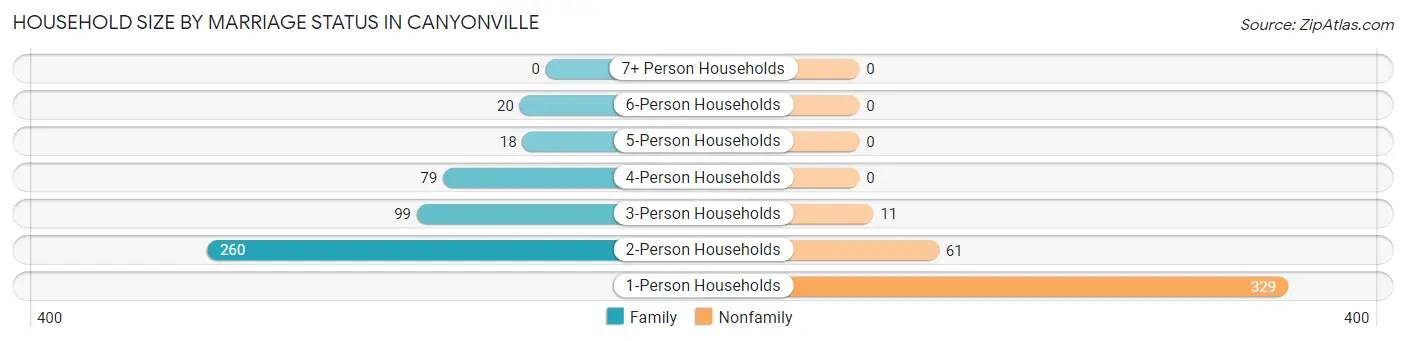
| Household Size | Family Households | Nonfamily Households |
| 1-Person Households | - | 329 (37.5%) |
| 2-Person Households | 260 (29.6%) | 61 (7.0%) |
| 3-Person Households | 99 (11.3%) | 11 (1.3%) |
| 4-Person Households | 79 (9.0%) | 0 (0.0%) |
| 5-Person Households | 18 (2.1%) | 0 (0.0%) |
| 6-Person Households | 20 (2.3%) | 0 (0.0%) |
| 7+ Person Households | 0 (0.0%) | 0 (0.0%) |
| Total | 476 (54.3%) | 401 (45.7%) |
Female Fertility in Canyonville
Fertility by Age in Canyonville
Average fertility rate in Canyonville is 68.0 births per 1,000 women. Women in the age bracket of 20 to 34 years have the highest fertility rate with 122.0 births per 1,000 women. Women in the age bracket of 20 to 34 years acount for 100.0% of all women with births.
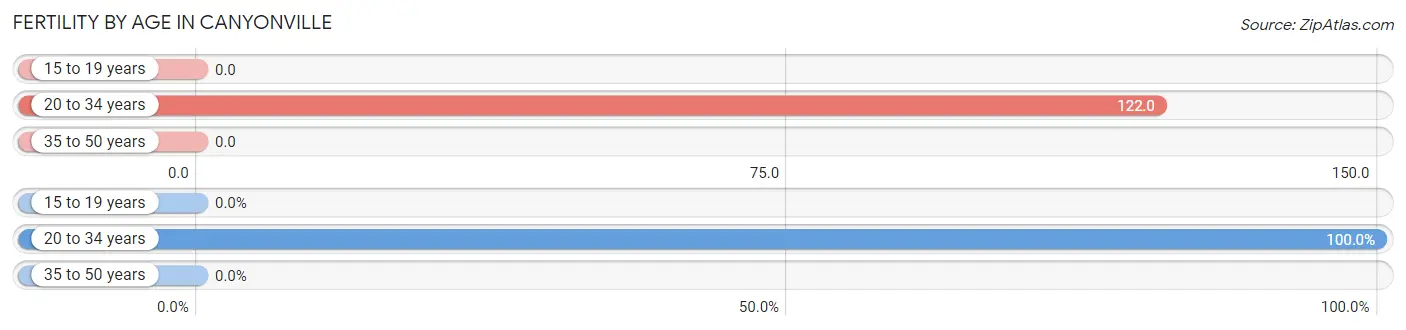
| Age Bracket | Women with Births | Births / 1,000 Women |
| 15 to 19 years | 0 (0.0%) | 0.0 |
| 20 to 34 years | 31 (100.0%) | 122.0 |
| 35 to 50 years | 0 (0.0%) | 0.0 |
| Total | 31 (100.0%) | 68.0 |
Fertility by Age by Marriage Status in Canyonville
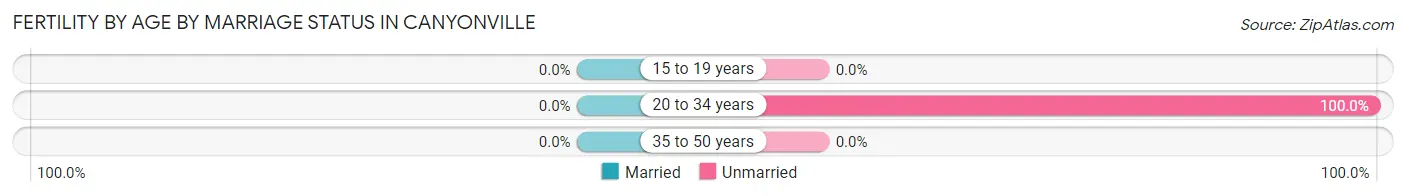
| Age Bracket | Married | Unmarried |
| 15 to 19 years | 0 (0.0%) | 0 (0.0%) |
| 20 to 34 years | 0 (0.0%) | 31 (100.0%) |
| 35 to 50 years | 0 (0.0%) | 0 (0.0%) |
| Total | 0 (0.0%) | 31 (100.0%) |
Fertility by Education in Canyonville
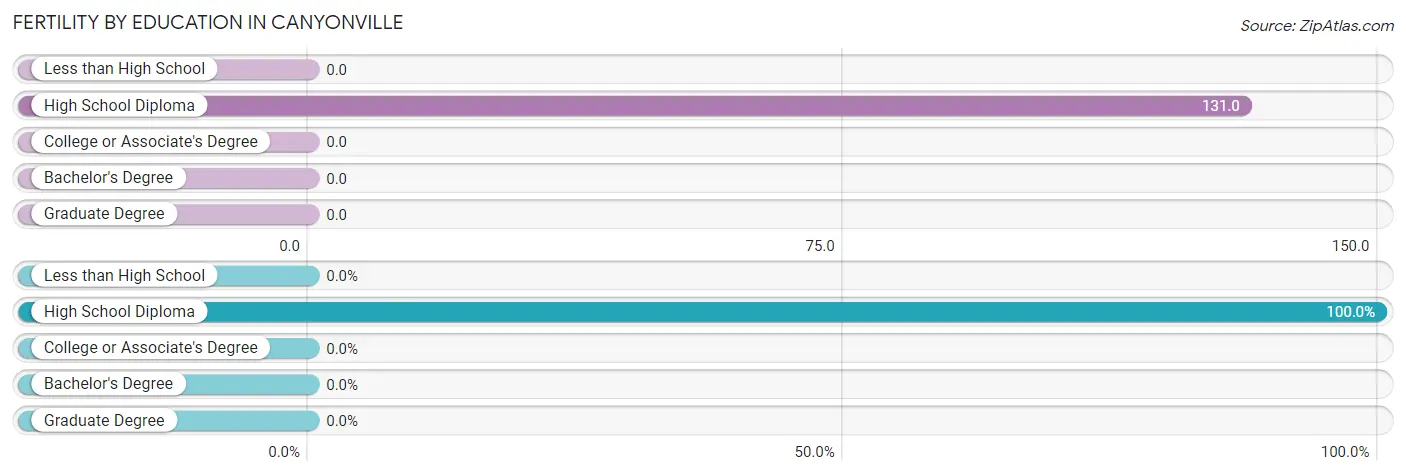
| Educational Attainment | Women with Births | Births / 1,000 Women |
| Less than High School | 0 (0.0%) | 0.0 |
| High School Diploma | 31 (100.0%) | 131.0 |
| College or Associate's Degree | 0 (0.0%) | 0.0 |
| Bachelor's Degree | 0 (0.0%) | 0.0 |
| Graduate Degree | 0 (0.0%) | 0.0 |
| Total | 31 (100.0%) | 68.0 |
Fertility by Education by Marriage Status in Canyonville
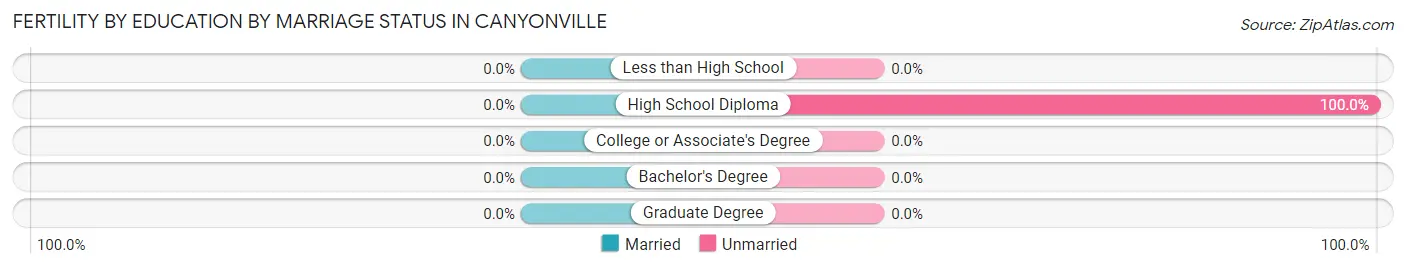
| Educational Attainment | Married | Unmarried |
| Less than High School | 0 (0.0%) | 0 (0.0%) |
| High School Diploma | 0 (0.0%) | 31 (100.0%) |
| College or Associate's Degree | 0 (0.0%) | 0 (0.0%) |
| Bachelor's Degree | 0 (0.0%) | 0 (0.0%) |
| Graduate Degree | 0 (0.0%) | 0 (0.0%) |
| Total | 0 (0.0%) | 31 (100.0%) |
Employment Characteristics in Canyonville
Employment by Class of Employer in Canyonville
Among the 561 employed individuals in Canyonville, private company employees (367 | 65.4%), not-for-profit organizations (133 | 23.7%), and self-employed (not incorporated) (25 | 4.5%) make up the most common classes of employment.
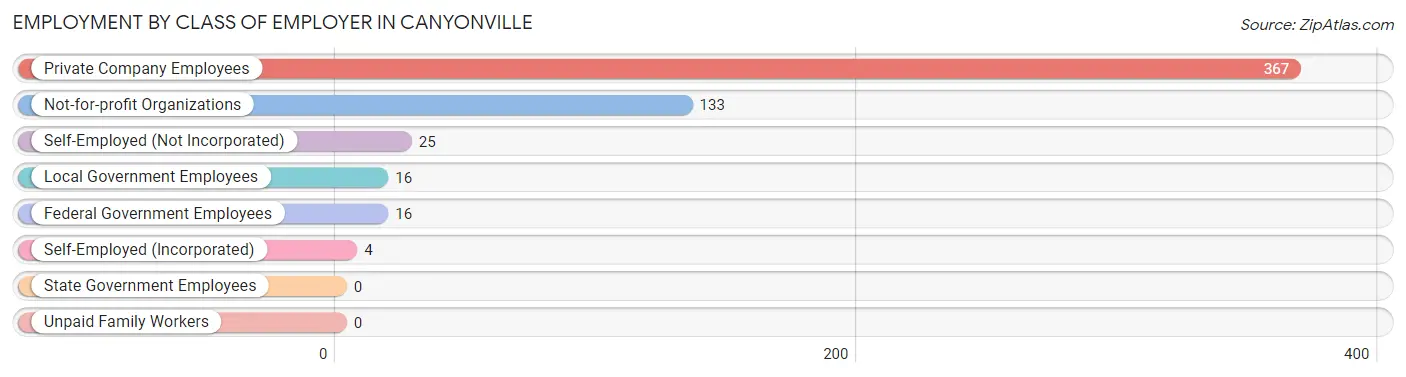
| Employer Class | # Employees | % Employees |
| Private Company Employees | 367 | 65.4% |
| Self-Employed (Incorporated) | 4 | 0.7% |
| Self-Employed (Not Incorporated) | 25 | 4.5% |
| Not-for-profit Organizations | 133 | 23.7% |
| Local Government Employees | 16 | 2.9% |
| State Government Employees | 0 | 0.0% |
| Federal Government Employees | 16 | 2.9% |
| Unpaid Family Workers | 0 | 0.0% |
| Total | 561 | 100.0% |
Employment Status by Age in Canyonville
According to the labor force statistics for Canyonville, out of the total population over 16 years of age (1,599), 40.4% or 646 individuals are in the labor force, with 13.2% or 85 of them unemployed. The age group with the highest labor force participation rate is 25 to 29 years, with 93.3% or 180 individuals in the labor force. Within the labor force, the 16 to 19 years age range has the highest percentage of unemployed individuals, with 40.0% or 12 of them being unemployed.
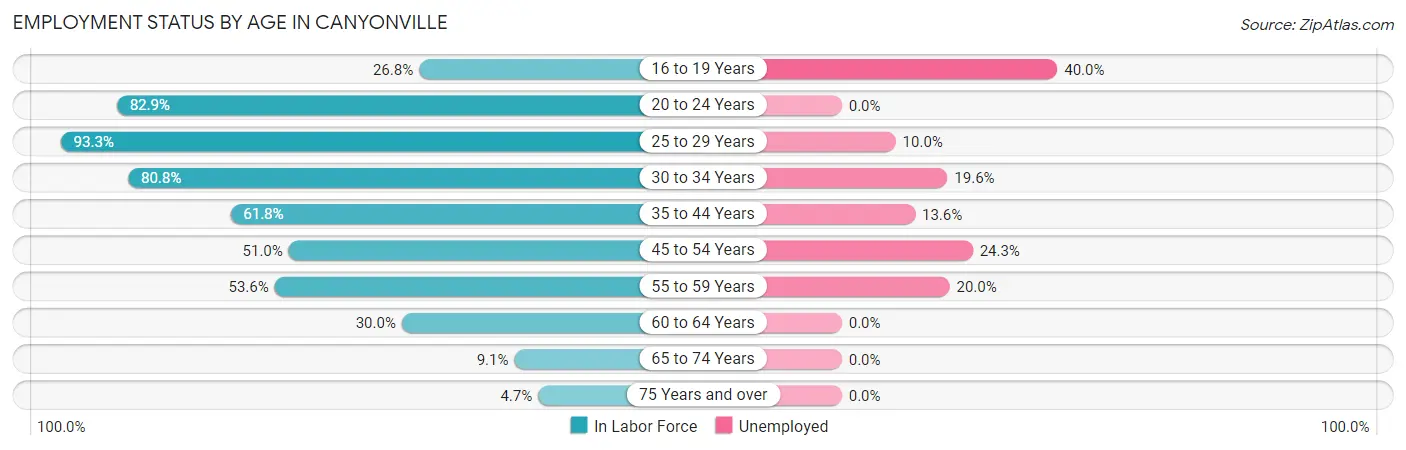
| Age Bracket | In Labor Force | Unemployed |
| 16 to 19 Years | 30 (26.8%) | 12 (40.0%) |
| 20 to 24 Years | 68 (82.9%) | 0 (0.0%) |
| 25 to 29 Years | 180 (93.3%) | 18 (10.0%) |
| 30 to 34 Years | 97 (80.8%) | 19 (19.6%) |
| 35 to 44 Years | 110 (61.8%) | 15 (13.6%) |
| 45 to 54 Years | 74 (51.0%) | 18 (24.3%) |
| 55 to 59 Years | 15 (53.6%) | 3 (20.0%) |
| 60 to 64 Years | 27 (30.0%) | 0 (0.0%) |
| 65 to 74 Years | 30 (9.1%) | 0 (0.0%) |
| 75 Years and over | 15 (4.7%) | 0 (0.0%) |
| Total | 646 (40.4%) | 85 (13.2%) |
Employment Status by Educational Attainment in Canyonville
According to labor force statistics for Canyonville, 66.7% of individuals (503) out of the total population between 25 and 64 years of age (754) are in the labor force, with 14.5% or 73 of them being unemployed. The group with the highest labor force participation rate are those with the educational attainment of college / associate degree, with 81.3% or 191 individuals in the labor force. Within the labor force, individuals with college / associate degree education have the highest percentage of unemployment, with 24.1% or 46 of them being unemployed.
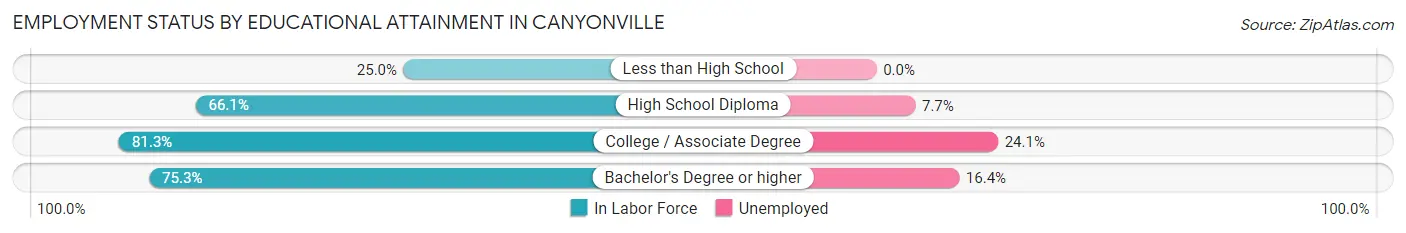
| Educational Attainment | In Labor Force | Unemployed |
| Less than High School | 23 (25.0%) | 0 (0.0%) |
| High School Diploma | 234 (66.1%) | 27 (7.7%) |
| College / Associate Degree | 191 (81.3%) | 57 (24.1%) |
| Bachelor's Degree or higher | 55 (75.3%) | 12 (16.4%) |
| Total | 503 (66.7%) | 109 (14.5%) |
Employment Occupations by Sex in Canyonville
Management, Business, Science and Arts Occupations
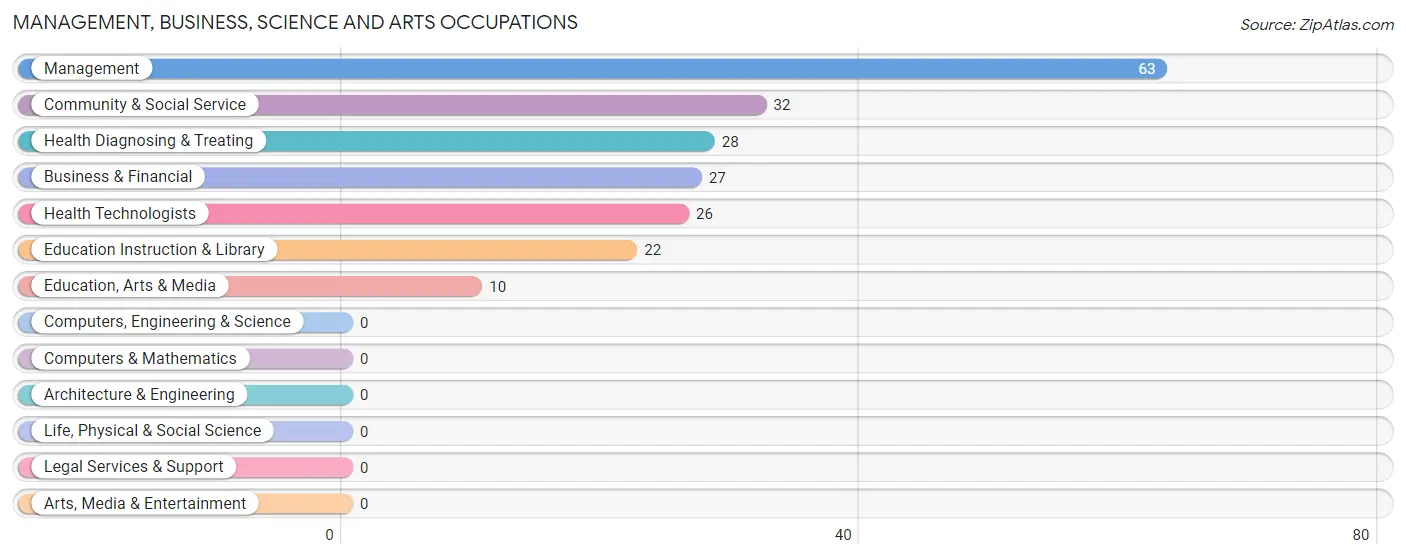
The most common Management, Business, Science and Arts occupations in Canyonville are Management (63 | 11.2%), Community & Social Service (32 | 5.7%), Health Diagnosing & Treating (28 | 5.0%), Business & Financial (27 | 4.8%), and Health Technologists (26 | 4.6%).
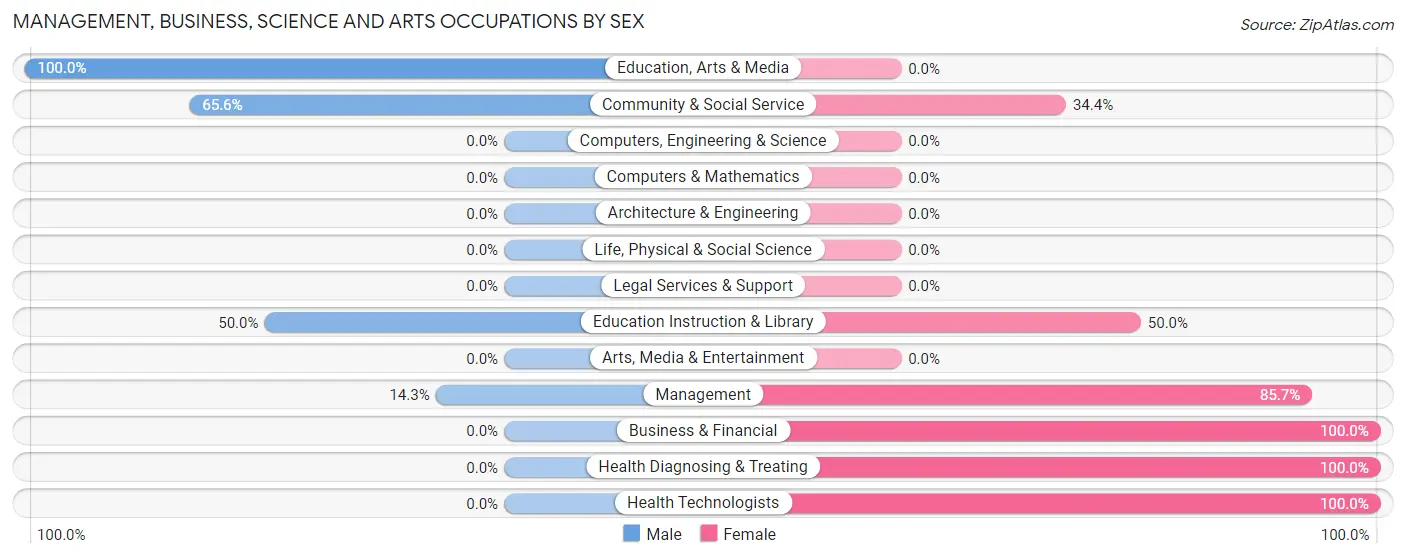
Management, Business, Science and Arts Occupations by Sex
Within the Management, Business, Science and Arts occupations in Canyonville, the most male-oriented occupations are Education, Arts & Media (100.0%), Community & Social Service (65.6%), and Education Instruction & Library (50.0%), while the most female-oriented occupations are Business & Financial (100.0%), Health Diagnosing & Treating (100.0%), and Health Technologists (100.0%).
| Occupation | Male | Female |
| Management | 9 (14.3%) | 54 (85.7%) |
| Business & Financial | 0 (0.0%) | 27 (100.0%) |
| Computers, Engineering & Science | 0 (0.0%) | 0 (0.0%) |
| Computers & Mathematics | 0 (0.0%) | 0 (0.0%) |
| Architecture & Engineering | 0 (0.0%) | 0 (0.0%) |
| Life, Physical & Social Science | 0 (0.0%) | 0 (0.0%) |
| Community & Social Service | 21 (65.6%) | 11 (34.4%) |
| Education, Arts & Media | 10 (100.0%) | 0 (0.0%) |
| Legal Services & Support | 0 (0.0%) | 0 (0.0%) |
| Education Instruction & Library | 11 (50.0%) | 11 (50.0%) |
| Arts, Media & Entertainment | 0 (0.0%) | 0 (0.0%) |
| Health Diagnosing & Treating | 0 (0.0%) | 28 (100.0%) |
| Health Technologists | 0 (0.0%) | 26 (100.0%) |
| Total (Category) | 30 (20.0%) | 120 (80.0%) |
| Total (Overall) | 235 (41.9%) | 326 (58.1%) |
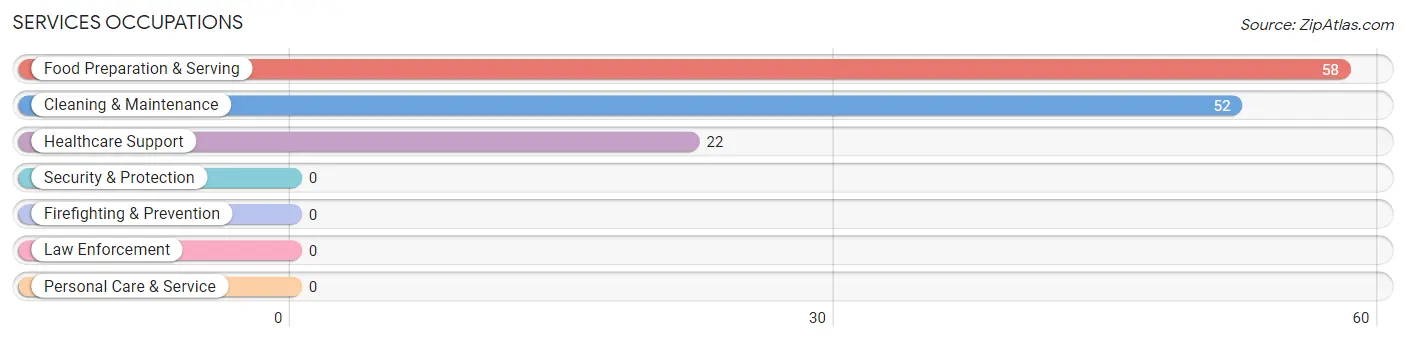
Services Occupations
The most common Services occupations in Canyonville are Food Preparation & Serving (58 | 10.3%), Cleaning & Maintenance (52 | 9.3%), and Healthcare Support (22 | 3.9%).
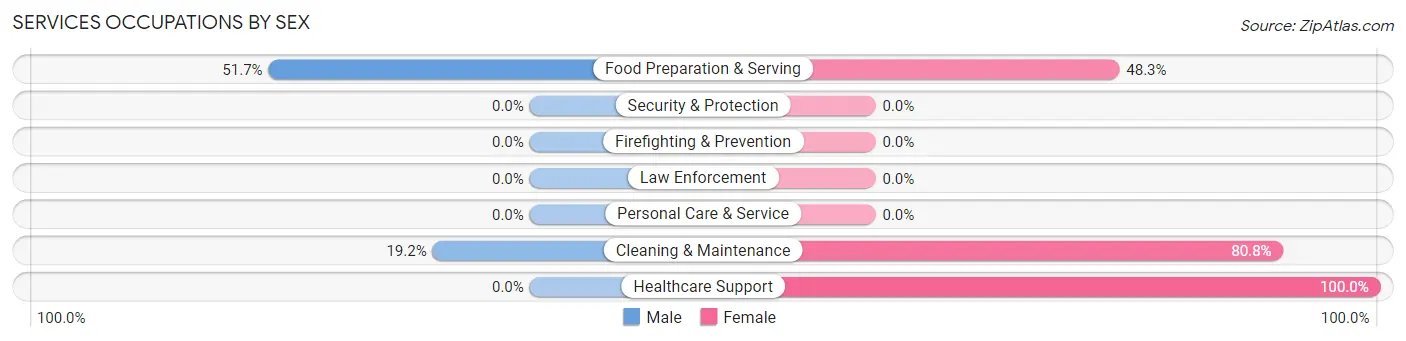
Services Occupations by Sex
Within the Services occupations in Canyonville, the most male-oriented occupations are Food Preparation & Serving (51.7%), and Cleaning & Maintenance (19.2%), while the most female-oriented occupations are Healthcare Support (100.0%), Cleaning & Maintenance (80.8%), and Food Preparation & Serving (48.3%).
| Occupation | Male | Female |
| Healthcare Support | 0 (0.0%) | 22 (100.0%) |
| Security & Protection | 0 (0.0%) | 0 (0.0%) |
| Firefighting & Prevention | 0 (0.0%) | 0 (0.0%) |
| Law Enforcement | 0 (0.0%) | 0 (0.0%) |
| Food Preparation & Serving | 30 (51.7%) | 28 (48.3%) |
| Cleaning & Maintenance | 10 (19.2%) | 42 (80.8%) |
| Personal Care & Service | 0 (0.0%) | 0 (0.0%) |
| Total (Category) | 40 (30.3%) | 92 (69.7%) |
| Total (Overall) | 235 (41.9%) | 326 (58.1%) |
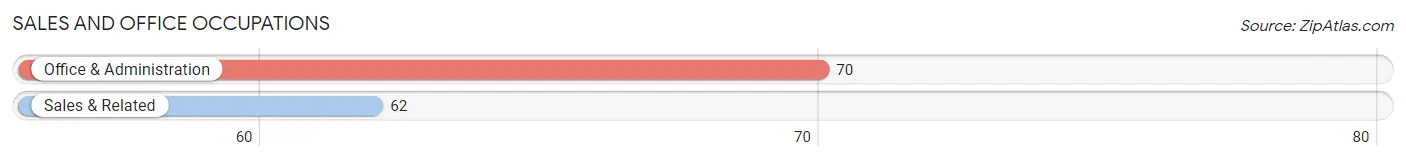
Sales and Office Occupations
The most common Sales and Office occupations in Canyonville are Office & Administration (70 | 12.5%), and Sales & Related (62 | 11.1%).
Sales and Office Occupations by Sex
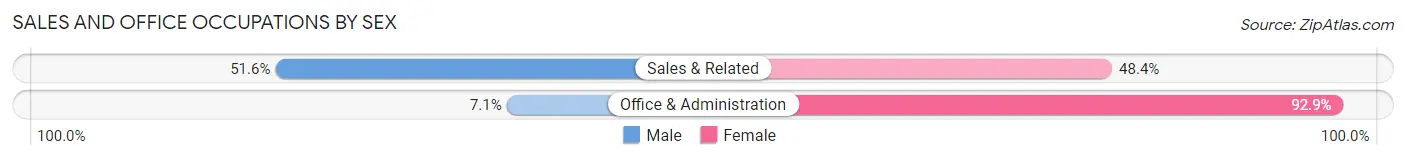
| Occupation | Male | Female |
| Sales & Related | 32 (51.6%) | 30 (48.4%) |
| Office & Administration | 5 (7.1%) | 65 (92.9%) |
| Total (Category) | 37 (28.0%) | 95 (72.0%) |
| Total (Overall) | 235 (41.9%) | 326 (58.1%) |
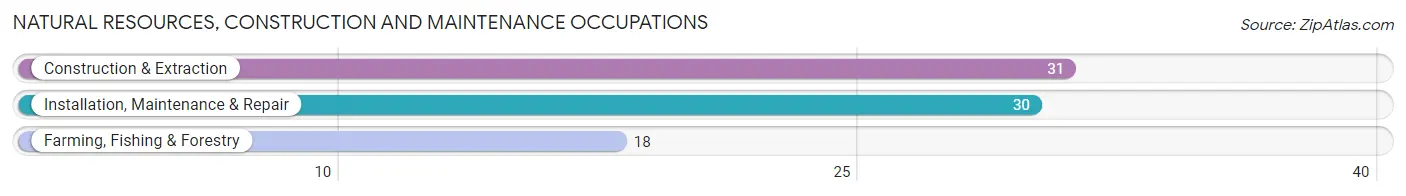
Natural Resources, Construction and Maintenance Occupations
The most common Natural Resources, Construction and Maintenance occupations in Canyonville are Construction & Extraction (31 | 5.5%), Installation, Maintenance & Repair (30 | 5.3%), and Farming, Fishing & Forestry (18 | 3.2%).
Natural Resources, Construction and Maintenance Occupations by Sex
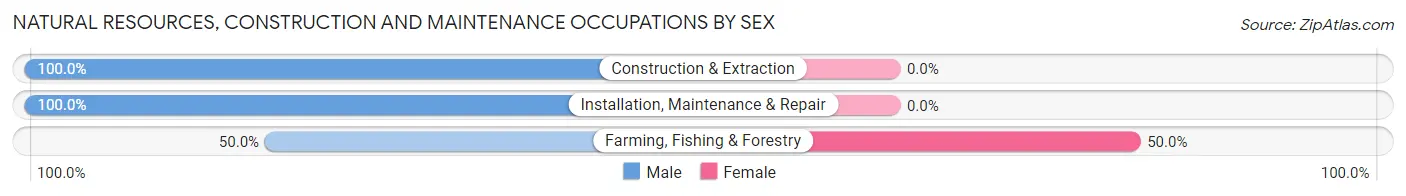
| Occupation | Male | Female |
| Farming, Fishing & Forestry | 9 (50.0%) | 9 (50.0%) |
| Construction & Extraction | 31 (100.0%) | 0 (0.0%) |
| Installation, Maintenance & Repair | 30 (100.0%) | 0 (0.0%) |
| Total (Category) | 70 (88.6%) | 9 (11.4%) |
| Total (Overall) | 235 (41.9%) | 326 (58.1%) |
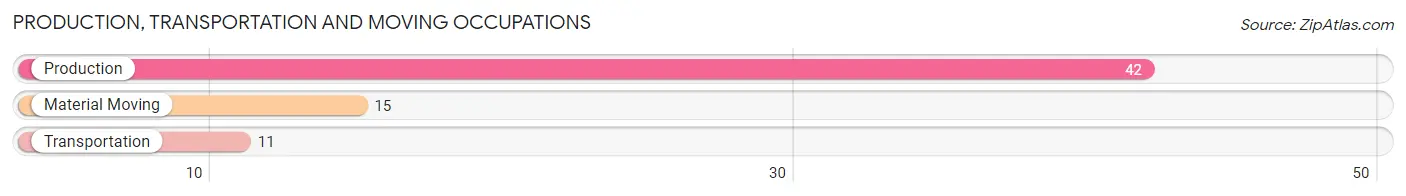
Production, Transportation and Moving Occupations
The most common Production, Transportation and Moving occupations in Canyonville are Production (42 | 7.5%), Material Moving (15 | 2.7%), and Transportation (11 | 2.0%).
Production, Transportation and Moving Occupations by Sex
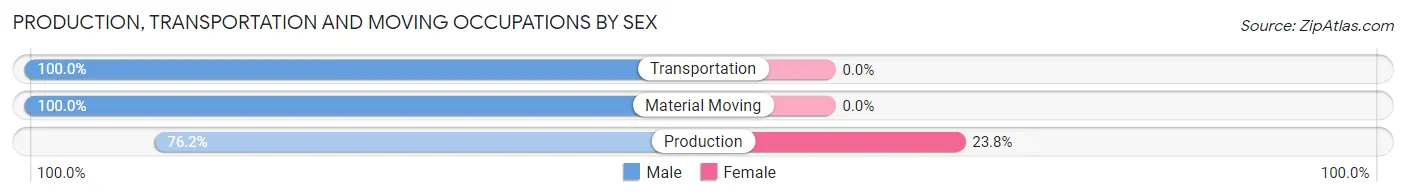
| Occupation | Male | Female |
| Production | 32 (76.2%) | 10 (23.8%) |
| Transportation | 11 (100.0%) | 0 (0.0%) |
| Material Moving | 15 (100.0%) | 0 (0.0%) |
| Total (Category) | 58 (85.3%) | 10 (14.7%) |
| Total (Overall) | 235 (41.9%) | 326 (58.1%) |
Employment Industries by Sex in Canyonville
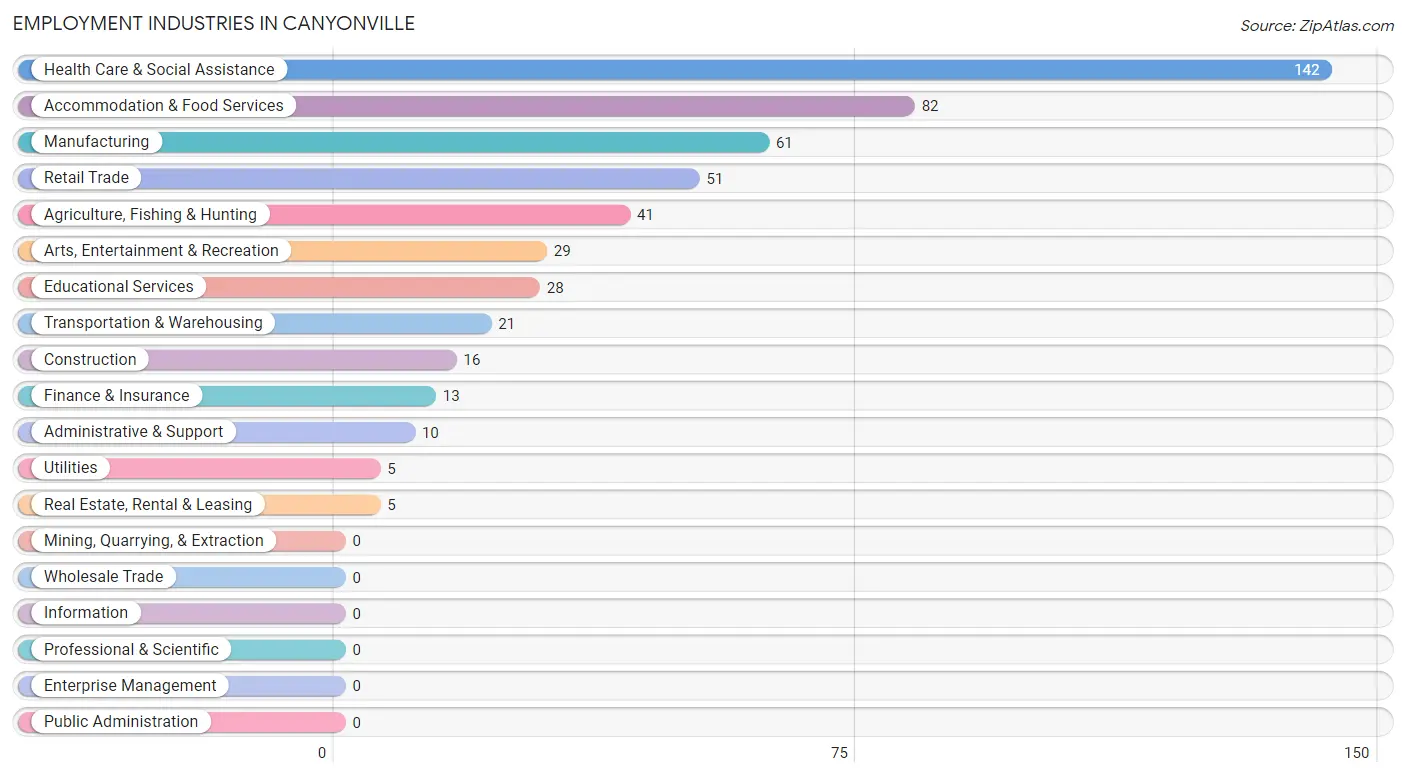
Employment Industries in Canyonville
The major employment industries in Canyonville include Health Care & Social Assistance (142 | 25.3%), Accommodation & Food Services (82 | 14.6%), Manufacturing (61 | 10.9%), Retail Trade (51 | 9.1%), and Agriculture, Fishing & Hunting (41 | 7.3%).
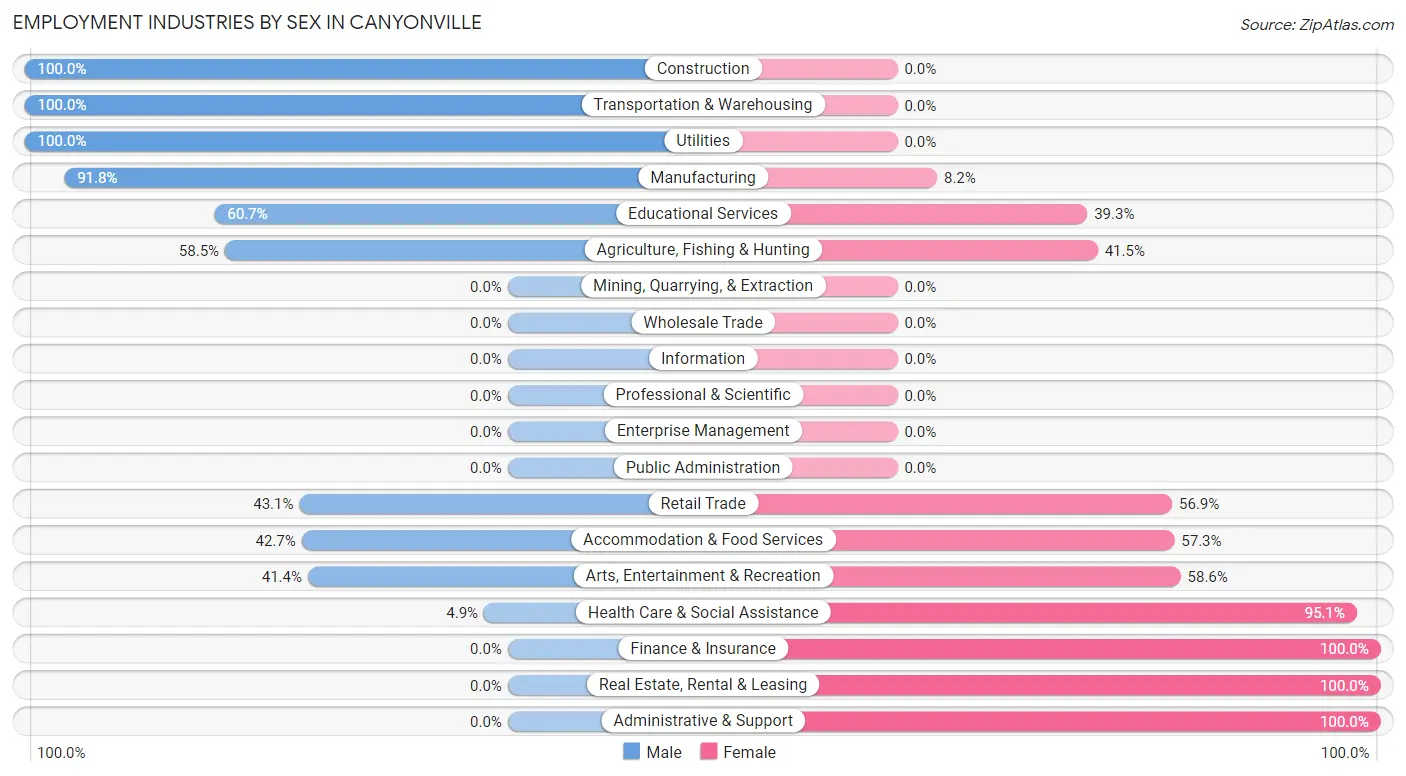
Employment Industries by Sex in Canyonville
The Canyonville industries that see more men than women are Construction (100.0%), Transportation & Warehousing (100.0%), and Utilities (100.0%), whereas the industries that tend to have a higher number of women are Finance & Insurance (100.0%), Real Estate, Rental & Leasing (100.0%), and Administrative & Support (100.0%).
| Industry | Male | Female |
| Agriculture, Fishing & Hunting | 24 (58.5%) | 17 (41.5%) |
| Mining, Quarrying, & Extraction | 0 (0.0%) | 0 (0.0%) |
| Construction | 16 (100.0%) | 0 (0.0%) |
| Manufacturing | 56 (91.8%) | 5 (8.2%) |
| Wholesale Trade | 0 (0.0%) | 0 (0.0%) |
| Retail Trade | 22 (43.1%) | 29 (56.9%) |
| Transportation & Warehousing | 21 (100.0%) | 0 (0.0%) |
| Utilities | 5 (100.0%) | 0 (0.0%) |
| Information | 0 (0.0%) | 0 (0.0%) |
| Finance & Insurance | 0 (0.0%) | 13 (100.0%) |
| Real Estate, Rental & Leasing | 0 (0.0%) | 5 (100.0%) |
| Professional & Scientific | 0 (0.0%) | 0 (0.0%) |
| Enterprise Management | 0 (0.0%) | 0 (0.0%) |
| Administrative & Support | 0 (0.0%) | 10 (100.0%) |
| Educational Services | 17 (60.7%) | 11 (39.3%) |
| Health Care & Social Assistance | 7 (4.9%) | 135 (95.1%) |
| Arts, Entertainment & Recreation | 12 (41.4%) | 17 (58.6%) |
| Accommodation & Food Services | 35 (42.7%) | 47 (57.3%) |
| Public Administration | 0 (0.0%) | 0 (0.0%) |
| Total | 235 (41.9%) | 326 (58.1%) |
Education in Canyonville
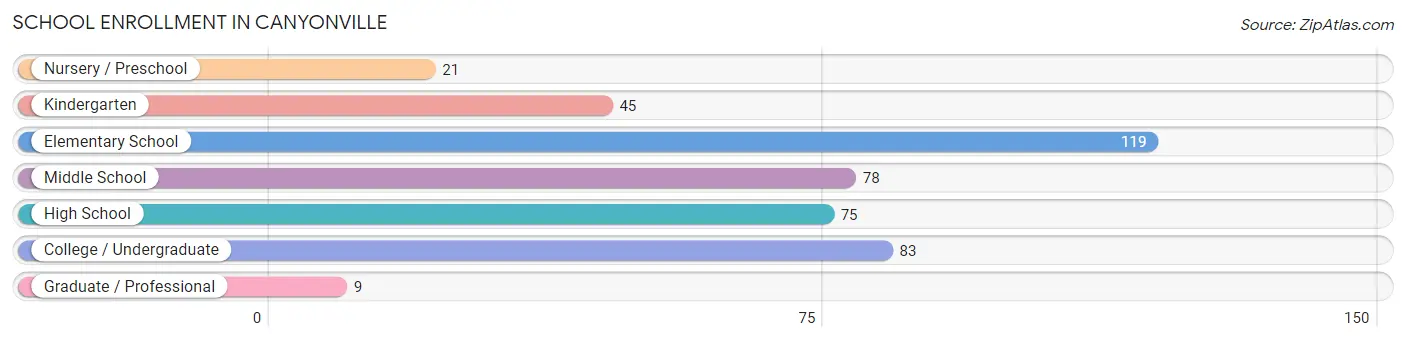
School Enrollment in Canyonville
The most common levels of schooling among the 430 students in Canyonville are elementary school (119 | 27.7%), college / undergraduate (83 | 19.3%), and middle school (78 | 18.1%).
| School Level | # Students | % Students |
| Nursery / Preschool | 21 | 4.9% |
| Kindergarten | 45 | 10.5% |
| Elementary School | 119 | 27.7% |
| Middle School | 78 | 18.1% |
| High School | 75 | 17.4% |
| College / Undergraduate | 83 | 19.3% |
| Graduate / Professional | 9 | 2.1% |
| Total | 430 | 100.0% |
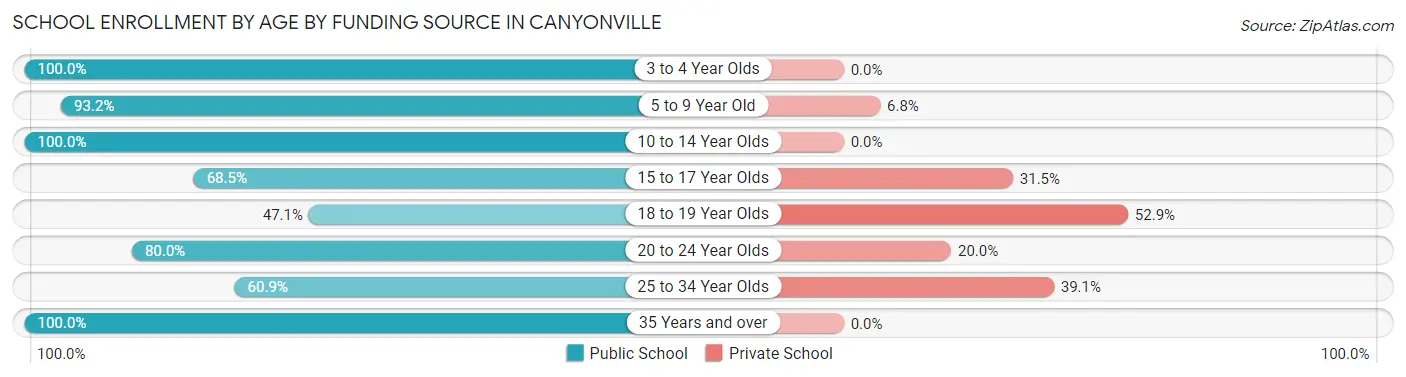
School Enrollment by Age by Funding Source in Canyonville
Out of a total of 430 students who are enrolled in schools in Canyonville, 67 (15.6%) attend a private institution, while the remaining 363 (84.4%) are enrolled in public schools. The age group of 18 to 19 year olds has the highest likelihood of being enrolled in private schools, with 18 (52.9% in the age bracket) enrolled. Conversely, the age group of 3 to 4 year olds has the lowest likelihood of being enrolled in a private school, with 12 (100.0% in the age bracket) attending a public institution.
| Age Bracket | Public School | Private School |
| 3 to 4 Year Olds | 12 (100.0%) | 0 (0.0%) |
| 5 to 9 Year Old | 151 (93.2%) | 11 (6.8%) |
| 10 to 14 Year Olds | 89 (100.0%) | 0 (0.0%) |
| 15 to 17 Year Olds | 50 (68.5%) | 23 (31.5%) |
| 18 to 19 Year Olds | 16 (47.1%) | 18 (52.9%) |
| 20 to 24 Year Olds | 24 (80.0%) | 6 (20.0%) |
| 25 to 34 Year Olds | 14 (60.9%) | 9 (39.1%) |
| 35 Years and over | 7 (100.0%) | 0 (0.0%) |
| Total | 363 (84.4%) | 67 (15.6%) |
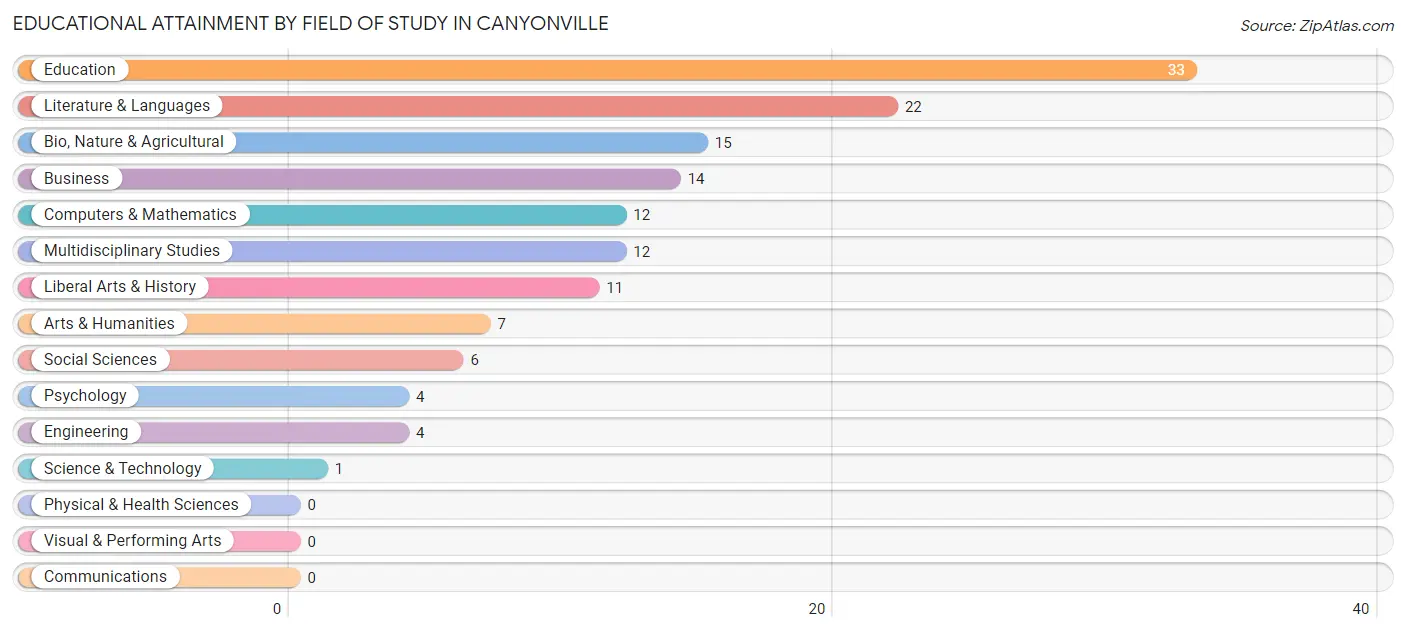
Educational Attainment by Field of Study in Canyonville
Education (33 | 23.4%), literature & languages (22 | 15.6%), bio, nature & agricultural (15 | 10.6%), business (14 | 9.9%), and computers & mathematics (12 | 8.5%) are the most common fields of study among 141 individuals in Canyonville who have obtained a bachelor's degree or higher.
| Field of Study | # Graduates | % Graduates |
| Computers & Mathematics | 12 | 8.5% |
| Bio, Nature & Agricultural | 15 | 10.6% |
| Physical & Health Sciences | 0 | 0.0% |
| Psychology | 4 | 2.8% |
| Social Sciences | 6 | 4.3% |
| Engineering | 4 | 2.8% |
| Multidisciplinary Studies | 12 | 8.5% |
| Science & Technology | 1 | 0.7% |
| Business | 14 | 9.9% |
| Education | 33 | 23.4% |
| Literature & Languages | 22 | 15.6% |
| Liberal Arts & History | 11 | 7.8% |
| Visual & Performing Arts | 0 | 0.0% |
| Communications | 0 | 0.0% |
| Arts & Humanities | 7 | 5.0% |
| Total | 141 | 100.0% |
Transportation & Commute in Canyonville
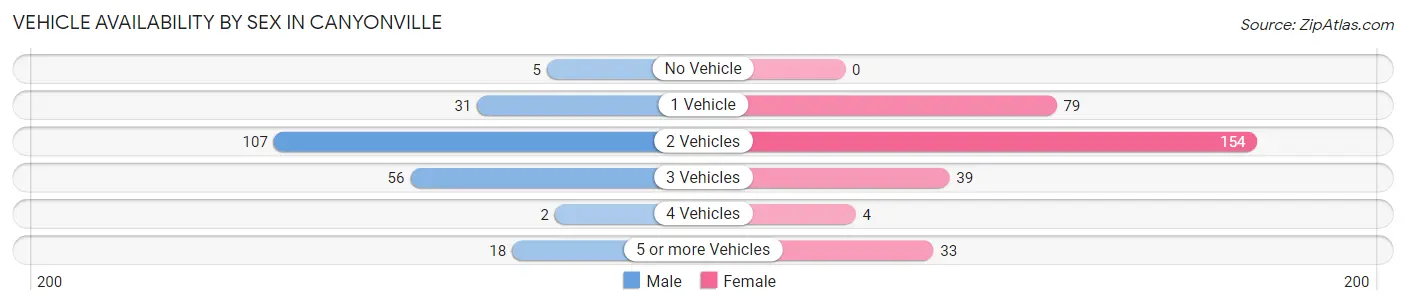
Vehicle Availability by Sex in Canyonville
The most prevalent vehicle ownership categories in Canyonville are males with 2 vehicles (107, accounting for 48.9%) and females with 2 vehicles (154, making up 34.6%).
| Vehicles Available | Male | Female |
| No Vehicle | 5 (2.3%) | 0 (0.0%) |
| 1 Vehicle | 31 (14.2%) | 79 (25.6%) |
| 2 Vehicles | 107 (48.9%) | 154 (49.8%) |
| 3 Vehicles | 56 (25.6%) | 39 (12.6%) |
| 4 Vehicles | 2 (0.9%) | 4 (1.3%) |
| 5 or more Vehicles | 18 (8.2%) | 33 (10.7%) |
| Total | 219 (100.0%) | 309 (100.0%) |
Commute Time in Canyonville
The most frequently occuring commute durations in Canyonville are 15 to 19 minutes (97 commuters, 18.6%), 10 to 14 minutes (91 commuters, 17.5%), and 30 to 34 minutes (75 commuters, 14.4%).
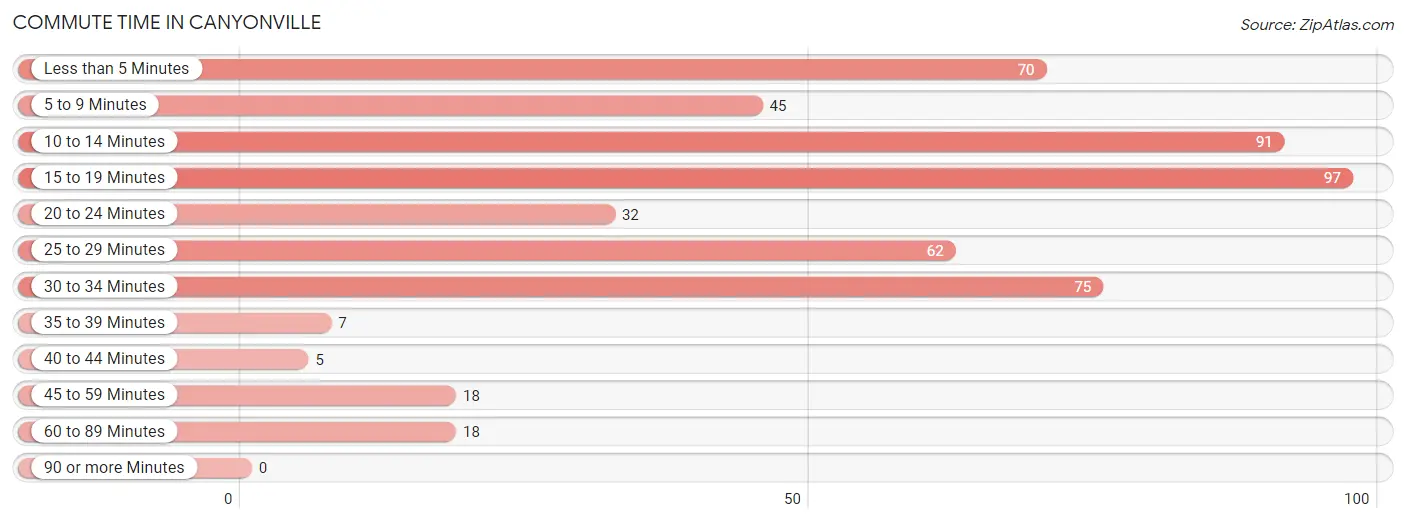
| Commute Time | # Commuters | % Commuters |
| Less than 5 Minutes | 70 | 13.5% |
| 5 to 9 Minutes | 45 | 8.6% |
| 10 to 14 Minutes | 91 | 17.5% |
| 15 to 19 Minutes | 97 | 18.6% |
| 20 to 24 Minutes | 32 | 6.1% |
| 25 to 29 Minutes | 62 | 11.9% |
| 30 to 34 Minutes | 75 | 14.4% |
| 35 to 39 Minutes | 7 | 1.3% |
| 40 to 44 Minutes | 5 | 1.0% |
| 45 to 59 Minutes | 18 | 3.5% |
| 60 to 89 Minutes | 18 | 3.5% |
| 90 or more Minutes | 0 | 0.0% |
Commute Time by Sex in Canyonville
The most common commute times in Canyonville are 15 to 19 minutes (50 commuters, 21.3%) for males and 25 to 29 minutes (56 commuters, 19.7%) for females.
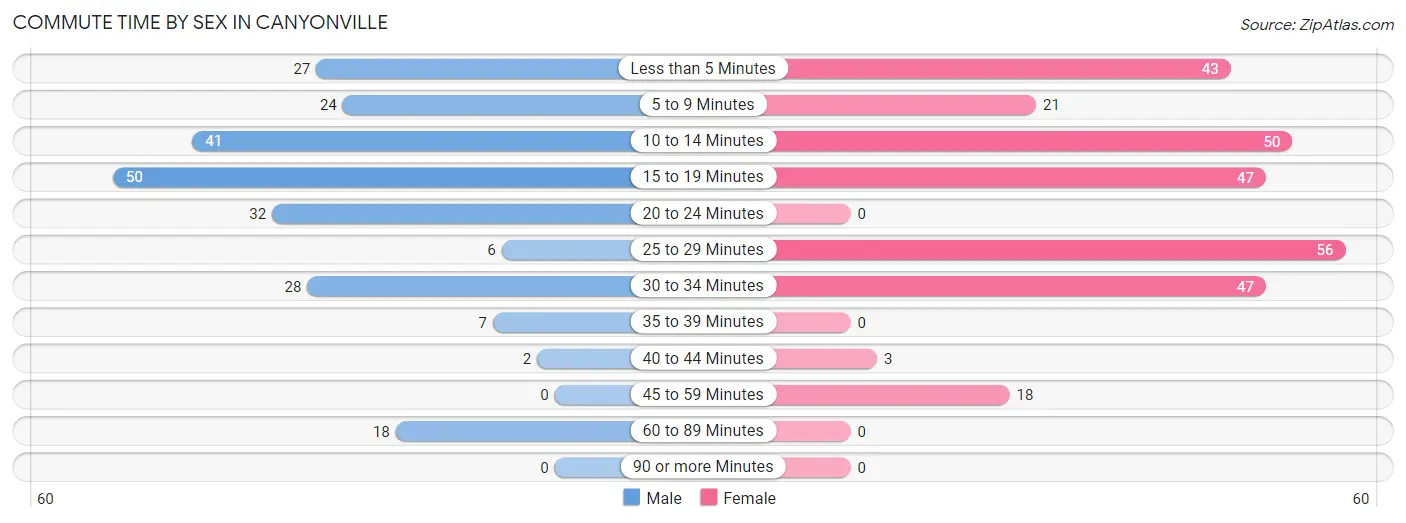
| Commute Time | Male | Female |
| Less than 5 Minutes | 27 (11.5%) | 43 (15.1%) |
| 5 to 9 Minutes | 24 (10.2%) | 21 (7.4%) |
| 10 to 14 Minutes | 41 (17.4%) | 50 (17.5%) |
| 15 to 19 Minutes | 50 (21.3%) | 47 (16.5%) |
| 20 to 24 Minutes | 32 (13.6%) | 0 (0.0%) |
| 25 to 29 Minutes | 6 (2.5%) | 56 (19.7%) |
| 30 to 34 Minutes | 28 (11.9%) | 47 (16.5%) |
| 35 to 39 Minutes | 7 (3.0%) | 0 (0.0%) |
| 40 to 44 Minutes | 2 (0.9%) | 3 (1.1%) |
| 45 to 59 Minutes | 0 (0.0%) | 18 (6.3%) |
| 60 to 89 Minutes | 18 (7.7%) | 0 (0.0%) |
| 90 or more Minutes | 0 (0.0%) | 0 (0.0%) |
Time of Departure to Work by Sex in Canyonville
The most frequent times of departure to work in Canyonville are 12:00 AM to 4:59 AM (48, 20.4%) for males and 7:00 AM to 7:29 AM (76, 26.7%) for females.
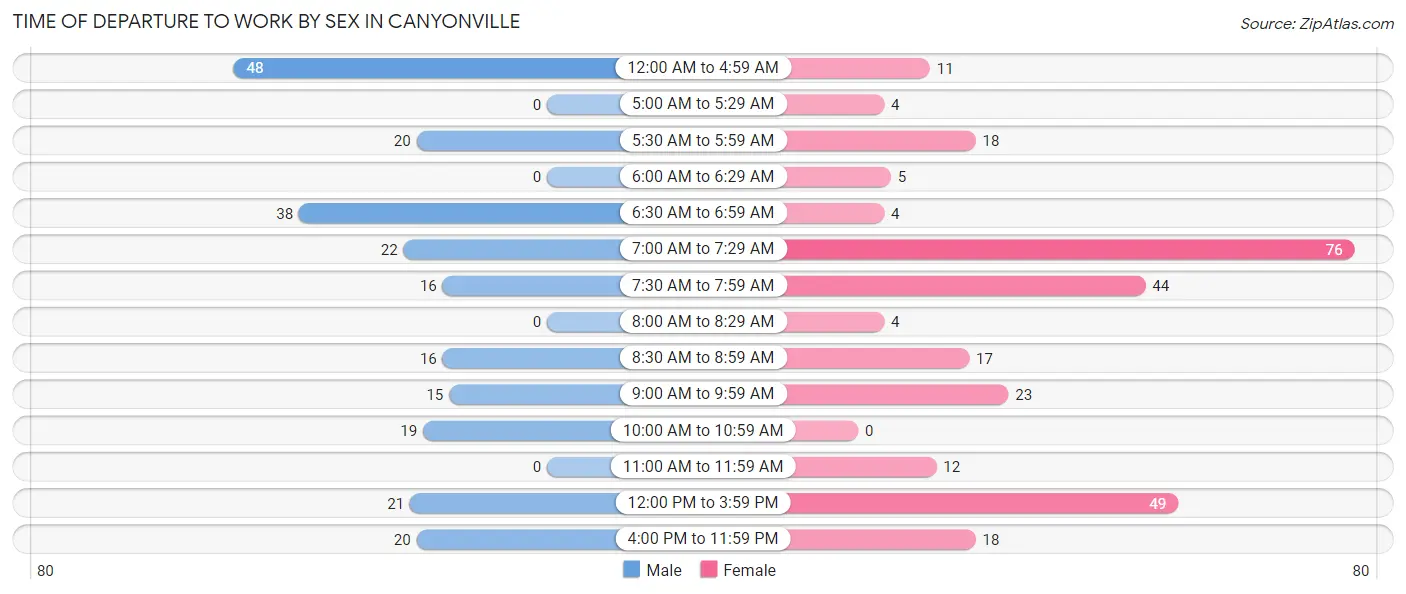
| Time of Departure | Male | Female |
| 12:00 AM to 4:59 AM | 48 (20.4%) | 11 (3.9%) |
| 5:00 AM to 5:29 AM | 0 (0.0%) | 4 (1.4%) |
| 5:30 AM to 5:59 AM | 20 (8.5%) | 18 (6.3%) |
| 6:00 AM to 6:29 AM | 0 (0.0%) | 5 (1.8%) |
| 6:30 AM to 6:59 AM | 38 (16.2%) | 4 (1.4%) |
| 7:00 AM to 7:29 AM | 22 (9.4%) | 76 (26.7%) |
| 7:30 AM to 7:59 AM | 16 (6.8%) | 44 (15.4%) |
| 8:00 AM to 8:29 AM | 0 (0.0%) | 4 (1.4%) |
| 8:30 AM to 8:59 AM | 16 (6.8%) | 17 (6.0%) |
| 9:00 AM to 9:59 AM | 15 (6.4%) | 23 (8.1%) |
| 10:00 AM to 10:59 AM | 19 (8.1%) | 0 (0.0%) |
| 11:00 AM to 11:59 AM | 0 (0.0%) | 12 (4.2%) |
| 12:00 PM to 3:59 PM | 21 (8.9%) | 49 (17.2%) |
| 4:00 PM to 11:59 PM | 20 (8.5%) | 18 (6.3%) |
| Total | 235 (100.0%) | 285 (100.0%) |
Housing Occupancy in Canyonville
Occupancy by Ownership in Canyonville
Of the total 877 dwellings in Canyonville, owner-occupied units account for 542 (61.8%), while renter-occupied units make up 335 (38.2%).
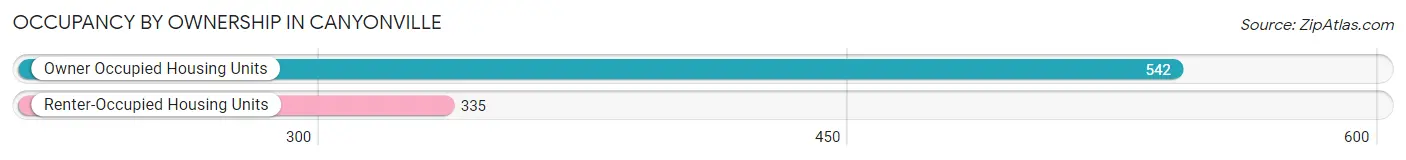
| Occupancy | # Housing Units | % Housing Units |
| Owner Occupied Housing Units | 542 | 61.8% |
| Renter-Occupied Housing Units | 335 | 38.2% |
| Total Occupied Housing Units | 877 | 100.0% |
Occupancy by Household Size in Canyonville
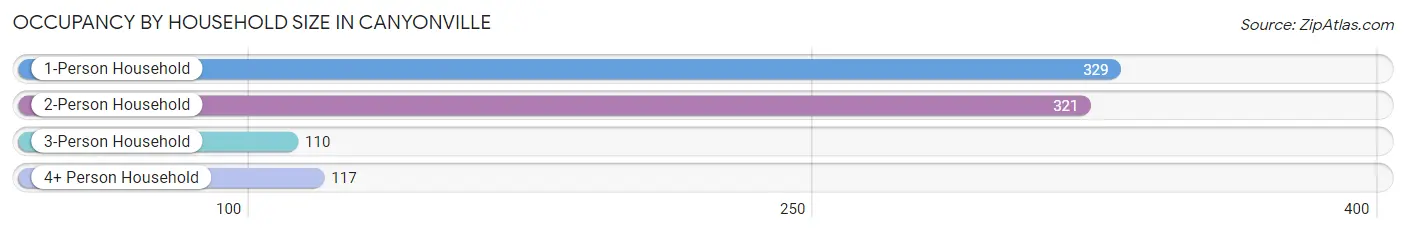
| Household Size | # Housing Units | % Housing Units |
| 1-Person Household | 329 | 37.5% |
| 2-Person Household | 321 | 36.6% |
| 3-Person Household | 110 | 12.5% |
| 4+ Person Household | 117 | 13.3% |
| Total Housing Units | 877 | 100.0% |
Occupancy by Ownership by Household Size in Canyonville
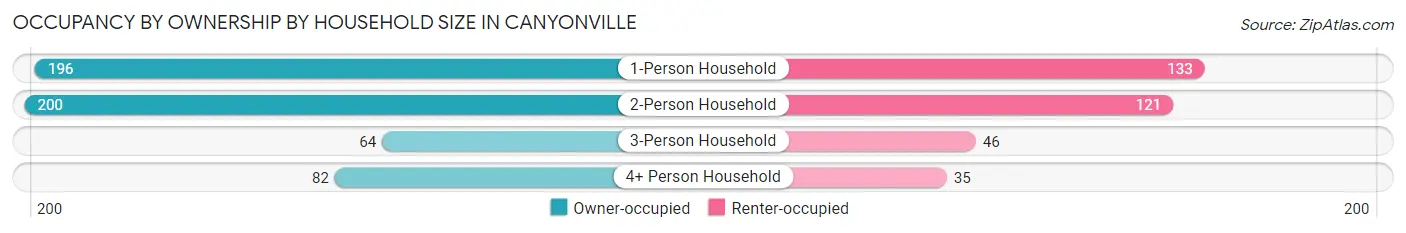
| Household Size | Owner-occupied | Renter-occupied |
| 1-Person Household | 196 (59.6%) | 133 (40.4%) |
| 2-Person Household | 200 (62.3%) | 121 (37.7%) |
| 3-Person Household | 64 (58.2%) | 46 (41.8%) |
| 4+ Person Household | 82 (70.1%) | 35 (29.9%) |
| Total Housing Units | 542 (61.8%) | 335 (38.2%) |
Occupancy by Educational Attainment in Canyonville
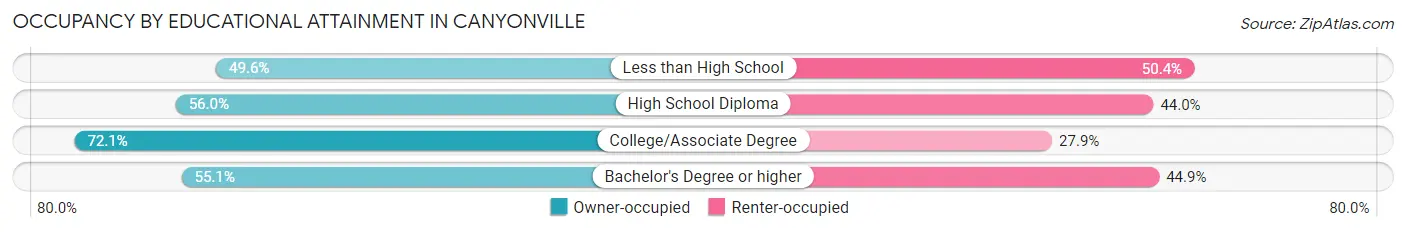
| Household Size | Owner-occupied | Renter-occupied |
| Less than High School | 63 (49.6%) | 64 (50.4%) |
| High School Diploma | 186 (56.0%) | 146 (44.0%) |
| College/Associate Degree | 266 (72.1%) | 103 (27.9%) |
| Bachelor's Degree or higher | 27 (55.1%) | 22 (44.9%) |
Occupancy by Age of Householder in Canyonville
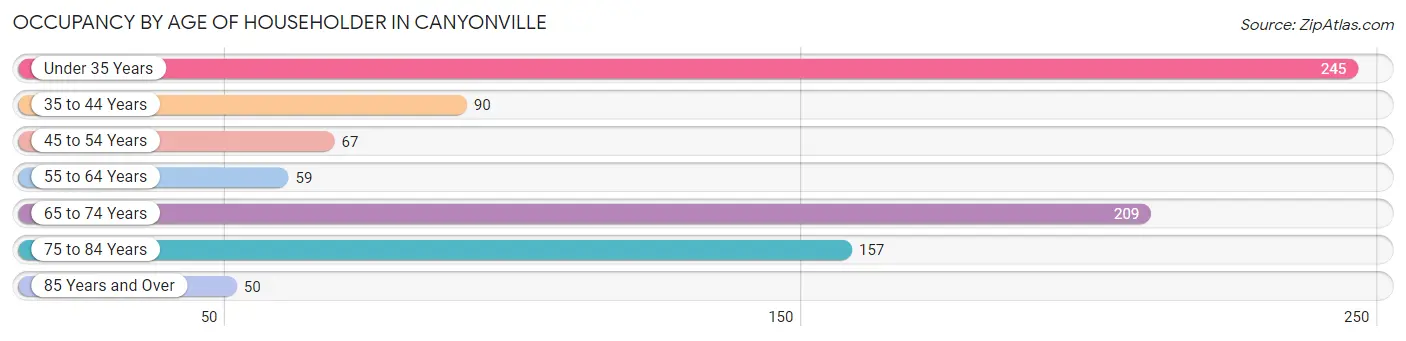
| Age Bracket | # Households | % Households |
| Under 35 Years | 245 | 27.9% |
| 35 to 44 Years | 90 | 10.3% |
| 45 to 54 Years | 67 | 7.6% |
| 55 to 64 Years | 59 | 6.7% |
| 65 to 74 Years | 209 | 23.8% |
| 75 to 84 Years | 157 | 17.9% |
| 85 Years and Over | 50 | 5.7% |
| Total | 877 | 100.0% |
Housing Finances in Canyonville
Median Income by Occupancy in Canyonville
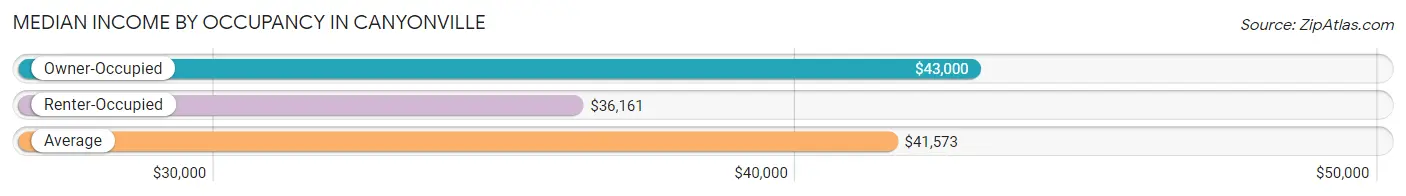
| Occupancy Type | # Households | Median Income |
| Owner-Occupied | 542 (61.8%) | $43,000 |
| Renter-Occupied | 335 (38.2%) | $36,161 |
| Average | 877 (100.0%) | $41,573 |
Occupancy by Householder Income Bracket in Canyonville
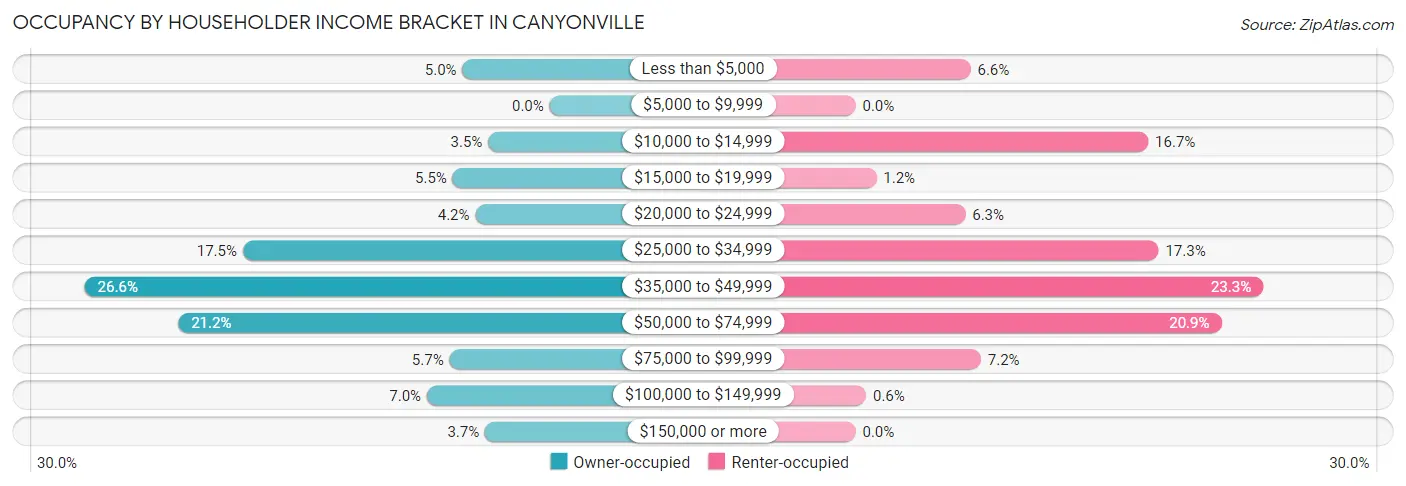
| Income Bracket | Owner-occupied | Renter-occupied |
| Less than $5,000 | 27 (5.0%) | 22 (6.6%) |
| $5,000 to $9,999 | 0 (0.0%) | 0 (0.0%) |
| $10,000 to $14,999 | 19 (3.5%) | 56 (16.7%) |
| $15,000 to $19,999 | 30 (5.5%) | 4 (1.2%) |
| $20,000 to $24,999 | 23 (4.2%) | 21 (6.3%) |
| $25,000 to $34,999 | 95 (17.5%) | 58 (17.3%) |
| $35,000 to $49,999 | 144 (26.6%) | 78 (23.3%) |
| $50,000 to $74,999 | 115 (21.2%) | 70 (20.9%) |
| $75,000 to $99,999 | 31 (5.7%) | 24 (7.2%) |
| $100,000 to $149,999 | 38 (7.0%) | 2 (0.6%) |
| $150,000 or more | 20 (3.7%) | 0 (0.0%) |
| Total | 542 (100.0%) | 335 (100.0%) |
Monthly Housing Cost Tiers in Canyonville
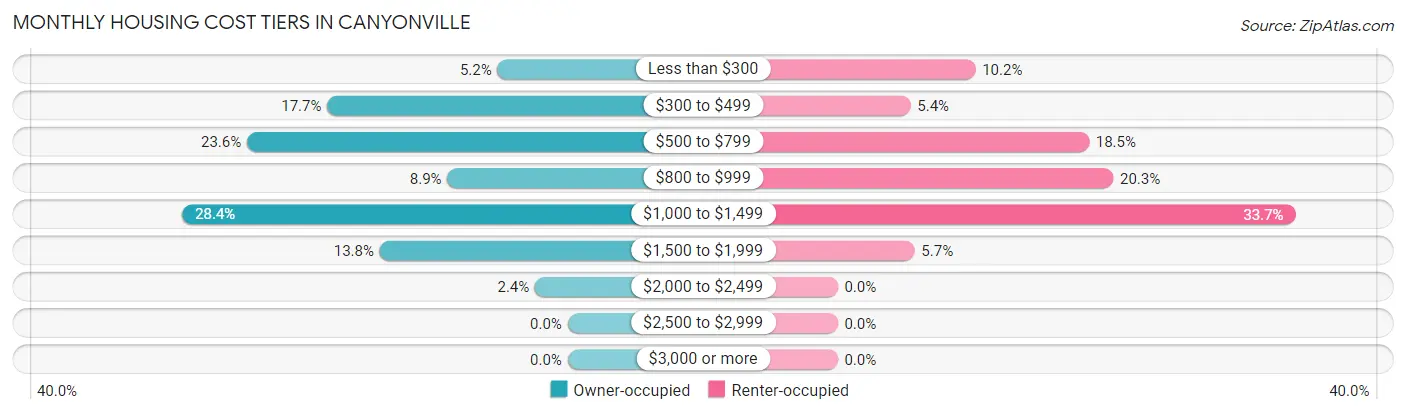
| Monthly Cost | Owner-occupied | Renter-occupied |
| Less than $300 | 28 (5.2%) | 34 (10.2%) |
| $300 to $499 | 96 (17.7%) | 18 (5.4%) |
| $500 to $799 | 128 (23.6%) | 62 (18.5%) |
| $800 to $999 | 48 (8.9%) | 68 (20.3%) |
| $1,000 to $1,499 | 154 (28.4%) | 113 (33.7%) |
| $1,500 to $1,999 | 75 (13.8%) | 19 (5.7%) |
| $2,000 to $2,499 | 13 (2.4%) | 0 (0.0%) |
| $2,500 to $2,999 | 0 (0.0%) | 0 (0.0%) |
| $3,000 or more | 0 (0.0%) | 0 (0.0%) |
| Total | 542 (100.0%) | 335 (100.0%) |
Physical Housing Characteristics in Canyonville
Housing Structures in Canyonville
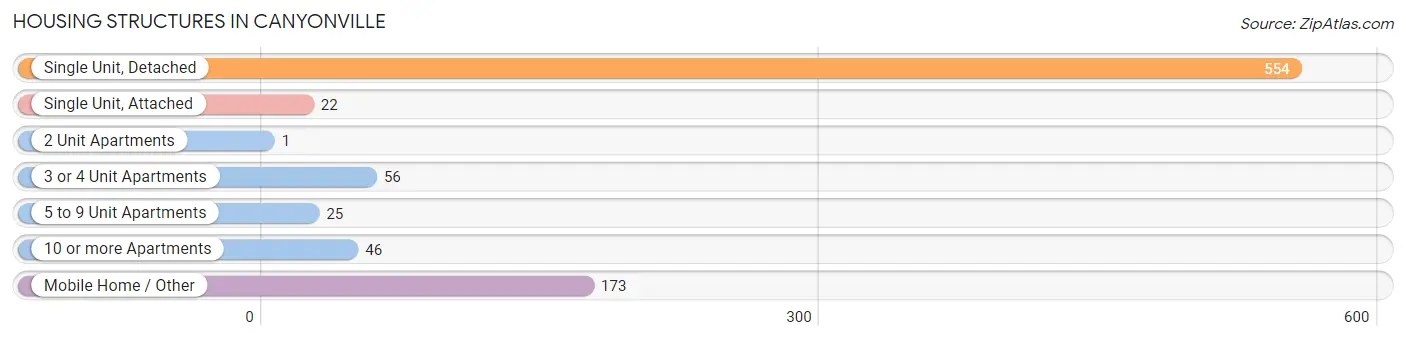
| Structure Type | # Housing Units | % Housing Units |
| Single Unit, Detached | 554 | 63.2% |
| Single Unit, Attached | 22 | 2.5% |
| 2 Unit Apartments | 1 | 0.1% |
| 3 or 4 Unit Apartments | 56 | 6.4% |
| 5 to 9 Unit Apartments | 25 | 2.9% |
| 10 or more Apartments | 46 | 5.2% |
| Mobile Home / Other | 173 | 19.7% |
| Total | 877 | 100.0% |
Housing Structures by Occupancy in Canyonville
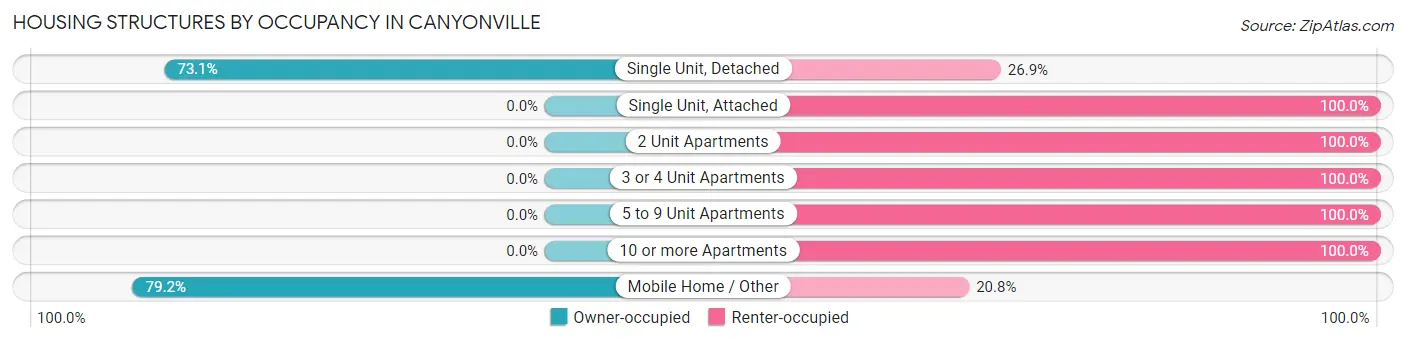
| Structure Type | Owner-occupied | Renter-occupied |
| Single Unit, Detached | 405 (73.1%) | 149 (26.9%) |
| Single Unit, Attached | 0 (0.0%) | 22 (100.0%) |
| 2 Unit Apartments | 0 (0.0%) | 1 (100.0%) |
| 3 or 4 Unit Apartments | 0 (0.0%) | 56 (100.0%) |
| 5 to 9 Unit Apartments | 0 (0.0%) | 25 (100.0%) |
| 10 or more Apartments | 0 (0.0%) | 46 (100.0%) |
| Mobile Home / Other | 137 (79.2%) | 36 (20.8%) |
| Total | 542 (61.8%) | 335 (38.2%) |
Housing Structures by Number of Rooms in Canyonville
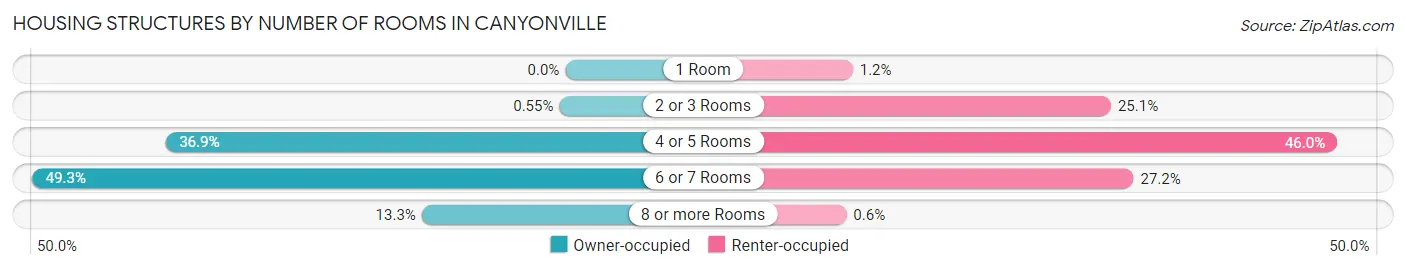
| Number of Rooms | Owner-occupied | Renter-occupied |
| 1 Room | 0 (0.0%) | 4 (1.2%) |
| 2 or 3 Rooms | 3 (0.5%) | 84 (25.1%) |
| 4 or 5 Rooms | 200 (36.9%) | 154 (46.0%) |
| 6 or 7 Rooms | 267 (49.3%) | 91 (27.2%) |
| 8 or more Rooms | 72 (13.3%) | 2 (0.6%) |
| Total | 542 (100.0%) | 335 (100.0%) |
Housing Structure by Heating Type in Canyonville
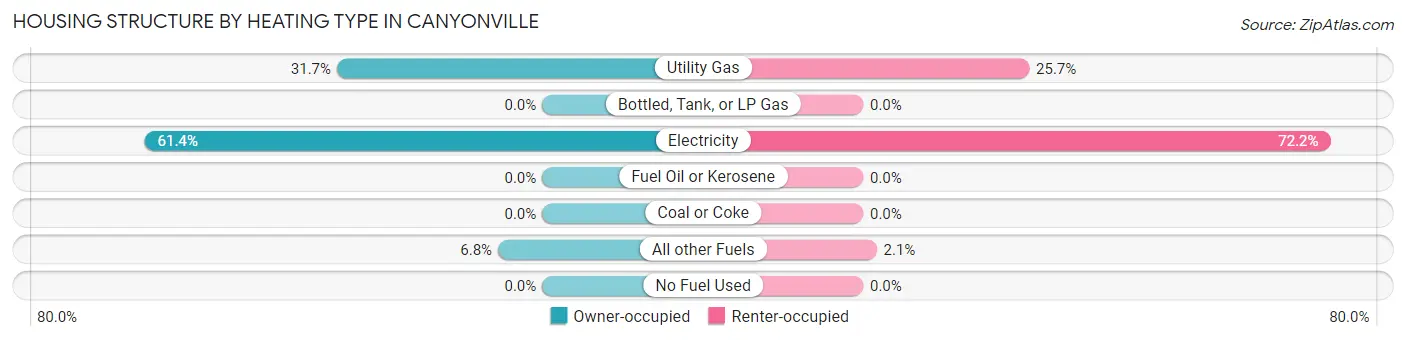
| Heating Type | Owner-occupied | Renter-occupied |
| Utility Gas | 172 (31.7%) | 86 (25.7%) |
| Bottled, Tank, or LP Gas | 0 (0.0%) | 0 (0.0%) |
| Electricity | 333 (61.4%) | 242 (72.2%) |
| Fuel Oil or Kerosene | 0 (0.0%) | 0 (0.0%) |
| Coal or Coke | 0 (0.0%) | 0 (0.0%) |
| All other Fuels | 37 (6.8%) | 7 (2.1%) |
| No Fuel Used | 0 (0.0%) | 0 (0.0%) |
| Total | 542 (100.0%) | 335 (100.0%) |
Household Vehicle Usage in Canyonville
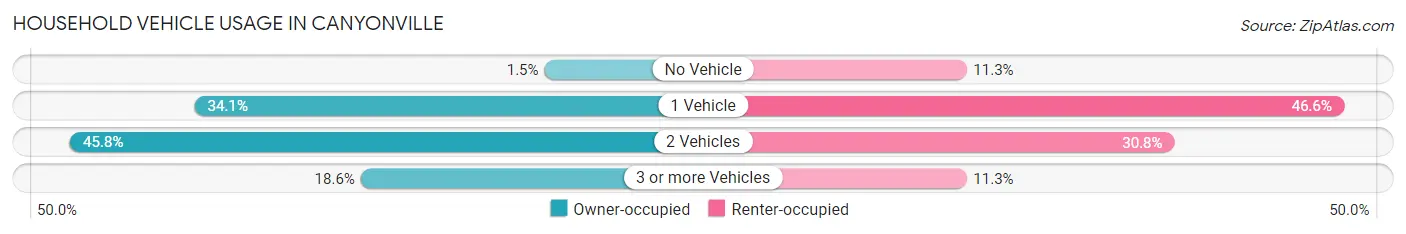
| Vehicles per Household | Owner-occupied | Renter-occupied |
| No Vehicle | 8 (1.5%) | 38 (11.3%) |
| 1 Vehicle | 185 (34.1%) | 156 (46.6%) |
| 2 Vehicles | 248 (45.8%) | 103 (30.7%) |
| 3 or more Vehicles | 101 (18.6%) | 38 (11.3%) |
| Total | 542 (100.0%) | 335 (100.0%) |
Real Estate & Mortgages in Canyonville
Real Estate and Mortgage Overview in Canyonville
| Characteristic | Without Mortgage | With Mortgage |
| Housing Units | 262 | 280 |
| Median Property Value | $133,300 | $180,200 |
| Median Household Income | $32,396 | $10 |
| Monthly Housing Costs | $513 | $0 |
| Real Estate Taxes | $1,230 | $4 |
Property Value by Mortgage Status in Canyonville
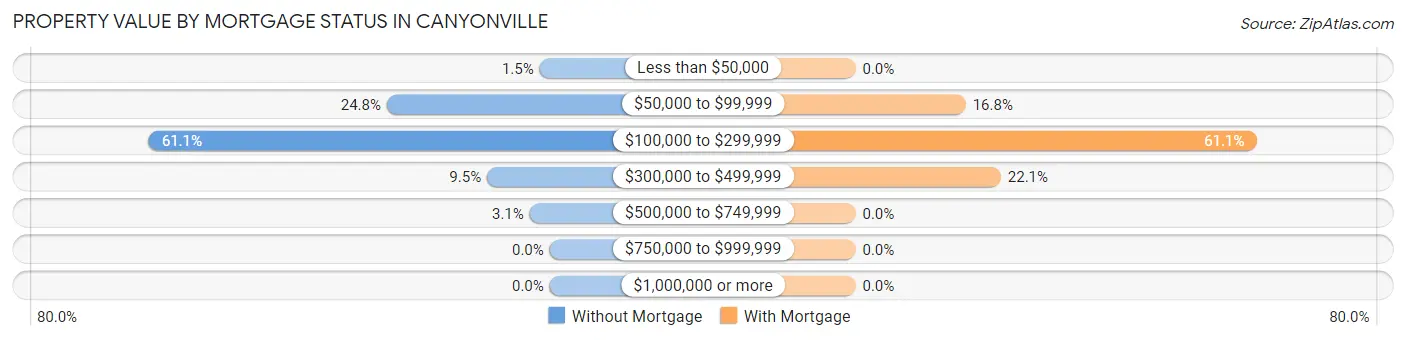
| Property Value | Without Mortgage | With Mortgage |
| Less than $50,000 | 4 (1.5%) | 0 (0.0%) |
| $50,000 to $99,999 | 65 (24.8%) | 47 (16.8%) |
| $100,000 to $299,999 | 160 (61.1%) | 171 (61.1%) |
| $300,000 to $499,999 | 25 (9.5%) | 62 (22.1%) |
| $500,000 to $749,999 | 8 (3.0%) | 0 (0.0%) |
| $750,000 to $999,999 | 0 (0.0%) | 0 (0.0%) |
| $1,000,000 or more | 0 (0.0%) | 0 (0.0%) |
| Total | 262 (100.0%) | 280 (100.0%) |
Household Income by Mortgage Status in Canyonville
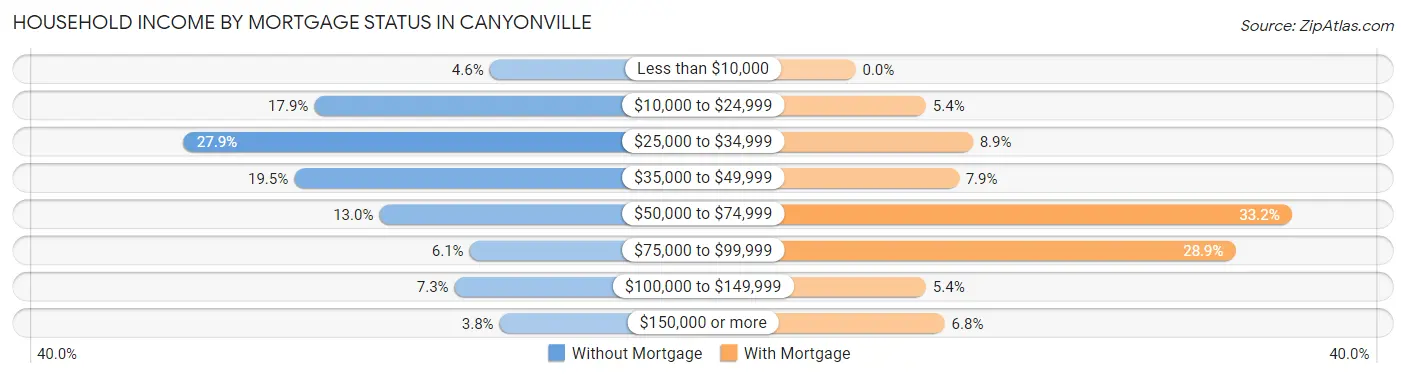
| Household Income | Without Mortgage | With Mortgage |
| Less than $10,000 | 12 (4.6%) | 0 (0.0%) |
| $10,000 to $24,999 | 47 (17.9%) | 15 (5.4%) |
| $25,000 to $34,999 | 73 (27.9%) | 25 (8.9%) |
| $35,000 to $49,999 | 51 (19.5%) | 22 (7.9%) |
| $50,000 to $74,999 | 34 (13.0%) | 93 (33.2%) |
| $75,000 to $99,999 | 16 (6.1%) | 81 (28.9%) |
| $100,000 to $149,999 | 19 (7.2%) | 15 (5.4%) |
| $150,000 or more | 10 (3.8%) | 19 (6.8%) |
| Total | 262 (100.0%) | 280 (100.0%) |
Property Value to Household Income Ratio in Canyonville
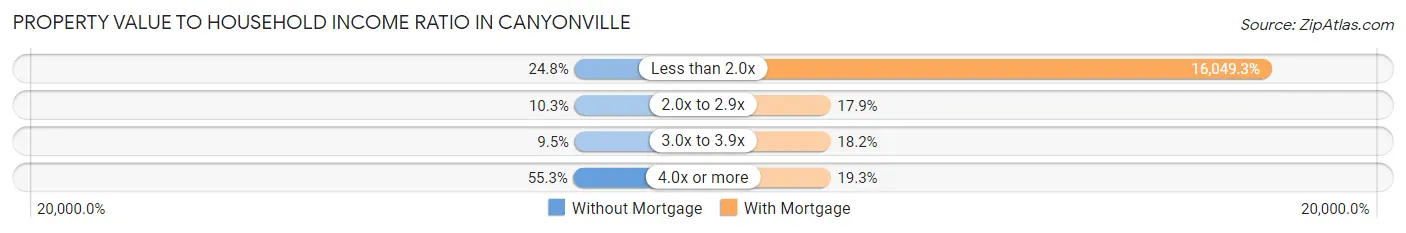
| Value-to-Income Ratio | Without Mortgage | With Mortgage |
| Less than 2.0x | 65 (24.8%) | 44,938 (16,049.3%) |
| 2.0x to 2.9x | 27 (10.3%) | 50 (17.9%) |
| 3.0x to 3.9x | 25 (9.5%) | 51 (18.2%) |
| 4.0x or more | 145 (55.3%) | 54 (19.3%) |
| Total | 262 (100.0%) | 280 (100.0%) |
Real Estate Taxes by Mortgage Status in Canyonville
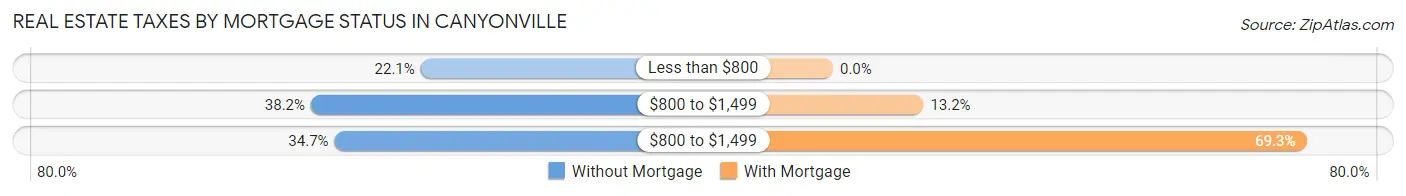
| Property Taxes | Without Mortgage | With Mortgage |
| Less than $800 | 58 (22.1%) | 0 (0.0%) |
| $800 to $1,499 | 100 (38.2%) | 37 (13.2%) |
| $800 to $1,499 | 91 (34.7%) | 194 (69.3%) |
| Total | 262 (100.0%) | 280 (100.0%) |
Health & Disability in Canyonville
Health Insurance Coverage by Age in Canyonville
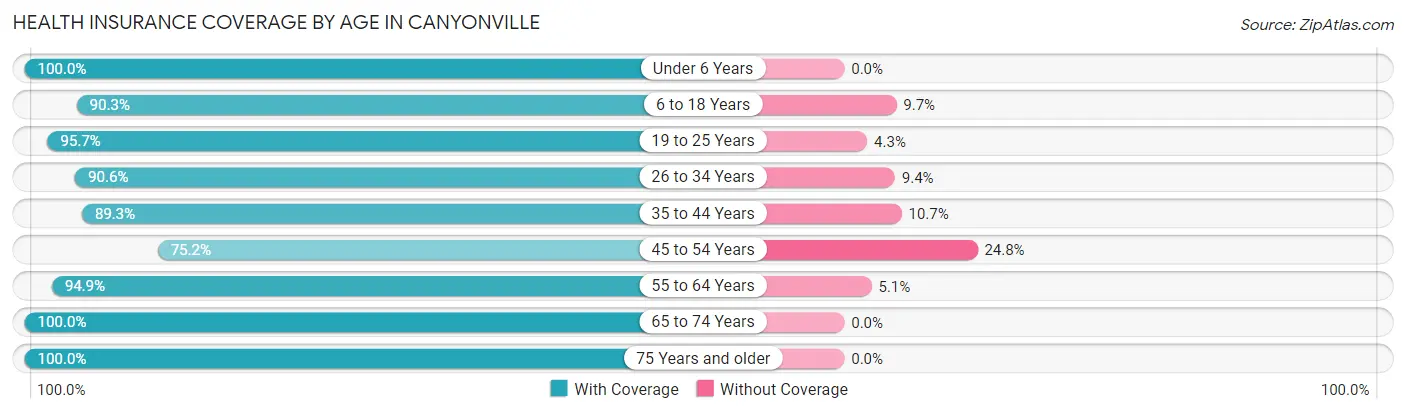
| Age Bracket | With Coverage | Without Coverage |
| Under 6 Years | 120 (100.0%) | 0 (0.0%) |
| 6 to 18 Years | 270 (90.3%) | 29 (9.7%) |
| 19 to 25 Years | 135 (95.7%) | 6 (4.3%) |
| 26 to 34 Years | 269 (90.6%) | 28 (9.4%) |
| 35 to 44 Years | 159 (89.3%) | 19 (10.7%) |
| 45 to 54 Years | 109 (75.2%) | 36 (24.8%) |
| 55 to 64 Years | 112 (94.9%) | 6 (5.1%) |
| 65 to 74 Years | 329 (100.0%) | 0 (0.0%) |
| 75 Years and older | 322 (100.0%) | 0 (0.0%) |
| Total | 1,825 (93.6%) | 124 (6.4%) |
Health Insurance Coverage by Citizenship Status in Canyonville
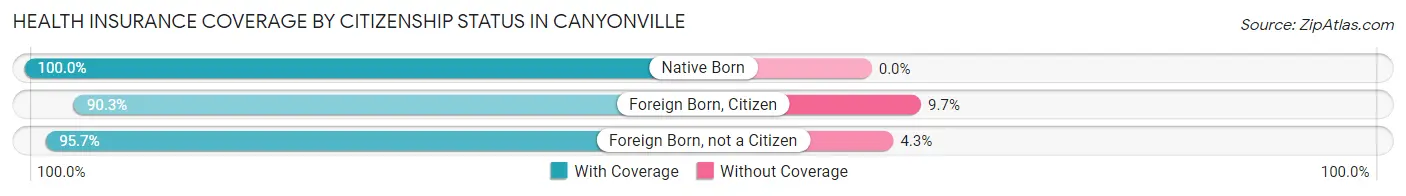
| Citizenship Status | With Coverage | Without Coverage |
| Native Born | 120 (100.0%) | 0 (0.0%) |
| Foreign Born, Citizen | 270 (90.3%) | 29 (9.7%) |
| Foreign Born, not a Citizen | 135 (95.7%) | 6 (4.3%) |
Health Insurance Coverage by Household Income in Canyonville
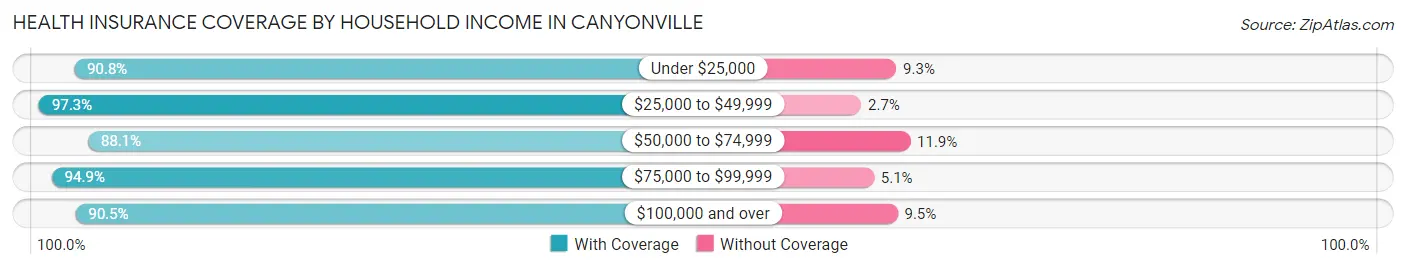
| Household Income | With Coverage | Without Coverage |
| Under $25,000 | 265 (90.7%) | 27 (9.2%) |
| $25,000 to $49,999 | 798 (97.3%) | 22 (2.7%) |
| $50,000 to $74,999 | 379 (88.1%) | 51 (11.9%) |
| $75,000 to $99,999 | 131 (94.9%) | 7 (5.1%) |
| $100,000 and over | 162 (90.5%) | 17 (9.5%) |
Public vs Private Health Insurance Coverage by Age in Canyonville
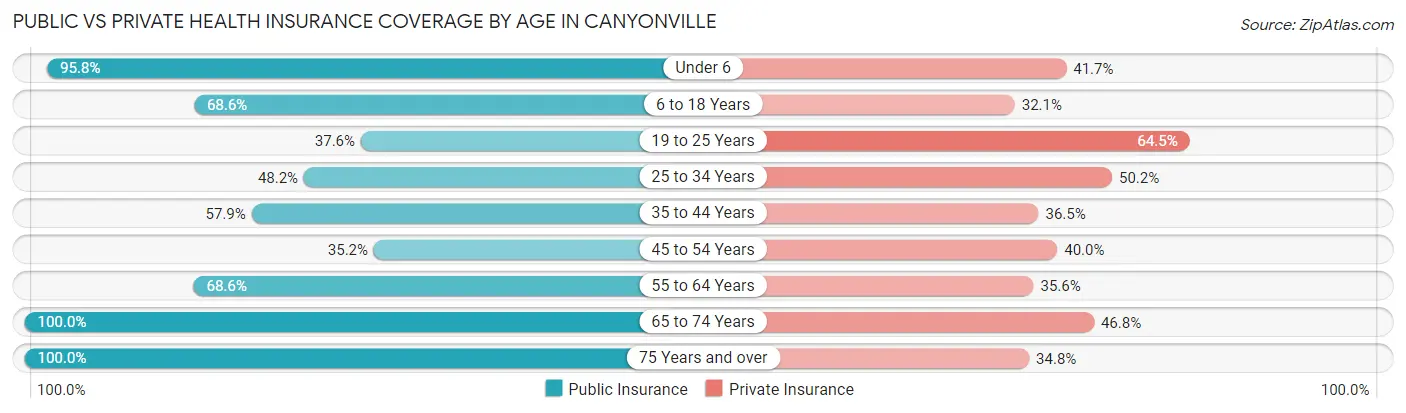
| Age Bracket | Public Insurance | Private Insurance |
| Under 6 | 115 (95.8%) | 50 (41.7%) |
| 6 to 18 Years | 205 (68.6%) | 96 (32.1%) |
| 19 to 25 Years | 53 (37.6%) | 91 (64.5%) |
| 25 to 34 Years | 143 (48.1%) | 149 (50.2%) |
| 35 to 44 Years | 103 (57.9%) | 65 (36.5%) |
| 45 to 54 Years | 51 (35.2%) | 58 (40.0%) |
| 55 to 64 Years | 81 (68.6%) | 42 (35.6%) |
| 65 to 74 Years | 329 (100.0%) | 154 (46.8%) |
| 75 Years and over | 322 (100.0%) | 112 (34.8%) |
| Total | 1,402 (71.9%) | 817 (41.9%) |
Disability Status by Sex by Age in Canyonville
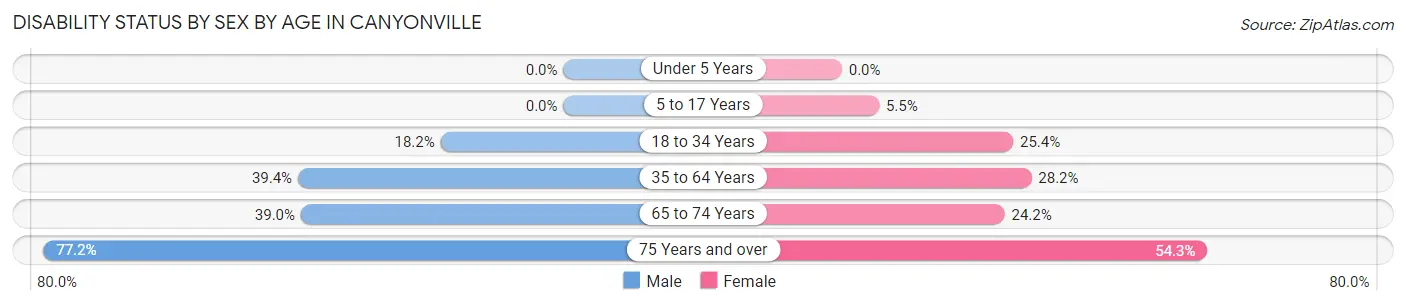
| Age Bracket | Male | Female |
| Under 5 Years | 0 (0.0%) | 0 (0.0%) |
| 5 to 17 Years | 0 (0.0%) | 9 (5.5%) |
| 18 to 34 Years | 29 (18.2%) | 74 (25.4%) |
| 35 to 64 Years | 80 (39.4%) | 67 (28.1%) |
| 65 to 74 Years | 46 (39.0%) | 51 (24.2%) |
| 75 Years and over | 122 (77.2%) | 89 (54.3%) |
Disability Class by Sex by Age in Canyonville
Disability Class: Hearing Difficulty
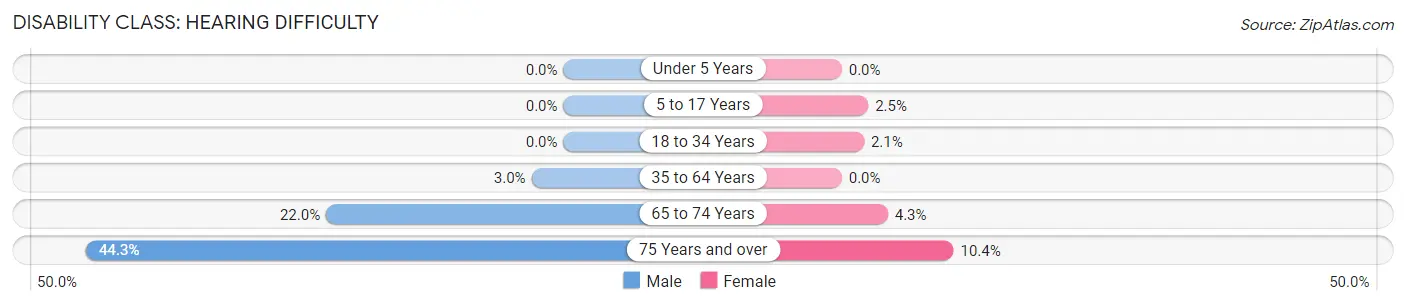
| Age Bracket | Male | Female |
| Under 5 Years | 0 (0.0%) | 0 (0.0%) |
| 5 to 17 Years | 0 (0.0%) | 4 (2.5%) |
| 18 to 34 Years | 0 (0.0%) | 6 (2.1%) |
| 35 to 64 Years | 6 (3.0%) | 0 (0.0%) |
| 65 to 74 Years | 26 (22.0%) | 9 (4.3%) |
| 75 Years and over | 70 (44.3%) | 17 (10.4%) |
Disability Class: Vision Difficulty
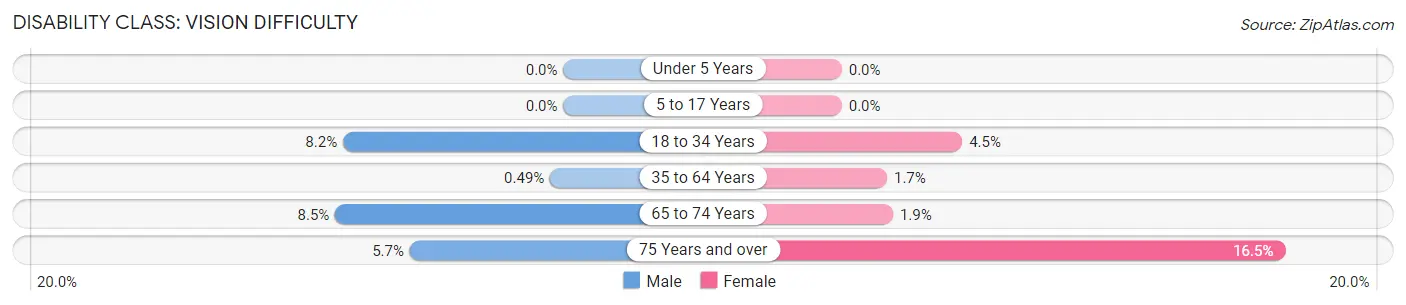
| Age Bracket | Male | Female |
| Under 5 Years | 0 (0.0%) | 0 (0.0%) |
| 5 to 17 Years | 0 (0.0%) | 0 (0.0%) |
| 18 to 34 Years | 13 (8.2%) | 13 (4.5%) |
| 35 to 64 Years | 1 (0.5%) | 4 (1.7%) |
| 65 to 74 Years | 10 (8.5%) | 4 (1.9%) |
| 75 Years and over | 9 (5.7%) | 27 (16.5%) |
Disability Class: Cognitive Difficulty
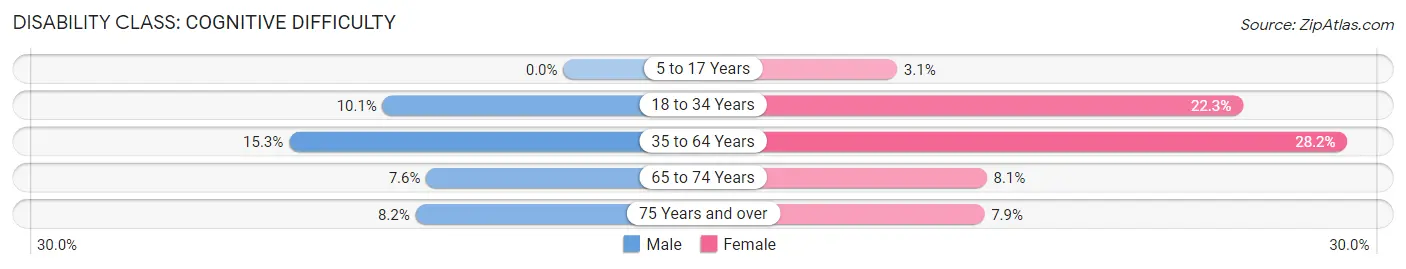
| Age Bracket | Male | Female |
| 5 to 17 Years | 0 (0.0%) | 5 (3.1%) |
| 18 to 34 Years | 16 (10.1%) | 65 (22.3%) |
| 35 to 64 Years | 31 (15.3%) | 67 (28.1%) |
| 65 to 74 Years | 9 (7.6%) | 17 (8.1%) |
| 75 Years and over | 13 (8.2%) | 13 (7.9%) |
Disability Class: Ambulatory Difficulty
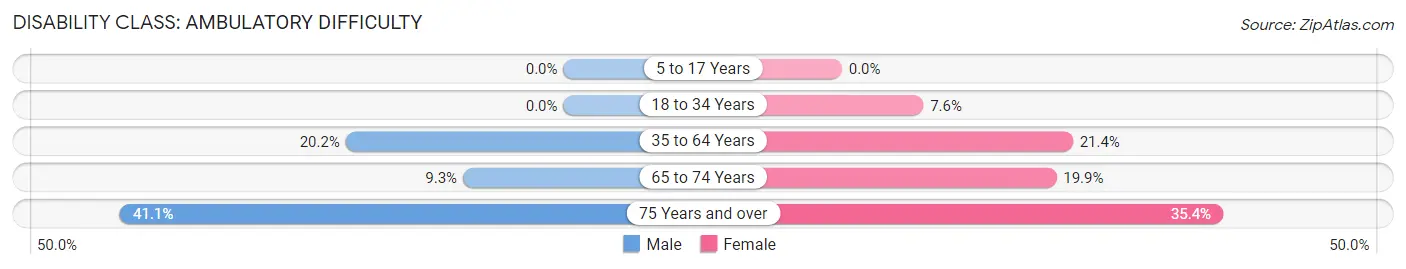
| Age Bracket | Male | Female |
| 5 to 17 Years | 0 (0.0%) | 0 (0.0%) |
| 18 to 34 Years | 0 (0.0%) | 22 (7.6%) |
| 35 to 64 Years | 41 (20.2%) | 51 (21.4%) |
| 65 to 74 Years | 11 (9.3%) | 42 (19.9%) |
| 75 Years and over | 65 (41.1%) | 58 (35.4%) |
Disability Class: Self-Care Difficulty
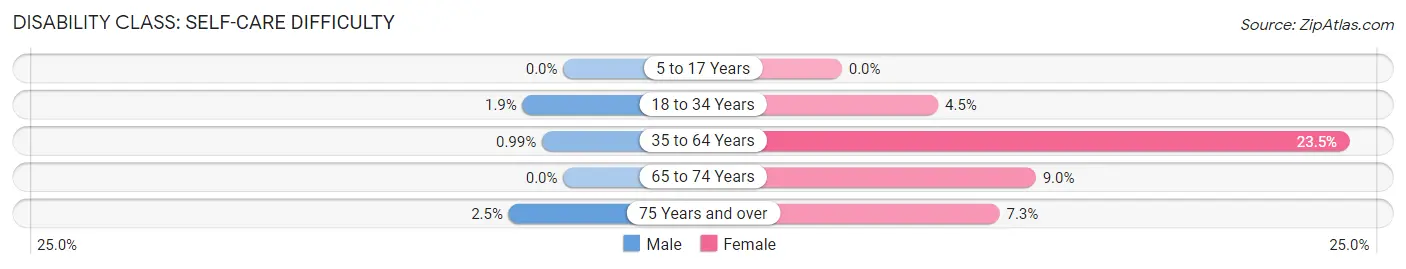
| Age Bracket | Male | Female |
| 5 to 17 Years | 0 (0.0%) | 0 (0.0%) |
| 18 to 34 Years | 3 (1.9%) | 13 (4.5%) |
| 35 to 64 Years | 2 (1.0%) | 56 (23.5%) |
| 65 to 74 Years | 0 (0.0%) | 19 (9.0%) |
| 75 Years and over | 4 (2.5%) | 12 (7.3%) |
Technology Access in Canyonville
Computing Device Access in Canyonville
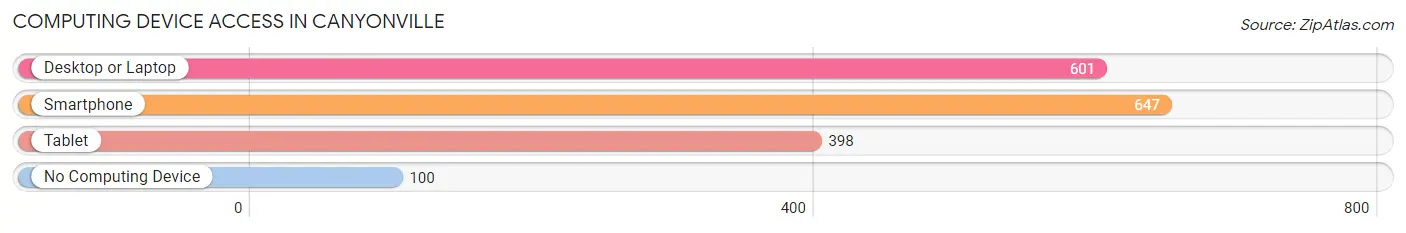
| Device Type | # Households | % Households |
| Desktop or Laptop | 601 | 68.5% |
| Smartphone | 647 | 73.8% |
| Tablet | 398 | 45.4% |
| No Computing Device | 100 | 11.4% |
| Total | 877 | 100.0% |
Internet Access in Canyonville
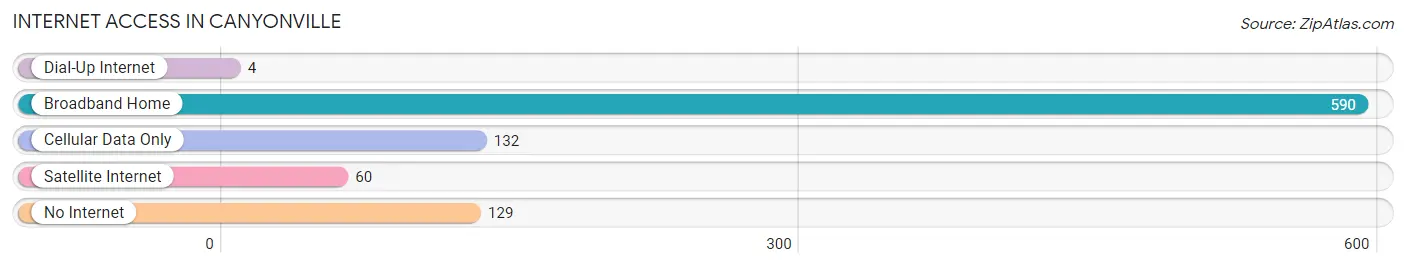
| Internet Type | # Households | % Households |
| Dial-Up Internet | 4 | 0.5% |
| Broadband Home | 590 | 67.3% |
| Cellular Data Only | 132 | 15.0% |
| Satellite Internet | 60 | 6.8% |
| No Internet | 129 | 14.7% |
| Total | 877 | 100.0% |
Canyonville Summary
Canyonville is a small city located in Douglas County, Oregon, United States. It is situated on the banks of the South Umpqua River, approximately 40 miles south of Eugene and 25 miles north of Roseburg. The city has a population of 2,719 as of the 2010 census.
History
The area that is now Canyonville was first inhabited by the Umpqua Indians, who lived in the area for thousands of years before the arrival of European settlers. The first white settlers arrived in the area in the early 1850s, and the town of Canyonville was officially established in 1853. The town was named after the nearby canyon of the South Umpqua River.
In the late 1800s, the town became a major stop on the Oregon and California Railroad, which connected the town to the rest of the state. The railroad brought in new settlers and businesses, and the town began to grow. In the early 1900s, the town was home to several sawmills, a flour mill, and a brickyard.
In the 1950s, the town began to decline as the railroad stopped running and the sawmills and other businesses closed. In the 1970s, the town was revitalized with the opening of Seven Feathers Casino Resort, which brought in new jobs and businesses.
Geography
Canyonville is located in the foothills of the Cascade Mountains, at an elevation of 845 feet. The city is situated on the banks of the South Umpqua River, and is surrounded by rolling hills and forests. The city covers an area of 2.3 square miles, and has a population density of 1,170 people per square mile.
The climate in Canyonville is mild and temperate, with warm summers and cool winters. The average annual temperature is 54 degrees Fahrenheit, and the average annual precipitation is 37 inches.
Economy
The economy of Canyonville is largely based on tourism and the service industry. The city is home to Seven Feathers Casino Resort, which is the largest employer in the city. Other major employers include the local school district, the city government, and several retail stores and restaurants.
The city also has a small manufacturing sector, with several small factories producing wood products, metal products, and other goods.
Demographics
As of the 2010 census, the population of Canyonville was 2,719. The racial makeup of the city was 91.3% White, 0.7% African American, 1.2% Native American, 0.7% Asian, 0.1% Pacific Islander, 2.2% from other races, and 3.8% from two or more races. Hispanic or Latino of any race were 6.2% of the population.
The median household income in Canyonville was $35,938, and the median family income was $41,944. The per capita income was $17,845. About 16.3% of the population was below the poverty line.
Common Questions
What is Per Capita Income in Canyonville?
Per Capita income in Canyonville is $21,162.
What is the Median Family Income in Canyonville?
Median Family Income in Canyonville is $44,350.
What is the Median Household income in Canyonville?
Median Household Income in Canyonville is $41,573.
What is Income or Wage Gap in Canyonville?
Income or Wage Gap in Canyonville is 40.1%.
Women in Canyonville earn 59.9 cents for every dollar earned by a man.
What is Inequality or Gini Index in Canyonville?
Inequality or Gini Index in Canyonville is 0.36.
What is the Total Population of Canyonville?
Total Population of Canyonville is 1,949.
What is the Total Male Population of Canyonville?
Total Male Population of Canyonville is 845.
What is the Total Female Population of Canyonville?
Total Female Population of Canyonville is 1,104.
What is the Ratio of Males per 100 Females in Canyonville?
There are 76.54 Males per 100 Females in Canyonville.
What is the Ratio of Females per 100 Males in Canyonville?
There are 130.65 Females per 100 Males in Canyonville.
What is the Median Population Age in Canyonville?
Median Population Age in Canyonville is 42.1 Years.
What is the Average Family Size in Canyonville
Average Family Size in Canyonville is 2.7 People.
What is the Average Household Size in Canyonville
Average Household Size in Canyonville is 2.1 People.
How Large is the Labor Force in Canyonville?
There are 646 People in the Labor Forcein in Canyonville.
What is the Percentage of People in the Labor Force in Canyonville?
40.4% of People are in the Labor Force in Canyonville.
What is the Unemployment Rate in Canyonville?
Unemployment Rate in Canyonville is 13.2%.