Sutherlin, OR Map & Demographics
Sutherlin Map
Sutherlin Overview
$31,982
PER CAPITA INCOME
$71,226
AVG FAMILY INCOME
$48,610
AVG HOUSEHOLD INCOME
45.0%
WAGE / INCOME GAP [ % ]
55.0¢/ $1
WAGE / INCOME GAP [ $ ]
0.45
INEQUALITY / GINI INDEX
8,513
TOTAL POPULATION
4,003
MALE POPULATION
4,510
FEMALE POPULATION
88.76
MALES / 100 FEMALES
112.67
FEMALES / 100 MALES
46.9
MEDIAN AGE
2.7
AVG FAMILY SIZE
2.2
AVG HOUSEHOLD SIZE
3,906
LABOR FORCE [ PEOPLE ]
55.3%
PERCENT IN LABOR FORCE
5.7%
UNEMPLOYMENT RATE
Sutherlin Zip Codes
Sutherlin Area Codes
Income in Sutherlin
Income Overview in Sutherlin
Per Capita Income in Sutherlin is $31,982, while median incomes of families and households are $71,226 and $48,610 respectively.
| Characteristic | Number | Measure |
| Per Capita Income | 8,513 | $31,982 |
| Median Family Income | 2,160 | $71,226 |
| Mean Family Income | 2,160 | $88,599 |
| Median Household Income | 3,885 | $48,610 |
| Mean Household Income | 3,885 | $68,207 |
| Income Deficit | 2,160 | $0 |
| Wage / Income Gap (%) | 8,513 | 45.01% |
| Wage / Income Gap ($) | 8,513 | 54.99¢ per $1 |
| Gini / Inequality Index | 8,513 | 0.45 |
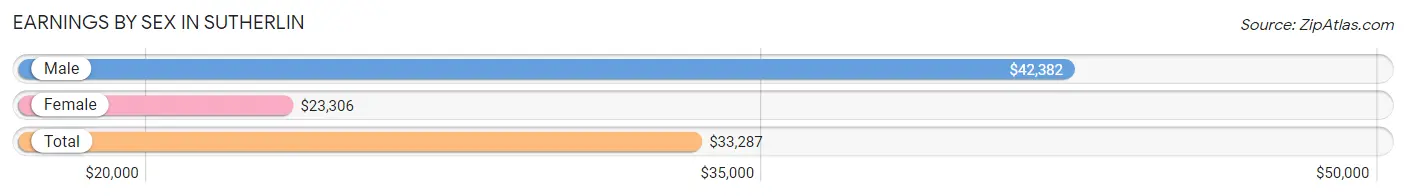
Earnings by Sex in Sutherlin
Average Earnings in Sutherlin are $33,287, $42,382 for men and $23,306 for women, a difference of 45.0%.
| Sex | Number | Average Earnings |
| Male | 1,866 (46.0%) | $42,382 |
| Female | 2,187 (54.0%) | $23,306 |
| Total | 4,053 (100.0%) | $33,287 |
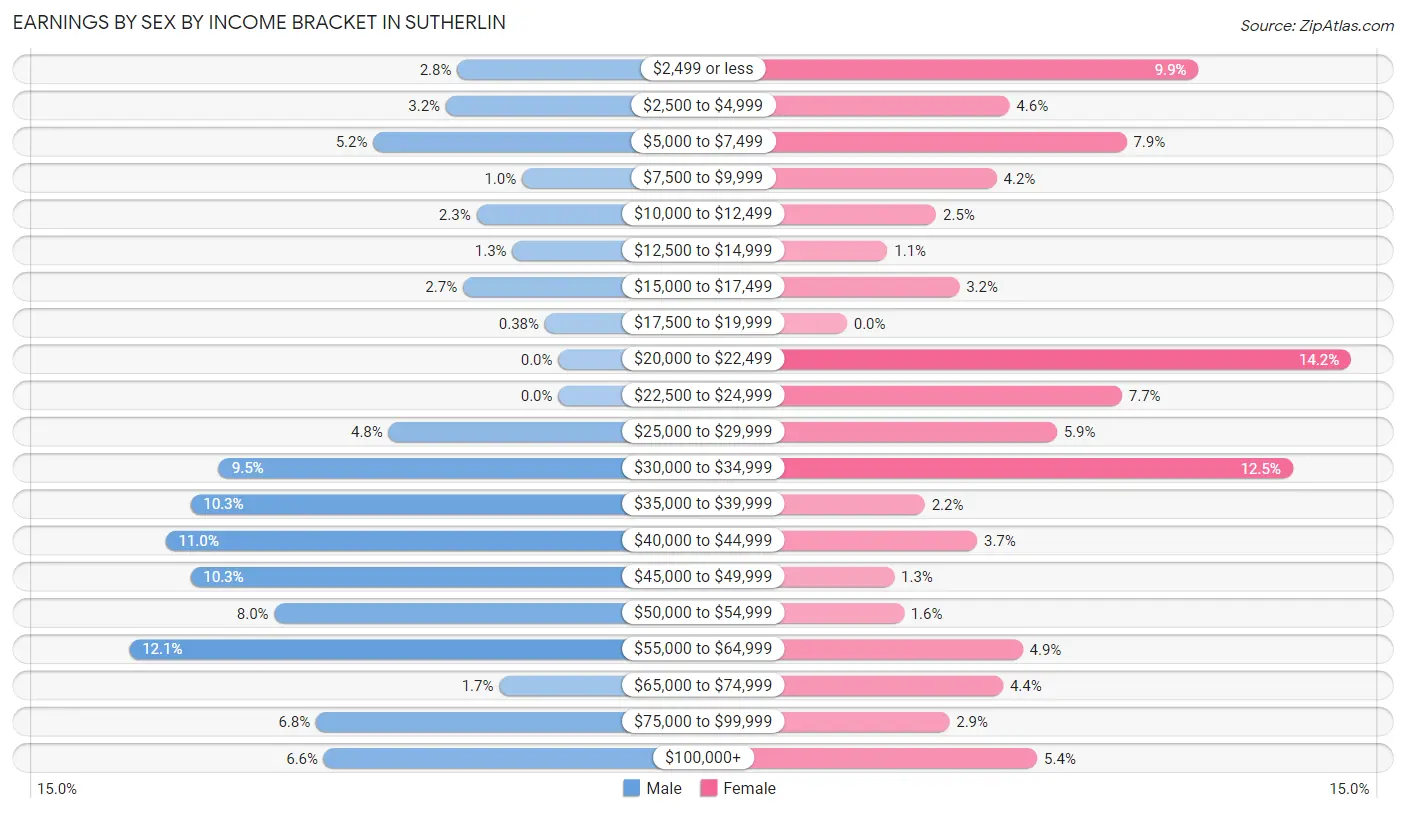
Earnings by Sex by Income Bracket in Sutherlin
The most common earnings brackets in Sutherlin are $55,000 to $64,999 for men (225 | 12.1%) and $20,000 to $22,499 for women (310 | 14.2%).
| Income | Male | Female |
| $2,499 or less | 53 (2.8%) | 216 (9.9%) |
| $2,500 to $4,999 | 59 (3.2%) | 100 (4.6%) |
| $5,000 to $7,499 | 97 (5.2%) | 172 (7.9%) |
| $7,500 to $9,999 | 19 (1.0%) | 92 (4.2%) |
| $10,000 to $12,499 | 43 (2.3%) | 55 (2.5%) |
| $12,500 to $14,999 | 24 (1.3%) | 25 (1.1%) |
| $15,000 to $17,499 | 50 (2.7%) | 69 (3.2%) |
| $17,500 to $19,999 | 7 (0.4%) | 0 (0.0%) |
| $20,000 to $22,499 | 0 (0.0%) | 310 (14.2%) |
| $22,500 to $24,999 | 0 (0.0%) | 169 (7.7%) |
| $25,000 to $29,999 | 89 (4.8%) | 129 (5.9%) |
| $30,000 to $34,999 | 178 (9.5%) | 274 (12.5%) |
| $35,000 to $39,999 | 193 (10.3%) | 48 (2.2%) |
| $40,000 to $44,999 | 206 (11.0%) | 80 (3.7%) |
| $45,000 to $49,999 | 193 (10.3%) | 29 (1.3%) |
| $50,000 to $54,999 | 149 (8.0%) | 35 (1.6%) |
| $55,000 to $64,999 | 225 (12.1%) | 108 (4.9%) |
| $65,000 to $74,999 | 31 (1.7%) | 96 (4.4%) |
| $75,000 to $99,999 | 127 (6.8%) | 63 (2.9%) |
| $100,000+ | 123 (6.6%) | 117 (5.3%) |
| Total | 1,866 (100.0%) | 2,187 (100.0%) |
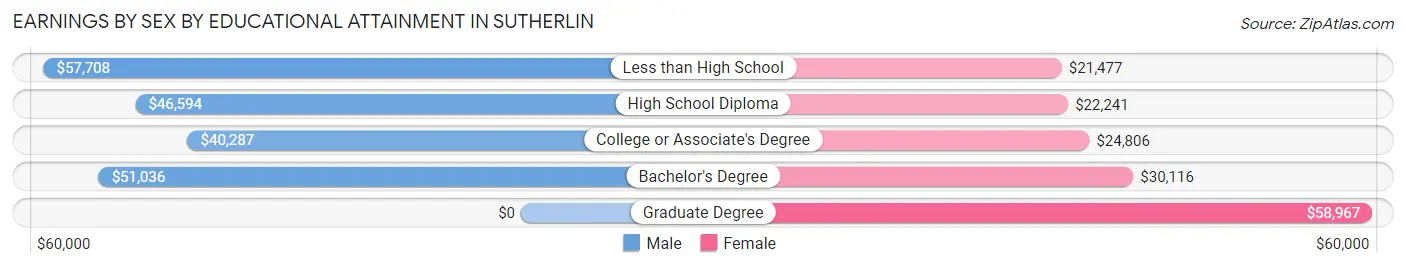
Earnings by Sex by Educational Attainment in Sutherlin
Average earnings in Sutherlin are $45,101 for men and $23,676 for women, a difference of 47.5%. Men with an educational attainment of less than high school enjoy the highest average annual earnings of $57,708, while those with college or associate's degree education earn the least with $40,287. Women with an educational attainment of graduate degree earn the most with the average annual earnings of $58,967, while those with less than high school education have the smallest earnings of $21,477.
| Educational Attainment | Male Income | Female Income |
| Less than High School | $57,708 | $21,477 |
| High School Diploma | $46,594 | $22,241 |
| College or Associate's Degree | $40,287 | $24,806 |
| Bachelor's Degree | $51,036 | $30,116 |
| Graduate Degree | - | - |
| Total | $45,101 | $23,676 |
Family Income in Sutherlin
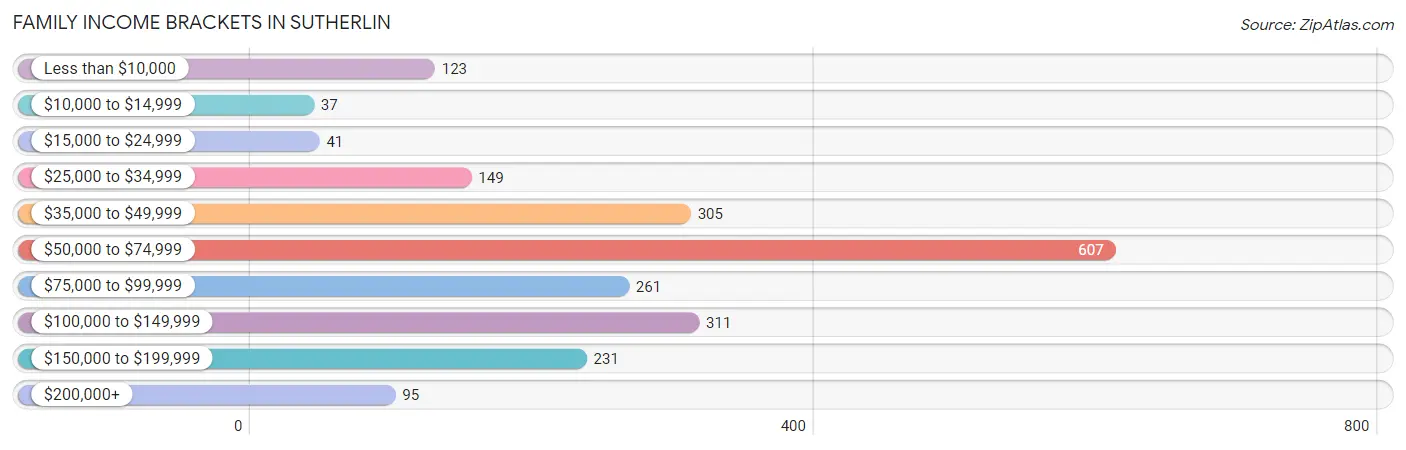
Family Income Brackets in Sutherlin
According to the Sutherlin family income data, there are 607 families falling into the $50,000 to $74,999 income range, which is the most common income bracket and makes up 28.1% of all families. Conversely, the $10,000 to $14,999 income bracket is the least frequent group with only 37 families (1.7%) belonging to this category.
| Income Bracket | # Families | % Families |
| Less than $10,000 | 123 | 5.7% |
| $10,000 to $14,999 | 37 | 1.7% |
| $15,000 to $24,999 | 41 | 1.9% |
| $25,000 to $34,999 | 149 | 6.9% |
| $35,000 to $49,999 | 305 | 14.1% |
| $50,000 to $74,999 | 607 | 28.1% |
| $75,000 to $99,999 | 261 | 12.1% |
| $100,000 to $149,999 | 311 | 14.4% |
| $150,000 to $199,999 | 231 | 10.7% |
| $200,000+ | 95 | 4.4% |
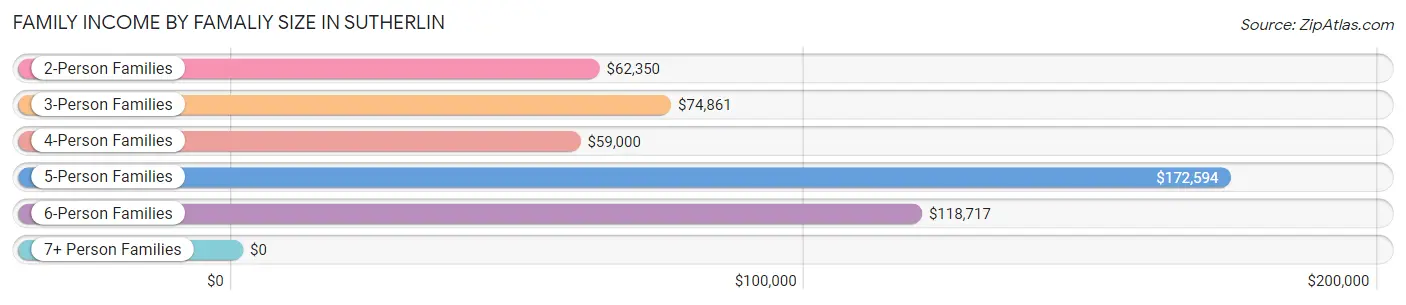
Family Income by Famaliy Size in Sutherlin
5-person families (154 | 7.1%) account for the highest median family income in Sutherlin with $172,594 per family, while 5-person families (154 | 7.1%) have the highest median income of $34,519 per family member.
| Income Bracket | # Families | Median Income |
| 2-Person Families | 1,394 (64.5%) | $62,350 |
| 3-Person Families | 273 (12.6%) | $74,861 |
| 4-Person Families | 248 (11.5%) | $59,000 |
| 5-Person Families | 154 (7.1%) | $172,594 |
| 6-Person Families | 91 (4.2%) | $118,717 |
| 7+ Person Families | 0 (0.0%) | $0 |
| Total | 2,160 (100.0%) | $71,226 |
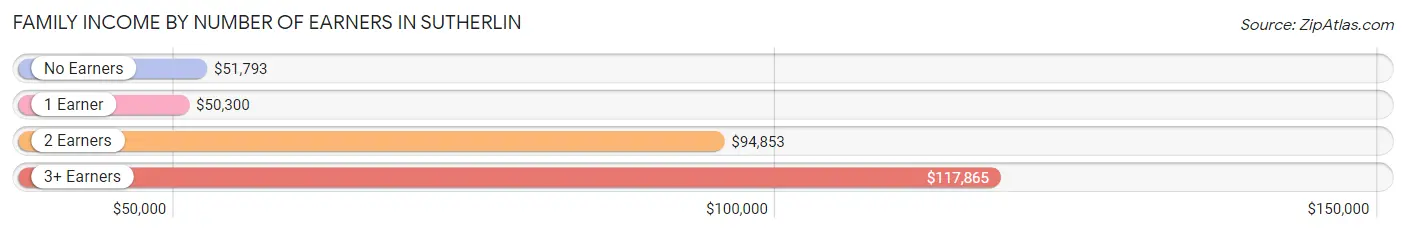
Family Income by Number of Earners in Sutherlin
The median family income in Sutherlin is $71,226, with families comprising 3+ earners (47) having the highest median family income of $117,865, while families with 1 earner (494) have the lowest median family income of $50,300, accounting for 2.2% and 22.9% of families, respectively.
| Number of Earners | # Families | Median Income |
| No Earners | 641 (29.7%) | $51,793 |
| 1 Earner | 494 (22.9%) | $50,300 |
| 2 Earners | 978 (45.3%) | $94,853 |
| 3+ Earners | 47 (2.2%) | $117,865 |
| Total | 2,160 (100.0%) | $71,226 |
Household Income in Sutherlin
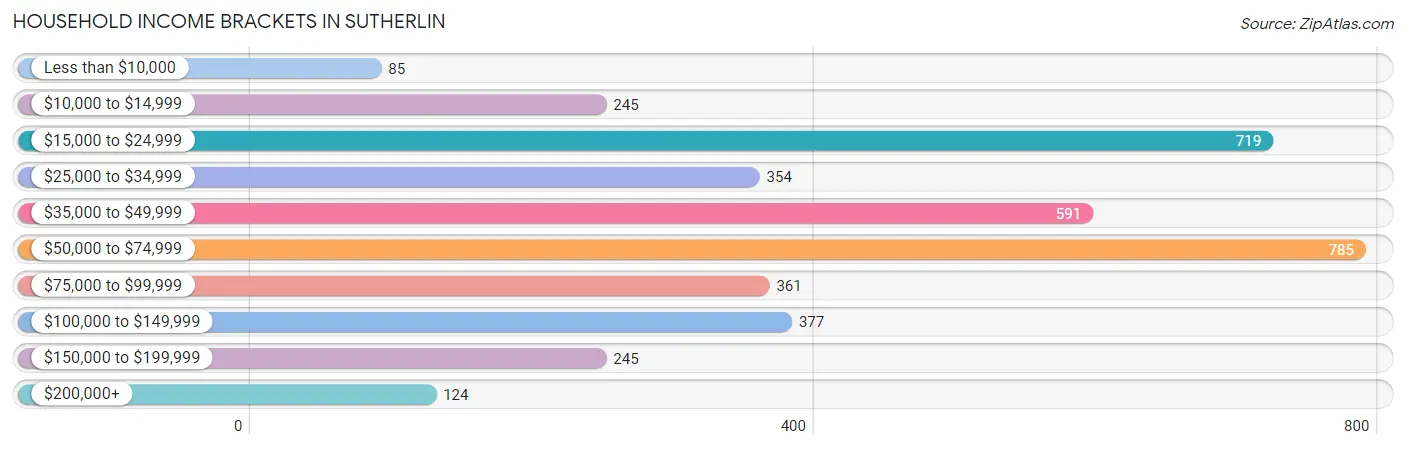
Household Income Brackets in Sutherlin
With 785 households falling in the category, the $50,000 to $74,999 income range is the most frequent in Sutherlin, accounting for 20.2% of all households. In contrast, only 85 households (2.2%) fall into the less than $10,000 income bracket, making it the least populous group.
| Income Bracket | # Households | % Households |
| Less than $10,000 | 85 | 2.2% |
| $10,000 to $14,999 | 245 | 6.3% |
| $15,000 to $24,999 | 719 | 18.5% |
| $25,000 to $34,999 | 354 | 9.1% |
| $35,000 to $49,999 | 591 | 15.2% |
| $50,000 to $74,999 | 785 | 20.2% |
| $75,000 to $99,999 | 361 | 9.3% |
| $100,000 to $149,999 | 377 | 9.7% |
| $150,000 to $199,999 | 245 | 6.3% |
| $200,000+ | 124 | 3.2% |
Household Income by Householder Age in Sutherlin
The median household income in Sutherlin is $48,610, with the highest median household income of $69,539 found in the 25 to 44 years age bracket for the primary householder. A total of 1,055 households (27.2%) fall into this category. Meanwhile, the 15 to 24 years age bracket for the primary householder has the lowest median household income of $26,523, with 79 households (2.0%) in this group.
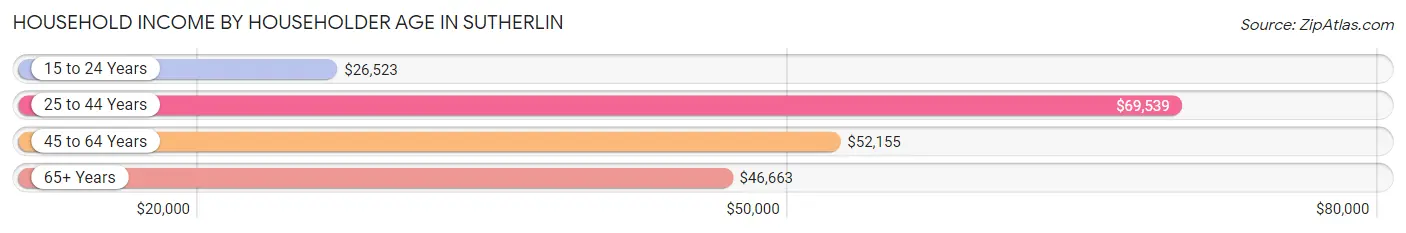
| Income Bracket | # Households | Median Income |
| 15 to 24 Years | 79 (2.0%) | $26,523 |
| 25 to 44 Years | 1,055 (27.2%) | $69,539 |
| 45 to 64 Years | 1,402 (36.1%) | $52,155 |
| 65+ Years | 1,349 (34.7%) | $46,663 |
| Total | 3,885 (100.0%) | $48,610 |
Poverty in Sutherlin
Income Below Poverty by Sex and Age in Sutherlin
With 16.1% poverty level for males and 10.7% for females among the residents of Sutherlin, under 5 year old males and 16 and 17 year old females are the most vulnerable to poverty, with 89 males (59.7%) and 23 females (34.3%) in their respective age groups living below the poverty level.
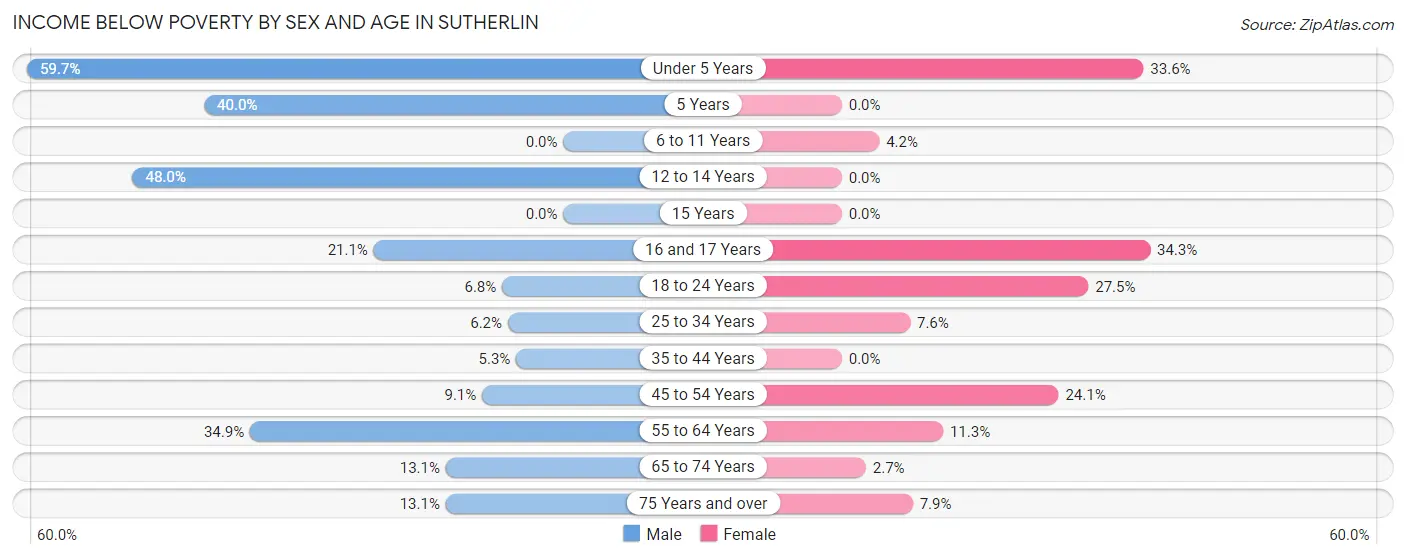
| Age Bracket | Male | Female |
| Under 5 Years | 89 (59.7%) | 86 (33.6%) |
| 5 Years | 10 (40.0%) | 0 (0.0%) |
| 6 to 11 Years | 0 (0.0%) | 8 (4.2%) |
| 12 to 14 Years | 59 (48.0%) | 0 (0.0%) |
| 15 Years | 0 (0.0%) | 0 (0.0%) |
| 16 and 17 Years | 34 (21.1%) | 23 (34.3%) |
| 18 to 24 Years | 15 (6.8%) | 56 (27.5%) |
| 25 to 34 Years | 26 (6.2%) | 55 (7.6%) |
| 35 to 44 Years | 23 (5.2%) | 0 (0.0%) |
| 45 to 54 Years | 44 (9.0%) | 104 (24.1%) |
| 55 to 64 Years | 215 (34.9%) | 79 (11.3%) |
| 65 to 74 Years | 72 (13.1%) | 19 (2.7%) |
| 75 Years and over | 44 (13.1%) | 49 (7.9%) |
| Total | 631 (16.1%) | 479 (10.7%) |
Income Above Poverty by Sex and Age in Sutherlin
According to the poverty statistics in Sutherlin, males aged 6 to 11 years and females aged 5 years are the age groups that are most secure financially, with 100.0% of males and 100.0% of females in these age groups living above the poverty line.
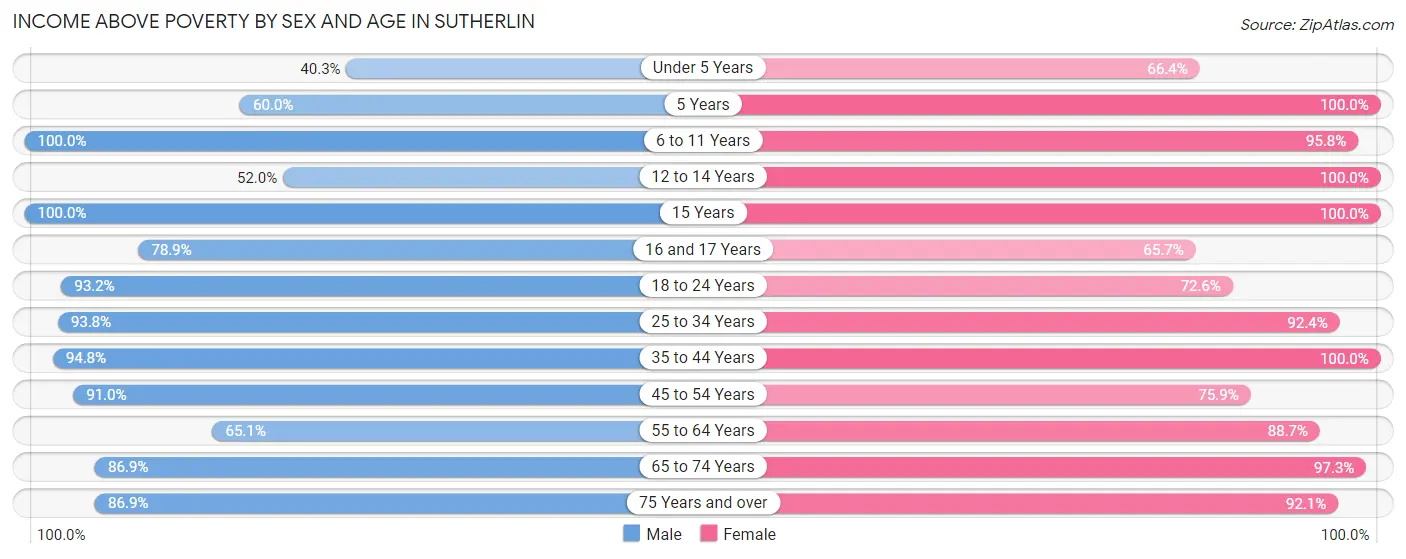
| Age Bracket | Male | Female |
| Under 5 Years | 60 (40.3%) | 170 (66.4%) |
| 5 Years | 15 (60.0%) | 26 (100.0%) |
| 6 to 11 Years | 352 (100.0%) | 184 (95.8%) |
| 12 to 14 Years | 64 (52.0%) | 171 (100.0%) |
| 15 Years | 40 (100.0%) | 6 (100.0%) |
| 16 and 17 Years | 127 (78.9%) | 44 (65.7%) |
| 18 to 24 Years | 205 (93.2%) | 148 (72.6%) |
| 25 to 34 Years | 395 (93.8%) | 669 (92.4%) |
| 35 to 44 Years | 415 (94.8%) | 379 (100.0%) |
| 45 to 54 Years | 442 (90.9%) | 327 (75.9%) |
| 55 to 64 Years | 401 (65.1%) | 622 (88.7%) |
| 65 to 74 Years | 478 (86.9%) | 690 (97.3%) |
| 75 Years and over | 292 (86.9%) | 571 (92.1%) |
| Total | 3,286 (83.9%) | 4,007 (89.3%) |
Income Below Poverty Among Married-Couple Families in Sutherlin
The poverty statistics for married-couple families in Sutherlin show that 3.7% or 60 of the total 1,639 families live below the poverty line. Families with 3 or 4 children have the highest poverty rate of 4.5%, comprising of 9 families. On the other hand, families with no children have the lowest poverty rate of 3.4%, which includes 36 families.
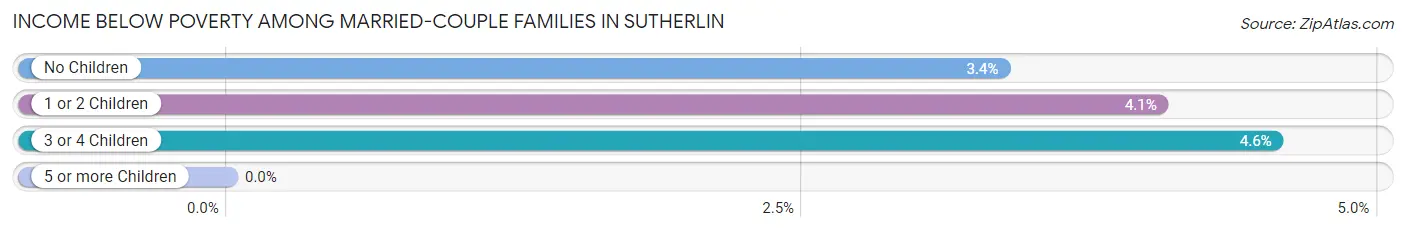
| Children | Above Poverty | Below Poverty |
| No Children | 1,035 (96.6%) | 36 (3.4%) |
| 1 or 2 Children | 355 (96.0%) | 15 (4.1%) |
| 3 or 4 Children | 189 (95.5%) | 9 (4.5%) |
| 5 or more Children | 0 (0.0%) | 0 (0.0%) |
| Total | 1,579 (96.3%) | 60 (3.7%) |
Income Below Poverty Among Single-Parent Households in Sutherlin
According to the poverty data in Sutherlin, 22.8% or 33 single-father households and 28.5% or 107 single-mother households are living below the poverty line. Among single-father households, those with 1 or 2 children have the highest poverty rate, with 17 households (27.4%) experiencing poverty. Likewise, among single-mother households, those with 1 or 2 children have the highest poverty rate, with 107 households (46.5%) falling below the poverty line.
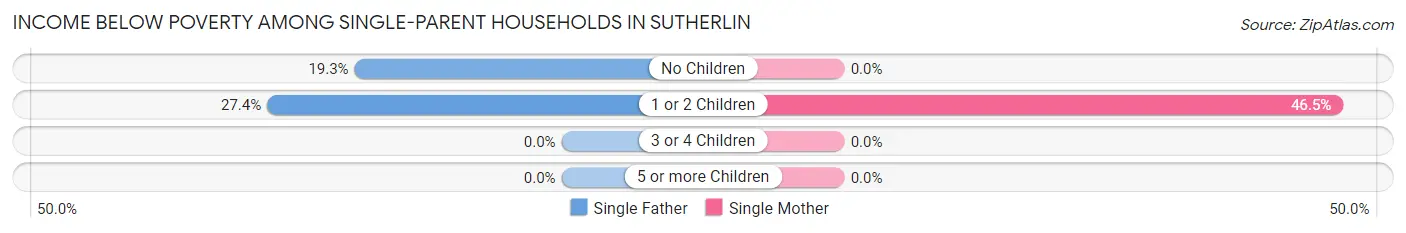
| Children | Single Father | Single Mother |
| No Children | 16 (19.3%) | 0 (0.0%) |
| 1 or 2 Children | 17 (27.4%) | 107 (46.5%) |
| 3 or 4 Children | 0 (0.0%) | 0 (0.0%) |
| 5 or more Children | 0 (0.0%) | 0 (0.0%) |
| Total | 33 (22.8%) | 107 (28.5%) |
Income Below Poverty Among Married-Couple vs Single-Parent Households in Sutherlin
The poverty data for Sutherlin shows that 60 of the married-couple family households (3.7%) and 140 of the single-parent households (26.9%) are living below the poverty level. Within the married-couple family households, those with 3 or 4 children have the highest poverty rate, with 9 households (4.5%) falling below the poverty line. Among the single-parent households, those with 1 or 2 children have the highest poverty rate, with 124 household (42.5%) living below poverty.
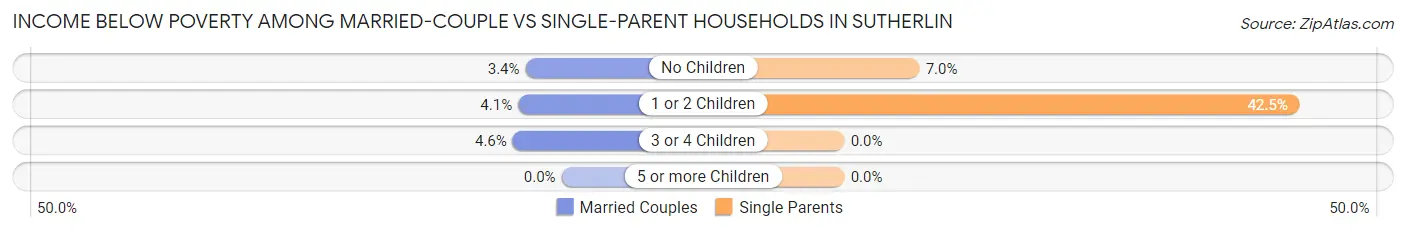
| Children | Married-Couple Families | Single-Parent Households |
| No Children | 36 (3.4%) | 16 (7.0%) |
| 1 or 2 Children | 15 (4.1%) | 124 (42.5%) |
| 3 or 4 Children | 9 (4.5%) | 0 (0.0%) |
| 5 or more Children | 0 (0.0%) | 0 (0.0%) |
| Total | 60 (3.7%) | 140 (26.9%) |
Race in Sutherlin
The most populous races in Sutherlin are White / Caucasian (7,875 | 92.5%), Two or more Races (411 | 4.8%), and Hispanic or Latino (146 | 1.7%).
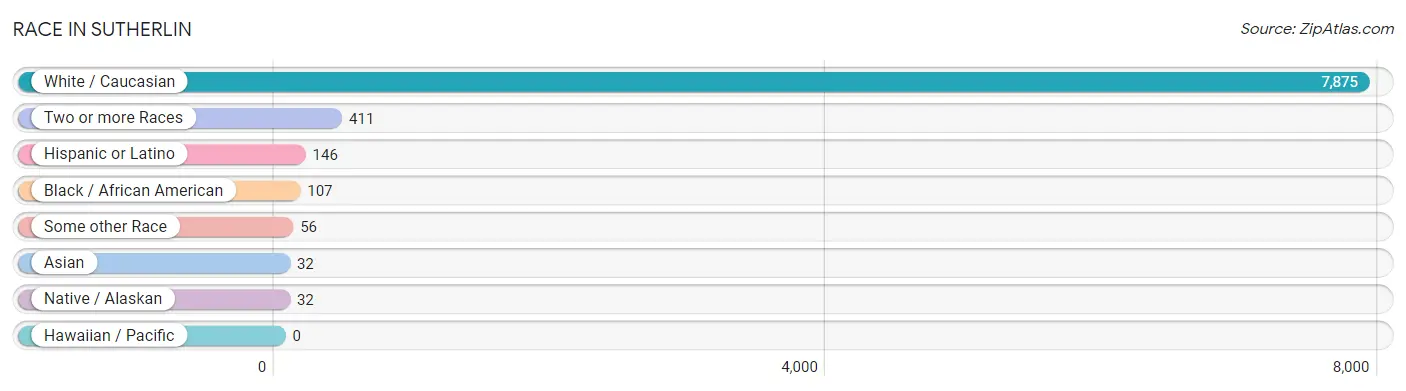
| Race | # Population | % Population |
| Asian | 32 | 0.4% |
| Black / African American | 107 | 1.3% |
| Hawaiian / Pacific | 0 | 0.0% |
| Hispanic or Latino | 146 | 1.7% |
| Native / Alaskan | 32 | 0.4% |
| White / Caucasian | 7,875 | 92.5% |
| Two or more Races | 411 | 4.8% |
| Some other Race | 56 | 0.7% |
| Total | 8,513 | 100.0% |
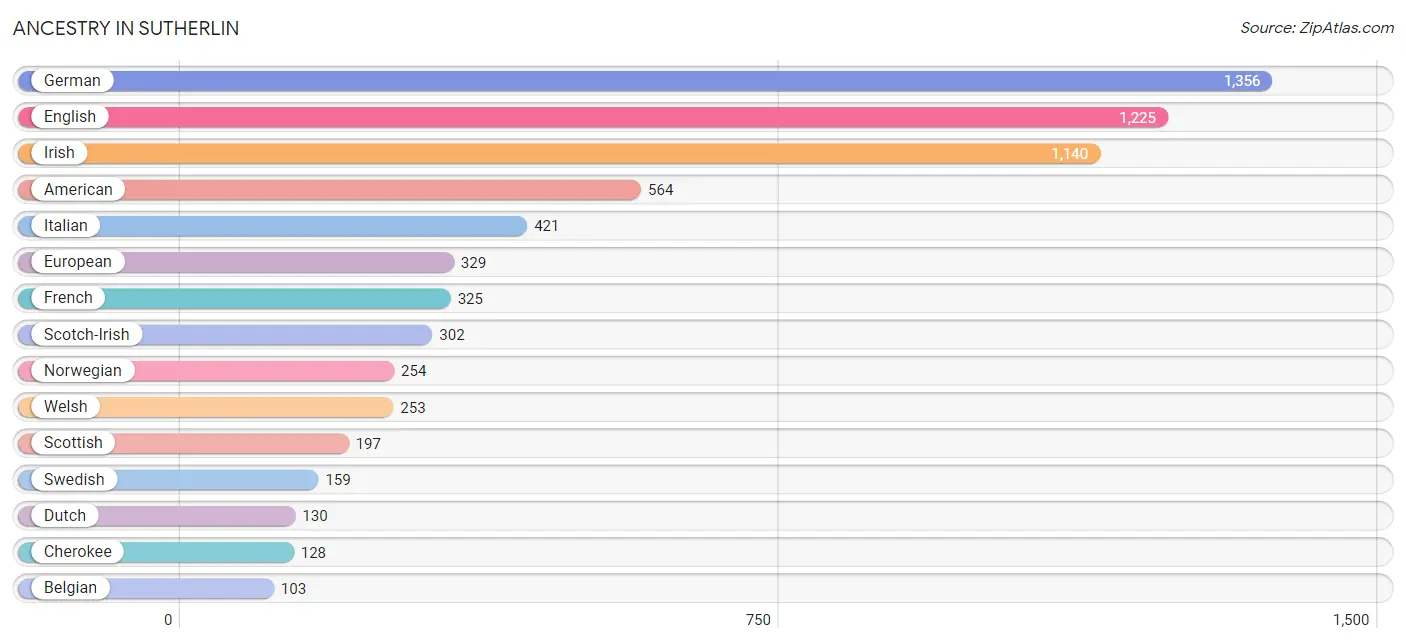
Ancestry in Sutherlin
The most populous ancestries reported in Sutherlin are German (1,356 | 15.9%), English (1,225 | 14.4%), Irish (1,140 | 13.4%), American (564 | 6.6%), and Italian (421 | 5.0%), together accounting for 55.3% of all Sutherlin residents.
| Ancestry | # Population | % Population |
| American | 564 | 6.6% |
| Arab | 16 | 0.2% |
| Austrian | 62 | 0.7% |
| Belgian | 103 | 1.2% |
| Blackfeet | 12 | 0.1% |
| British | 52 | 0.6% |
| Burmese | 21 | 0.3% |
| Canadian | 18 | 0.2% |
| Cherokee | 128 | 1.5% |
| Chickasaw | 18 | 0.2% |
| Colombian | 19 | 0.2% |
| Czechoslovakian | 14 | 0.2% |
| Danish | 54 | 0.6% |
| Dutch | 130 | 1.5% |
| Eastern European | 22 | 0.3% |
| English | 1,225 | 14.4% |
| European | 329 | 3.9% |
| Finnish | 12 | 0.1% |
| French | 325 | 3.8% |
| French Canadian | 21 | 0.3% |
| German | 1,356 | 15.9% |
| Hungarian | 9 | 0.1% |
| Indian (Asian) | 20 | 0.2% |
| Irish | 1,140 | 13.4% |
| Italian | 421 | 5.0% |
| Korean | 9 | 0.1% |
| Latvian | 36 | 0.4% |
| Lebanese | 16 | 0.2% |
| Mexican | 97 | 1.1% |
| Northern European | 17 | 0.2% |
| Norwegian | 254 | 3.0% |
| Polish | 94 | 1.1% |
| Portuguese | 10 | 0.1% |
| Puerto Rican | 16 | 0.2% |
| Russian | 61 | 0.7% |
| Scandinavian | 16 | 0.2% |
| Scotch-Irish | 302 | 3.5% |
| Scottish | 197 | 2.3% |
| South American | 19 | 0.2% |
| Spanish | 14 | 0.2% |
| Sri Lankan | 6 | 0.1% |
| Swedish | 159 | 1.9% |
| Swiss | 16 | 0.2% |
| Welsh | 253 | 3.0% | View All 44 Rows |
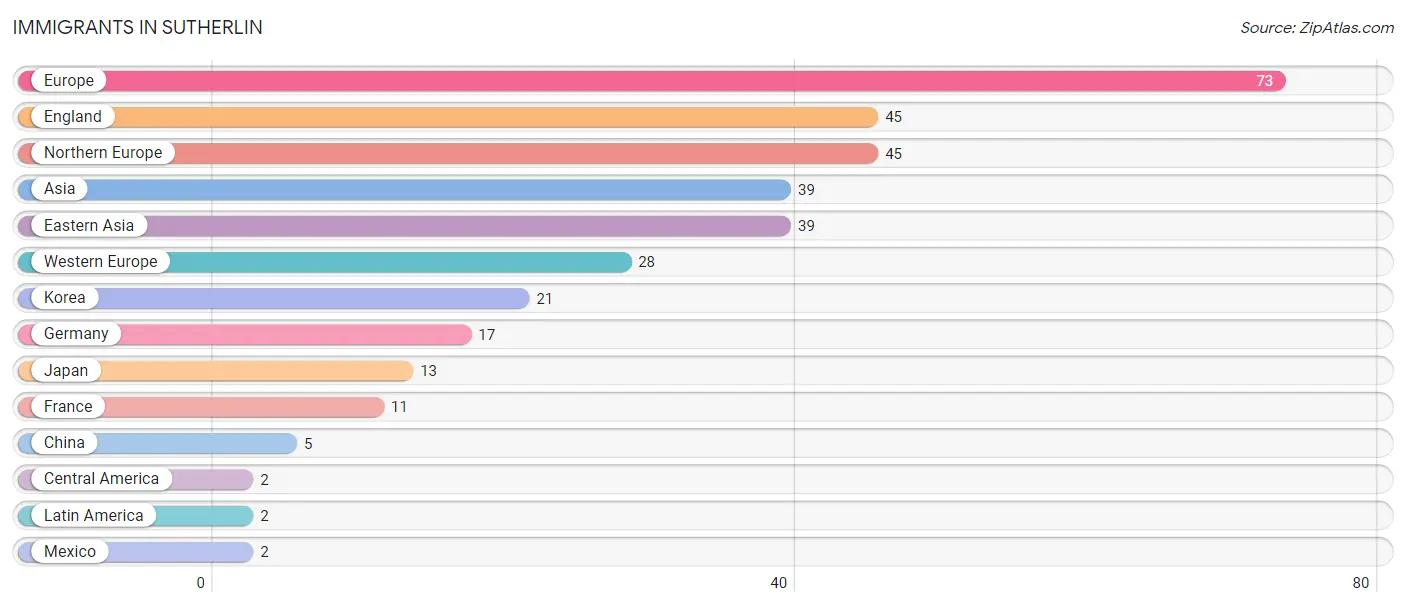
Immigrants in Sutherlin
The most numerous immigrant groups reported in Sutherlin came from Europe (73 | 0.9%), England (45 | 0.5%), Northern Europe (45 | 0.5%), Asia (39 | 0.5%), and Eastern Asia (39 | 0.5%), together accounting for 2.8% of all Sutherlin residents.
| Immigration Origin | # Population | % Population |
| Asia | 39 | 0.5% |
| Central America | 2 | 0.0% |
| China | 5 | 0.1% |
| Eastern Asia | 39 | 0.5% |
| England | 45 | 0.5% |
| Europe | 73 | 0.9% |
| France | 11 | 0.1% |
| Germany | 17 | 0.2% |
| Japan | 13 | 0.2% |
| Korea | 21 | 0.3% |
| Latin America | 2 | 0.0% |
| Mexico | 2 | 0.0% |
| Northern Europe | 45 | 0.5% |
| Western Europe | 28 | 0.3% | View All 14 Rows |
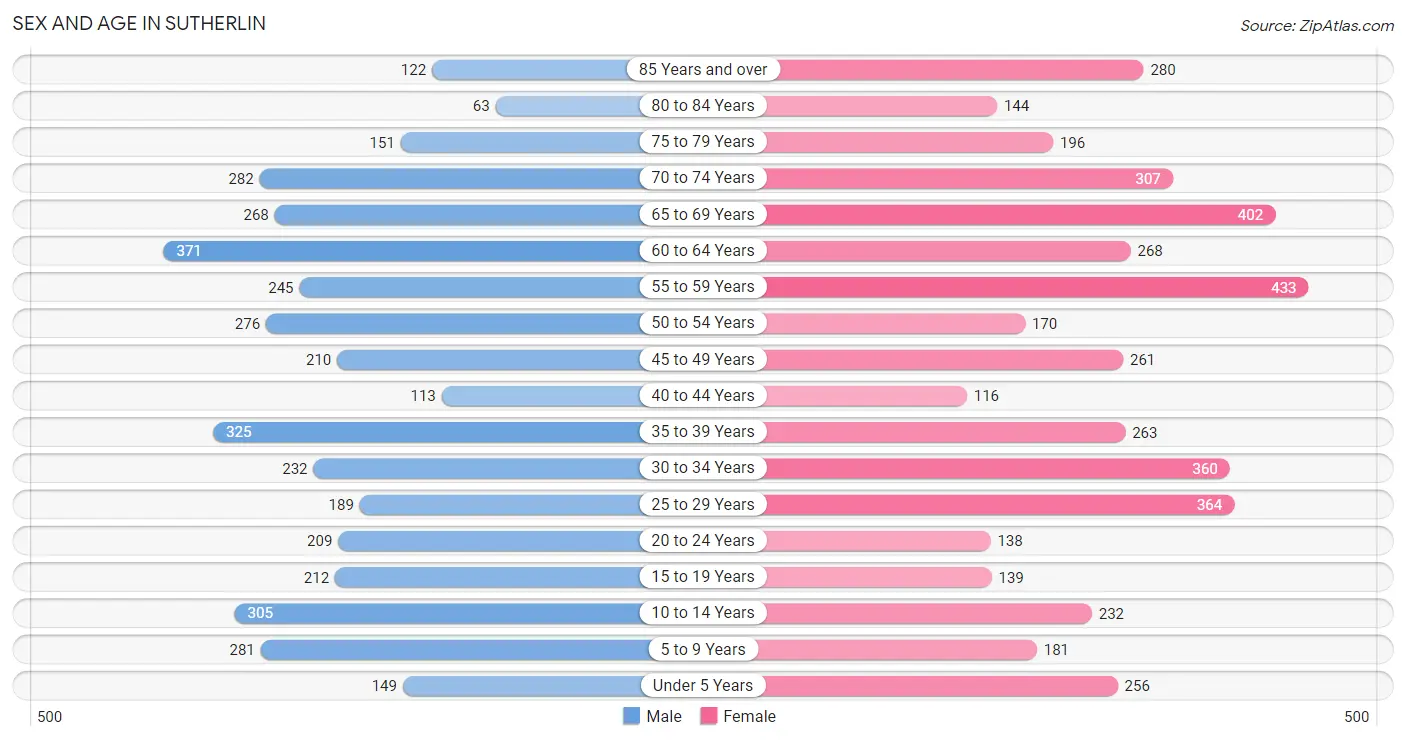
Sex and Age in Sutherlin
Sex and Age in Sutherlin
The most populous age groups in Sutherlin are 60 to 64 Years (371 | 9.3%) for men and 55 to 59 Years (433 | 9.6%) for women.
| Age Bracket | Male | Female |
| Under 5 Years | 149 (3.7%) | 256 (5.7%) |
| 5 to 9 Years | 281 (7.0%) | 181 (4.0%) |
| 10 to 14 Years | 305 (7.6%) | 232 (5.1%) |
| 15 to 19 Years | 212 (5.3%) | 139 (3.1%) |
| 20 to 24 Years | 209 (5.2%) | 138 (3.1%) |
| 25 to 29 Years | 189 (4.7%) | 364 (8.1%) |
| 30 to 34 Years | 232 (5.8%) | 360 (8.0%) |
| 35 to 39 Years | 325 (8.1%) | 263 (5.8%) |
| 40 to 44 Years | 113 (2.8%) | 116 (2.6%) |
| 45 to 49 Years | 210 (5.2%) | 261 (5.8%) |
| 50 to 54 Years | 276 (6.9%) | 170 (3.8%) |
| 55 to 59 Years | 245 (6.1%) | 433 (9.6%) |
| 60 to 64 Years | 371 (9.3%) | 268 (5.9%) |
| 65 to 69 Years | 268 (6.7%) | 402 (8.9%) |
| 70 to 74 Years | 282 (7.0%) | 307 (6.8%) |
| 75 to 79 Years | 151 (3.8%) | 196 (4.3%) |
| 80 to 84 Years | 63 (1.6%) | 144 (3.2%) |
| 85 Years and over | 122 (3.0%) | 280 (6.2%) |
| Total | 4,003 (100.0%) | 4,510 (100.0%) |
Families and Households in Sutherlin
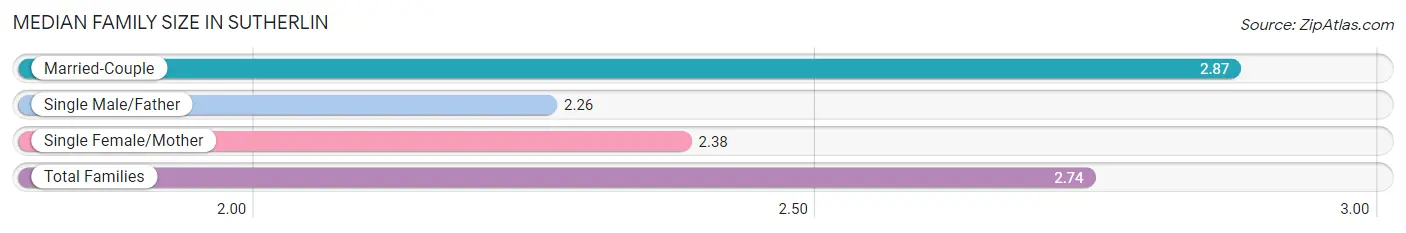
Median Family Size in Sutherlin
The median family size in Sutherlin is 2.74 persons per family, with married-couple families (1,639 | 75.9%) accounting for the largest median family size of 2.87 persons per family. On the other hand, single male/father families (145 | 6.7%) represent the smallest median family size with 2.26 persons per family.
| Family Type | # Families | Family Size |
| Married-Couple | 1,639 (75.9%) | 2.87 |
| Single Male/Father | 145 (6.7%) | 2.26 |
| Single Female/Mother | 376 (17.4%) | 2.38 |
| Total Families | 2,160 (100.0%) | 2.74 |
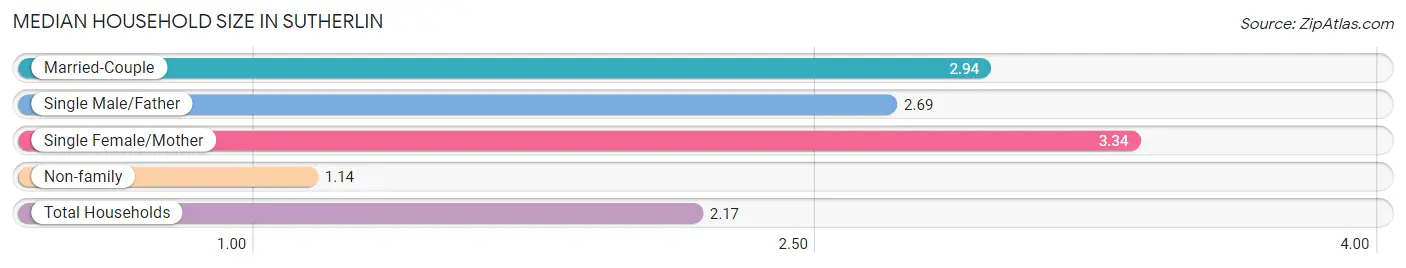
Median Household Size in Sutherlin
The median household size in Sutherlin is 2.17 persons per household, with single female/mother households (376 | 9.7%) accounting for the largest median household size of 3.34 persons per household. non-family households (1,725 | 44.4%) represent the smallest median household size with 1.14 persons per household.
| Household Type | # Households | Household Size |
| Married-Couple | 1,639 (42.2%) | 2.94 |
| Single Male/Father | 145 (3.7%) | 2.69 |
| Single Female/Mother | 376 (9.7%) | 3.34 |
| Non-family | 1,725 (44.4%) | 1.14 |
| Total Households | 3,885 (100.0%) | 2.17 |
Household Size by Marriage Status in Sutherlin
Out of a total of 3,885 households in Sutherlin, 2,160 (55.6%) are family households, while 1,725 (44.4%) are nonfamily households. The most numerous type of family households are 2-person households, comprising 1,090, and the most common type of nonfamily households are 1-person households, comprising 1,523.
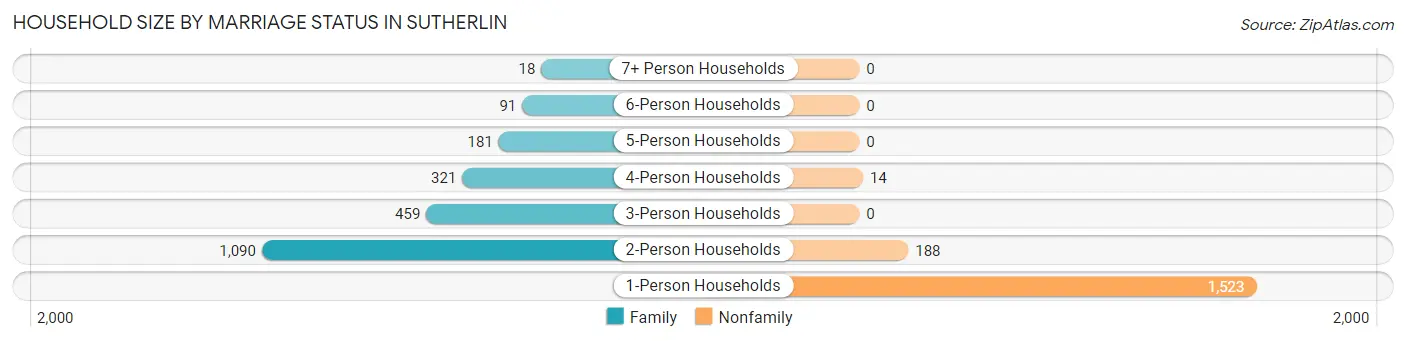
| Household Size | Family Households | Nonfamily Households |
| 1-Person Households | - | 1,523 (39.2%) |
| 2-Person Households | 1,090 (28.1%) | 188 (4.8%) |
| 3-Person Households | 459 (11.8%) | 0 (0.0%) |
| 4-Person Households | 321 (8.3%) | 14 (0.4%) |
| 5-Person Households | 181 (4.7%) | 0 (0.0%) |
| 6-Person Households | 91 (2.3%) | 0 (0.0%) |
| 7+ Person Households | 18 (0.5%) | 0 (0.0%) |
| Total | 2,160 (55.6%) | 1,725 (44.4%) |
Female Fertility in Sutherlin
Fertility by Age in Sutherlin
Average fertility rate in Sutherlin is 26.0 births per 1,000 women. Women in the age bracket of 35 to 50 years have the highest fertility rate with 49.0 births per 1,000 women. Women in the age bracket of 35 to 50 years acount for 79.5% of all women with births.
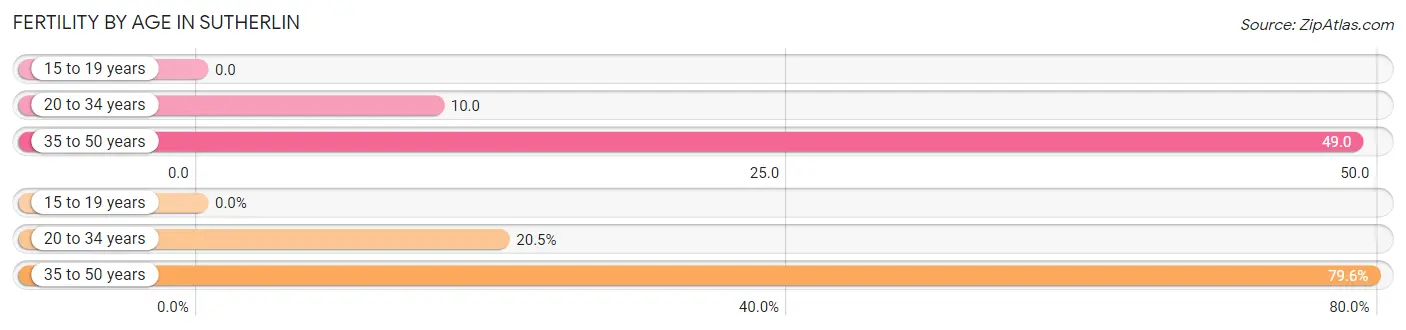
| Age Bracket | Women with Births | Births / 1,000 Women |
| 15 to 19 years | 0 (0.0%) | 0.0 |
| 20 to 34 years | 9 (20.4%) | 10.0 |
| 35 to 50 years | 35 (79.5%) | 49.0 |
| Total | 44 (100.0%) | 26.0 |
Fertility by Age by Marriage Status in Sutherlin
20.5% of women with births (44) in Sutherlin are married. The highest percentage of unmarried women with births falls into 35 to 50 years age bracket with 100.0% of them unmarried at the time of birth, while the lowest percentage of unmarried women with births belong to 20 to 34 years age bracket with 0.0% of them unmarried.
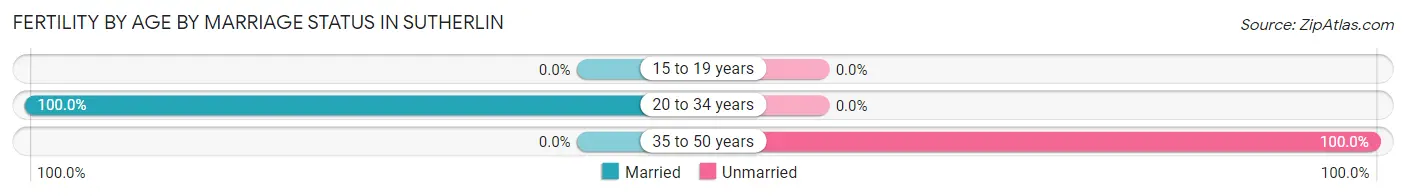
| Age Bracket | Married | Unmarried |
| 15 to 19 years | 0 (0.0%) | 0 (0.0%) |
| 20 to 34 years | 9 (100.0%) | 0 (0.0%) |
| 35 to 50 years | 0 (0.0%) | 35 (100.0%) |
| Total | 9 (20.4%) | 35 (79.5%) |
Fertility by Education in Sutherlin
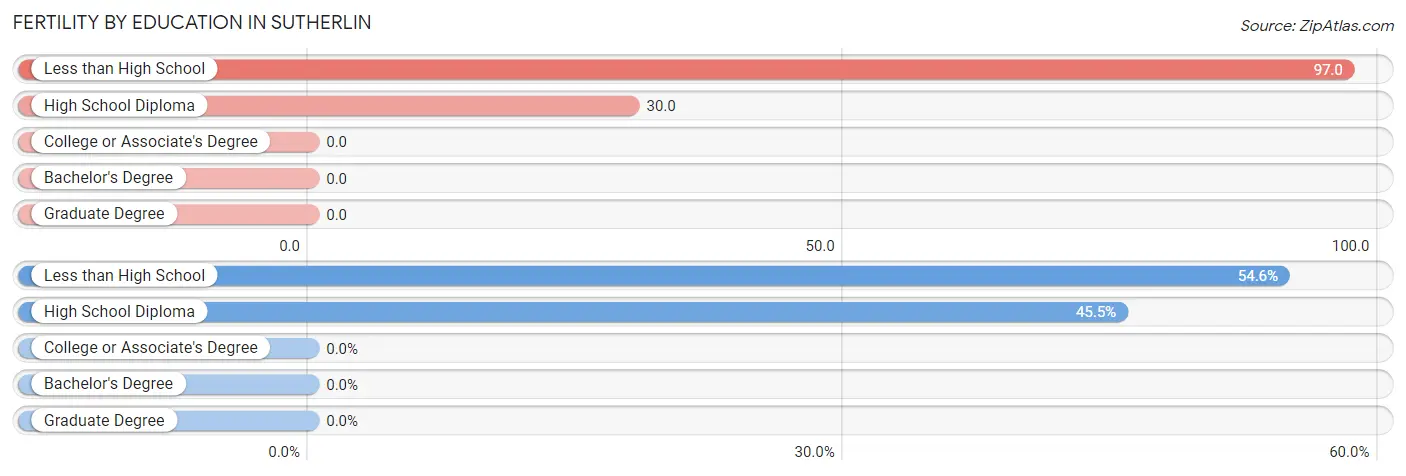
| Educational Attainment | Women with Births | Births / 1,000 Women |
| Less than High School | 24 (54.5%) | 97.0 |
| High School Diploma | 20 (45.5%) | 30.0 |
| College or Associate's Degree | 0 (0.0%) | 0.0 |
| Bachelor's Degree | 0 (0.0%) | 0.0 |
| Graduate Degree | 0 (0.0%) | 0.0 |
| Total | 44 (100.0%) | 26.0 |
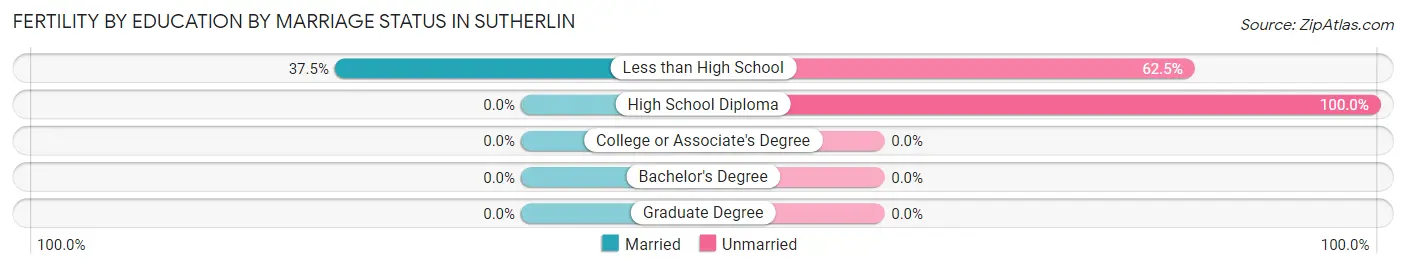
Fertility by Education by Marriage Status in Sutherlin
79.5% of women with births in Sutherlin are unmarried. Women with the educational attainment of less than high school are most likely to be married with 37.5% of them married at childbirth, while women with the educational attainment of high school diploma are least likely to be married with 100.0% of them unmarried at childbirth.
| Educational Attainment | Married | Unmarried |
| Less than High School | 9 (37.5%) | 15 (62.5%) |
| High School Diploma | 0 (0.0%) | 20 (100.0%) |
| College or Associate's Degree | 0 (0.0%) | 0 (0.0%) |
| Bachelor's Degree | 0 (0.0%) | 0 (0.0%) |
| Graduate Degree | 0 (0.0%) | 0 (0.0%) |
| Total | 9 (20.4%) | 35 (79.5%) |
Employment Characteristics in Sutherlin
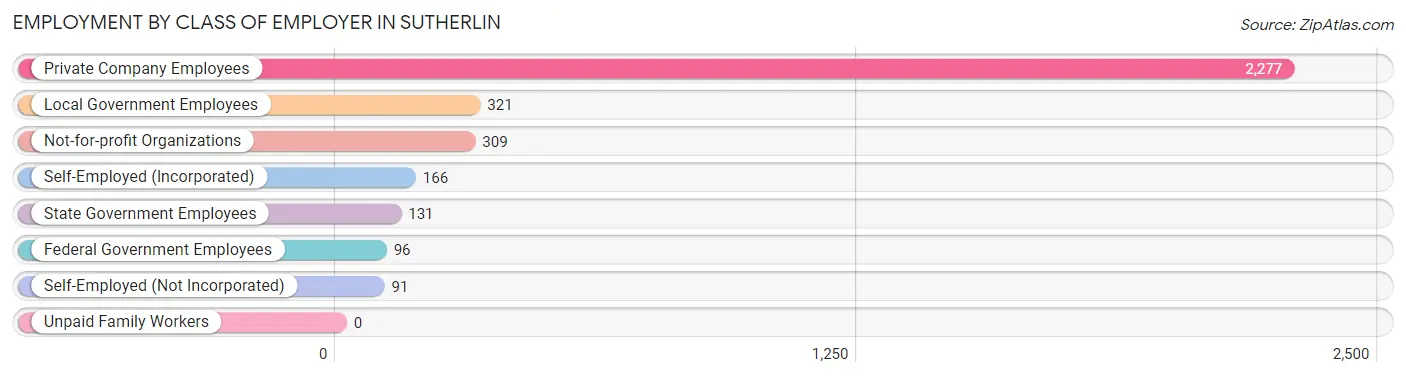
Employment by Class of Employer in Sutherlin
Among the 3,391 employed individuals in Sutherlin, private company employees (2,277 | 67.1%), local government employees (321 | 9.5%), and not-for-profit organizations (309 | 9.1%) make up the most common classes of employment.
| Employer Class | # Employees | % Employees |
| Private Company Employees | 2,277 | 67.1% |
| Self-Employed (Incorporated) | 166 | 4.9% |
| Self-Employed (Not Incorporated) | 91 | 2.7% |
| Not-for-profit Organizations | 309 | 9.1% |
| Local Government Employees | 321 | 9.5% |
| State Government Employees | 131 | 3.9% |
| Federal Government Employees | 96 | 2.8% |
| Unpaid Family Workers | 0 | 0.0% |
| Total | 3,391 | 100.0% |
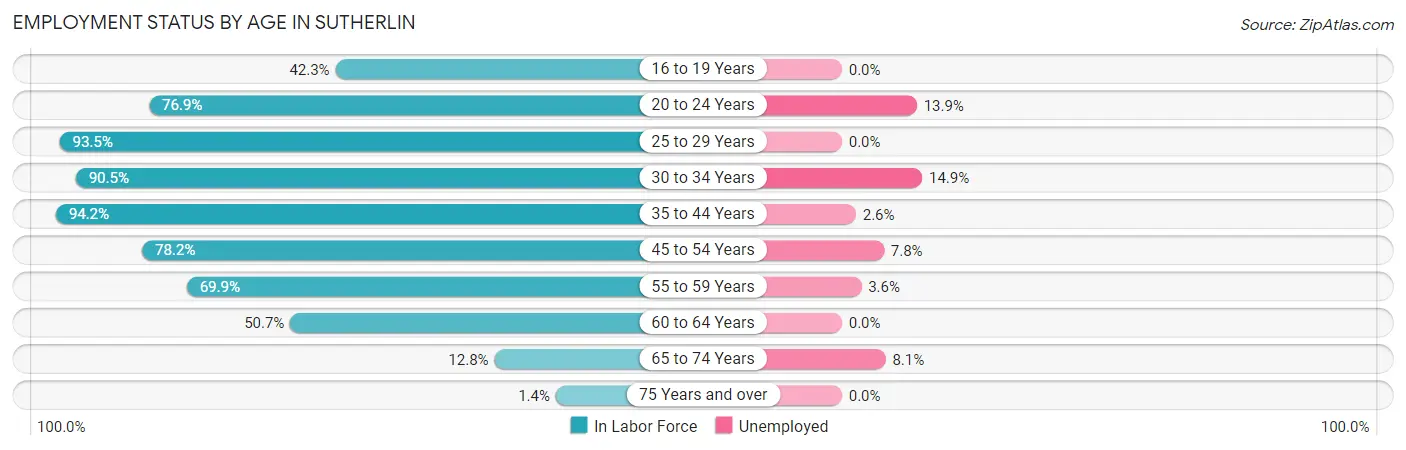
Employment Status by Age in Sutherlin
According to the labor force statistics for Sutherlin, out of the total population over 16 years of age (7,063), 55.3% or 3,906 individuals are in the labor force, with 5.7% or 223 of them unemployed. The age group with the highest labor force participation rate is 35 to 44 years, with 94.2% or 770 individuals in the labor force. Within the labor force, the 30 to 34 years age range has the highest percentage of unemployed individuals, with 14.9% or 80 of them being unemployed.
| Age Bracket | In Labor Force | Unemployed |
| 16 to 19 Years | 129 (42.3%) | 0 (0.0%) |
| 20 to 24 Years | 267 (76.9%) | 37 (13.9%) |
| 25 to 29 Years | 517 (93.5%) | 0 (0.0%) |
| 30 to 34 Years | 536 (90.5%) | 80 (14.9%) |
| 35 to 44 Years | 770 (94.2%) | 20 (2.6%) |
| 45 to 54 Years | 717 (78.2%) | 56 (7.8%) |
| 55 to 59 Years | 474 (69.9%) | 17 (3.6%) |
| 60 to 64 Years | 324 (50.7%) | 0 (0.0%) |
| 65 to 74 Years | 161 (12.8%) | 13 (8.1%) |
| 75 Years and over | 13 (1.4%) | 0 (0.0%) |
| Total | 3,906 (55.3%) | 223 (5.7%) |
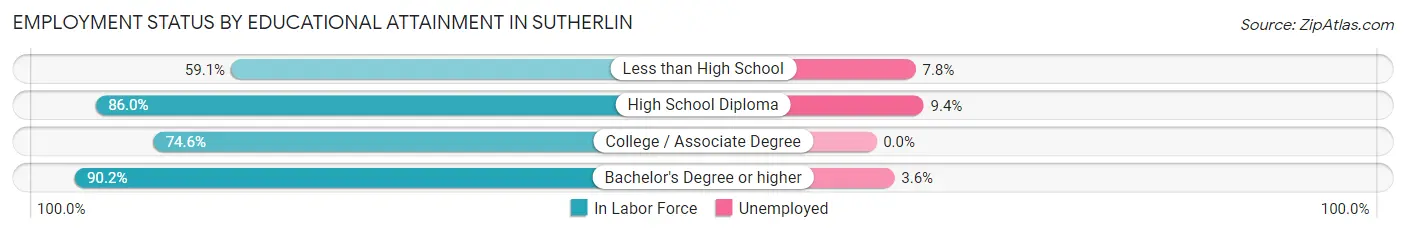
Employment Status by Educational Attainment in Sutherlin
According to labor force statistics for Sutherlin, 79.6% of individuals (3,340) out of the total population between 25 and 64 years of age (4,196) are in the labor force, with 5.2% or 174 of them being unemployed. The group with the highest labor force participation rate are those with the educational attainment of bachelor's degree or higher, with 90.2% or 472 individuals in the labor force. Within the labor force, individuals with high school diploma education have the highest percentage of unemployment, with 9.4% or 136 of them being unemployed.
| Educational Attainment | In Labor Force | Unemployed |
| Less than High School | 256 (59.1%) | 34 (7.8%) |
| High School Diploma | 1,448 (86.0%) | 158 (9.4%) |
| College / Associate Degree | 1,161 (74.6%) | 0 (0.0%) |
| Bachelor's Degree or higher | 472 (90.2%) | 19 (3.6%) |
| Total | 3,340 (79.6%) | 218 (5.2%) |
Employment Occupations by Sex in Sutherlin
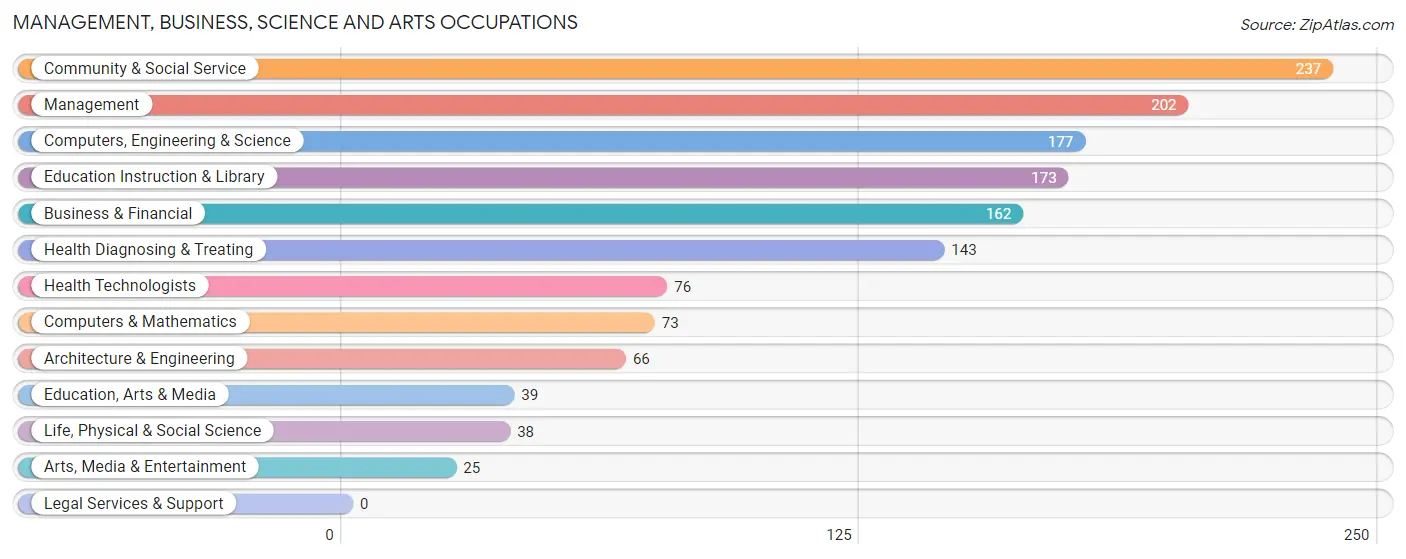
Management, Business, Science and Arts Occupations
The most common Management, Business, Science and Arts occupations in Sutherlin are Community & Social Service (237 | 6.5%), Management (202 | 5.5%), Computers, Engineering & Science (177 | 4.8%), Education Instruction & Library (173 | 4.7%), and Business & Financial (162 | 4.4%).
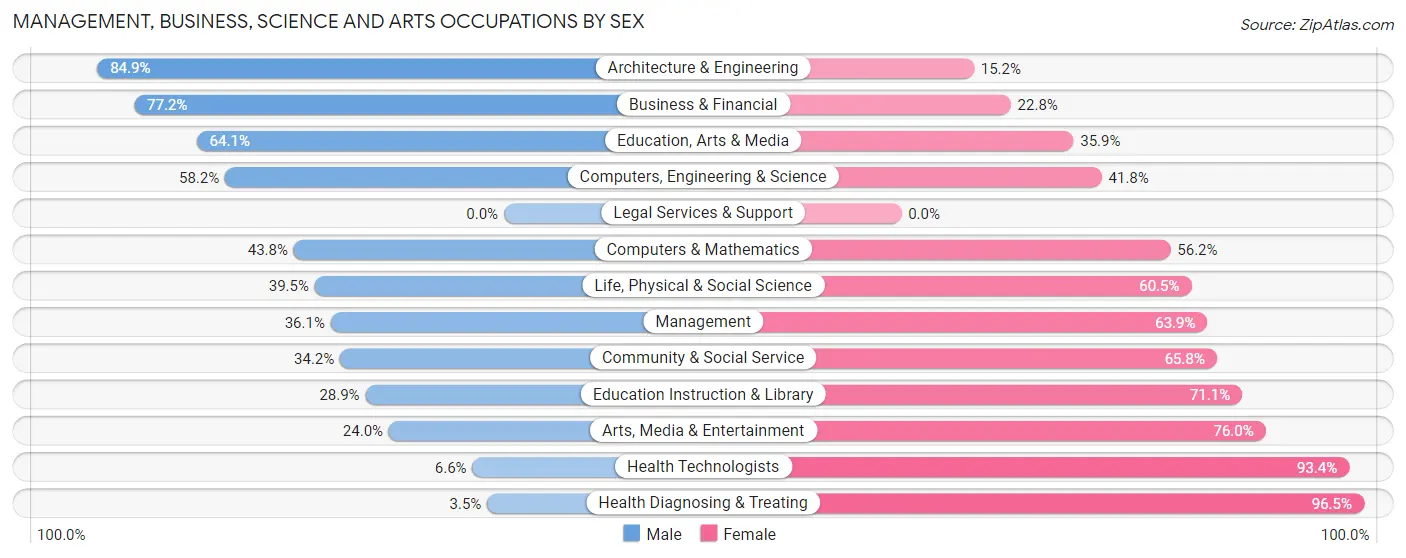
Management, Business, Science and Arts Occupations by Sex
Within the Management, Business, Science and Arts occupations in Sutherlin, the most male-oriented occupations are Architecture & Engineering (84.9%), Business & Financial (77.2%), and Education, Arts & Media (64.1%), while the most female-oriented occupations are Health Diagnosing & Treating (96.5%), Health Technologists (93.4%), and Arts, Media & Entertainment (76.0%).
| Occupation | Male | Female |
| Management | 73 (36.1%) | 129 (63.9%) |
| Business & Financial | 125 (77.2%) | 37 (22.8%) |
| Computers, Engineering & Science | 103 (58.2%) | 74 (41.8%) |
| Computers & Mathematics | 32 (43.8%) | 41 (56.2%) |
| Architecture & Engineering | 56 (84.9%) | 10 (15.1%) |
| Life, Physical & Social Science | 15 (39.5%) | 23 (60.5%) |
| Community & Social Service | 81 (34.2%) | 156 (65.8%) |
| Education, Arts & Media | 25 (64.1%) | 14 (35.9%) |
| Legal Services & Support | 0 (0.0%) | 0 (0.0%) |
| Education Instruction & Library | 50 (28.9%) | 123 (71.1%) |
| Arts, Media & Entertainment | 6 (24.0%) | 19 (76.0%) |
| Health Diagnosing & Treating | 5 (3.5%) | 138 (96.5%) |
| Health Technologists | 5 (6.6%) | 71 (93.4%) |
| Total (Category) | 387 (42.0%) | 534 (58.0%) |
| Total (Overall) | 1,652 (45.1%) | 2,011 (54.9%) |
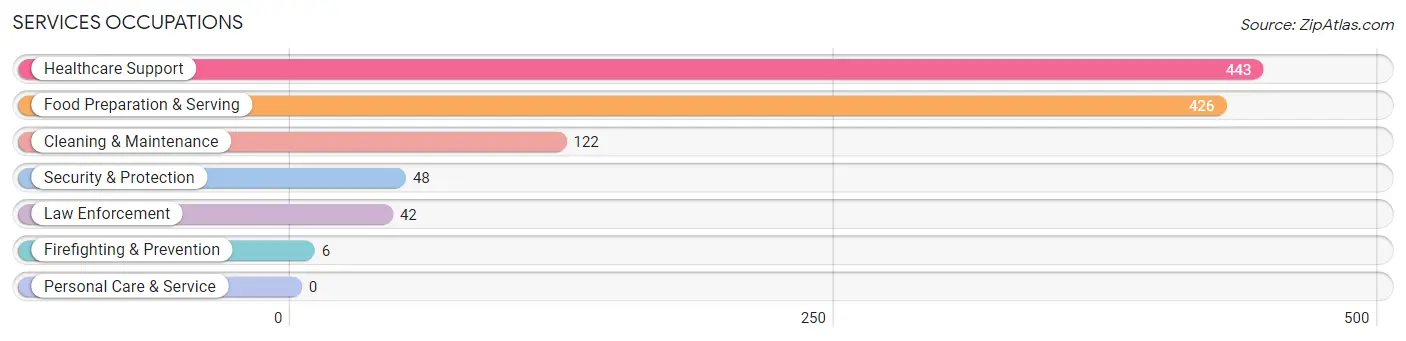
Services Occupations
The most common Services occupations in Sutherlin are Healthcare Support (443 | 12.1%), Food Preparation & Serving (426 | 11.6%), Cleaning & Maintenance (122 | 3.3%), Security & Protection (48 | 1.3%), and Law Enforcement (42 | 1.1%).
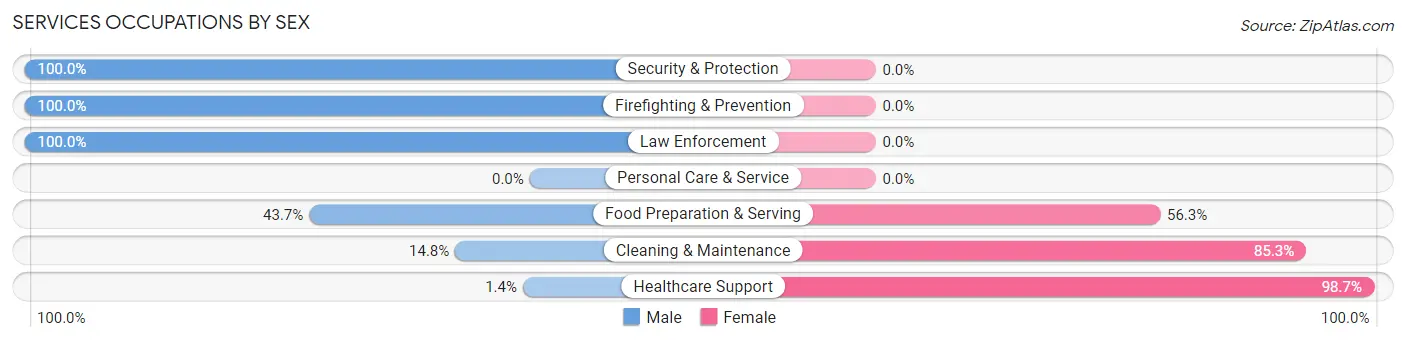
Services Occupations by Sex
Within the Services occupations in Sutherlin, the most male-oriented occupations are Security & Protection (100.0%), Firefighting & Prevention (100.0%), and Law Enforcement (100.0%), while the most female-oriented occupations are Healthcare Support (98.7%), Cleaning & Maintenance (85.3%), and Food Preparation & Serving (56.3%).
| Occupation | Male | Female |
| Healthcare Support | 6 (1.3%) | 437 (98.7%) |
| Security & Protection | 48 (100.0%) | 0 (0.0%) |
| Firefighting & Prevention | 6 (100.0%) | 0 (0.0%) |
| Law Enforcement | 42 (100.0%) | 0 (0.0%) |
| Food Preparation & Serving | 186 (43.7%) | 240 (56.3%) |
| Cleaning & Maintenance | 18 (14.7%) | 104 (85.3%) |
| Personal Care & Service | 0 (0.0%) | 0 (0.0%) |
| Total (Category) | 258 (24.8%) | 781 (75.2%) |
| Total (Overall) | 1,652 (45.1%) | 2,011 (54.9%) |
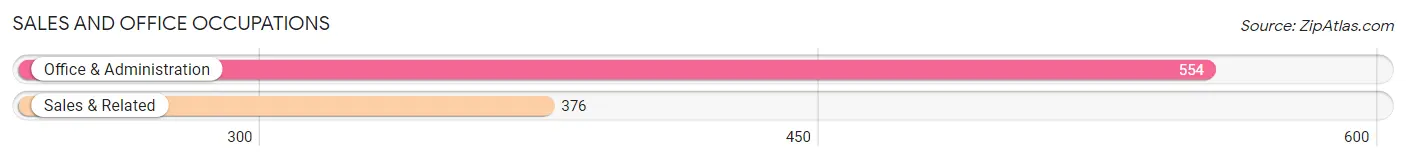
Sales and Office Occupations
The most common Sales and Office occupations in Sutherlin are Office & Administration (554 | 15.1%), and Sales & Related (376 | 10.3%).
Sales and Office Occupations by Sex
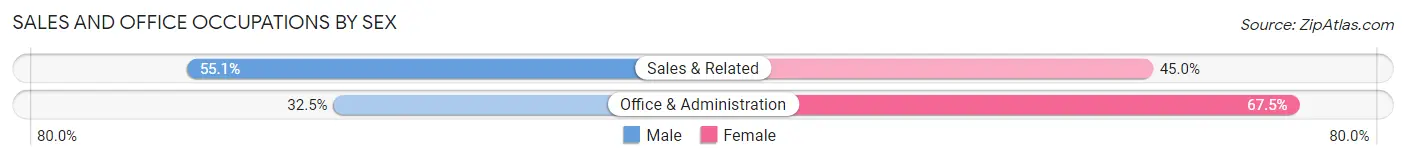
| Occupation | Male | Female |
| Sales & Related | 207 (55.0%) | 169 (45.0%) |
| Office & Administration | 180 (32.5%) | 374 (67.5%) |
| Total (Category) | 387 (41.6%) | 543 (58.4%) |
| Total (Overall) | 1,652 (45.1%) | 2,011 (54.9%) |
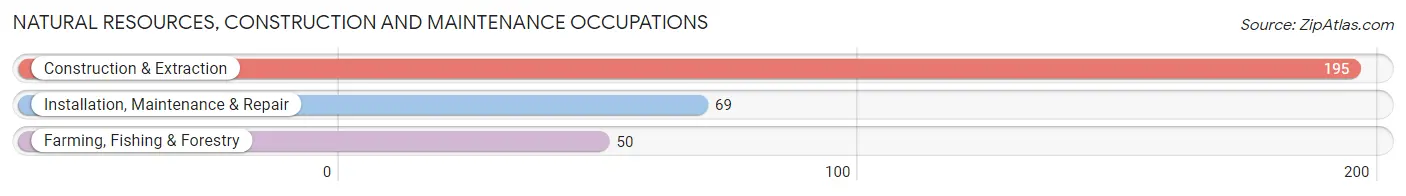
Natural Resources, Construction and Maintenance Occupations
The most common Natural Resources, Construction and Maintenance occupations in Sutherlin are Construction & Extraction (195 | 5.3%), Installation, Maintenance & Repair (69 | 1.9%), and Farming, Fishing & Forestry (50 | 1.4%).
Natural Resources, Construction and Maintenance Occupations by Sex
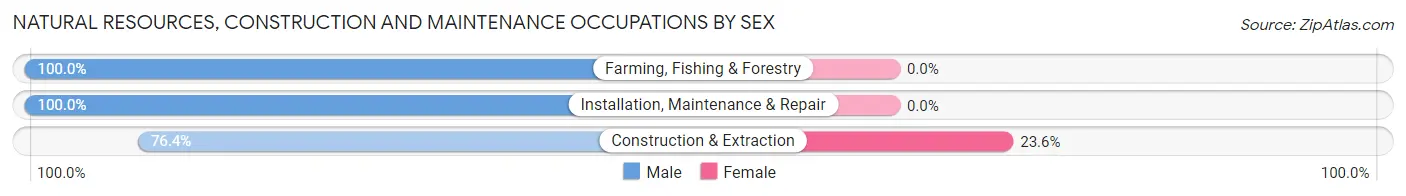
| Occupation | Male | Female |
| Farming, Fishing & Forestry | 50 (100.0%) | 0 (0.0%) |
| Construction & Extraction | 149 (76.4%) | 46 (23.6%) |
| Installation, Maintenance & Repair | 69 (100.0%) | 0 (0.0%) |
| Total (Category) | 268 (85.4%) | 46 (14.6%) |
| Total (Overall) | 1,652 (45.1%) | 2,011 (54.9%) |
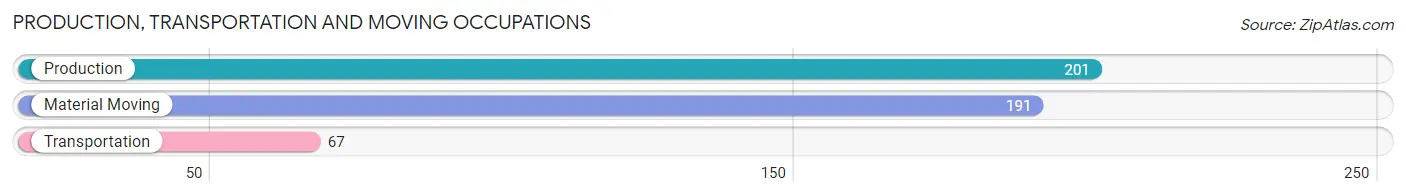
Production, Transportation and Moving Occupations
The most common Production, Transportation and Moving occupations in Sutherlin are Production (201 | 5.5%), Material Moving (191 | 5.2%), and Transportation (67 | 1.8%).
Production, Transportation and Moving Occupations by Sex
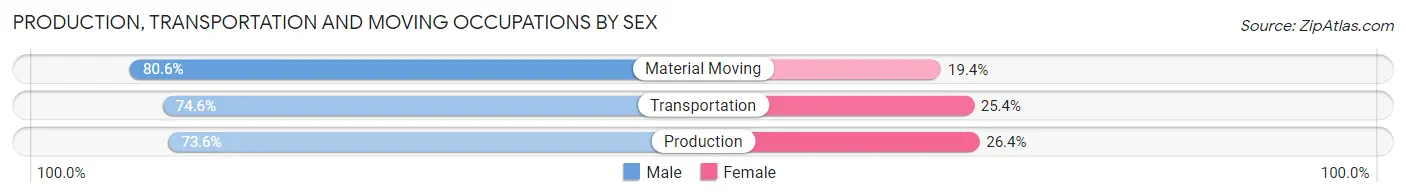
| Occupation | Male | Female |
| Production | 148 (73.6%) | 53 (26.4%) |
| Transportation | 50 (74.6%) | 17 (25.4%) |
| Material Moving | 154 (80.6%) | 37 (19.4%) |
| Total (Category) | 352 (76.7%) | 107 (23.3%) |
| Total (Overall) | 1,652 (45.1%) | 2,011 (54.9%) |
Employment Industries by Sex in Sutherlin
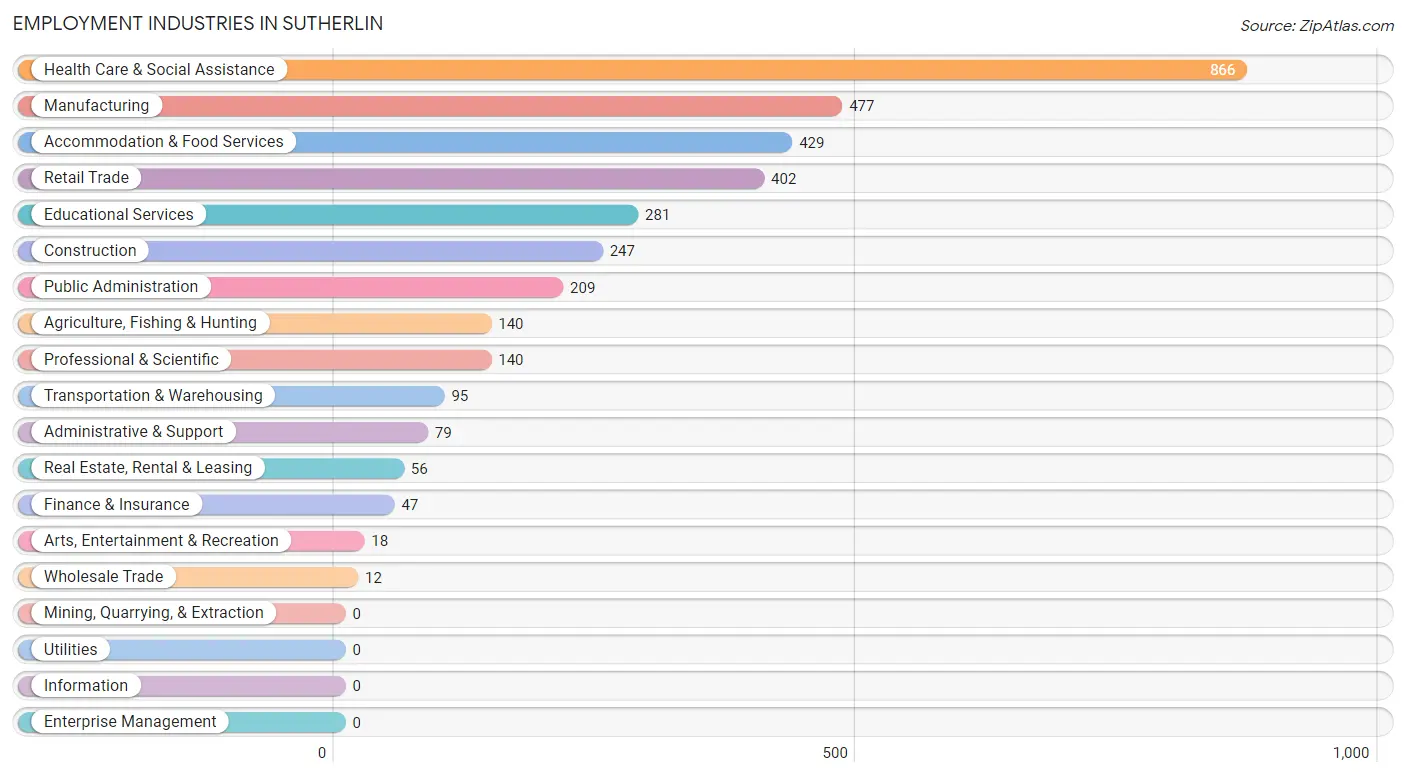
Employment Industries in Sutherlin
The major employment industries in Sutherlin include Health Care & Social Assistance (866 | 23.6%), Manufacturing (477 | 13.0%), Accommodation & Food Services (429 | 11.7%), Retail Trade (402 | 11.0%), and Educational Services (281 | 7.7%).
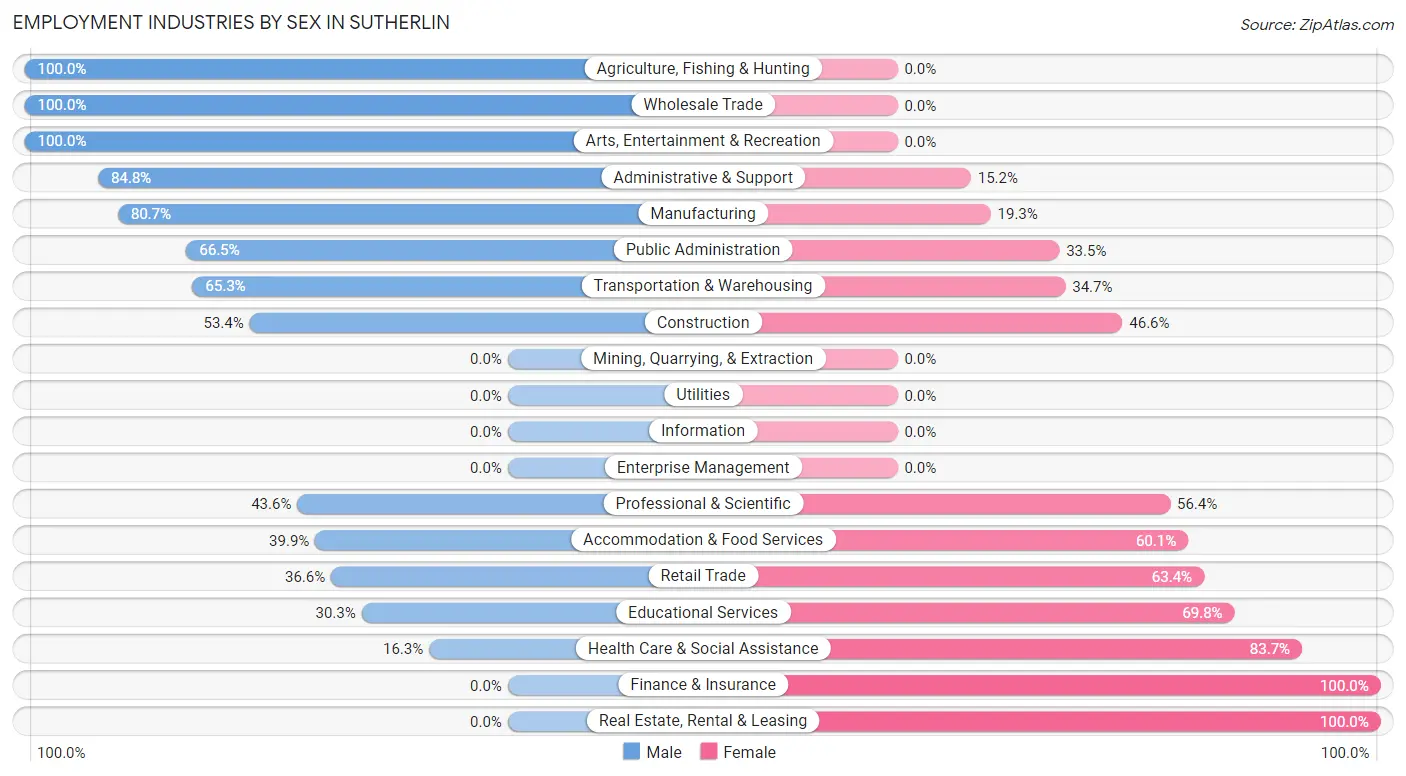
Employment Industries by Sex in Sutherlin
The Sutherlin industries that see more men than women are Agriculture, Fishing & Hunting (100.0%), Wholesale Trade (100.0%), and Arts, Entertainment & Recreation (100.0%), whereas the industries that tend to have a higher number of women are Finance & Insurance (100.0%), Real Estate, Rental & Leasing (100.0%), and Health Care & Social Assistance (83.7%).
| Industry | Male | Female |
| Agriculture, Fishing & Hunting | 140 (100.0%) | 0 (0.0%) |
| Mining, Quarrying, & Extraction | 0 (0.0%) | 0 (0.0%) |
| Construction | 132 (53.4%) | 115 (46.6%) |
| Manufacturing | 385 (80.7%) | 92 (19.3%) |
| Wholesale Trade | 12 (100.0%) | 0 (0.0%) |
| Retail Trade | 147 (36.6%) | 255 (63.4%) |
| Transportation & Warehousing | 62 (65.3%) | 33 (34.7%) |
| Utilities | 0 (0.0%) | 0 (0.0%) |
| Information | 0 (0.0%) | 0 (0.0%) |
| Finance & Insurance | 0 (0.0%) | 47 (100.0%) |
| Real Estate, Rental & Leasing | 0 (0.0%) | 56 (100.0%) |
| Professional & Scientific | 61 (43.6%) | 79 (56.4%) |
| Enterprise Management | 0 (0.0%) | 0 (0.0%) |
| Administrative & Support | 67 (84.8%) | 12 (15.2%) |
| Educational Services | 85 (30.2%) | 196 (69.8%) |
| Health Care & Social Assistance | 141 (16.3%) | 725 (83.7%) |
| Arts, Entertainment & Recreation | 18 (100.0%) | 0 (0.0%) |
| Accommodation & Food Services | 171 (39.9%) | 258 (60.1%) |
| Public Administration | 139 (66.5%) | 70 (33.5%) |
| Total | 1,652 (45.1%) | 2,011 (54.9%) |
Education in Sutherlin
School Enrollment in Sutherlin
The most common levels of schooling among the 1,534 students in Sutherlin are middle school (448 | 29.2%), high school (338 | 22.0%), and elementary school (303 | 19.8%).
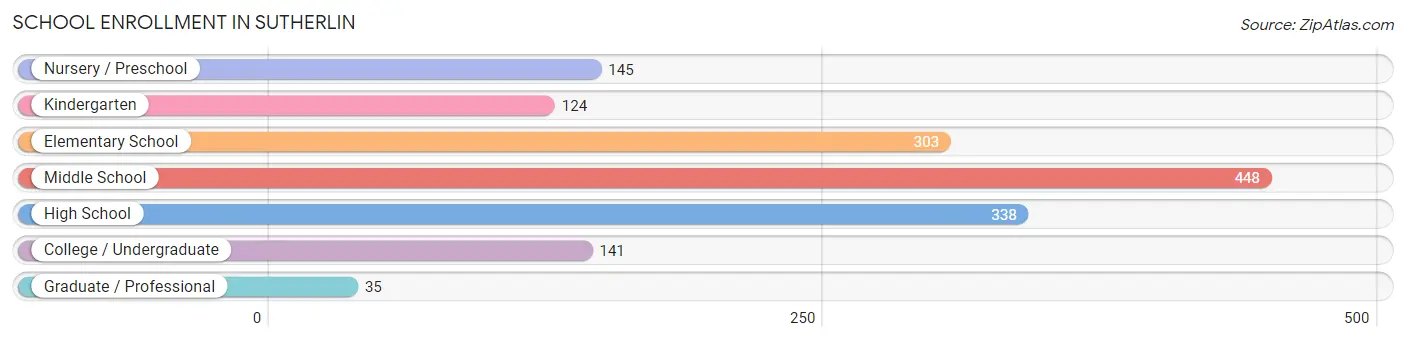
| School Level | # Students | % Students |
| Nursery / Preschool | 145 | 9.5% |
| Kindergarten | 124 | 8.1% |
| Elementary School | 303 | 19.8% |
| Middle School | 448 | 29.2% |
| High School | 338 | 22.0% |
| College / Undergraduate | 141 | 9.2% |
| Graduate / Professional | 35 | 2.3% |
| Total | 1,534 | 100.0% |
School Enrollment by Age by Funding Source in Sutherlin
Out of a total of 1,534 students who are enrolled in schools in Sutherlin, 195 (12.7%) attend a private institution, while the remaining 1,339 (87.3%) are enrolled in public schools. The age group of 3 to 4 year olds has the highest likelihood of being enrolled in private schools, with 69 (57.0% in the age bracket) enrolled. Conversely, the age group of 15 to 17 year olds has the lowest likelihood of being enrolled in a private school, with 247 (100.0% in the age bracket) attending a public institution.
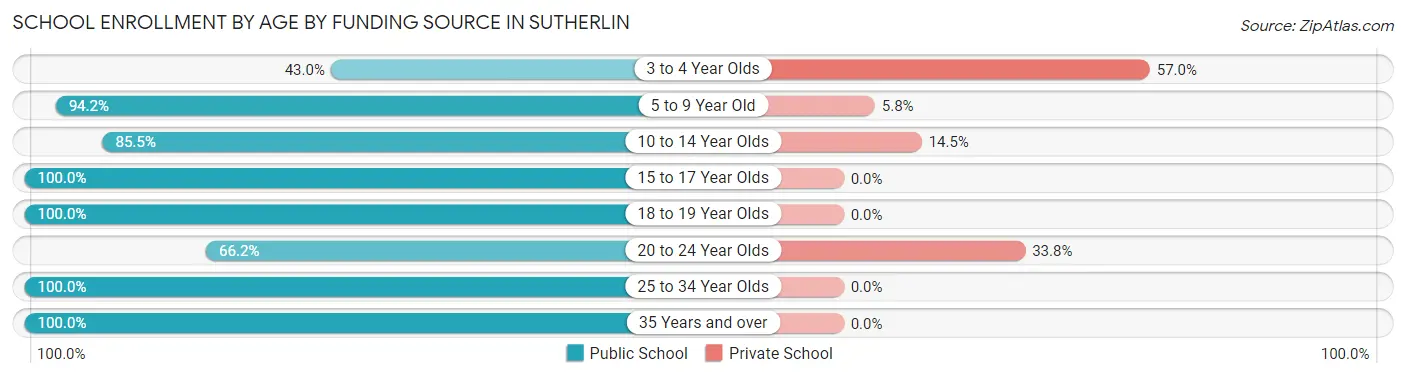
| Age Bracket | Public School | Private School |
| 3 to 4 Year Olds | 52 (43.0%) | 69 (57.0%) |
| 5 to 9 Year Old | 406 (94.2%) | 25 (5.8%) |
| 10 to 14 Year Olds | 459 (85.5%) | 78 (14.5%) |
| 15 to 17 Year Olds | 247 (100.0%) | 0 (0.0%) |
| 18 to 19 Year Olds | 52 (100.0%) | 0 (0.0%) |
| 20 to 24 Year Olds | 45 (66.2%) | 23 (33.8%) |
| 25 to 34 Year Olds | 42 (100.0%) | 0 (0.0%) |
| 35 Years and over | 36 (100.0%) | 0 (0.0%) |
| Total | 1,339 (87.3%) | 195 (12.7%) |
Educational Attainment by Field of Study in Sutherlin
Education (319 | 30.3%), business (165 | 15.7%), bio, nature & agricultural (114 | 10.8%), computers & mathematics (89 | 8.5%), and social sciences (79 | 7.5%) are the most common fields of study among 1,051 individuals in Sutherlin who have obtained a bachelor's degree or higher.
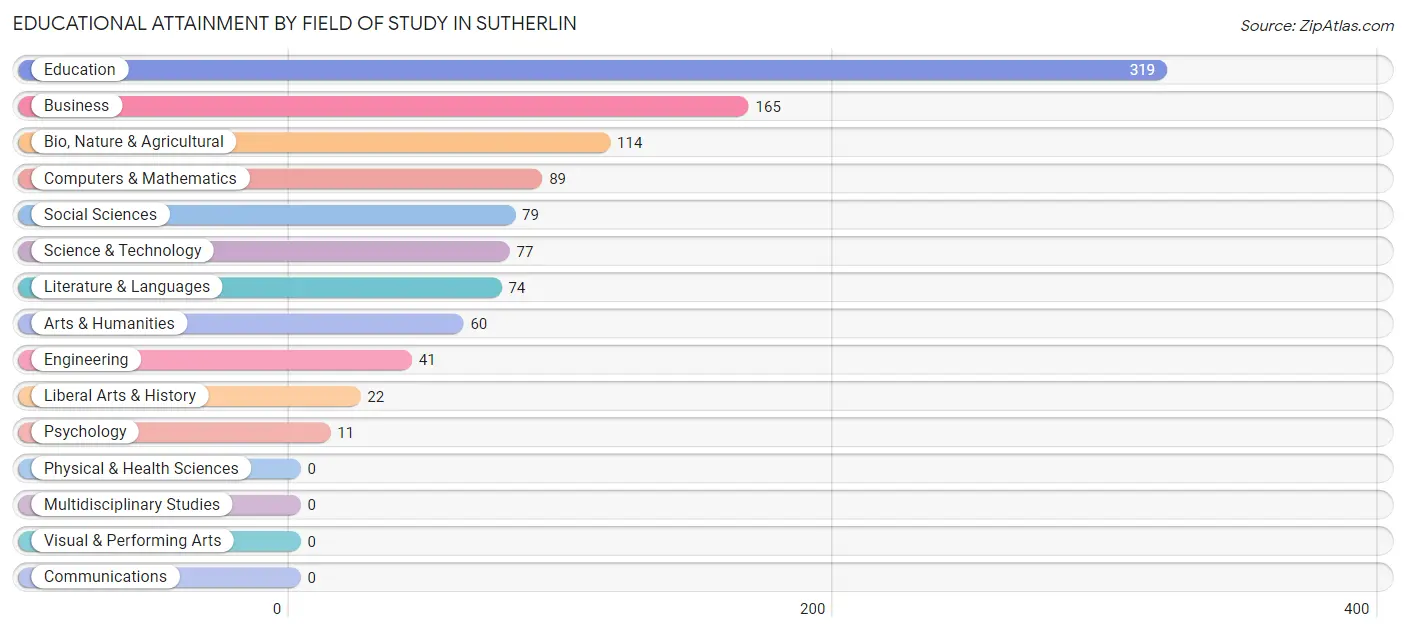
| Field of Study | # Graduates | % Graduates |
| Computers & Mathematics | 89 | 8.5% |
| Bio, Nature & Agricultural | 114 | 10.8% |
| Physical & Health Sciences | 0 | 0.0% |
| Psychology | 11 | 1.1% |
| Social Sciences | 79 | 7.5% |
| Engineering | 41 | 3.9% |
| Multidisciplinary Studies | 0 | 0.0% |
| Science & Technology | 77 | 7.3% |
| Business | 165 | 15.7% |
| Education | 319 | 30.3% |
| Literature & Languages | 74 | 7.0% |
| Liberal Arts & History | 22 | 2.1% |
| Visual & Performing Arts | 0 | 0.0% |
| Communications | 0 | 0.0% |
| Arts & Humanities | 60 | 5.7% |
| Total | 1,051 | 100.0% |
Transportation & Commute in Sutherlin
Vehicle Availability by Sex in Sutherlin
The most prevalent vehicle ownership categories in Sutherlin are males with 2 vehicles (774, accounting for 50.7%) and females with 2 vehicles (907, making up 41.5%).
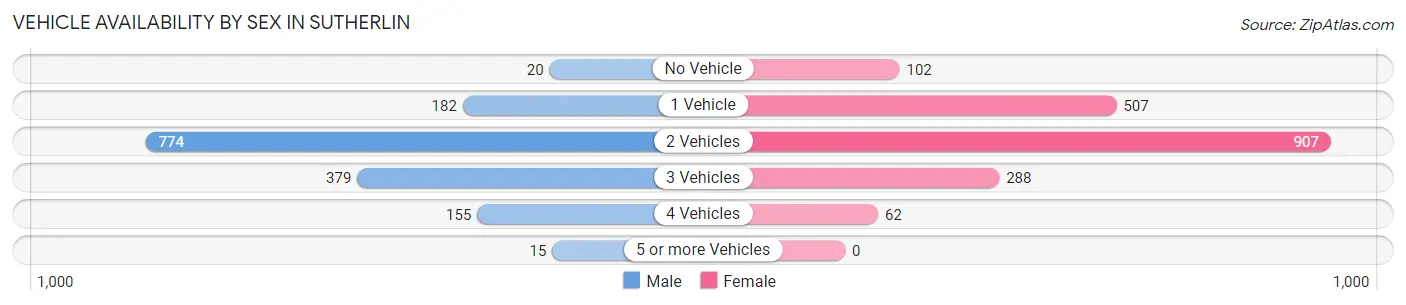
| Vehicles Available | Male | Female |
| No Vehicle | 20 (1.3%) | 102 (5.5%) |
| 1 Vehicle | 182 (11.9%) | 507 (27.2%) |
| 2 Vehicles | 774 (50.7%) | 907 (48.6%) |
| 3 Vehicles | 379 (24.8%) | 288 (15.4%) |
| 4 Vehicles | 155 (10.2%) | 62 (3.3%) |
| 5 or more Vehicles | 15 (1.0%) | 0 (0.0%) |
| Total | 1,525 (100.0%) | 1,866 (100.0%) |
Commute Time in Sutherlin
The most frequently occuring commute durations in Sutherlin are 5 to 9 minutes (598 commuters, 18.1%), 15 to 19 minutes (591 commuters, 17.9%), and 20 to 24 minutes (559 commuters, 16.9%).
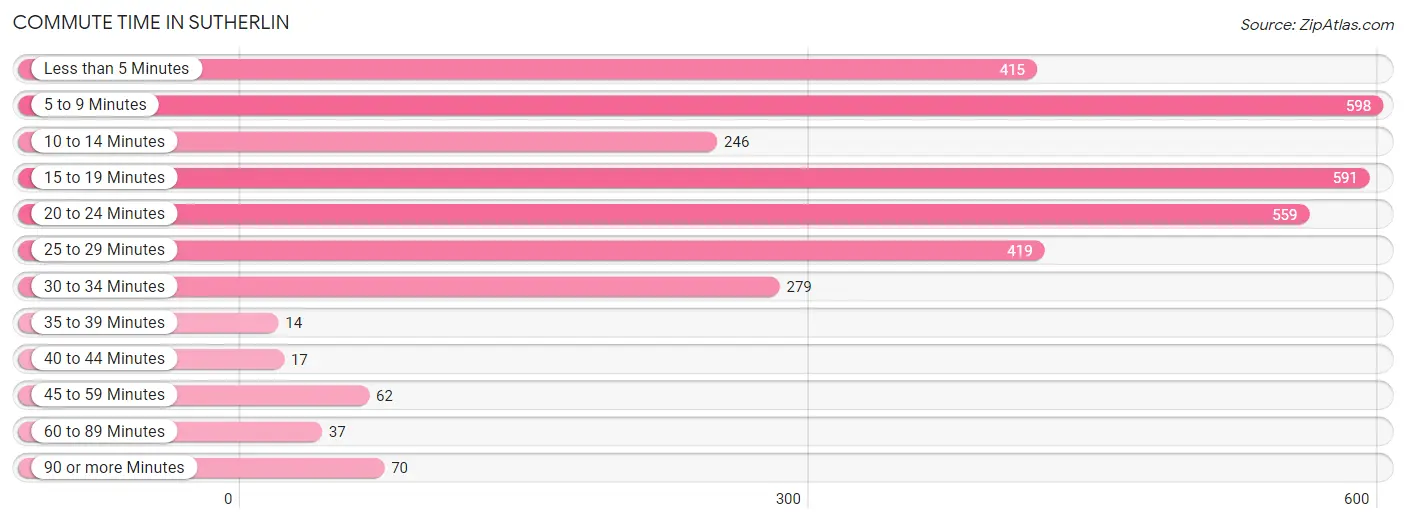
| Commute Time | # Commuters | % Commuters |
| Less than 5 Minutes | 415 | 12.6% |
| 5 to 9 Minutes | 598 | 18.1% |
| 10 to 14 Minutes | 246 | 7.4% |
| 15 to 19 Minutes | 591 | 17.9% |
| 20 to 24 Minutes | 559 | 16.9% |
| 25 to 29 Minutes | 419 | 12.7% |
| 30 to 34 Minutes | 279 | 8.4% |
| 35 to 39 Minutes | 14 | 0.4% |
| 40 to 44 Minutes | 17 | 0.5% |
| 45 to 59 Minutes | 62 | 1.9% |
| 60 to 89 Minutes | 37 | 1.1% |
| 90 or more Minutes | 70 | 2.1% |
Commute Time by Sex in Sutherlin
The most common commute times in Sutherlin are 20 to 24 minutes (238 commuters, 16.3%) for males and 5 to 9 minutes (361 commuters, 19.6%) for females.
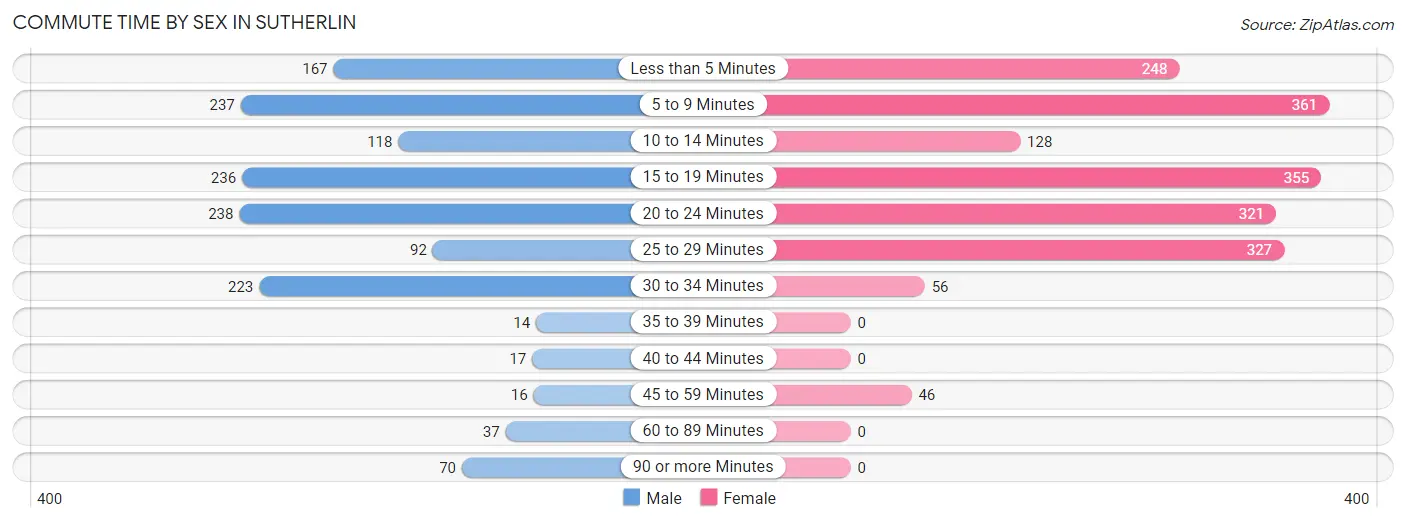
| Commute Time | Male | Female |
| Less than 5 Minutes | 167 (11.4%) | 248 (13.5%) |
| 5 to 9 Minutes | 237 (16.2%) | 361 (19.6%) |
| 10 to 14 Minutes | 118 (8.1%) | 128 (7.0%) |
| 15 to 19 Minutes | 236 (16.1%) | 355 (19.3%) |
| 20 to 24 Minutes | 238 (16.3%) | 321 (17.4%) |
| 25 to 29 Minutes | 92 (6.3%) | 327 (17.7%) |
| 30 to 34 Minutes | 223 (15.2%) | 56 (3.0%) |
| 35 to 39 Minutes | 14 (1.0%) | 0 (0.0%) |
| 40 to 44 Minutes | 17 (1.2%) | 0 (0.0%) |
| 45 to 59 Minutes | 16 (1.1%) | 46 (2.5%) |
| 60 to 89 Minutes | 37 (2.5%) | 0 (0.0%) |
| 90 or more Minutes | 70 (4.8%) | 0 (0.0%) |
Time of Departure to Work by Sex in Sutherlin
The most frequent times of departure to work in Sutherlin are 5:30 AM to 5:59 AM (260, 17.7%) for males and 7:00 AM to 7:29 AM (531, 28.8%) for females.
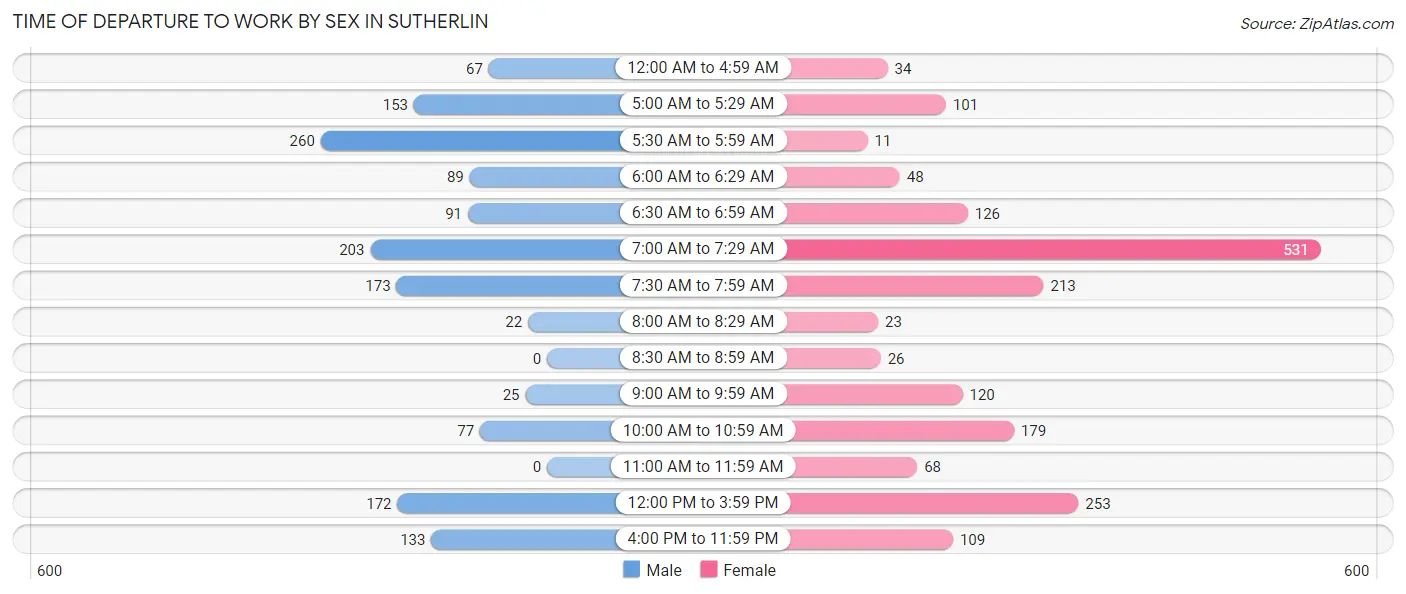
| Time of Departure | Male | Female |
| 12:00 AM to 4:59 AM | 67 (4.6%) | 34 (1.8%) |
| 5:00 AM to 5:29 AM | 153 (10.4%) | 101 (5.5%) |
| 5:30 AM to 5:59 AM | 260 (17.7%) | 11 (0.6%) |
| 6:00 AM to 6:29 AM | 89 (6.1%) | 48 (2.6%) |
| 6:30 AM to 6:59 AM | 91 (6.2%) | 126 (6.8%) |
| 7:00 AM to 7:29 AM | 203 (13.9%) | 531 (28.8%) |
| 7:30 AM to 7:59 AM | 173 (11.8%) | 213 (11.6%) |
| 8:00 AM to 8:29 AM | 22 (1.5%) | 23 (1.3%) |
| 8:30 AM to 8:59 AM | 0 (0.0%) | 26 (1.4%) |
| 9:00 AM to 9:59 AM | 25 (1.7%) | 120 (6.5%) |
| 10:00 AM to 10:59 AM | 77 (5.3%) | 179 (9.7%) |
| 11:00 AM to 11:59 AM | 0 (0.0%) | 68 (3.7%) |
| 12:00 PM to 3:59 PM | 172 (11.7%) | 253 (13.7%) |
| 4:00 PM to 11:59 PM | 133 (9.1%) | 109 (5.9%) |
| Total | 1,465 (100.0%) | 1,842 (100.0%) |
Housing Occupancy in Sutherlin
Occupancy by Ownership in Sutherlin
Of the total 3,885 dwellings in Sutherlin, owner-occupied units account for 2,430 (62.5%), while renter-occupied units make up 1,455 (37.4%).
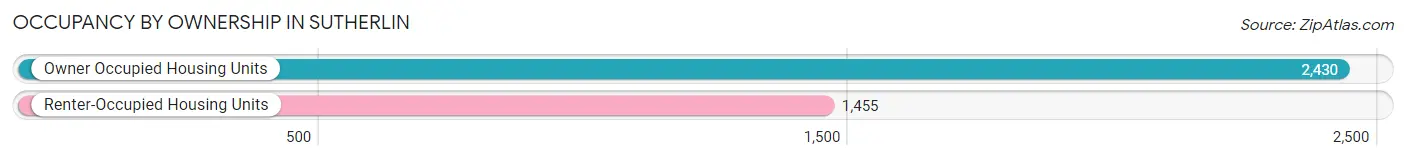
| Occupancy | # Housing Units | % Housing Units |
| Owner Occupied Housing Units | 2,430 | 62.5% |
| Renter-Occupied Housing Units | 1,455 | 37.4% |
| Total Occupied Housing Units | 3,885 | 100.0% |
Occupancy by Household Size in Sutherlin
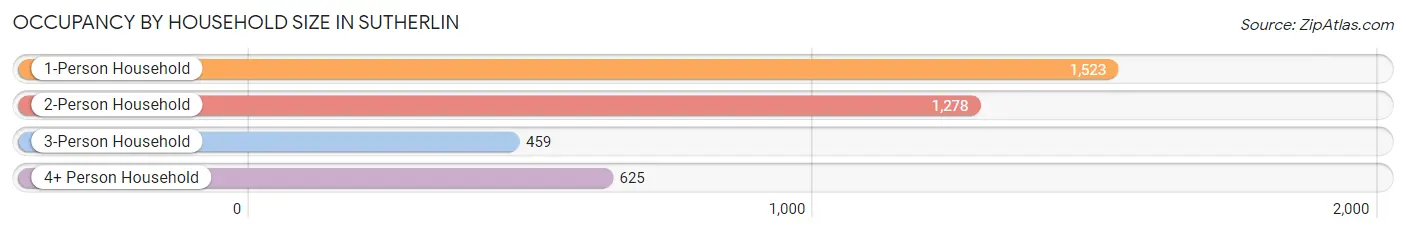
| Household Size | # Housing Units | % Housing Units |
| 1-Person Household | 1,523 | 39.2% |
| 2-Person Household | 1,278 | 32.9% |
| 3-Person Household | 459 | 11.8% |
| 4+ Person Household | 625 | 16.1% |
| Total Housing Units | 3,885 | 100.0% |
Occupancy by Ownership by Household Size in Sutherlin
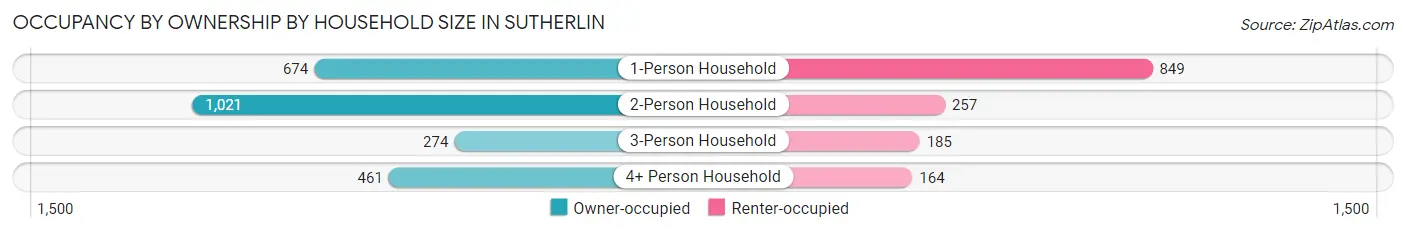
| Household Size | Owner-occupied | Renter-occupied |
| 1-Person Household | 674 (44.3%) | 849 (55.7%) |
| 2-Person Household | 1,021 (79.9%) | 257 (20.1%) |
| 3-Person Household | 274 (59.7%) | 185 (40.3%) |
| 4+ Person Household | 461 (73.8%) | 164 (26.2%) |
| Total Housing Units | 2,430 (62.5%) | 1,455 (37.4%) |
Occupancy by Educational Attainment in Sutherlin
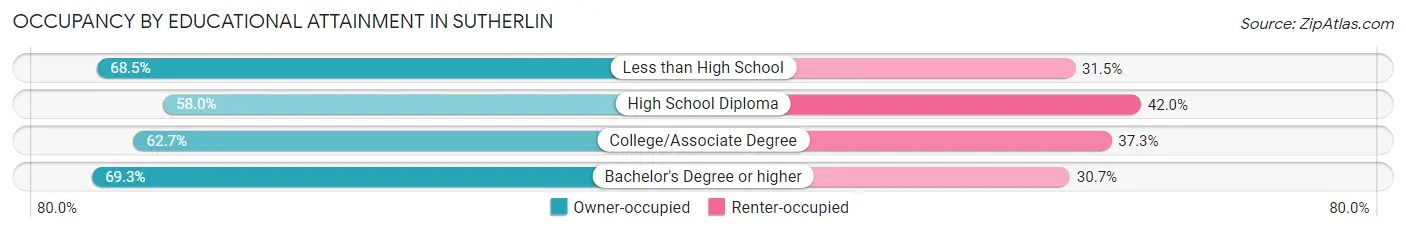
| Household Size | Owner-occupied | Renter-occupied |
| Less than High School | 191 (68.5%) | 88 (31.5%) |
| High School Diploma | 846 (58.0%) | 612 (42.0%) |
| College/Associate Degree | 906 (62.7%) | 539 (37.3%) |
| Bachelor's Degree or higher | 487 (69.3%) | 216 (30.7%) |
Occupancy by Age of Householder in Sutherlin
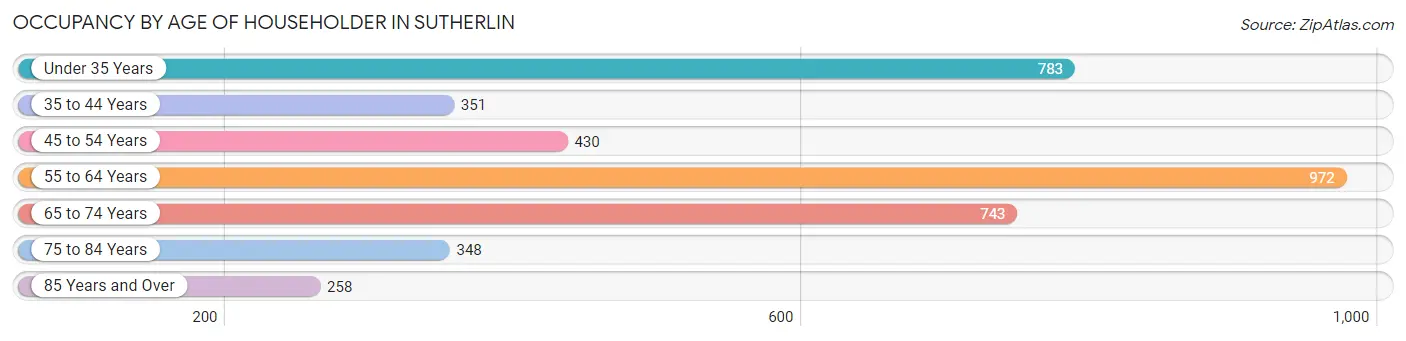
| Age Bracket | # Households | % Households |
| Under 35 Years | 783 | 20.2% |
| 35 to 44 Years | 351 | 9.0% |
| 45 to 54 Years | 430 | 11.1% |
| 55 to 64 Years | 972 | 25.0% |
| 65 to 74 Years | 743 | 19.1% |
| 75 to 84 Years | 348 | 9.0% |
| 85 Years and Over | 258 | 6.6% |
| Total | 3,885 | 100.0% |
Housing Finances in Sutherlin
Median Income by Occupancy in Sutherlin
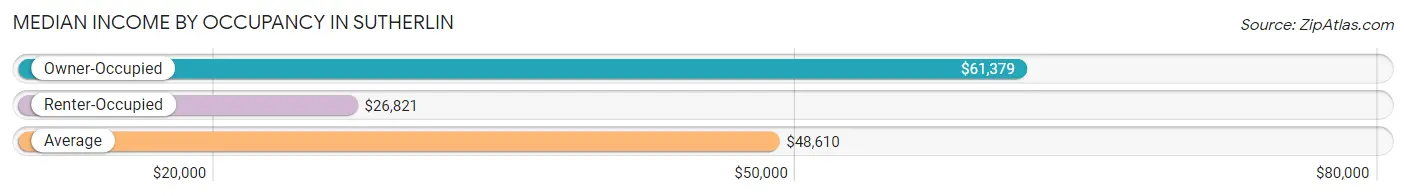
| Occupancy Type | # Households | Median Income |
| Owner-Occupied | 2,430 (62.5%) | $61,379 |
| Renter-Occupied | 1,455 (37.4%) | $26,821 |
| Average | 3,885 (100.0%) | $48,610 |
Occupancy by Householder Income Bracket in Sutherlin
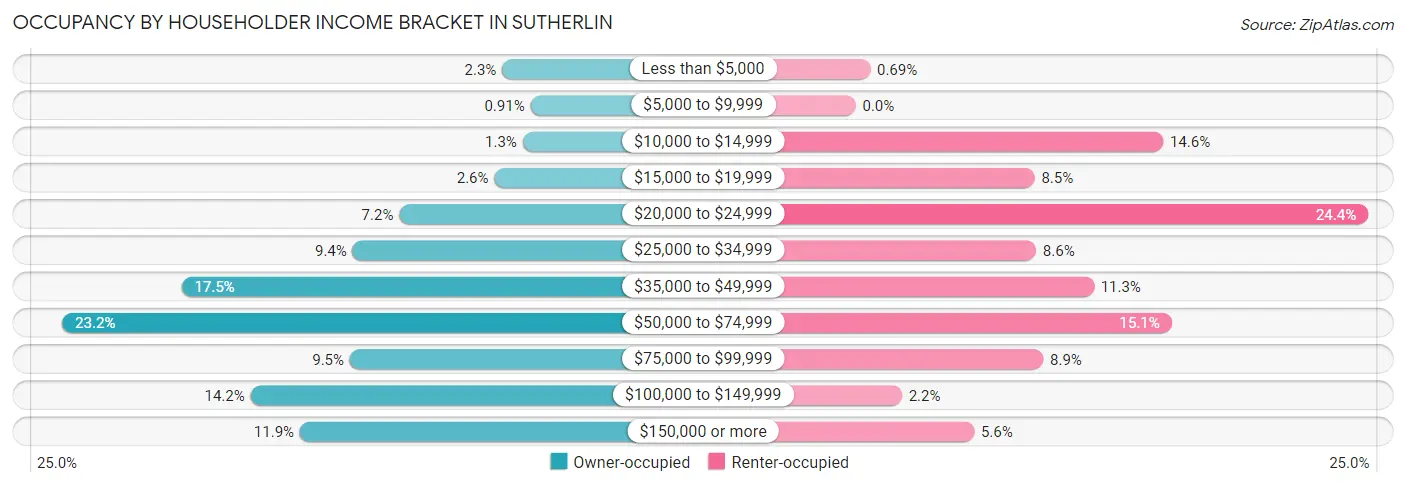
| Income Bracket | Owner-occupied | Renter-occupied |
| Less than $5,000 | 55 (2.3%) | 10 (0.7%) |
| $5,000 to $9,999 | 22 (0.9%) | 0 (0.0%) |
| $10,000 to $14,999 | 31 (1.3%) | 213 (14.6%) |
| $15,000 to $19,999 | 64 (2.6%) | 124 (8.5%) |
| $20,000 to $24,999 | 174 (7.2%) | 355 (24.4%) |
| $25,000 to $34,999 | 228 (9.4%) | 125 (8.6%) |
| $35,000 to $49,999 | 426 (17.5%) | 165 (11.3%) |
| $50,000 to $74,999 | 564 (23.2%) | 219 (15.0%) |
| $75,000 to $99,999 | 231 (9.5%) | 130 (8.9%) |
| $100,000 to $149,999 | 346 (14.2%) | 32 (2.2%) |
| $150,000 or more | 289 (11.9%) | 82 (5.6%) |
| Total | 2,430 (100.0%) | 1,455 (100.0%) |
Monthly Housing Cost Tiers in Sutherlin
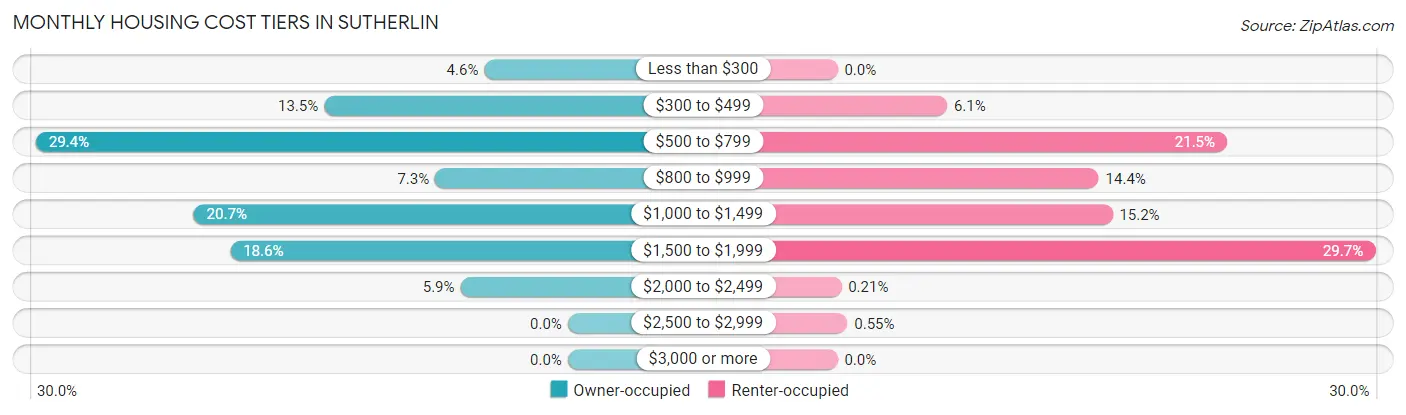
| Monthly Cost | Owner-occupied | Renter-occupied |
| Less than $300 | 112 (4.6%) | 0 (0.0%) |
| $300 to $499 | 327 (13.5%) | 88 (6.0%) |
| $500 to $799 | 714 (29.4%) | 313 (21.5%) |
| $800 to $999 | 178 (7.3%) | 210 (14.4%) |
| $1,000 to $1,499 | 502 (20.7%) | 221 (15.2%) |
| $1,500 to $1,999 | 453 (18.6%) | 432 (29.7%) |
| $2,000 to $2,499 | 144 (5.9%) | 3 (0.2%) |
| $2,500 to $2,999 | 0 (0.0%) | 8 (0.5%) |
| $3,000 or more | 0 (0.0%) | 0 (0.0%) |
| Total | 2,430 (100.0%) | 1,455 (100.0%) |
Physical Housing Characteristics in Sutherlin
Housing Structures in Sutherlin
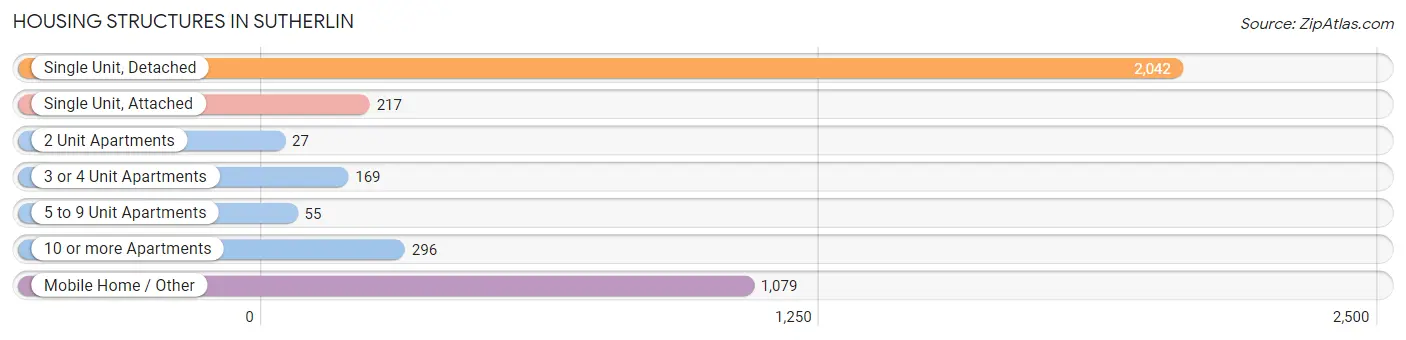
| Structure Type | # Housing Units | % Housing Units |
| Single Unit, Detached | 2,042 | 52.6% |
| Single Unit, Attached | 217 | 5.6% |
| 2 Unit Apartments | 27 | 0.7% |
| 3 or 4 Unit Apartments | 169 | 4.3% |
| 5 to 9 Unit Apartments | 55 | 1.4% |
| 10 or more Apartments | 296 | 7.6% |
| Mobile Home / Other | 1,079 | 27.8% |
| Total | 3,885 | 100.0% |
Housing Structures by Occupancy in Sutherlin
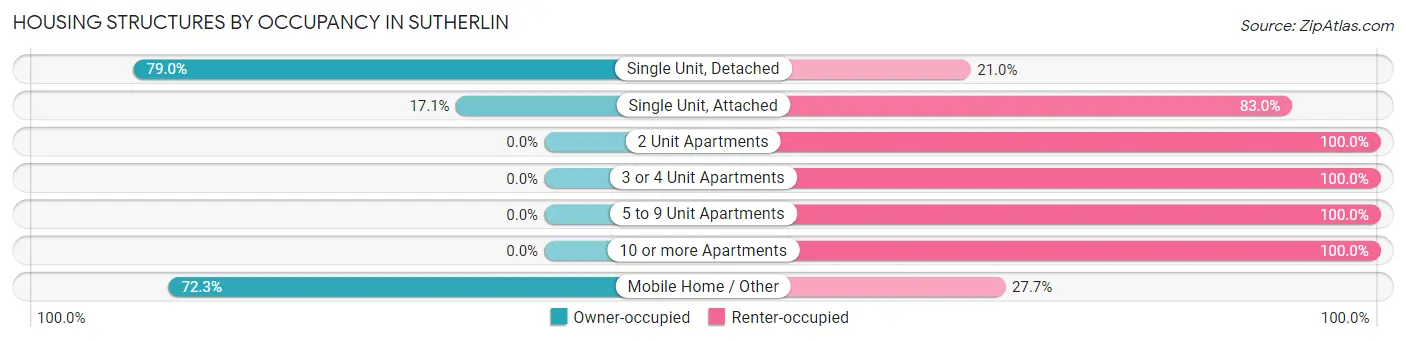
| Structure Type | Owner-occupied | Renter-occupied |
| Single Unit, Detached | 1,613 (79.0%) | 429 (21.0%) |
| Single Unit, Attached | 37 (17.1%) | 180 (83.0%) |
| 2 Unit Apartments | 0 (0.0%) | 27 (100.0%) |
| 3 or 4 Unit Apartments | 0 (0.0%) | 169 (100.0%) |
| 5 to 9 Unit Apartments | 0 (0.0%) | 55 (100.0%) |
| 10 or more Apartments | 0 (0.0%) | 296 (100.0%) |
| Mobile Home / Other | 780 (72.3%) | 299 (27.7%) |
| Total | 2,430 (62.5%) | 1,455 (37.4%) |
Housing Structures by Number of Rooms in Sutherlin
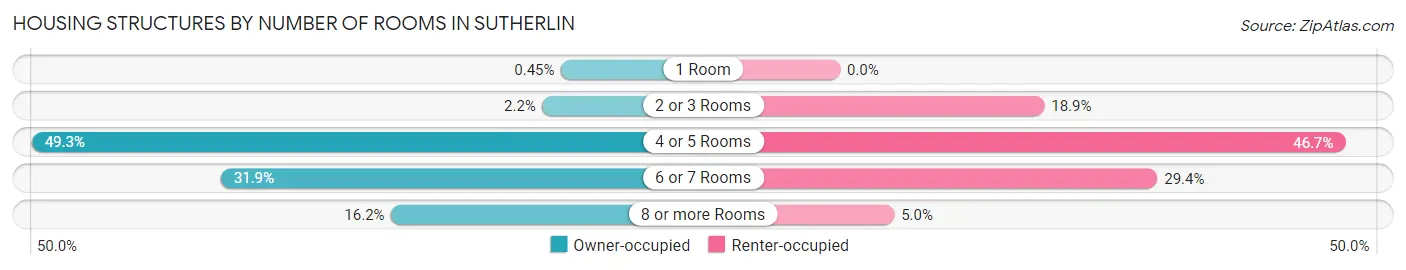
| Number of Rooms | Owner-occupied | Renter-occupied |
| 1 Room | 11 (0.4%) | 0 (0.0%) |
| 2 or 3 Rooms | 53 (2.2%) | 275 (18.9%) |
| 4 or 5 Rooms | 1,199 (49.3%) | 680 (46.7%) |
| 6 or 7 Rooms | 774 (31.9%) | 427 (29.3%) |
| 8 or more Rooms | 393 (16.2%) | 73 (5.0%) |
| Total | 2,430 (100.0%) | 1,455 (100.0%) |
Housing Structure by Heating Type in Sutherlin
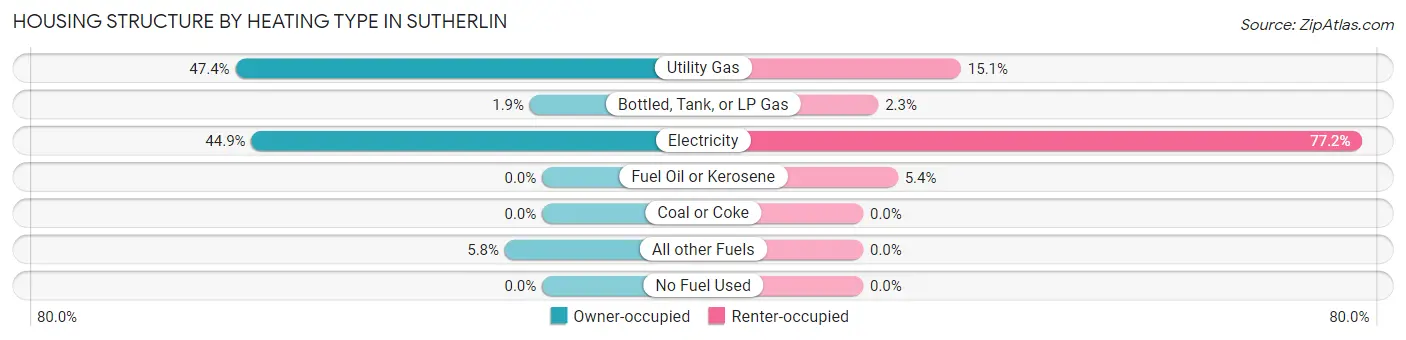
| Heating Type | Owner-occupied | Renter-occupied |
| Utility Gas | 1,152 (47.4%) | 220 (15.1%) |
| Bottled, Tank, or LP Gas | 46 (1.9%) | 34 (2.3%) |
| Electricity | 1,092 (44.9%) | 1,123 (77.2%) |
| Fuel Oil or Kerosene | 0 (0.0%) | 78 (5.4%) |
| Coal or Coke | 0 (0.0%) | 0 (0.0%) |
| All other Fuels | 140 (5.8%) | 0 (0.0%) |
| No Fuel Used | 0 (0.0%) | 0 (0.0%) |
| Total | 2,430 (100.0%) | 1,455 (100.0%) |
Household Vehicle Usage in Sutherlin
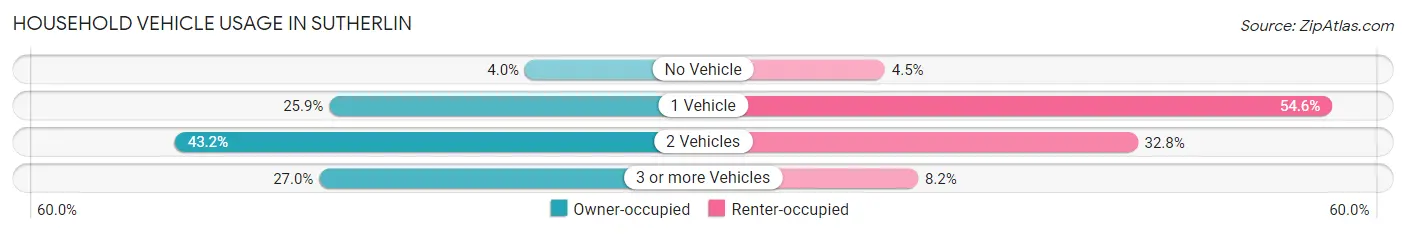
| Vehicles per Household | Owner-occupied | Renter-occupied |
| No Vehicle | 96 (4.0%) | 65 (4.5%) |
| 1 Vehicle | 629 (25.9%) | 794 (54.6%) |
| 2 Vehicles | 1,049 (43.2%) | 477 (32.8%) |
| 3 or more Vehicles | 656 (27.0%) | 119 (8.2%) |
| Total | 2,430 (100.0%) | 1,455 (100.0%) |
Real Estate & Mortgages in Sutherlin
Real Estate and Mortgage Overview in Sutherlin
| Characteristic | Without Mortgage | With Mortgage |
| Housing Units | 1,145 | 1,285 |
| Median Property Value | $132,800 | $279,200 |
| Median Household Income | $50,281 | $238 |
| Monthly Housing Costs | $583 | $0 |
| Real Estate Taxes | $1,068 | $24 |
Property Value by Mortgage Status in Sutherlin
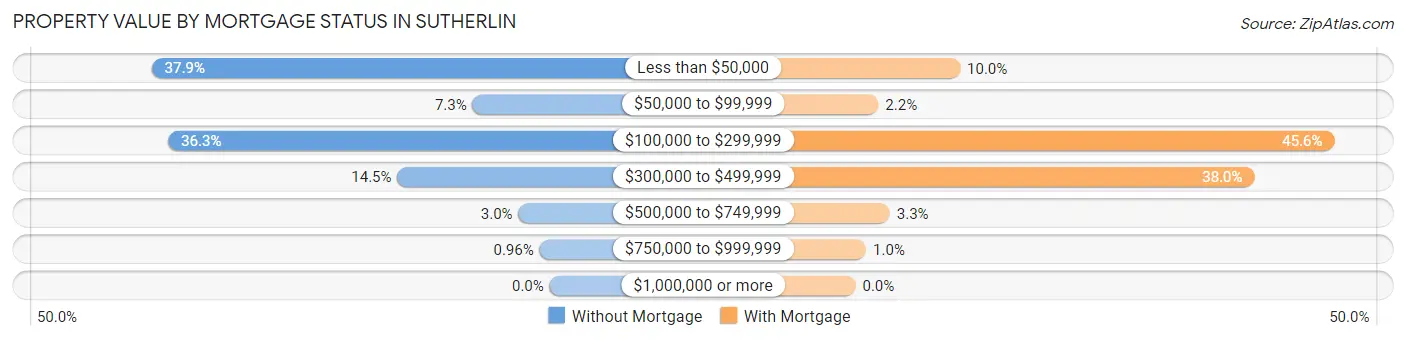
| Property Value | Without Mortgage | With Mortgage |
| Less than $50,000 | 434 (37.9%) | 128 (10.0%) |
| $50,000 to $99,999 | 84 (7.3%) | 28 (2.2%) |
| $100,000 to $299,999 | 416 (36.3%) | 586 (45.6%) |
| $300,000 to $499,999 | 166 (14.5%) | 488 (38.0%) |
| $500,000 to $749,999 | 34 (3.0%) | 42 (3.3%) |
| $750,000 to $999,999 | 11 (1.0%) | 13 (1.0%) |
| $1,000,000 or more | 0 (0.0%) | 0 (0.0%) |
| Total | 1,145 (100.0%) | 1,285 (100.0%) |
Household Income by Mortgage Status in Sutherlin
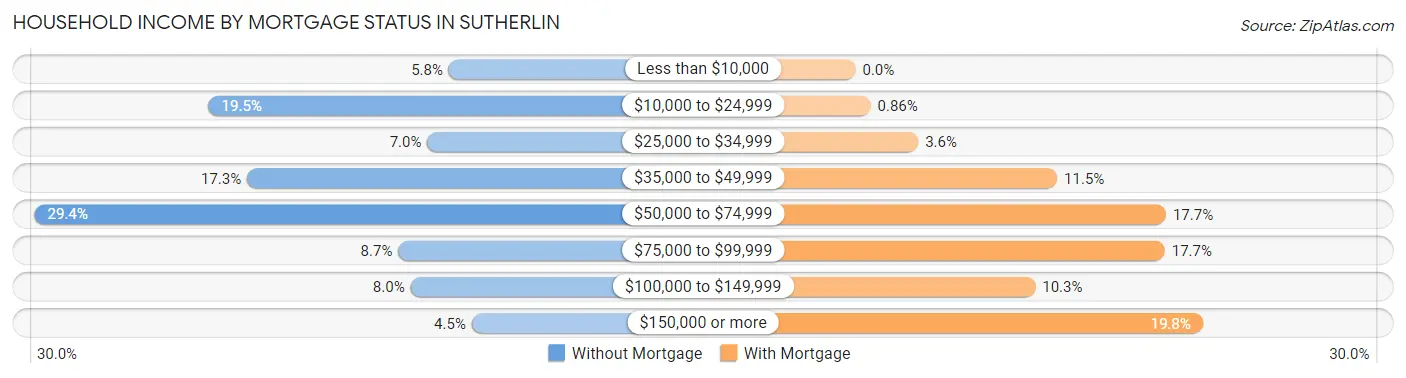
| Household Income | Without Mortgage | With Mortgage |
| Less than $10,000 | 66 (5.8%) | 0 (0.0%) |
| $10,000 to $24,999 | 223 (19.5%) | 11 (0.9%) |
| $25,000 to $34,999 | 80 (7.0%) | 46 (3.6%) |
| $35,000 to $49,999 | 198 (17.3%) | 148 (11.5%) |
| $50,000 to $74,999 | 337 (29.4%) | 228 (17.7%) |
| $75,000 to $99,999 | 99 (8.6%) | 227 (17.7%) |
| $100,000 to $149,999 | 91 (8.0%) | 132 (10.3%) |
| $150,000 or more | 51 (4.4%) | 255 (19.8%) |
| Total | 1,145 (100.0%) | 1,285 (100.0%) |
Property Value to Household Income Ratio in Sutherlin
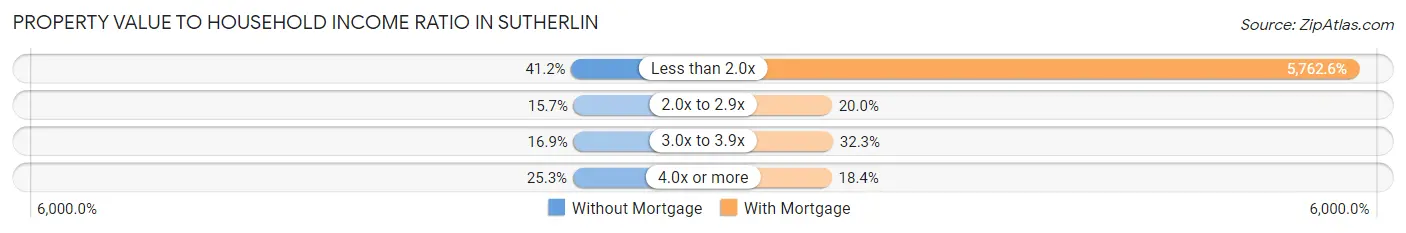
| Value-to-Income Ratio | Without Mortgage | With Mortgage |
| Less than 2.0x | 472 (41.2%) | 74,049 (5,762.6%) |
| 2.0x to 2.9x | 180 (15.7%) | 257 (20.0%) |
| 3.0x to 3.9x | 193 (16.9%) | 415 (32.3%) |
| 4.0x or more | 290 (25.3%) | 237 (18.4%) |
| Total | 1,145 (100.0%) | 1,285 (100.0%) |
Real Estate Taxes by Mortgage Status in Sutherlin
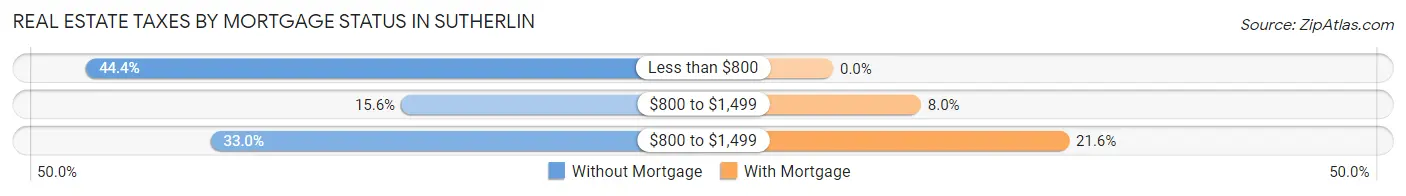
| Property Taxes | Without Mortgage | With Mortgage |
| Less than $800 | 508 (44.4%) | 0 (0.0%) |
| $800 to $1,499 | 179 (15.6%) | 103 (8.0%) |
| $800 to $1,499 | 378 (33.0%) | 277 (21.6%) |
| Total | 1,145 (100.0%) | 1,285 (100.0%) |
Health & Disability in Sutherlin
Health Insurance Coverage by Age in Sutherlin
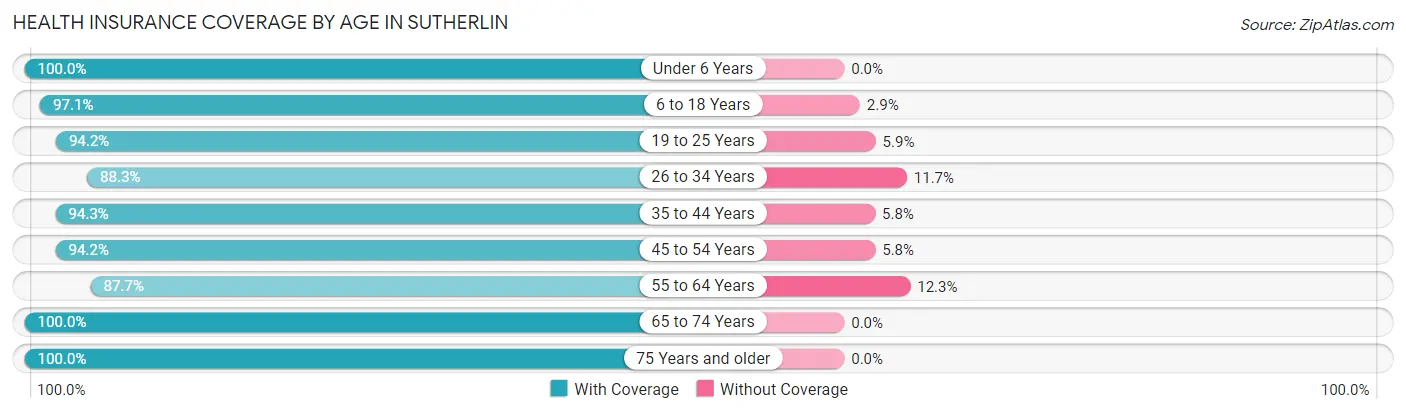
| Age Bracket | With Coverage | Without Coverage |
| Under 6 Years | 456 (100.0%) | 0 (0.0%) |
| 6 to 18 Years | 1,200 (97.1%) | 36 (2.9%) |
| 19 to 25 Years | 386 (94.2%) | 24 (5.9%) |
| 26 to 34 Years | 992 (88.3%) | 131 (11.7%) |
| 35 to 44 Years | 770 (94.3%) | 47 (5.8%) |
| 45 to 54 Years | 864 (94.2%) | 53 (5.8%) |
| 55 to 64 Years | 1,155 (87.7%) | 162 (12.3%) |
| 65 to 74 Years | 1,259 (100.0%) | 0 (0.0%) |
| 75 Years and older | 956 (100.0%) | 0 (0.0%) |
| Total | 8,038 (94.7%) | 453 (5.3%) |
Health Insurance Coverage by Citizenship Status in Sutherlin
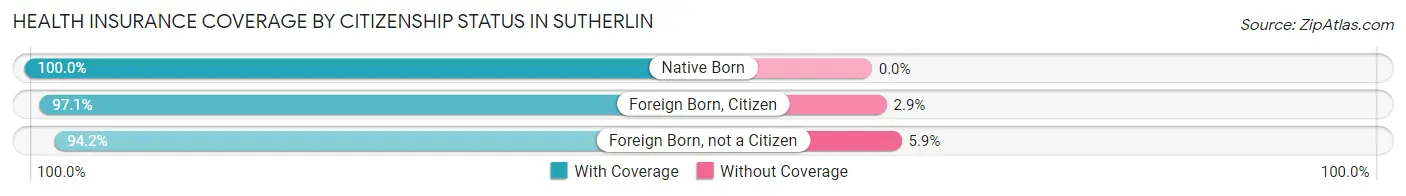
| Citizenship Status | With Coverage | Without Coverage |
| Native Born | 456 (100.0%) | 0 (0.0%) |
| Foreign Born, Citizen | 1,200 (97.1%) | 36 (2.9%) |
| Foreign Born, not a Citizen | 386 (94.2%) | 24 (5.9%) |
Health Insurance Coverage by Household Income in Sutherlin
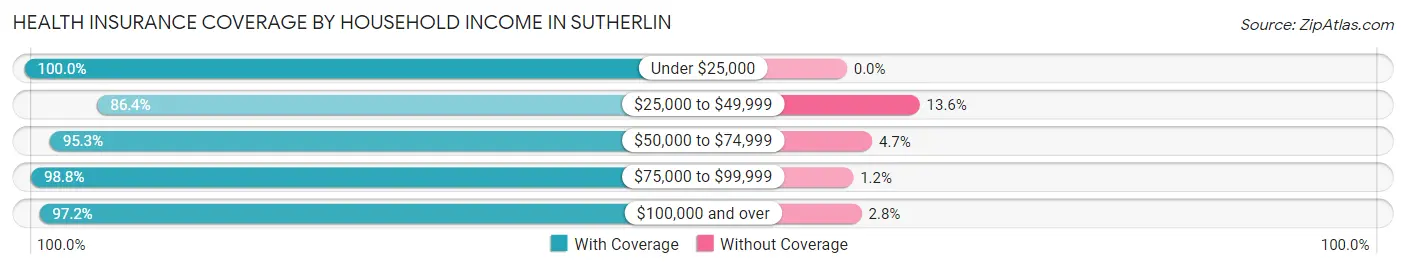
| Household Income | With Coverage | Without Coverage |
| Under $25,000 | 1,177 (100.0%) | 0 (0.0%) |
| $25,000 to $49,999 | 1,861 (86.4%) | 294 (13.6%) |
| $50,000 to $74,999 | 1,611 (95.3%) | 80 (4.7%) |
| $75,000 to $99,999 | 1,141 (98.8%) | 14 (1.2%) |
| $100,000 and over | 2,167 (97.2%) | 62 (2.8%) |
Public vs Private Health Insurance Coverage by Age in Sutherlin
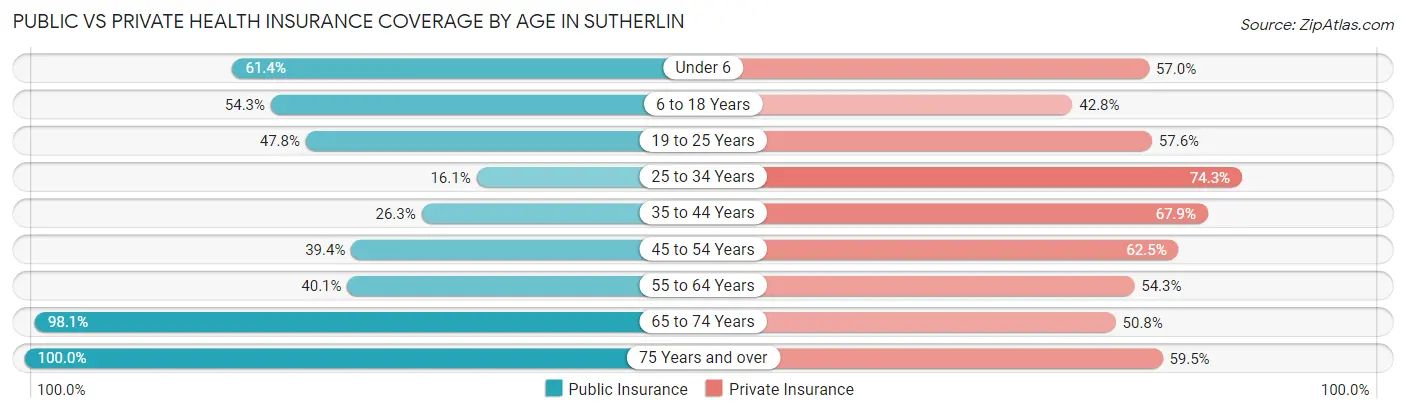
| Age Bracket | Public Insurance | Private Insurance |
| Under 6 | 280 (61.4%) | 260 (57.0%) |
| 6 to 18 Years | 671 (54.3%) | 529 (42.8%) |
| 19 to 25 Years | 196 (47.8%) | 236 (57.6%) |
| 25 to 34 Years | 181 (16.1%) | 834 (74.3%) |
| 35 to 44 Years | 215 (26.3%) | 555 (67.9%) |
| 45 to 54 Years | 361 (39.4%) | 573 (62.5%) |
| 55 to 64 Years | 528 (40.1%) | 715 (54.3%) |
| 65 to 74 Years | 1,235 (98.1%) | 640 (50.8%) |
| 75 Years and over | 956 (100.0%) | 569 (59.5%) |
| Total | 4,623 (54.4%) | 4,911 (57.8%) |
Disability Status by Sex by Age in Sutherlin
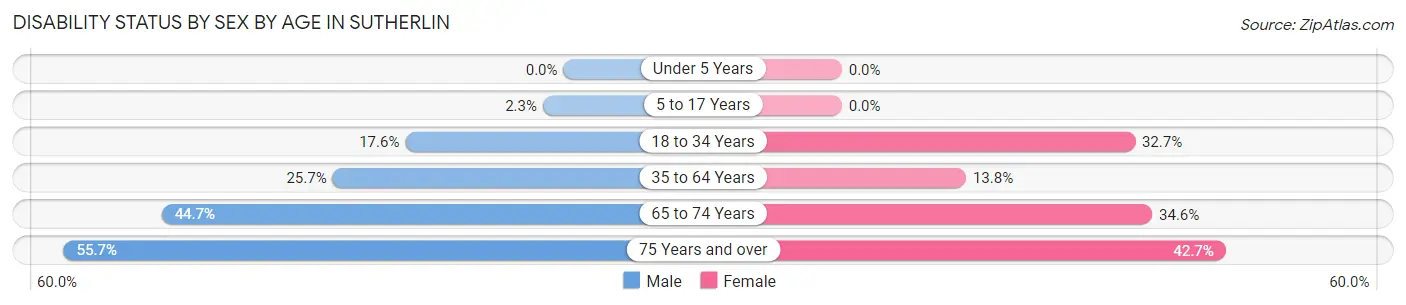
| Age Bracket | Male | Female |
| Under 5 Years | 0 (0.0%) | 0 (0.0%) |
| 5 to 17 Years | 18 (2.3%) | 0 (0.0%) |
| 18 to 34 Years | 109 (17.6%) | 303 (32.7%) |
| 35 to 64 Years | 396 (25.7%) | 209 (13.8%) |
| 65 to 74 Years | 246 (44.7%) | 245 (34.6%) |
| 75 Years and over | 187 (55.6%) | 265 (42.7%) |
Disability Class by Sex by Age in Sutherlin
Disability Class: Hearing Difficulty
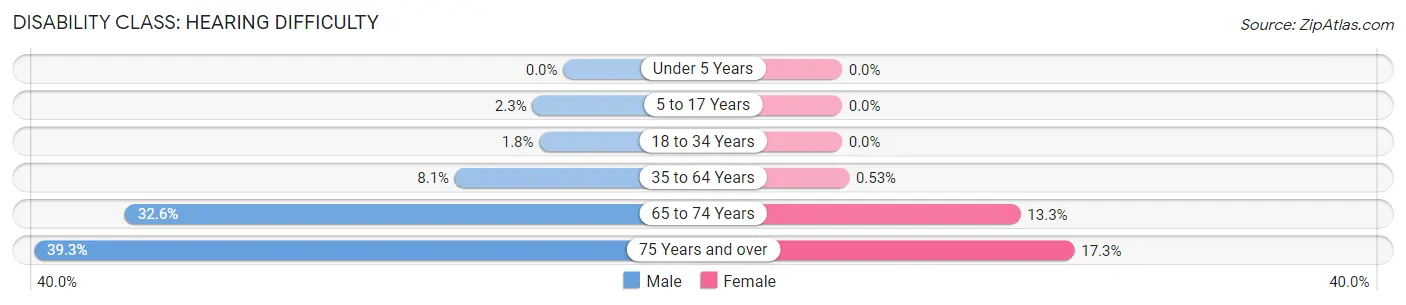
| Age Bracket | Male | Female |
| Under 5 Years | 0 (0.0%) | 0 (0.0%) |
| 5 to 17 Years | 18 (2.3%) | 0 (0.0%) |
| 18 to 34 Years | 11 (1.8%) | 0 (0.0%) |
| 35 to 64 Years | 124 (8.1%) | 8 (0.5%) |
| 65 to 74 Years | 179 (32.6%) | 94 (13.3%) |
| 75 Years and over | 132 (39.3%) | 107 (17.3%) |
Disability Class: Vision Difficulty
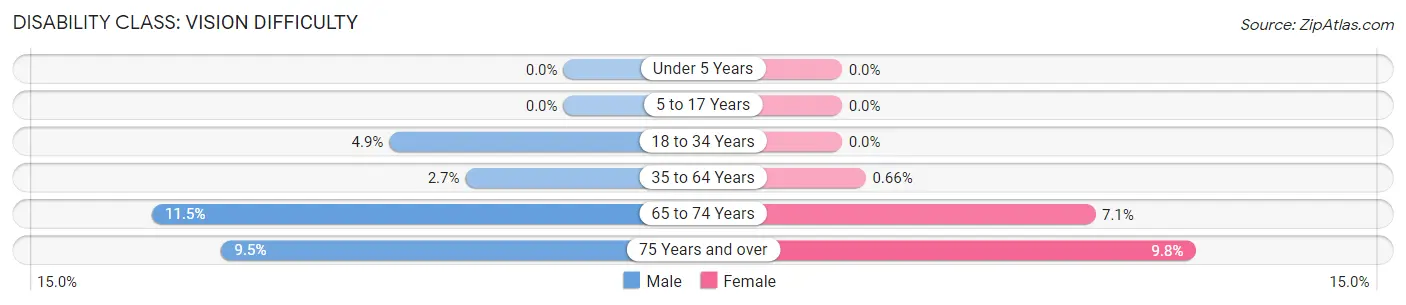
| Age Bracket | Male | Female |
| Under 5 Years | 0 (0.0%) | 0 (0.0%) |
| 5 to 17 Years | 0 (0.0%) | 0 (0.0%) |
| 18 to 34 Years | 30 (4.9%) | 0 (0.0%) |
| 35 to 64 Years | 42 (2.7%) | 10 (0.7%) |
| 65 to 74 Years | 63 (11.5%) | 50 (7.0%) |
| 75 Years and over | 32 (9.5%) | 61 (9.8%) |
Disability Class: Cognitive Difficulty
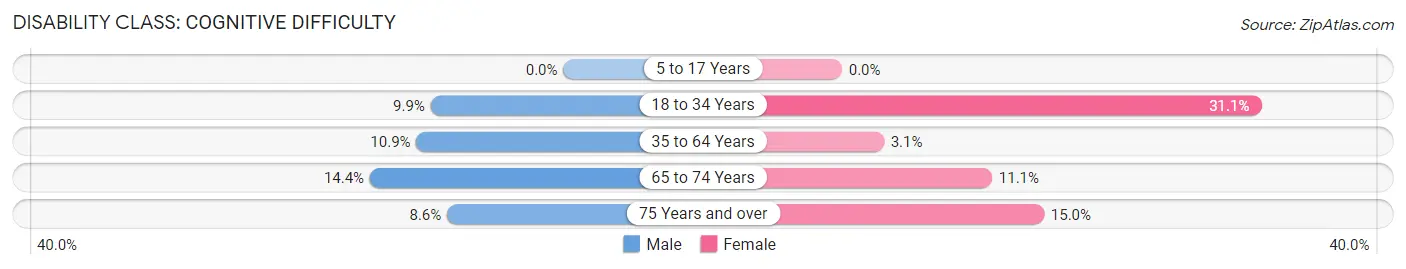
| Age Bracket | Male | Female |
| 5 to 17 Years | 0 (0.0%) | 0 (0.0%) |
| 18 to 34 Years | 61 (9.9%) | 289 (31.1%) |
| 35 to 64 Years | 168 (10.9%) | 47 (3.1%) |
| 65 to 74 Years | 79 (14.4%) | 79 (11.1%) |
| 75 Years and over | 29 (8.6%) | 93 (15.0%) |
Disability Class: Ambulatory Difficulty
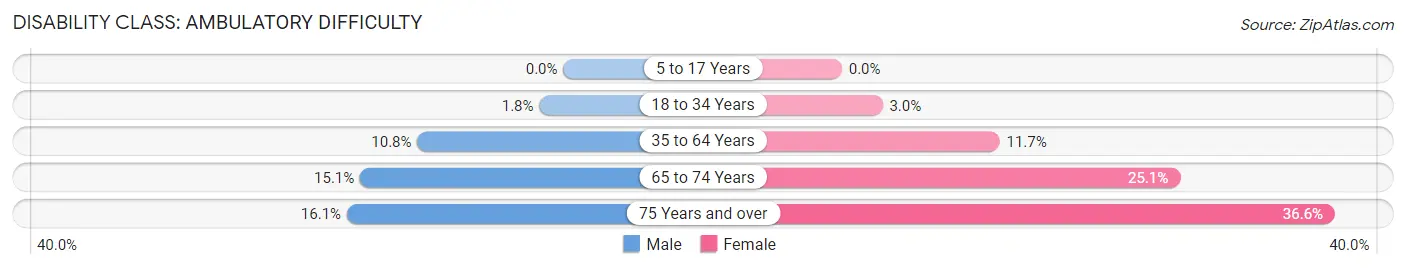
| Age Bracket | Male | Female |
| 5 to 17 Years | 0 (0.0%) | 0 (0.0%) |
| 18 to 34 Years | 11 (1.8%) | 28 (3.0%) |
| 35 to 64 Years | 167 (10.8%) | 177 (11.7%) |
| 65 to 74 Years | 83 (15.1%) | 178 (25.1%) |
| 75 Years and over | 54 (16.1%) | 227 (36.6%) |
Disability Class: Self-Care Difficulty
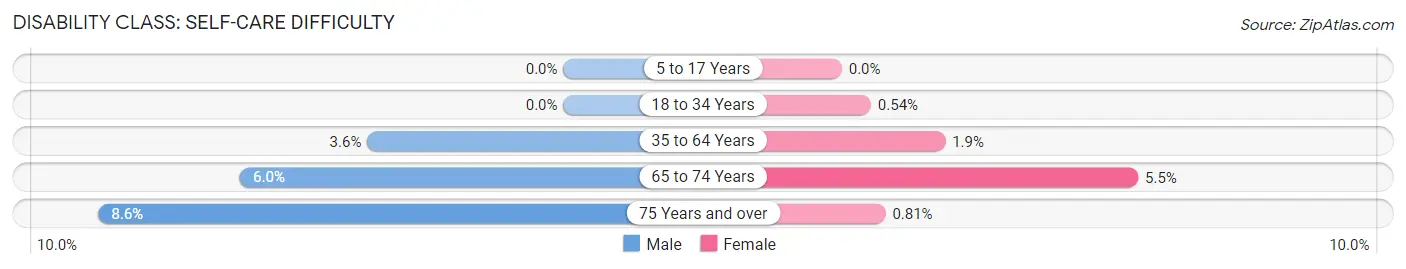
| Age Bracket | Male | Female |
| 5 to 17 Years | 0 (0.0%) | 0 (0.0%) |
| 18 to 34 Years | 0 (0.0%) | 5 (0.5%) |
| 35 to 64 Years | 56 (3.6%) | 29 (1.9%) |
| 65 to 74 Years | 33 (6.0%) | 39 (5.5%) |
| 75 Years and over | 29 (8.6%) | 5 (0.8%) |
Technology Access in Sutherlin
Computing Device Access in Sutherlin
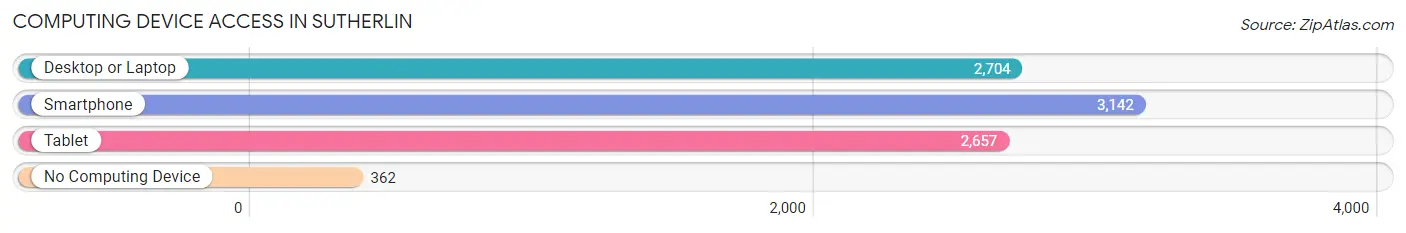
| Device Type | # Households | % Households |
| Desktop or Laptop | 2,704 | 69.6% |
| Smartphone | 3,142 | 80.9% |
| Tablet | 2,657 | 68.4% |
| No Computing Device | 362 | 9.3% |
| Total | 3,885 | 100.0% |
Internet Access in Sutherlin
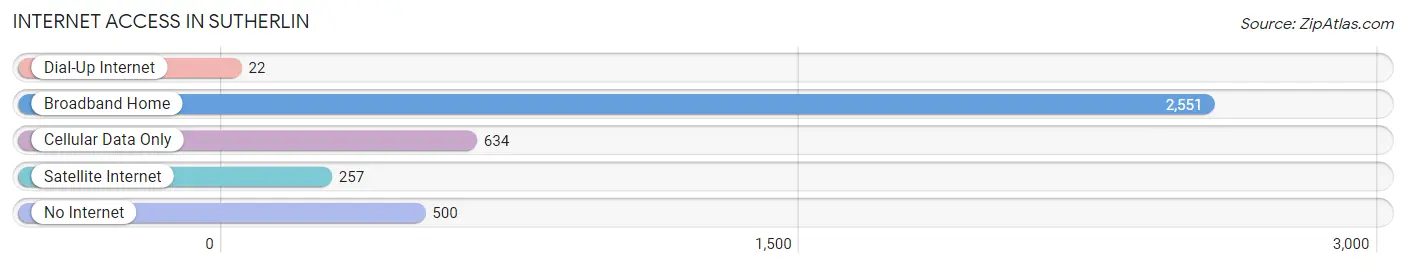
| Internet Type | # Households | % Households |
| Dial-Up Internet | 22 | 0.6% |
| Broadband Home | 2,551 | 65.7% |
| Cellular Data Only | 634 | 16.3% |
| Satellite Internet | 257 | 6.6% |
| No Internet | 500 | 12.9% |
| Total | 3,885 | 100.0% |
Sutherlin Summary
Sutherlin is a city located in Douglas County, Oregon, United States. It is situated in the Umpqua Valley, about 25 miles south of Roseburg. The population was 7,810 at the 2010 census.
History
The area that is now Sutherlin was first settled in 1851 by a group of pioneers led by William Sutherlin. The town was originally called Sutherlinville, but the name was changed to Sutherlin in 1891. The town was incorporated in 1901.
In the early 1900s, Sutherlin was a major lumber town, with several sawmills in operation. The town also had a thriving agricultural industry, with many farms and orchards in the area.
In the 1950s, Sutherlin began to experience a population boom, as people moved to the area from other parts of the country. This growth continued into the 1960s and 1970s, and the population of Sutherlin has remained relatively stable since then.
Geography
Sutherlin is located in the Umpqua Valley, about 25 miles south of Roseburg. The city is situated at the intersection of Interstate 5 and Oregon Route 138. The city is surrounded by rolling hills and is located near the Umpqua River.
The climate in Sutherlin is mild and temperate, with warm summers and cool winters. The average annual temperature is around 50 degrees Fahrenheit.
Economy
The economy of Sutherlin is largely based on agriculture and timber. The area is home to several large timber companies, as well as numerous small farms and orchards.
The city is also home to several manufacturing companies, including a paper mill, a wood products plant, and a plastics factory.
In addition, Sutherlin is home to several retail stores, restaurants, and other businesses. The city is also home to a number of medical facilities, including a hospital and several clinics.
Demographics
As of the 2010 census, the population of Sutherlin was 7,810. The racial makeup of the city was 90.3% White, 0.7% African American, 0.7% Native American, 0.7% Asian, 0.2% Pacific Islander, 4.2% from other races, and 3.2% from two or more races. Hispanic or Latino of any race were 8.2% of the population.
The median household income in Sutherlin was $41,944, and the median family income was $50,944. The per capita income was $20,944. About 14.2% of families and 17.3% of the population were below the poverty line, including 25.2% of those under age 18 and 8.2% of those age 65 or over.
Sutherlin is served by the Sutherlin School District, which includes two elementary schools, one middle school, and one high school. The city is also home to Umpqua Community College, which offers a variety of degree and certificate programs.
Common Questions
What is Per Capita Income in Sutherlin?
Per Capita income in Sutherlin is $31,982.
What is the Median Family Income in Sutherlin?
Median Family Income in Sutherlin is $71,226.
What is the Median Household income in Sutherlin?
Median Household Income in Sutherlin is $48,610.
What is Income or Wage Gap in Sutherlin?
Income or Wage Gap in Sutherlin is 45.0%.
Women in Sutherlin earn 55.0 cents for every dollar earned by a man.
What is Inequality or Gini Index in Sutherlin?
Inequality or Gini Index in Sutherlin is 0.45.
What is the Total Population of Sutherlin?
Total Population of Sutherlin is 8,513.
What is the Total Male Population of Sutherlin?
Total Male Population of Sutherlin is 4,003.
What is the Total Female Population of Sutherlin?
Total Female Population of Sutherlin is 4,510.
What is the Ratio of Males per 100 Females in Sutherlin?
There are 88.76 Males per 100 Females in Sutherlin.
What is the Ratio of Females per 100 Males in Sutherlin?
There are 112.67 Females per 100 Males in Sutherlin.
What is the Median Population Age in Sutherlin?
Median Population Age in Sutherlin is 46.9 Years.
What is the Average Family Size in Sutherlin
Average Family Size in Sutherlin is 2.7 People.
What is the Average Household Size in Sutherlin
Average Household Size in Sutherlin is 2.2 People.
How Large is the Labor Force in Sutherlin?
There are 3,906 People in the Labor Forcein in Sutherlin.
What is the Percentage of People in the Labor Force in Sutherlin?
55.3% of People are in the Labor Force in Sutherlin.
What is the Unemployment Rate in Sutherlin?
Unemployment Rate in Sutherlin is 5.7%.