Zip Codes with the Highest Percentage of Population Employed in Food Preparation & Serving in Beaverton, OR
RELATED REPORTS & OPTIONS
Food Preparation & Serving
Beaverton
Compare Zip Codes
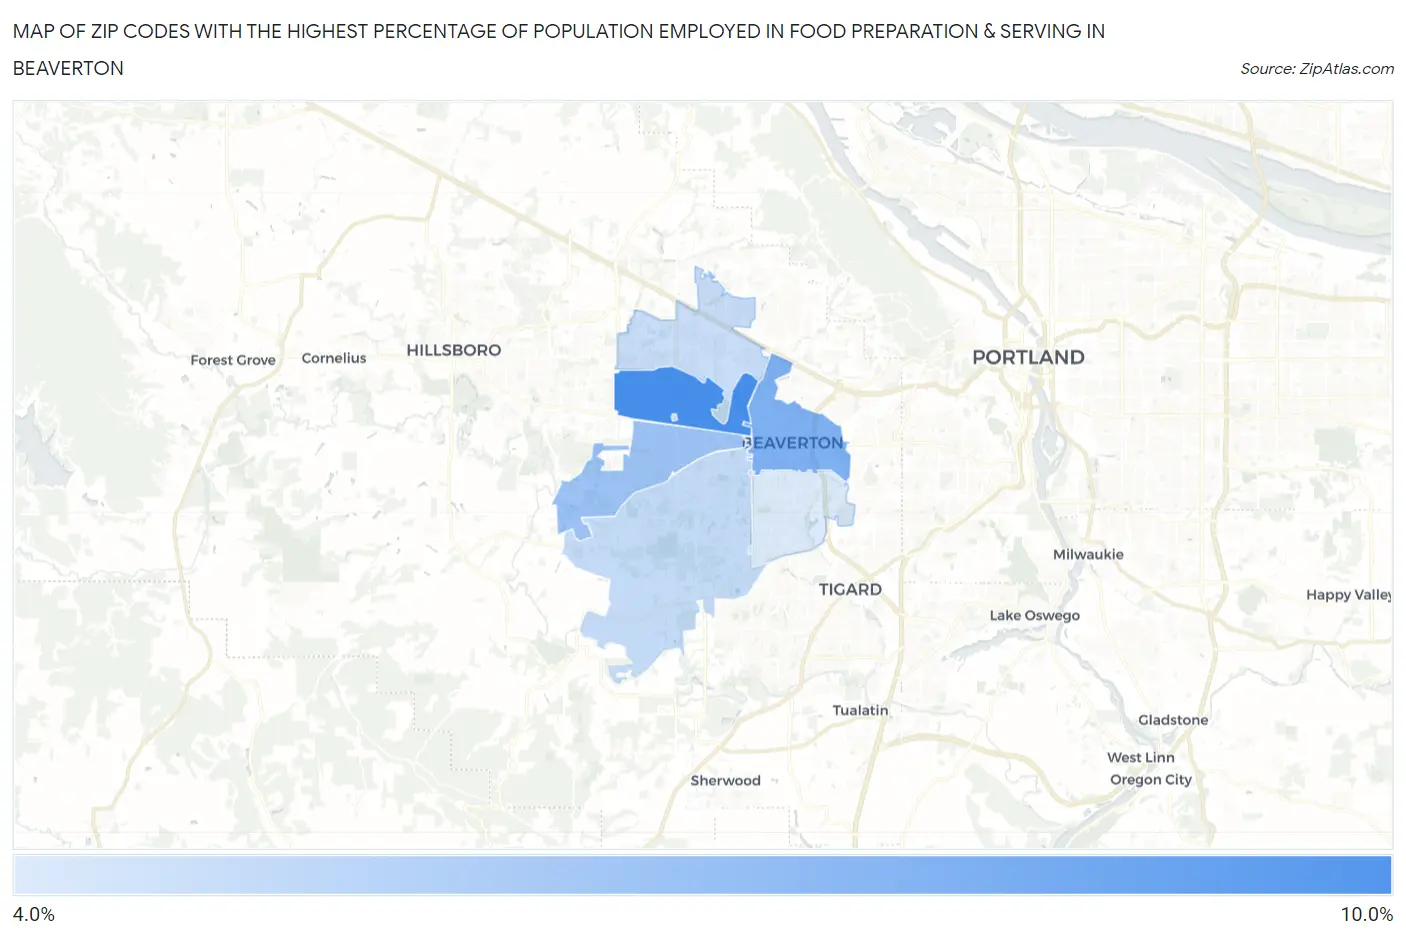
Map of Zip Codes with the Highest Percentage of Population Employed in Food Preparation & Serving in Beaverton
4.6%
9.1%
Zip Codes with the Highest Percentage of Population Employed in Food Preparation & Serving in Beaverton, OR
| Zip Code | % Employed | vs State | vs National | |
| 1. | 97003 | 9.1% | 5.9%(+3.17)#61 | 5.3%(+3.81)#3,414 |
| 2. | 97005 | 7.4% | 5.9%(+1.50)#106 | 5.3%(+2.14)#5,689 |
| 3. | 97078 | 6.6% | 5.9%(+0.696)#131 | 5.3%(+1.34)#7,549 |
| 4. | 97007 | 5.4% | 5.9%(-0.547)#181 | 5.3%(+0.094)#11,470 |
| 5. | 97006 | 5.2% | 5.9%(-0.733)#187 | 5.3%(-0.092)#12,168 |
| 6. | 97008 | 4.6% | 5.9%(-1.32)#214 | 5.3%(-0.677)#14,556 |
1
Common Questions
What are the Top 5 Zip Codes with the Highest Percentage of Population Employed in Food Preparation & Serving in Beaverton, OR?
Top 5 Zip Codes with the Highest Percentage of Population Employed in Food Preparation & Serving in Beaverton, OR are:
What zip code has the Highest Percentage of Population Employed in Food Preparation & Serving in Beaverton, OR?
97003 has the Highest Percentage of Population Employed in Food Preparation & Serving in Beaverton, OR with 9.1%.
What is the Percentage of Population Employed in Food Preparation & Serving in Beaverton, OR?
Percentage of Population Employed in Food Preparation & Serving in Beaverton is 5.5%.
What is the Percentage of Population Employed in Food Preparation & Serving in Oregon?
Percentage of Population Employed in Food Preparation & Serving in Oregon is 5.9%.
What is the Percentage of Population Employed in Food Preparation & Serving in the United States?
Percentage of Population Employed in Food Preparation & Serving in the United States is 5.3%.