Butteville, OR Map & Demographics
Butteville Map
Butteville Overview
$70,320
PER CAPITA INCOME
$114,375
AVG FAMILY INCOME
$144,306
AVG HOUSEHOLD INCOME
0.46
INEQUALITY / GINI INDEX
285
TOTAL POPULATION
121
MALE POPULATION
164
FEMALE POPULATION
73.78
MALES / 100 FEMALES
135.54
FEMALES / 100 MALES
56.5
MEDIAN AGE
2.9
AVG FAMILY SIZE
2.7
AVG HOUSEHOLD SIZE
107
LABOR FORCE [ PEOPLE ]
44.0%
PERCENT IN LABOR FORCE
Income in Butteville
Income Overview in Butteville
Per Capita Income in Butteville is $70,320, while median incomes of families and households are $114,375 and $144,306 respectively.
| Characteristic | Number | Measure |
| Per Capita Income | 285 | $70,320 |
| Median Family Income | 89 | $114,375 |
| Mean Family Income | 89 | $168,947 |
| Median Household Income | 105 | $144,306 |
| Mean Household Income | 105 | $186,301 |
| Income Deficit | 89 | $0 |
| Wage / Income Gap (%) | 285 | 0.00% |
| Wage / Income Gap ($) | 285 | 100.00¢ per $1 |
| Gini / Inequality Index | 285 | 0.46 |
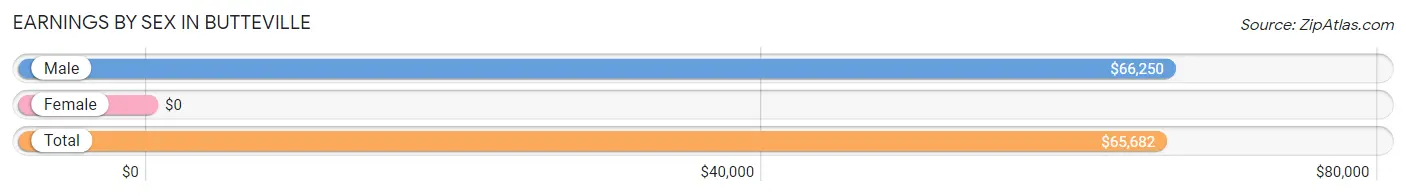
Earnings by Sex in Butteville
| Sex | Number | Average Earnings |
| Male | 51 (45.5%) | $66,250 |
| Female | 61 (54.5%) | $0 |
| Total | 112 (100.0%) | $65,682 |
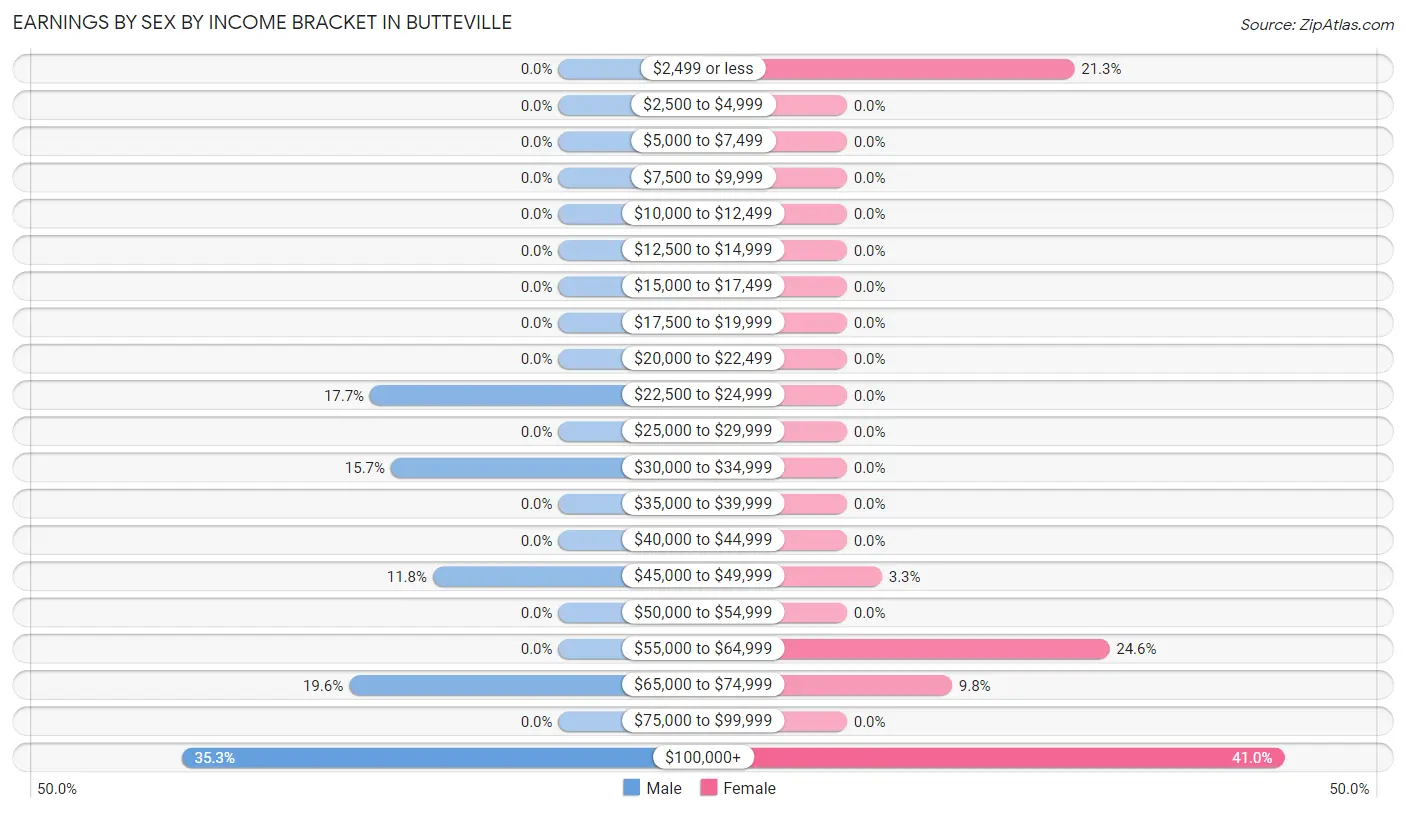
Earnings by Sex by Income Bracket in Butteville
The most common earnings brackets in Butteville are $100,000+ for men (18 | 35.3%) and $100,000+ for women (25 | 41.0%).
| Income | Male | Female |
| $2,499 or less | 0 (0.0%) | 13 (21.3%) |
| $2,500 to $4,999 | 0 (0.0%) | 0 (0.0%) |
| $5,000 to $7,499 | 0 (0.0%) | 0 (0.0%) |
| $7,500 to $9,999 | 0 (0.0%) | 0 (0.0%) |
| $10,000 to $12,499 | 0 (0.0%) | 0 (0.0%) |
| $12,500 to $14,999 | 0 (0.0%) | 0 (0.0%) |
| $15,000 to $17,499 | 0 (0.0%) | 0 (0.0%) |
| $17,500 to $19,999 | 0 (0.0%) | 0 (0.0%) |
| $20,000 to $22,499 | 0 (0.0%) | 0 (0.0%) |
| $22,500 to $24,999 | 9 (17.6%) | 0 (0.0%) |
| $25,000 to $29,999 | 0 (0.0%) | 0 (0.0%) |
| $30,000 to $34,999 | 8 (15.7%) | 0 (0.0%) |
| $35,000 to $39,999 | 0 (0.0%) | 0 (0.0%) |
| $40,000 to $44,999 | 0 (0.0%) | 0 (0.0%) |
| $45,000 to $49,999 | 6 (11.8%) | 2 (3.3%) |
| $50,000 to $54,999 | 0 (0.0%) | 0 (0.0%) |
| $55,000 to $64,999 | 0 (0.0%) | 15 (24.6%) |
| $65,000 to $74,999 | 10 (19.6%) | 6 (9.8%) |
| $75,000 to $99,999 | 0 (0.0%) | 0 (0.0%) |
| $100,000+ | 18 (35.3%) | 25 (41.0%) |
| Total | 51 (100.0%) | 61 (100.0%) |
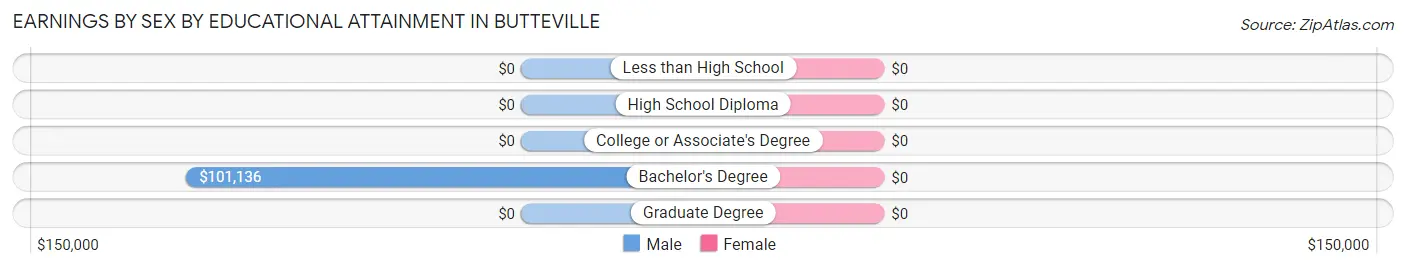
Earnings by Sex by Educational Attainment in Butteville
| Educational Attainment | Male Income | Female Income |
| Less than High School | - | - |
| High School Diploma | - | - |
| College or Associate's Degree | - | - |
| Bachelor's Degree | $101,136 | $0 |
| Graduate Degree | - | - |
| Total | $66,250 | $0 |
Family Income in Butteville
Family Income Brackets in Butteville
According to the Butteville family income data, there are 26 families falling into the $100,000 to $149,999 income range, which is the most common income bracket and makes up 29.2% of all families.
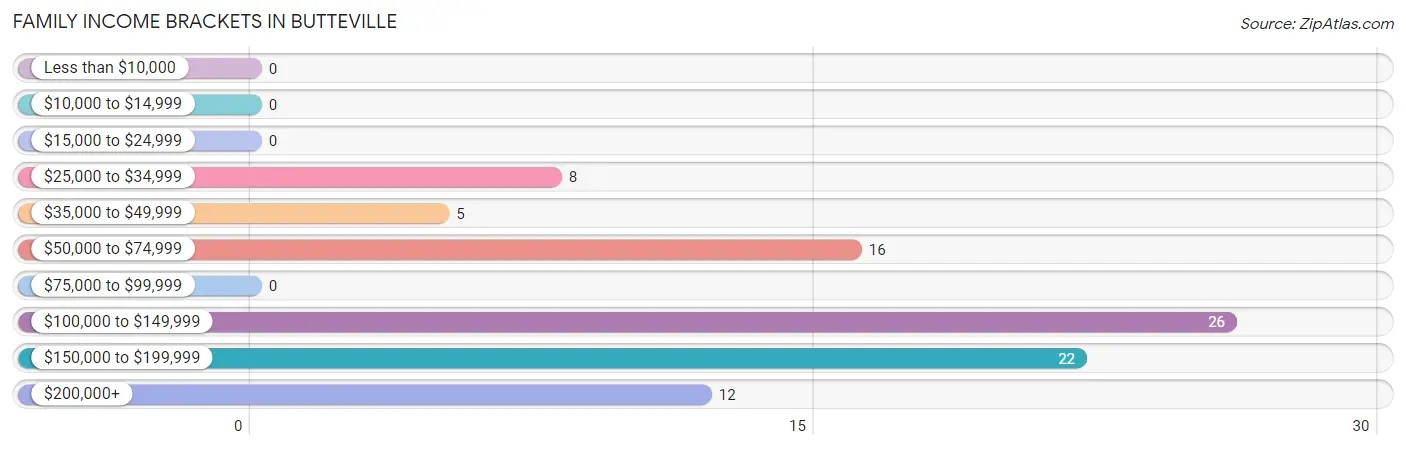
| Income Bracket | # Families | % Families |
| Less than $10,000 | 0 | 0.0% |
| $10,000 to $14,999 | 0 | 0.0% |
| $15,000 to $24,999 | 0 | 0.0% |
| $25,000 to $34,999 | 8 | 9.0% |
| $35,000 to $49,999 | 5 | 5.6% |
| $50,000 to $74,999 | 16 | 18.0% |
| $75,000 to $99,999 | 0 | 0.0% |
| $100,000 to $149,999 | 26 | 29.2% |
| $150,000 to $199,999 | 22 | 24.7% |
| $200,000+ | 12 | 13.5% |
Family Income by Famaliy Size in Butteville
4-person families (25 | 28.1%) account for the highest median family income in Butteville with $142,917 per family, while 4-person families (25 | 28.1%) have the highest median income of $35,729 per family member.
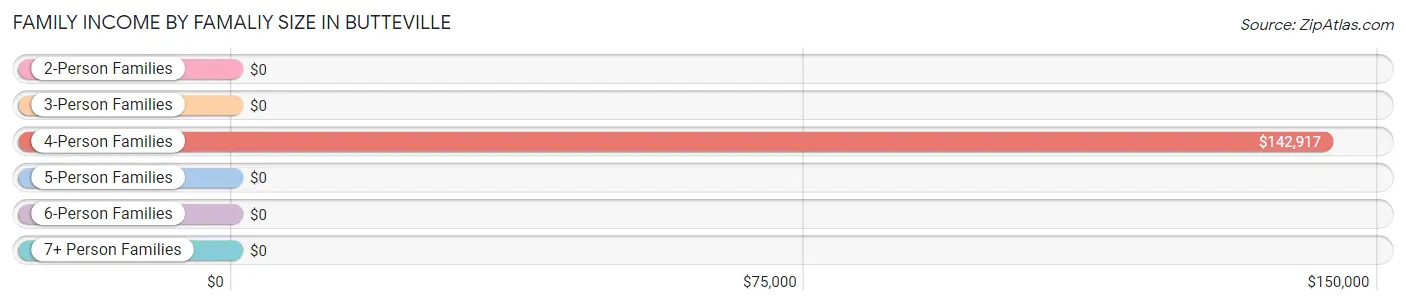
| Income Bracket | # Families | Median Income |
| 2-Person Families | 48 (53.9%) | $0 |
| 3-Person Families | 16 (18.0%) | $0 |
| 4-Person Families | 25 (28.1%) | $142,917 |
| 5-Person Families | 0 (0.0%) | $0 |
| 6-Person Families | 0 (0.0%) | $0 |
| 7+ Person Families | 0 (0.0%) | $0 |
| Total | 89 (100.0%) | $114,375 |
Family Income by Number of Earners in Butteville
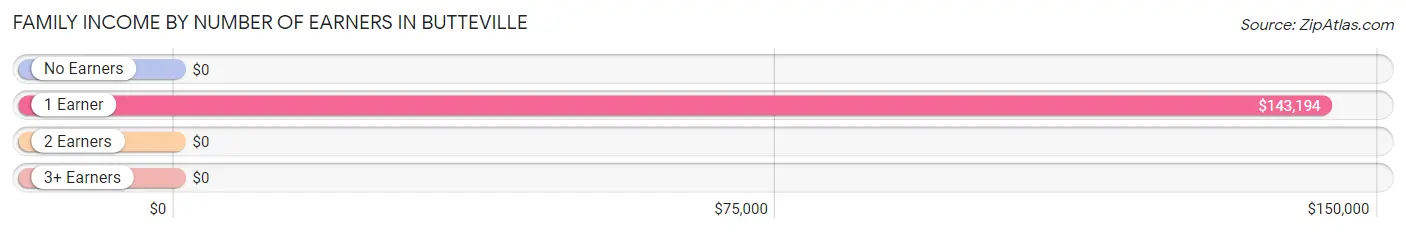
| Number of Earners | # Families | Median Income |
| No Earners | 36 (40.5%) | $0 |
| 1 Earner | 27 (30.3%) | $143,194 |
| 2 Earners | 26 (29.2%) | $0 |
| 3+ Earners | 0 (0.0%) | $0 |
| Total | 89 (100.0%) | $114,375 |
Household Income in Butteville
Household Income Brackets in Butteville
With 28 households falling in the category, the $200,000+ income range is the most frequent in Butteville, accounting for 26.7% of all households.
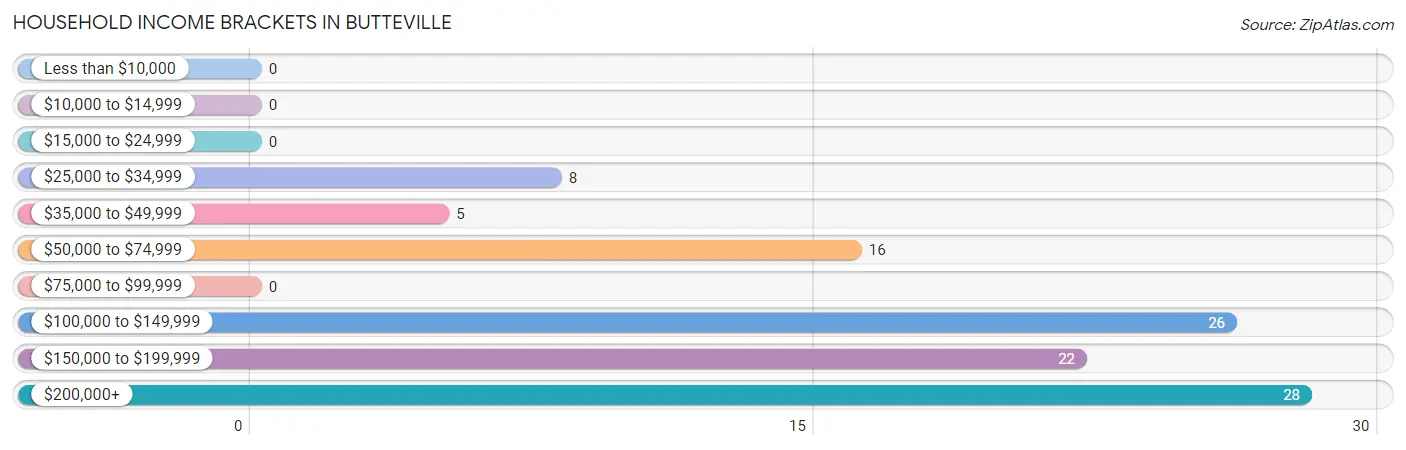
| Income Bracket | # Households | % Households |
| Less than $10,000 | 0 | 0.0% |
| $10,000 to $14,999 | 0 | 0.0% |
| $15,000 to $24,999 | 0 | 0.0% |
| $25,000 to $34,999 | 8 | 7.6% |
| $35,000 to $49,999 | 5 | 4.8% |
| $50,000 to $74,999 | 16 | 15.2% |
| $75,000 to $99,999 | 0 | 0.0% |
| $100,000 to $149,999 | 26 | 24.8% |
| $150,000 to $199,999 | 22 | 21.0% |
| $200,000+ | 28 | 26.7% |
Household Income by Householder Age in Butteville
The median household income in Butteville is $144,306, with the highest median household income of $152,031 found in the 45 to 64 years age bracket for the primary householder. A total of 73 households (69.5%) fall into this category.
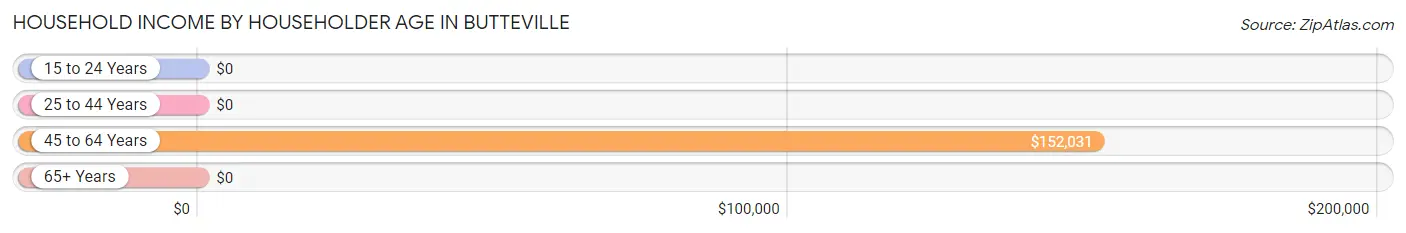
| Income Bracket | # Households | Median Income |
| 15 to 24 Years | 0 (0.0%) | $0 |
| 25 to 44 Years | 0 (0.0%) | $0 |
| 45 to 64 Years | 73 (69.5%) | $152,031 |
| 65+ Years | 32 (30.5%) | $0 |
| Total | 105 (100.0%) | $144,306 |
Poverty in Butteville
Income Below Poverty by Sex and Age in Butteville
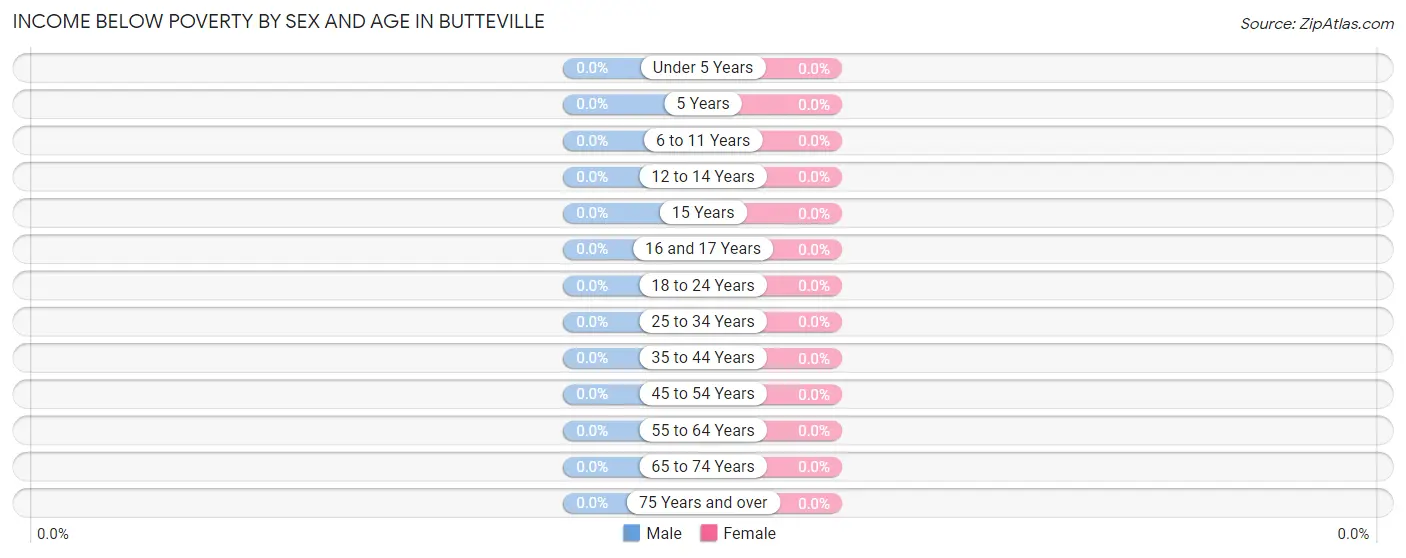
| Age Bracket | Male | Female |
| Under 5 Years | 0 (0.0%) | 0 (0.0%) |
| 5 Years | 0 (0.0%) | 0 (0.0%) |
| 6 to 11 Years | 0 (0.0%) | 0 (0.0%) |
| 12 to 14 Years | 0 (0.0%) | 0 (0.0%) |
| 15 Years | 0 (0.0%) | 0 (0.0%) |
| 16 and 17 Years | 0 (0.0%) | 0 (0.0%) |
| 18 to 24 Years | 0 (0.0%) | 0 (0.0%) |
| 25 to 34 Years | 0 (0.0%) | 0 (0.0%) |
| 35 to 44 Years | 0 (0.0%) | 0 (0.0%) |
| 45 to 54 Years | 0 (0.0%) | 0 (0.0%) |
| 55 to 64 Years | 0 (0.0%) | 0 (0.0%) |
| 65 to 74 Years | 0 (0.0%) | 0 (0.0%) |
| 75 Years and over | 0 (0.0%) | 0 (0.0%) |
| Total | 0 (0.0%) | 0 (0.0%) |
Income Above Poverty by Sex and Age in Butteville
According to the poverty statistics in Butteville, males aged 5 years and females aged 6 to 11 years are the age groups that are most secure financially, with 100.0% of males and 100.0% of females in these age groups living above the poverty line.
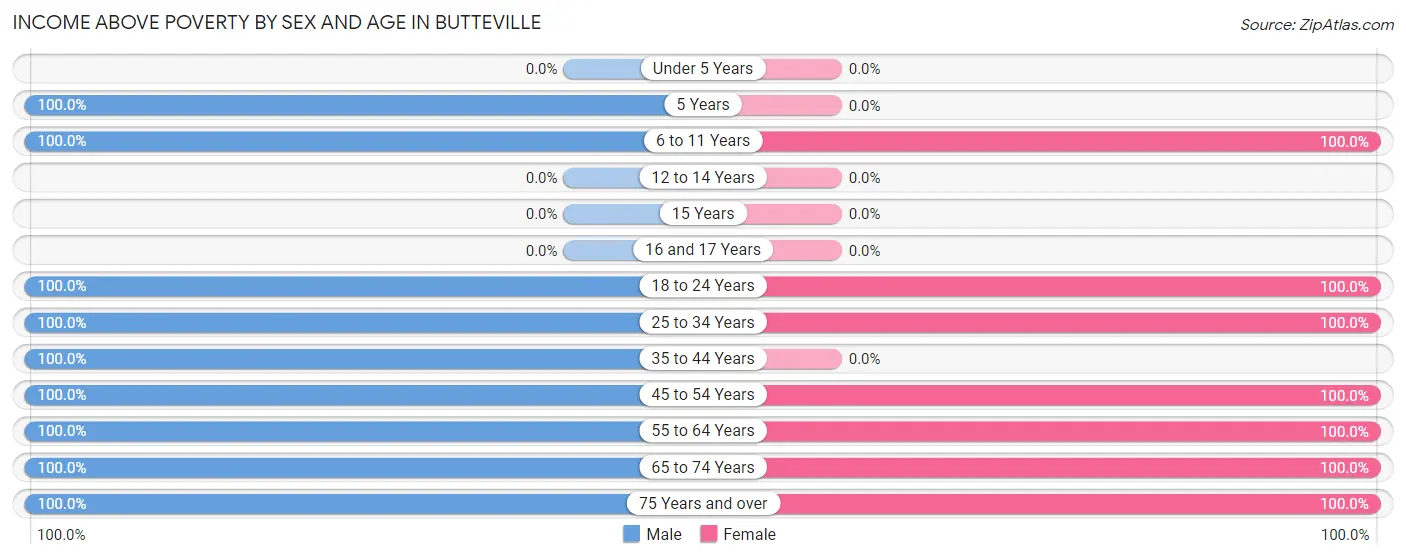
| Age Bracket | Male | Female |
| Under 5 Years | 0 (0.0%) | 0 (0.0%) |
| 5 Years | 11 (100.0%) | 0 (0.0%) |
| 6 to 11 Years | 11 (100.0%) | 20 (100.0%) |
| 12 to 14 Years | 0 (0.0%) | 0 (0.0%) |
| 15 Years | 0 (0.0%) | 0 (0.0%) |
| 16 and 17 Years | 0 (0.0%) | 0 (0.0%) |
| 18 to 24 Years | 5 (100.0%) | 5 (100.0%) |
| 25 to 34 Years | 5 (100.0%) | 8 (100.0%) |
| 35 to 44 Years | 9 (100.0%) | 0 (0.0%) |
| 45 to 54 Years | 20 (100.0%) | 42 (100.0%) |
| 55 to 64 Years | 19 (100.0%) | 47 (100.0%) |
| 65 to 74 Years | 18 (100.0%) | 35 (100.0%) |
| 75 Years and over | 23 (100.0%) | 7 (100.0%) |
| Total | 121 (100.0%) | 164 (100.0%) |
Income Below Poverty Among Married-Couple Families in Butteville
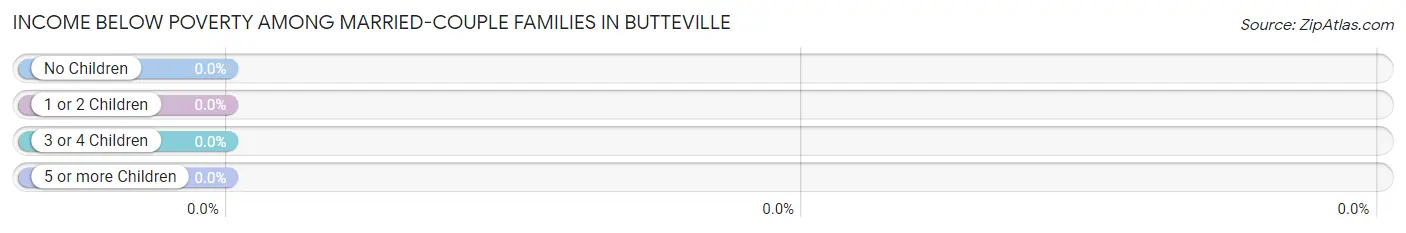
| Children | Above Poverty | Below Poverty |
| No Children | 68 (100.0%) | 0 (0.0%) |
| 1 or 2 Children | 16 (100.0%) | 0 (0.0%) |
| 3 or 4 Children | 0 (0.0%) | 0 (0.0%) |
| 5 or more Children | 0 (0.0%) | 0 (0.0%) |
| Total | 84 (100.0%) | 0 (0.0%) |
Income Below Poverty Among Single-Parent Households in Butteville
| Children | Single Father | Single Mother |
| No Children | 0 (0.0%) | 0 (0.0%) |
| 1 or 2 Children | 0 (0.0%) | 0 (0.0%) |
| 3 or 4 Children | 0 (0.0%) | 0 (0.0%) |
| 5 or more Children | 0 (0.0%) | 0 (0.0%) |
| Total | 0 (0.0%) | 0 (0.0%) |
Income Below Poverty Among Married-Couple vs Single-Parent Households in Butteville
| Children | Married-Couple Families | Single-Parent Households |
| No Children | 0 (0.0%) | 0 (0.0%) |
| 1 or 2 Children | 0 (0.0%) | 0 (0.0%) |
| 3 or 4 Children | 0 (0.0%) | 0 (0.0%) |
| 5 or more Children | 0 (0.0%) | 0 (0.0%) |
| Total | 0 (0.0%) | 0 (0.0%) |
Race in Butteville
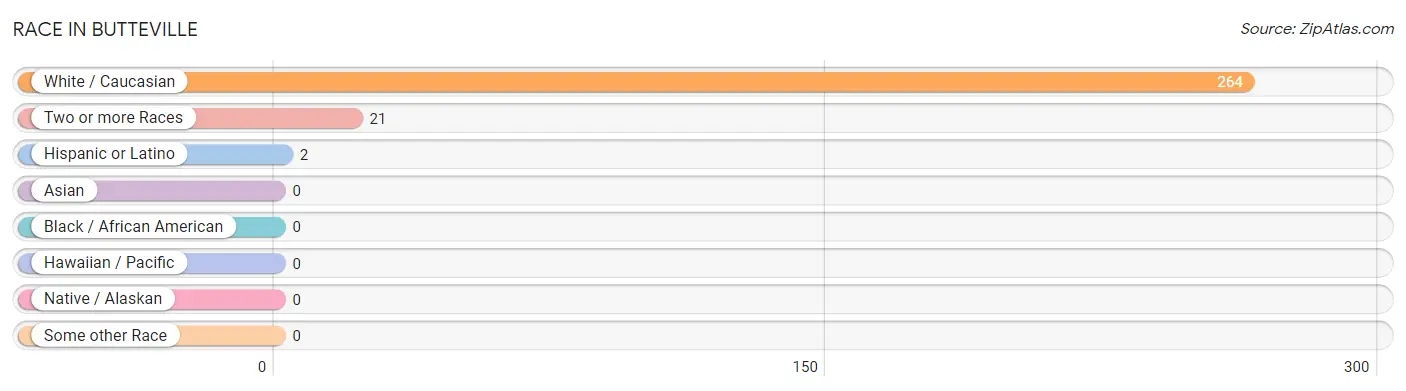
The most populous races in Butteville are White / Caucasian (264 | 92.6%), Two or more Races (21 | 7.4%), and Hispanic or Latino (2 | 0.7%).
| Race | # Population | % Population |
| Asian | 0 | 0.0% |
| Black / African American | 0 | 0.0% |
| Hawaiian / Pacific | 0 | 0.0% |
| Hispanic or Latino | 2 | 0.7% |
| Native / Alaskan | 0 | 0.0% |
| White / Caucasian | 264 | 92.6% |
| Two or more Races | 21 | 7.4% |
| Some other Race | 0 | 0.0% |
| Total | 285 | 100.0% |
Ancestry in Butteville
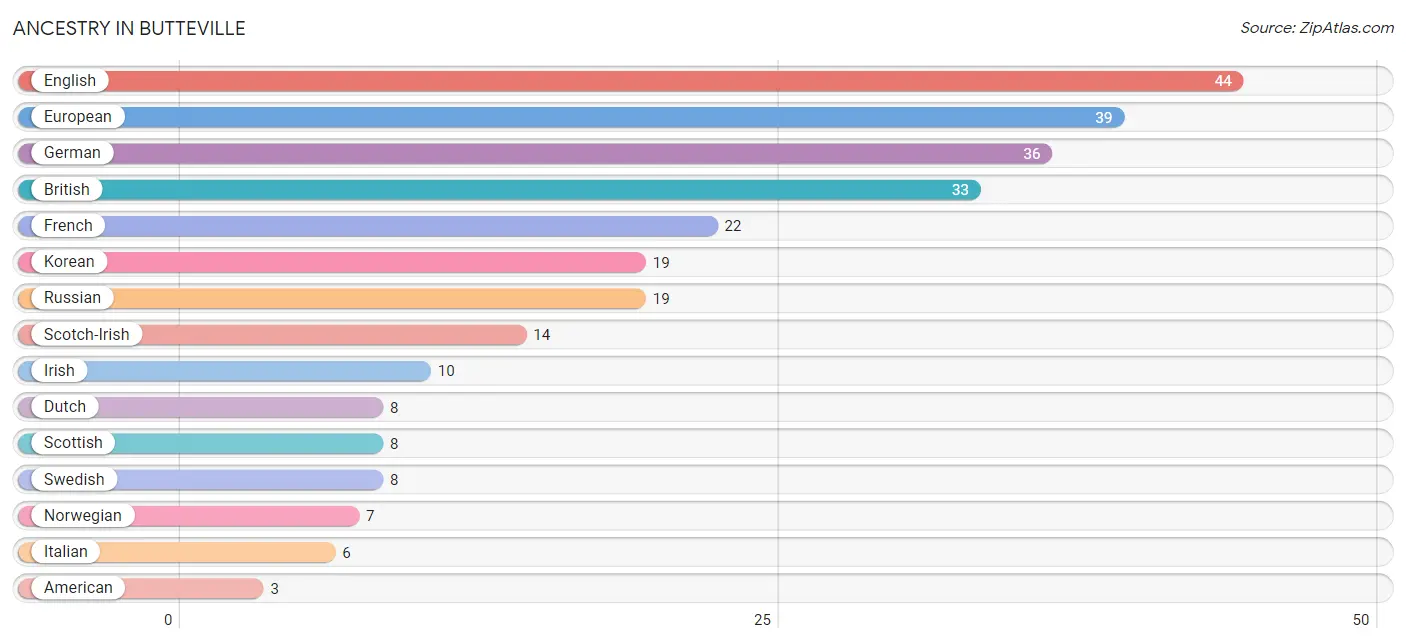
The most populous ancestries reported in Butteville are English (44 | 15.4%), European (39 | 13.7%), German (36 | 12.6%), British (33 | 11.6%), and French (22 | 7.7%), together accounting for 61.1% of all Butteville residents.
| Ancestry | # Population | % Population |
| American | 3 | 1.1% |
| Apache | 2 | 0.7% |
| British | 33 | 11.6% |
| Dutch | 8 | 2.8% |
| English | 44 | 15.4% |
| European | 39 | 13.7% |
| French | 22 | 7.7% |
| German | 36 | 12.6% |
| Irish | 10 | 3.5% |
| Italian | 6 | 2.1% |
| Korean | 19 | 6.7% |
| Norwegian | 7 | 2.5% |
| Russian | 19 | 6.7% |
| Scotch-Irish | 14 | 4.9% |
| Scottish | 8 | 2.8% |
| Spaniard | 2 | 0.7% |
| Swedish | 8 | 2.8% | View All 17 Rows |
Immigrants in Butteville
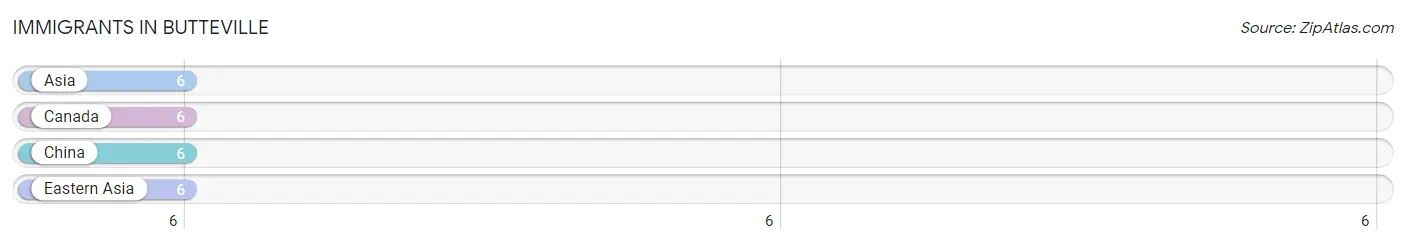
The most numerous immigrant groups reported in Butteville came from Asia (6 | 2.1%), Canada (6 | 2.1%), China (6 | 2.1%), and Eastern Asia (6 | 2.1%), together accounting for 8.4% of all Butteville residents.
| Immigration Origin | # Population | % Population |
| Asia | 6 | 2.1% |
| Canada | 6 | 2.1% |
| China | 6 | 2.1% |
| Eastern Asia | 6 | 2.1% | View All 4 Rows |
Sex and Age in Butteville
Sex and Age in Butteville
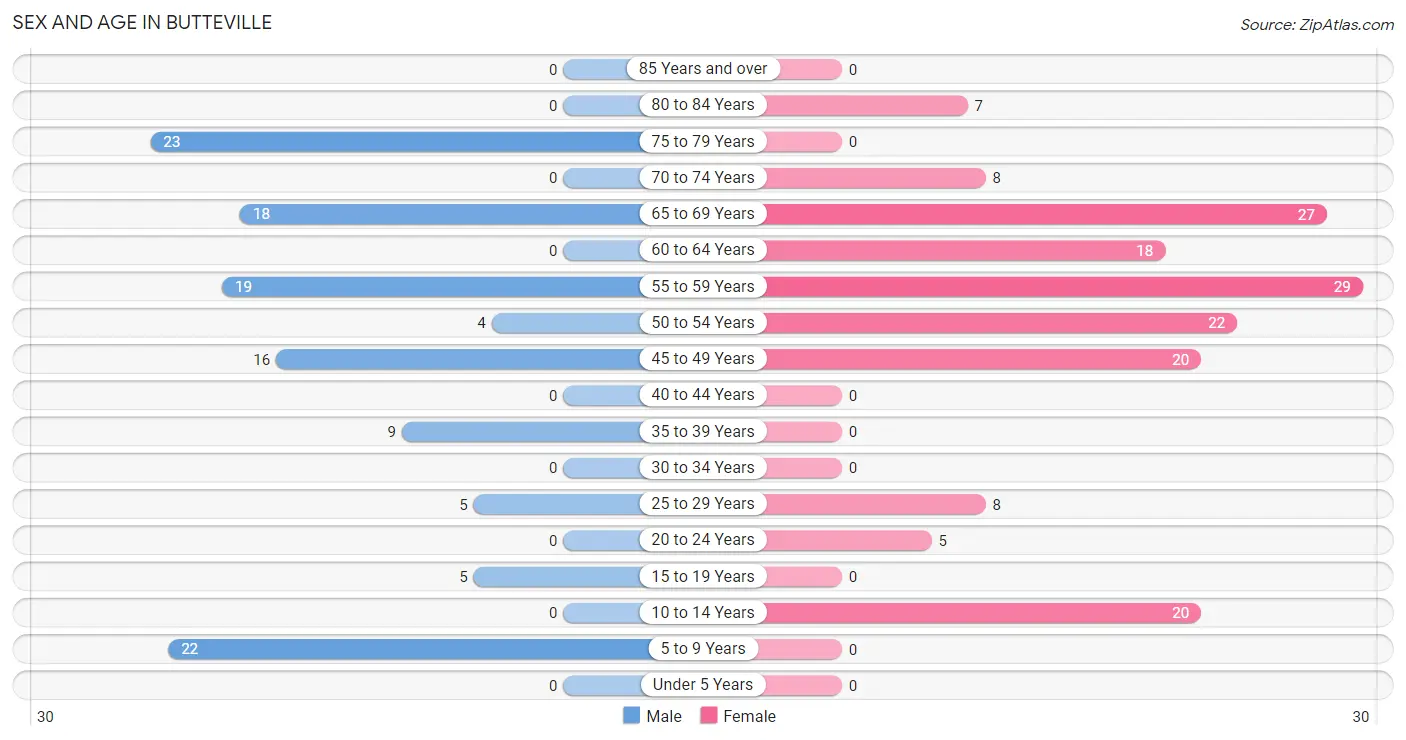
The most populous age groups in Butteville are 75 to 79 Years (23 | 19.0%) for men and 55 to 59 Years (29 | 17.7%) for women.
| Age Bracket | Male | Female |
| Under 5 Years | 0 (0.0%) | 0 (0.0%) |
| 5 to 9 Years | 22 (18.2%) | 0 (0.0%) |
| 10 to 14 Years | 0 (0.0%) | 20 (12.2%) |
| 15 to 19 Years | 5 (4.1%) | 0 (0.0%) |
| 20 to 24 Years | 0 (0.0%) | 5 (3.0%) |
| 25 to 29 Years | 5 (4.1%) | 8 (4.9%) |
| 30 to 34 Years | 0 (0.0%) | 0 (0.0%) |
| 35 to 39 Years | 9 (7.4%) | 0 (0.0%) |
| 40 to 44 Years | 0 (0.0%) | 0 (0.0%) |
| 45 to 49 Years | 16 (13.2%) | 20 (12.2%) |
| 50 to 54 Years | 4 (3.3%) | 22 (13.4%) |
| 55 to 59 Years | 19 (15.7%) | 29 (17.7%) |
| 60 to 64 Years | 0 (0.0%) | 18 (11.0%) |
| 65 to 69 Years | 18 (14.9%) | 27 (16.5%) |
| 70 to 74 Years | 0 (0.0%) | 8 (4.9%) |
| 75 to 79 Years | 23 (19.0%) | 0 (0.0%) |
| 80 to 84 Years | 0 (0.0%) | 7 (4.3%) |
| 85 Years and over | 0 (0.0%) | 0 (0.0%) |
| Total | 121 (100.0%) | 164 (100.0%) |
Families and Households in Butteville
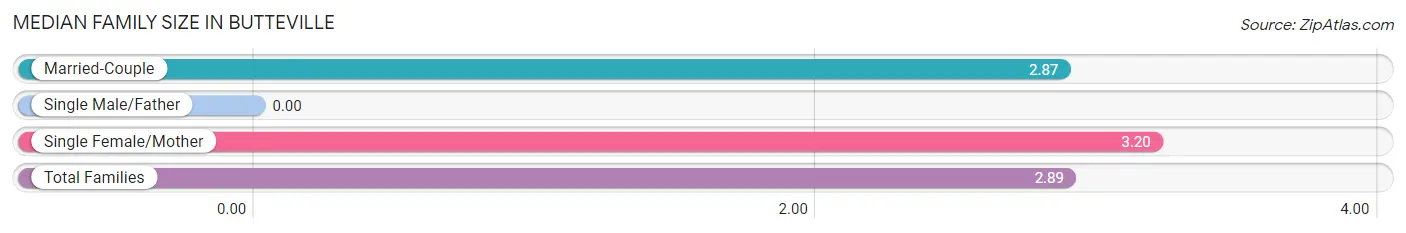
Median Family Size in Butteville
| Family Type | # Families | Family Size |
| Married-Couple | 84 (94.4%) | 2.87 |
| Single Male/Father | 0 (0.0%) | - |
| Single Female/Mother | 5 (5.6%) | 3.20 |
| Total Families | 89 (100.0%) | 2.89 |
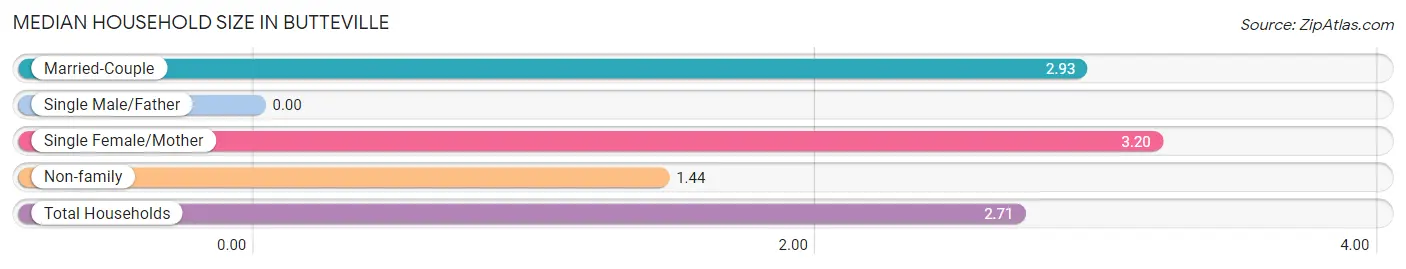
Median Household Size in Butteville
| Household Type | # Households | Household Size |
| Married-Couple | 84 (80.0%) | 2.93 |
| Single Male/Father | 0 (0.0%) | - |
| Single Female/Mother | 5 (4.8%) | 3.20 |
| Non-family | 16 (15.2%) | 1.44 |
| Total Households | 105 (100.0%) | 2.71 |
Household Size by Marriage Status in Butteville
Out of a total of 105 households in Butteville, 89 (84.8%) are family households, while 16 (15.2%) are nonfamily households. The most numerous type of family households are 2-person households, comprising 48, and the most common type of nonfamily households are 1-person households, comprising 10.
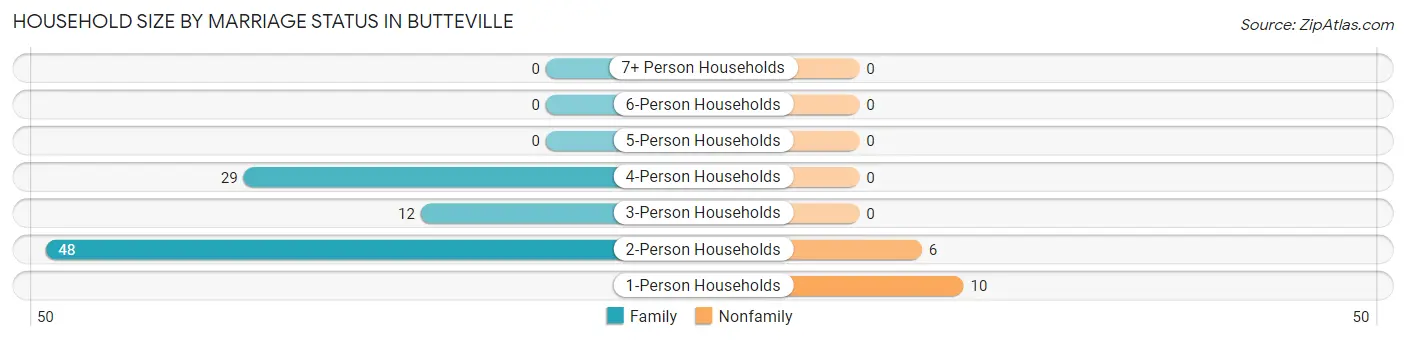
| Household Size | Family Households | Nonfamily Households |
| 1-Person Households | - | 10 (9.5%) |
| 2-Person Households | 48 (45.7%) | 6 (5.7%) |
| 3-Person Households | 12 (11.4%) | 0 (0.0%) |
| 4-Person Households | 29 (27.6%) | 0 (0.0%) |
| 5-Person Households | 0 (0.0%) | 0 (0.0%) |
| 6-Person Households | 0 (0.0%) | 0 (0.0%) |
| 7+ Person Households | 0 (0.0%) | 0 (0.0%) |
| Total | 89 (84.8%) | 16 (15.2%) |
Female Fertility in Butteville
Fertility by Age in Butteville
Average fertility rate in Butteville is 282.0 births per 1,000 women. Women in the age bracket of 35 to 50 years have the highest fertility rate with 423.0 births per 1,000 women. Women in the age bracket of 35 to 50 years acount for 100.0% of all women with births.
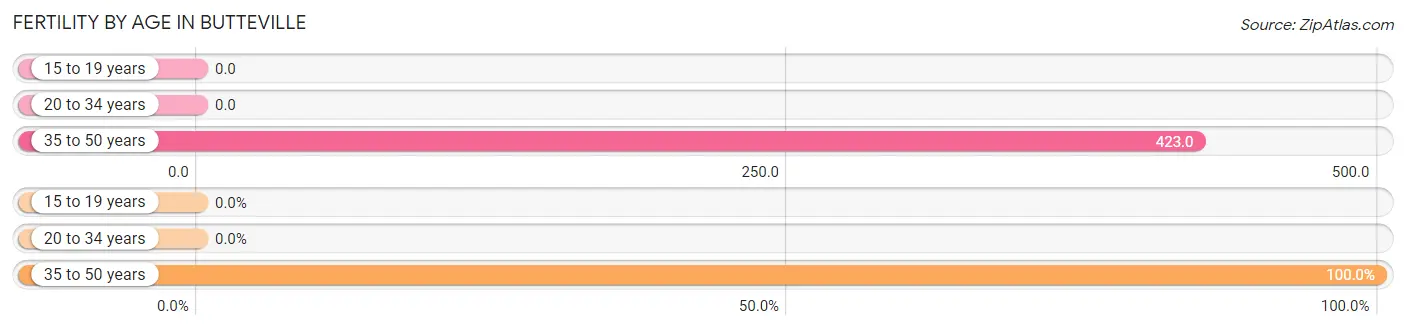
| Age Bracket | Women with Births | Births / 1,000 Women |
| 15 to 19 years | 0 (0.0%) | 0.0 |
| 20 to 34 years | 0 (0.0%) | 0.0 |
| 35 to 50 years | 11 (100.0%) | 423.0 |
| Total | 11 (100.0%) | 282.0 |
Fertility by Age by Marriage Status in Butteville
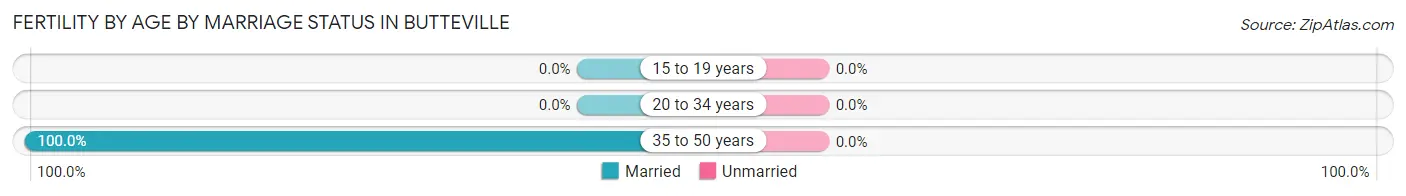
| Age Bracket | Married | Unmarried |
| 15 to 19 years | 0 (0.0%) | 0 (0.0%) |
| 20 to 34 years | 0 (0.0%) | 0 (0.0%) |
| 35 to 50 years | 11 (100.0%) | 0 (0.0%) |
| Total | 11 (100.0%) | 0 (0.0%) |
Fertility by Education in Butteville
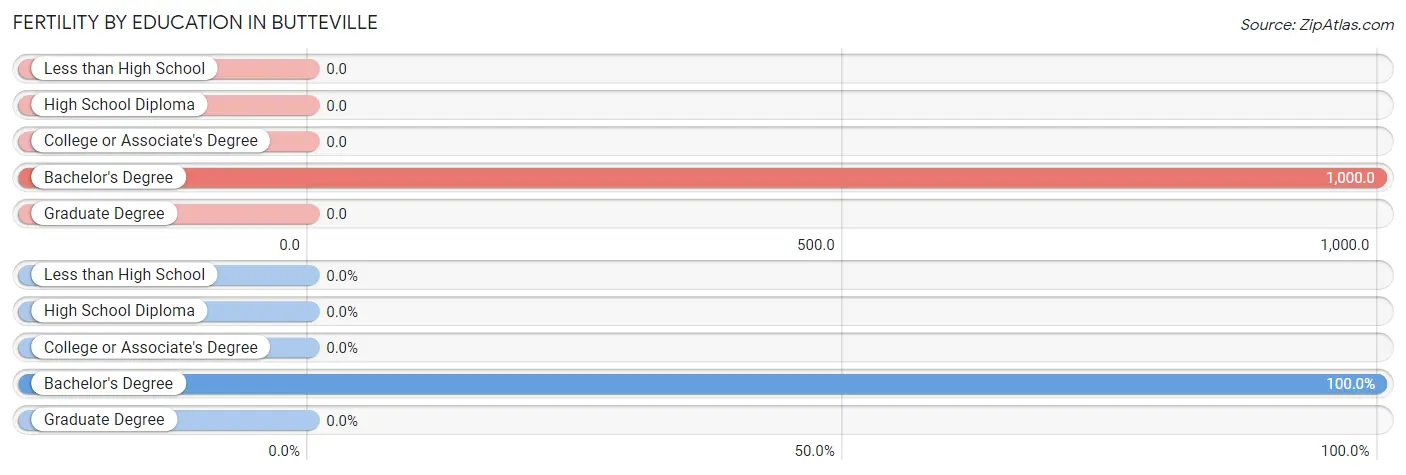
| Educational Attainment | Women with Births | Births / 1,000 Women |
| Less than High School | 0 (0.0%) | 0.0 |
| High School Diploma | 0 (0.0%) | 0.0 |
| College or Associate's Degree | 0 (0.0%) | 0.0 |
| Bachelor's Degree | 11 (100.0%) | 1,000.0 |
| Graduate Degree | 0 (0.0%) | 0.0 |
| Total | 11 (100.0%) | 282.0 |
Fertility by Education by Marriage Status in Butteville
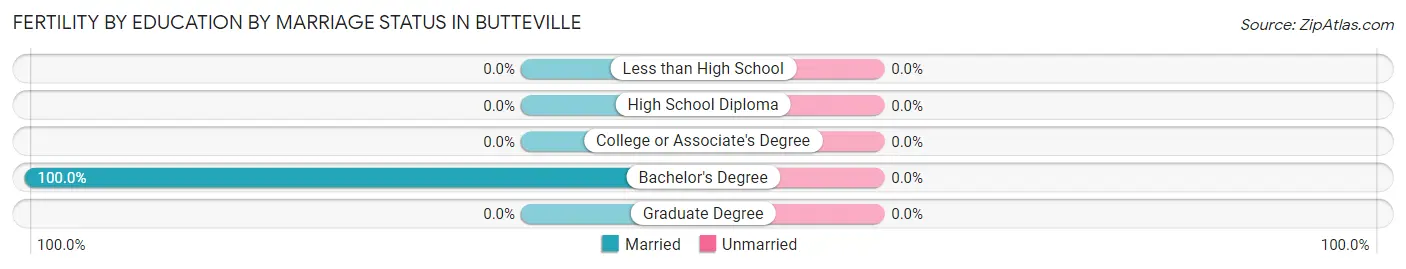
| Educational Attainment | Married | Unmarried |
| Less than High School | 0 (0.0%) | 0 (0.0%) |
| High School Diploma | 0 (0.0%) | 0 (0.0%) |
| College or Associate's Degree | 0 (0.0%) | 0 (0.0%) |
| Bachelor's Degree | 11 (100.0%) | 0 (0.0%) |
| Graduate Degree | 0 (0.0%) | 0 (0.0%) |
| Total | 11 (100.0%) | 0 (0.0%) |
Employment Characteristics in Butteville
Employment by Class of Employer in Butteville
Among the 107 employed individuals in Butteville, private company employees (55 | 51.4%), self-employed (incorporated) (16 | 14.9%), and local government employees (13 | 12.1%) make up the most common classes of employment.
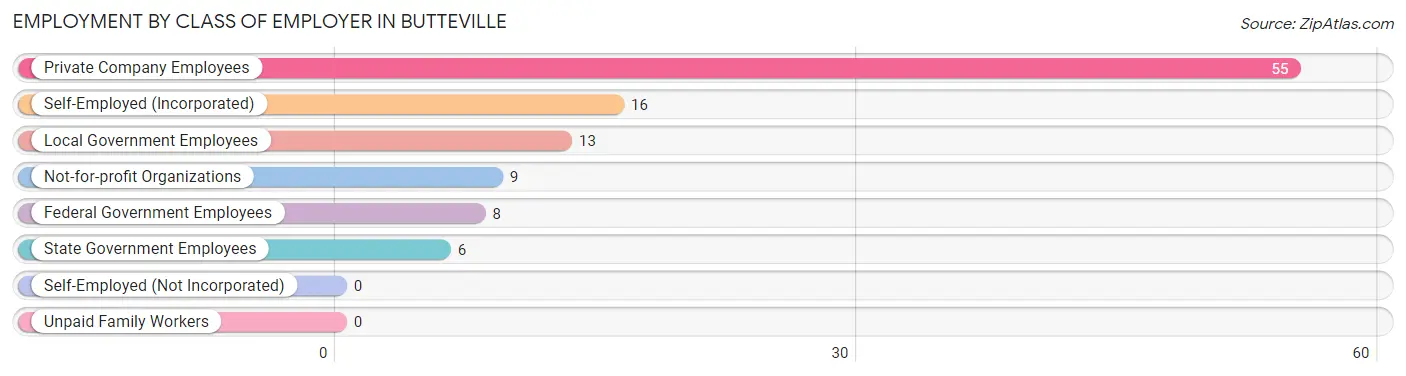
| Employer Class | # Employees | % Employees |
| Private Company Employees | 55 | 51.4% |
| Self-Employed (Incorporated) | 16 | 14.9% |
| Self-Employed (Not Incorporated) | 0 | 0.0% |
| Not-for-profit Organizations | 9 | 8.4% |
| Local Government Employees | 13 | 12.1% |
| State Government Employees | 6 | 5.6% |
| Federal Government Employees | 8 | 7.5% |
| Unpaid Family Workers | 0 | 0.0% |
| Total | 107 | 100.0% |
Employment Status by Age in Butteville
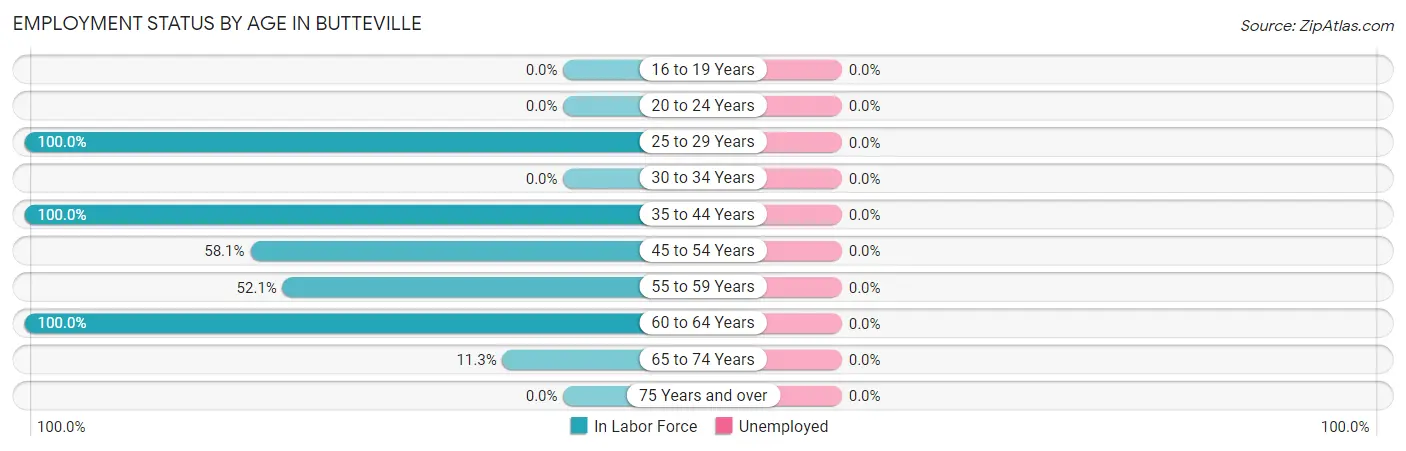
| Age Bracket | In Labor Force | Unemployed |
| 16 to 19 Years | 0 (0.0%) | 0 (0.0%) |
| 20 to 24 Years | 0 (0.0%) | 0 (0.0%) |
| 25 to 29 Years | 13 (100.0%) | 0 (0.0%) |
| 30 to 34 Years | 0 (0.0%) | 0 (0.0%) |
| 35 to 44 Years | 9 (100.0%) | 0 (0.0%) |
| 45 to 54 Years | 36 (58.1%) | 0 (0.0%) |
| 55 to 59 Years | 25 (52.1%) | 0 (0.0%) |
| 60 to 64 Years | 18 (100.0%) | 0 (0.0%) |
| 65 to 74 Years | 6 (11.3%) | 0 (0.0%) |
| 75 Years and over | 0 (0.0%) | 0 (0.0%) |
| Total | 107 (44.0%) | 0 (0.0%) |
Employment Status by Educational Attainment in Butteville
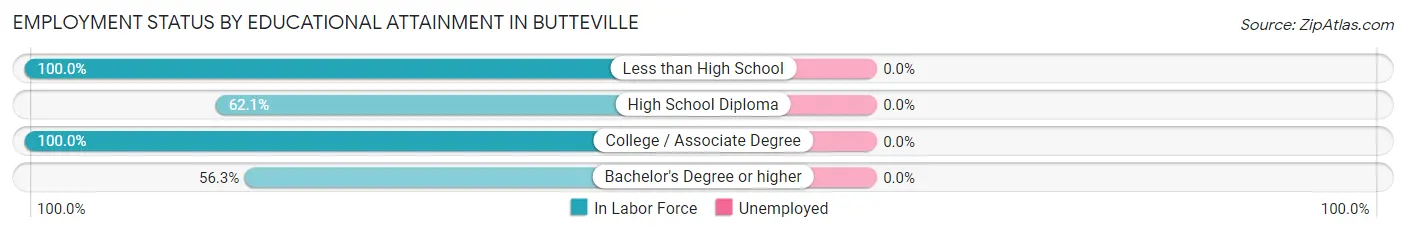
| Educational Attainment | In Labor Force | Unemployed |
| Less than High School | 8 (100.0%) | 0 (0.0%) |
| High School Diploma | 18 (62.1%) | 0 (0.0%) |
| College / Associate Degree | 26 (100.0%) | 0 (0.0%) |
| Bachelor's Degree or higher | 49 (56.3%) | 0 (0.0%) |
| Total | 101 (67.3%) | 0 (0.0%) |
Employment Occupations by Sex in Butteville
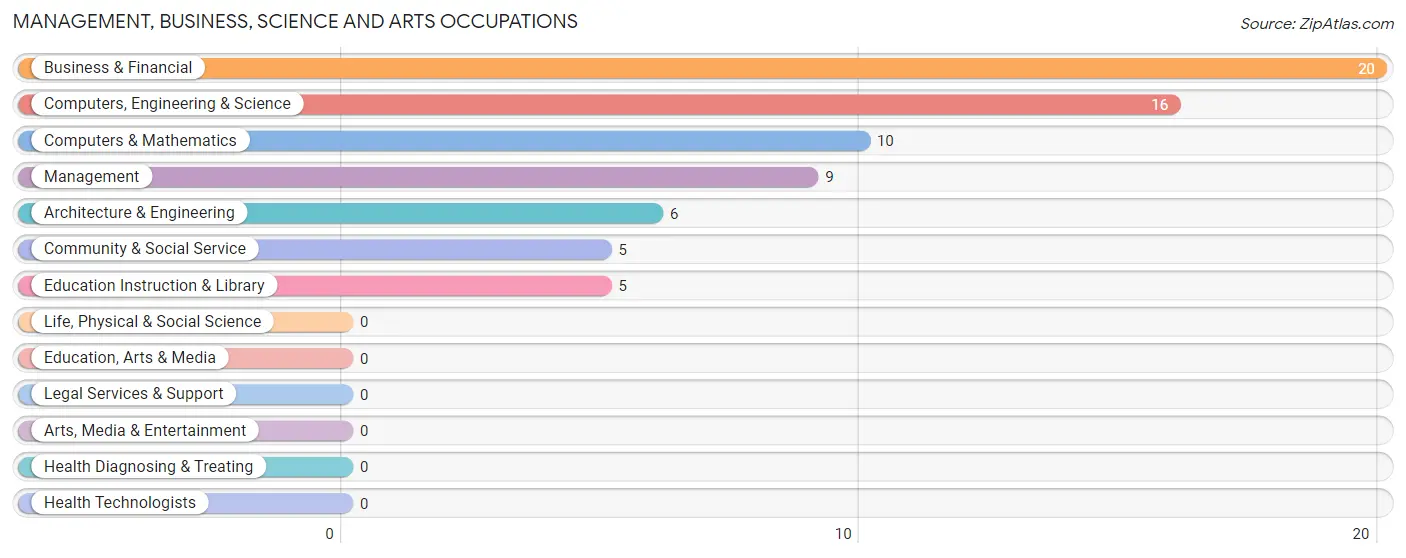
Management, Business, Science and Arts Occupations
The most common Management, Business, Science and Arts occupations in Butteville are Business & Financial (20 | 18.7%), Computers, Engineering & Science (16 | 14.9%), Computers & Mathematics (10 | 9.3%), Management (9 | 8.4%), and Architecture & Engineering (6 | 5.6%).
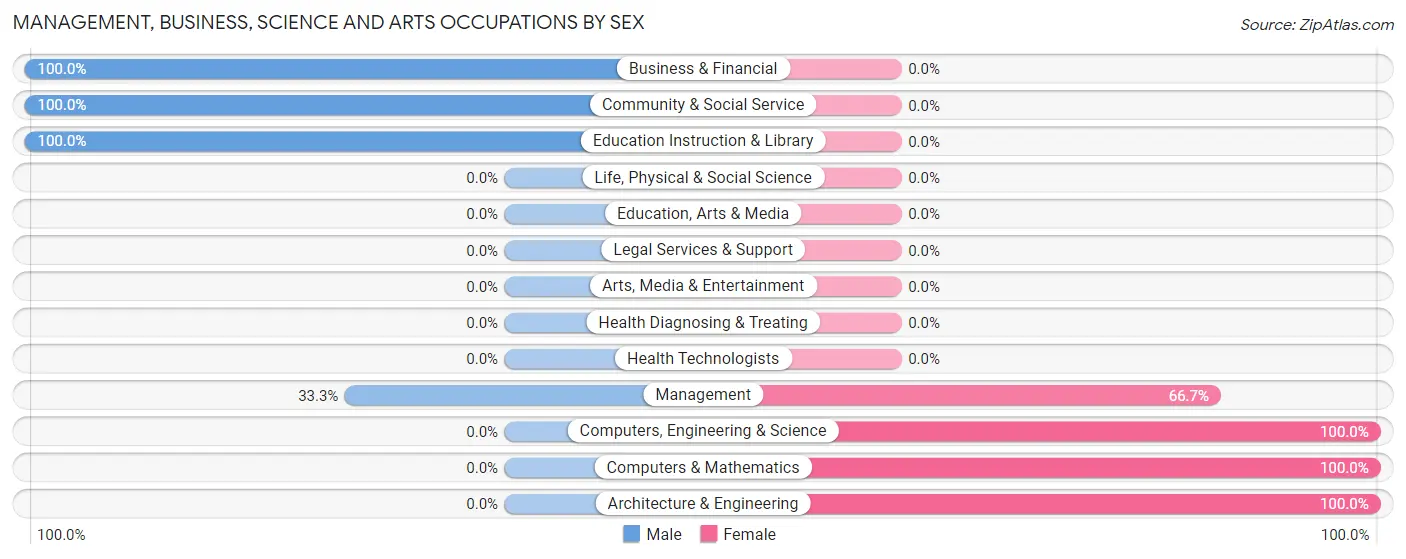
Management, Business, Science and Arts Occupations by Sex
Within the Management, Business, Science and Arts occupations in Butteville, the most male-oriented occupations are Business & Financial (100.0%), Community & Social Service (100.0%), and Education Instruction & Library (100.0%), while the most female-oriented occupations are Computers, Engineering & Science (100.0%), Computers & Mathematics (100.0%), and Architecture & Engineering (100.0%).
| Occupation | Male | Female |
| Management | 3 (33.3%) | 6 (66.7%) |
| Business & Financial | 20 (100.0%) | 0 (0.0%) |
| Computers, Engineering & Science | 0 (0.0%) | 16 (100.0%) |
| Computers & Mathematics | 0 (0.0%) | 10 (100.0%) |
| Architecture & Engineering | 0 (0.0%) | 6 (100.0%) |
| Life, Physical & Social Science | 0 (0.0%) | 0 (0.0%) |
| Community & Social Service | 5 (100.0%) | 0 (0.0%) |
| Education, Arts & Media | 0 (0.0%) | 0 (0.0%) |
| Legal Services & Support | 0 (0.0%) | 0 (0.0%) |
| Education Instruction & Library | 5 (100.0%) | 0 (0.0%) |
| Arts, Media & Entertainment | 0 (0.0%) | 0 (0.0%) |
| Health Diagnosing & Treating | 0 (0.0%) | 0 (0.0%) |
| Health Technologists | 0 (0.0%) | 0 (0.0%) |
| Total (Category) | 28 (56.0%) | 22 (44.0%) |
| Total (Overall) | 51 (47.7%) | 56 (52.3%) |
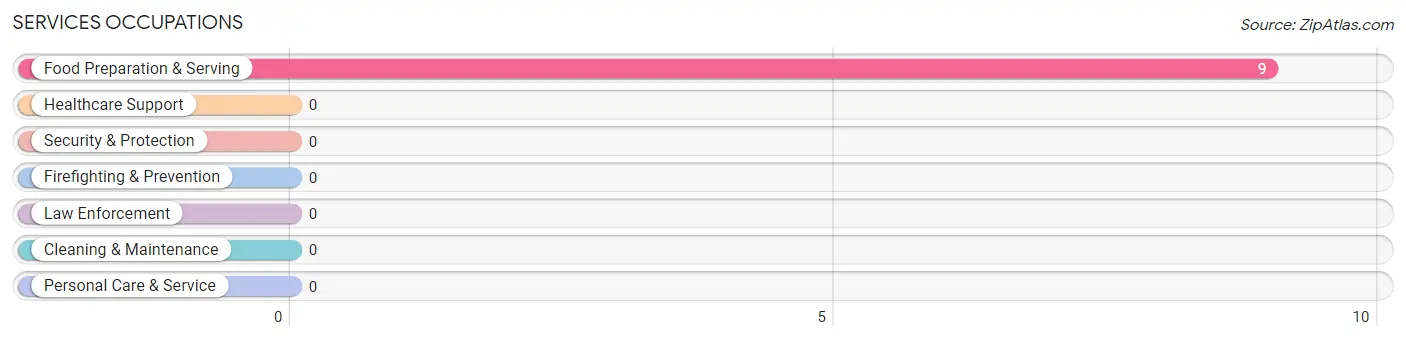
Services Occupations
The most common Services occupations in Butteville are , and Food Preparation & Serving (9 | 8.4%).
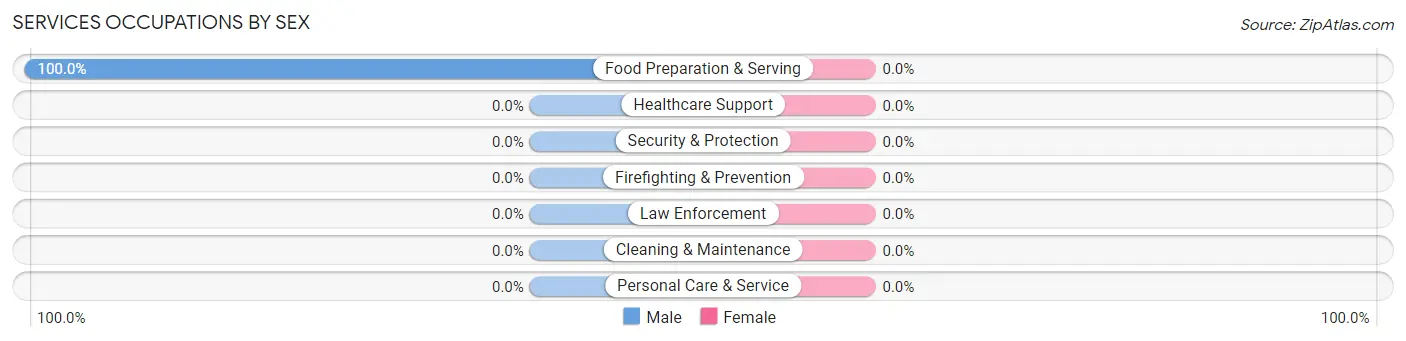
Services Occupations by Sex
| Occupation | Male | Female |
| Healthcare Support | 0 (0.0%) | 0 (0.0%) |
| Security & Protection | 0 (0.0%) | 0 (0.0%) |
| Firefighting & Prevention | 0 (0.0%) | 0 (0.0%) |
| Law Enforcement | 0 (0.0%) | 0 (0.0%) |
| Food Preparation & Serving | 9 (100.0%) | 0 (0.0%) |
| Cleaning & Maintenance | 0 (0.0%) | 0 (0.0%) |
| Personal Care & Service | 0 (0.0%) | 0 (0.0%) |
| Total (Category) | 9 (100.0%) | 0 (0.0%) |
| Total (Overall) | 51 (47.7%) | 56 (52.3%) |
Sales and Office Occupations
The most common Sales and Office occupations in Butteville are Office & Administration (25 | 23.4%), and Sales & Related (9 | 8.4%).
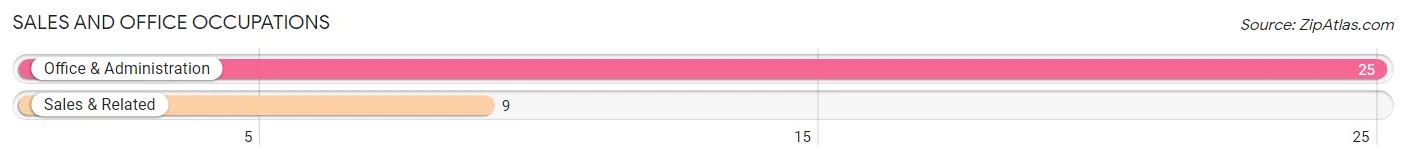
Sales and Office Occupations by Sex
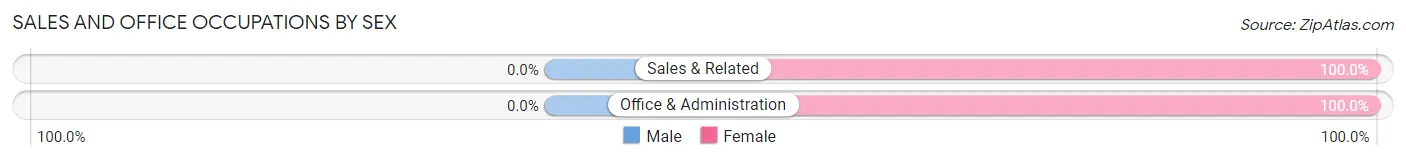
| Occupation | Male | Female |
| Sales & Related | 0 (0.0%) | 9 (100.0%) |
| Office & Administration | 0 (0.0%) | 25 (100.0%) |
| Total (Category) | 0 (0.0%) | 34 (100.0%) |
| Total (Overall) | 51 (47.7%) | 56 (52.3%) |
Natural Resources, Construction and Maintenance Occupations
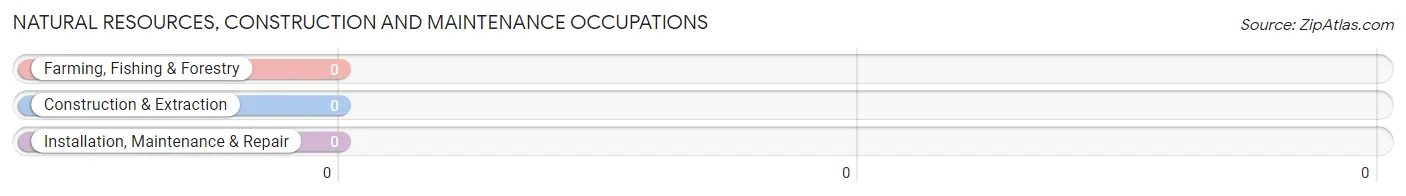
Natural Resources, Construction and Maintenance Occupations by Sex
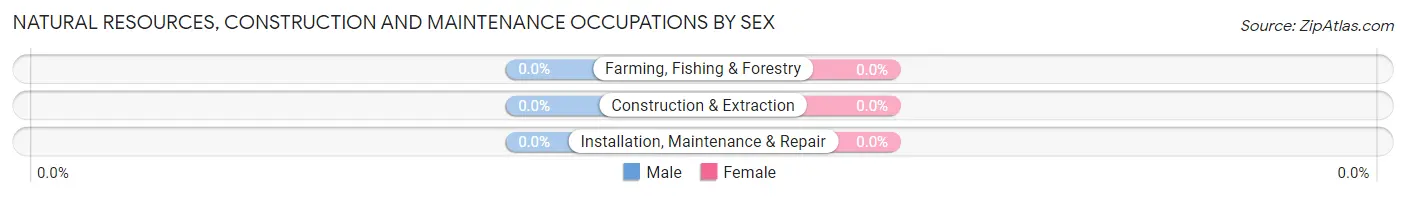
| Occupation | Male | Female |
| Farming, Fishing & Forestry | 0 (0.0%) | 0 (0.0%) |
| Construction & Extraction | 0 (0.0%) | 0 (0.0%) |
| Installation, Maintenance & Repair | 0 (0.0%) | 0 (0.0%) |
| Total (Category) | 0 (0.0%) | 0 (0.0%) |
| Total (Overall) | 51 (47.7%) | 56 (52.3%) |
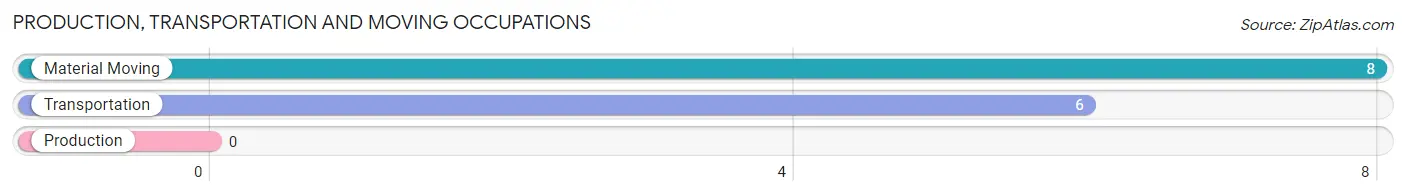
Production, Transportation and Moving Occupations
The most common Production, Transportation and Moving occupations in Butteville are Material Moving (8 | 7.5%), and Transportation (6 | 5.6%).
Production, Transportation and Moving Occupations by Sex
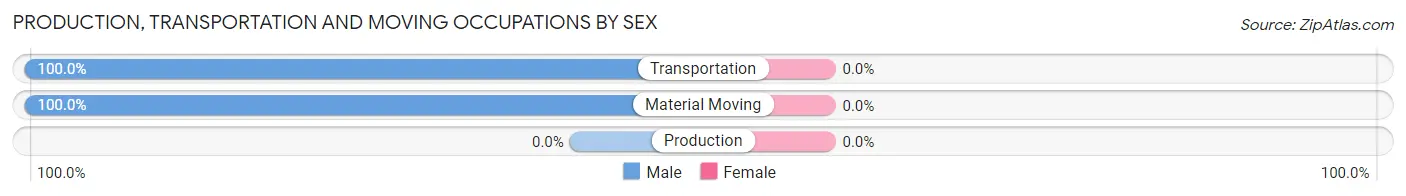
| Occupation | Male | Female |
| Production | 0 (0.0%) | 0 (0.0%) |
| Transportation | 6 (100.0%) | 0 (0.0%) |
| Material Moving | 8 (100.0%) | 0 (0.0%) |
| Total (Category) | 14 (100.0%) | 0 (0.0%) |
| Total (Overall) | 51 (47.7%) | 56 (52.3%) |
Employment Industries by Sex in Butteville
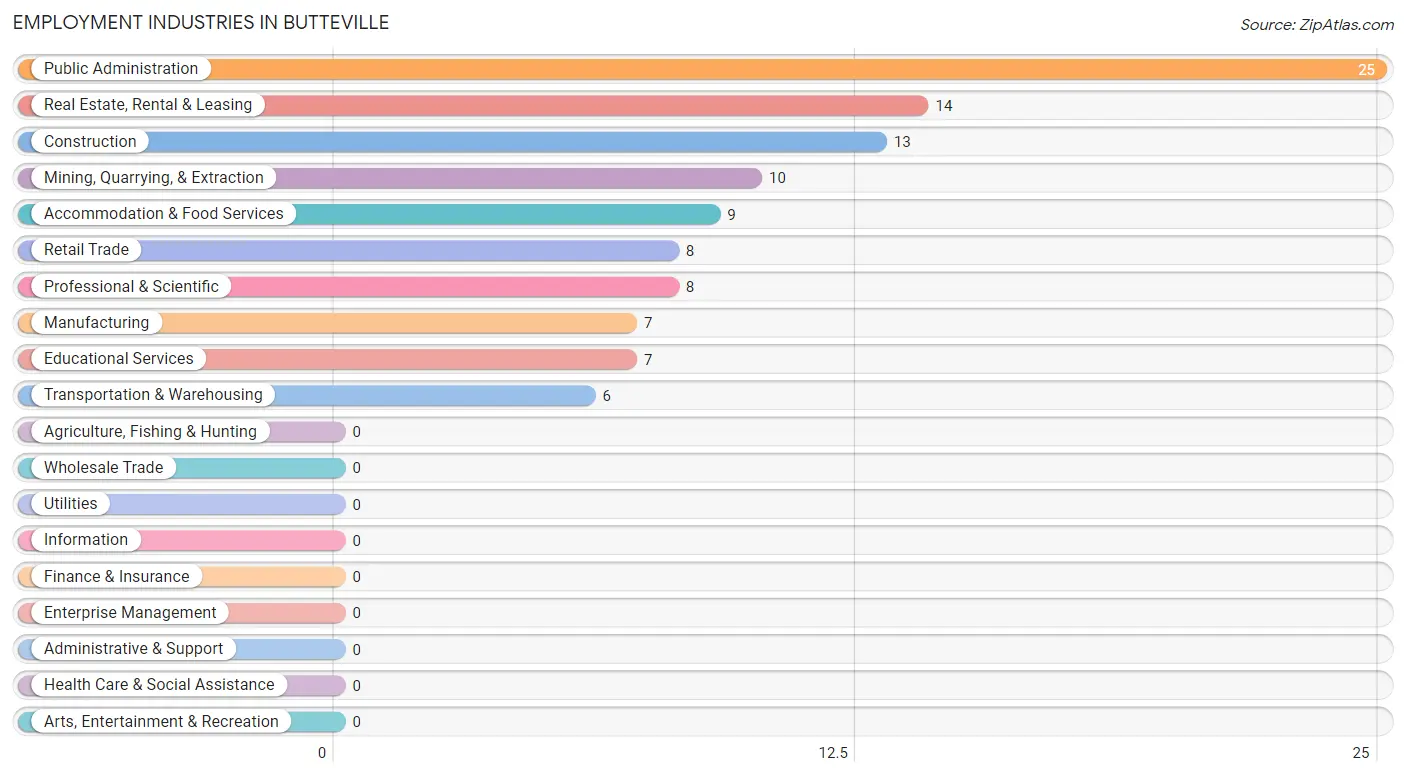
Employment Industries in Butteville
The major employment industries in Butteville include Public Administration (25 | 23.4%), Real Estate, Rental & Leasing (14 | 13.1%), Construction (13 | 12.1%), Mining, Quarrying, & Extraction (10 | 9.3%), and Accommodation & Food Services (9 | 8.4%).
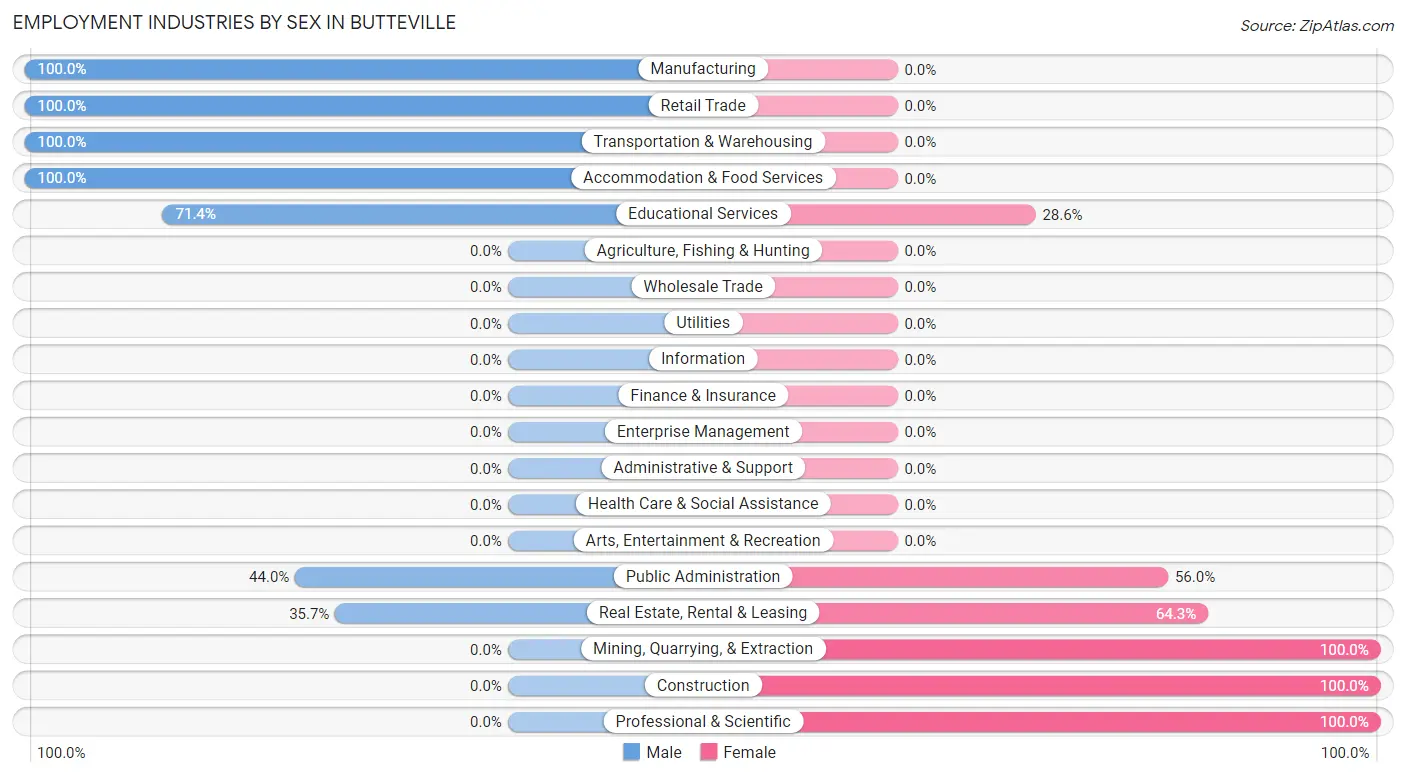
Employment Industries by Sex in Butteville
The Butteville industries that see more men than women are Manufacturing (100.0%), Retail Trade (100.0%), and Transportation & Warehousing (100.0%), whereas the industries that tend to have a higher number of women are Mining, Quarrying, & Extraction (100.0%), Construction (100.0%), and Professional & Scientific (100.0%).
| Industry | Male | Female |
| Agriculture, Fishing & Hunting | 0 (0.0%) | 0 (0.0%) |
| Mining, Quarrying, & Extraction | 0 (0.0%) | 10 (100.0%) |
| Construction | 0 (0.0%) | 13 (100.0%) |
| Manufacturing | 7 (100.0%) | 0 (0.0%) |
| Wholesale Trade | 0 (0.0%) | 0 (0.0%) |
| Retail Trade | 8 (100.0%) | 0 (0.0%) |
| Transportation & Warehousing | 6 (100.0%) | 0 (0.0%) |
| Utilities | 0 (0.0%) | 0 (0.0%) |
| Information | 0 (0.0%) | 0 (0.0%) |
| Finance & Insurance | 0 (0.0%) | 0 (0.0%) |
| Real Estate, Rental & Leasing | 5 (35.7%) | 9 (64.3%) |
| Professional & Scientific | 0 (0.0%) | 8 (100.0%) |
| Enterprise Management | 0 (0.0%) | 0 (0.0%) |
| Administrative & Support | 0 (0.0%) | 0 (0.0%) |
| Educational Services | 5 (71.4%) | 2 (28.6%) |
| Health Care & Social Assistance | 0 (0.0%) | 0 (0.0%) |
| Arts, Entertainment & Recreation | 0 (0.0%) | 0 (0.0%) |
| Accommodation & Food Services | 9 (100.0%) | 0 (0.0%) |
| Public Administration | 11 (44.0%) | 14 (56.0%) |
| Total | 51 (47.7%) | 56 (52.3%) |
Education in Butteville
School Enrollment in Butteville
The most common levels of schooling among the 47 students in Butteville are middle school (20 | 42.5%), nursery / preschool (11 | 23.4%), and elementary school (11 | 23.4%).
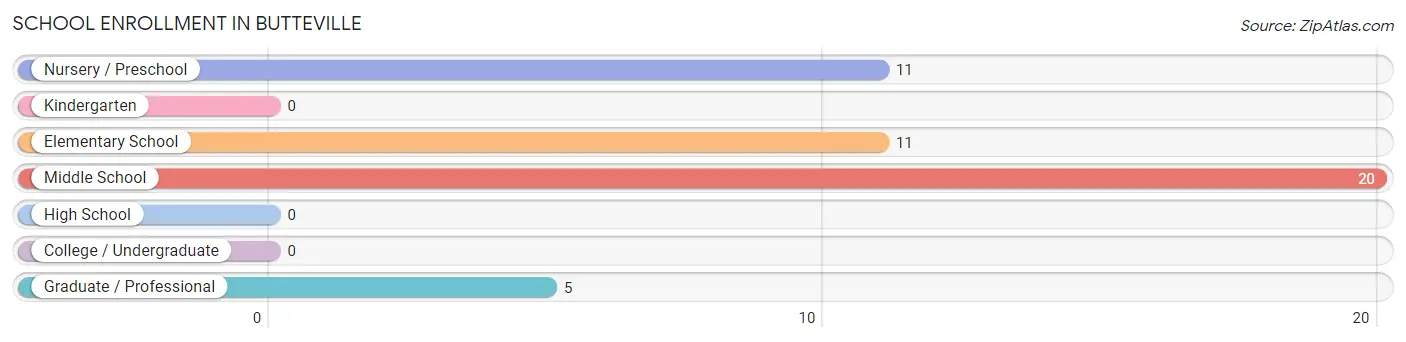
| School Level | # Students | % Students |
| Nursery / Preschool | 11 | 23.4% |
| Kindergarten | 0 | 0.0% |
| Elementary School | 11 | 23.4% |
| Middle School | 20 | 42.5% |
| High School | 0 | 0.0% |
| College / Undergraduate | 0 | 0.0% |
| Graduate / Professional | 5 | 10.6% |
| Total | 47 | 100.0% |
School Enrollment by Age by Funding Source in Butteville
Out of a total of 47 students who are enrolled in schools in Butteville, 11 (23.4%) attend a private institution, while the remaining 36 (76.6%) are enrolled in public schools. The age group of 5 to 9 year old has the highest likelihood of being enrolled in private schools, with 11 (50.0% in the age bracket) enrolled. Conversely, the age group of 10 to 14 year olds has the lowest likelihood of being enrolled in a private school, with 20 (100.0% in the age bracket) attending a public institution.
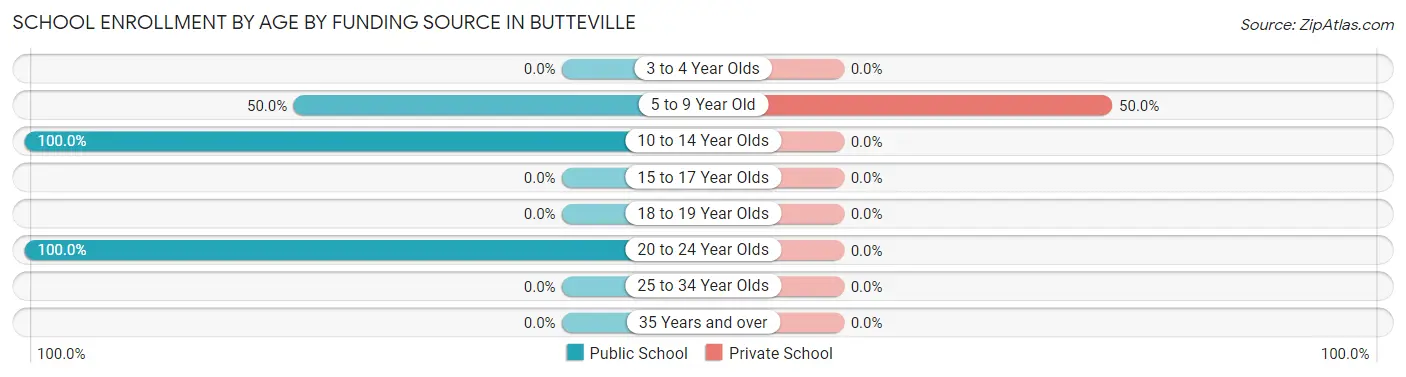
| Age Bracket | Public School | Private School |
| 3 to 4 Year Olds | 0 (0.0%) | 0 (0.0%) |
| 5 to 9 Year Old | 11 (50.0%) | 11 (50.0%) |
| 10 to 14 Year Olds | 20 (100.0%) | 0 (0.0%) |
| 15 to 17 Year Olds | 0 (0.0%) | 0 (0.0%) |
| 18 to 19 Year Olds | 0 (0.0%) | 0 (0.0%) |
| 20 to 24 Year Olds | 5 (100.0%) | 0 (0.0%) |
| 25 to 34 Year Olds | 0 (0.0%) | 0 (0.0%) |
| 35 Years and over | 0 (0.0%) | 0 (0.0%) |
| Total | 36 (76.6%) | 11 (23.4%) |
Educational Attainment by Field of Study in Butteville
Social sciences (19 | 16.2%), education (16 | 13.7%), business (14 | 12.0%), physical & health sciences (12 | 10.3%), and psychology (11 | 9.4%) are the most common fields of study among 117 individuals in Butteville who have obtained a bachelor's degree or higher.
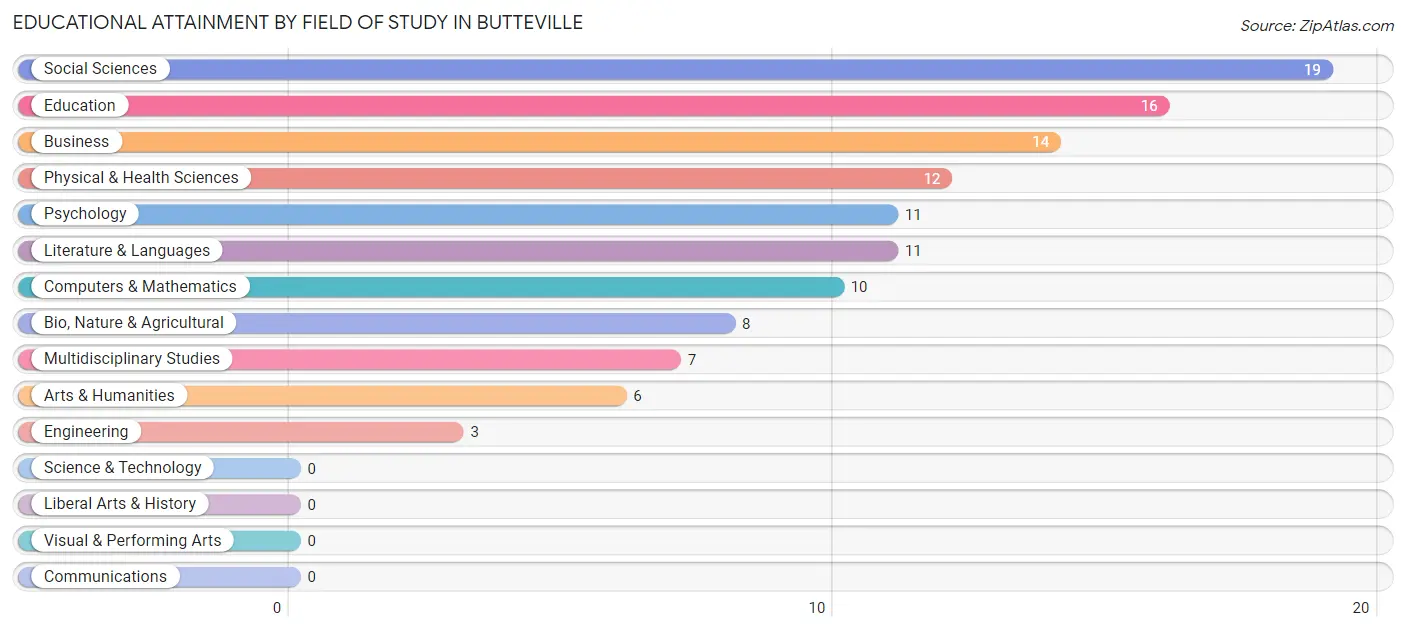
| Field of Study | # Graduates | % Graduates |
| Computers & Mathematics | 10 | 8.6% |
| Bio, Nature & Agricultural | 8 | 6.8% |
| Physical & Health Sciences | 12 | 10.3% |
| Psychology | 11 | 9.4% |
| Social Sciences | 19 | 16.2% |
| Engineering | 3 | 2.6% |
| Multidisciplinary Studies | 7 | 6.0% |
| Science & Technology | 0 | 0.0% |
| Business | 14 | 12.0% |
| Education | 16 | 13.7% |
| Literature & Languages | 11 | 9.4% |
| Liberal Arts & History | 0 | 0.0% |
| Visual & Performing Arts | 0 | 0.0% |
| Communications | 0 | 0.0% |
| Arts & Humanities | 6 | 5.1% |
| Total | 117 | 100.0% |
Transportation & Commute in Butteville
Vehicle Availability by Sex in Butteville
The most prevalent vehicle ownership categories in Butteville are males with 2 vehicles (22, accounting for 43.1%) and females with 2 vehicles (25, making up 39.3%).
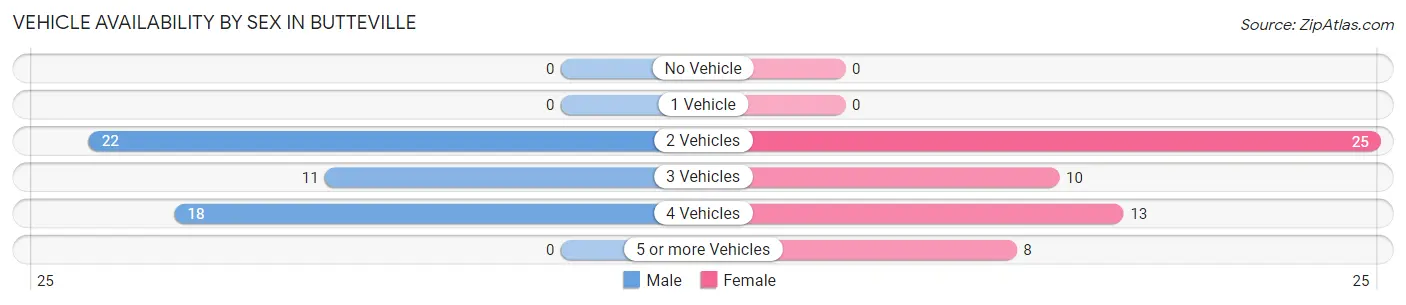
| Vehicles Available | Male | Female |
| No Vehicle | 0 (0.0%) | 0 (0.0%) |
| 1 Vehicle | 0 (0.0%) | 0 (0.0%) |
| 2 Vehicles | 22 (43.1%) | 25 (44.6%) |
| 3 Vehicles | 11 (21.6%) | 10 (17.9%) |
| 4 Vehicles | 18 (35.3%) | 13 (23.2%) |
| 5 or more Vehicles | 0 (0.0%) | 8 (14.3%) |
| Total | 51 (100.0%) | 56 (100.0%) |
Commute Time in Butteville
The most frequently occuring commute durations in Butteville are 45 to 59 minutes (21 commuters, 22.1%), 60 to 89 minutes (19 commuters, 20.0%), and 5 to 9 minutes (15 commuters, 15.8%).
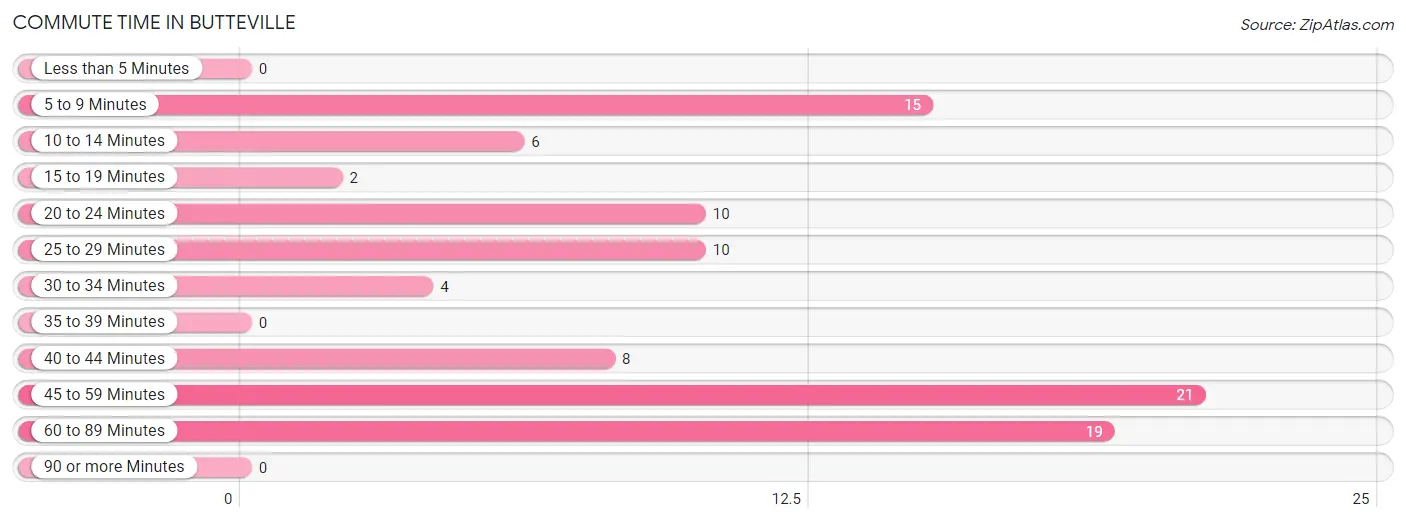
| Commute Time | # Commuters | % Commuters |
| Less than 5 Minutes | 0 | 0.0% |
| 5 to 9 Minutes | 15 | 15.8% |
| 10 to 14 Minutes | 6 | 6.3% |
| 15 to 19 Minutes | 2 | 2.1% |
| 20 to 24 Minutes | 10 | 10.5% |
| 25 to 29 Minutes | 10 | 10.5% |
| 30 to 34 Minutes | 4 | 4.2% |
| 35 to 39 Minutes | 0 | 0.0% |
| 40 to 44 Minutes | 8 | 8.4% |
| 45 to 59 Minutes | 21 | 22.1% |
| 60 to 89 Minutes | 19 | 20.0% |
| 90 or more Minutes | 0 | 0.0% |
Commute Time by Sex in Butteville
The most common commute times in Butteville are 60 to 89 minutes (19 commuters, 39.6%) for males and 45 to 59 minutes (21 commuters, 44.7%) for females.
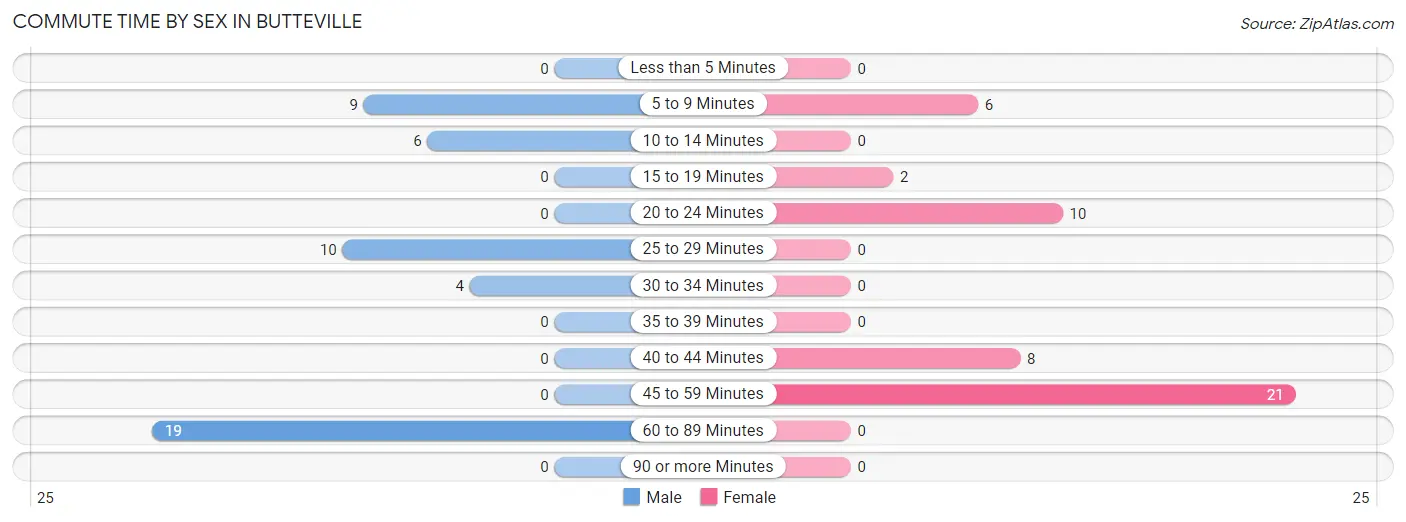
| Commute Time | Male | Female |
| Less than 5 Minutes | 0 (0.0%) | 0 (0.0%) |
| 5 to 9 Minutes | 9 (18.8%) | 6 (12.8%) |
| 10 to 14 Minutes | 6 (12.5%) | 0 (0.0%) |
| 15 to 19 Minutes | 0 (0.0%) | 2 (4.3%) |
| 20 to 24 Minutes | 0 (0.0%) | 10 (21.3%) |
| 25 to 29 Minutes | 10 (20.8%) | 0 (0.0%) |
| 30 to 34 Minutes | 4 (8.3%) | 0 (0.0%) |
| 35 to 39 Minutes | 0 (0.0%) | 0 (0.0%) |
| 40 to 44 Minutes | 0 (0.0%) | 8 (17.0%) |
| 45 to 59 Minutes | 0 (0.0%) | 21 (44.7%) |
| 60 to 89 Minutes | 19 (39.6%) | 0 (0.0%) |
| 90 or more Minutes | 0 (0.0%) | 0 (0.0%) |
Time of Departure to Work by Sex in Butteville
The most frequent times of departure to work in Butteville are 7:30 AM to 7:59 AM (19, 39.6%) for males and 6:30 AM to 6:59 AM (21, 44.7%) for females.
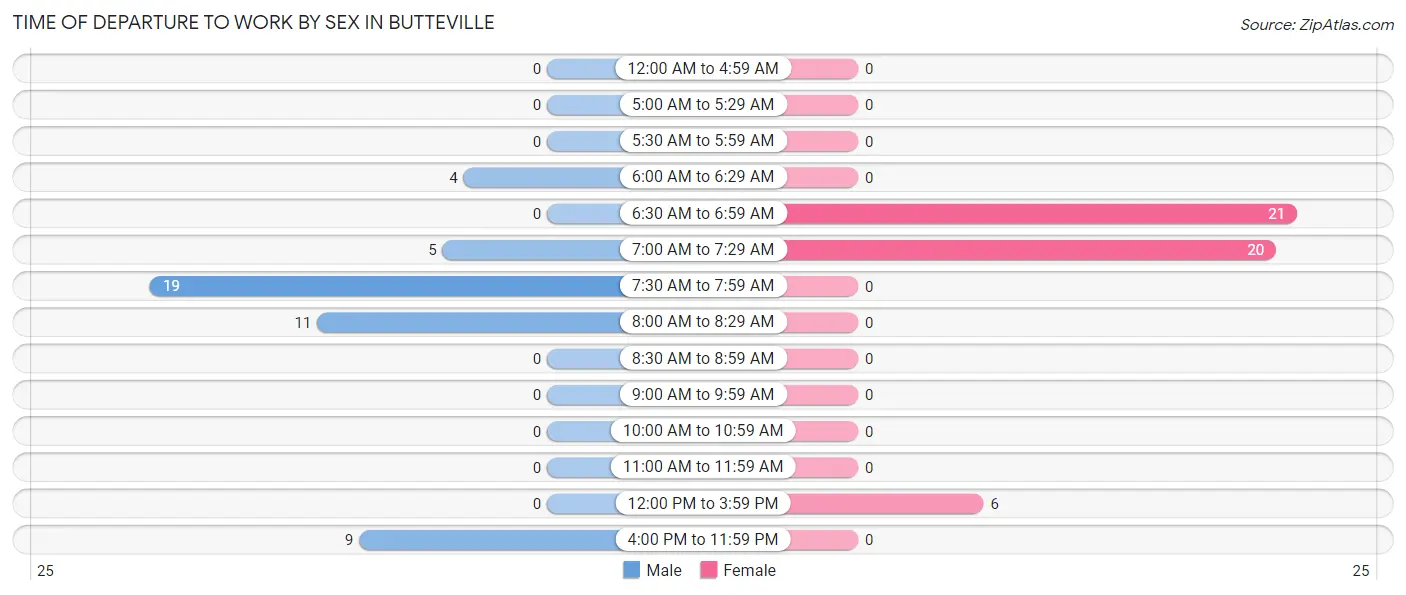
| Time of Departure | Male | Female |
| 12:00 AM to 4:59 AM | 0 (0.0%) | 0 (0.0%) |
| 5:00 AM to 5:29 AM | 0 (0.0%) | 0 (0.0%) |
| 5:30 AM to 5:59 AM | 0 (0.0%) | 0 (0.0%) |
| 6:00 AM to 6:29 AM | 4 (8.3%) | 0 (0.0%) |
| 6:30 AM to 6:59 AM | 0 (0.0%) | 21 (44.7%) |
| 7:00 AM to 7:29 AM | 5 (10.4%) | 20 (42.5%) |
| 7:30 AM to 7:59 AM | 19 (39.6%) | 0 (0.0%) |
| 8:00 AM to 8:29 AM | 11 (22.9%) | 0 (0.0%) |
| 8:30 AM to 8:59 AM | 0 (0.0%) | 0 (0.0%) |
| 9:00 AM to 9:59 AM | 0 (0.0%) | 0 (0.0%) |
| 10:00 AM to 10:59 AM | 0 (0.0%) | 0 (0.0%) |
| 11:00 AM to 11:59 AM | 0 (0.0%) | 0 (0.0%) |
| 12:00 PM to 3:59 PM | 0 (0.0%) | 6 (12.8%) |
| 4:00 PM to 11:59 PM | 9 (18.8%) | 0 (0.0%) |
| Total | 48 (100.0%) | 47 (100.0%) |
Housing Occupancy in Butteville
Occupancy by Ownership in Butteville
Of the total 105 dwellings in Butteville, owner-occupied units account for 92 (87.6%), while renter-occupied units make up 13 (12.4%).
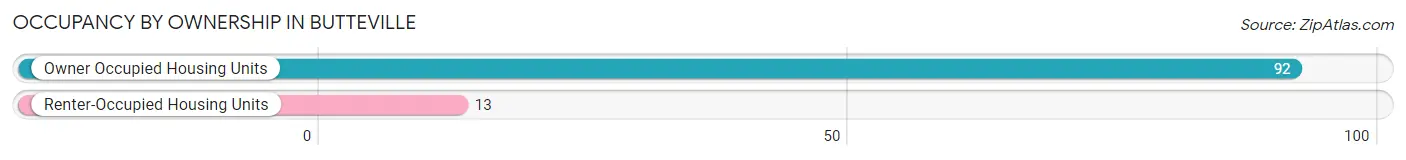
| Occupancy | # Housing Units | % Housing Units |
| Owner Occupied Housing Units | 92 | 87.6% |
| Renter-Occupied Housing Units | 13 | 12.4% |
| Total Occupied Housing Units | 105 | 100.0% |
Occupancy by Household Size in Butteville
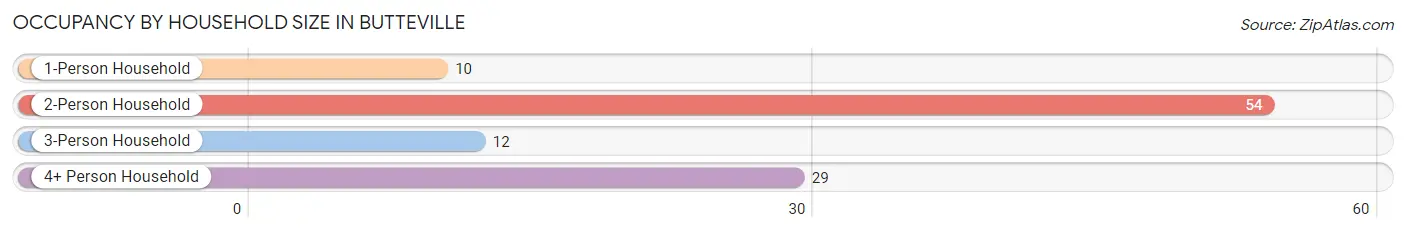
| Household Size | # Housing Units | % Housing Units |
| 1-Person Household | 10 | 9.5% |
| 2-Person Household | 54 | 51.4% |
| 3-Person Household | 12 | 11.4% |
| 4+ Person Household | 29 | 27.6% |
| Total Housing Units | 105 | 100.0% |
Occupancy by Ownership by Household Size in Butteville
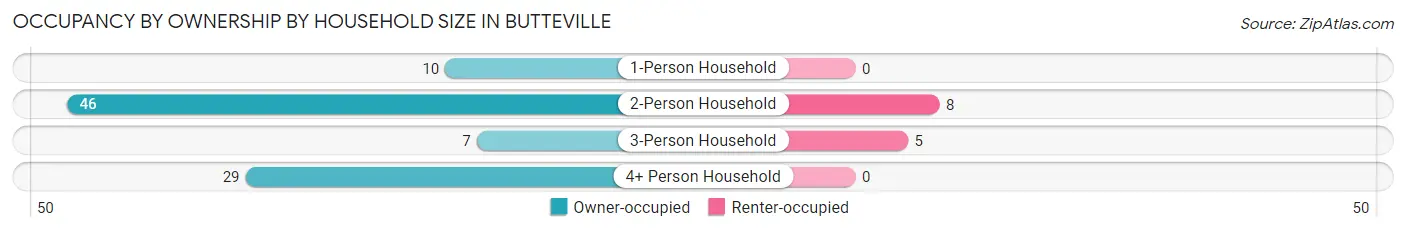
| Household Size | Owner-occupied | Renter-occupied |
| 1-Person Household | 10 (100.0%) | 0 (0.0%) |
| 2-Person Household | 46 (85.2%) | 8 (14.8%) |
| 3-Person Household | 7 (58.3%) | 5 (41.7%) |
| 4+ Person Household | 29 (100.0%) | 0 (0.0%) |
| Total Housing Units | 92 (87.6%) | 13 (12.4%) |
Occupancy by Educational Attainment in Butteville
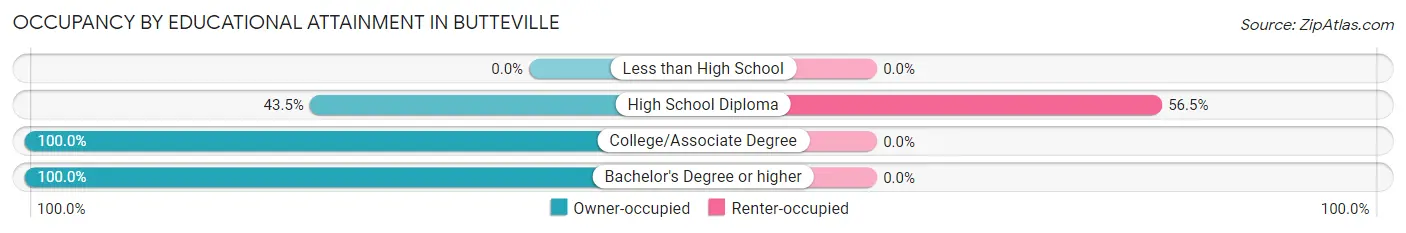
| Household Size | Owner-occupied | Renter-occupied |
| Less than High School | 0 (0.0%) | 0 (0.0%) |
| High School Diploma | 10 (43.5%) | 13 (56.5%) |
| College/Associate Degree | 40 (100.0%) | 0 (0.0%) |
| Bachelor's Degree or higher | 42 (100.0%) | 0 (0.0%) |
Occupancy by Age of Householder in Butteville
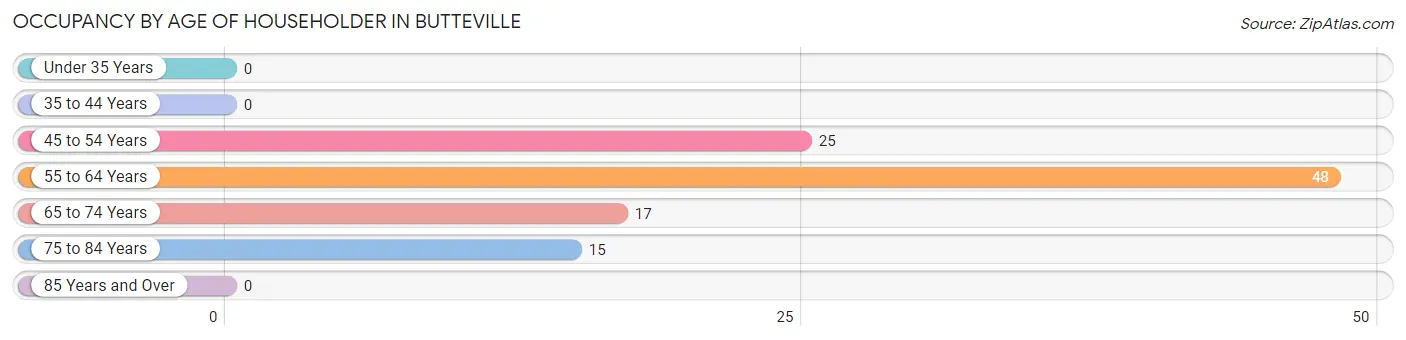
| Age Bracket | # Households | % Households |
| Under 35 Years | 0 | 0.0% |
| 35 to 44 Years | 0 | 0.0% |
| 45 to 54 Years | 25 | 23.8% |
| 55 to 64 Years | 48 | 45.7% |
| 65 to 74 Years | 17 | 16.2% |
| 75 to 84 Years | 15 | 14.3% |
| 85 Years and Over | 0 | 0.0% |
| Total | 105 | 100.0% |
Housing Finances in Butteville
Median Income by Occupancy in Butteville
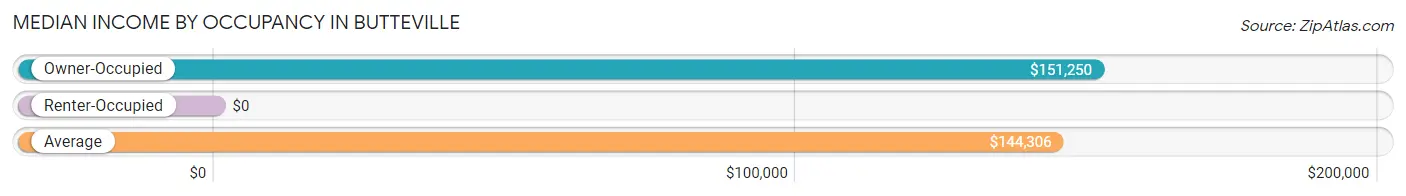
| Occupancy Type | # Households | Median Income |
| Owner-Occupied | 92 (87.6%) | $151,250 |
| Renter-Occupied | 13 (12.4%) | $0 |
| Average | 105 (100.0%) | $144,306 |
Occupancy by Householder Income Bracket in Butteville
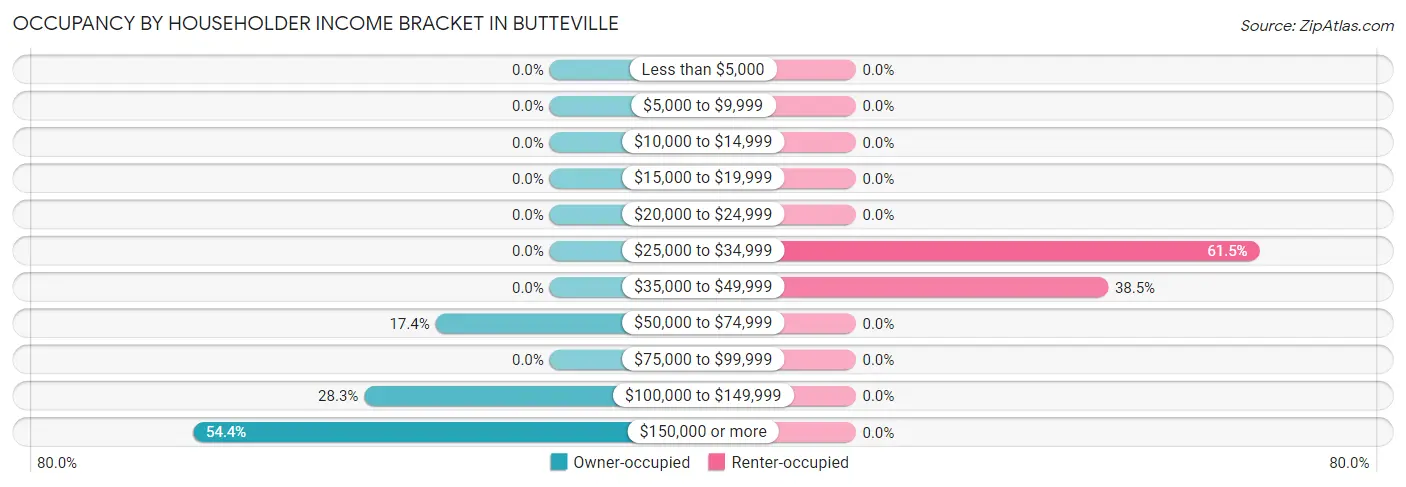
| Income Bracket | Owner-occupied | Renter-occupied |
| Less than $5,000 | 0 (0.0%) | 0 (0.0%) |
| $5,000 to $9,999 | 0 (0.0%) | 0 (0.0%) |
| $10,000 to $14,999 | 0 (0.0%) | 0 (0.0%) |
| $15,000 to $19,999 | 0 (0.0%) | 0 (0.0%) |
| $20,000 to $24,999 | 0 (0.0%) | 0 (0.0%) |
| $25,000 to $34,999 | 0 (0.0%) | 8 (61.5%) |
| $35,000 to $49,999 | 0 (0.0%) | 5 (38.5%) |
| $50,000 to $74,999 | 16 (17.4%) | 0 (0.0%) |
| $75,000 to $99,999 | 0 (0.0%) | 0 (0.0%) |
| $100,000 to $149,999 | 26 (28.3%) | 0 (0.0%) |
| $150,000 or more | 50 (54.3%) | 0 (0.0%) |
| Total | 92 (100.0%) | 13 (100.0%) |
Monthly Housing Cost Tiers in Butteville
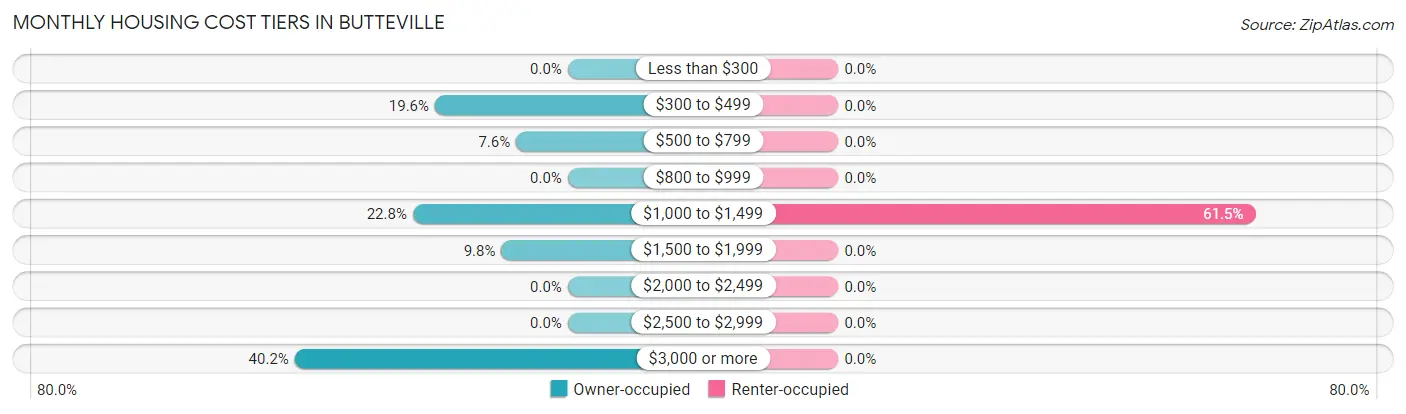
| Monthly Cost | Owner-occupied | Renter-occupied |
| Less than $300 | 0 (0.0%) | 0 (0.0%) |
| $300 to $499 | 18 (19.6%) | 0 (0.0%) |
| $500 to $799 | 7 (7.6%) | 0 (0.0%) |
| $800 to $999 | 0 (0.0%) | 0 (0.0%) |
| $1,000 to $1,499 | 21 (22.8%) | 8 (61.5%) |
| $1,500 to $1,999 | 9 (9.8%) | 0 (0.0%) |
| $2,000 to $2,499 | 0 (0.0%) | 0 (0.0%) |
| $2,500 to $2,999 | 0 (0.0%) | 0 (0.0%) |
| $3,000 or more | 37 (40.2%) | 0 (0.0%) |
| Total | 92 (100.0%) | 13 (100.0%) |
Physical Housing Characteristics in Butteville
Housing Structures in Butteville
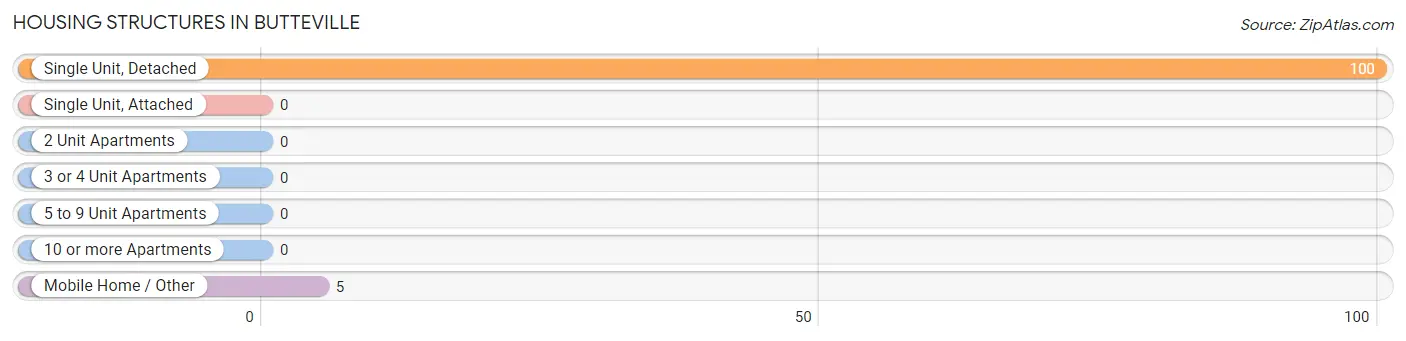
| Structure Type | # Housing Units | % Housing Units |
| Single Unit, Detached | 100 | 95.2% |
| Single Unit, Attached | 0 | 0.0% |
| 2 Unit Apartments | 0 | 0.0% |
| 3 or 4 Unit Apartments | 0 | 0.0% |
| 5 to 9 Unit Apartments | 0 | 0.0% |
| 10 or more Apartments | 0 | 0.0% |
| Mobile Home / Other | 5 | 4.8% |
| Total | 105 | 100.0% |
Housing Structures by Occupancy in Butteville
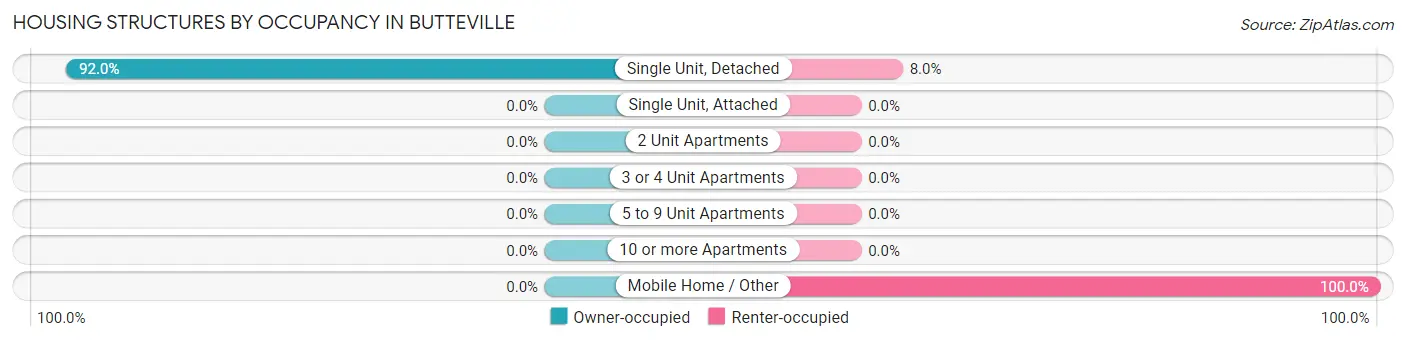
| Structure Type | Owner-occupied | Renter-occupied |
| Single Unit, Detached | 92 (92.0%) | 8 (8.0%) |
| Single Unit, Attached | 0 (0.0%) | 0 (0.0%) |
| 2 Unit Apartments | 0 (0.0%) | 0 (0.0%) |
| 3 or 4 Unit Apartments | 0 (0.0%) | 0 (0.0%) |
| 5 to 9 Unit Apartments | 0 (0.0%) | 0 (0.0%) |
| 10 or more Apartments | 0 (0.0%) | 0 (0.0%) |
| Mobile Home / Other | 0 (0.0%) | 5 (100.0%) |
| Total | 92 (87.6%) | 13 (12.4%) |
Housing Structures by Number of Rooms in Butteville
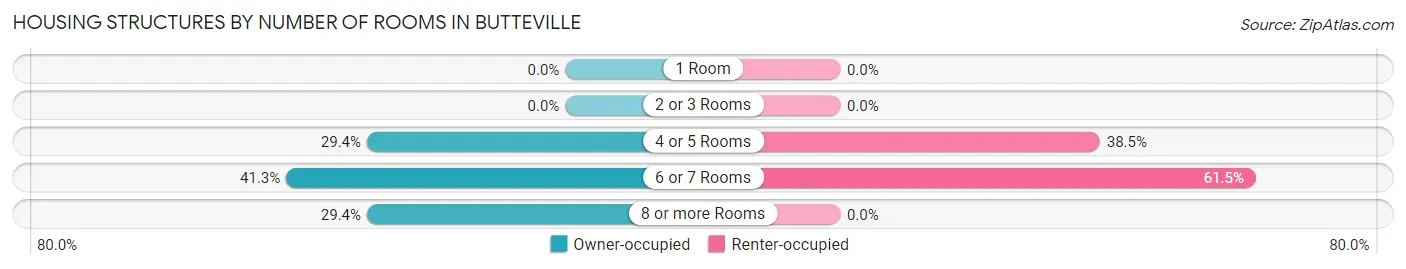
| Number of Rooms | Owner-occupied | Renter-occupied |
| 1 Room | 0 (0.0%) | 0 (0.0%) |
| 2 or 3 Rooms | 0 (0.0%) | 0 (0.0%) |
| 4 or 5 Rooms | 27 (29.3%) | 5 (38.5%) |
| 6 or 7 Rooms | 38 (41.3%) | 8 (61.5%) |
| 8 or more Rooms | 27 (29.3%) | 0 (0.0%) |
| Total | 92 (100.0%) | 13 (100.0%) |
Housing Structure by Heating Type in Butteville
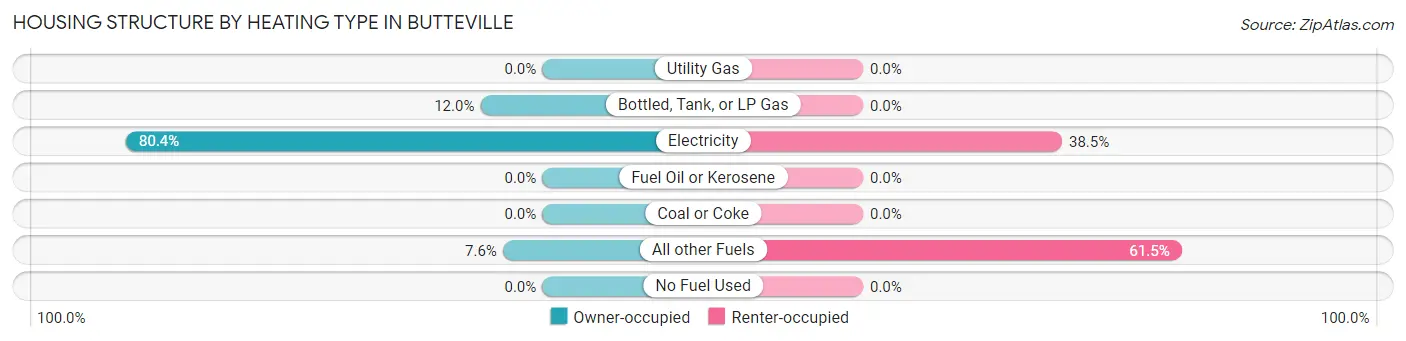
| Heating Type | Owner-occupied | Renter-occupied |
| Utility Gas | 0 (0.0%) | 0 (0.0%) |
| Bottled, Tank, or LP Gas | 11 (12.0%) | 0 (0.0%) |
| Electricity | 74 (80.4%) | 5 (38.5%) |
| Fuel Oil or Kerosene | 0 (0.0%) | 0 (0.0%) |
| Coal or Coke | 0 (0.0%) | 0 (0.0%) |
| All other Fuels | 7 (7.6%) | 8 (61.5%) |
| No Fuel Used | 0 (0.0%) | 0 (0.0%) |
| Total | 92 (100.0%) | 13 (100.0%) |
Household Vehicle Usage in Butteville
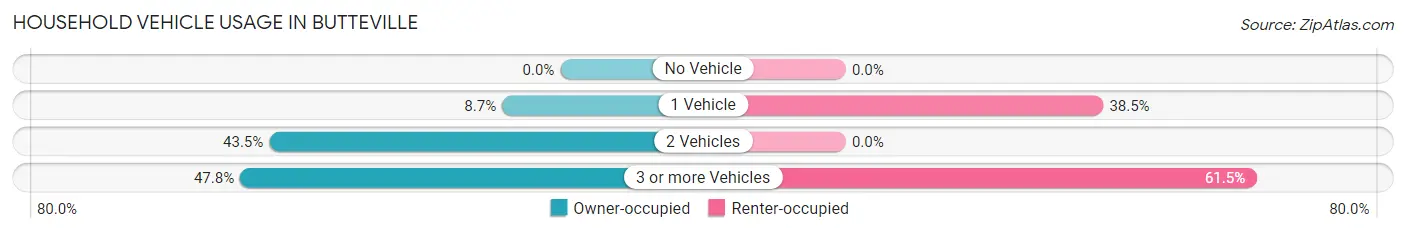
| Vehicles per Household | Owner-occupied | Renter-occupied |
| No Vehicle | 0 (0.0%) | 0 (0.0%) |
| 1 Vehicle | 8 (8.7%) | 5 (38.5%) |
| 2 Vehicles | 40 (43.5%) | 0 (0.0%) |
| 3 or more Vehicles | 44 (47.8%) | 8 (61.5%) |
| Total | 92 (100.0%) | 13 (100.0%) |
Real Estate & Mortgages in Butteville
Real Estate and Mortgage Overview in Butteville
| Characteristic | Without Mortgage | With Mortgage |
| Housing Units | 40 | 52 |
| Median Property Value | $700,000 | $802,100 |
| Median Household Income | - | - |
| Monthly Housing Costs | $629 | $37 |
| Real Estate Taxes | $4,286 | $0 |
Property Value by Mortgage Status in Butteville
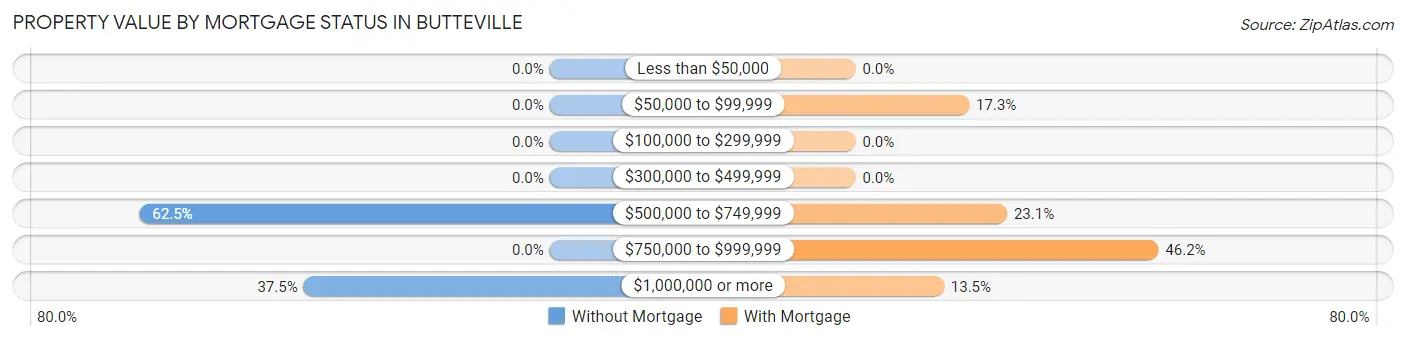
| Property Value | Without Mortgage | With Mortgage |
| Less than $50,000 | 0 (0.0%) | 0 (0.0%) |
| $50,000 to $99,999 | 0 (0.0%) | 9 (17.3%) |
| $100,000 to $299,999 | 0 (0.0%) | 0 (0.0%) |
| $300,000 to $499,999 | 0 (0.0%) | 0 (0.0%) |
| $500,000 to $749,999 | 25 (62.5%) | 12 (23.1%) |
| $750,000 to $999,999 | 0 (0.0%) | 24 (46.2%) |
| $1,000,000 or more | 15 (37.5%) | 7 (13.5%) |
| Total | 40 (100.0%) | 52 (100.0%) |
Household Income by Mortgage Status in Butteville
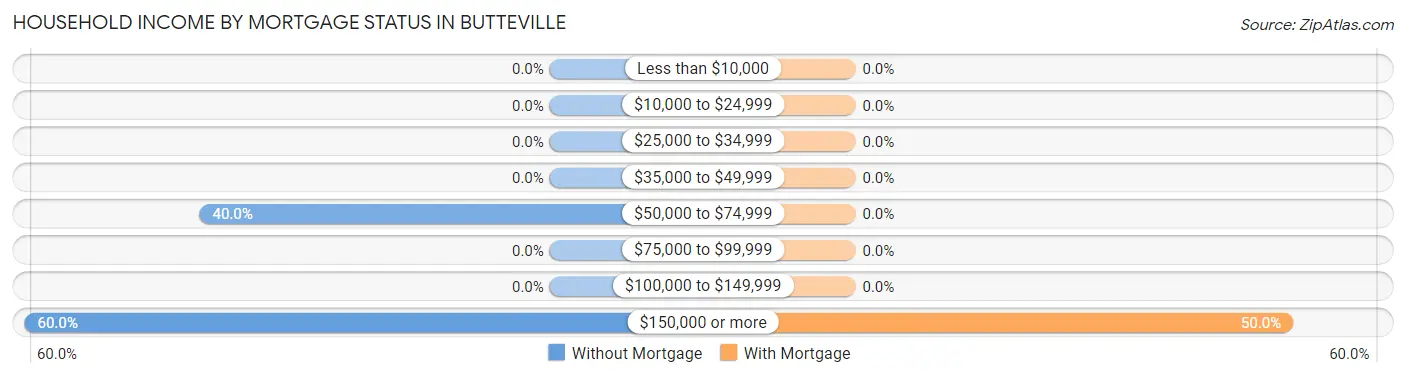
| Household Income | Without Mortgage | With Mortgage |
| Less than $10,000 | 0 (0.0%) | 0 (0.0%) |
| $10,000 to $24,999 | 0 (0.0%) | 0 (0.0%) |
| $25,000 to $34,999 | 0 (0.0%) | 0 (0.0%) |
| $35,000 to $49,999 | 0 (0.0%) | 0 (0.0%) |
| $50,000 to $74,999 | 16 (40.0%) | 0 (0.0%) |
| $75,000 to $99,999 | 0 (0.0%) | 0 (0.0%) |
| $100,000 to $149,999 | 0 (0.0%) | 0 (0.0%) |
| $150,000 or more | 24 (60.0%) | 26 (50.0%) |
| Total | 40 (100.0%) | 52 (100.0%) |
Property Value to Household Income Ratio in Butteville
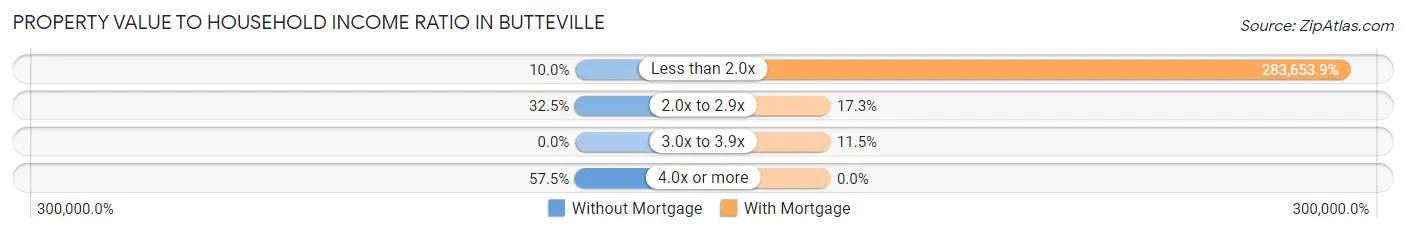
| Value-to-Income Ratio | Without Mortgage | With Mortgage |
| Less than 2.0x | 4 (10.0%) | 147,500 (283,653.9%) |
| 2.0x to 2.9x | 13 (32.5%) | 9 (17.3%) |
| 3.0x to 3.9x | 0 (0.0%) | 6 (11.5%) |
| 4.0x or more | 23 (57.5%) | 0 (0.0%) |
| Total | 40 (100.0%) | 52 (100.0%) |
Real Estate Taxes by Mortgage Status in Butteville
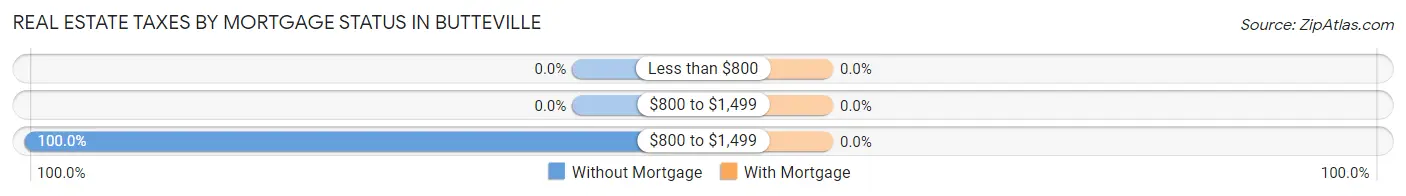
| Property Taxes | Without Mortgage | With Mortgage |
| Less than $800 | 0 (0.0%) | 0 (0.0%) |
| $800 to $1,499 | 0 (0.0%) | 0 (0.0%) |
| $800 to $1,499 | 40 (100.0%) | 0 (0.0%) |
| Total | 40 (100.0%) | 52 (100.0%) |
Health & Disability in Butteville
Health Insurance Coverage by Age in Butteville
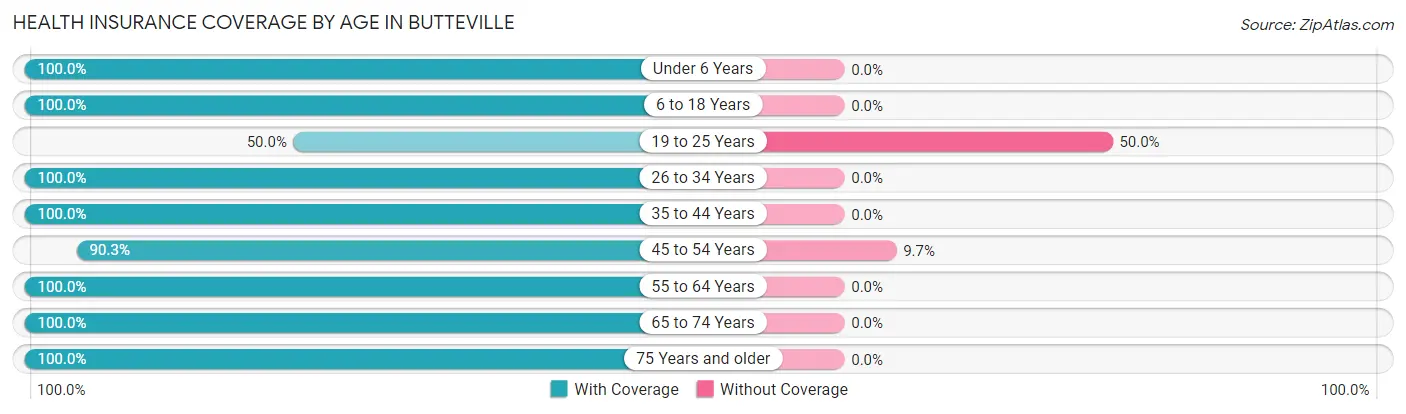
| Age Bracket | With Coverage | Without Coverage |
| Under 6 Years | 11 (100.0%) | 0 (0.0%) |
| 6 to 18 Years | 31 (100.0%) | 0 (0.0%) |
| 19 to 25 Years | 5 (50.0%) | 5 (50.0%) |
| 26 to 34 Years | 13 (100.0%) | 0 (0.0%) |
| 35 to 44 Years | 9 (100.0%) | 0 (0.0%) |
| 45 to 54 Years | 56 (90.3%) | 6 (9.7%) |
| 55 to 64 Years | 66 (100.0%) | 0 (0.0%) |
| 65 to 74 Years | 53 (100.0%) | 0 (0.0%) |
| 75 Years and older | 30 (100.0%) | 0 (0.0%) |
| Total | 274 (96.1%) | 11 (3.9%) |
Health Insurance Coverage by Citizenship Status in Butteville
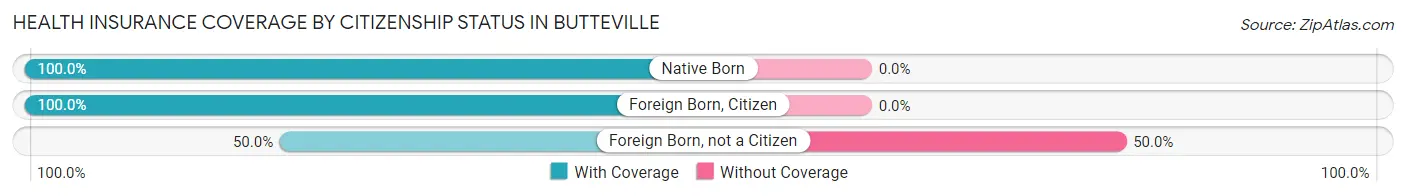
| Citizenship Status | With Coverage | Without Coverage |
| Native Born | 11 (100.0%) | 0 (0.0%) |
| Foreign Born, Citizen | 31 (100.0%) | 0 (0.0%) |
| Foreign Born, not a Citizen | 5 (50.0%) | 5 (50.0%) |
Health Insurance Coverage by Household Income in Butteville
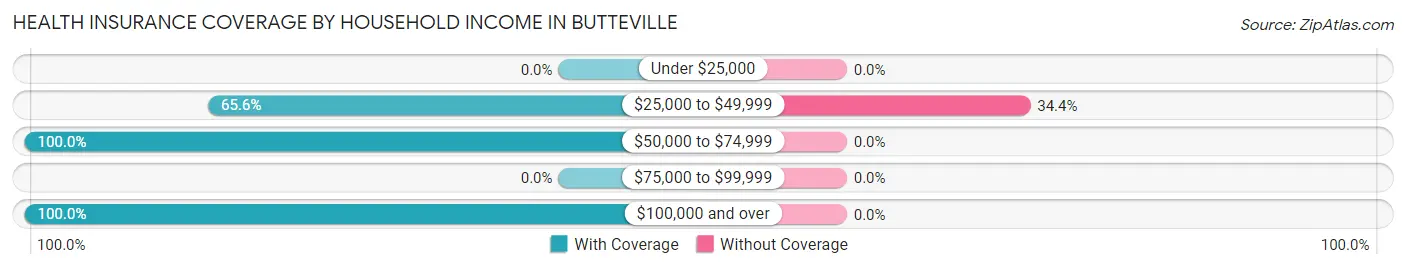
| Household Income | With Coverage | Without Coverage |
| Under $25,000 | 0 (0.0%) | 0 (0.0%) |
| $25,000 to $49,999 | 21 (65.6%) | 11 (34.4%) |
| $50,000 to $74,999 | 30 (100.0%) | 0 (0.0%) |
| $75,000 to $99,999 | 0 (0.0%) | 0 (0.0%) |
| $100,000 and over | 223 (100.0%) | 0 (0.0%) |
Public vs Private Health Insurance Coverage by Age in Butteville
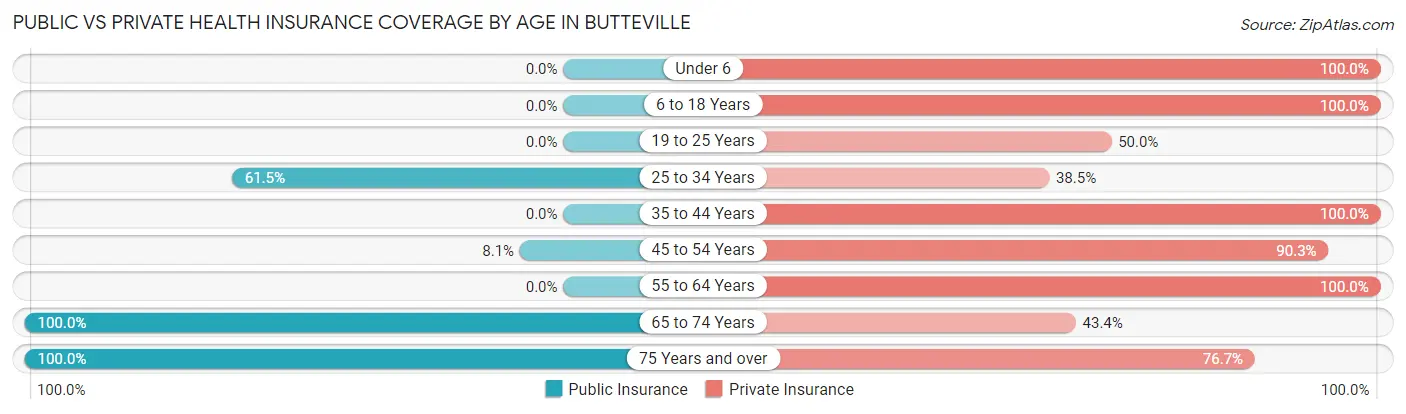
| Age Bracket | Public Insurance | Private Insurance |
| Under 6 | 0 (0.0%) | 11 (100.0%) |
| 6 to 18 Years | 0 (0.0%) | 31 (100.0%) |
| 19 to 25 Years | 0 (0.0%) | 5 (50.0%) |
| 25 to 34 Years | 8 (61.5%) | 5 (38.5%) |
| 35 to 44 Years | 0 (0.0%) | 9 (100.0%) |
| 45 to 54 Years | 5 (8.1%) | 56 (90.3%) |
| 55 to 64 Years | 0 (0.0%) | 66 (100.0%) |
| 65 to 74 Years | 53 (100.0%) | 23 (43.4%) |
| 75 Years and over | 30 (100.0%) | 23 (76.7%) |
| Total | 96 (33.7%) | 229 (80.3%) |
Disability Status by Sex by Age in Butteville
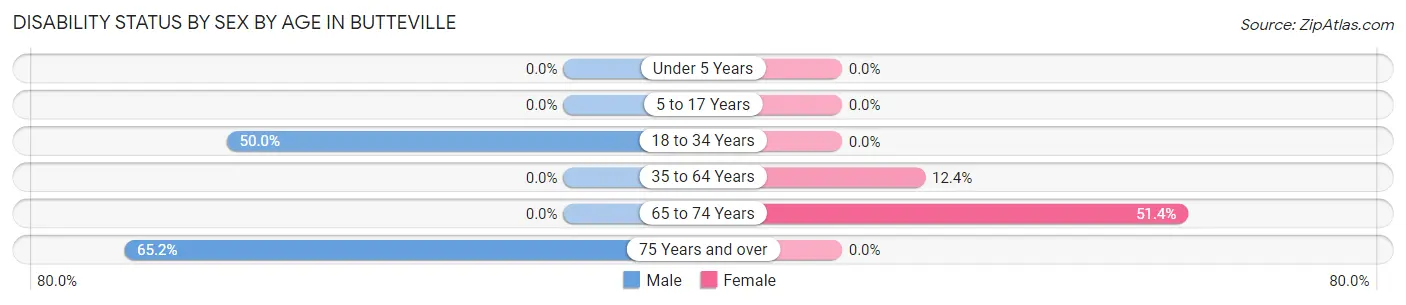
| Age Bracket | Male | Female |
| Under 5 Years | 0 (0.0%) | 0 (0.0%) |
| 5 to 17 Years | 0 (0.0%) | 0 (0.0%) |
| 18 to 34 Years | 5 (50.0%) | 0 (0.0%) |
| 35 to 64 Years | 0 (0.0%) | 11 (12.4%) |
| 65 to 74 Years | 0 (0.0%) | 18 (51.4%) |
| 75 Years and over | 15 (65.2%) | 0 (0.0%) |
Disability Class by Sex by Age in Butteville
Disability Class: Hearing Difficulty
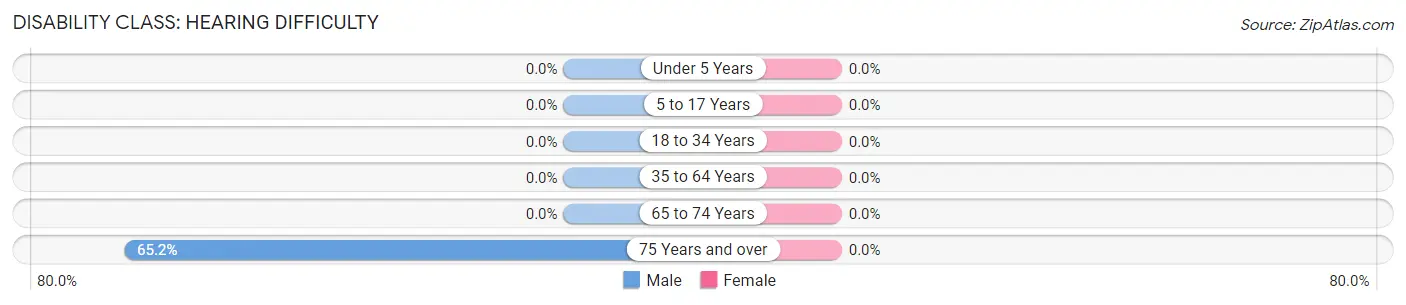
| Age Bracket | Male | Female |
| Under 5 Years | 0 (0.0%) | 0 (0.0%) |
| 5 to 17 Years | 0 (0.0%) | 0 (0.0%) |
| 18 to 34 Years | 0 (0.0%) | 0 (0.0%) |
| 35 to 64 Years | 0 (0.0%) | 0 (0.0%) |
| 65 to 74 Years | 0 (0.0%) | 0 (0.0%) |
| 75 Years and over | 15 (65.2%) | 0 (0.0%) |
Disability Class: Vision Difficulty
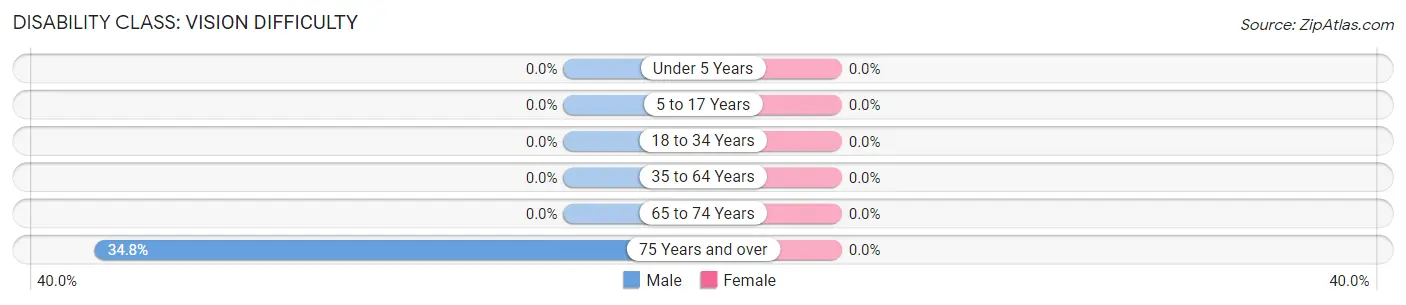
| Age Bracket | Male | Female |
| Under 5 Years | 0 (0.0%) | 0 (0.0%) |
| 5 to 17 Years | 0 (0.0%) | 0 (0.0%) |
| 18 to 34 Years | 0 (0.0%) | 0 (0.0%) |
| 35 to 64 Years | 0 (0.0%) | 0 (0.0%) |
| 65 to 74 Years | 0 (0.0%) | 0 (0.0%) |
| 75 Years and over | 8 (34.8%) | 0 (0.0%) |
Disability Class: Cognitive Difficulty
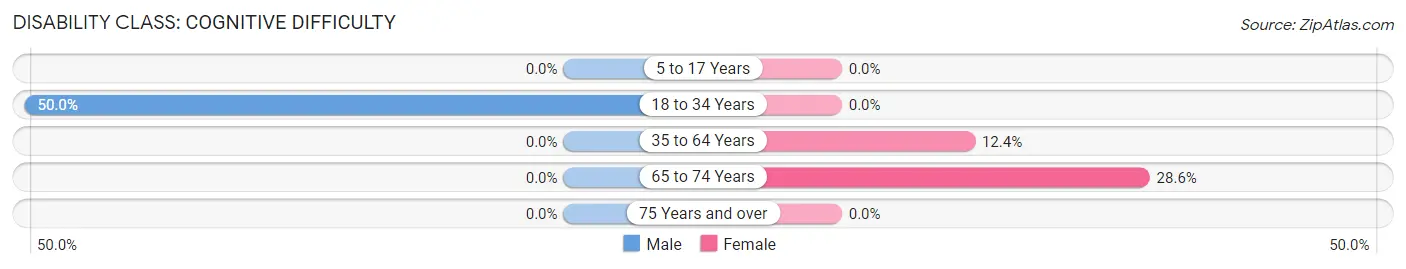
| Age Bracket | Male | Female |
| 5 to 17 Years | 0 (0.0%) | 0 (0.0%) |
| 18 to 34 Years | 5 (50.0%) | 0 (0.0%) |
| 35 to 64 Years | 0 (0.0%) | 11 (12.4%) |
| 65 to 74 Years | 0 (0.0%) | 10 (28.6%) |
| 75 Years and over | 0 (0.0%) | 0 (0.0%) |
Disability Class: Ambulatory Difficulty

| Age Bracket | Male | Female |
| 5 to 17 Years | 0 (0.0%) | 0 (0.0%) |
| 18 to 34 Years | 0 (0.0%) | 0 (0.0%) |
| 35 to 64 Years | 0 (0.0%) | 0 (0.0%) |
| 65 to 74 Years | 0 (0.0%) | 0 (0.0%) |
| 75 Years and over | 8 (34.8%) | 0 (0.0%) |
Disability Class: Self-Care Difficulty
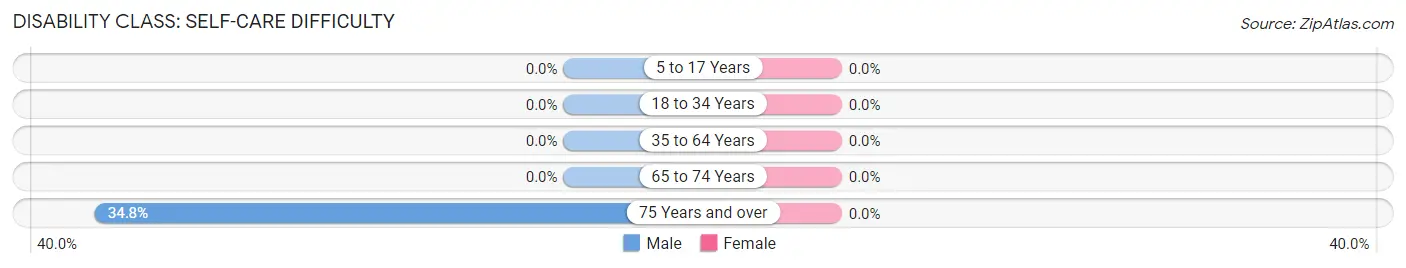
| Age Bracket | Male | Female |
| 5 to 17 Years | 0 (0.0%) | 0 (0.0%) |
| 18 to 34 Years | 0 (0.0%) | 0 (0.0%) |
| 35 to 64 Years | 0 (0.0%) | 0 (0.0%) |
| 65 to 74 Years | 0 (0.0%) | 0 (0.0%) |
| 75 Years and over | 8 (34.8%) | 0 (0.0%) |
Technology Access in Butteville
Computing Device Access in Butteville
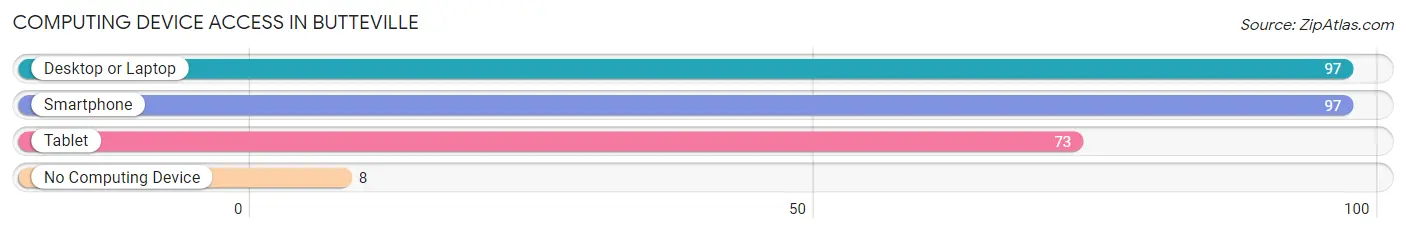
| Device Type | # Households | % Households |
| Desktop or Laptop | 97 | 92.4% |
| Smartphone | 97 | 92.4% |
| Tablet | 73 | 69.5% |
| No Computing Device | 8 | 7.6% |
| Total | 105 | 100.0% |
Internet Access in Butteville
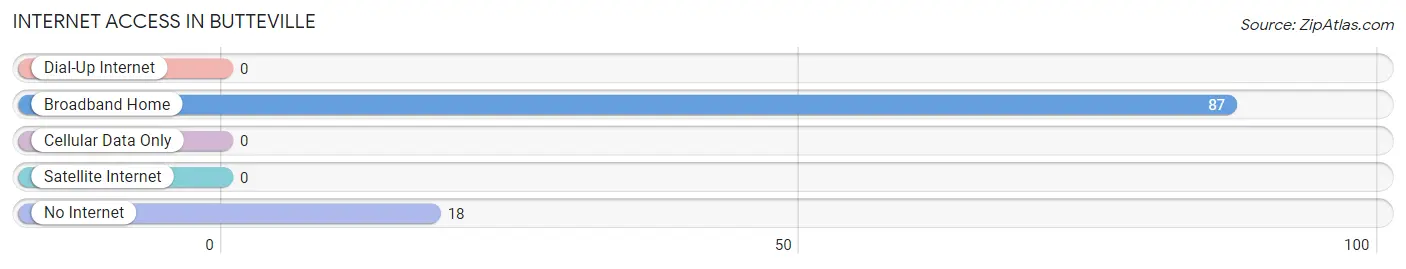
| Internet Type | # Households | % Households |
| Dial-Up Internet | 0 | 0.0% |
| Broadband Home | 87 | 82.9% |
| Cellular Data Only | 0 | 0.0% |
| Satellite Internet | 0 | 0.0% |
| No Internet | 18 | 17.1% |
| Total | 105 | 100.0% |
Butteville Summary
Butteville is a small unincorporated community located in Marion County, Oregon, United States. It is situated on the banks of the Willamette River, approximately 10 miles south of Salem, the state capital. The population of Butteville was estimated to be around 200 in 2020.
History
Butteville was founded in 1845 by a group of settlers led by William H. Willson. The settlers were drawn to the area by the abundance of natural resources, including timber, fish, and game. The town was named after the nearby Butte Creek, which was named for its resemblance to a butte.
The town quickly grew and by 1851, it had a population of over 500. The town was home to a variety of businesses, including a sawmill, a gristmill, a blacksmith shop, and a general store.
In 1853, Butteville was incorporated as a city. The city was home to a variety of churches, including the Methodist Episcopal Church, the Congregational Church, and the Presbyterian Church.
In 1856, the Oregon and California Railroad was built through Butteville, connecting the town to the rest of the state. This allowed for increased trade and commerce, and the town continued to grow.
In 1867, Butteville was the site of the first Oregon State Fair. The fair was held annually until 1877, when it moved to Salem.
In 1871 the Butteville post office was established
Geography
Butteville is located in the Willamette Valley, approximately 10 miles south of Salem. The town is situated on the banks of the Willamette River, and is surrounded by rolling hills and farmland.
The climate in Butteville is mild and temperate, with warm summers and cool winters. The average annual temperature is around 50 degrees Fahrenheit.
Economy
Butteville’s economy is largely based on agriculture and tourism. The town is home to several farms, which produce a variety of crops, including wheat, corn, and hay.
The town is also home to several wineries, which produce a variety of wines. The town is also home to several restaurants, which serve a variety of local and regional dishes.
Tourism is also an important part of the local economy. The town is home to several historic sites, including the Butteville Store, the Butteville Church, and the Butteville Cemetery. The town is also home to several parks, including Butteville Park and Butteville Wildlife Refuge.
Demographics
As of the 2010 census, the population of Butteville was estimated to be around 200. The racial makeup of the town was 97.5% White, 0.5% Native American, 0.5% Asian, and 1.5% from other races.
The median household income in Butteville was $45,000, and the median family income was $50,000. The per capita income in Butteville was $20,000.
Conclusion
Butteville is a small unincorporated community located in Marion County, Oregon. It is situated on the banks of the Willamette River, approximately 10 miles south of Salem. The town was founded in 1845 by a group of settlers, and quickly grew due to its abundance of natural resources. The town is home to a variety of businesses, including farms, wineries, and restaurants. The town’s economy is largely based on agriculture and tourism. The population of Butteville was estimated to be around 200 in 2020.
Common Questions
What is Per Capita Income in Butteville?
Per Capita income in Butteville is $70,320.
What is the Median Family Income in Butteville?
Median Family Income in Butteville is $114,375.
What is the Median Household income in Butteville?
Median Household Income in Butteville is $144,306.
What is Inequality or Gini Index in Butteville?
Inequality or Gini Index in Butteville is 0.46.
What is the Total Population of Butteville?
Total Population of Butteville is 285.
What is the Total Male Population of Butteville?
Total Male Population of Butteville is 121.
What is the Total Female Population of Butteville?
Total Female Population of Butteville is 164.
What is the Ratio of Males per 100 Females in Butteville?
There are 73.78 Males per 100 Females in Butteville.
What is the Ratio of Females per 100 Males in Butteville?
There are 135.54 Females per 100 Males in Butteville.
What is the Median Population Age in Butteville?
Median Population Age in Butteville is 56.5 Years.
What is the Average Family Size in Butteville
Average Family Size in Butteville is 2.9 People.
What is the Average Household Size in Butteville
Average Household Size in Butteville is 2.7 People.
How Large is the Labor Force in Butteville?
There are 107 People in the Labor Forcein in Butteville.
What is the Percentage of People in the Labor Force in Butteville?
44.0% of People are in the Labor Force in Butteville.