Sheridan, OR Map & Demographics
Sheridan Map
Sheridan Overview
$31,053
PER CAPITA INCOME
$74,887
AVG FAMILY INCOME
$56,989
AVG HOUSEHOLD INCOME
39.6%
WAGE / INCOME GAP [ % ]
60.4¢/ $1
WAGE / INCOME GAP [ $ ]
0.45
INEQUALITY / GINI INDEX
6,237
TOTAL POPULATION
3,086
MALE POPULATION
3,151
FEMALE POPULATION
97.94
MALES / 100 FEMALES
102.11
FEMALES / 100 MALES
38.9
MEDIAN AGE
3.2
AVG FAMILY SIZE
2.5
AVG HOUSEHOLD SIZE
3,102
LABOR FORCE [ PEOPLE ]
58.4%
PERCENT IN LABOR FORCE
6.8%
UNEMPLOYMENT RATE
Sheridan Zip Codes
Income in Sheridan
Income Overview in Sheridan
Per Capita Income in Sheridan is $31,053, while median incomes of families and households are $74,887 and $56,989 respectively.
| Characteristic | Number | Measure |
| Per Capita Income | 6,237 | $31,053 |
| Median Family Income | 1,500 | $74,887 |
| Mean Family Income | 1,500 | $93,332 |
| Median Household Income | 2,429 | $56,989 |
| Mean Household Income | 2,429 | $76,492 |
| Income Deficit | 1,500 | $0 |
| Wage / Income Gap (%) | 6,237 | 39.64% |
| Wage / Income Gap ($) | 6,237 | 60.36¢ per $1 |
| Gini / Inequality Index | 6,237 | 0.45 |
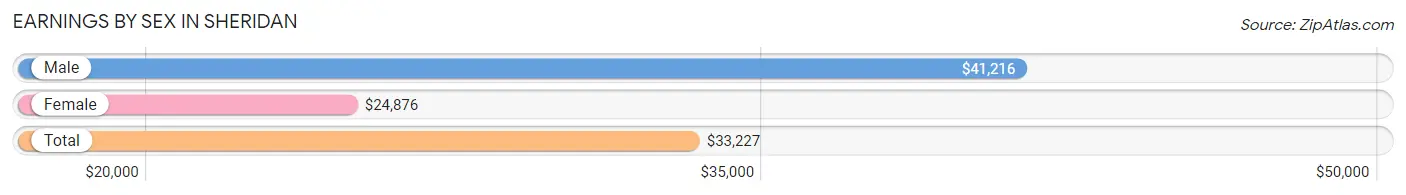
Earnings by Sex in Sheridan
Average Earnings in Sheridan are $33,227, $41,216 for men and $24,876 for women, a difference of 39.6%.
| Sex | Number | Average Earnings |
| Male | 1,642 (48.5%) | $41,216 |
| Female | 1,740 (51.4%) | $24,876 |
| Total | 3,382 (100.0%) | $33,227 |
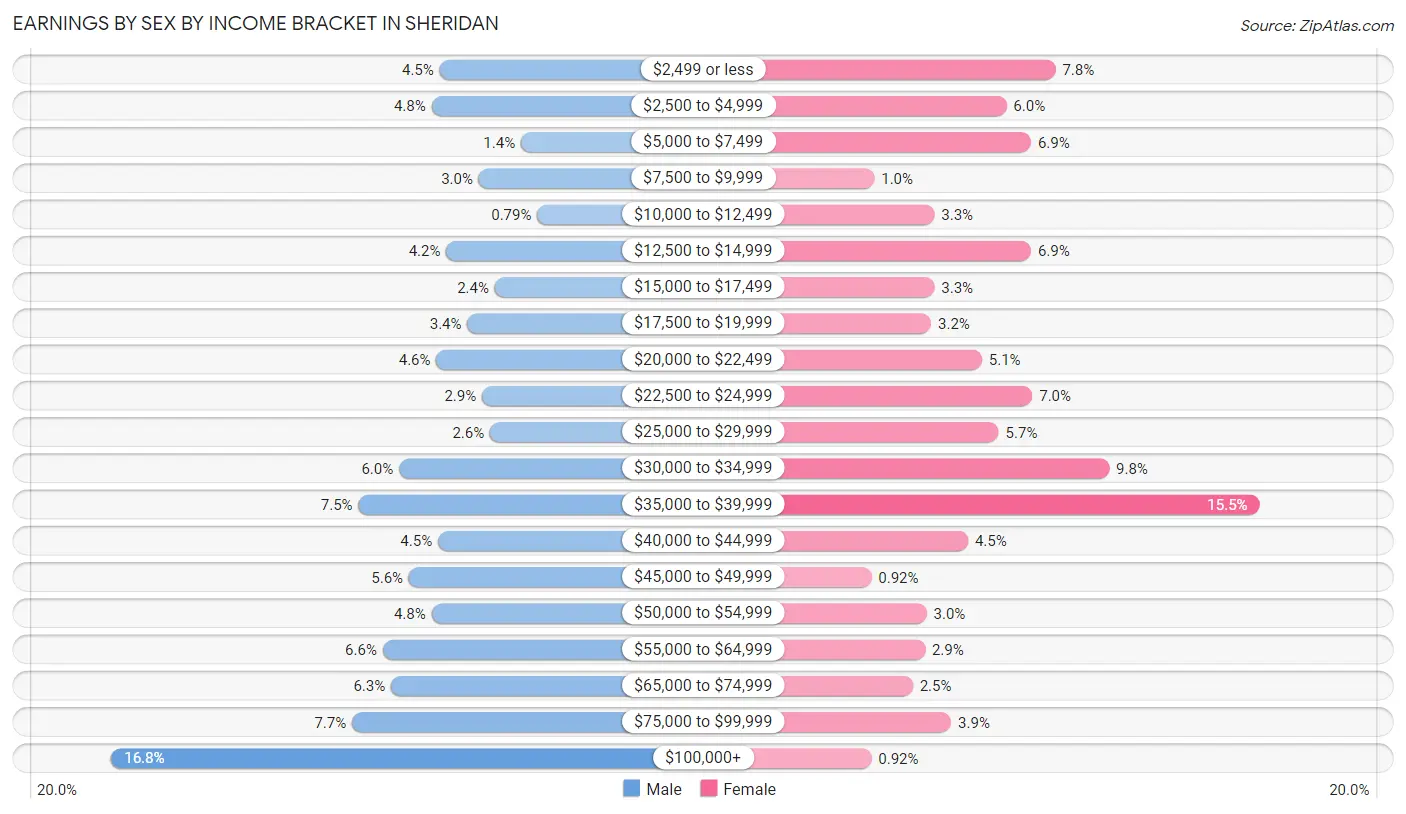
Earnings by Sex by Income Bracket in Sheridan
The most common earnings brackets in Sheridan are $100,000+ for men (275 | 16.8%) and $35,000 to $39,999 for women (269 | 15.5%).
| Income | Male | Female |
| $2,499 or less | 73 (4.4%) | 136 (7.8%) |
| $2,500 to $4,999 | 78 (4.8%) | 104 (6.0%) |
| $5,000 to $7,499 | 23 (1.4%) | 120 (6.9%) |
| $7,500 to $9,999 | 49 (3.0%) | 18 (1.0%) |
| $10,000 to $12,499 | 13 (0.8%) | 57 (3.3%) |
| $12,500 to $14,999 | 69 (4.2%) | 120 (6.9%) |
| $15,000 to $17,499 | 39 (2.4%) | 57 (3.3%) |
| $17,500 to $19,999 | 56 (3.4%) | 55 (3.2%) |
| $20,000 to $22,499 | 75 (4.6%) | 88 (5.1%) |
| $22,500 to $24,999 | 47 (2.9%) | 121 (7.0%) |
| $25,000 to $29,999 | 42 (2.6%) | 99 (5.7%) |
| $30,000 to $34,999 | 98 (6.0%) | 171 (9.8%) |
| $35,000 to $39,999 | 123 (7.5%) | 269 (15.5%) |
| $40,000 to $44,999 | 74 (4.5%) | 79 (4.5%) |
| $45,000 to $49,999 | 92 (5.6%) | 16 (0.9%) |
| $50,000 to $54,999 | 78 (4.8%) | 52 (3.0%) |
| $55,000 to $64,999 | 108 (6.6%) | 51 (2.9%) |
| $65,000 to $74,999 | 103 (6.3%) | 43 (2.5%) |
| $75,000 to $99,999 | 127 (7.7%) | 68 (3.9%) |
| $100,000+ | 275 (16.8%) | 16 (0.9%) |
| Total | 1,642 (100.0%) | 1,740 (100.0%) |
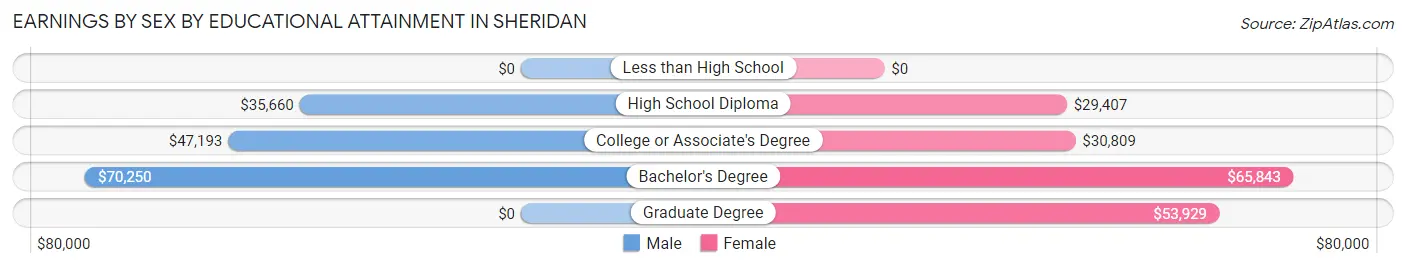
Earnings by Sex by Educational Attainment in Sheridan
Average earnings in Sheridan are $47,145 for men and $31,434 for women, a difference of 33.3%. Men with an educational attainment of bachelor's degree enjoy the highest average annual earnings of $70,250, while those with high school diploma education earn the least with $35,660. Women with an educational attainment of bachelor's degree earn the most with the average annual earnings of $65,843, while those with high school diploma education have the smallest earnings of $29,407.
| Educational Attainment | Male Income | Female Income |
| Less than High School | - | - |
| High School Diploma | $35,660 | $29,407 |
| College or Associate's Degree | $47,193 | $30,809 |
| Bachelor's Degree | $70,250 | $65,843 |
| Graduate Degree | - | - |
| Total | $47,145 | $31,434 |
Family Income in Sheridan
Family Income Brackets in Sheridan
According to the Sheridan family income data, there are 364 families falling into the $50,000 to $74,999 income range, which is the most common income bracket and makes up 24.3% of all families. Conversely, the $10,000 to $14,999 income bracket is the least frequent group with only 22 families (1.5%) belonging to this category.
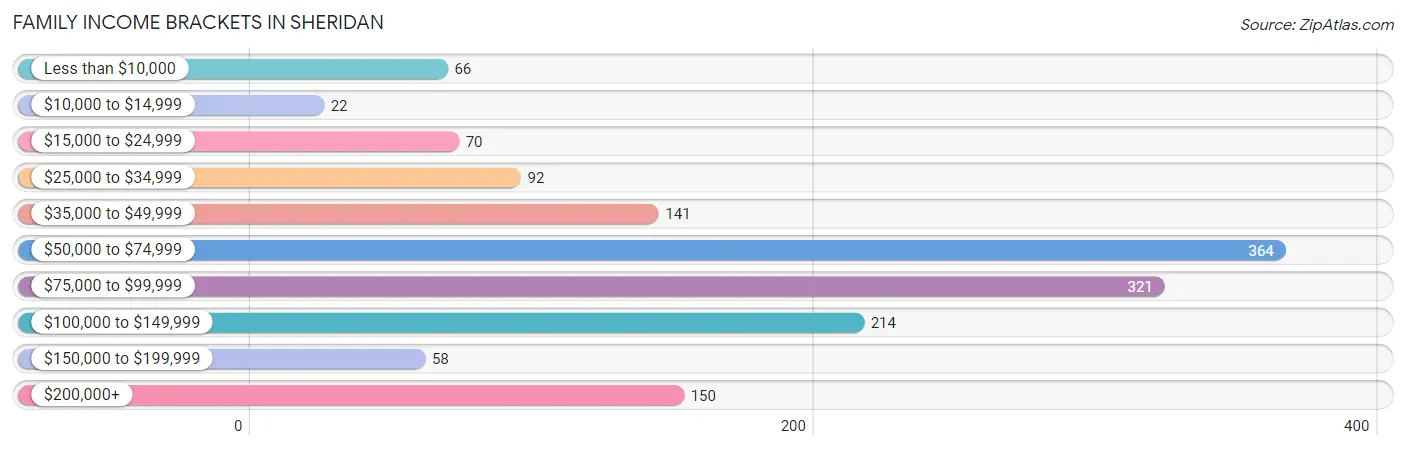
| Income Bracket | # Families | % Families |
| Less than $10,000 | 66 | 4.4% |
| $10,000 to $14,999 | 22 | 1.5% |
| $15,000 to $24,999 | 70 | 4.7% |
| $25,000 to $34,999 | 92 | 6.1% |
| $35,000 to $49,999 | 141 | 9.4% |
| $50,000 to $74,999 | 364 | 24.3% |
| $75,000 to $99,999 | 321 | 21.4% |
| $100,000 to $149,999 | 214 | 14.3% |
| $150,000 to $199,999 | 58 | 3.9% |
| $200,000+ | 150 | 10.0% |
Family Income by Famaliy Size in Sheridan
4-person families (257 | 17.1%) account for the highest median family income in Sheridan with $76,014 per family, while 2-person families (735 | 49.0%) have the highest median income of $36,323 per family member.
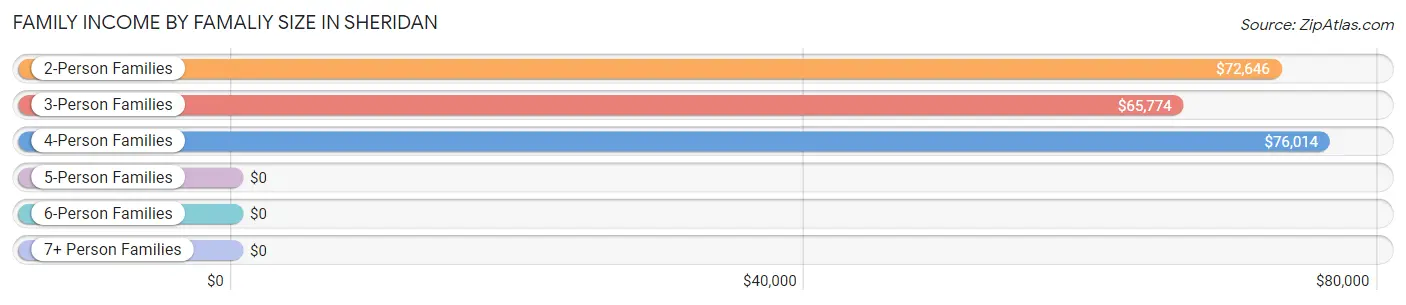
| Income Bracket | # Families | Median Income |
| 2-Person Families | 735 (49.0%) | $72,646 |
| 3-Person Families | 299 (19.9%) | $65,774 |
| 4-Person Families | 257 (17.1%) | $76,014 |
| 5-Person Families | 93 (6.2%) | $0 |
| 6-Person Families | 37 (2.5%) | $0 |
| 7+ Person Families | 79 (5.3%) | $0 |
| Total | 1,500 (100.0%) | $74,887 |
Family Income by Number of Earners in Sheridan
The median family income in Sheridan is $74,887, with families comprising 3+ earners (213) having the highest median family income of $107,813, while families with 1 earner (400) have the lowest median family income of $51,959, accounting for 14.2% and 26.7% of families, respectively.
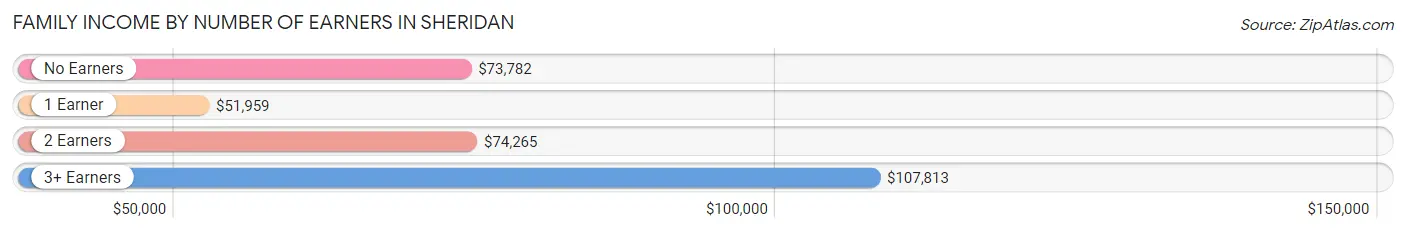
| Number of Earners | # Families | Median Income |
| No Earners | 257 (17.1%) | $73,782 |
| 1 Earner | 400 (26.7%) | $51,959 |
| 2 Earners | 630 (42.0%) | $74,265 |
| 3+ Earners | 213 (14.2%) | $107,813 |
| Total | 1,500 (100.0%) | $74,887 |
Household Income in Sheridan
Household Income Brackets in Sheridan
With 488 households falling in the category, the $50,000 to $74,999 income range is the most frequent in Sheridan, accounting for 20.1% of all households. In contrast, only 58 households (2.4%) fall into the $150,000 to $199,999 income bracket, making it the least populous group.
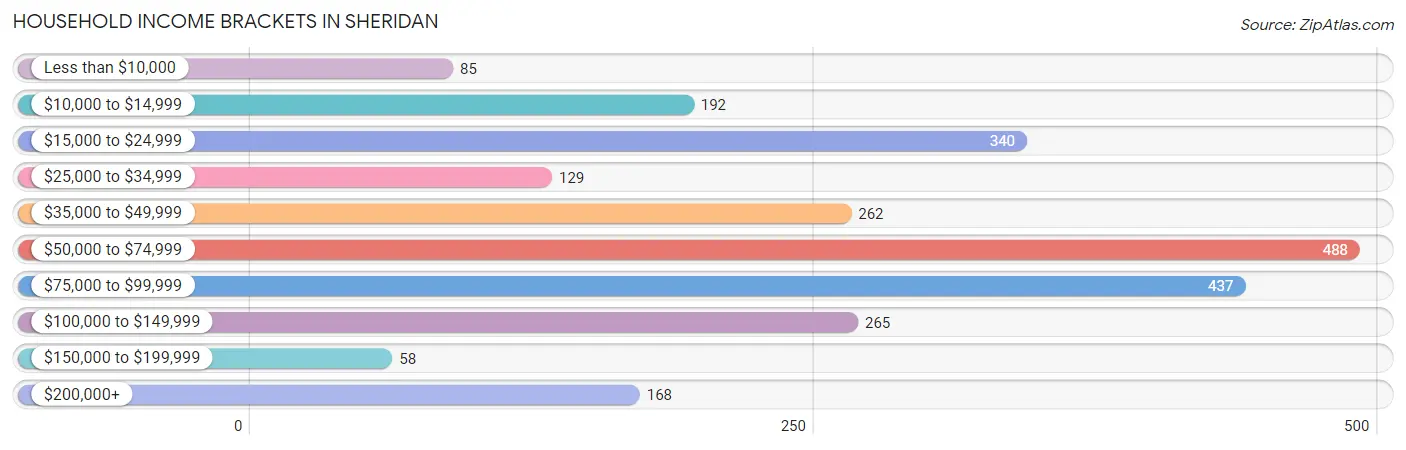
| Income Bracket | # Households | % Households |
| Less than $10,000 | 85 | 3.5% |
| $10,000 to $14,999 | 192 | 7.9% |
| $15,000 to $24,999 | 340 | 14.0% |
| $25,000 to $34,999 | 129 | 5.3% |
| $35,000 to $49,999 | 262 | 10.8% |
| $50,000 to $74,999 | 488 | 20.1% |
| $75,000 to $99,999 | 437 | 18.0% |
| $100,000 to $149,999 | 265 | 10.9% |
| $150,000 to $199,999 | 58 | 2.4% |
| $200,000+ | 168 | 6.9% |
Household Income by Householder Age in Sheridan
The median household income in Sheridan is $56,989, with the highest median household income of $76,627 found in the 25 to 44 years age bracket for the primary householder. A total of 821 households (33.8%) fall into this category. Meanwhile, the 65+ years age bracket for the primary householder has the lowest median household income of $48,958, with 762 households (31.4%) in this group.
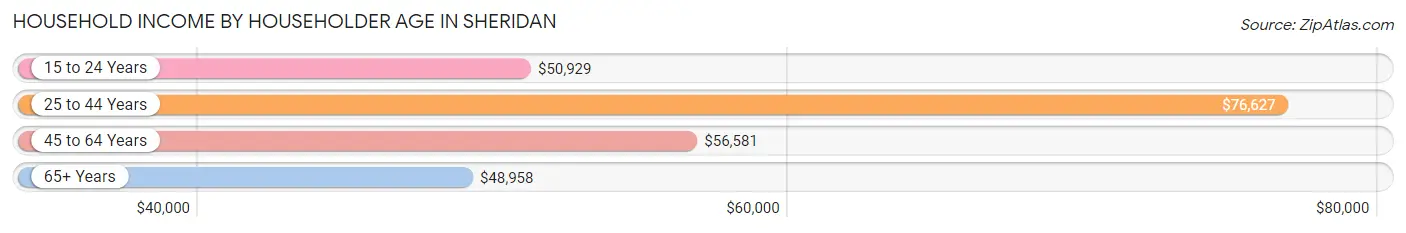
| Income Bracket | # Households | Median Income |
| 15 to 24 Years | 111 (4.6%) | $50,929 |
| 25 to 44 Years | 821 (33.8%) | $76,627 |
| 45 to 64 Years | 735 (30.3%) | $56,581 |
| 65+ Years | 762 (31.4%) | $48,958 |
| Total | 2,429 (100.0%) | $56,989 |
Poverty in Sheridan
Income Below Poverty by Sex and Age in Sheridan
With 9.9% poverty level for males and 14.9% for females among the residents of Sheridan, 45 to 54 year old males and 5 year old females are the most vulnerable to poverty, with 75 males (26.0%) and 43 females (100.0%) in their respective age groups living below the poverty level.
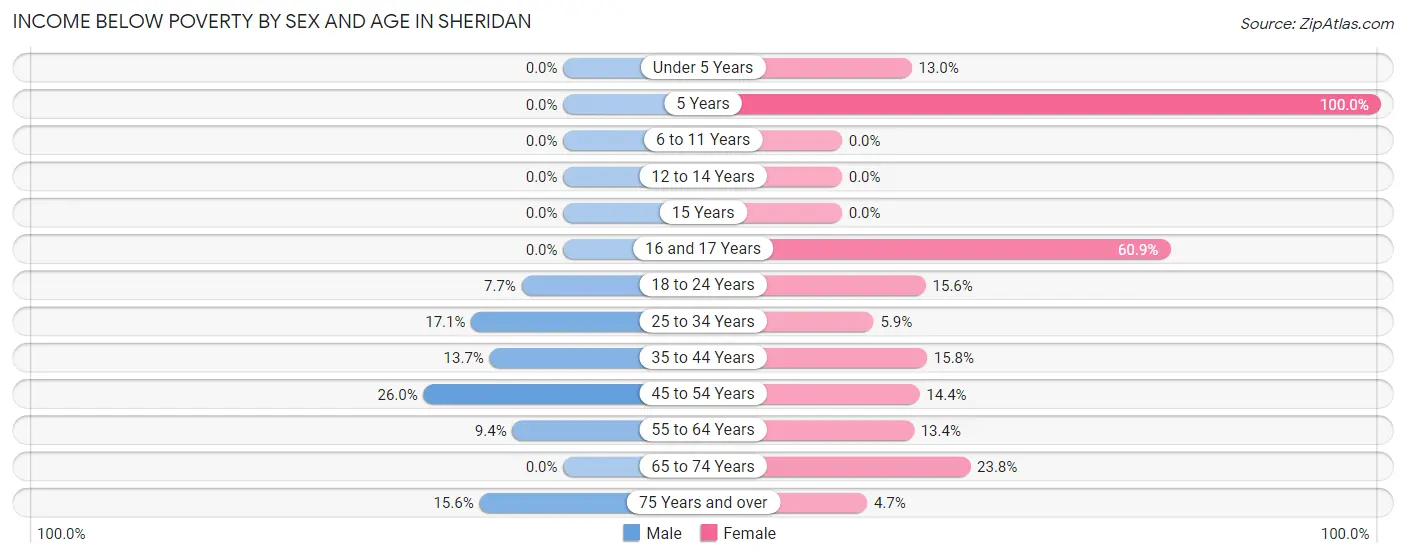
| Age Bracket | Male | Female |
| Under 5 Years | 0 (0.0%) | 14 (13.0%) |
| 5 Years | 0 (0.0%) | 43 (100.0%) |
| 6 to 11 Years | 0 (0.0%) | 0 (0.0%) |
| 12 to 14 Years | 0 (0.0%) | 0 (0.0%) |
| 15 Years | 0 (0.0%) | 0 (0.0%) |
| 16 and 17 Years | 0 (0.0%) | 39 (60.9%) |
| 18 to 24 Years | 23 (7.7%) | 70 (15.6%) |
| 25 to 34 Years | 81 (17.1%) | 31 (5.9%) |
| 35 to 44 Years | 52 (13.7%) | 54 (15.8%) |
| 45 to 54 Years | 75 (26.0%) | 33 (14.4%) |
| 55 to 64 Years | 47 (9.4%) | 57 (13.4%) |
| 65 to 74 Years | 0 (0.0%) | 111 (23.8%) |
| 75 Years and over | 26 (15.6%) | 14 (4.7%) |
| Total | 304 (9.9%) | 466 (14.9%) |
Income Above Poverty by Sex and Age in Sheridan
According to the poverty statistics in Sheridan, males aged under 5 years and females aged 6 to 11 years are the age groups that are most secure financially, with 100.0% of males and 100.0% of females in these age groups living above the poverty line.
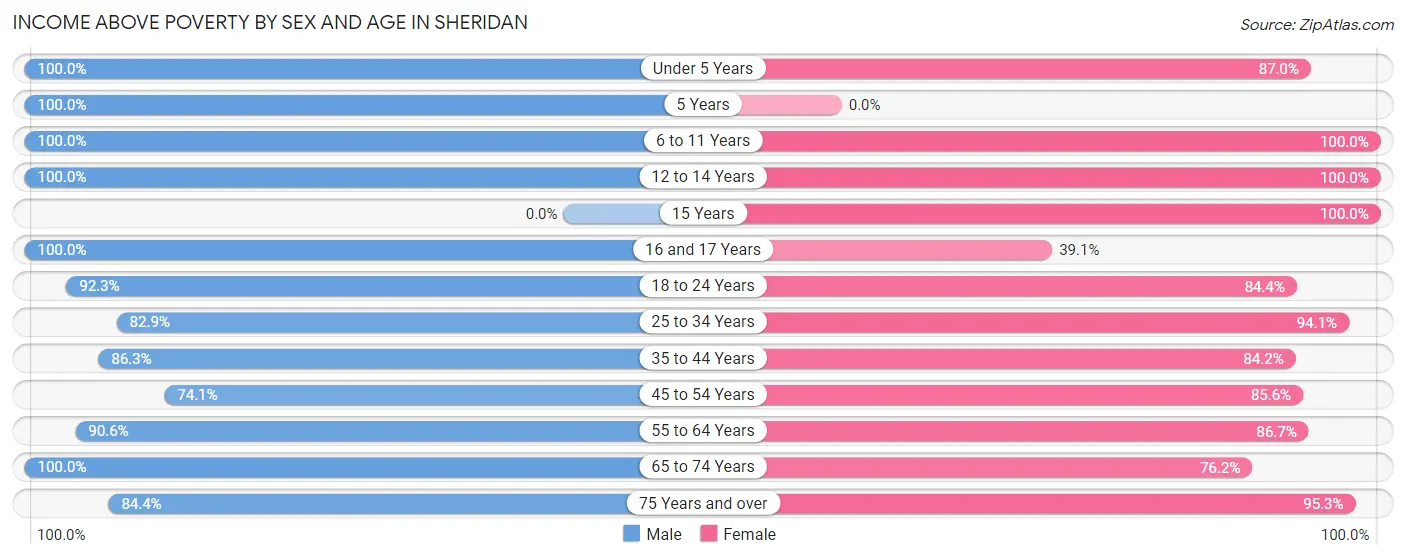
| Age Bracket | Male | Female |
| Under 5 Years | 184 (100.0%) | 94 (87.0%) |
| 5 Years | 102 (100.0%) | 0 (0.0%) |
| 6 to 11 Years | 181 (100.0%) | 123 (100.0%) |
| 12 to 14 Years | 127 (100.0%) | 18 (100.0%) |
| 15 Years | 0 (0.0%) | 39 (100.0%) |
| 16 and 17 Years | 128 (100.0%) | 25 (39.1%) |
| 18 to 24 Years | 274 (92.3%) | 380 (84.4%) |
| 25 to 34 Years | 393 (82.9%) | 496 (94.1%) |
| 35 to 44 Years | 328 (86.3%) | 288 (84.2%) |
| 45 to 54 Years | 214 (74.1%) | 196 (85.6%) |
| 55 to 64 Years | 451 (90.6%) | 370 (86.7%) |
| 65 to 74 Years | 235 (100.0%) | 355 (76.2%) |
| 75 Years and over | 141 (84.4%) | 285 (95.3%) |
| Total | 2,758 (90.1%) | 2,669 (85.1%) |
Income Below Poverty Among Married-Couple Families in Sheridan
The poverty statistics for married-couple families in Sheridan show that 6.3% or 66 of the total 1,053 families live below the poverty line. Families with 1 or 2 children have the highest poverty rate of 9.2%, comprising of 31 families. On the other hand, families with 3 or 4 children have the lowest poverty rate of 0.0%, which includes 0 families.
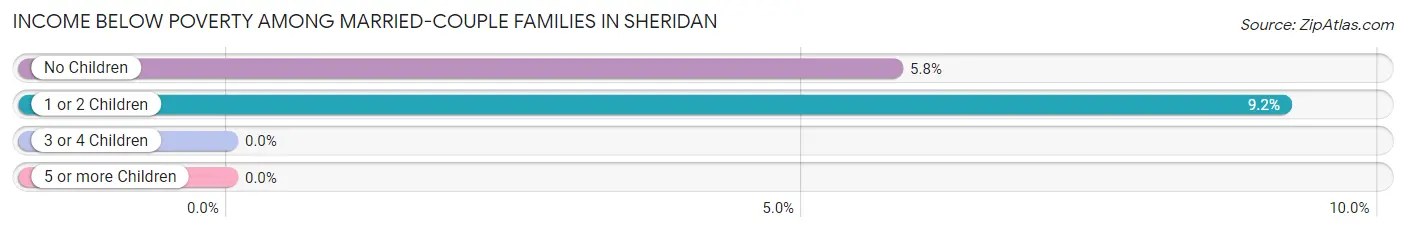
| Children | Above Poverty | Below Poverty |
| No Children | 569 (94.2%) | 35 (5.8%) |
| 1 or 2 Children | 307 (90.8%) | 31 (9.2%) |
| 3 or 4 Children | 94 (100.0%) | 0 (0.0%) |
| 5 or more Children | 17 (100.0%) | 0 (0.0%) |
| Total | 987 (93.7%) | 66 (6.3%) |
Income Below Poverty Among Single-Parent Households in Sheridan
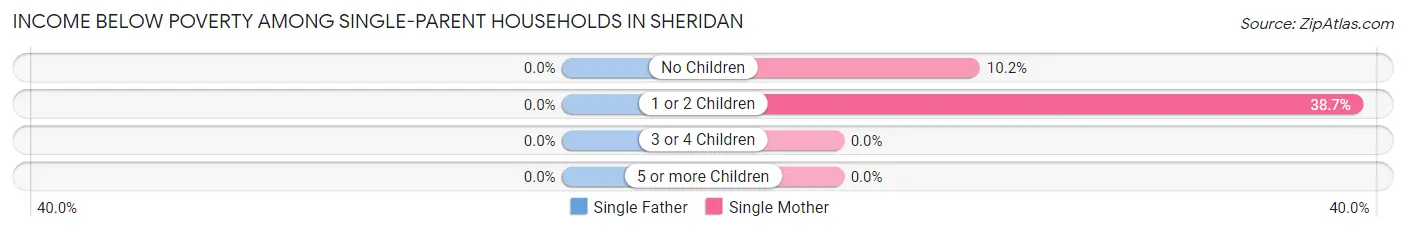
| Children | Single Father | Single Mother |
| No Children | 0 (0.0%) | 20 (10.2%) |
| 1 or 2 Children | 0 (0.0%) | 46 (38.7%) |
| 3 or 4 Children | 0 (0.0%) | 0 (0.0%) |
| 5 or more Children | 0 (0.0%) | 0 (0.0%) |
| Total | 0 (0.0%) | 66 (19.4%) |
Income Below Poverty Among Married-Couple vs Single-Parent Households in Sheridan
The poverty data for Sheridan shows that 66 of the married-couple family households (6.3%) and 66 of the single-parent households (14.8%) are living below the poverty level. Within the married-couple family households, those with 1 or 2 children have the highest poverty rate, with 31 households (9.2%) falling below the poverty line. Among the single-parent households, those with 1 or 2 children have the highest poverty rate, with 46 household (38.7%) living below poverty.
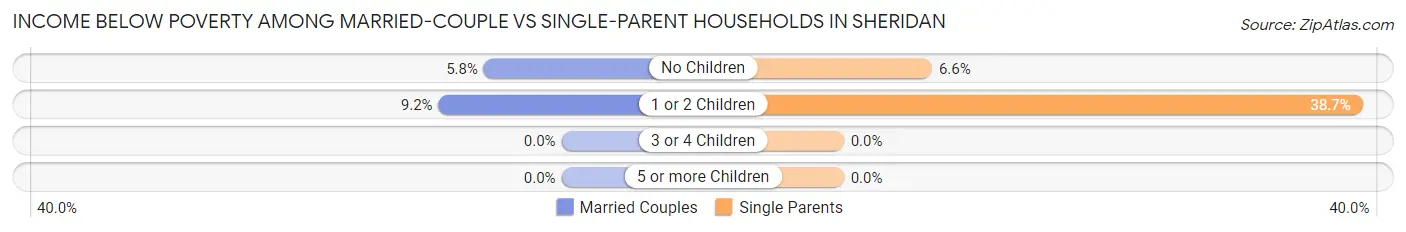
| Children | Married-Couple Families | Single-Parent Households |
| No Children | 35 (5.8%) | 20 (6.6%) |
| 1 or 2 Children | 31 (9.2%) | 46 (38.7%) |
| 3 or 4 Children | 0 (0.0%) | 0 (0.0%) |
| 5 or more Children | 0 (0.0%) | 0 (0.0%) |
| Total | 66 (6.3%) | 66 (14.8%) |
Race in Sheridan
The most populous races in Sheridan are White / Caucasian (5,579 | 89.4%), Hispanic or Latino (792 | 12.7%), and Two or more Races (408 | 6.5%).
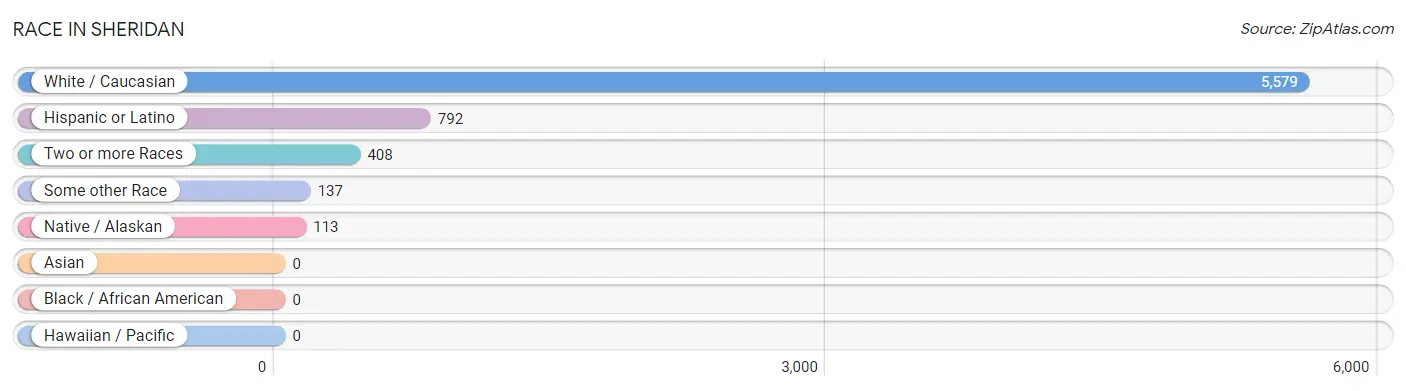
| Race | # Population | % Population |
| Asian | 0 | 0.0% |
| Black / African American | 0 | 0.0% |
| Hawaiian / Pacific | 0 | 0.0% |
| Hispanic or Latino | 792 | 12.7% |
| Native / Alaskan | 113 | 1.8% |
| White / Caucasian | 5,579 | 89.4% |
| Two or more Races | 408 | 6.5% |
| Some other Race | 137 | 2.2% |
| Total | 6,237 | 100.0% |
Ancestry in Sheridan
The most populous ancestries reported in Sheridan are German (1,389 | 22.3%), English (941 | 15.1%), Irish (823 | 13.2%), Mexican (664 | 10.6%), and European (452 | 7.2%), together accounting for 68.5% of all Sheridan residents.
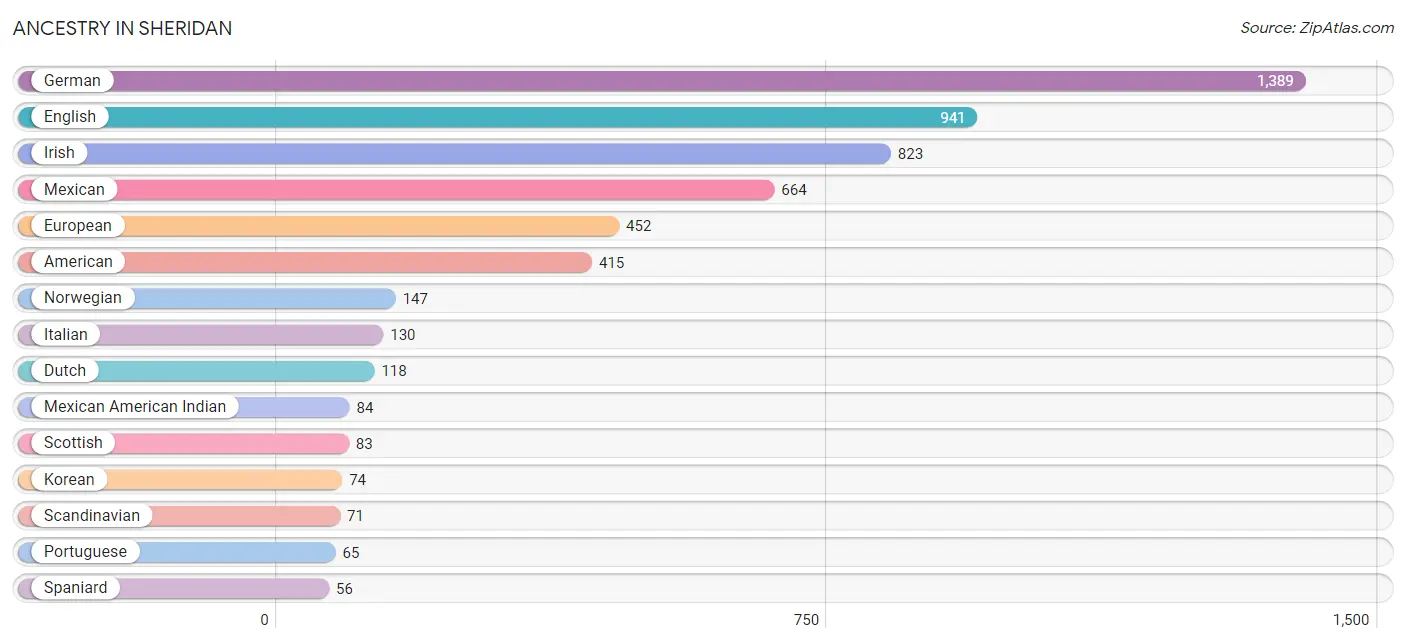
| Ancestry | # Population | % Population |
| Alaskan Athabascan | 15 | 0.2% |
| American | 415 | 6.7% |
| Armenian | 11 | 0.2% |
| Blackfeet | 40 | 0.6% |
| British | 35 | 0.6% |
| Canadian | 44 | 0.7% |
| Choctaw | 46 | 0.7% |
| Cuban | 18 | 0.3% |
| Czech | 17 | 0.3% |
| Dutch | 118 | 1.9% |
| English | 941 | 15.1% |
| Estonian | 12 | 0.2% |
| European | 452 | 7.2% |
| Finnish | 34 | 0.5% |
| French | 52 | 0.8% |
| German | 1,389 | 22.3% |
| Hungarian | 11 | 0.2% |
| Irish | 823 | 13.2% |
| Italian | 130 | 2.1% |
| Korean | 74 | 1.2% |
| Mexican | 664 | 10.6% |
| Mexican American Indian | 84 | 1.3% |
| Norwegian | 147 | 2.4% |
| Polish | 21 | 0.3% |
| Portuguese | 65 | 1.0% |
| Puerto Rican | 54 | 0.9% |
| Scandinavian | 71 | 1.1% |
| Scotch-Irish | 49 | 0.8% |
| Scottish | 83 | 1.3% |
| Spaniard | 56 | 0.9% |
| Sri Lankan | 32 | 0.5% |
| Swedish | 51 | 0.8% |
| Swiss | 24 | 0.4% | View All 33 Rows |
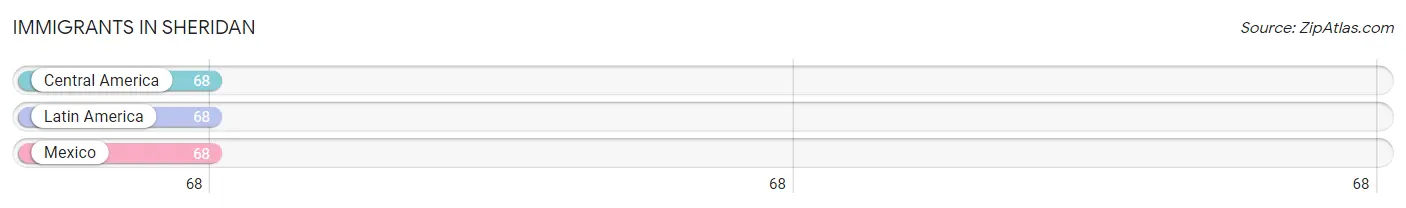
Immigrants in Sheridan
The most numerous immigrant groups reported in Sheridan came from Central America (68 | 1.1%), Latin America (68 | 1.1%), and Mexico (68 | 1.1%), together accounting for 3.3% of all Sheridan residents.
| Immigration Origin | # Population | % Population |
| Central America | 68 | 1.1% |
| Latin America | 68 | 1.1% |
| Mexico | 68 | 1.1% | View All 3 Rows |
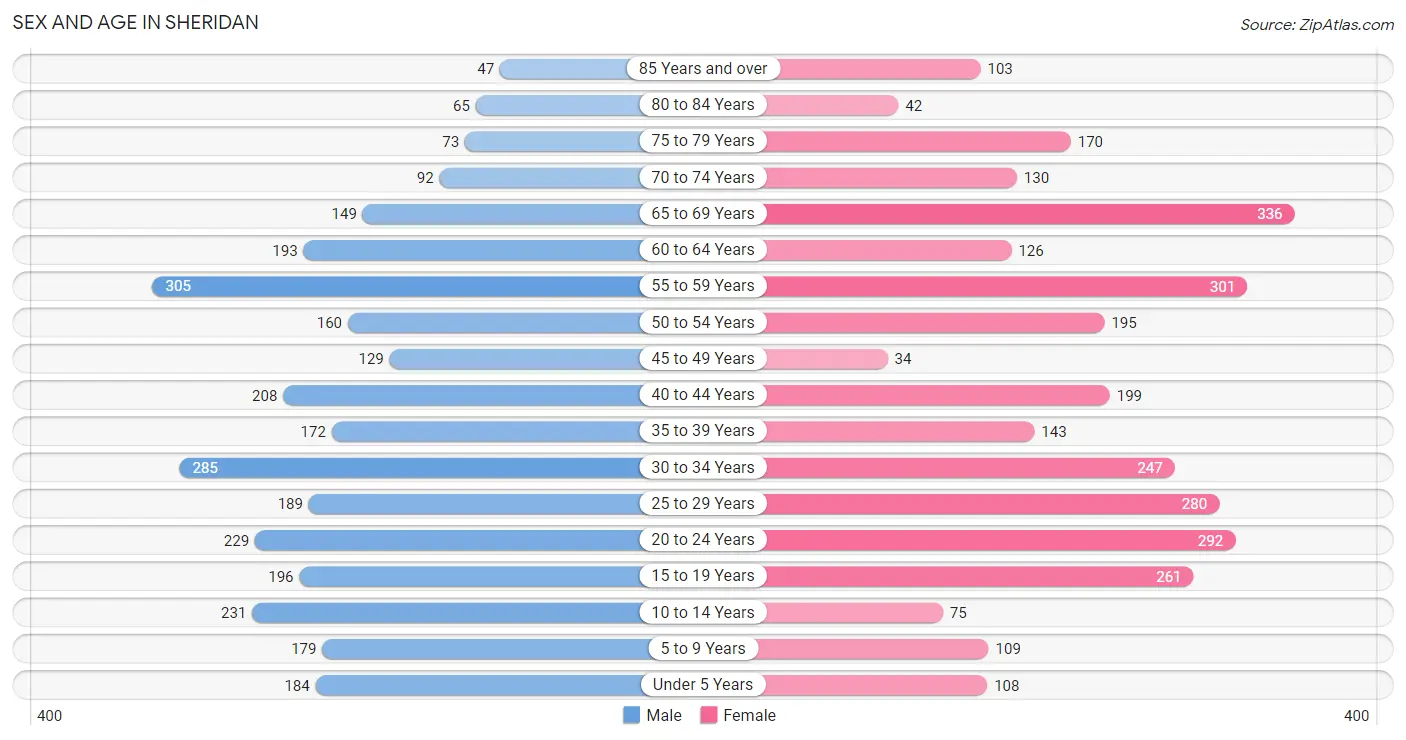
Sex and Age in Sheridan
Sex and Age in Sheridan
The most populous age groups in Sheridan are 55 to 59 Years (305 | 9.9%) for men and 65 to 69 Years (336 | 10.7%) for women.
| Age Bracket | Male | Female |
| Under 5 Years | 184 (6.0%) | 108 (3.4%) |
| 5 to 9 Years | 179 (5.8%) | 109 (3.5%) |
| 10 to 14 Years | 231 (7.5%) | 75 (2.4%) |
| 15 to 19 Years | 196 (6.4%) | 261 (8.3%) |
| 20 to 24 Years | 229 (7.4%) | 292 (9.3%) |
| 25 to 29 Years | 189 (6.1%) | 280 (8.9%) |
| 30 to 34 Years | 285 (9.2%) | 247 (7.8%) |
| 35 to 39 Years | 172 (5.6%) | 143 (4.5%) |
| 40 to 44 Years | 208 (6.7%) | 199 (6.3%) |
| 45 to 49 Years | 129 (4.2%) | 34 (1.1%) |
| 50 to 54 Years | 160 (5.2%) | 195 (6.2%) |
| 55 to 59 Years | 305 (9.9%) | 301 (9.6%) |
| 60 to 64 Years | 193 (6.2%) | 126 (4.0%) |
| 65 to 69 Years | 149 (4.8%) | 336 (10.7%) |
| 70 to 74 Years | 92 (3.0%) | 130 (4.1%) |
| 75 to 79 Years | 73 (2.4%) | 170 (5.4%) |
| 80 to 84 Years | 65 (2.1%) | 42 (1.3%) |
| 85 Years and over | 47 (1.5%) | 103 (3.3%) |
| Total | 3,086 (100.0%) | 3,151 (100.0%) |
Families and Households in Sheridan
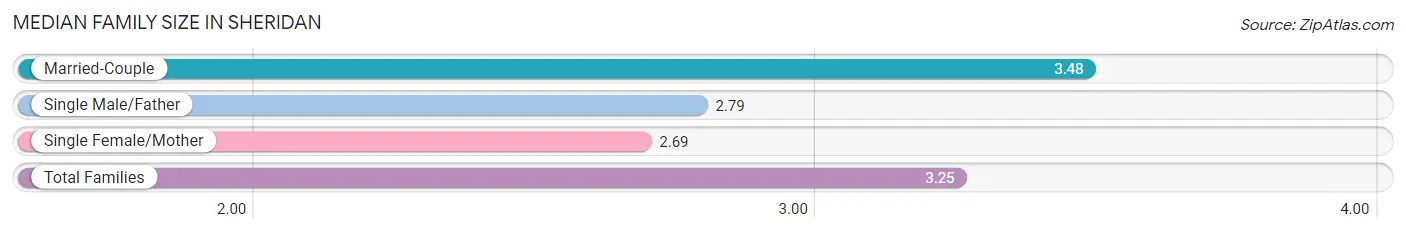
Median Family Size in Sheridan
The median family size in Sheridan is 3.25 persons per family, with married-couple families (1,053 | 70.2%) accounting for the largest median family size of 3.48 persons per family. On the other hand, single female/mother families (340 | 22.7%) represent the smallest median family size with 2.69 persons per family.
| Family Type | # Families | Family Size |
| Married-Couple | 1,053 (70.2%) | 3.48 |
| Single Male/Father | 107 (7.1%) | 2.79 |
| Single Female/Mother | 340 (22.7%) | 2.69 |
| Total Families | 1,500 (100.0%) | 3.25 |
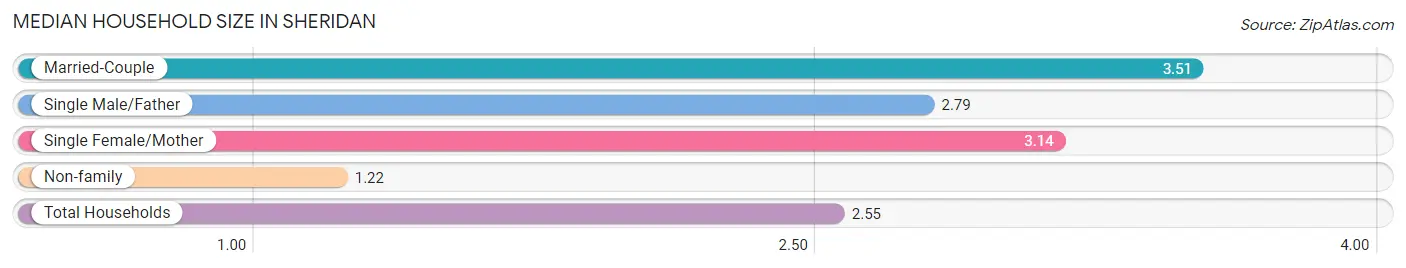
Median Household Size in Sheridan
The median household size in Sheridan is 2.55 persons per household, with married-couple households (1,053 | 43.3%) accounting for the largest median household size of 3.51 persons per household. non-family households (929 | 38.3%) represent the smallest median household size with 1.22 persons per household.
| Household Type | # Households | Household Size |
| Married-Couple | 1,053 (43.3%) | 3.51 |
| Single Male/Father | 107 (4.4%) | 2.79 |
| Single Female/Mother | 340 (14.0%) | 3.14 |
| Non-family | 929 (38.3%) | 1.22 |
| Total Households | 2,429 (100.0%) | 2.55 |
Household Size by Marriage Status in Sheridan
Out of a total of 2,429 households in Sheridan, 1,500 (61.8%) are family households, while 929 (38.3%) are nonfamily households. The most numerous type of family households are 2-person households, comprising 659, and the most common type of nonfamily households are 1-person households, comprising 772.
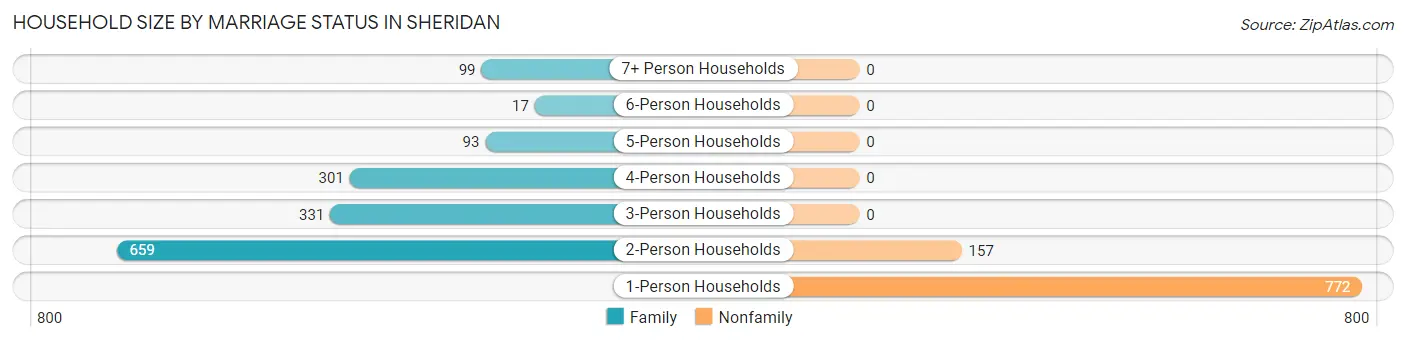
| Household Size | Family Households | Nonfamily Households |
| 1-Person Households | - | 772 (31.8%) |
| 2-Person Households | 659 (27.1%) | 157 (6.5%) |
| 3-Person Households | 331 (13.6%) | 0 (0.0%) |
| 4-Person Households | 301 (12.4%) | 0 (0.0%) |
| 5-Person Households | 93 (3.8%) | 0 (0.0%) |
| 6-Person Households | 17 (0.7%) | 0 (0.0%) |
| 7+ Person Households | 99 (4.1%) | 0 (0.0%) |
| Total | 1,500 (61.8%) | 929 (38.3%) |
Female Fertility in Sheridan
Fertility by Age in Sheridan
Average fertility rate in Sheridan is 109.0 births per 1,000 women. Women in the age bracket of 35 to 50 years have the highest fertility rate with 231.0 births per 1,000 women. Women in the age bracket of 35 to 50 years acount for 54.7% of all women with births.
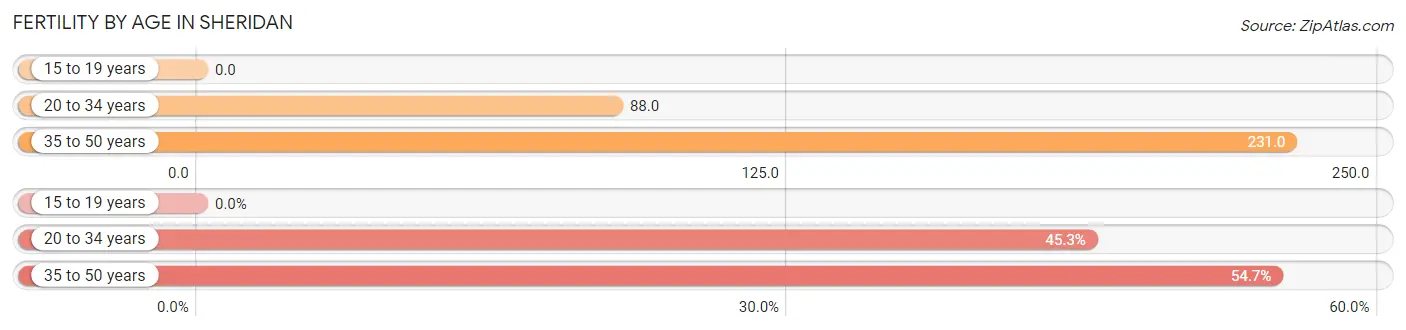
| Age Bracket | Women with Births | Births / 1,000 Women |
| 15 to 19 years | 0 (0.0%) | 0.0 |
| 20 to 34 years | 72 (45.3%) | 88.0 |
| 35 to 50 years | 87 (54.7%) | 231.0 |
| Total | 159 (100.0%) | 109.0 |
Fertility by Age by Marriage Status in Sheridan
47.8% of women with births (159) in Sheridan are married. The highest percentage of unmarried women with births falls into 20 to 34 years age bracket with 81.9% of them unmarried at the time of birth, while the lowest percentage of unmarried women with births belong to 35 to 50 years age bracket with 27.6% of them unmarried.
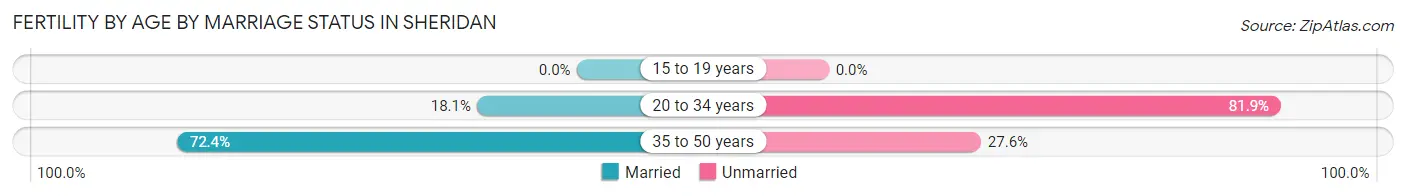
| Age Bracket | Married | Unmarried |
| 15 to 19 years | 0 (0.0%) | 0 (0.0%) |
| 20 to 34 years | 13 (18.1%) | 59 (81.9%) |
| 35 to 50 years | 63 (72.4%) | 24 (27.6%) |
| Total | 76 (47.8%) | 83 (52.2%) |
Fertility by Education in Sheridan
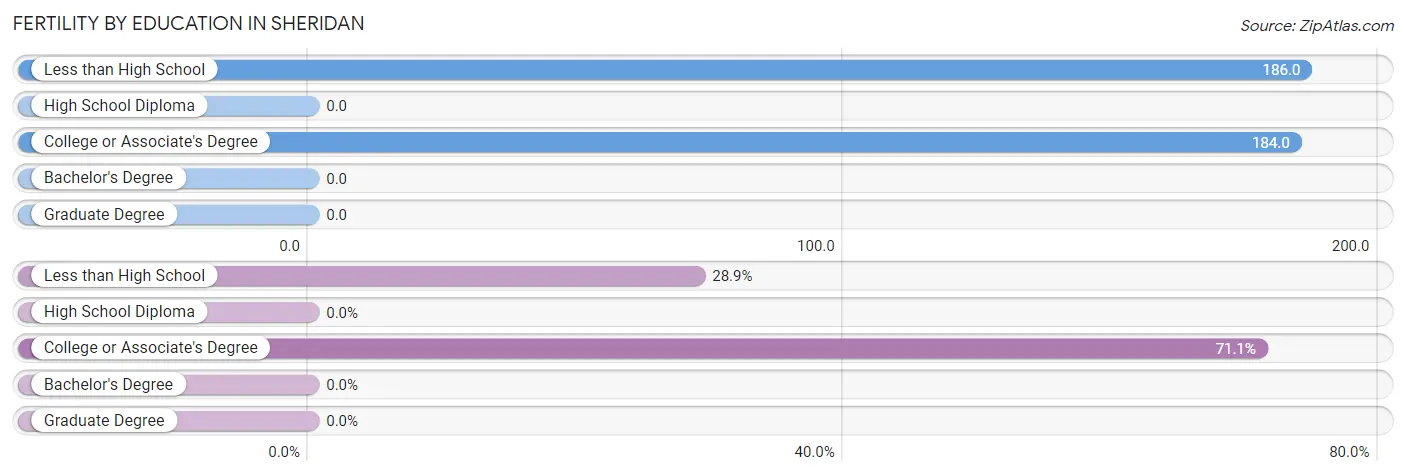
| Educational Attainment | Women with Births | Births / 1,000 Women |
| Less than High School | 46 (28.9%) | 186.0 |
| High School Diploma | 0 (0.0%) | 0.0 |
| College or Associate's Degree | 113 (71.1%) | 184.0 |
| Bachelor's Degree | 0 (0.0%) | 0.0 |
| Graduate Degree | 0 (0.0%) | 0.0 |
| Total | 159 (100.0%) | 109.0 |
Fertility by Education by Marriage Status in Sheridan
52.2% of women with births in Sheridan are unmarried. Women with the educational attainment of less than high school are most likely to be married with 100.0% of them married at childbirth, while women with the educational attainment of college or associate's degree are least likely to be married with 73.5% of them unmarried at childbirth.
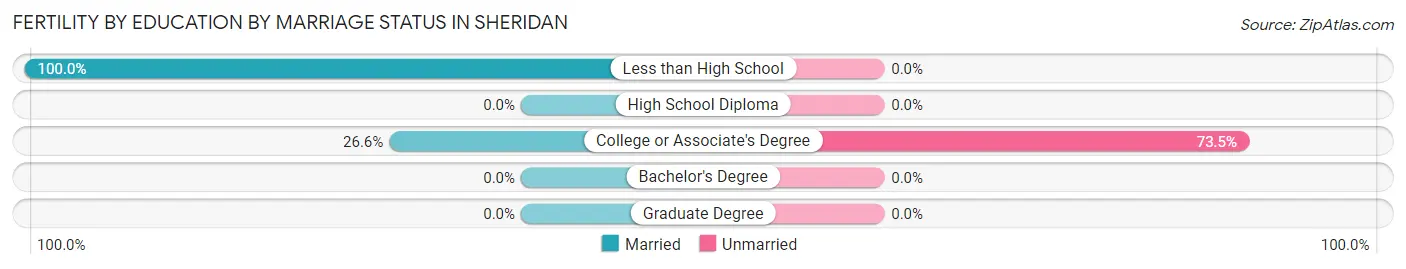
| Educational Attainment | Married | Unmarried |
| Less than High School | 46 (100.0%) | 0 (0.0%) |
| High School Diploma | 0 (0.0%) | 0 (0.0%) |
| College or Associate's Degree | 30 (26.6%) | 83 (73.5%) |
| Bachelor's Degree | 0 (0.0%) | 0 (0.0%) |
| Graduate Degree | 0 (0.0%) | 0 (0.0%) |
| Total | 76 (47.8%) | 83 (52.2%) |
Employment Characteristics in Sheridan
Employment by Class of Employer in Sheridan
Among the 2,832 employed individuals in Sheridan, private company employees (2,131 | 75.2%), self-employed (not incorporated) (199 | 7.0%), and local government employees (192 | 6.8%) make up the most common classes of employment.
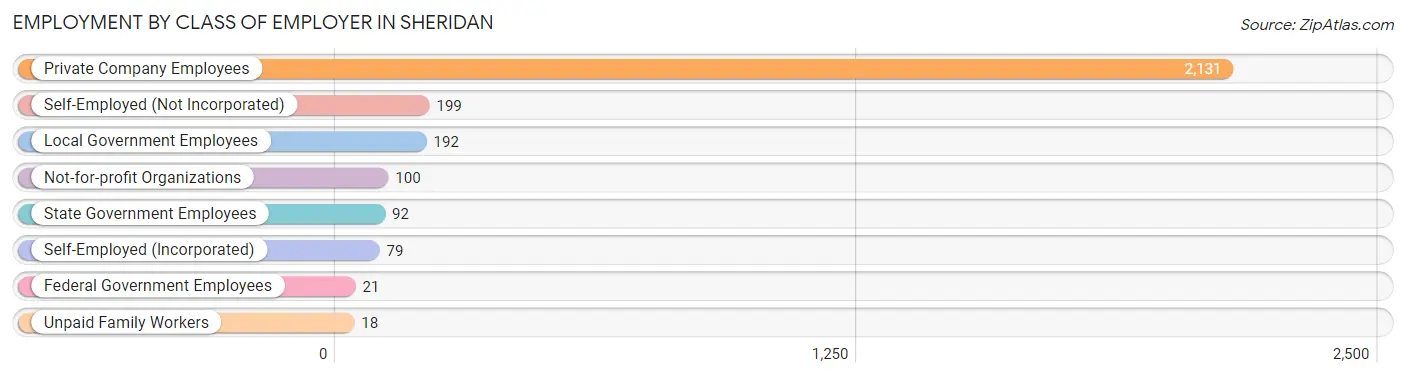
| Employer Class | # Employees | % Employees |
| Private Company Employees | 2,131 | 75.2% |
| Self-Employed (Incorporated) | 79 | 2.8% |
| Self-Employed (Not Incorporated) | 199 | 7.0% |
| Not-for-profit Organizations | 100 | 3.5% |
| Local Government Employees | 192 | 6.8% |
| State Government Employees | 92 | 3.3% |
| Federal Government Employees | 21 | 0.7% |
| Unpaid Family Workers | 18 | 0.6% |
| Total | 2,832 | 100.0% |
Employment Status by Age in Sheridan
According to the labor force statistics for Sheridan, out of the total population over 16 years of age (5,312), 58.4% or 3,102 individuals are in the labor force, with 6.8% or 211 of them unemployed. The age group with the highest labor force participation rate is 20 to 24 years, with 92.9% or 484 individuals in the labor force. Within the labor force, the 45 to 54 years age range has the highest percentage of unemployed individuals, with 16.6% or 54 of them being unemployed.
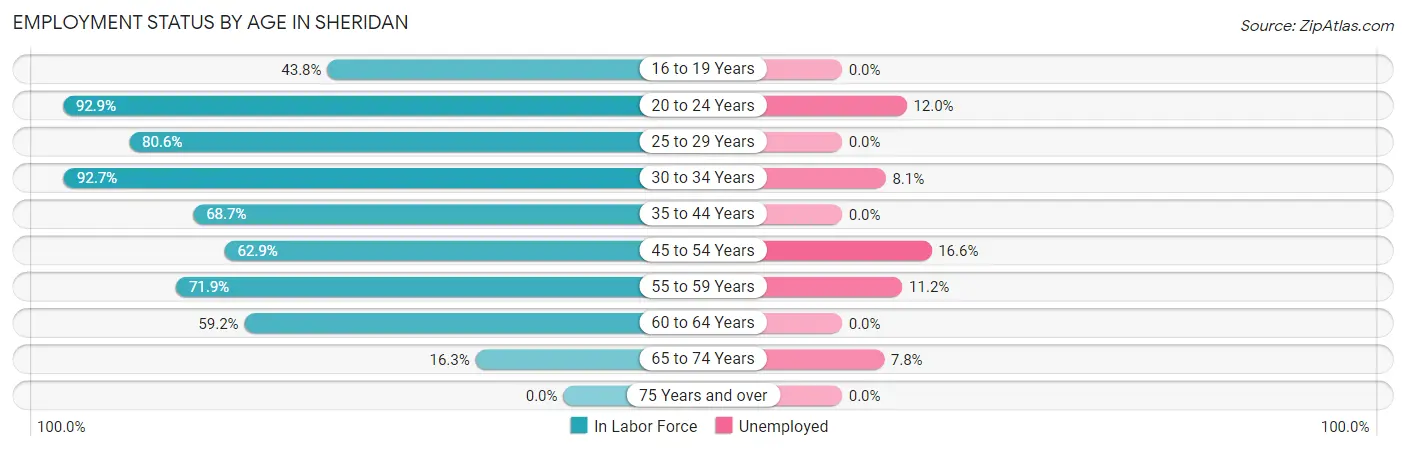
| Age Bracket | In Labor Force | Unemployed |
| 16 to 19 Years | 183 (43.8%) | 0 (0.0%) |
| 20 to 24 Years | 484 (92.9%) | 58 (12.0%) |
| 25 to 29 Years | 378 (80.6%) | 0 (0.0%) |
| 30 to 34 Years | 493 (92.7%) | 40 (8.1%) |
| 35 to 44 Years | 496 (68.7%) | 0 (0.0%) |
| 45 to 54 Years | 326 (62.9%) | 54 (16.6%) |
| 55 to 59 Years | 436 (71.9%) | 49 (11.2%) |
| 60 to 64 Years | 189 (59.2%) | 0 (0.0%) |
| 65 to 74 Years | 115 (16.3%) | 9 (7.8%) |
| 75 Years and over | 0 (0.0%) | 0 (0.0%) |
| Total | 3,102 (58.4%) | 211 (6.8%) |
Employment Status by Educational Attainment in Sheridan
According to labor force statistics for Sheridan, 73.2% of individuals (2,318) out of the total population between 25 and 64 years of age (3,166) are in the labor force, with 6.2% or 144 of them being unemployed. The group with the highest labor force participation rate are those with the educational attainment of bachelor's degree or higher, with 89.6% or 380 individuals in the labor force. Within the labor force, individuals with high school diploma education have the highest percentage of unemployment, with 8.4% or 67 of them being unemployed.
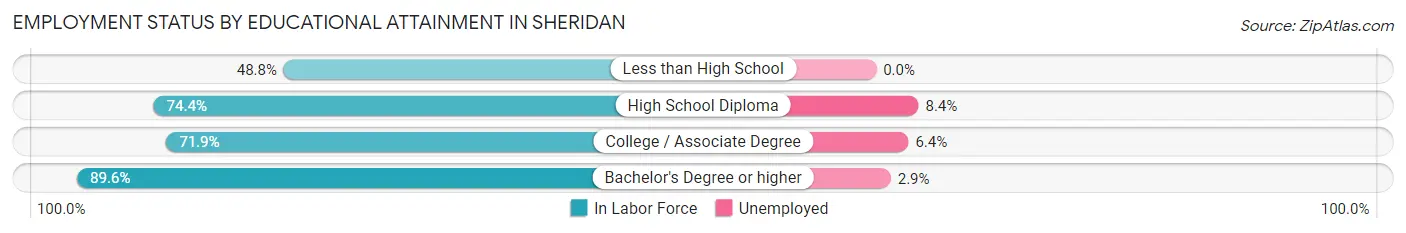
| Educational Attainment | In Labor Force | Unemployed |
| Less than High School | 127 (48.8%) | 0 (0.0%) |
| High School Diploma | 801 (74.4%) | 90 (8.4%) |
| College / Associate Degree | 1,010 (71.9%) | 90 (6.4%) |
| Bachelor's Degree or higher | 380 (89.6%) | 12 (2.9%) |
| Total | 2,318 (73.2%) | 196 (6.2%) |
Employment Occupations by Sex in Sheridan
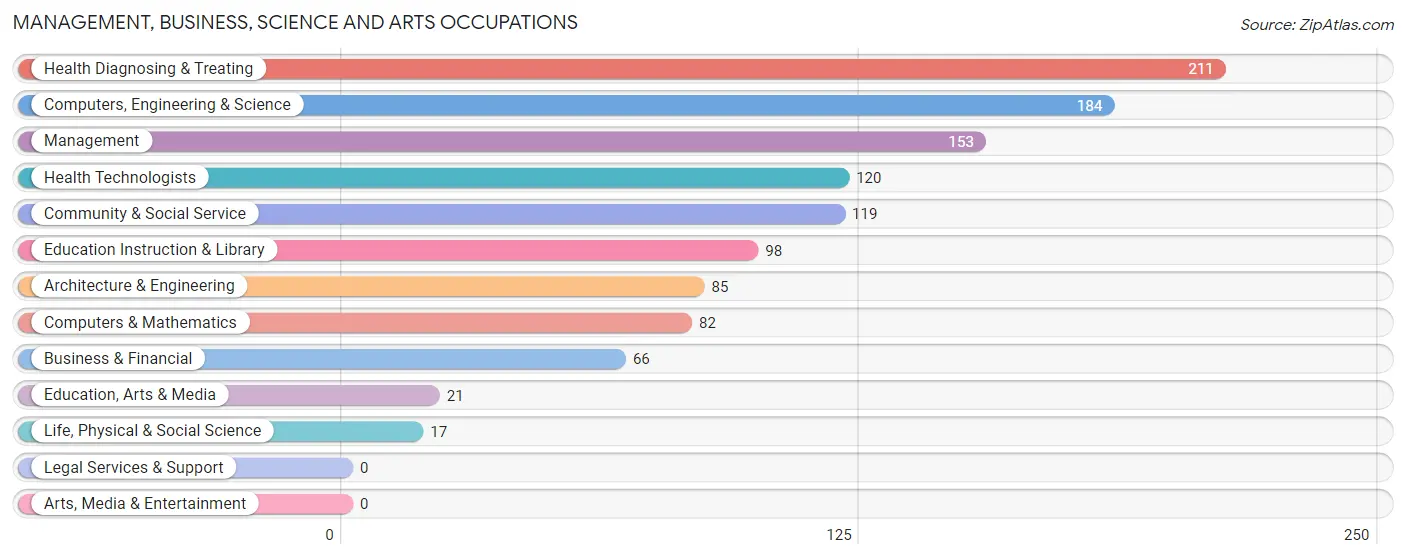
Management, Business, Science and Arts Occupations
The most common Management, Business, Science and Arts occupations in Sheridan are Health Diagnosing & Treating (211 | 7.3%), Computers, Engineering & Science (184 | 6.4%), Management (153 | 5.3%), Health Technologists (120 | 4.2%), and Community & Social Service (119 | 4.1%).
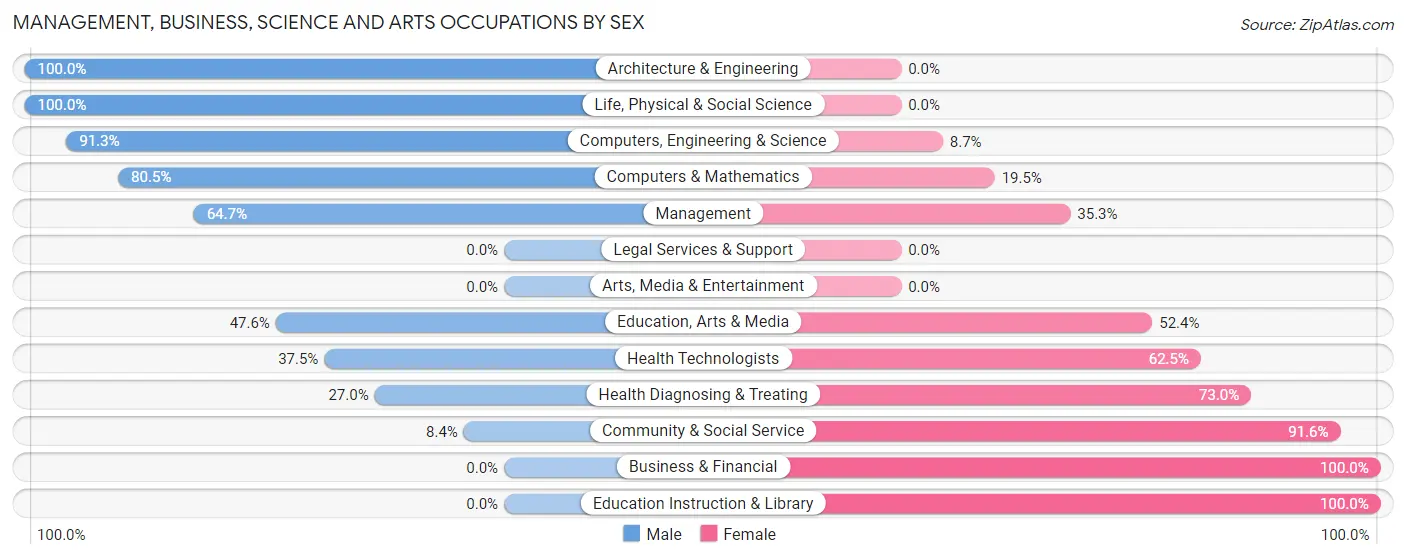
Management, Business, Science and Arts Occupations by Sex
Within the Management, Business, Science and Arts occupations in Sheridan, the most male-oriented occupations are Architecture & Engineering (100.0%), Life, Physical & Social Science (100.0%), and Computers, Engineering & Science (91.3%), while the most female-oriented occupations are Business & Financial (100.0%), Education Instruction & Library (100.0%), and Community & Social Service (91.6%).
| Occupation | Male | Female |
| Management | 99 (64.7%) | 54 (35.3%) |
| Business & Financial | 0 (0.0%) | 66 (100.0%) |
| Computers, Engineering & Science | 168 (91.3%) | 16 (8.7%) |
| Computers & Mathematics | 66 (80.5%) | 16 (19.5%) |
| Architecture & Engineering | 85 (100.0%) | 0 (0.0%) |
| Life, Physical & Social Science | 17 (100.0%) | 0 (0.0%) |
| Community & Social Service | 10 (8.4%) | 109 (91.6%) |
| Education, Arts & Media | 10 (47.6%) | 11 (52.4%) |
| Legal Services & Support | 0 (0.0%) | 0 (0.0%) |
| Education Instruction & Library | 0 (0.0%) | 98 (100.0%) |
| Arts, Media & Entertainment | 0 (0.0%) | 0 (0.0%) |
| Health Diagnosing & Treating | 57 (27.0%) | 154 (73.0%) |
| Health Technologists | 45 (37.5%) | 75 (62.5%) |
| Total (Category) | 334 (45.6%) | 399 (54.4%) |
| Total (Overall) | 1,418 (49.1%) | 1,472 (50.9%) |
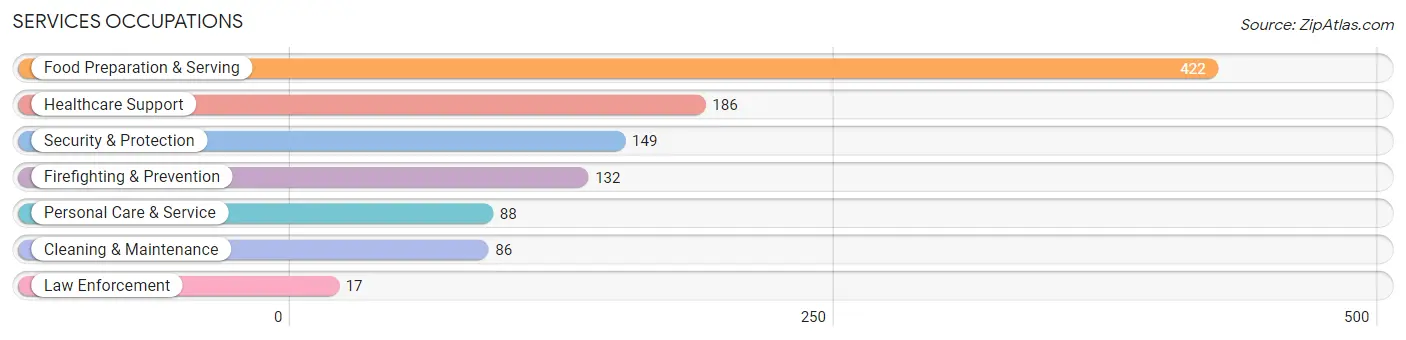
Services Occupations
The most common Services occupations in Sheridan are Food Preparation & Serving (422 | 14.6%), Healthcare Support (186 | 6.4%), Security & Protection (149 | 5.2%), Firefighting & Prevention (132 | 4.6%), and Personal Care & Service (88 | 3.0%).
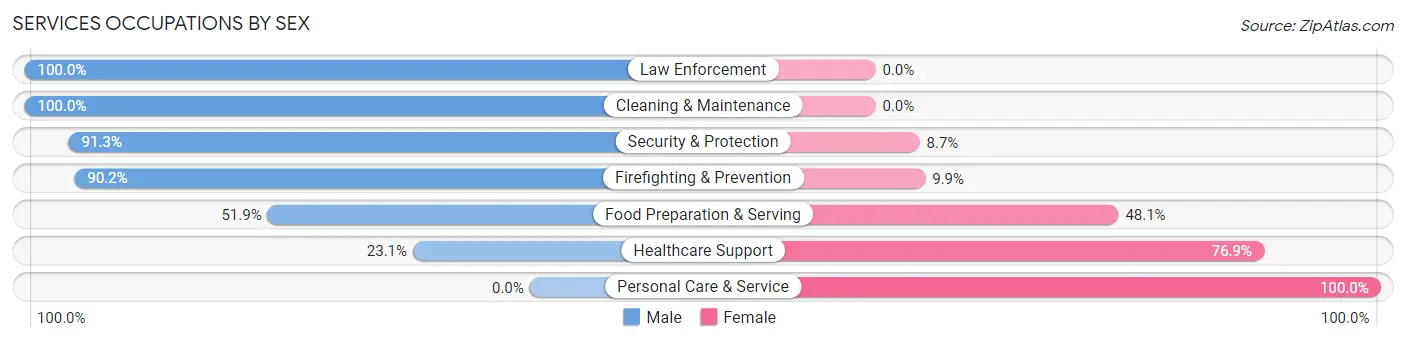
Services Occupations by Sex
Within the Services occupations in Sheridan, the most male-oriented occupations are Law Enforcement (100.0%), Cleaning & Maintenance (100.0%), and Security & Protection (91.3%), while the most female-oriented occupations are Personal Care & Service (100.0%), Healthcare Support (76.9%), and Food Preparation & Serving (48.1%).
| Occupation | Male | Female |
| Healthcare Support | 43 (23.1%) | 143 (76.9%) |
| Security & Protection | 136 (91.3%) | 13 (8.7%) |
| Firefighting & Prevention | 119 (90.1%) | 13 (9.9%) |
| Law Enforcement | 17 (100.0%) | 0 (0.0%) |
| Food Preparation & Serving | 219 (51.9%) | 203 (48.1%) |
| Cleaning & Maintenance | 86 (100.0%) | 0 (0.0%) |
| Personal Care & Service | 0 (0.0%) | 88 (100.0%) |
| Total (Category) | 484 (52.0%) | 447 (48.0%) |
| Total (Overall) | 1,418 (49.1%) | 1,472 (50.9%) |
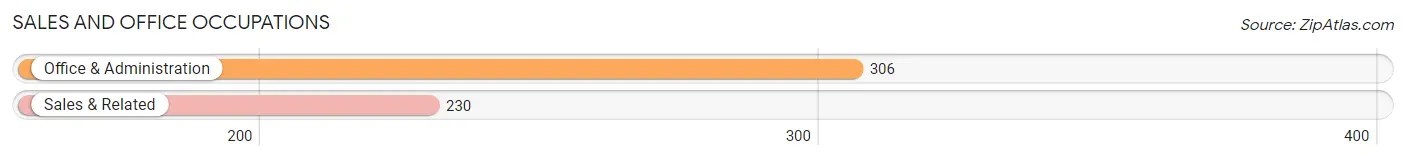
Sales and Office Occupations
The most common Sales and Office occupations in Sheridan are Office & Administration (306 | 10.6%), and Sales & Related (230 | 8.0%).
Sales and Office Occupations by Sex
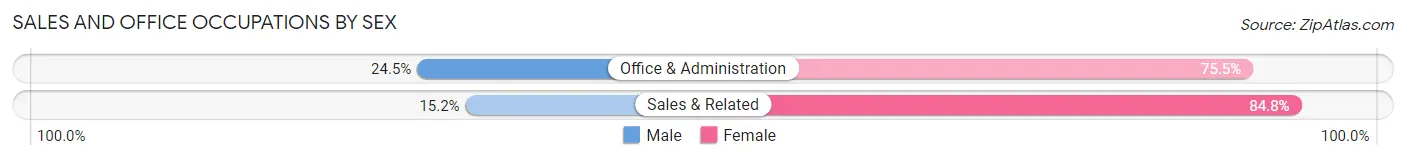
| Occupation | Male | Female |
| Sales & Related | 35 (15.2%) | 195 (84.8%) |
| Office & Administration | 75 (24.5%) | 231 (75.5%) |
| Total (Category) | 110 (20.5%) | 426 (79.5%) |
| Total (Overall) | 1,418 (49.1%) | 1,472 (50.9%) |
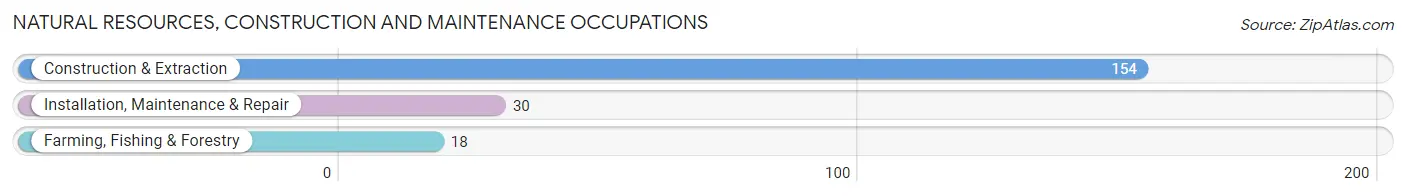
Natural Resources, Construction and Maintenance Occupations
The most common Natural Resources, Construction and Maintenance occupations in Sheridan are Construction & Extraction (154 | 5.3%), Installation, Maintenance & Repair (30 | 1.0%), and Farming, Fishing & Forestry (18 | 0.6%).
Natural Resources, Construction and Maintenance Occupations by Sex
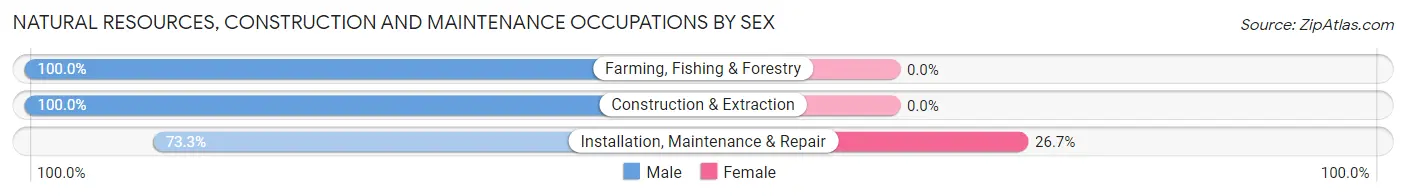
| Occupation | Male | Female |
| Farming, Fishing & Forestry | 18 (100.0%) | 0 (0.0%) |
| Construction & Extraction | 154 (100.0%) | 0 (0.0%) |
| Installation, Maintenance & Repair | 22 (73.3%) | 8 (26.7%) |
| Total (Category) | 194 (96.0%) | 8 (4.0%) |
| Total (Overall) | 1,418 (49.1%) | 1,472 (50.9%) |
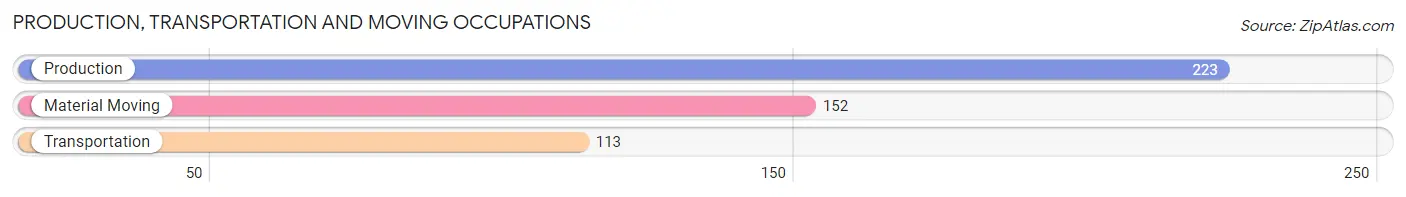
Production, Transportation and Moving Occupations
The most common Production, Transportation and Moving occupations in Sheridan are Production (223 | 7.7%), Material Moving (152 | 5.3%), and Transportation (113 | 3.9%).
Production, Transportation and Moving Occupations by Sex
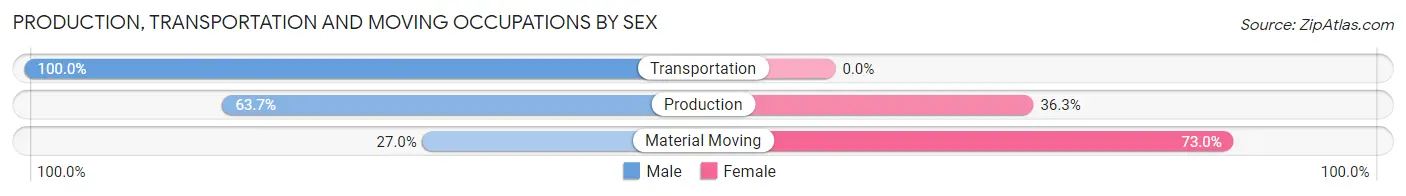
| Occupation | Male | Female |
| Production | 142 (63.7%) | 81 (36.3%) |
| Transportation | 113 (100.0%) | 0 (0.0%) |
| Material Moving | 41 (27.0%) | 111 (73.0%) |
| Total (Category) | 296 (60.7%) | 192 (39.3%) |
| Total (Overall) | 1,418 (49.1%) | 1,472 (50.9%) |
Employment Industries by Sex in Sheridan
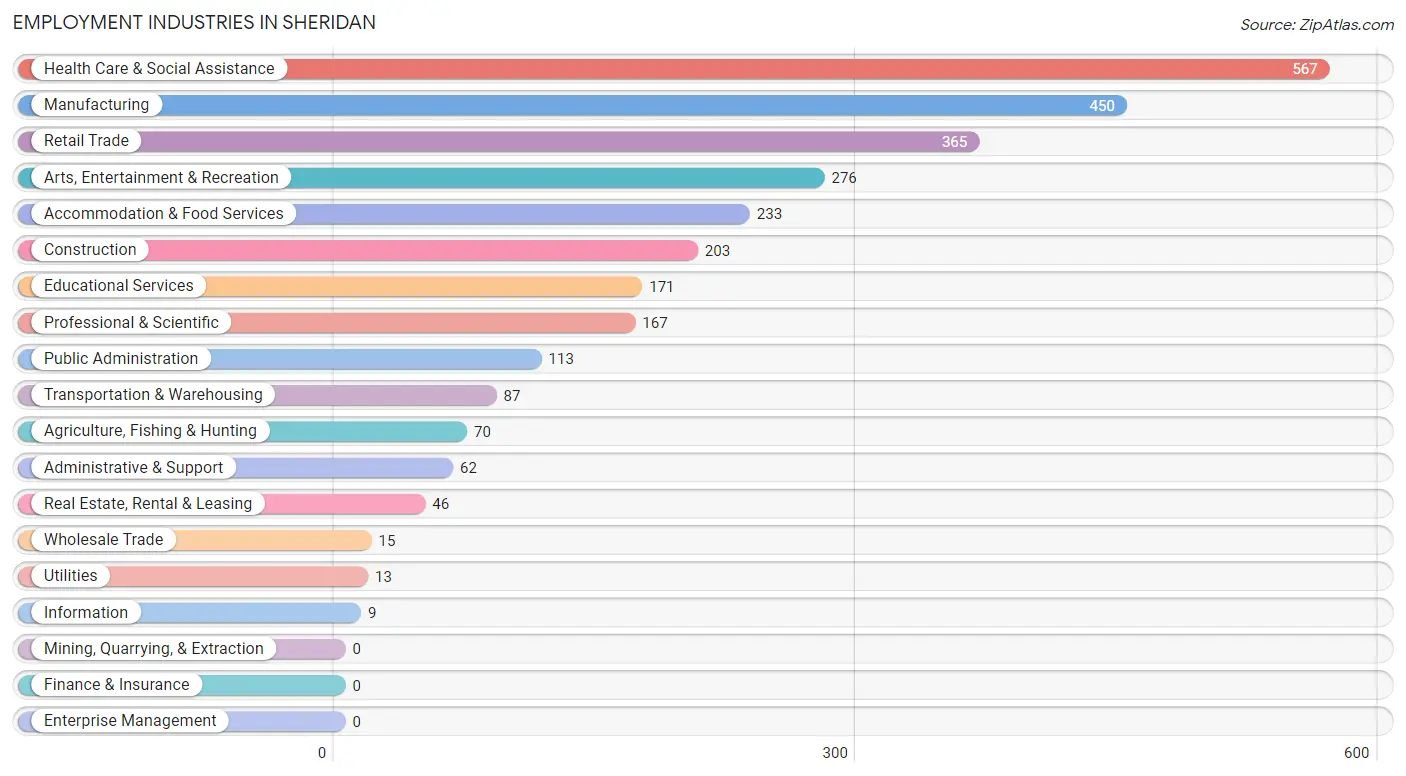
Employment Industries in Sheridan
The major employment industries in Sheridan include Health Care & Social Assistance (567 | 19.6%), Manufacturing (450 | 15.6%), Retail Trade (365 | 12.6%), Arts, Entertainment & Recreation (276 | 9.6%), and Accommodation & Food Services (233 | 8.1%).
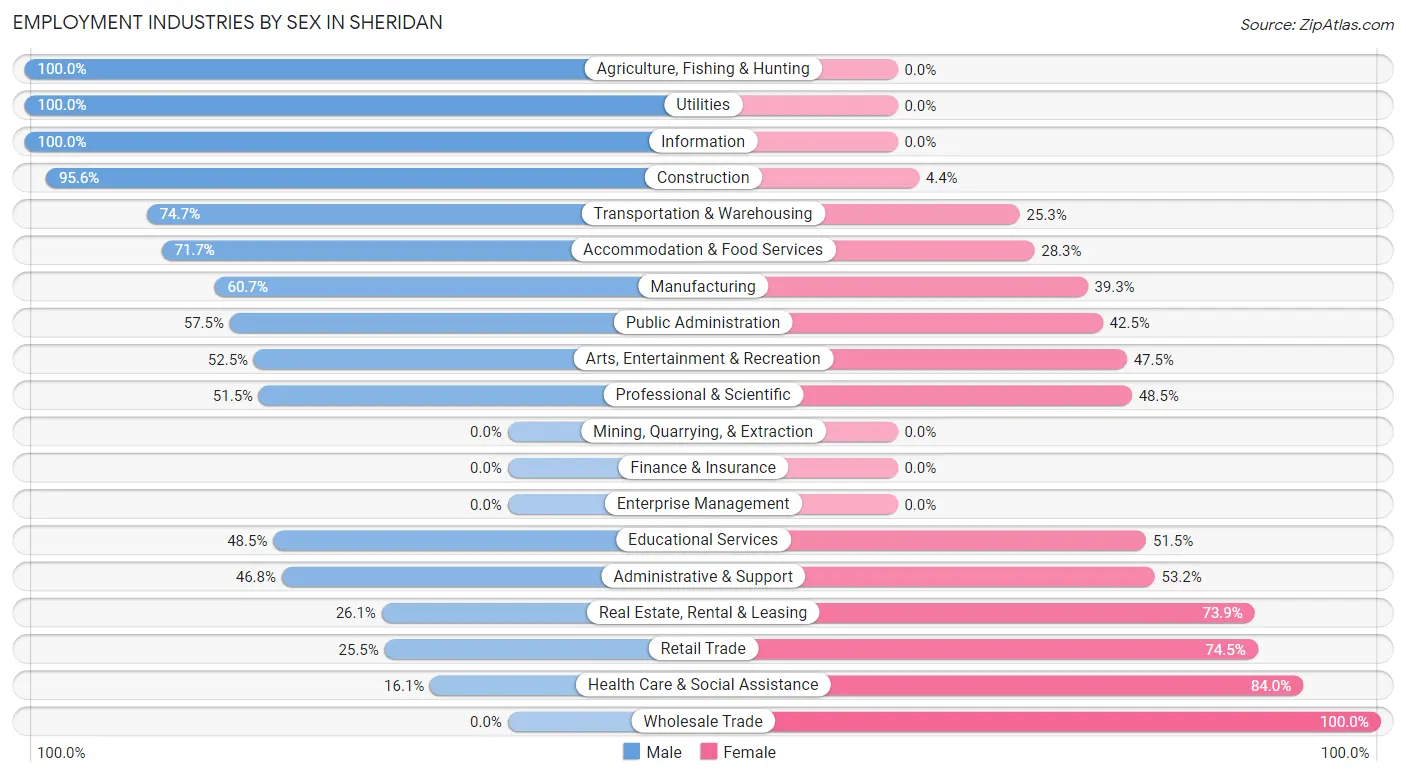
Employment Industries by Sex in Sheridan
The Sheridan industries that see more men than women are Agriculture, Fishing & Hunting (100.0%), Utilities (100.0%), and Information (100.0%), whereas the industries that tend to have a higher number of women are Wholesale Trade (100.0%), Health Care & Social Assistance (84.0%), and Retail Trade (74.5%).
| Industry | Male | Female |
| Agriculture, Fishing & Hunting | 70 (100.0%) | 0 (0.0%) |
| Mining, Quarrying, & Extraction | 0 (0.0%) | 0 (0.0%) |
| Construction | 194 (95.6%) | 9 (4.4%) |
| Manufacturing | 273 (60.7%) | 177 (39.3%) |
| Wholesale Trade | 0 (0.0%) | 15 (100.0%) |
| Retail Trade | 93 (25.5%) | 272 (74.5%) |
| Transportation & Warehousing | 65 (74.7%) | 22 (25.3%) |
| Utilities | 13 (100.0%) | 0 (0.0%) |
| Information | 9 (100.0%) | 0 (0.0%) |
| Finance & Insurance | 0 (0.0%) | 0 (0.0%) |
| Real Estate, Rental & Leasing | 12 (26.1%) | 34 (73.9%) |
| Professional & Scientific | 86 (51.5%) | 81 (48.5%) |
| Enterprise Management | 0 (0.0%) | 0 (0.0%) |
| Administrative & Support | 29 (46.8%) | 33 (53.2%) |
| Educational Services | 83 (48.5%) | 88 (51.5%) |
| Health Care & Social Assistance | 91 (16.1%) | 476 (84.0%) |
| Arts, Entertainment & Recreation | 145 (52.5%) | 131 (47.5%) |
| Accommodation & Food Services | 167 (71.7%) | 66 (28.3%) |
| Public Administration | 65 (57.5%) | 48 (42.5%) |
| Total | 1,418 (49.1%) | 1,472 (50.9%) |
Education in Sheridan
School Enrollment in Sheridan
The most common levels of schooling among the 1,097 students in Sheridan are high school (341 | 31.1%), elementary school (245 | 22.3%), and college / undergraduate (223 | 20.3%).
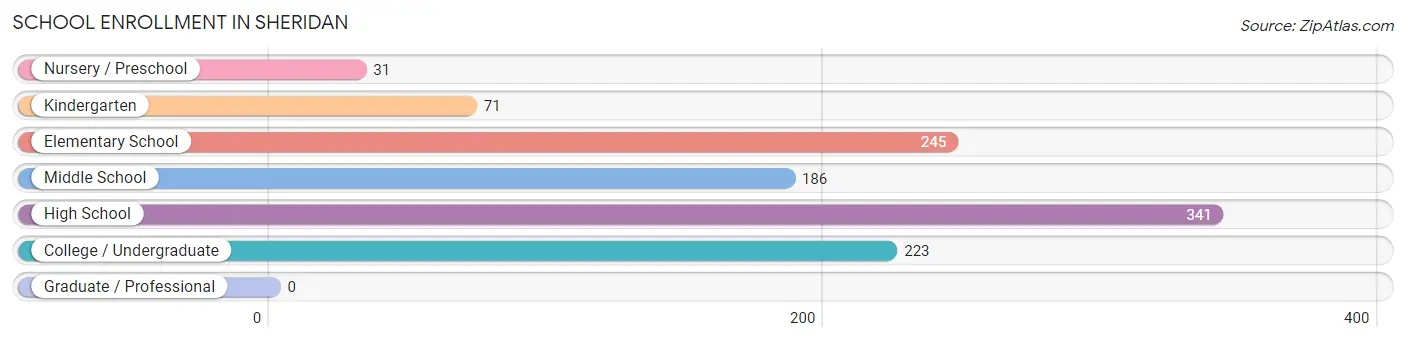
| School Level | # Students | % Students |
| Nursery / Preschool | 31 | 2.8% |
| Kindergarten | 71 | 6.5% |
| Elementary School | 245 | 22.3% |
| Middle School | 186 | 17.0% |
| High School | 341 | 31.1% |
| College / Undergraduate | 223 | 20.3% |
| Graduate / Professional | 0 | 0.0% |
| Total | 1,097 | 100.0% |
School Enrollment by Age by Funding Source in Sheridan
Out of a total of 1,097 students who are enrolled in schools in Sheridan, 18 (1.6%) attend a private institution, while the remaining 1,079 (98.4%) are enrolled in public schools. The age group of 5 to 9 year old has the highest likelihood of being enrolled in private schools, with 18 (7.3% in the age bracket) enrolled. Conversely, the age group of 3 to 4 year olds has the lowest likelihood of being enrolled in a private school, with 31 (100.0% in the age bracket) attending a public institution.
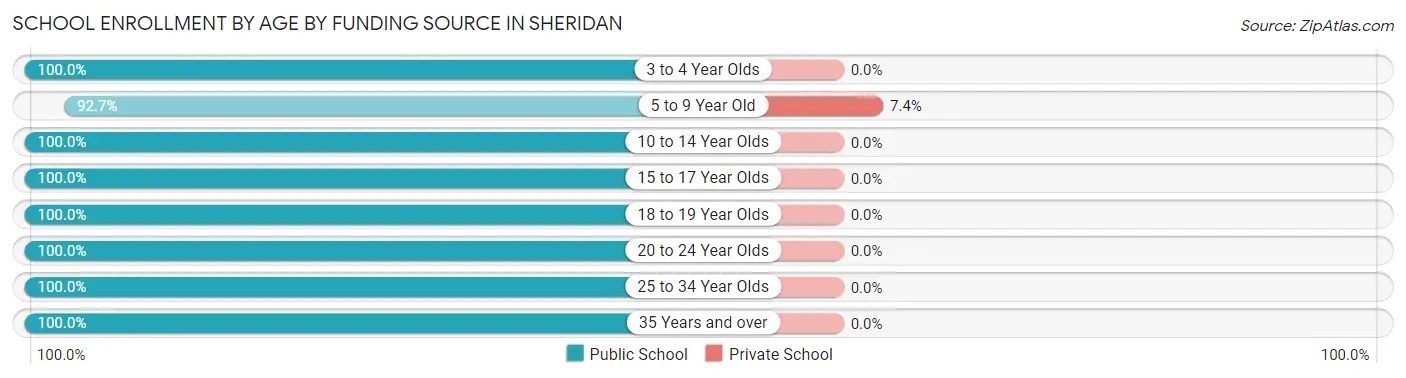
| Age Bracket | Public School | Private School |
| 3 to 4 Year Olds | 31 (100.0%) | 0 (0.0%) |
| 5 to 9 Year Old | 227 (92.6%) | 18 (7.3%) |
| 10 to 14 Year Olds | 306 (100.0%) | 0 (0.0%) |
| 15 to 17 Year Olds | 211 (100.0%) | 0 (0.0%) |
| 18 to 19 Year Olds | 99 (100.0%) | 0 (0.0%) |
| 20 to 24 Year Olds | 68 (100.0%) | 0 (0.0%) |
| 25 to 34 Year Olds | 89 (100.0%) | 0 (0.0%) |
| 35 Years and over | 48 (100.0%) | 0 (0.0%) |
| Total | 1,079 (98.4%) | 18 (1.6%) |
Educational Attainment by Field of Study in Sheridan
Social sciences (126 | 20.4%), education (95 | 15.3%), business (91 | 14.7%), engineering (83 | 13.4%), and science & technology (70 | 11.3%) are the most common fields of study among 619 individuals in Sheridan who have obtained a bachelor's degree or higher.
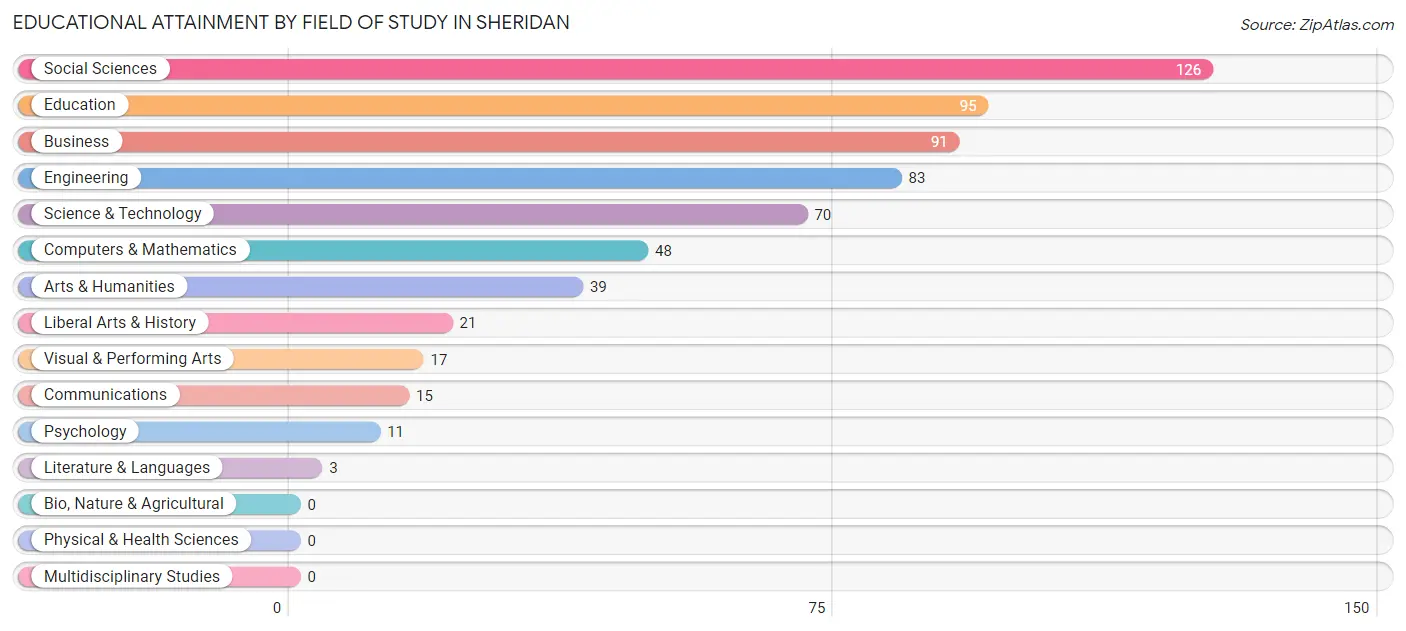
| Field of Study | # Graduates | % Graduates |
| Computers & Mathematics | 48 | 7.7% |
| Bio, Nature & Agricultural | 0 | 0.0% |
| Physical & Health Sciences | 0 | 0.0% |
| Psychology | 11 | 1.8% |
| Social Sciences | 126 | 20.4% |
| Engineering | 83 | 13.4% |
| Multidisciplinary Studies | 0 | 0.0% |
| Science & Technology | 70 | 11.3% |
| Business | 91 | 14.7% |
| Education | 95 | 15.3% |
| Literature & Languages | 3 | 0.5% |
| Liberal Arts & History | 21 | 3.4% |
| Visual & Performing Arts | 17 | 2.8% |
| Communications | 15 | 2.4% |
| Arts & Humanities | 39 | 6.3% |
| Total | 619 | 100.0% |
Transportation & Commute in Sheridan
Vehicle Availability by Sex in Sheridan
The most prevalent vehicle ownership categories in Sheridan are males with 2 vehicles (607, accounting for 44.7%) and females with 2 vehicles (665, making up 41.2%).
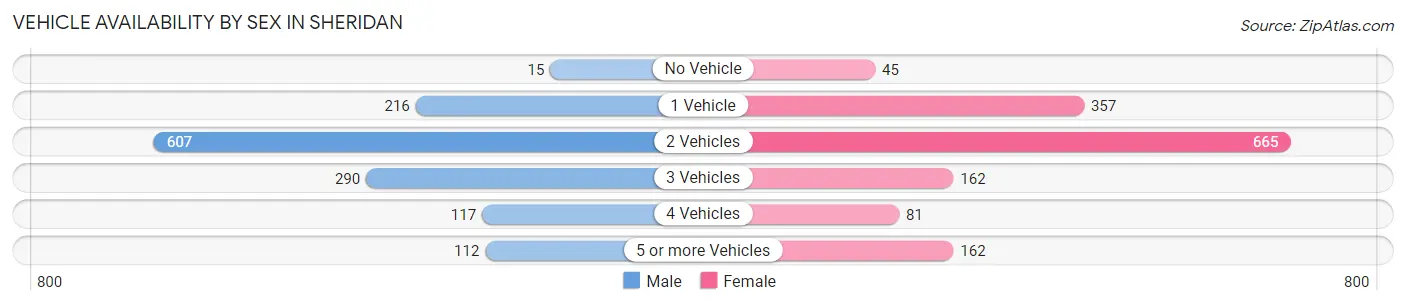
| Vehicles Available | Male | Female |
| No Vehicle | 15 (1.1%) | 45 (3.1%) |
| 1 Vehicle | 216 (15.9%) | 357 (24.2%) |
| 2 Vehicles | 607 (44.7%) | 665 (45.2%) |
| 3 Vehicles | 290 (21.4%) | 162 (11.0%) |
| 4 Vehicles | 117 (8.6%) | 81 (5.5%) |
| 5 or more Vehicles | 112 (8.3%) | 162 (11.0%) |
| Total | 1,357 (100.0%) | 1,472 (100.0%) |
Commute Time in Sheridan
The most frequently occuring commute durations in Sheridan are 15 to 19 minutes (367 commuters, 14.0%), 20 to 24 minutes (367 commuters, 14.0%), and 60 to 89 minutes (366 commuters, 14.0%).
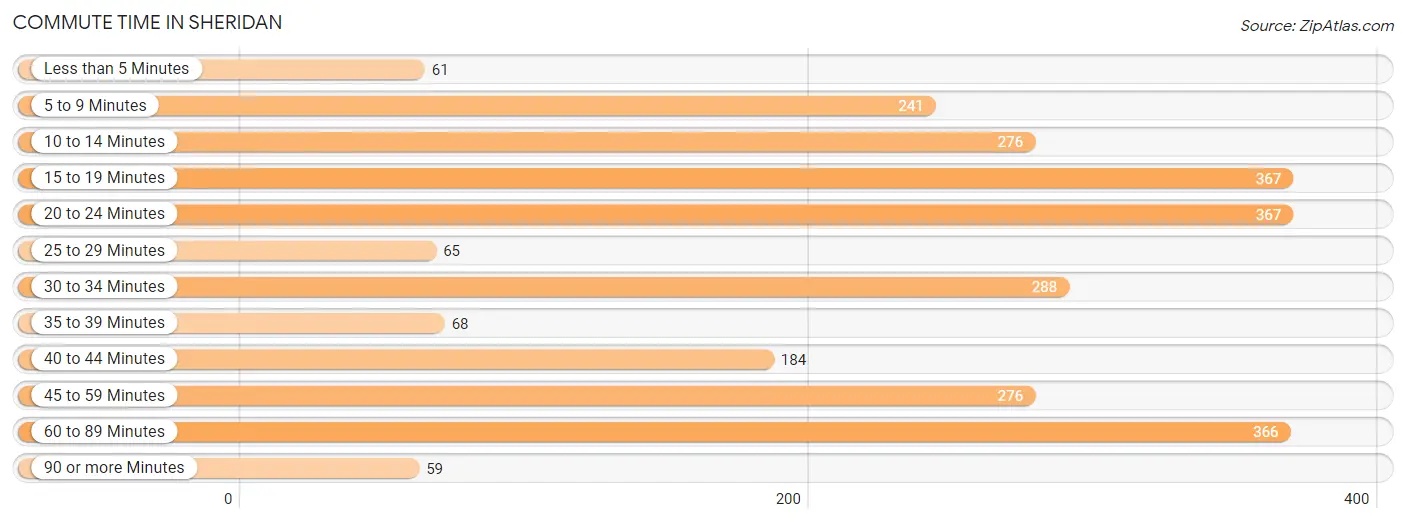
| Commute Time | # Commuters | % Commuters |
| Less than 5 Minutes | 61 | 2.3% |
| 5 to 9 Minutes | 241 | 9.2% |
| 10 to 14 Minutes | 276 | 10.5% |
| 15 to 19 Minutes | 367 | 14.0% |
| 20 to 24 Minutes | 367 | 14.0% |
| 25 to 29 Minutes | 65 | 2.5% |
| 30 to 34 Minutes | 288 | 11.0% |
| 35 to 39 Minutes | 68 | 2.6% |
| 40 to 44 Minutes | 184 | 7.0% |
| 45 to 59 Minutes | 276 | 10.5% |
| 60 to 89 Minutes | 366 | 14.0% |
| 90 or more Minutes | 59 | 2.2% |
Commute Time by Sex in Sheridan
The most common commute times in Sheridan are 60 to 89 minutes (205 commuters, 16.1%) for males and 15 to 19 minutes (215 commuters, 16.0%) for females.
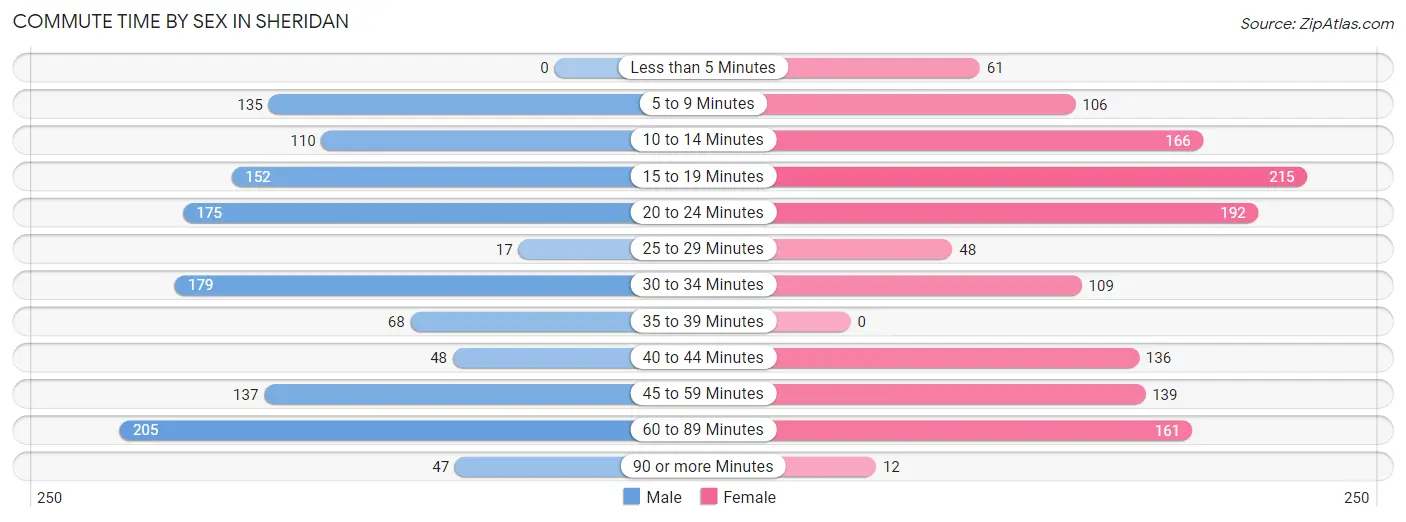
| Commute Time | Male | Female |
| Less than 5 Minutes | 0 (0.0%) | 61 (4.5%) |
| 5 to 9 Minutes | 135 (10.6%) | 106 (7.9%) |
| 10 to 14 Minutes | 110 (8.6%) | 166 (12.3%) |
| 15 to 19 Minutes | 152 (11.9%) | 215 (16.0%) |
| 20 to 24 Minutes | 175 (13.8%) | 192 (14.3%) |
| 25 to 29 Minutes | 17 (1.3%) | 48 (3.6%) |
| 30 to 34 Minutes | 179 (14.1%) | 109 (8.1%) |
| 35 to 39 Minutes | 68 (5.3%) | 0 (0.0%) |
| 40 to 44 Minutes | 48 (3.8%) | 136 (10.1%) |
| 45 to 59 Minutes | 137 (10.8%) | 139 (10.3%) |
| 60 to 89 Minutes | 205 (16.1%) | 161 (12.0%) |
| 90 or more Minutes | 47 (3.7%) | 12 (0.9%) |
Time of Departure to Work by Sex in Sheridan
The most frequent times of departure to work in Sheridan are 12:00 AM to 4:59 AM (235, 18.5%) for males and 7:00 AM to 7:29 AM (277, 20.6%) for females.
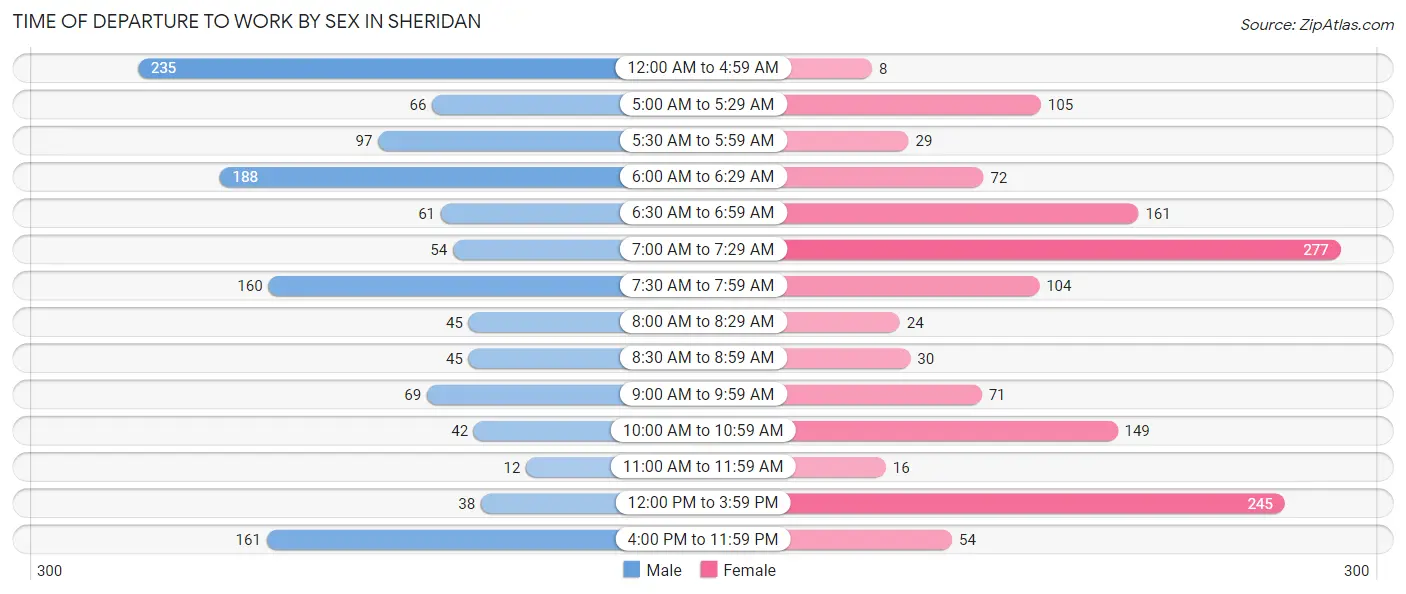
| Time of Departure | Male | Female |
| 12:00 AM to 4:59 AM | 235 (18.5%) | 8 (0.6%) |
| 5:00 AM to 5:29 AM | 66 (5.2%) | 105 (7.8%) |
| 5:30 AM to 5:59 AM | 97 (7.6%) | 29 (2.2%) |
| 6:00 AM to 6:29 AM | 188 (14.8%) | 72 (5.3%) |
| 6:30 AM to 6:59 AM | 61 (4.8%) | 161 (12.0%) |
| 7:00 AM to 7:29 AM | 54 (4.2%) | 277 (20.6%) |
| 7:30 AM to 7:59 AM | 160 (12.6%) | 104 (7.7%) |
| 8:00 AM to 8:29 AM | 45 (3.5%) | 24 (1.8%) |
| 8:30 AM to 8:59 AM | 45 (3.5%) | 30 (2.2%) |
| 9:00 AM to 9:59 AM | 69 (5.4%) | 71 (5.3%) |
| 10:00 AM to 10:59 AM | 42 (3.3%) | 149 (11.1%) |
| 11:00 AM to 11:59 AM | 12 (0.9%) | 16 (1.2%) |
| 12:00 PM to 3:59 PM | 38 (3.0%) | 245 (18.2%) |
| 4:00 PM to 11:59 PM | 161 (12.7%) | 54 (4.0%) |
| Total | 1,273 (100.0%) | 1,345 (100.0%) |
Housing Occupancy in Sheridan
Occupancy by Ownership in Sheridan
Of the total 2,429 dwellings in Sheridan, owner-occupied units account for 1,481 (61.0%), while renter-occupied units make up 948 (39.0%).
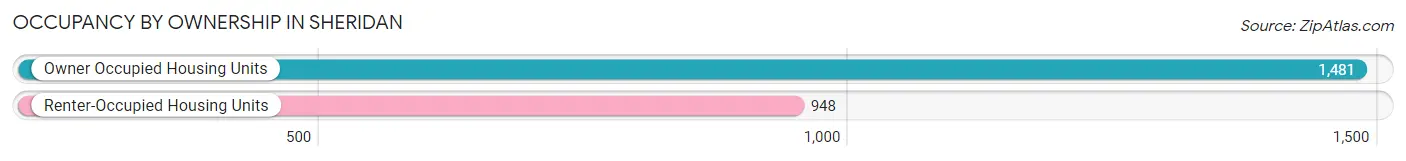
| Occupancy | # Housing Units | % Housing Units |
| Owner Occupied Housing Units | 1,481 | 61.0% |
| Renter-Occupied Housing Units | 948 | 39.0% |
| Total Occupied Housing Units | 2,429 | 100.0% |
Occupancy by Household Size in Sheridan
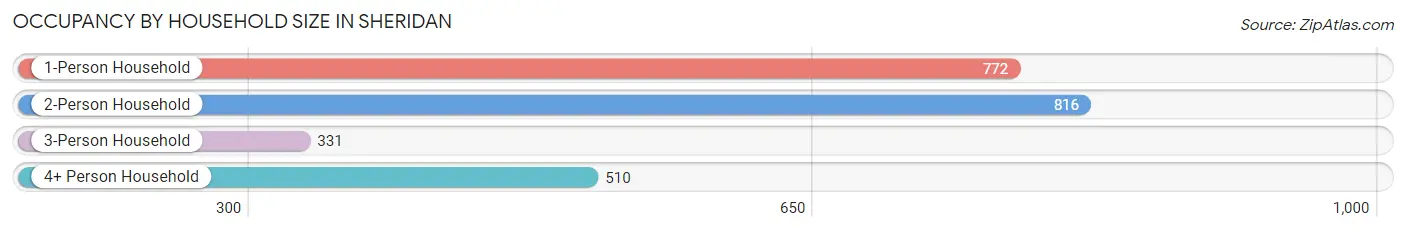
| Household Size | # Housing Units | % Housing Units |
| 1-Person Household | 772 | 31.8% |
| 2-Person Household | 816 | 33.6% |
| 3-Person Household | 331 | 13.6% |
| 4+ Person Household | 510 | 21.0% |
| Total Housing Units | 2,429 | 100.0% |
Occupancy by Ownership by Household Size in Sheridan
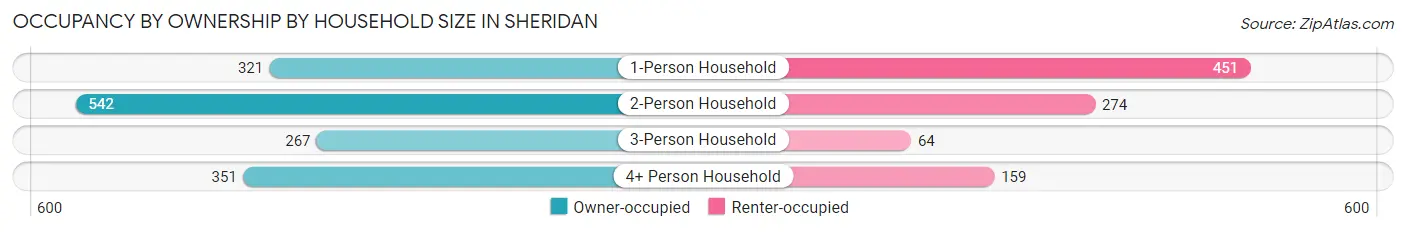
| Household Size | Owner-occupied | Renter-occupied |
| 1-Person Household | 321 (41.6%) | 451 (58.4%) |
| 2-Person Household | 542 (66.4%) | 274 (33.6%) |
| 3-Person Household | 267 (80.7%) | 64 (19.3%) |
| 4+ Person Household | 351 (68.8%) | 159 (31.2%) |
| Total Housing Units | 1,481 (61.0%) | 948 (39.0%) |
Occupancy by Educational Attainment in Sheridan
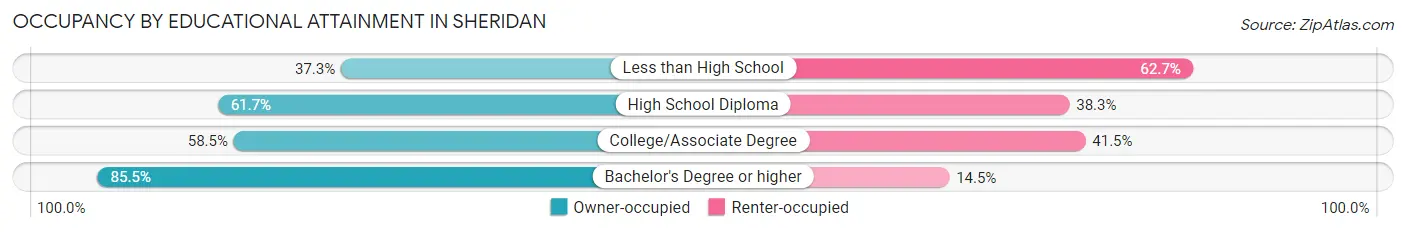
| Household Size | Owner-occupied | Renter-occupied |
| Less than High School | 79 (37.3%) | 133 (62.7%) |
| High School Diploma | 469 (61.7%) | 291 (38.3%) |
| College/Associate Degree | 679 (58.5%) | 481 (41.5%) |
| Bachelor's Degree or higher | 254 (85.5%) | 43 (14.5%) |
Occupancy by Age of Householder in Sheridan
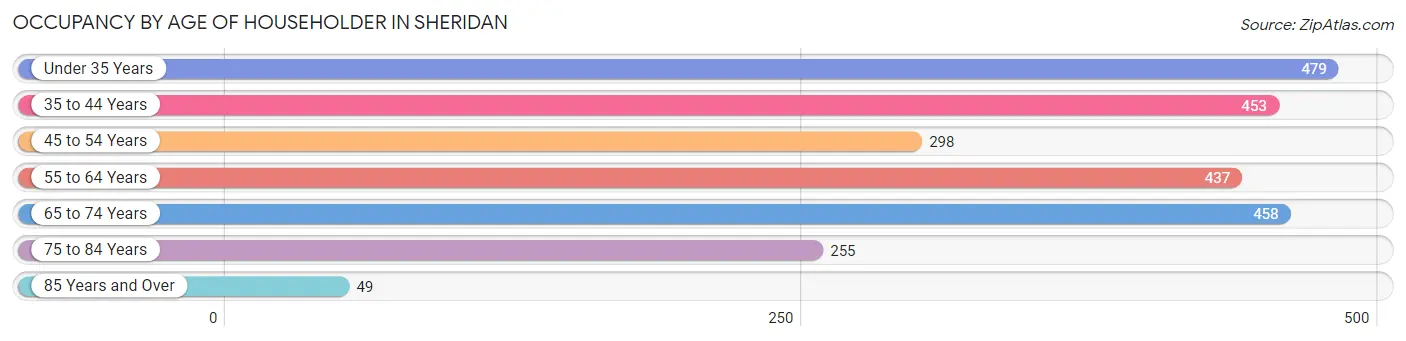
| Age Bracket | # Households | % Households |
| Under 35 Years | 479 | 19.7% |
| 35 to 44 Years | 453 | 18.6% |
| 45 to 54 Years | 298 | 12.3% |
| 55 to 64 Years | 437 | 18.0% |
| 65 to 74 Years | 458 | 18.9% |
| 75 to 84 Years | 255 | 10.5% |
| 85 Years and Over | 49 | 2.0% |
| Total | 2,429 | 100.0% |
Housing Finances in Sheridan
Median Income by Occupancy in Sheridan
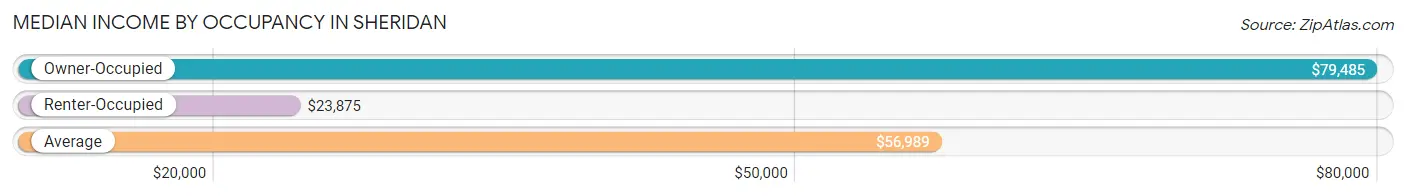
| Occupancy Type | # Households | Median Income |
| Owner-Occupied | 1,481 (61.0%) | $79,485 |
| Renter-Occupied | 948 (39.0%) | $23,875 |
| Average | 2,429 (100.0%) | $56,989 |
Occupancy by Householder Income Bracket in Sheridan
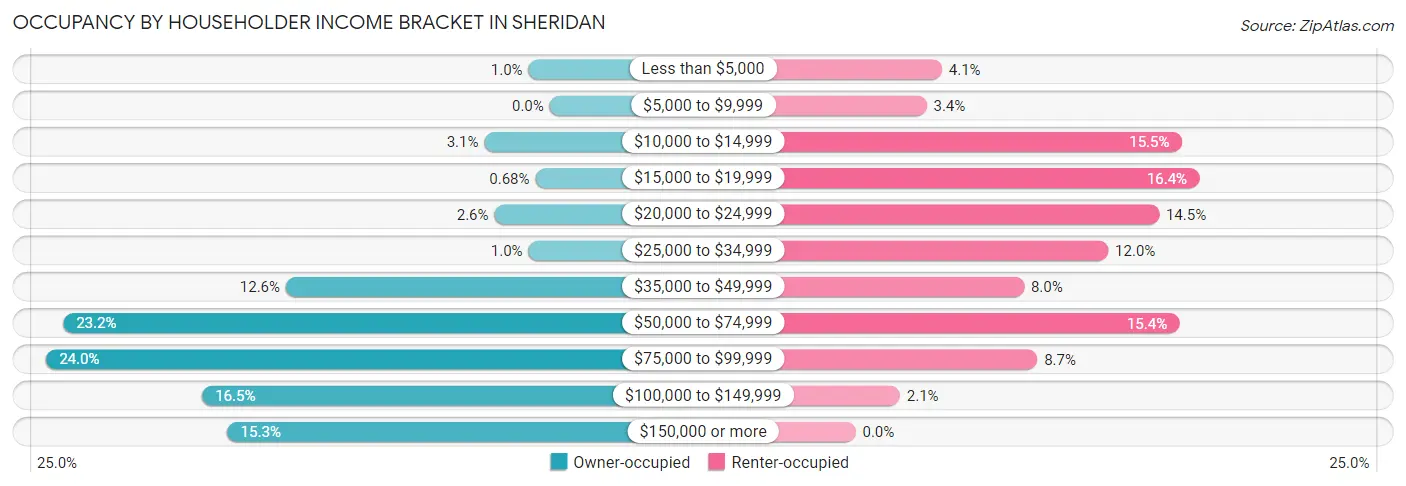
| Income Bracket | Owner-occupied | Renter-occupied |
| Less than $5,000 | 15 (1.0%) | 39 (4.1%) |
| $5,000 to $9,999 | 0 (0.0%) | 32 (3.4%) |
| $10,000 to $14,999 | 46 (3.1%) | 147 (15.5%) |
| $15,000 to $19,999 | 10 (0.7%) | 155 (16.4%) |
| $20,000 to $24,999 | 39 (2.6%) | 137 (14.4%) |
| $25,000 to $34,999 | 15 (1.0%) | 114 (12.0%) |
| $35,000 to $49,999 | 186 (12.6%) | 76 (8.0%) |
| $50,000 to $74,999 | 343 (23.2%) | 146 (15.4%) |
| $75,000 to $99,999 | 355 (24.0%) | 82 (8.6%) |
| $100,000 to $149,999 | 245 (16.5%) | 20 (2.1%) |
| $150,000 or more | 227 (15.3%) | 0 (0.0%) |
| Total | 1,481 (100.0%) | 948 (100.0%) |
Monthly Housing Cost Tiers in Sheridan
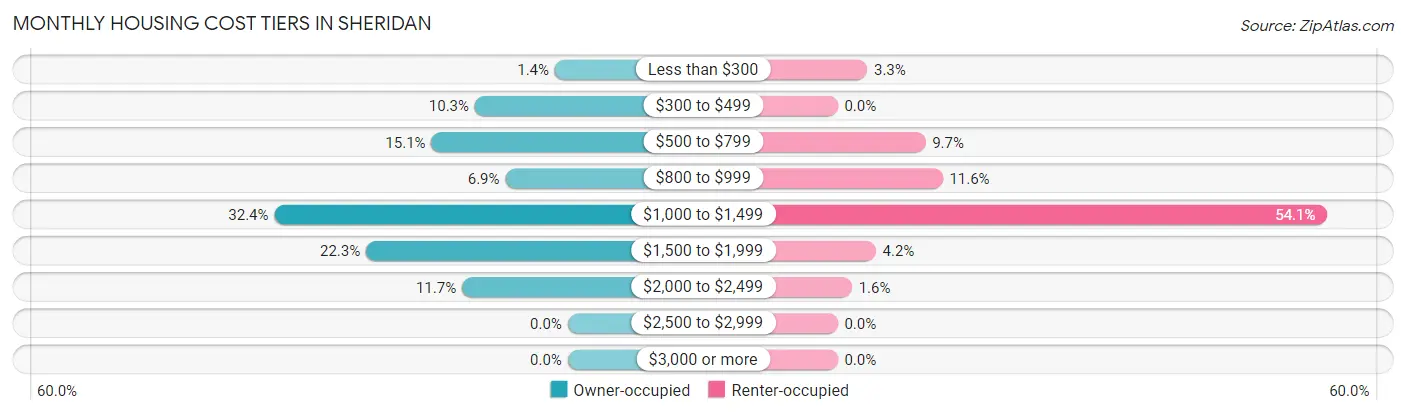
| Monthly Cost | Owner-occupied | Renter-occupied |
| Less than $300 | 21 (1.4%) | 31 (3.3%) |
| $300 to $499 | 152 (10.3%) | 0 (0.0%) |
| $500 to $799 | 223 (15.1%) | 92 (9.7%) |
| $800 to $999 | 102 (6.9%) | 110 (11.6%) |
| $1,000 to $1,499 | 480 (32.4%) | 513 (54.1%) |
| $1,500 to $1,999 | 330 (22.3%) | 40 (4.2%) |
| $2,000 to $2,499 | 173 (11.7%) | 15 (1.6%) |
| $2,500 to $2,999 | 0 (0.0%) | 0 (0.0%) |
| $3,000 or more | 0 (0.0%) | 0 (0.0%) |
| Total | 1,481 (100.0%) | 948 (100.0%) |
Physical Housing Characteristics in Sheridan
Housing Structures in Sheridan
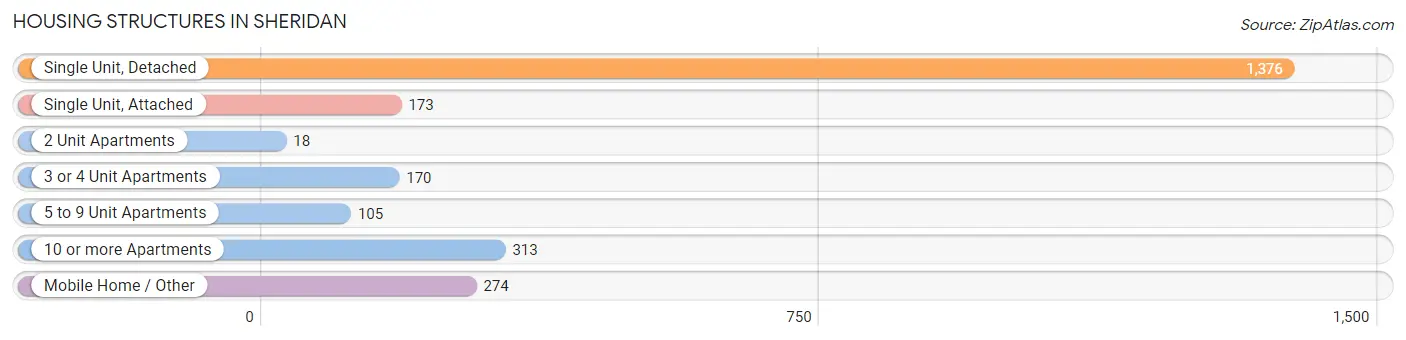
| Structure Type | # Housing Units | % Housing Units |
| Single Unit, Detached | 1,376 | 56.7% |
| Single Unit, Attached | 173 | 7.1% |
| 2 Unit Apartments | 18 | 0.7% |
| 3 or 4 Unit Apartments | 170 | 7.0% |
| 5 to 9 Unit Apartments | 105 | 4.3% |
| 10 or more Apartments | 313 | 12.9% |
| Mobile Home / Other | 274 | 11.3% |
| Total | 2,429 | 100.0% |
Housing Structures by Occupancy in Sheridan
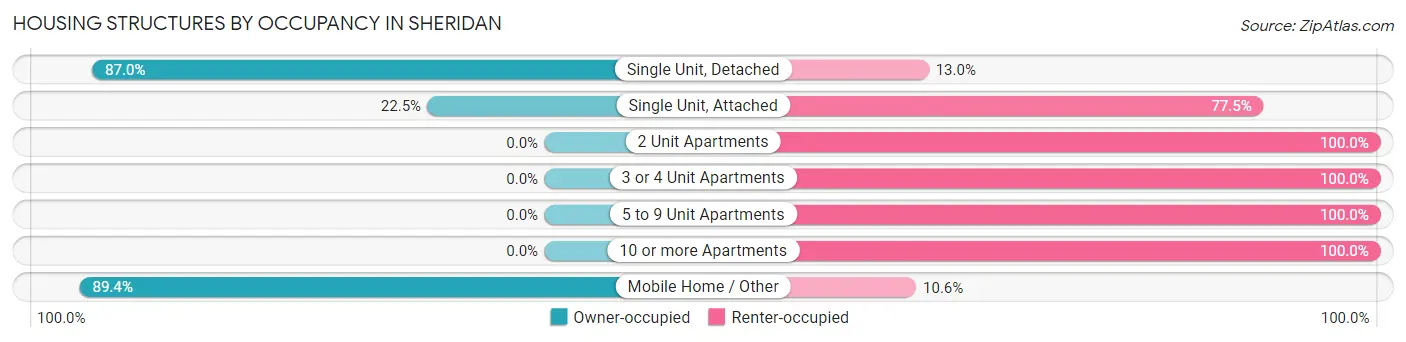
| Structure Type | Owner-occupied | Renter-occupied |
| Single Unit, Detached | 1,197 (87.0%) | 179 (13.0%) |
| Single Unit, Attached | 39 (22.5%) | 134 (77.5%) |
| 2 Unit Apartments | 0 (0.0%) | 18 (100.0%) |
| 3 or 4 Unit Apartments | 0 (0.0%) | 170 (100.0%) |
| 5 to 9 Unit Apartments | 0 (0.0%) | 105 (100.0%) |
| 10 or more Apartments | 0 (0.0%) | 313 (100.0%) |
| Mobile Home / Other | 245 (89.4%) | 29 (10.6%) |
| Total | 1,481 (61.0%) | 948 (39.0%) |
Housing Structures by Number of Rooms in Sheridan
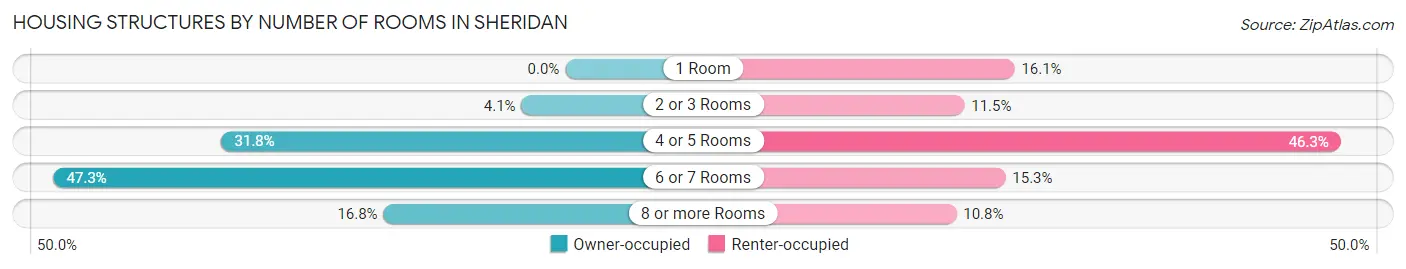
| Number of Rooms | Owner-occupied | Renter-occupied |
| 1 Room | 0 (0.0%) | 153 (16.1%) |
| 2 or 3 Rooms | 60 (4.1%) | 109 (11.5%) |
| 4 or 5 Rooms | 471 (31.8%) | 439 (46.3%) |
| 6 or 7 Rooms | 701 (47.3%) | 145 (15.3%) |
| 8 or more Rooms | 249 (16.8%) | 102 (10.8%) |
| Total | 1,481 (100.0%) | 948 (100.0%) |
Housing Structure by Heating Type in Sheridan
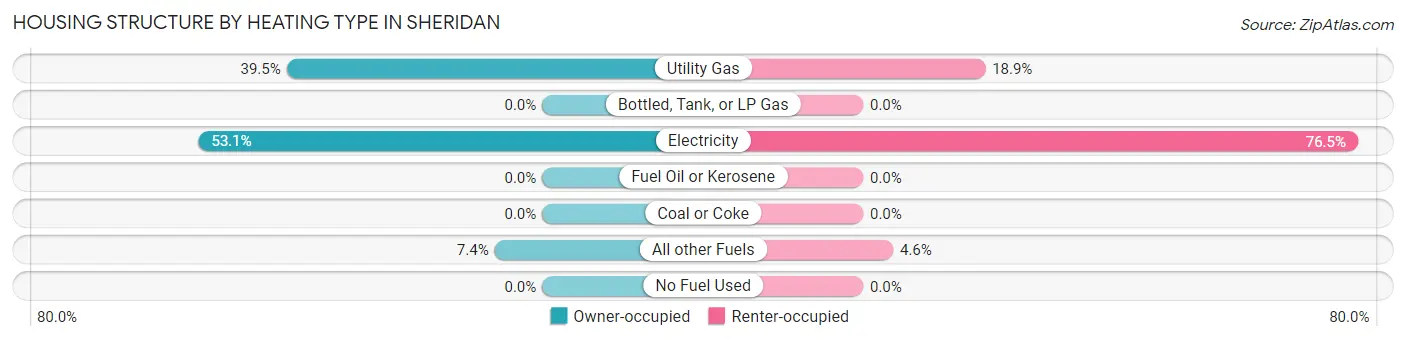
| Heating Type | Owner-occupied | Renter-occupied |
| Utility Gas | 585 (39.5%) | 179 (18.9%) |
| Bottled, Tank, or LP Gas | 0 (0.0%) | 0 (0.0%) |
| Electricity | 787 (53.1%) | 725 (76.5%) |
| Fuel Oil or Kerosene | 0 (0.0%) | 0 (0.0%) |
| Coal or Coke | 0 (0.0%) | 0 (0.0%) |
| All other Fuels | 109 (7.4%) | 44 (4.6%) |
| No Fuel Used | 0 (0.0%) | 0 (0.0%) |
| Total | 1,481 (100.0%) | 948 (100.0%) |
Household Vehicle Usage in Sheridan
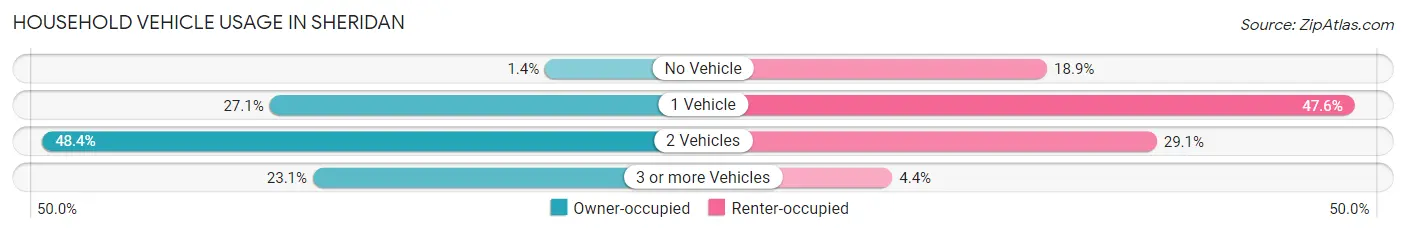
| Vehicles per Household | Owner-occupied | Renter-occupied |
| No Vehicle | 21 (1.4%) | 179 (18.9%) |
| 1 Vehicle | 402 (27.1%) | 451 (47.6%) |
| 2 Vehicles | 716 (48.3%) | 276 (29.1%) |
| 3 or more Vehicles | 342 (23.1%) | 42 (4.4%) |
| Total | 1,481 (100.0%) | 948 (100.0%) |
Real Estate & Mortgages in Sheridan
Real Estate and Mortgage Overview in Sheridan
| Characteristic | Without Mortgage | With Mortgage |
| Housing Units | 405 | 1,076 |
| Median Property Value | $265,000 | $259,300 |
| Median Household Income | $90,028 | $149 |
| Monthly Housing Costs | $557 | $0 |
| Real Estate Taxes | $2,115 | $0 |
Property Value by Mortgage Status in Sheridan
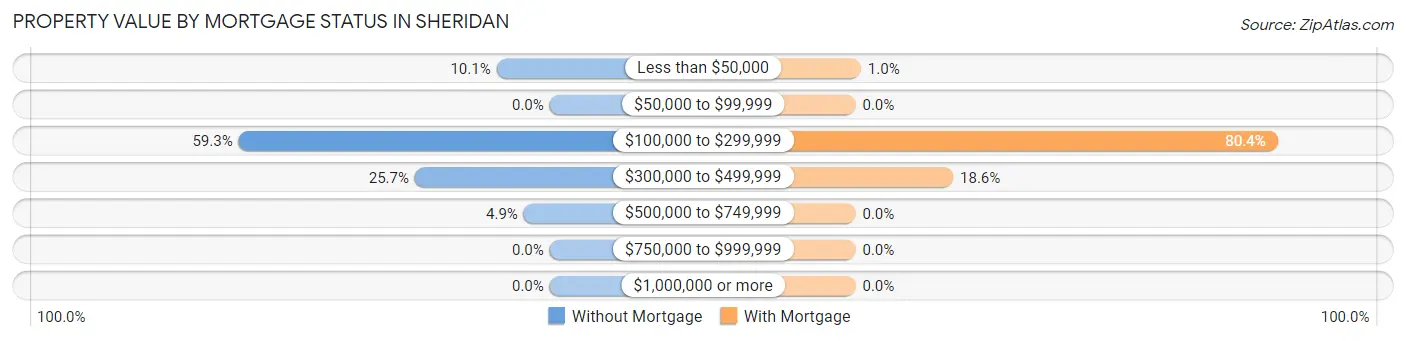
| Property Value | Without Mortgage | With Mortgage |
| Less than $50,000 | 41 (10.1%) | 11 (1.0%) |
| $50,000 to $99,999 | 0 (0.0%) | 0 (0.0%) |
| $100,000 to $299,999 | 240 (59.3%) | 865 (80.4%) |
| $300,000 to $499,999 | 104 (25.7%) | 200 (18.6%) |
| $500,000 to $749,999 | 20 (4.9%) | 0 (0.0%) |
| $750,000 to $999,999 | 0 (0.0%) | 0 (0.0%) |
| $1,000,000 or more | 0 (0.0%) | 0 (0.0%) |
| Total | 405 (100.0%) | 1,076 (100.0%) |
Household Income by Mortgage Status in Sheridan
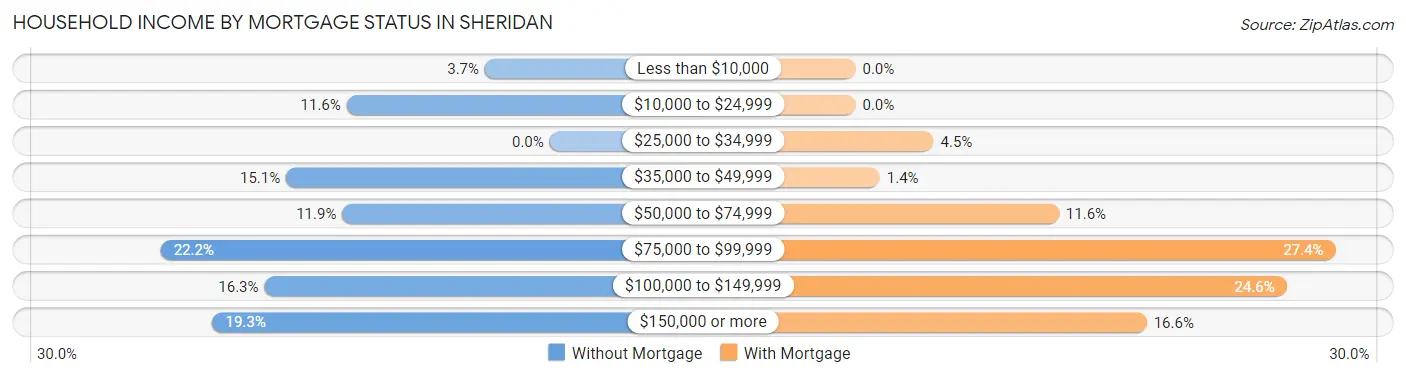
| Household Income | Without Mortgage | With Mortgage |
| Less than $10,000 | 15 (3.7%) | 0 (0.0%) |
| $10,000 to $24,999 | 47 (11.6%) | 0 (0.0%) |
| $25,000 to $34,999 | 0 (0.0%) | 48 (4.5%) |
| $35,000 to $49,999 | 61 (15.1%) | 15 (1.4%) |
| $50,000 to $74,999 | 48 (11.8%) | 125 (11.6%) |
| $75,000 to $99,999 | 90 (22.2%) | 295 (27.4%) |
| $100,000 to $149,999 | 66 (16.3%) | 265 (24.6%) |
| $150,000 or more | 78 (19.3%) | 179 (16.6%) |
| Total | 405 (100.0%) | 1,076 (100.0%) |
Property Value to Household Income Ratio in Sheridan
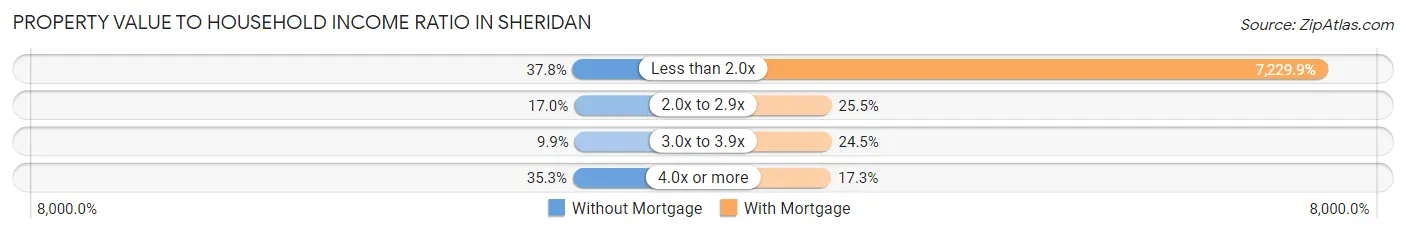
| Value-to-Income Ratio | Without Mortgage | With Mortgage |
| Less than 2.0x | 153 (37.8%) | 77,794 (7,229.9%) |
| 2.0x to 2.9x | 69 (17.0%) | 274 (25.5%) |
| 3.0x to 3.9x | 40 (9.9%) | 264 (24.5%) |
| 4.0x or more | 143 (35.3%) | 186 (17.3%) |
| Total | 405 (100.0%) | 1,076 (100.0%) |
Real Estate Taxes by Mortgage Status in Sheridan
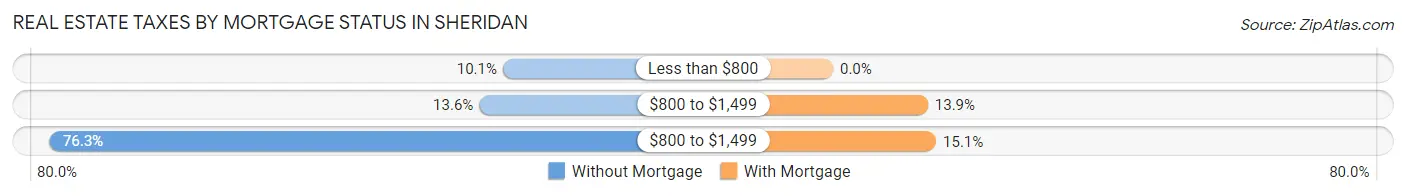
| Property Taxes | Without Mortgage | With Mortgage |
| Less than $800 | 41 (10.1%) | 0 (0.0%) |
| $800 to $1,499 | 55 (13.6%) | 149 (13.9%) |
| $800 to $1,499 | 309 (76.3%) | 162 (15.1%) |
| Total | 405 (100.0%) | 1,076 (100.0%) |
Health & Disability in Sheridan
Health Insurance Coverage by Age in Sheridan
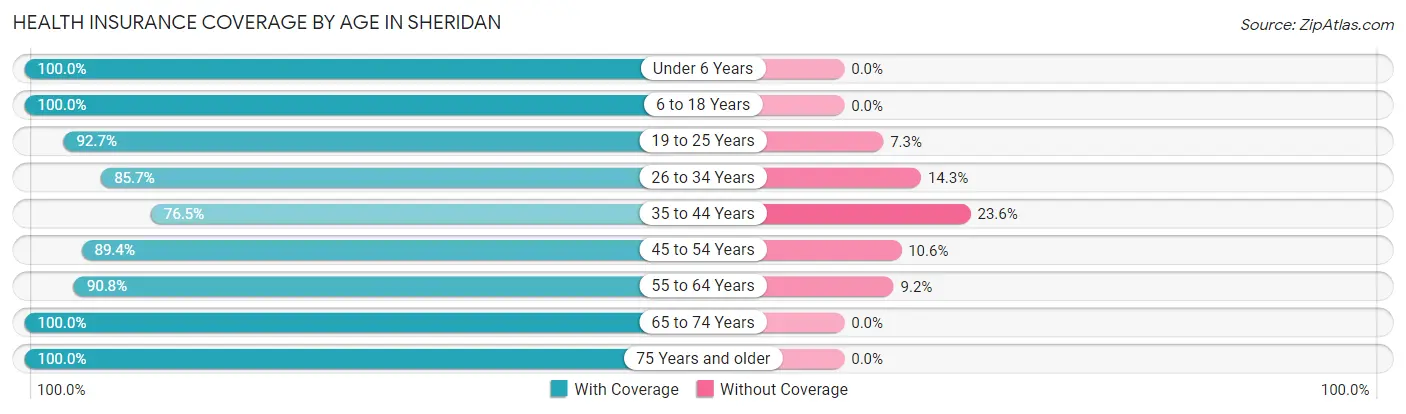
| Age Bracket | With Coverage | Without Coverage |
| Under 6 Years | 437 (100.0%) | 0 (0.0%) |
| 6 to 18 Years | 713 (100.0%) | 0 (0.0%) |
| 19 to 25 Years | 741 (92.7%) | 58 (7.3%) |
| 26 to 34 Years | 785 (85.7%) | 131 (14.3%) |
| 35 to 44 Years | 552 (76.4%) | 170 (23.5%) |
| 45 to 54 Years | 463 (89.4%) | 55 (10.6%) |
| 55 to 64 Years | 840 (90.8%) | 85 (9.2%) |
| 65 to 74 Years | 701 (100.0%) | 0 (0.0%) |
| 75 Years and older | 466 (100.0%) | 0 (0.0%) |
| Total | 5,698 (91.9%) | 499 (8.1%) |
Health Insurance Coverage by Citizenship Status in Sheridan
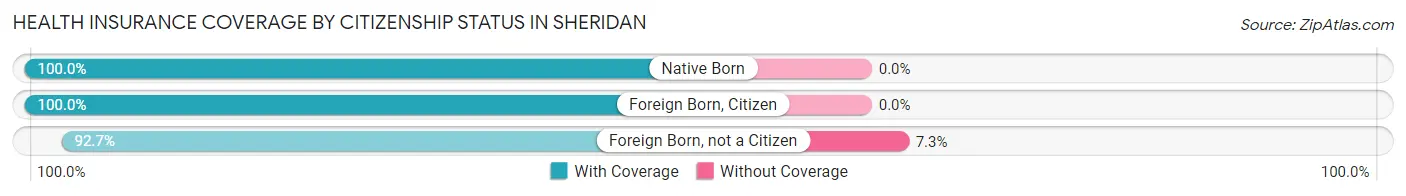
| Citizenship Status | With Coverage | Without Coverage |
| Native Born | 437 (100.0%) | 0 (0.0%) |
| Foreign Born, Citizen | 713 (100.0%) | 0 (0.0%) |
| Foreign Born, not a Citizen | 741 (92.7%) | 58 (7.3%) |
Health Insurance Coverage by Household Income in Sheridan
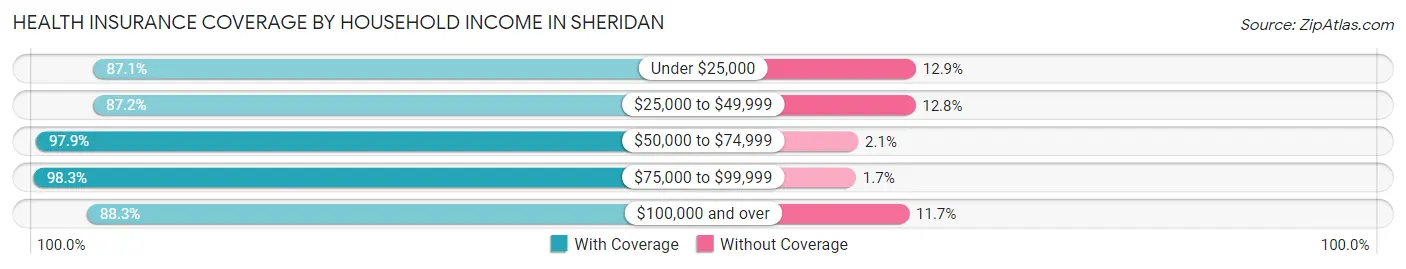
| Household Income | With Coverage | Without Coverage |
| Under $25,000 | 787 (87.1%) | 117 (12.9%) |
| $25,000 to $49,999 | 822 (87.2%) | 121 (12.8%) |
| $50,000 to $74,999 | 1,147 (97.9%) | 25 (2.1%) |
| $75,000 to $99,999 | 1,323 (98.3%) | 23 (1.7%) |
| $100,000 and over | 1,611 (88.3%) | 213 (11.7%) |
Public vs Private Health Insurance Coverage by Age in Sheridan
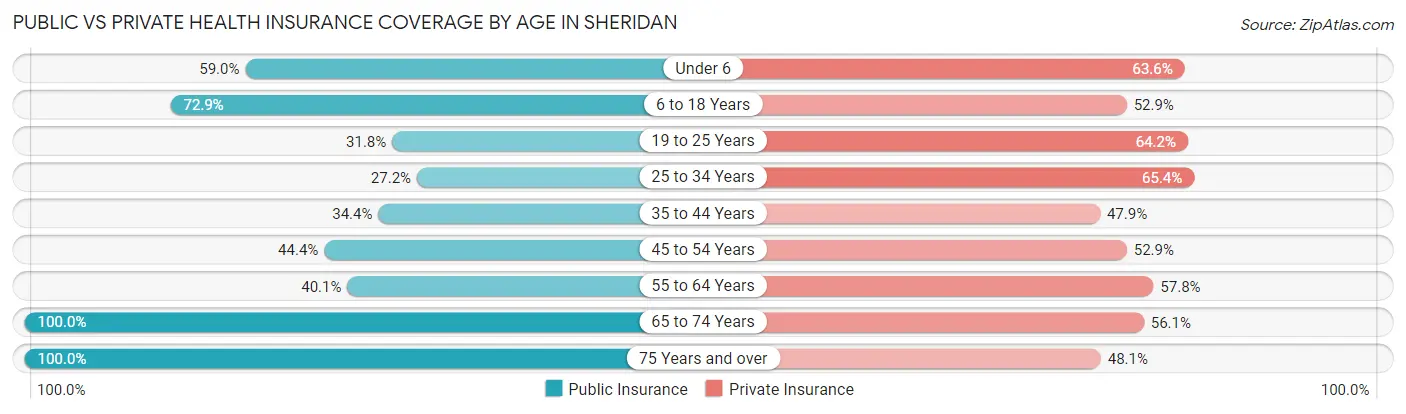
| Age Bracket | Public Insurance | Private Insurance |
| Under 6 | 258 (59.0%) | 278 (63.6%) |
| 6 to 18 Years | 520 (72.9%) | 377 (52.9%) |
| 19 to 25 Years | 254 (31.8%) | 513 (64.2%) |
| 25 to 34 Years | 249 (27.2%) | 599 (65.4%) |
| 35 to 44 Years | 248 (34.4%) | 346 (47.9%) |
| 45 to 54 Years | 230 (44.4%) | 274 (52.9%) |
| 55 to 64 Years | 371 (40.1%) | 535 (57.8%) |
| 65 to 74 Years | 701 (100.0%) | 393 (56.1%) |
| 75 Years and over | 466 (100.0%) | 224 (48.1%) |
| Total | 3,297 (53.2%) | 3,539 (57.1%) |
Disability Status by Sex by Age in Sheridan
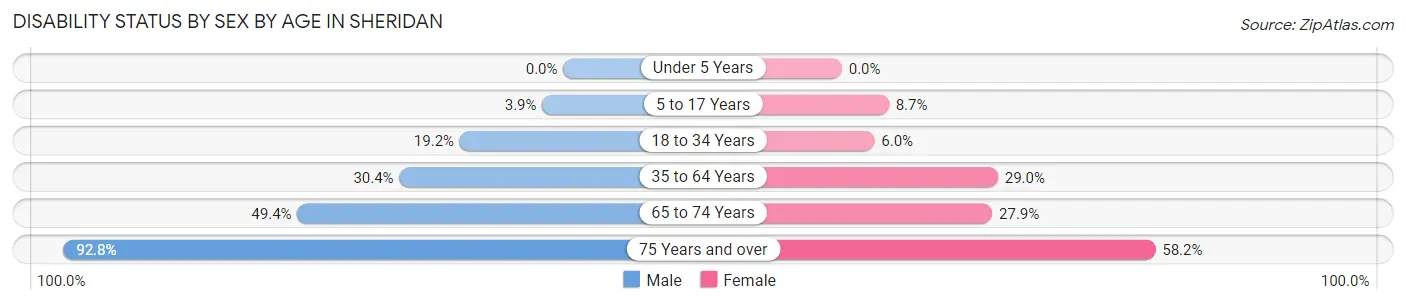
| Age Bracket | Male | Female |
| Under 5 Years | 0 (0.0%) | 0 (0.0%) |
| 5 to 17 Years | 21 (3.9%) | 25 (8.7%) |
| 18 to 34 Years | 148 (19.2%) | 59 (6.0%) |
| 35 to 64 Years | 355 (30.4%) | 289 (29.0%) |
| 65 to 74 Years | 116 (49.4%) | 130 (27.9%) |
| 75 Years and over | 155 (92.8%) | 174 (58.2%) |
Disability Class by Sex by Age in Sheridan
Disability Class: Hearing Difficulty
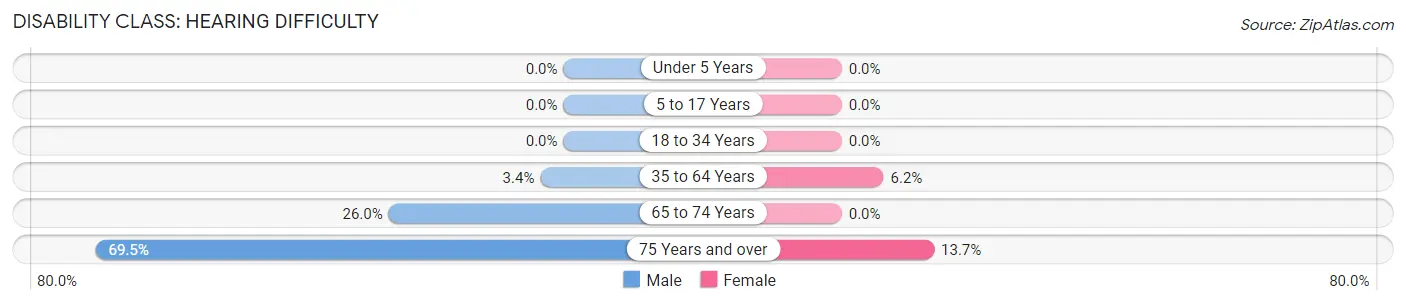
| Age Bracket | Male | Female |
| Under 5 Years | 0 (0.0%) | 0 (0.0%) |
| 5 to 17 Years | 0 (0.0%) | 0 (0.0%) |
| 18 to 34 Years | 0 (0.0%) | 0 (0.0%) |
| 35 to 64 Years | 40 (3.4%) | 62 (6.2%) |
| 65 to 74 Years | 61 (26.0%) | 0 (0.0%) |
| 75 Years and over | 116 (69.5%) | 41 (13.7%) |
Disability Class: Vision Difficulty
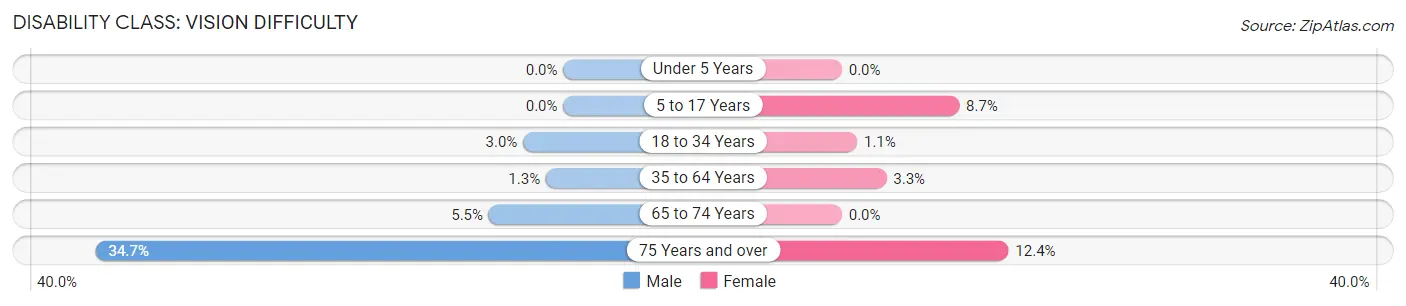
| Age Bracket | Male | Female |
| Under 5 Years | 0 (0.0%) | 0 (0.0%) |
| 5 to 17 Years | 0 (0.0%) | 25 (8.7%) |
| 18 to 34 Years | 23 (3.0%) | 11 (1.1%) |
| 35 to 64 Years | 15 (1.3%) | 33 (3.3%) |
| 65 to 74 Years | 13 (5.5%) | 0 (0.0%) |
| 75 Years and over | 58 (34.7%) | 37 (12.4%) |
Disability Class: Cognitive Difficulty
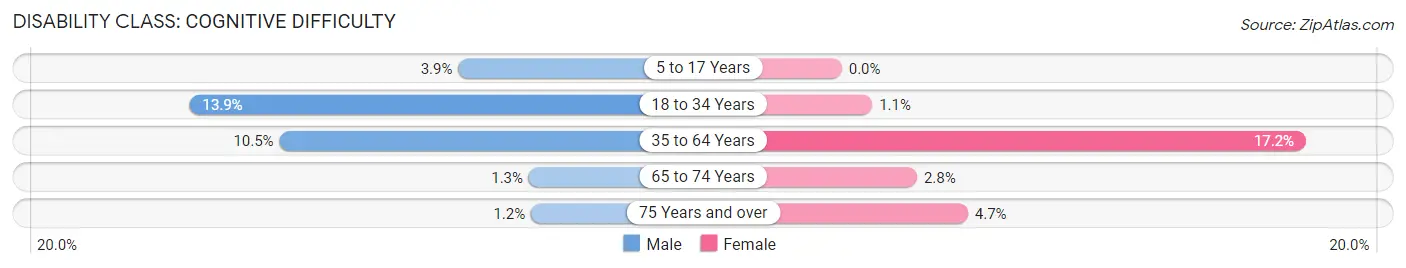
| Age Bracket | Male | Female |
| 5 to 17 Years | 21 (3.9%) | 0 (0.0%) |
| 18 to 34 Years | 107 (13.9%) | 11 (1.1%) |
| 35 to 64 Years | 123 (10.5%) | 172 (17.2%) |
| 65 to 74 Years | 3 (1.3%) | 13 (2.8%) |
| 75 Years and over | 2 (1.2%) | 14 (4.7%) |
Disability Class: Ambulatory Difficulty
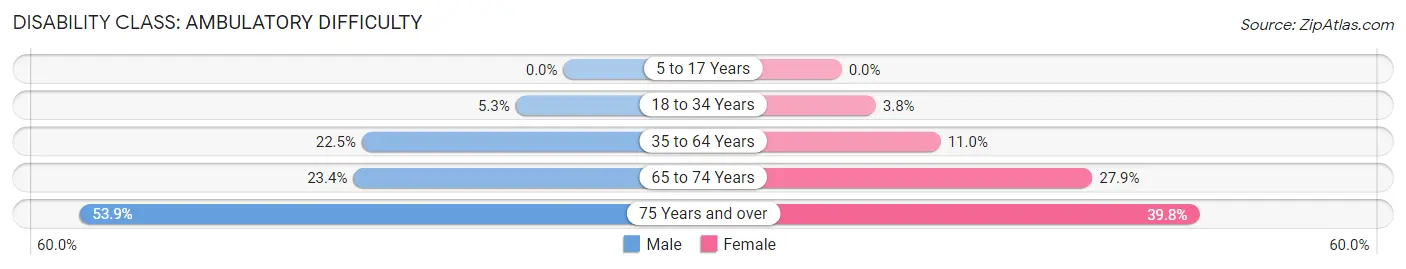
| Age Bracket | Male | Female |
| 5 to 17 Years | 0 (0.0%) | 0 (0.0%) |
| 18 to 34 Years | 41 (5.3%) | 37 (3.8%) |
| 35 to 64 Years | 262 (22.5%) | 110 (11.0%) |
| 65 to 74 Years | 55 (23.4%) | 130 (27.9%) |
| 75 Years and over | 90 (53.9%) | 119 (39.8%) |
Disability Class: Self-Care Difficulty
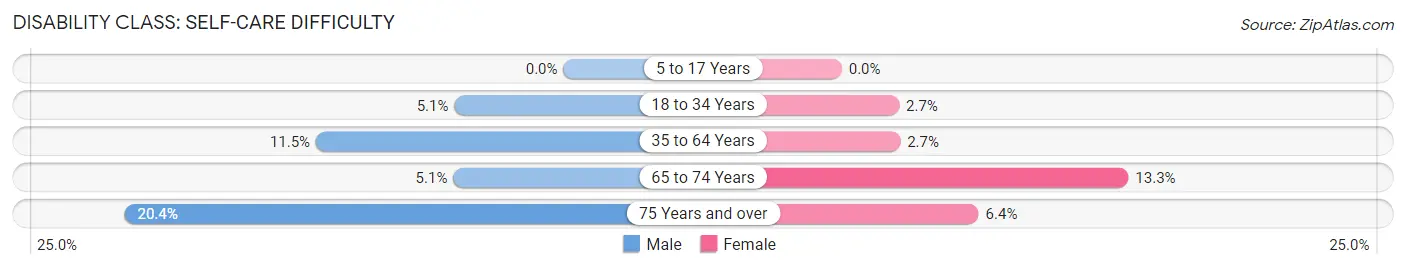
| Age Bracket | Male | Female |
| 5 to 17 Years | 0 (0.0%) | 0 (0.0%) |
| 18 to 34 Years | 39 (5.1%) | 26 (2.7%) |
| 35 to 64 Years | 134 (11.5%) | 27 (2.7%) |
| 65 to 74 Years | 12 (5.1%) | 62 (13.3%) |
| 75 Years and over | 34 (20.4%) | 19 (6.4%) |
Technology Access in Sheridan
Computing Device Access in Sheridan
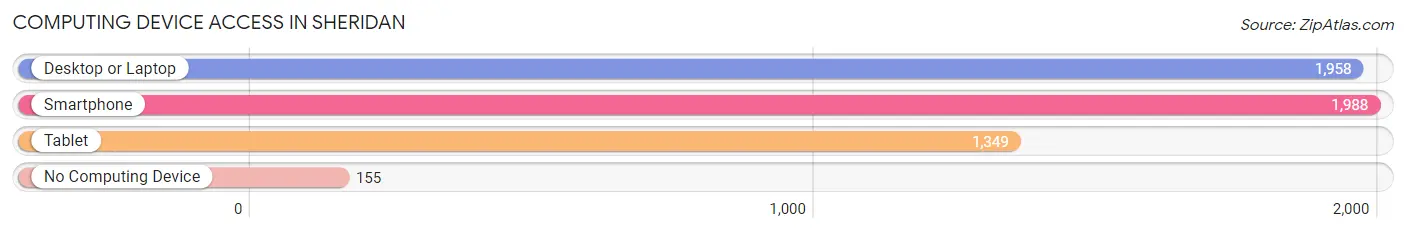
| Device Type | # Households | % Households |
| Desktop or Laptop | 1,958 | 80.6% |
| Smartphone | 1,988 | 81.8% |
| Tablet | 1,349 | 55.5% |
| No Computing Device | 155 | 6.4% |
| Total | 2,429 | 100.0% |
Internet Access in Sheridan
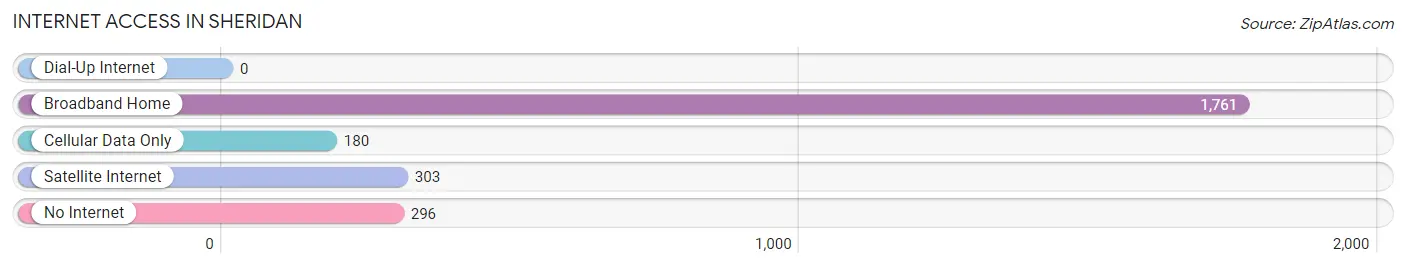
| Internet Type | # Households | % Households |
| Dial-Up Internet | 0 | 0.0% |
| Broadband Home | 1,761 | 72.5% |
| Cellular Data Only | 180 | 7.4% |
| Satellite Internet | 303 | 12.5% |
| No Internet | 296 | 12.2% |
| Total | 2,429 | 100.0% |
Sheridan Summary
Sheridan, Oregon is a small city located in Yamhill County, Oregon, United States. It is situated on the banks of the Yamhill River, approximately 25 miles southwest of Portland. The city has a population of approximately 5,000 people and is part of the Portland metropolitan area.
History
Sheridan was founded in 1851 by a group of settlers from the Oregon Trail. The city was named after the nearby Sheridan Creek, which was named after the Civil War General Philip Sheridan. The city was originally a farming community, but in the late 19th century, it became a center for logging and lumber production. The city was incorporated in 1891 and has since grown to become a small city.
Geography
Sheridan is located in the Willamette Valley, which is a fertile agricultural region in the Pacific Northwest. The city is situated on the banks of the Yamhill River, which is a tributary of the Willamette River. The city is surrounded by rolling hills and is located in the foothills of the Coast Range. The city has a total area of 2.3 square miles, all of which is land.
Economy
Sheridan’s economy is largely based on agriculture and timber production. The city is home to several wineries and vineyards, as well as a number of small businesses. The city is also home to a number of manufacturing companies, including a paper mill and a furniture factory. The city is also home to a number of retail stores, restaurants, and other services.
Demographics
As of the 2010 census, the population of Sheridan was 5,039. The racial makeup of the city was 91.2% White, 0.7% African American, 0.7% Native American, 0.7% Asian, 0.2% Pacific Islander, 4.2% from other races, and 2.1% from two or more races. Hispanic or Latino of any race were 8.2% of the population.
The median income for a household in the city was $41,944, and the median income for a family was $50,917. The per capita income for the city was $20,945. About 11.2% of families and 14.2% of the population were below the poverty line, including 19.2% of those under age 18 and 8.2% of those age 65 or over.
Sheridan is a small city with a rich history and a diverse economy. The city is home to a number of small businesses, wineries, and manufacturing companies, as well as a number of retail stores and restaurants. The city has a diverse population and a median income that is slightly higher than the national average.
Common Questions
What is Per Capita Income in Sheridan?
Per Capita income in Sheridan is $31,053.
What is the Median Family Income in Sheridan?
Median Family Income in Sheridan is $74,887.
What is the Median Household income in Sheridan?
Median Household Income in Sheridan is $56,989.
What is Income or Wage Gap in Sheridan?
Income or Wage Gap in Sheridan is 39.6%.
Women in Sheridan earn 60.4 cents for every dollar earned by a man.
What is Inequality or Gini Index in Sheridan?
Inequality or Gini Index in Sheridan is 0.45.
What is the Total Population of Sheridan?
Total Population of Sheridan is 6,237.
What is the Total Male Population of Sheridan?
Total Male Population of Sheridan is 3,086.
What is the Total Female Population of Sheridan?
Total Female Population of Sheridan is 3,151.
What is the Ratio of Males per 100 Females in Sheridan?
There are 97.94 Males per 100 Females in Sheridan.
What is the Ratio of Females per 100 Males in Sheridan?
There are 102.11 Females per 100 Males in Sheridan.
What is the Median Population Age in Sheridan?
Median Population Age in Sheridan is 38.9 Years.
What is the Average Family Size in Sheridan
Average Family Size in Sheridan is 3.2 People.
What is the Average Household Size in Sheridan
Average Household Size in Sheridan is 2.5 People.
How Large is the Labor Force in Sheridan?
There are 3,102 People in the Labor Forcein in Sheridan.
What is the Percentage of People in the Labor Force in Sheridan?
58.4% of People are in the Labor Force in Sheridan.
What is the Unemployment Rate in Sheridan?
Unemployment Rate in Sheridan is 6.8%.