Mount Hood, OR Map & Demographics
Mount Hood Map
Mount Hood Overview
$49,263
PER CAPITA INCOME
$95,789
AVG FAMILY INCOME
$86,459
AVG HOUSEHOLD INCOME
19.3%
WAGE / INCOME GAP [ % ]
80.7¢/ $1
WAGE / INCOME GAP [ $ ]
0.42
INEQUALITY / GINI INDEX
4,663
TOTAL POPULATION
2,539
MALE POPULATION
2,124
FEMALE POPULATION
119.54
MALES / 100 FEMALES
83.65
FEMALES / 100 MALES
49.8
MEDIAN AGE
2.8
AVG FAMILY SIZE
2.2
AVG HOUSEHOLD SIZE
2,485
LABOR FORCE [ PEOPLE ]
61.3%
PERCENT IN LABOR FORCE
4.7%
UNEMPLOYMENT RATE
Income in Mount Hood
Income Overview in Mount Hood
Per Capita Income in Mount Hood is $49,263, while median incomes of families and households are $95,789 and $86,459 respectively.
| Characteristic | Number | Measure |
| Per Capita Income | 4,663 | $49,263 |
| Median Family Income | 1,208 | $95,789 |
| Mean Family Income | 1,208 | $123,442 |
| Median Household Income | 2,074 | $86,459 |
| Mean Household Income | 2,074 | $108,618 |
| Income Deficit | 1,208 | $0 |
| Wage / Income Gap (%) | 4,663 | 19.31% |
| Wage / Income Gap ($) | 4,663 | 80.69¢ per $1 |
| Gini / Inequality Index | 4,663 | 0.42 |
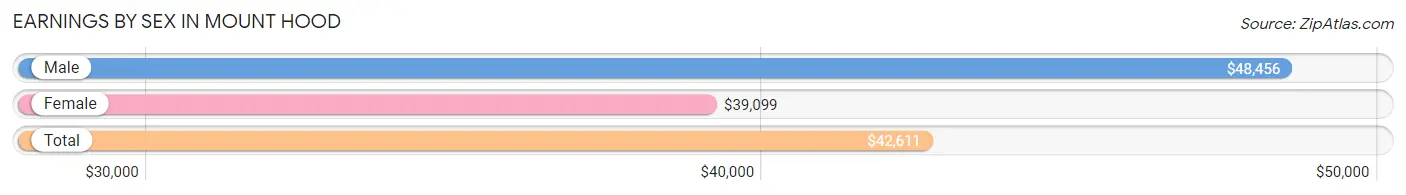
Earnings by Sex in Mount Hood
Average Earnings in Mount Hood are $42,611, $48,456 for men and $39,099 for women, a difference of 19.3%.
| Sex | Number | Average Earnings |
| Male | 1,443 (54.5%) | $48,456 |
| Female | 1,203 (45.5%) | $39,099 |
| Total | 2,646 (100.0%) | $42,611 |
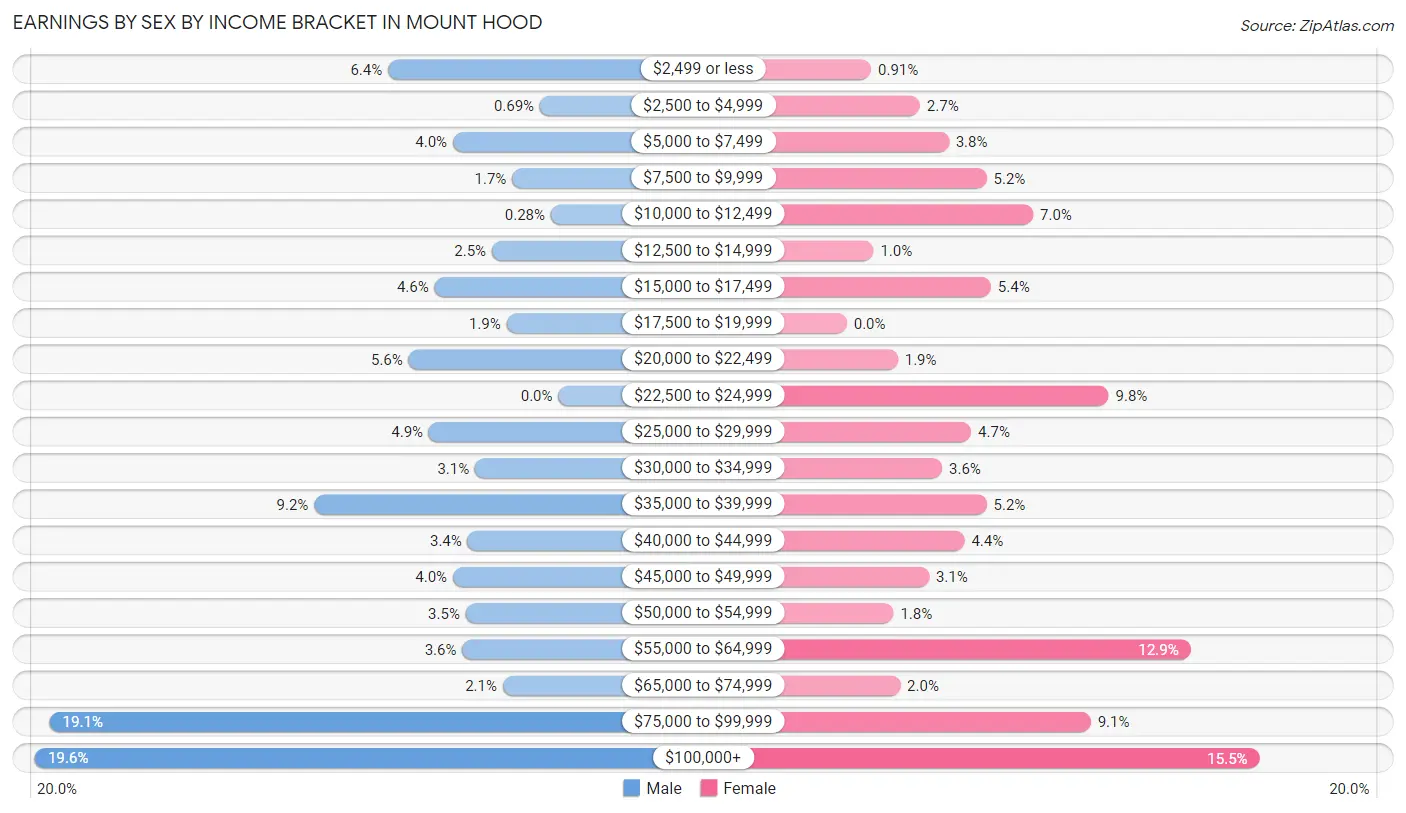
Earnings by Sex by Income Bracket in Mount Hood
The most common earnings brackets in Mount Hood are $100,000+ for men (283 | 19.6%) and $100,000+ for women (186 | 15.5%).
| Income | Male | Female |
| $2,499 or less | 92 (6.4%) | 11 (0.9%) |
| $2,500 to $4,999 | 10 (0.7%) | 33 (2.7%) |
| $5,000 to $7,499 | 57 (4.0%) | 46 (3.8%) |
| $7,500 to $9,999 | 25 (1.7%) | 63 (5.2%) |
| $10,000 to $12,499 | 4 (0.3%) | 84 (7.0%) |
| $12,500 to $14,999 | 36 (2.5%) | 12 (1.0%) |
| $15,000 to $17,499 | 67 (4.6%) | 65 (5.4%) |
| $17,500 to $19,999 | 28 (1.9%) | 0 (0.0%) |
| $20,000 to $22,499 | 81 (5.6%) | 23 (1.9%) |
| $22,500 to $24,999 | 0 (0.0%) | 118 (9.8%) |
| $25,000 to $29,999 | 70 (4.9%) | 56 (4.7%) |
| $30,000 to $34,999 | 45 (3.1%) | 43 (3.6%) |
| $35,000 to $39,999 | 132 (9.1%) | 63 (5.2%) |
| $40,000 to $44,999 | 49 (3.4%) | 53 (4.4%) |
| $45,000 to $49,999 | 57 (4.0%) | 37 (3.1%) |
| $50,000 to $54,999 | 50 (3.5%) | 21 (1.8%) |
| $55,000 to $64,999 | 52 (3.6%) | 155 (12.9%) |
| $65,000 to $74,999 | 30 (2.1%) | 24 (2.0%) |
| $75,000 to $99,999 | 275 (19.1%) | 110 (9.1%) |
| $100,000+ | 283 (19.6%) | 186 (15.5%) |
| Total | 1,443 (100.0%) | 1,203 (100.0%) |
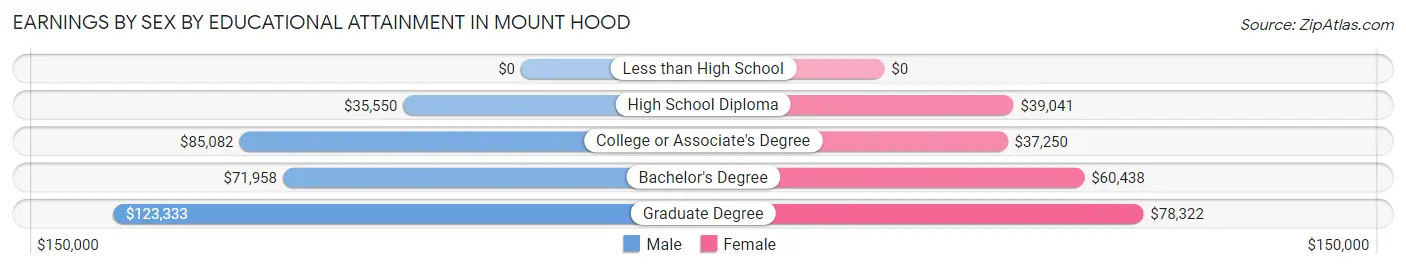
Earnings by Sex by Educational Attainment in Mount Hood
Average earnings in Mount Hood are $53,508 for men and $46,339 for women, a difference of 13.4%. Men with an educational attainment of graduate degree enjoy the highest average annual earnings of $123,333, while those with high school diploma education earn the least with $35,550. Women with an educational attainment of graduate degree earn the most with the average annual earnings of $78,322, while those with college or associate's degree education have the smallest earnings of $37,250.
| Educational Attainment | Male Income | Female Income |
| Less than High School | - | - |
| High School Diploma | $35,550 | $39,041 |
| College or Associate's Degree | $85,082 | $37,250 |
| Bachelor's Degree | $71,958 | $60,438 |
| Graduate Degree | $123,333 | $78,322 |
| Total | $53,508 | $46,339 |
Family Income in Mount Hood
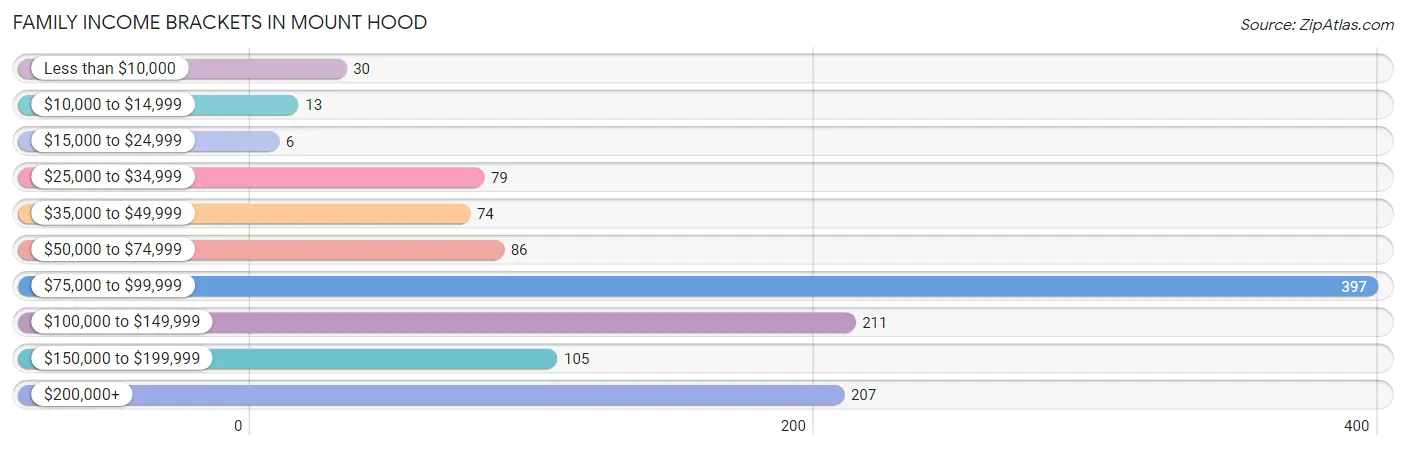
Family Income Brackets in Mount Hood
According to the Mount Hood family income data, there are 397 families falling into the $75,000 to $99,999 income range, which is the most common income bracket and makes up 32.9% of all families. Conversely, the $15,000 to $24,999 income bracket is the least frequent group with only 6 families (0.5%) belonging to this category.
| Income Bracket | # Families | % Families |
| Less than $10,000 | 30 | 2.5% |
| $10,000 to $14,999 | 13 | 1.1% |
| $15,000 to $24,999 | 6 | 0.5% |
| $25,000 to $34,999 | 79 | 6.5% |
| $35,000 to $49,999 | 74 | 6.1% |
| $50,000 to $74,999 | 86 | 7.1% |
| $75,000 to $99,999 | 397 | 32.9% |
| $100,000 to $149,999 | 211 | 17.5% |
| $150,000 to $199,999 | 105 | 8.7% |
| $200,000+ | 207 | 17.1% |
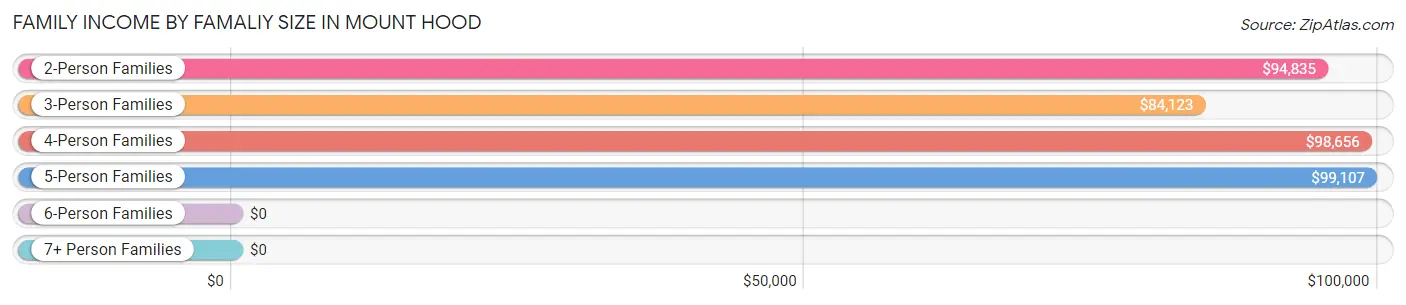
Family Income by Famaliy Size in Mount Hood
5-person families (66 | 5.5%) account for the highest median family income in Mount Hood with $99,107 per family, while 2-person families (718 | 59.4%) have the highest median income of $47,418 per family member.
| Income Bracket | # Families | Median Income |
| 2-Person Families | 718 (59.4%) | $94,835 |
| 3-Person Families | 270 (22.4%) | $84,123 |
| 4-Person Families | 119 (9.9%) | $98,656 |
| 5-Person Families | 66 (5.5%) | $99,107 |
| 6-Person Families | 22 (1.8%) | $0 |
| 7+ Person Families | 13 (1.1%) | $0 |
| Total | 1,208 (100.0%) | $95,789 |
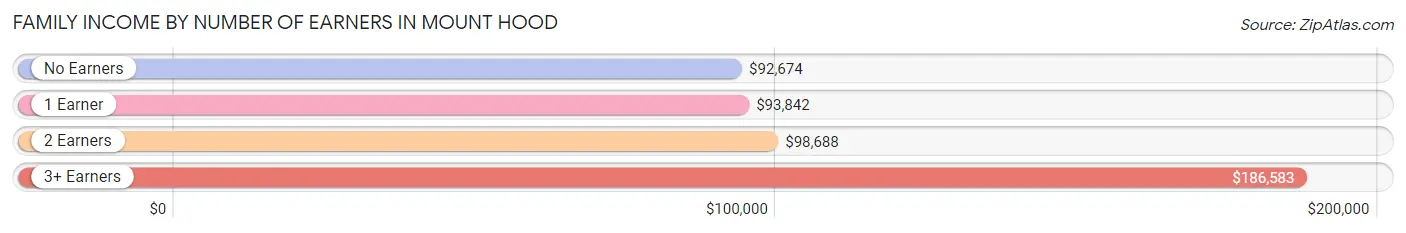
Family Income by Number of Earners in Mount Hood
The median family income in Mount Hood is $95,789, with families comprising 3+ earners (117) having the highest median family income of $186,583, while families with no earners (284) have the lowest median family income of $92,674, accounting for 9.7% and 23.5% of families, respectively.
| Number of Earners | # Families | Median Income |
| No Earners | 284 (23.5%) | $92,674 |
| 1 Earner | 309 (25.6%) | $93,842 |
| 2 Earners | 498 (41.2%) | $98,688 |
| 3+ Earners | 117 (9.7%) | $186,583 |
| Total | 1,208 (100.0%) | $95,789 |
Household Income in Mount Hood
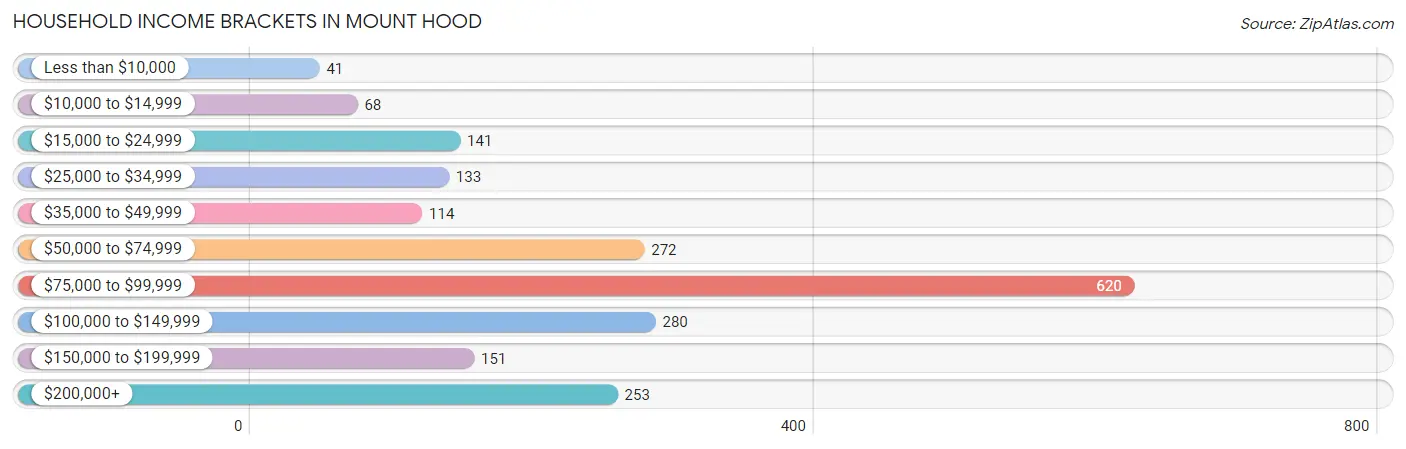
Household Income Brackets in Mount Hood
With 620 households falling in the category, the $75,000 to $99,999 income range is the most frequent in Mount Hood, accounting for 29.9% of all households. In contrast, only 41 households (2.0%) fall into the less than $10,000 income bracket, making it the least populous group.
| Income Bracket | # Households | % Households |
| Less than $10,000 | 41 | 2.0% |
| $10,000 to $14,999 | 68 | 3.3% |
| $15,000 to $24,999 | 141 | 6.8% |
| $25,000 to $34,999 | 133 | 6.4% |
| $35,000 to $49,999 | 114 | 5.5% |
| $50,000 to $74,999 | 272 | 13.1% |
| $75,000 to $99,999 | 620 | 29.9% |
| $100,000 to $149,999 | 280 | 13.5% |
| $150,000 to $199,999 | 151 | 7.3% |
| $200,000+ | 253 | 12.2% |
Household Income by Householder Age in Mount Hood
The median household income in Mount Hood is $86,459, with the highest median household income of $110,819 found in the 25 to 44 years age bracket for the primary householder. A total of 411 households (19.8%) fall into this category. Meanwhile, the 15 to 24 years age bracket for the primary householder has the lowest median household income of $0, with 58 households (2.8%) in this group.
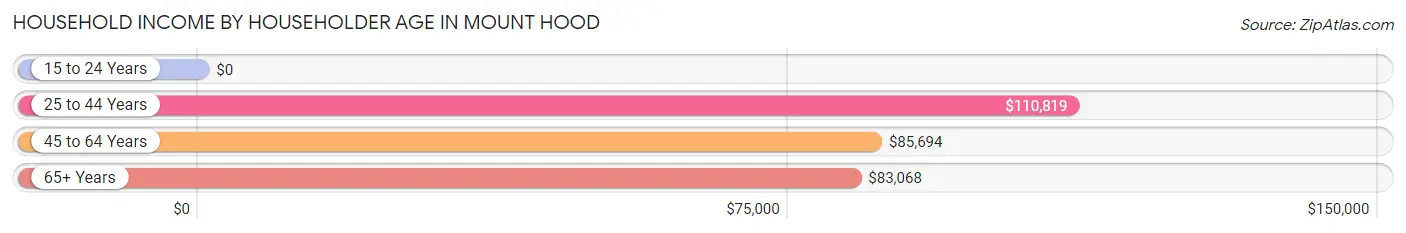
| Income Bracket | # Households | Median Income |
| 15 to 24 Years | 58 (2.8%) | $0 |
| 25 to 44 Years | 411 (19.8%) | $110,819 |
| 45 to 64 Years | 878 (42.3%) | $85,694 |
| 65+ Years | 727 (35.0%) | $83,068 |
| Total | 2,074 (100.0%) | $86,459 |
Poverty in Mount Hood
Income Below Poverty by Sex and Age in Mount Hood
With 6.6% poverty level for males and 11.5% for females among the residents of Mount Hood, 15 year old males and 5 year old females are the most vulnerable to poverty, with 8 males (100.0%) and 22 females (73.3%) in their respective age groups living below the poverty level.
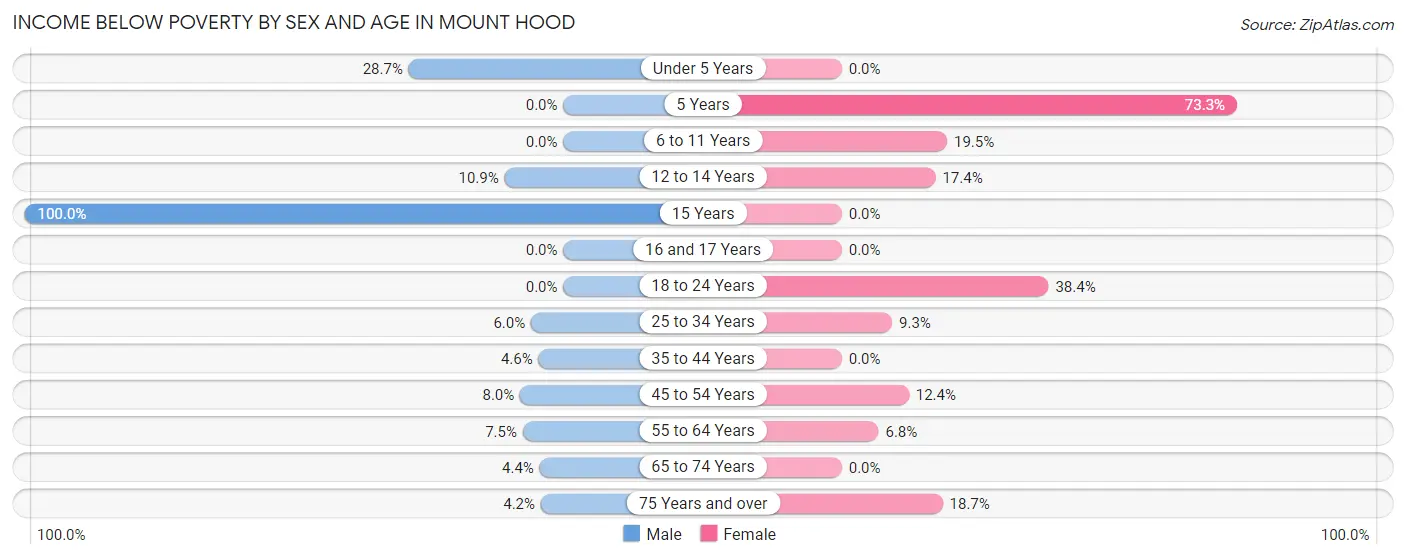
| Age Bracket | Male | Female |
| Under 5 Years | 31 (28.7%) | 0 (0.0%) |
| 5 Years | 0 (0.0%) | 22 (73.3%) |
| 6 to 11 Years | 0 (0.0%) | 33 (19.5%) |
| 12 to 14 Years | 6 (10.9%) | 8 (17.4%) |
| 15 Years | 8 (100.0%) | 0 (0.0%) |
| 16 and 17 Years | 0 (0.0%) | 0 (0.0%) |
| 18 to 24 Years | 0 (0.0%) | 66 (38.4%) |
| 25 to 34 Years | 15 (6.0%) | 27 (9.3%) |
| 35 to 44 Years | 10 (4.6%) | 0 (0.0%) |
| 45 to 54 Years | 38 (8.0%) | 42 (12.4%) |
| 55 to 64 Years | 30 (7.5%) | 15 (6.8%) |
| 65 to 74 Years | 18 (4.4%) | 0 (0.0%) |
| 75 Years and over | 9 (4.2%) | 32 (18.7%) |
| Total | 165 (6.6%) | 245 (11.5%) |
Income Above Poverty by Sex and Age in Mount Hood
According to the poverty statistics in Mount Hood, males aged 6 to 11 years and females aged under 5 years are the age groups that are most secure financially, with 100.0% of males and 100.0% of females in these age groups living above the poverty line.
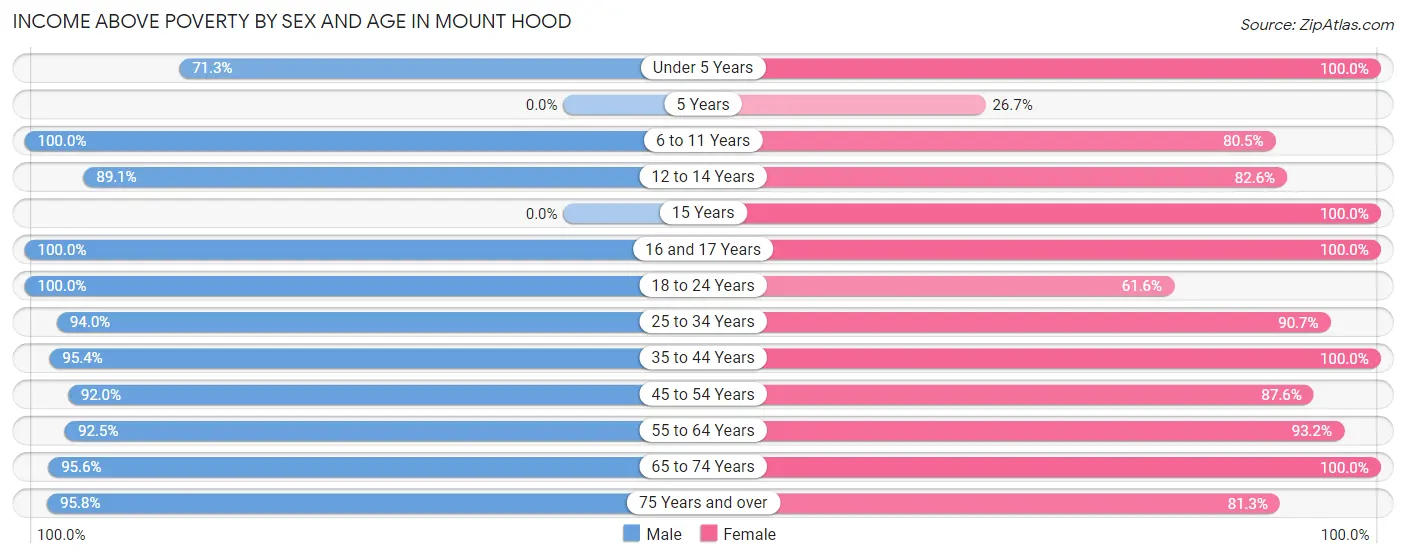
| Age Bracket | Male | Female |
| Under 5 Years | 77 (71.3%) | 70 (100.0%) |
| 5 Years | 0 (0.0%) | 8 (26.7%) |
| 6 to 11 Years | 86 (100.0%) | 136 (80.5%) |
| 12 to 14 Years | 49 (89.1%) | 38 (82.6%) |
| 15 Years | 0 (0.0%) | 13 (100.0%) |
| 16 and 17 Years | 77 (100.0%) | 22 (100.0%) |
| 18 to 24 Years | 215 (100.0%) | 106 (61.6%) |
| 25 to 34 Years | 235 (94.0%) | 262 (90.7%) |
| 35 to 44 Years | 207 (95.4%) | 209 (100.0%) |
| 45 to 54 Years | 436 (92.0%) | 296 (87.6%) |
| 55 to 64 Years | 369 (92.5%) | 205 (93.2%) |
| 65 to 74 Years | 392 (95.6%) | 375 (100.0%) |
| 75 Years and over | 207 (95.8%) | 139 (81.3%) |
| Total | 2,350 (93.4%) | 1,879 (88.5%) |
Income Below Poverty Among Married-Couple Families in Mount Hood
The poverty statistics for married-couple families in Mount Hood show that 4.1% or 43 of the total 1,043 families live below the poverty line. Families with 5 or more children have the highest poverty rate of 100.0%, comprising of 13 families. On the other hand, families with 1 or 2 children have the lowest poverty rate of 0.0%, which includes 0 families.
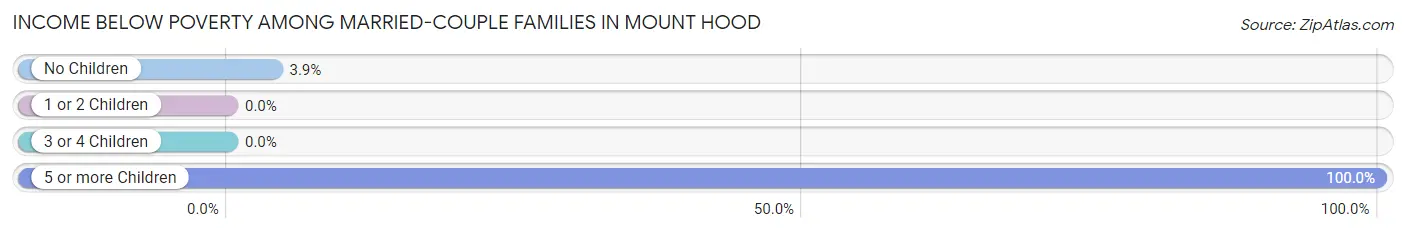
| Children | Above Poverty | Below Poverty |
| No Children | 746 (96.1%) | 30 (3.9%) |
| 1 or 2 Children | 197 (100.0%) | 0 (0.0%) |
| 3 or 4 Children | 57 (100.0%) | 0 (0.0%) |
| 5 or more Children | 0 (0.0%) | 13 (100.0%) |
| Total | 1,000 (95.9%) | 43 (4.1%) |
Income Below Poverty Among Single-Parent Households in Mount Hood
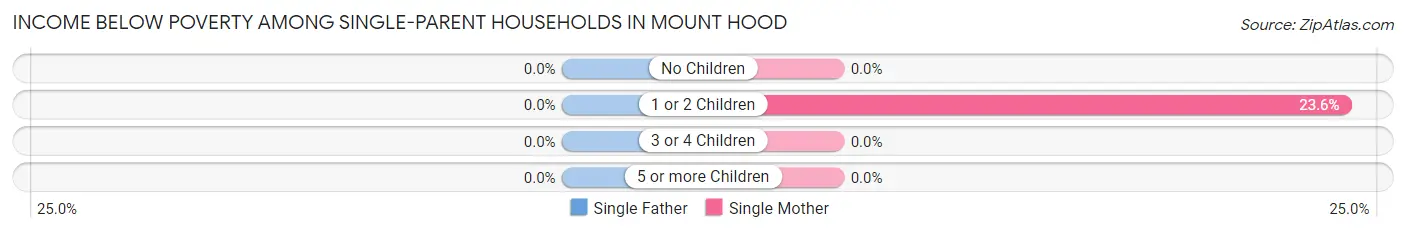
| Children | Single Father | Single Mother |
| No Children | 0 (0.0%) | 0 (0.0%) |
| 1 or 2 Children | 0 (0.0%) | 13 (23.6%) |
| 3 or 4 Children | 0 (0.0%) | 0 (0.0%) |
| 5 or more Children | 0 (0.0%) | 0 (0.0%) |
| Total | 0 (0.0%) | 13 (9.4%) |
Income Below Poverty Among Married-Couple vs Single-Parent Households in Mount Hood
The poverty data for Mount Hood shows that 43 of the married-couple family households (4.1%) and 13 of the single-parent households (7.9%) are living below the poverty level. Within the married-couple family households, those with 5 or more children have the highest poverty rate, with 13 households (100.0%) falling below the poverty line. Among the single-parent households, those with 1 or 2 children have the highest poverty rate, with 13 household (19.4%) living below poverty.
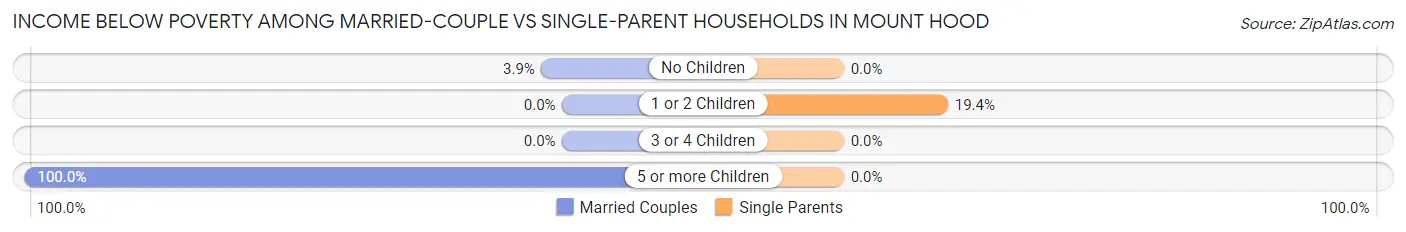
| Children | Married-Couple Families | Single-Parent Households |
| No Children | 30 (3.9%) | 0 (0.0%) |
| 1 or 2 Children | 0 (0.0%) | 13 (19.4%) |
| 3 or 4 Children | 0 (0.0%) | 0 (0.0%) |
| 5 or more Children | 13 (100.0%) | 0 (0.0%) |
| Total | 43 (4.1%) | 13 (7.9%) |
Race in Mount Hood
The most populous races in Mount Hood are White / Caucasian (4,270 | 91.6%), Two or more Races (309 | 6.6%), and Hispanic or Latino (207 | 4.4%).
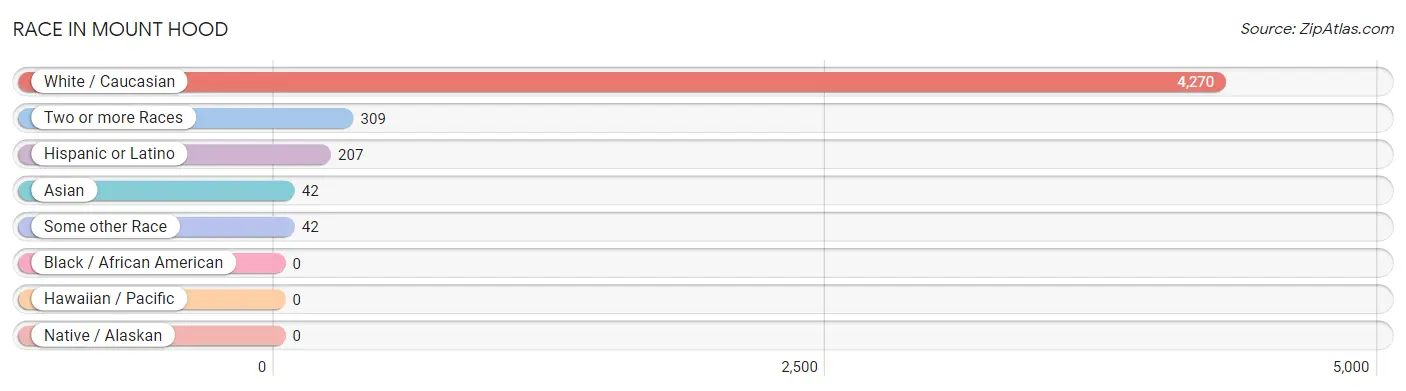
| Race | # Population | % Population |
| Asian | 42 | 0.9% |
| Black / African American | 0 | 0.0% |
| Hawaiian / Pacific | 0 | 0.0% |
| Hispanic or Latino | 207 | 4.4% |
| Native / Alaskan | 0 | 0.0% |
| White / Caucasian | 4,270 | 91.6% |
| Two or more Races | 309 | 6.6% |
| Some other Race | 42 | 0.9% |
| Total | 4,663 | 100.0% |
Ancestry in Mount Hood
The most populous ancestries reported in Mount Hood are English (1,012 | 21.7%), German (985 | 21.1%), Irish (714 | 15.3%), Italian (393 | 8.4%), and American (296 | 6.4%), together accounting for 72.9% of all Mount Hood residents.
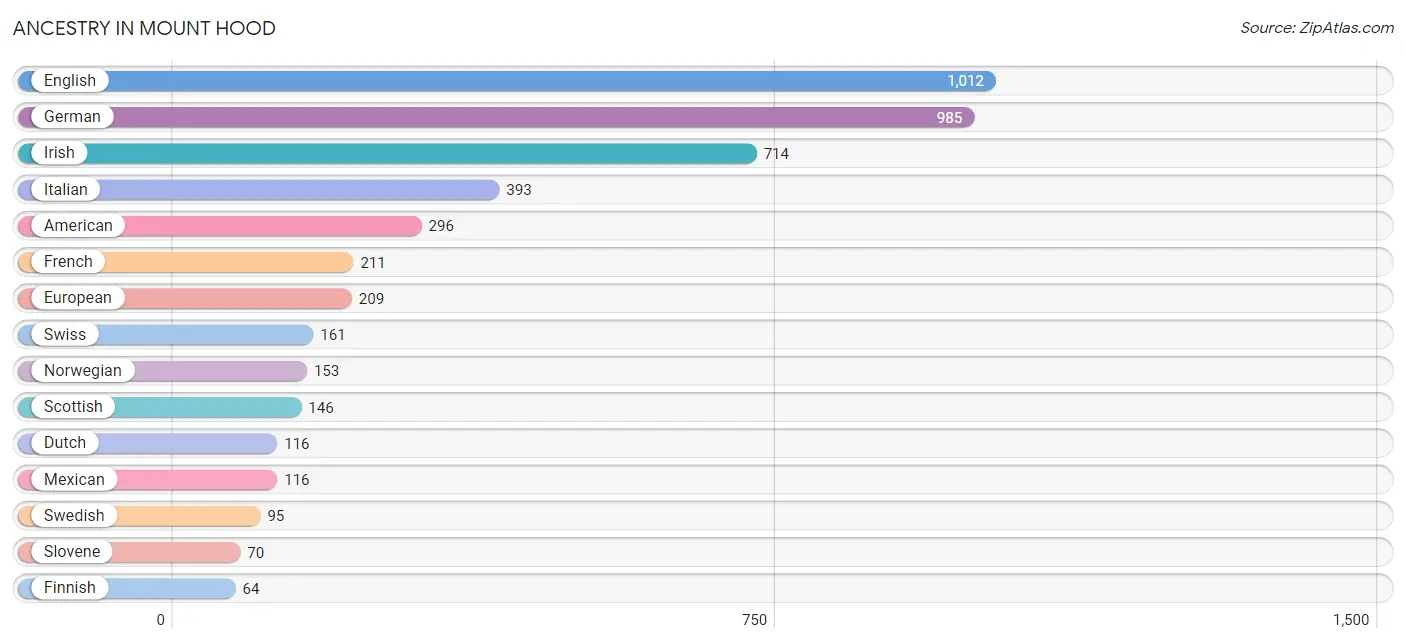
| Ancestry | # Population | % Population |
| American | 296 | 6.4% |
| Belgian | 5 | 0.1% |
| Bhutanese | 8 | 0.2% |
| British | 9 | 0.2% |
| Canadian | 7 | 0.2% |
| Czech | 17 | 0.4% |
| Danish | 42 | 0.9% |
| Dutch | 116 | 2.5% |
| Eastern European | 23 | 0.5% |
| English | 1,012 | 21.7% |
| European | 209 | 4.5% |
| Finnish | 64 | 1.4% |
| French | 211 | 4.5% |
| German | 985 | 21.1% |
| Indian (Asian) | 55 | 1.2% |
| Inupiat | 8 | 0.2% |
| Irish | 714 | 15.3% |
| Italian | 393 | 8.4% |
| Mexican | 116 | 2.5% |
| Norwegian | 153 | 3.3% |
| Polish | 39 | 0.8% |
| Portuguese | 27 | 0.6% |
| Puerto Rican | 36 | 0.8% |
| Russian | 58 | 1.2% |
| Scandinavian | 21 | 0.4% |
| Scotch-Irish | 11 | 0.2% |
| Scottish | 146 | 3.1% |
| Sioux | 18 | 0.4% |
| Slavic | 62 | 1.3% |
| Slovene | 70 | 1.5% |
| Spaniard | 18 | 0.4% |
| Spanish | 37 | 0.8% |
| Swedish | 95 | 2.0% |
| Swiss | 161 | 3.5% |
| Welsh | 48 | 1.0% |
| Yugoslavian | 26 | 0.6% | View All 36 Rows |
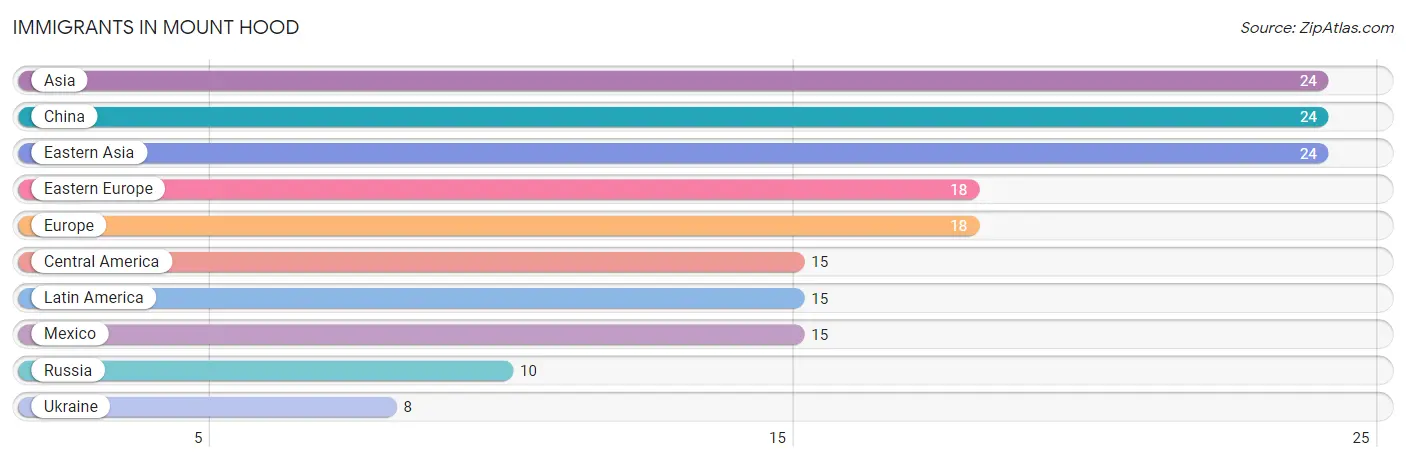
Immigrants in Mount Hood
The most numerous immigrant groups reported in Mount Hood came from Asia (24 | 0.5%), China (24 | 0.5%), Eastern Asia (24 | 0.5%), Eastern Europe (18 | 0.4%), and Europe (18 | 0.4%), together accounting for 2.3% of all Mount Hood residents.
| Immigration Origin | # Population | % Population |
| Asia | 24 | 0.5% |
| Central America | 15 | 0.3% |
| China | 24 | 0.5% |
| Eastern Asia | 24 | 0.5% |
| Eastern Europe | 18 | 0.4% |
| Europe | 18 | 0.4% |
| Latin America | 15 | 0.3% |
| Mexico | 15 | 0.3% |
| Russia | 10 | 0.2% |
| Ukraine | 8 | 0.2% | View All 10 Rows |
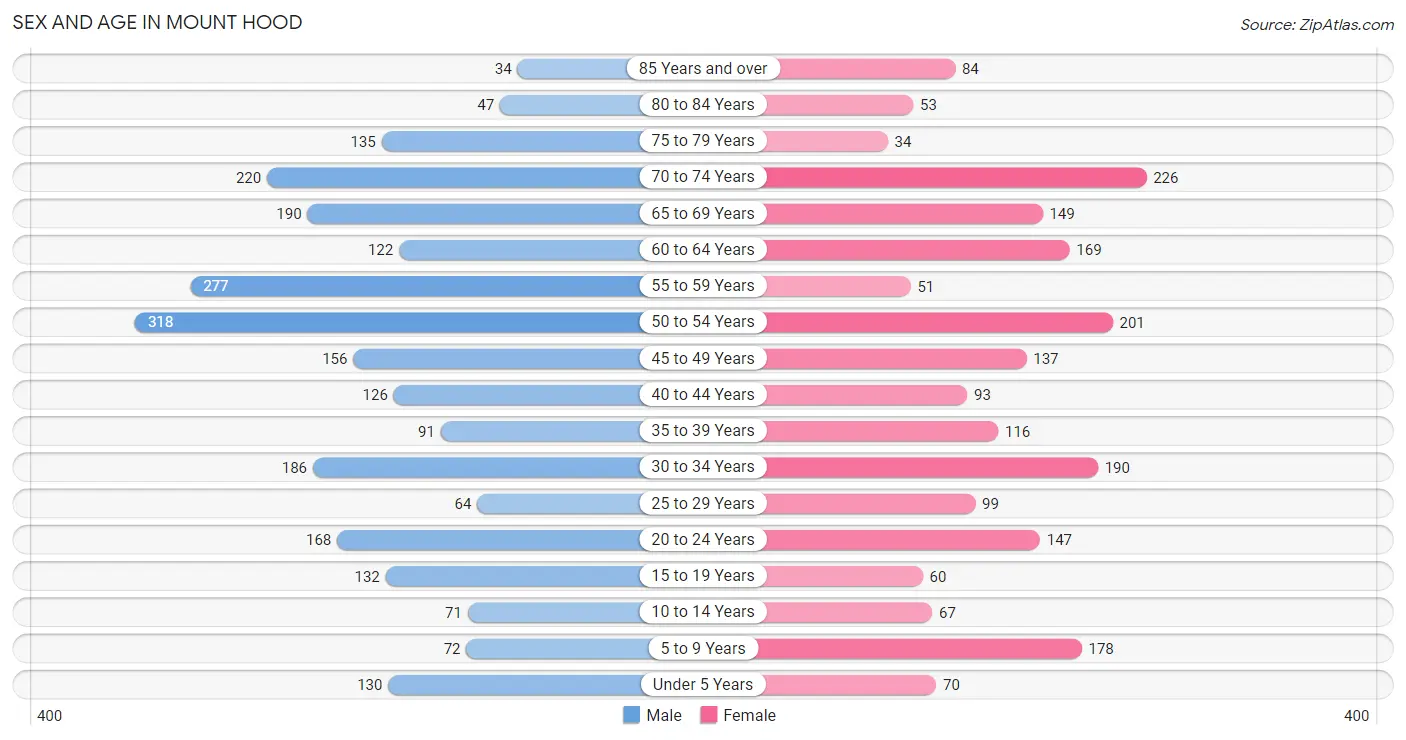
Sex and Age in Mount Hood
Sex and Age in Mount Hood
The most populous age groups in Mount Hood are 50 to 54 Years (318 | 12.5%) for men and 70 to 74 Years (226 | 10.6%) for women.
| Age Bracket | Male | Female |
| Under 5 Years | 130 (5.1%) | 70 (3.3%) |
| 5 to 9 Years | 72 (2.8%) | 178 (8.4%) |
| 10 to 14 Years | 71 (2.8%) | 67 (3.2%) |
| 15 to 19 Years | 132 (5.2%) | 60 (2.8%) |
| 20 to 24 Years | 168 (6.6%) | 147 (6.9%) |
| 25 to 29 Years | 64 (2.5%) | 99 (4.7%) |
| 30 to 34 Years | 186 (7.3%) | 190 (8.9%) |
| 35 to 39 Years | 91 (3.6%) | 116 (5.5%) |
| 40 to 44 Years | 126 (5.0%) | 93 (4.4%) |
| 45 to 49 Years | 156 (6.1%) | 137 (6.5%) |
| 50 to 54 Years | 318 (12.5%) | 201 (9.5%) |
| 55 to 59 Years | 277 (10.9%) | 51 (2.4%) |
| 60 to 64 Years | 122 (4.8%) | 169 (8.0%) |
| 65 to 69 Years | 190 (7.5%) | 149 (7.0%) |
| 70 to 74 Years | 220 (8.7%) | 226 (10.6%) |
| 75 to 79 Years | 135 (5.3%) | 34 (1.6%) |
| 80 to 84 Years | 47 (1.8%) | 53 (2.5%) |
| 85 Years and over | 34 (1.3%) | 84 (4.0%) |
| Total | 2,539 (100.0%) | 2,124 (100.0%) |
Families and Households in Mount Hood
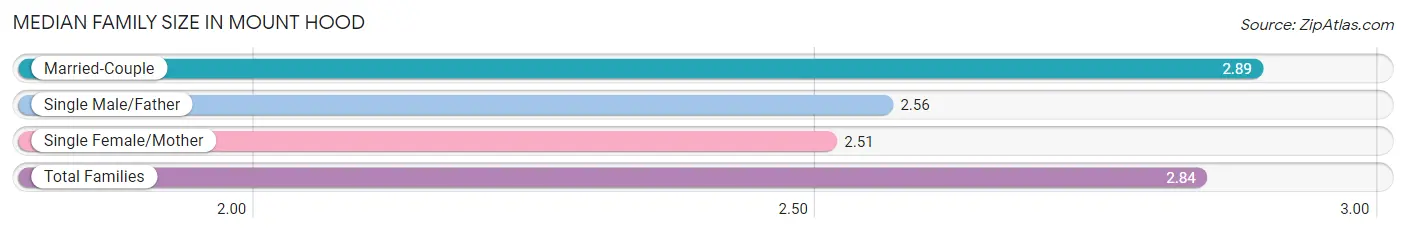
Median Family Size in Mount Hood
The median family size in Mount Hood is 2.84 persons per family, with married-couple families (1,043 | 86.3%) accounting for the largest median family size of 2.89 persons per family. On the other hand, single female/mother families (138 | 11.4%) represent the smallest median family size with 2.51 persons per family.
| Family Type | # Families | Family Size |
| Married-Couple | 1,043 (86.3%) | 2.89 |
| Single Male/Father | 27 (2.2%) | 2.56 |
| Single Female/Mother | 138 (11.4%) | 2.51 |
| Total Families | 1,208 (100.0%) | 2.84 |
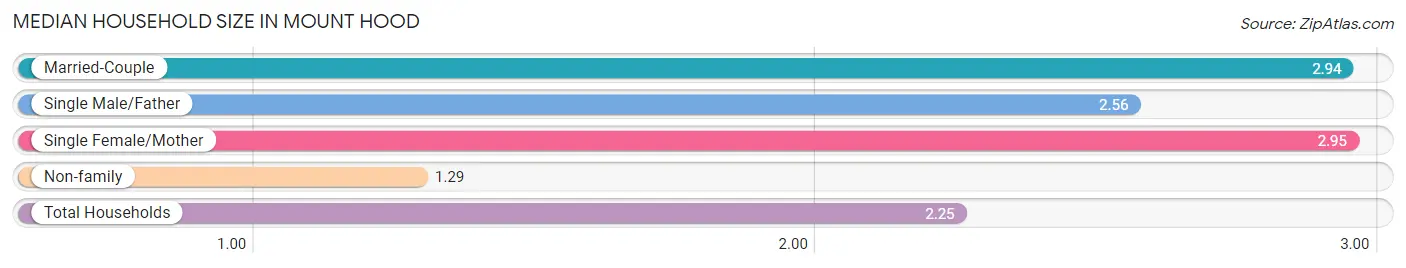
Median Household Size in Mount Hood
The median household size in Mount Hood is 2.25 persons per household, with single female/mother households (138 | 6.7%) accounting for the largest median household size of 2.95 persons per household. non-family households (866 | 41.8%) represent the smallest median household size with 1.29 persons per household.
| Household Type | # Households | Household Size |
| Married-Couple | 1,043 (50.3%) | 2.94 |
| Single Male/Father | 27 (1.3%) | 2.56 |
| Single Female/Mother | 138 (6.7%) | 2.95 |
| Non-family | 866 (41.8%) | 1.29 |
| Total Households | 2,074 (100.0%) | 2.25 |
Household Size by Marriage Status in Mount Hood
Out of a total of 2,074 households in Mount Hood, 1,208 (58.2%) are family households, while 866 (41.8%) are nonfamily households. The most numerous type of family households are 2-person households, comprising 653, and the most common type of nonfamily households are 1-person households, comprising 647.
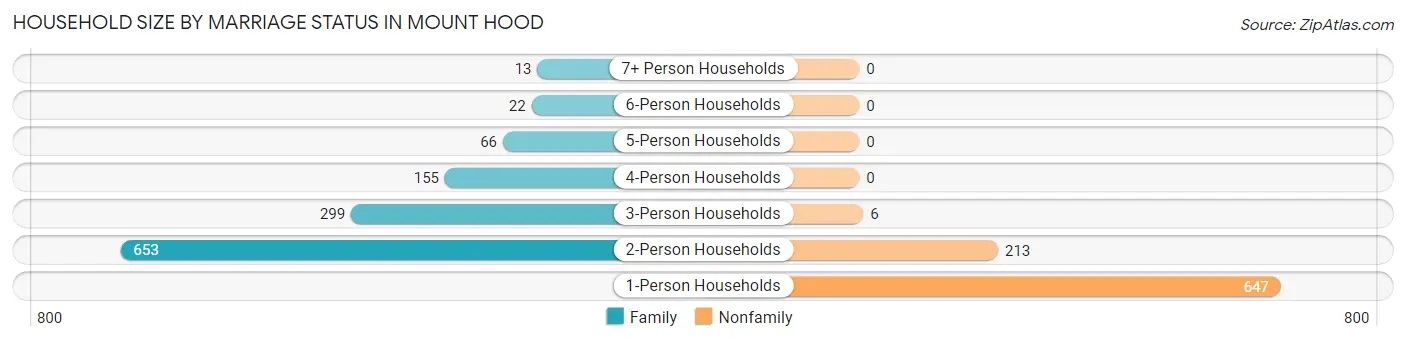
| Household Size | Family Households | Nonfamily Households |
| 1-Person Households | - | 647 (31.2%) |
| 2-Person Households | 653 (31.5%) | 213 (10.3%) |
| 3-Person Households | 299 (14.4%) | 6 (0.3%) |
| 4-Person Households | 155 (7.5%) | 0 (0.0%) |
| 5-Person Households | 66 (3.2%) | 0 (0.0%) |
| 6-Person Households | 22 (1.1%) | 0 (0.0%) |
| 7+ Person Households | 13 (0.6%) | 0 (0.0%) |
| Total | 1,208 (58.2%) | 866 (41.8%) |
Female Fertility in Mount Hood
Fertility by Age in Mount Hood
Average fertility rate in Mount Hood is 57.0 births per 1,000 women. Women in the age bracket of 20 to 34 years have the highest fertility rate with 117.0 births per 1,000 women. Women in the age bracket of 20 to 34 years acount for 100.0% of all women with births.
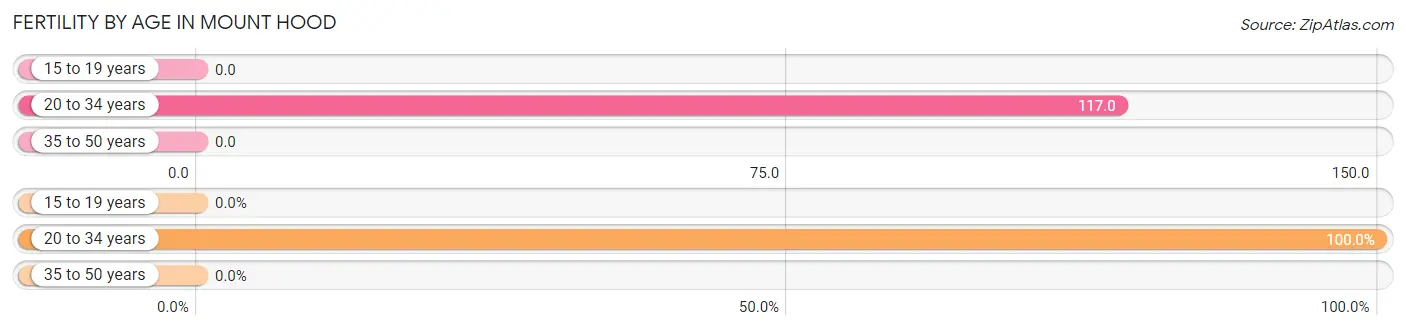
| Age Bracket | Women with Births | Births / 1,000 Women |
| 15 to 19 years | 0 (0.0%) | 0.0 |
| 20 to 34 years | 51 (100.0%) | 117.0 |
| 35 to 50 years | 0 (0.0%) | 0.0 |
| Total | 51 (100.0%) | 57.0 |
Fertility by Age by Marriage Status in Mount Hood
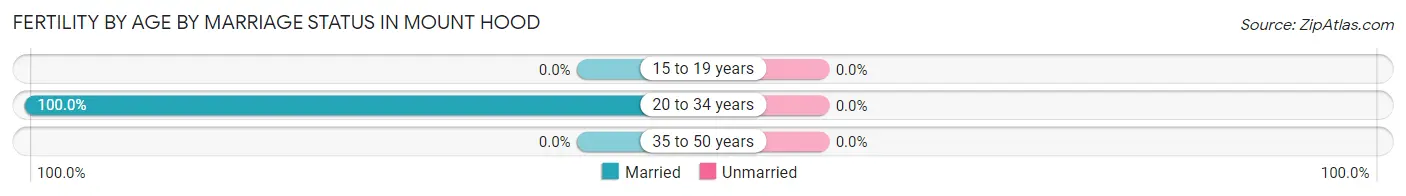
| Age Bracket | Married | Unmarried |
| 15 to 19 years | 0 (0.0%) | 0 (0.0%) |
| 20 to 34 years | 51 (100.0%) | 0 (0.0%) |
| 35 to 50 years | 0 (0.0%) | 0 (0.0%) |
| Total | 51 (100.0%) | 0 (0.0%) |
Fertility by Education in Mount Hood
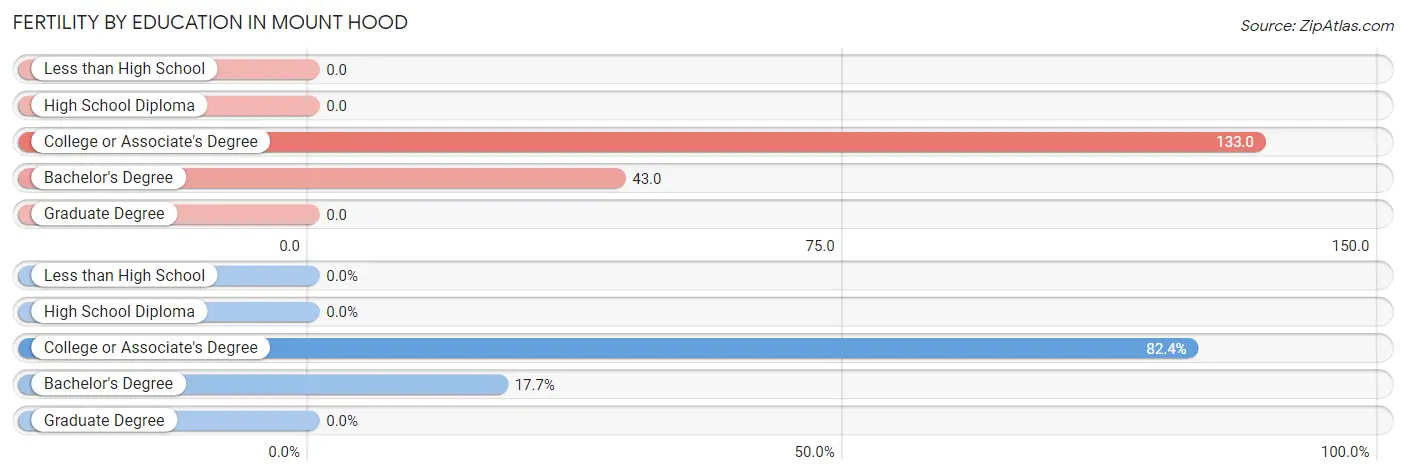
| Educational Attainment | Women with Births | Births / 1,000 Women |
| Less than High School | 0 (0.0%) | 0.0 |
| High School Diploma | 0 (0.0%) | 0.0 |
| College or Associate's Degree | 42 (82.4%) | 133.0 |
| Bachelor's Degree | 9 (17.6%) | 43.0 |
| Graduate Degree | 0 (0.0%) | 0.0 |
| Total | 51 (100.0%) | 57.0 |
Fertility by Education by Marriage Status in Mount Hood
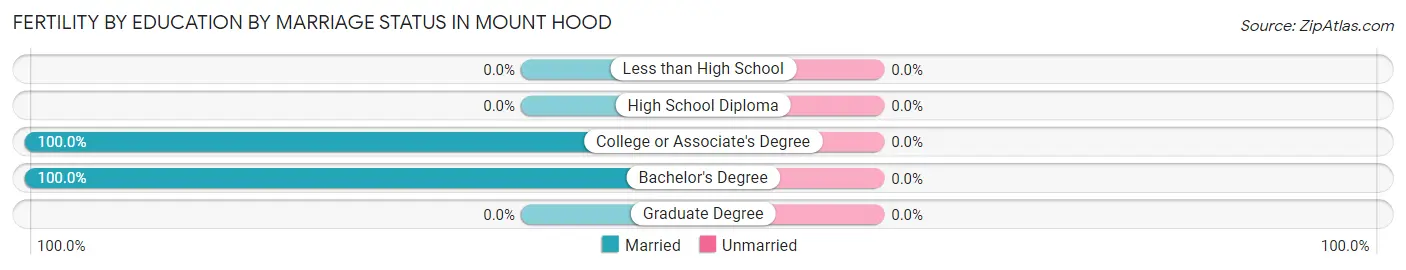
| Educational Attainment | Married | Unmarried |
| Less than High School | 0 (0.0%) | 0 (0.0%) |
| High School Diploma | 0 (0.0%) | 0 (0.0%) |
| College or Associate's Degree | 42 (100.0%) | 0 (0.0%) |
| Bachelor's Degree | 9 (100.0%) | 0 (0.0%) |
| Graduate Degree | 0 (0.0%) | 0 (0.0%) |
| Total | 51 (100.0%) | 0 (0.0%) |
Employment Characteristics in Mount Hood
Employment by Class of Employer in Mount Hood
Among the 2,370 employed individuals in Mount Hood, private company employees (1,558 | 65.7%), self-employed (not incorporated) (220 | 9.3%), and not-for-profit organizations (202 | 8.5%) make up the most common classes of employment.
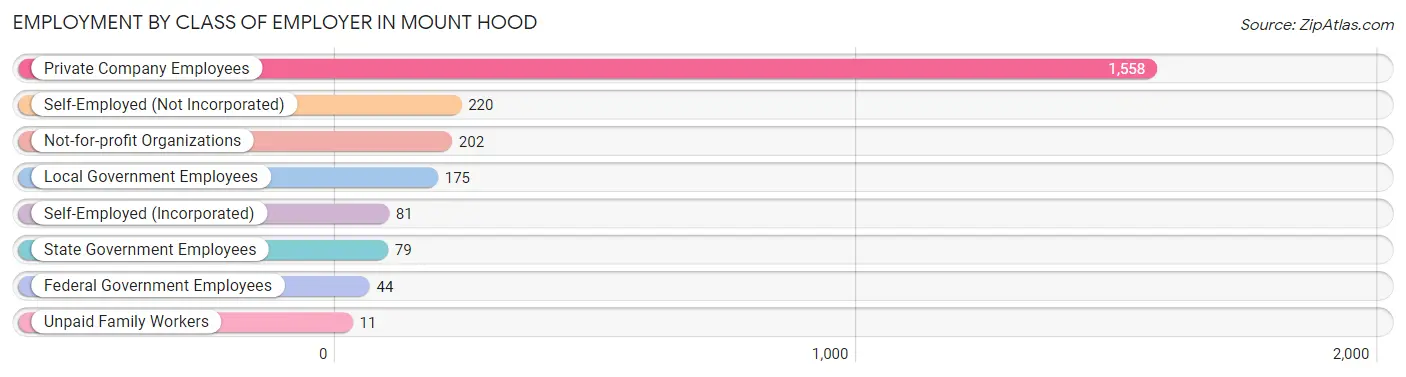
| Employer Class | # Employees | % Employees |
| Private Company Employees | 1,558 | 65.7% |
| Self-Employed (Incorporated) | 81 | 3.4% |
| Self-Employed (Not Incorporated) | 220 | 9.3% |
| Not-for-profit Organizations | 202 | 8.5% |
| Local Government Employees | 175 | 7.4% |
| State Government Employees | 79 | 3.3% |
| Federal Government Employees | 44 | 1.9% |
| Unpaid Family Workers | 11 | 0.5% |
| Total | 2,370 | 100.0% |
Employment Status by Age in Mount Hood
According to the labor force statistics for Mount Hood, out of the total population over 16 years of age (4,054), 61.3% or 2,485 individuals are in the labor force, with 4.7% or 117 of them unemployed. The age group with the highest labor force participation rate is 35 to 44 years, with 97.4% or 415 individuals in the labor force. Within the labor force, the 45 to 54 years age range has the highest percentage of unemployed individuals, with 11.6% or 72 of them being unemployed.
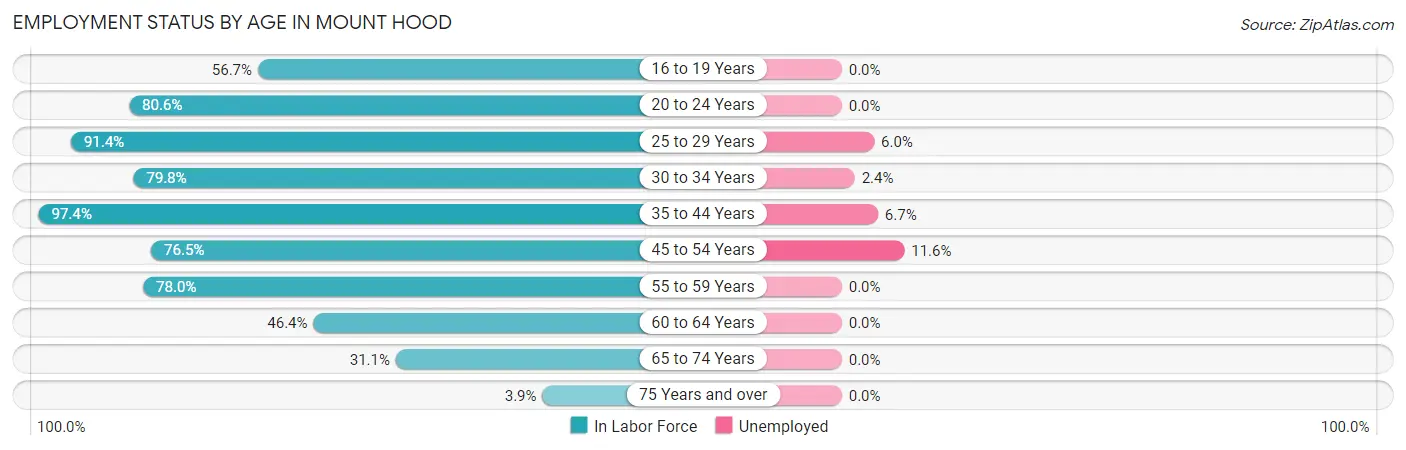
| Age Bracket | In Labor Force | Unemployed |
| 16 to 19 Years | 97 (56.7%) | 0 (0.0%) |
| 20 to 24 Years | 254 (80.6%) | 0 (0.0%) |
| 25 to 29 Years | 149 (91.4%) | 9 (6.0%) |
| 30 to 34 Years | 300 (79.8%) | 7 (2.4%) |
| 35 to 44 Years | 415 (97.4%) | 28 (6.7%) |
| 45 to 54 Years | 621 (76.5%) | 72 (11.6%) |
| 55 to 59 Years | 256 (78.0%) | 0 (0.0%) |
| 60 to 64 Years | 135 (46.4%) | 0 (0.0%) |
| 65 to 74 Years | 244 (31.1%) | 0 (0.0%) |
| 75 Years and over | 15 (3.9%) | 0 (0.0%) |
| Total | 2,485 (61.3%) | 117 (4.7%) |
Employment Status by Educational Attainment in Mount Hood
According to labor force statistics for Mount Hood, 78.3% of individuals (1,876) out of the total population between 25 and 64 years of age (2,396) are in the labor force, with 6.2% or 116 of them being unemployed. The group with the highest labor force participation rate are those with the educational attainment of bachelor's degree or higher, with 90.8% or 718 individuals in the labor force. Within the labor force, individuals with less than high school education have the highest percentage of unemployment, with 25.0% or 13 of them being unemployed.
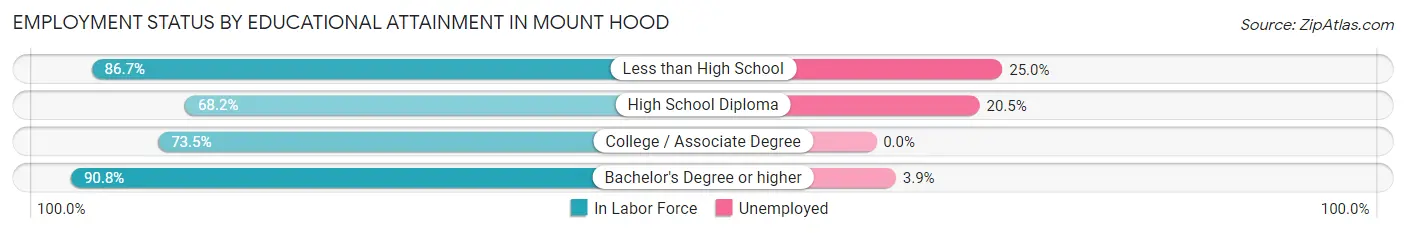
| Educational Attainment | In Labor Force | Unemployed |
| Less than High School | 52 (86.7%) | 15 (25.0%) |
| High School Diploma | 375 (68.2%) | 113 (20.5%) |
| College / Associate Degree | 731 (73.5%) | 0 (0.0%) |
| Bachelor's Degree or higher | 718 (90.8%) | 31 (3.9%) |
| Total | 1,876 (78.3%) | 149 (6.2%) |
Employment Occupations by Sex in Mount Hood
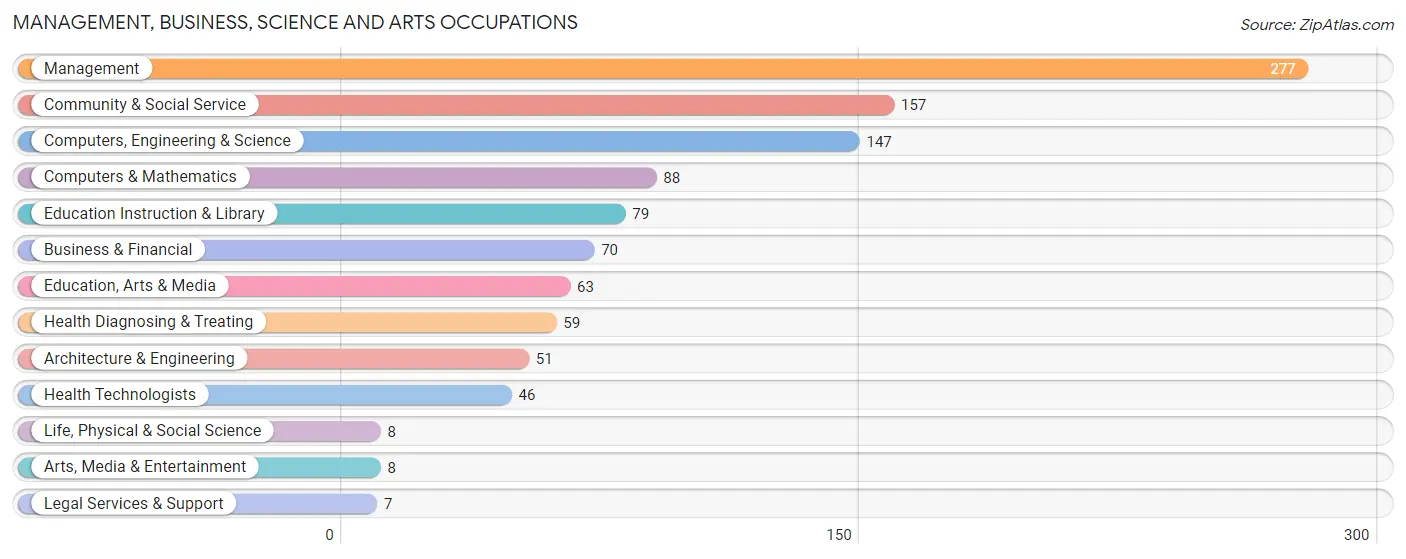
Management, Business, Science and Arts Occupations
The most common Management, Business, Science and Arts occupations in Mount Hood are Management (277 | 11.7%), Community & Social Service (157 | 6.7%), Computers, Engineering & Science (147 | 6.2%), Computers & Mathematics (88 | 3.7%), and Education Instruction & Library (79 | 3.4%).
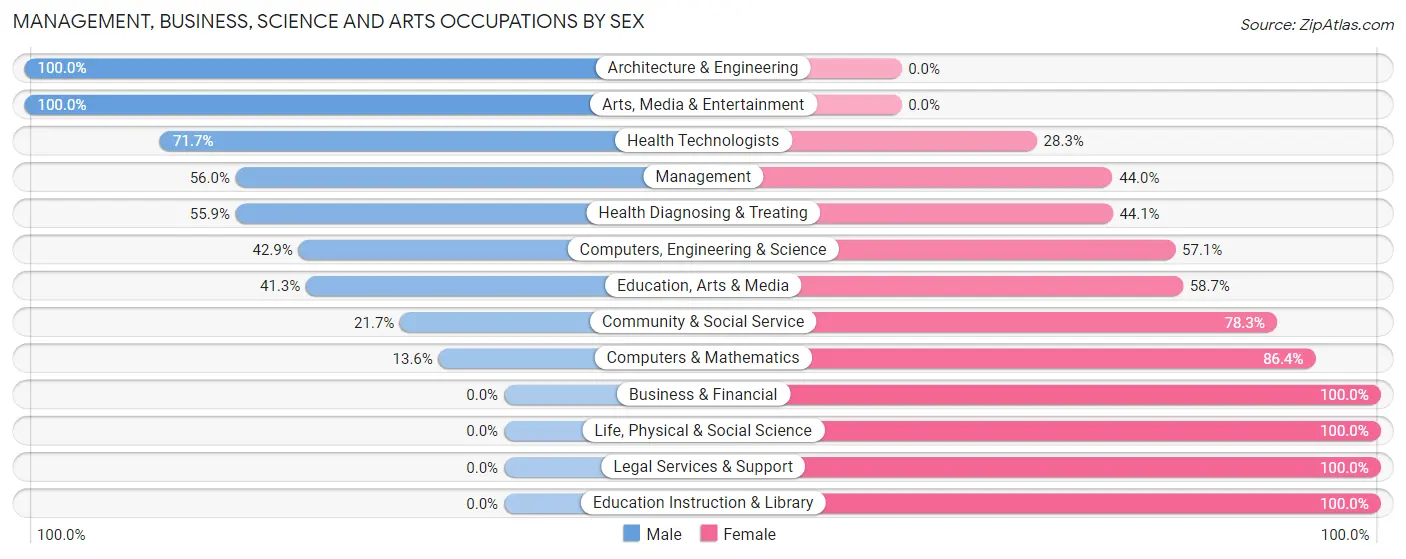
Management, Business, Science and Arts Occupations by Sex
Within the Management, Business, Science and Arts occupations in Mount Hood, the most male-oriented occupations are Architecture & Engineering (100.0%), Arts, Media & Entertainment (100.0%), and Health Technologists (71.7%), while the most female-oriented occupations are Business & Financial (100.0%), Life, Physical & Social Science (100.0%), and Legal Services & Support (100.0%).
| Occupation | Male | Female |
| Management | 155 (56.0%) | 122 (44.0%) |
| Business & Financial | 0 (0.0%) | 70 (100.0%) |
| Computers, Engineering & Science | 63 (42.9%) | 84 (57.1%) |
| Computers & Mathematics | 12 (13.6%) | 76 (86.4%) |
| Architecture & Engineering | 51 (100.0%) | 0 (0.0%) |
| Life, Physical & Social Science | 0 (0.0%) | 8 (100.0%) |
| Community & Social Service | 34 (21.7%) | 123 (78.3%) |
| Education, Arts & Media | 26 (41.3%) | 37 (58.7%) |
| Legal Services & Support | 0 (0.0%) | 7 (100.0%) |
| Education Instruction & Library | 0 (0.0%) | 79 (100.0%) |
| Arts, Media & Entertainment | 8 (100.0%) | 0 (0.0%) |
| Health Diagnosing & Treating | 33 (55.9%) | 26 (44.1%) |
| Health Technologists | 33 (71.7%) | 13 (28.3%) |
| Total (Category) | 285 (40.1%) | 425 (59.9%) |
| Total (Overall) | 1,262 (53.4%) | 1,099 (46.6%) |
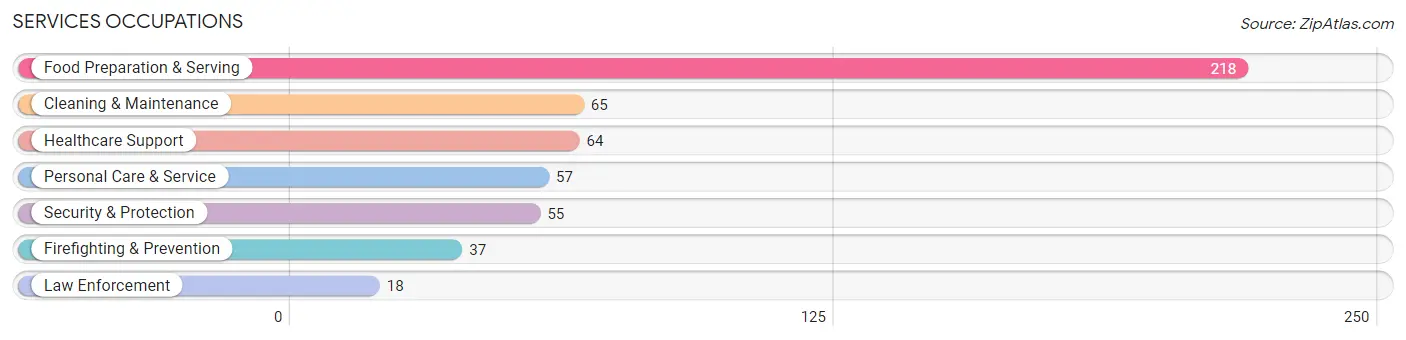
Services Occupations
The most common Services occupations in Mount Hood are Food Preparation & Serving (218 | 9.2%), Cleaning & Maintenance (65 | 2.8%), Healthcare Support (64 | 2.7%), Personal Care & Service (57 | 2.4%), and Security & Protection (55 | 2.3%).
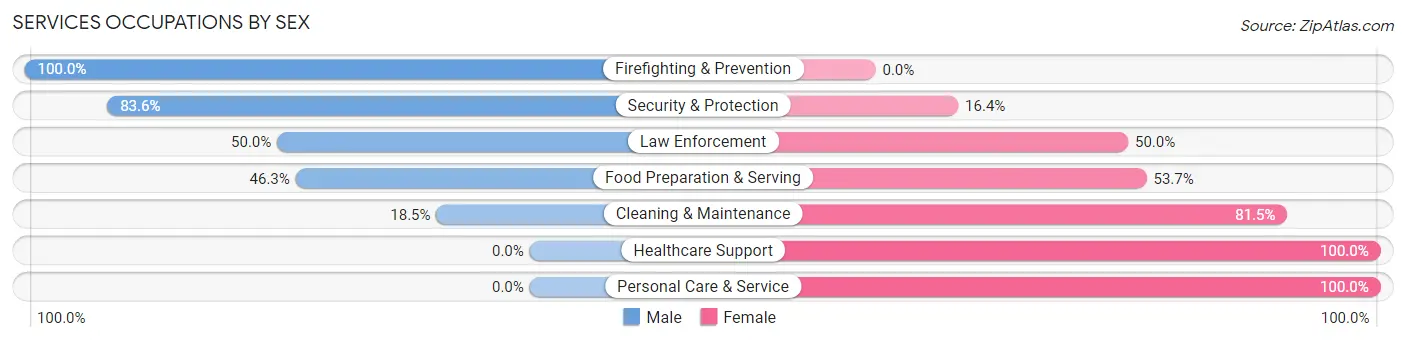
Services Occupations by Sex
Within the Services occupations in Mount Hood, the most male-oriented occupations are Firefighting & Prevention (100.0%), Security & Protection (83.6%), and Law Enforcement (50.0%), while the most female-oriented occupations are Healthcare Support (100.0%), Personal Care & Service (100.0%), and Cleaning & Maintenance (81.5%).
| Occupation | Male | Female |
| Healthcare Support | 0 (0.0%) | 64 (100.0%) |
| Security & Protection | 46 (83.6%) | 9 (16.4%) |
| Firefighting & Prevention | 37 (100.0%) | 0 (0.0%) |
| Law Enforcement | 9 (50.0%) | 9 (50.0%) |
| Food Preparation & Serving | 101 (46.3%) | 117 (53.7%) |
| Cleaning & Maintenance | 12 (18.5%) | 53 (81.5%) |
| Personal Care & Service | 0 (0.0%) | 57 (100.0%) |
| Total (Category) | 159 (34.6%) | 300 (65.4%) |
| Total (Overall) | 1,262 (53.4%) | 1,099 (46.6%) |
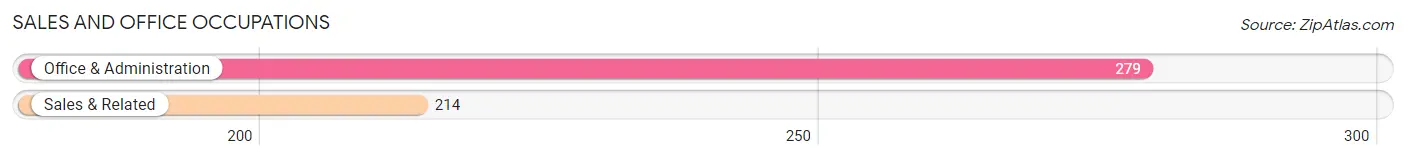
Sales and Office Occupations
The most common Sales and Office occupations in Mount Hood are Office & Administration (279 | 11.8%), and Sales & Related (214 | 9.1%).
Sales and Office Occupations by Sex
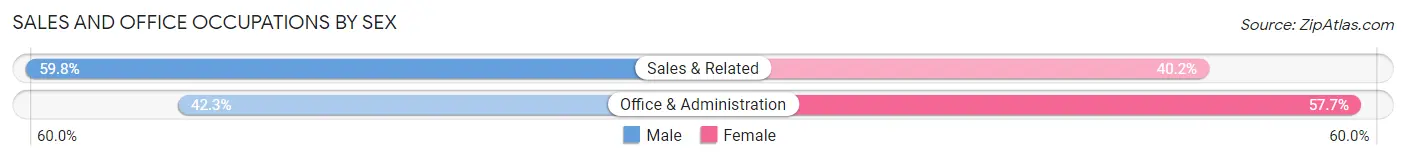
| Occupation | Male | Female |
| Sales & Related | 128 (59.8%) | 86 (40.2%) |
| Office & Administration | 118 (42.3%) | 161 (57.7%) |
| Total (Category) | 246 (49.9%) | 247 (50.1%) |
| Total (Overall) | 1,262 (53.4%) | 1,099 (46.6%) |
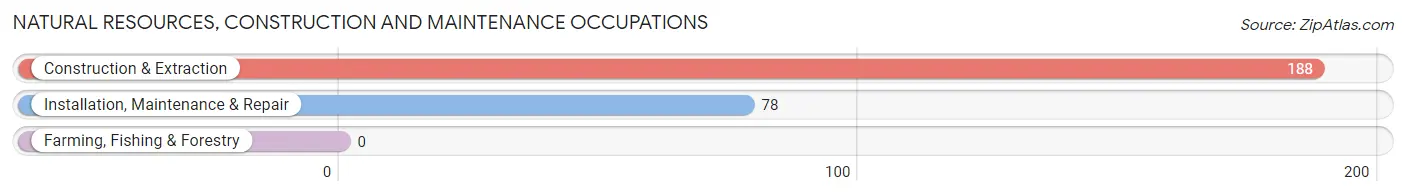
Natural Resources, Construction and Maintenance Occupations
The most common Natural Resources, Construction and Maintenance occupations in Mount Hood are Construction & Extraction (188 | 8.0%), and Installation, Maintenance & Repair (78 | 3.3%).
Natural Resources, Construction and Maintenance Occupations by Sex
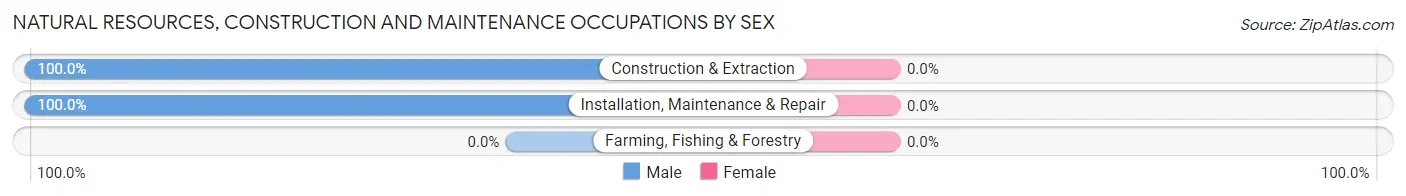
| Occupation | Male | Female |
| Farming, Fishing & Forestry | 0 (0.0%) | 0 (0.0%) |
| Construction & Extraction | 188 (100.0%) | 0 (0.0%) |
| Installation, Maintenance & Repair | 78 (100.0%) | 0 (0.0%) |
| Total (Category) | 266 (100.0%) | 0 (0.0%) |
| Total (Overall) | 1,262 (53.4%) | 1,099 (46.6%) |
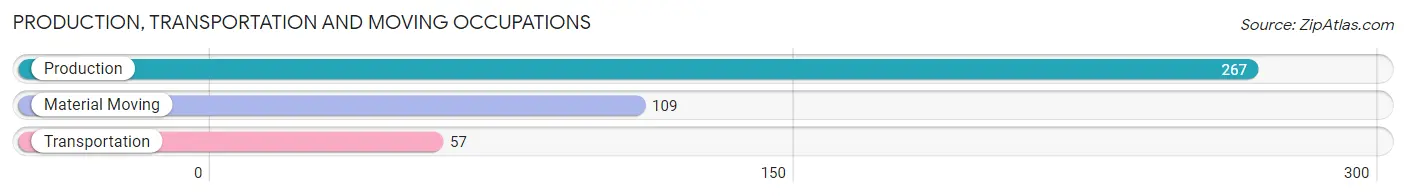
Production, Transportation and Moving Occupations
The most common Production, Transportation and Moving occupations in Mount Hood are Production (267 | 11.3%), Material Moving (109 | 4.6%), and Transportation (57 | 2.4%).
Production, Transportation and Moving Occupations by Sex
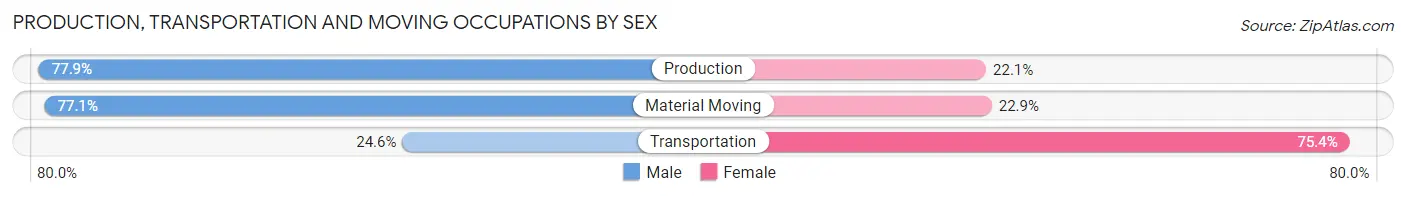
| Occupation | Male | Female |
| Production | 208 (77.9%) | 59 (22.1%) |
| Transportation | 14 (24.6%) | 43 (75.4%) |
| Material Moving | 84 (77.1%) | 25 (22.9%) |
| Total (Category) | 306 (70.7%) | 127 (29.3%) |
| Total (Overall) | 1,262 (53.4%) | 1,099 (46.6%) |
Employment Industries by Sex in Mount Hood
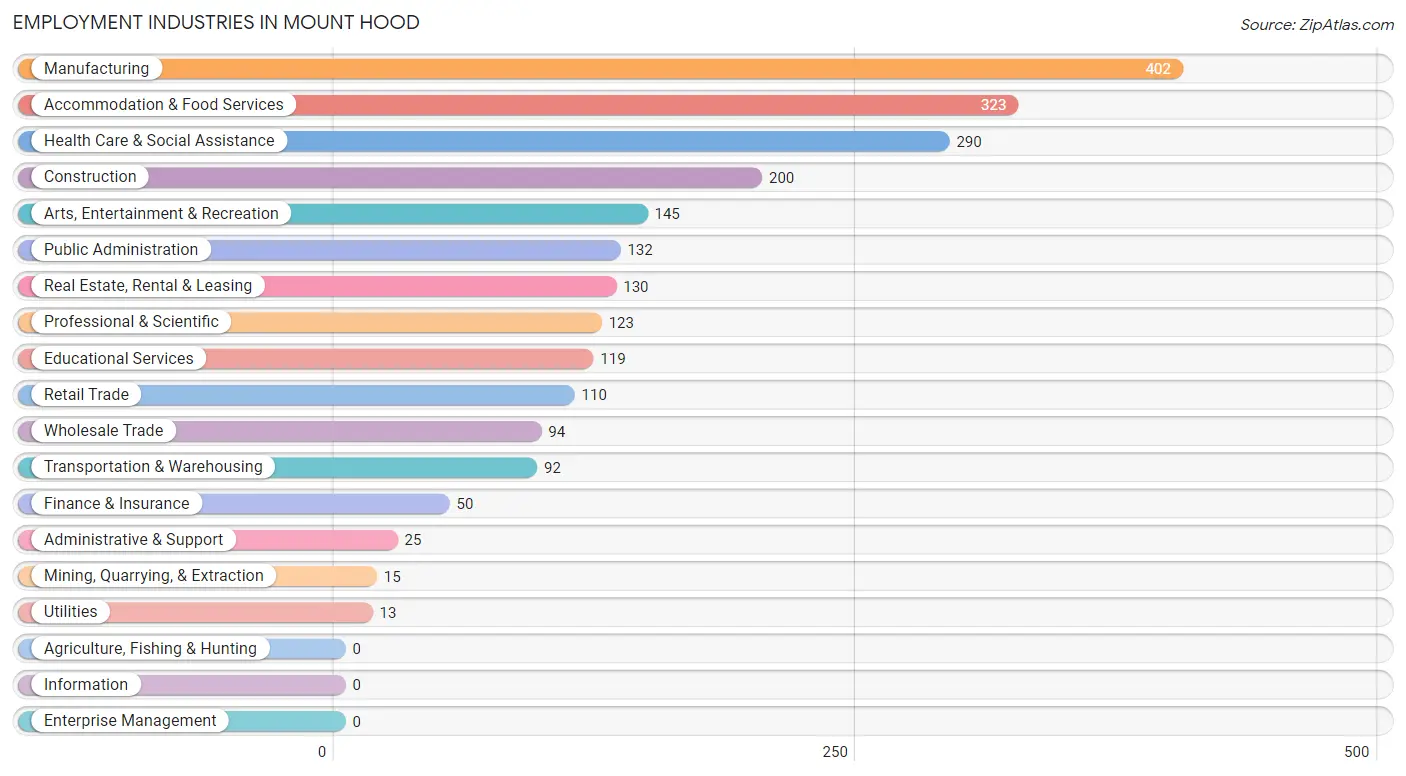
Employment Industries in Mount Hood
The major employment industries in Mount Hood include Manufacturing (402 | 17.0%), Accommodation & Food Services (323 | 13.7%), Health Care & Social Assistance (290 | 12.3%), Construction (200 | 8.5%), and Arts, Entertainment & Recreation (145 | 6.1%).
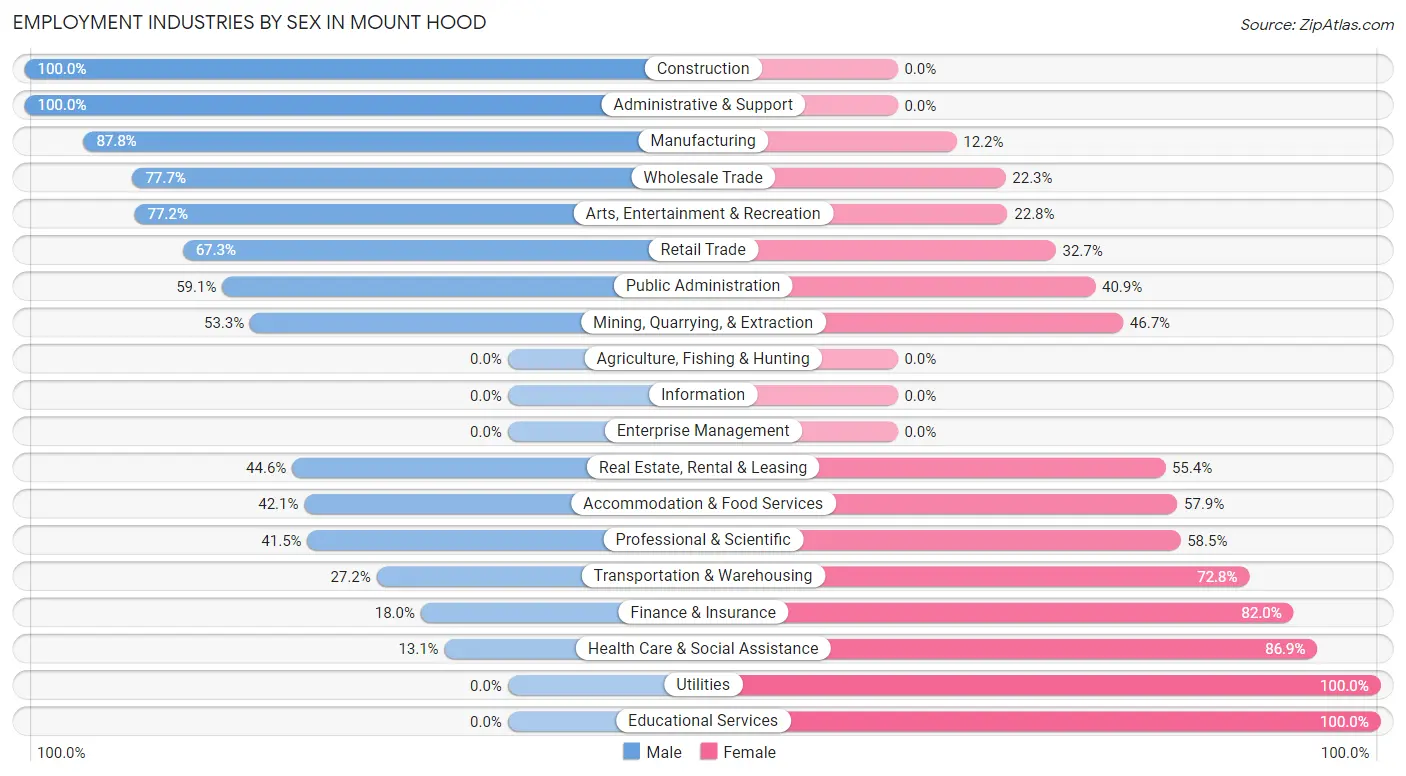
Employment Industries by Sex in Mount Hood
The Mount Hood industries that see more men than women are Construction (100.0%), Administrative & Support (100.0%), and Manufacturing (87.8%), whereas the industries that tend to have a higher number of women are Utilities (100.0%), Educational Services (100.0%), and Health Care & Social Assistance (86.9%).
| Industry | Male | Female |
| Agriculture, Fishing & Hunting | 0 (0.0%) | 0 (0.0%) |
| Mining, Quarrying, & Extraction | 8 (53.3%) | 7 (46.7%) |
| Construction | 200 (100.0%) | 0 (0.0%) |
| Manufacturing | 353 (87.8%) | 49 (12.2%) |
| Wholesale Trade | 73 (77.7%) | 21 (22.3%) |
| Retail Trade | 74 (67.3%) | 36 (32.7%) |
| Transportation & Warehousing | 25 (27.2%) | 67 (72.8%) |
| Utilities | 0 (0.0%) | 13 (100.0%) |
| Information | 0 (0.0%) | 0 (0.0%) |
| Finance & Insurance | 9 (18.0%) | 41 (82.0%) |
| Real Estate, Rental & Leasing | 58 (44.6%) | 72 (55.4%) |
| Professional & Scientific | 51 (41.5%) | 72 (58.5%) |
| Enterprise Management | 0 (0.0%) | 0 (0.0%) |
| Administrative & Support | 25 (100.0%) | 0 (0.0%) |
| Educational Services | 0 (0.0%) | 119 (100.0%) |
| Health Care & Social Assistance | 38 (13.1%) | 252 (86.9%) |
| Arts, Entertainment & Recreation | 112 (77.2%) | 33 (22.8%) |
| Accommodation & Food Services | 136 (42.1%) | 187 (57.9%) |
| Public Administration | 78 (59.1%) | 54 (40.9%) |
| Total | 1,262 (53.4%) | 1,099 (46.6%) |
Education in Mount Hood
School Enrollment in Mount Hood
The most common levels of schooling among the 785 students in Mount Hood are high school (209 | 26.6%), elementary school (192 | 24.5%), and college / undergraduate (133 | 16.9%).
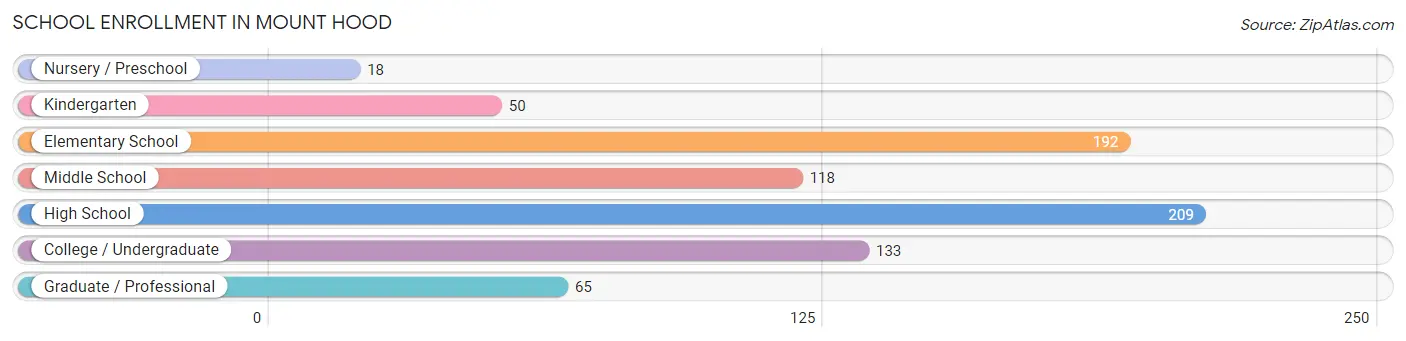
| School Level | # Students | % Students |
| Nursery / Preschool | 18 | 2.3% |
| Kindergarten | 50 | 6.4% |
| Elementary School | 192 | 24.5% |
| Middle School | 118 | 15.0% |
| High School | 209 | 26.6% |
| College / Undergraduate | 133 | 16.9% |
| Graduate / Professional | 65 | 8.3% |
| Total | 785 | 100.0% |
School Enrollment by Age by Funding Source in Mount Hood
Out of a total of 785 students who are enrolled in schools in Mount Hood, 319 (40.6%) attend a private institution, while the remaining 466 (59.4%) are enrolled in public schools. The age group of 3 to 4 year olds has the highest likelihood of being enrolled in private schools, with 10 (100.0% in the age bracket) enrolled. Conversely, the age group of 18 to 19 year olds has the lowest likelihood of being enrolled in a private school, with 72 (100.0% in the age bracket) attending a public institution.
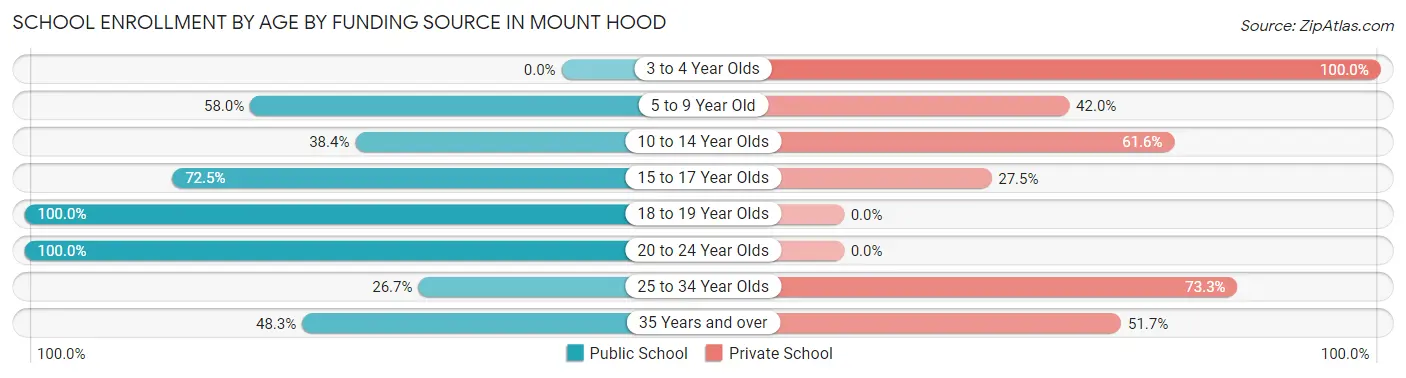
| Age Bracket | Public School | Private School |
| 3 to 4 Year Olds | 0 (0.0%) | 10 (100.0%) |
| 5 to 9 Year Old | 145 (58.0%) | 105 (42.0%) |
| 10 to 14 Year Olds | 53 (38.4%) | 85 (61.6%) |
| 15 to 17 Year Olds | 87 (72.5%) | 33 (27.5%) |
| 18 to 19 Year Olds | 72 (100.0%) | 0 (0.0%) |
| 20 to 24 Year Olds | 60 (100.0%) | 0 (0.0%) |
| 25 to 34 Year Olds | 20 (26.7%) | 55 (73.3%) |
| 35 Years and over | 29 (48.3%) | 31 (51.7%) |
| Total | 466 (59.4%) | 319 (40.6%) |
Educational Attainment by Field of Study in Mount Hood
Business (245 | 18.5%), psychology (162 | 12.2%), arts & humanities (150 | 11.3%), science & technology (121 | 9.1%), and literature & languages (105 | 7.9%) are the most common fields of study among 1,326 individuals in Mount Hood who have obtained a bachelor's degree or higher.
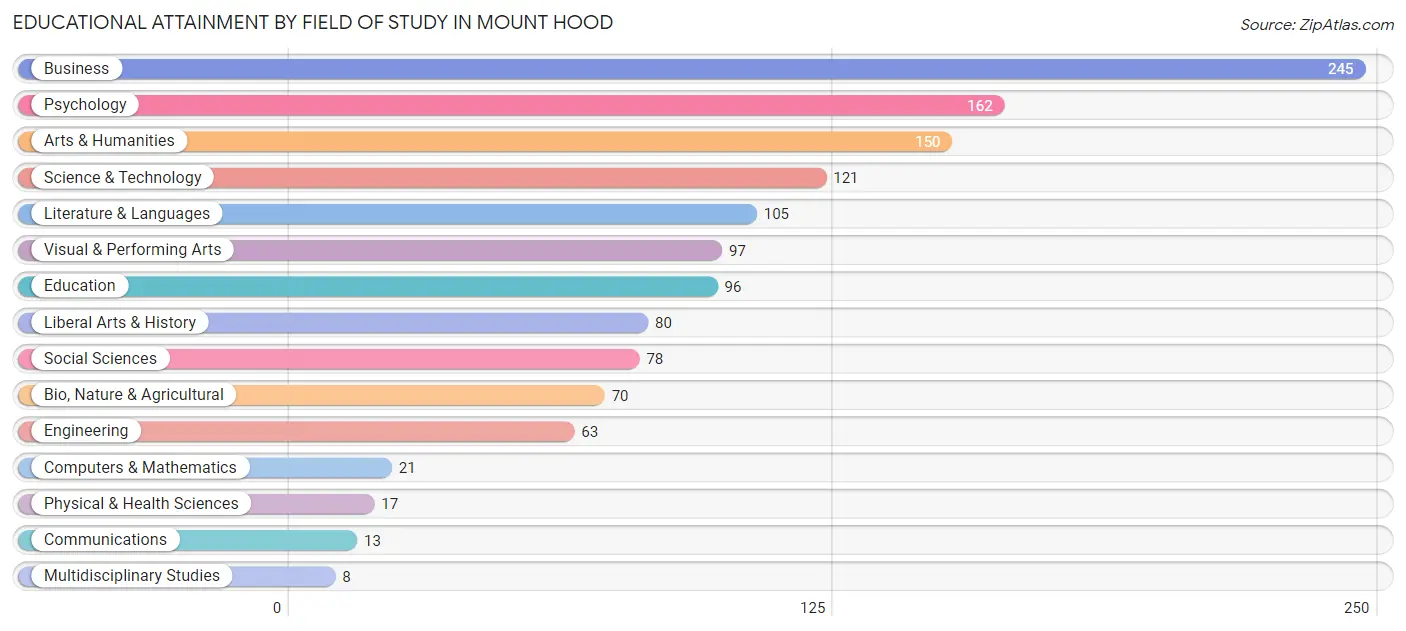
| Field of Study | # Graduates | % Graduates |
| Computers & Mathematics | 21 | 1.6% |
| Bio, Nature & Agricultural | 70 | 5.3% |
| Physical & Health Sciences | 17 | 1.3% |
| Psychology | 162 | 12.2% |
| Social Sciences | 78 | 5.9% |
| Engineering | 63 | 4.8% |
| Multidisciplinary Studies | 8 | 0.6% |
| Science & Technology | 121 | 9.1% |
| Business | 245 | 18.5% |
| Education | 96 | 7.2% |
| Literature & Languages | 105 | 7.9% |
| Liberal Arts & History | 80 | 6.0% |
| Visual & Performing Arts | 97 | 7.3% |
| Communications | 13 | 1.0% |
| Arts & Humanities | 150 | 11.3% |
| Total | 1,326 | 100.0% |
Transportation & Commute in Mount Hood
Vehicle Availability by Sex in Mount Hood
The most prevalent vehicle ownership categories in Mount Hood are males with 2 vehicles (607, accounting for 47.8%) and females with 2 vehicles (537, making up 55.2%).
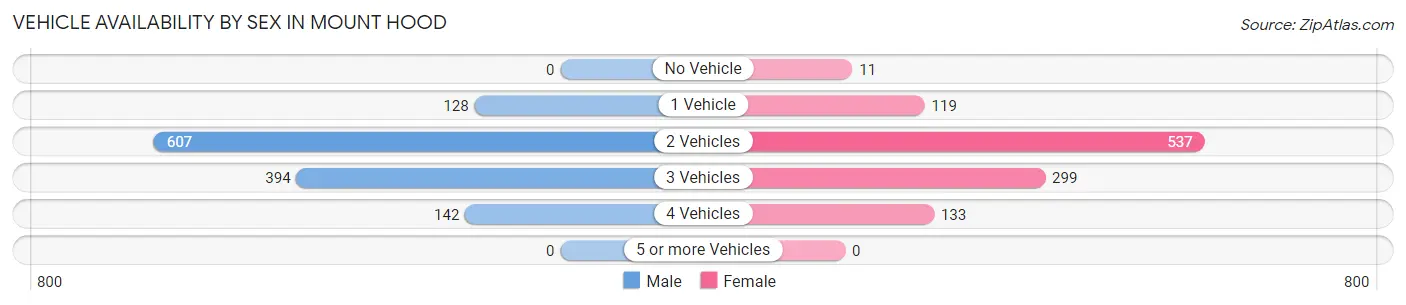
| Vehicles Available | Male | Female |
| No Vehicle | 0 (0.0%) | 11 (1.0%) |
| 1 Vehicle | 128 (10.1%) | 119 (10.8%) |
| 2 Vehicles | 607 (47.8%) | 537 (48.9%) |
| 3 Vehicles | 394 (31.0%) | 299 (27.2%) |
| 4 Vehicles | 142 (11.2%) | 133 (12.1%) |
| 5 or more Vehicles | 0 (0.0%) | 0 (0.0%) |
| Total | 1,271 (100.0%) | 1,099 (100.0%) |
Commute Time in Mount Hood
The most frequently occuring commute durations in Mount Hood are 45 to 59 minutes (411 commuters, 19.7%), 60 to 89 minutes (394 commuters, 18.9%), and 5 to 9 minutes (291 commuters, 14.0%).
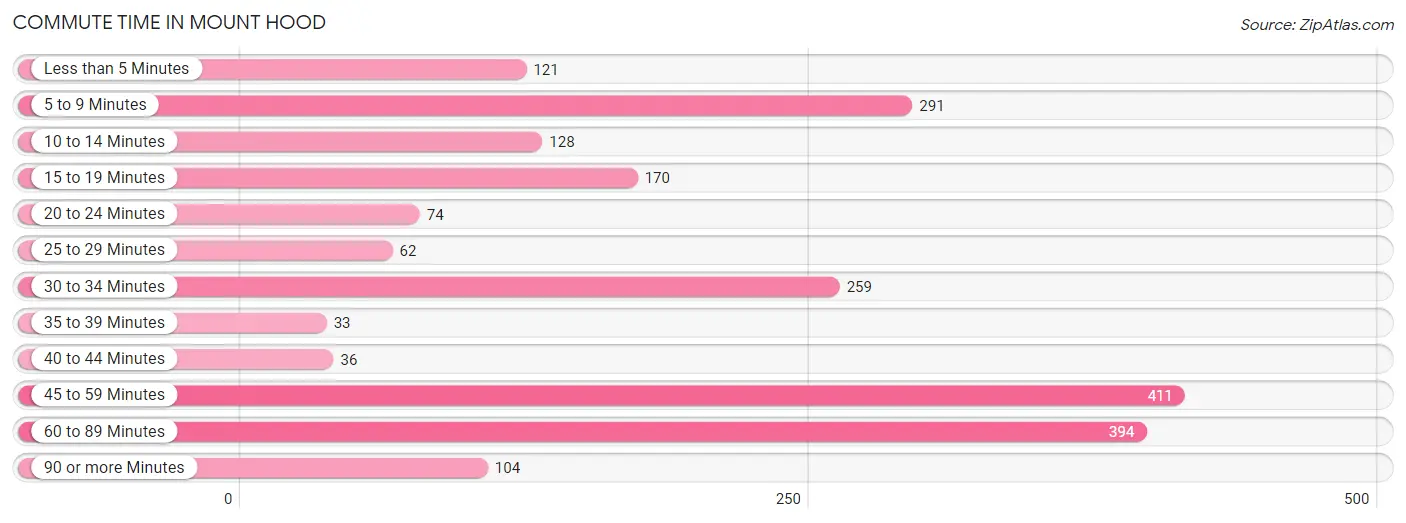
| Commute Time | # Commuters | % Commuters |
| Less than 5 Minutes | 121 | 5.8% |
| 5 to 9 Minutes | 291 | 14.0% |
| 10 to 14 Minutes | 128 | 6.1% |
| 15 to 19 Minutes | 170 | 8.2% |
| 20 to 24 Minutes | 74 | 3.5% |
| 25 to 29 Minutes | 62 | 3.0% |
| 30 to 34 Minutes | 259 | 12.4% |
| 35 to 39 Minutes | 33 | 1.6% |
| 40 to 44 Minutes | 36 | 1.7% |
| 45 to 59 Minutes | 411 | 19.7% |
| 60 to 89 Minutes | 394 | 18.9% |
| 90 or more Minutes | 104 | 5.0% |
Commute Time by Sex in Mount Hood
The most common commute times in Mount Hood are 45 to 59 minutes (311 commuters, 27.8%) for males and 60 to 89 minutes (179 commuters, 18.6%) for females.
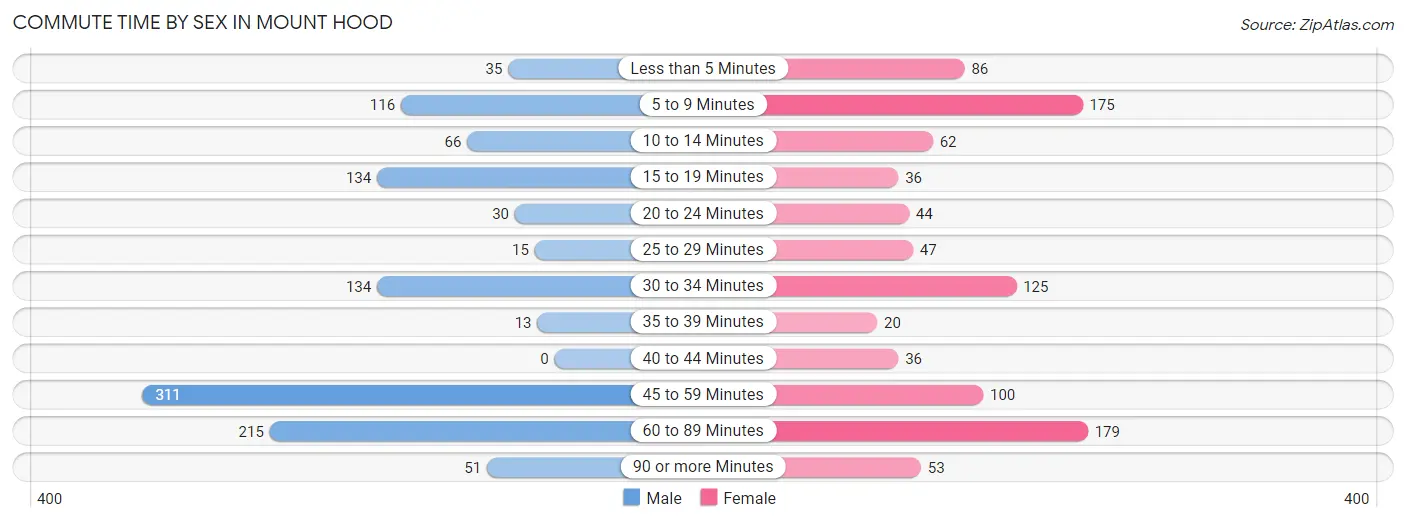
| Commute Time | Male | Female |
| Less than 5 Minutes | 35 (3.1%) | 86 (8.9%) |
| 5 to 9 Minutes | 116 (10.4%) | 175 (18.2%) |
| 10 to 14 Minutes | 66 (5.9%) | 62 (6.4%) |
| 15 to 19 Minutes | 134 (12.0%) | 36 (3.7%) |
| 20 to 24 Minutes | 30 (2.7%) | 44 (4.6%) |
| 25 to 29 Minutes | 15 (1.3%) | 47 (4.9%) |
| 30 to 34 Minutes | 134 (12.0%) | 125 (13.0%) |
| 35 to 39 Minutes | 13 (1.2%) | 20 (2.1%) |
| 40 to 44 Minutes | 0 (0.0%) | 36 (3.7%) |
| 45 to 59 Minutes | 311 (27.8%) | 100 (10.4%) |
| 60 to 89 Minutes | 215 (19.2%) | 179 (18.6%) |
| 90 or more Minutes | 51 (4.5%) | 53 (5.5%) |
Time of Departure to Work by Sex in Mount Hood
The most frequent times of departure to work in Mount Hood are 5:00 AM to 5:29 AM (171, 15.3%) for males and 8:00 AM to 8:29 AM (137, 14.2%) for females.
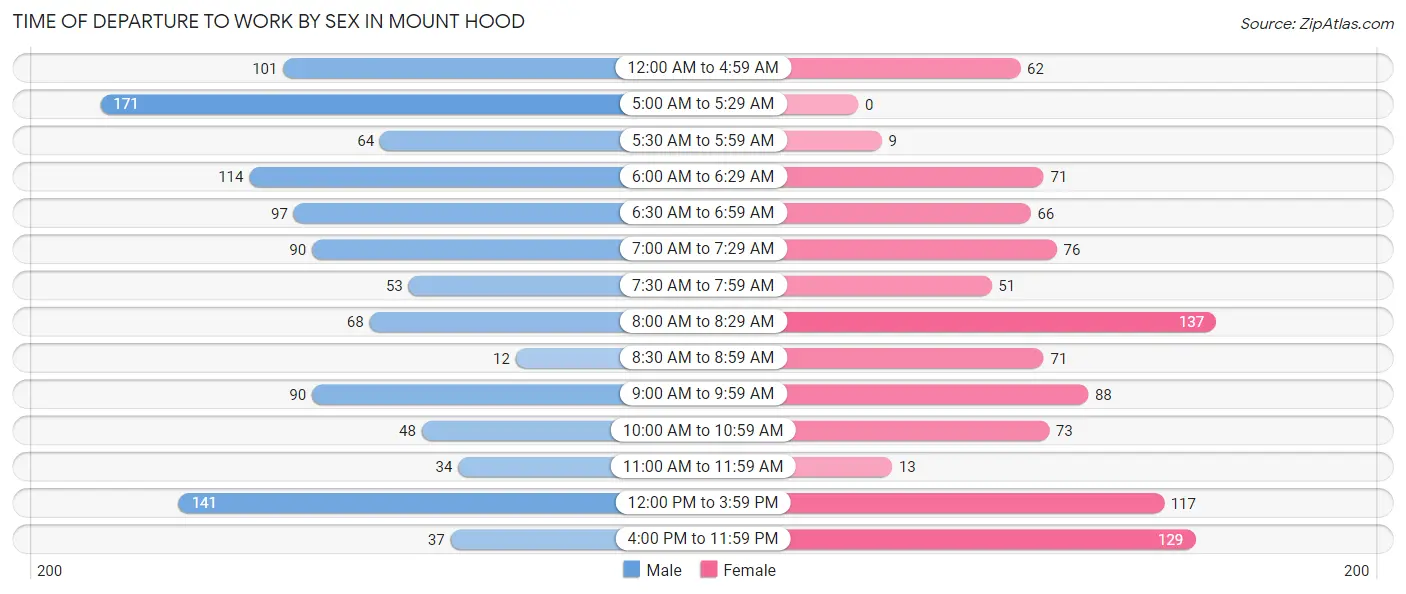
| Time of Departure | Male | Female |
| 12:00 AM to 4:59 AM | 101 (9.0%) | 62 (6.4%) |
| 5:00 AM to 5:29 AM | 171 (15.3%) | 0 (0.0%) |
| 5:30 AM to 5:59 AM | 64 (5.7%) | 9 (0.9%) |
| 6:00 AM to 6:29 AM | 114 (10.2%) | 71 (7.4%) |
| 6:30 AM to 6:59 AM | 97 (8.7%) | 66 (6.9%) |
| 7:00 AM to 7:29 AM | 90 (8.0%) | 76 (7.9%) |
| 7:30 AM to 7:59 AM | 53 (4.7%) | 51 (5.3%) |
| 8:00 AM to 8:29 AM | 68 (6.1%) | 137 (14.2%) |
| 8:30 AM to 8:59 AM | 12 (1.1%) | 71 (7.4%) |
| 9:00 AM to 9:59 AM | 90 (8.0%) | 88 (9.1%) |
| 10:00 AM to 10:59 AM | 48 (4.3%) | 73 (7.6%) |
| 11:00 AM to 11:59 AM | 34 (3.0%) | 13 (1.3%) |
| 12:00 PM to 3:59 PM | 141 (12.6%) | 117 (12.1%) |
| 4:00 PM to 11:59 PM | 37 (3.3%) | 129 (13.4%) |
| Total | 1,120 (100.0%) | 963 (100.0%) |
Housing Occupancy in Mount Hood
Occupancy by Ownership in Mount Hood
Of the total 2,074 dwellings in Mount Hood, owner-occupied units account for 1,779 (85.8%), while renter-occupied units make up 295 (14.2%).
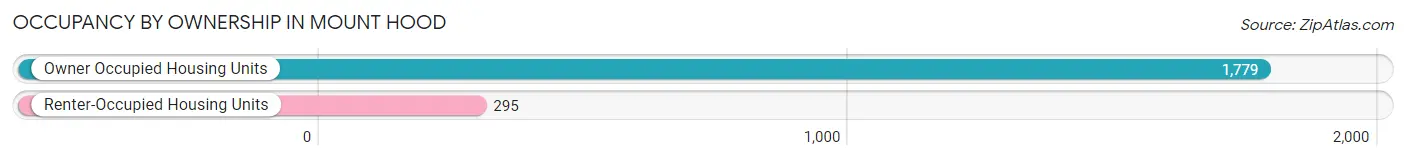
| Occupancy | # Housing Units | % Housing Units |
| Owner Occupied Housing Units | 1,779 | 85.8% |
| Renter-Occupied Housing Units | 295 | 14.2% |
| Total Occupied Housing Units | 2,074 | 100.0% |
Occupancy by Household Size in Mount Hood
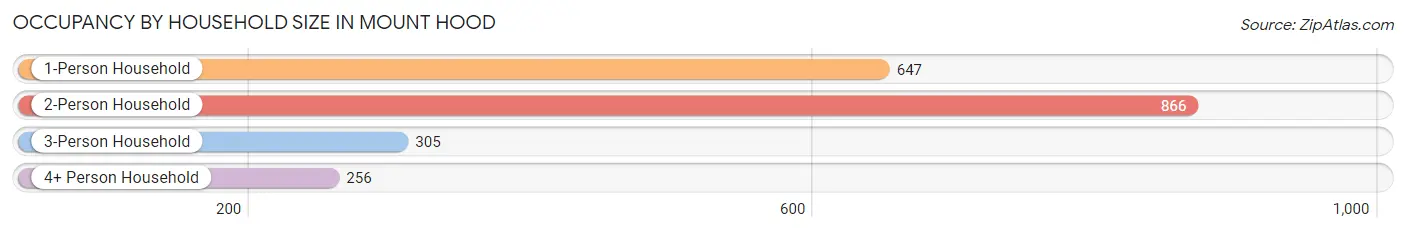
| Household Size | # Housing Units | % Housing Units |
| 1-Person Household | 647 | 31.2% |
| 2-Person Household | 866 | 41.8% |
| 3-Person Household | 305 | 14.7% |
| 4+ Person Household | 256 | 12.3% |
| Total Housing Units | 2,074 | 100.0% |
Occupancy by Ownership by Household Size in Mount Hood
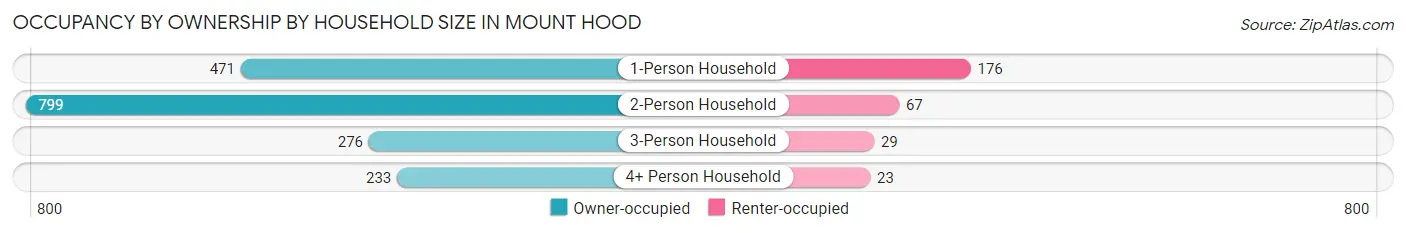
| Household Size | Owner-occupied | Renter-occupied |
| 1-Person Household | 471 (72.8%) | 176 (27.2%) |
| 2-Person Household | 799 (92.3%) | 67 (7.7%) |
| 3-Person Household | 276 (90.5%) | 29 (9.5%) |
| 4+ Person Household | 233 (91.0%) | 23 (9.0%) |
| Total Housing Units | 1,779 (85.8%) | 295 (14.2%) |
Occupancy by Educational Attainment in Mount Hood
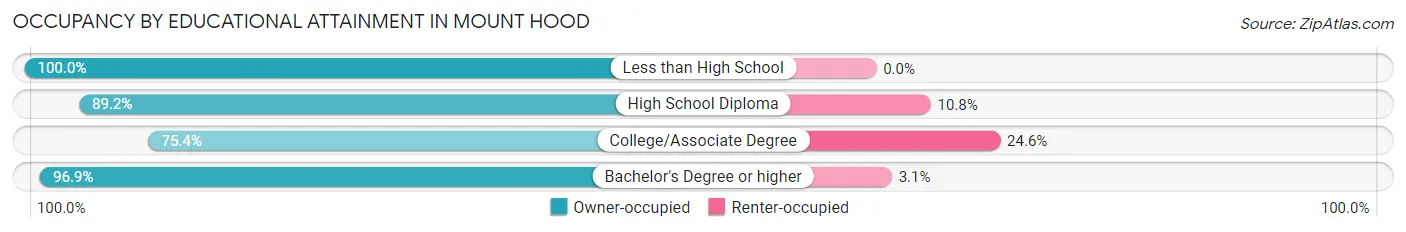
| Household Size | Owner-occupied | Renter-occupied |
| Less than High School | 23 (100.0%) | 0 (0.0%) |
| High School Diploma | 314 (89.2%) | 38 (10.8%) |
| College/Associate Degree | 718 (75.4%) | 234 (24.6%) |
| Bachelor's Degree or higher | 724 (96.9%) | 23 (3.1%) |
Occupancy by Age of Householder in Mount Hood
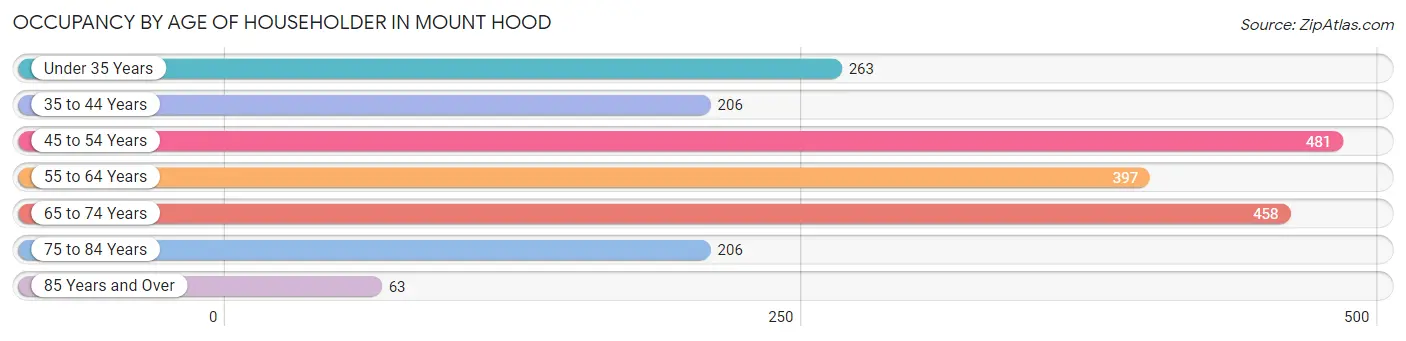
| Age Bracket | # Households | % Households |
| Under 35 Years | 263 | 12.7% |
| 35 to 44 Years | 206 | 9.9% |
| 45 to 54 Years | 481 | 23.2% |
| 55 to 64 Years | 397 | 19.1% |
| 65 to 74 Years | 458 | 22.1% |
| 75 to 84 Years | 206 | 9.9% |
| 85 Years and Over | 63 | 3.0% |
| Total | 2,074 | 100.0% |
Housing Finances in Mount Hood
Median Income by Occupancy in Mount Hood
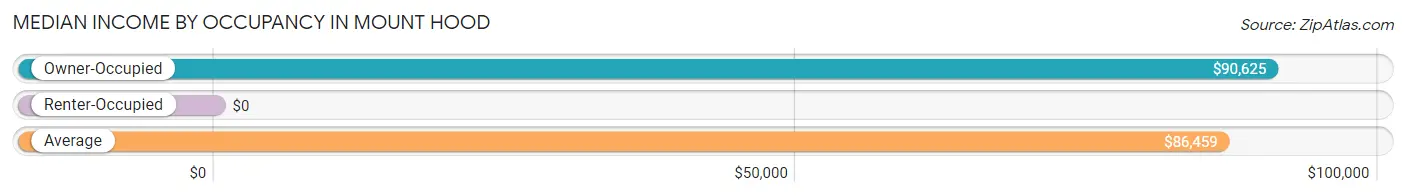
| Occupancy Type | # Households | Median Income |
| Owner-Occupied | 1,779 (85.8%) | $90,625 |
| Renter-Occupied | 295 (14.2%) | $0 |
| Average | 2,074 (100.0%) | $86,459 |
Occupancy by Householder Income Bracket in Mount Hood
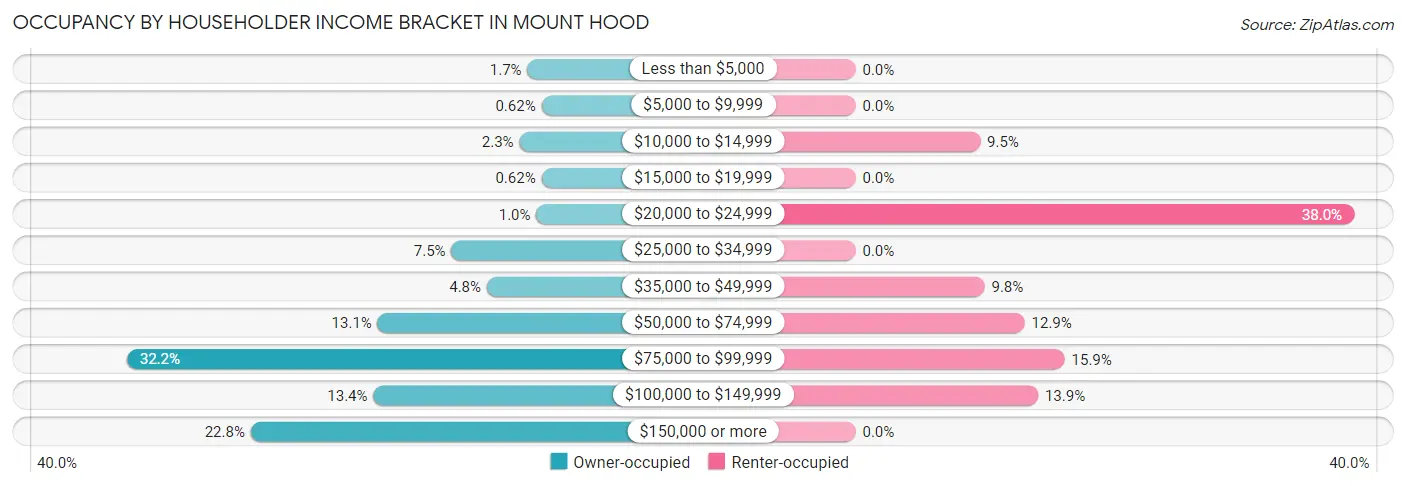
| Income Bracket | Owner-occupied | Renter-occupied |
| Less than $5,000 | 30 (1.7%) | 0 (0.0%) |
| $5,000 to $9,999 | 11 (0.6%) | 0 (0.0%) |
| $10,000 to $14,999 | 41 (2.3%) | 28 (9.5%) |
| $15,000 to $19,999 | 11 (0.6%) | 0 (0.0%) |
| $20,000 to $24,999 | 18 (1.0%) | 112 (38.0%) |
| $25,000 to $34,999 | 133 (7.5%) | 0 (0.0%) |
| $35,000 to $49,999 | 85 (4.8%) | 29 (9.8%) |
| $50,000 to $74,999 | 233 (13.1%) | 38 (12.9%) |
| $75,000 to $99,999 | 573 (32.2%) | 47 (15.9%) |
| $100,000 to $149,999 | 239 (13.4%) | 41 (13.9%) |
| $150,000 or more | 405 (22.8%) | 0 (0.0%) |
| Total | 1,779 (100.0%) | 295 (100.0%) |
Monthly Housing Cost Tiers in Mount Hood
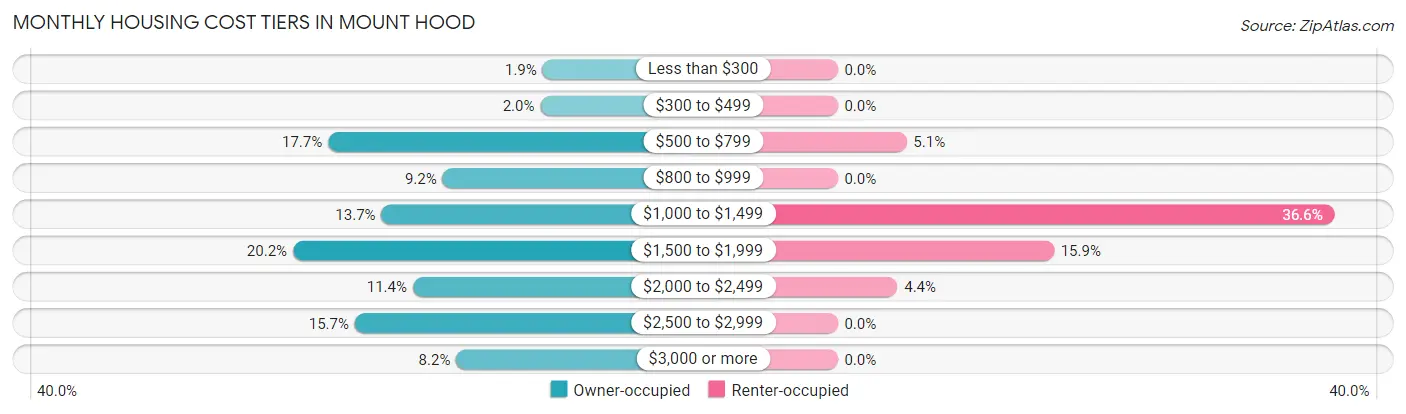
| Monthly Cost | Owner-occupied | Renter-occupied |
| Less than $300 | 33 (1.8%) | 0 (0.0%) |
| $300 to $499 | 36 (2.0%) | 0 (0.0%) |
| $500 to $799 | 314 (17.6%) | 15 (5.1%) |
| $800 to $999 | 164 (9.2%) | 0 (0.0%) |
| $1,000 to $1,499 | 244 (13.7%) | 108 (36.6%) |
| $1,500 to $1,999 | 360 (20.2%) | 47 (15.9%) |
| $2,000 to $2,499 | 203 (11.4%) | 13 (4.4%) |
| $2,500 to $2,999 | 279 (15.7%) | 0 (0.0%) |
| $3,000 or more | 146 (8.2%) | 0 (0.0%) |
| Total | 1,779 (100.0%) | 295 (100.0%) |
Physical Housing Characteristics in Mount Hood
Housing Structures in Mount Hood
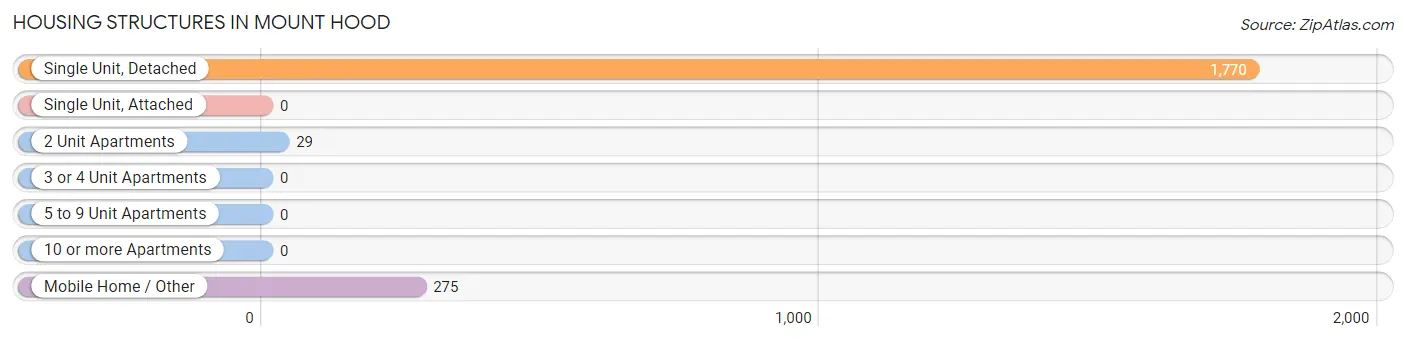
| Structure Type | # Housing Units | % Housing Units |
| Single Unit, Detached | 1,770 | 85.3% |
| Single Unit, Attached | 0 | 0.0% |
| 2 Unit Apartments | 29 | 1.4% |
| 3 or 4 Unit Apartments | 0 | 0.0% |
| 5 to 9 Unit Apartments | 0 | 0.0% |
| 10 or more Apartments | 0 | 0.0% |
| Mobile Home / Other | 275 | 13.3% |
| Total | 2,074 | 100.0% |
Housing Structures by Occupancy in Mount Hood
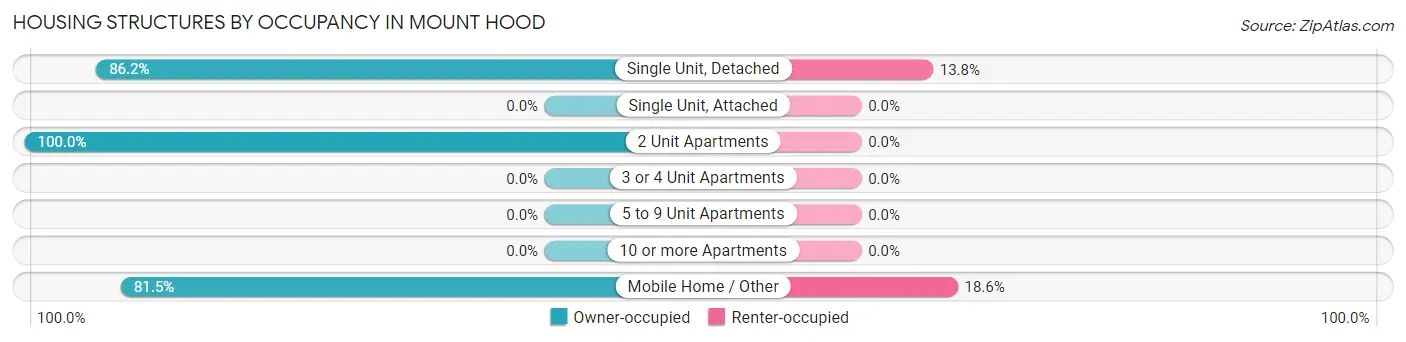
| Structure Type | Owner-occupied | Renter-occupied |
| Single Unit, Detached | 1,526 (86.2%) | 244 (13.8%) |
| Single Unit, Attached | 0 (0.0%) | 0 (0.0%) |
| 2 Unit Apartments | 29 (100.0%) | 0 (0.0%) |
| 3 or 4 Unit Apartments | 0 (0.0%) | 0 (0.0%) |
| 5 to 9 Unit Apartments | 0 (0.0%) | 0 (0.0%) |
| 10 or more Apartments | 0 (0.0%) | 0 (0.0%) |
| Mobile Home / Other | 224 (81.5%) | 51 (18.5%) |
| Total | 1,779 (85.8%) | 295 (14.2%) |
Housing Structures by Number of Rooms in Mount Hood
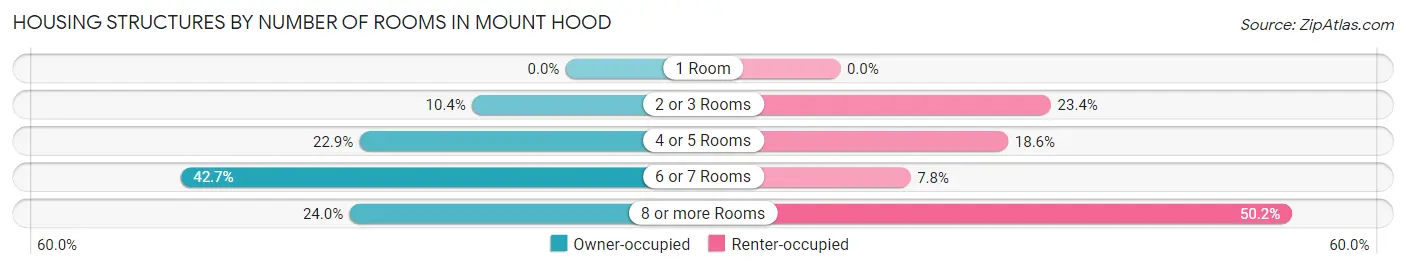
| Number of Rooms | Owner-occupied | Renter-occupied |
| 1 Room | 0 (0.0%) | 0 (0.0%) |
| 2 or 3 Rooms | 185 (10.4%) | 69 (23.4%) |
| 4 or 5 Rooms | 407 (22.9%) | 55 (18.6%) |
| 6 or 7 Rooms | 760 (42.7%) | 23 (7.8%) |
| 8 or more Rooms | 427 (24.0%) | 148 (50.2%) |
| Total | 1,779 (100.0%) | 295 (100.0%) |
Housing Structure by Heating Type in Mount Hood
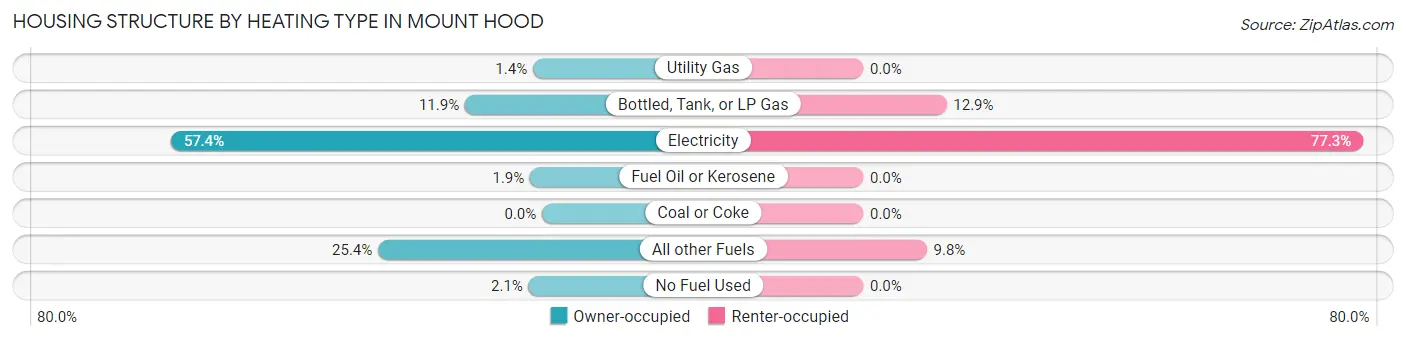
| Heating Type | Owner-occupied | Renter-occupied |
| Utility Gas | 25 (1.4%) | 0 (0.0%) |
| Bottled, Tank, or LP Gas | 212 (11.9%) | 38 (12.9%) |
| Electricity | 1,021 (57.4%) | 228 (77.3%) |
| Fuel Oil or Kerosene | 33 (1.8%) | 0 (0.0%) |
| Coal or Coke | 0 (0.0%) | 0 (0.0%) |
| All other Fuels | 451 (25.4%) | 29 (9.8%) |
| No Fuel Used | 37 (2.1%) | 0 (0.0%) |
| Total | 1,779 (100.0%) | 295 (100.0%) |
Household Vehicle Usage in Mount Hood
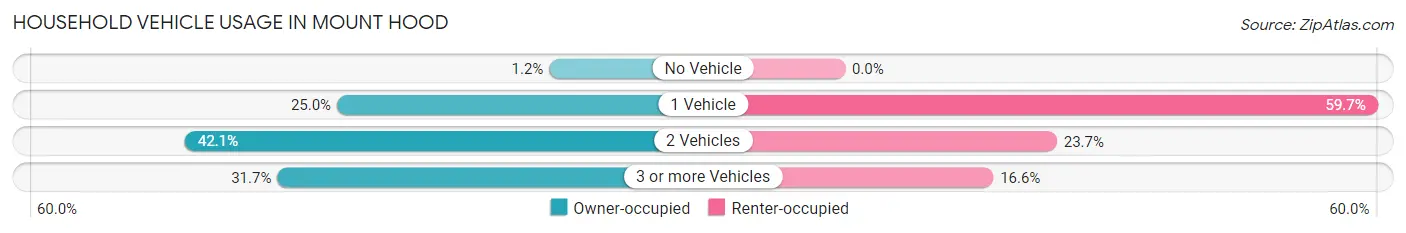
| Vehicles per Household | Owner-occupied | Renter-occupied |
| No Vehicle | 22 (1.2%) | 0 (0.0%) |
| 1 Vehicle | 445 (25.0%) | 176 (59.7%) |
| 2 Vehicles | 748 (42.0%) | 70 (23.7%) |
| 3 or more Vehicles | 564 (31.7%) | 49 (16.6%) |
| Total | 1,779 (100.0%) | 295 (100.0%) |
Real Estate & Mortgages in Mount Hood
Real Estate and Mortgage Overview in Mount Hood
| Characteristic | Without Mortgage | With Mortgage |
| Housing Units | 495 | 1,284 |
| Median Property Value | $472,700 | $442,200 |
| Median Household Income | $90,104 | $360 |
| Monthly Housing Costs | $722 | $146 |
| Real Estate Taxes | $4,065 | $43 |
Property Value by Mortgage Status in Mount Hood
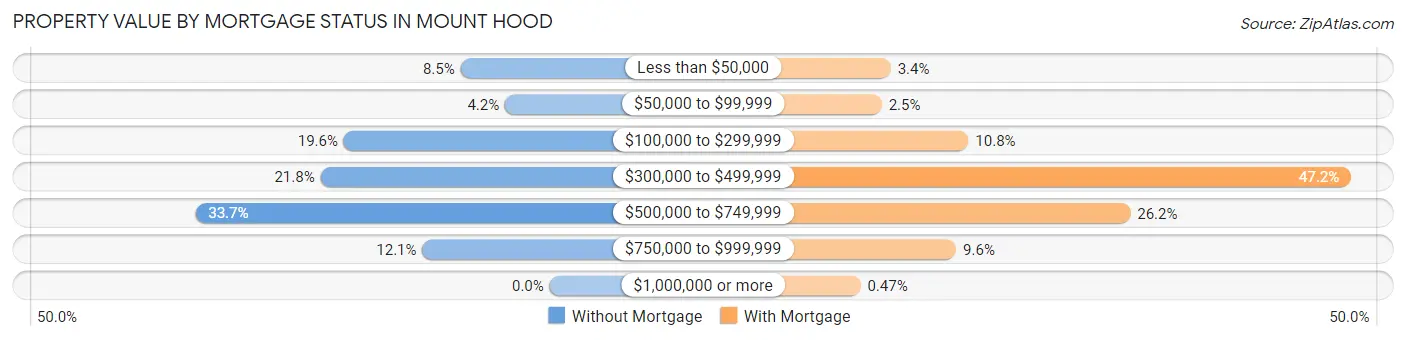
| Property Value | Without Mortgage | With Mortgage |
| Less than $50,000 | 42 (8.5%) | 43 (3.4%) |
| $50,000 to $99,999 | 21 (4.2%) | 32 (2.5%) |
| $100,000 to $299,999 | 97 (19.6%) | 138 (10.7%) |
| $300,000 to $499,999 | 108 (21.8%) | 606 (47.2%) |
| $500,000 to $749,999 | 167 (33.7%) | 336 (26.2%) |
| $750,000 to $999,999 | 60 (12.1%) | 123 (9.6%) |
| $1,000,000 or more | 0 (0.0%) | 6 (0.5%) |
| Total | 495 (100.0%) | 1,284 (100.0%) |
Household Income by Mortgage Status in Mount Hood
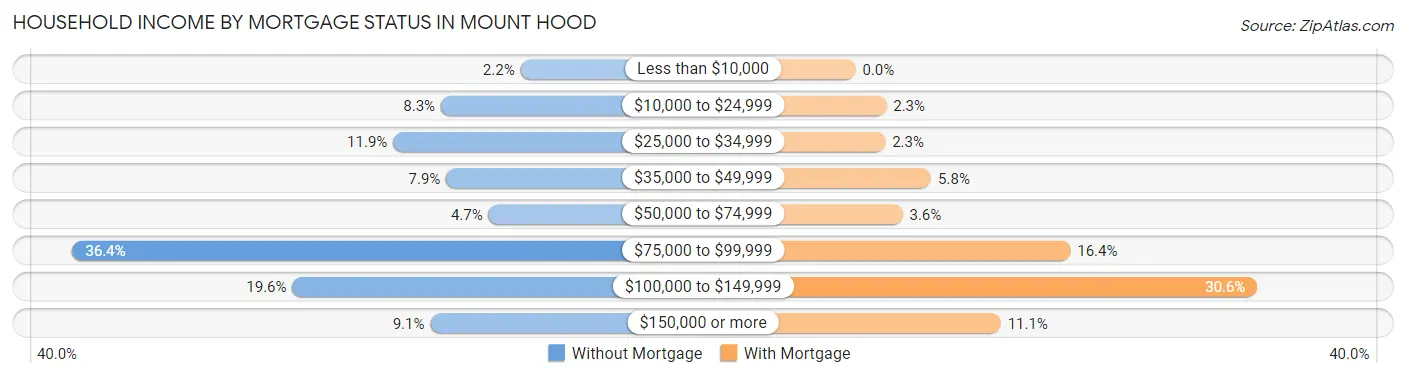
| Household Income | Without Mortgage | With Mortgage |
| Less than $10,000 | 11 (2.2%) | 0 (0.0%) |
| $10,000 to $24,999 | 41 (8.3%) | 30 (2.3%) |
| $25,000 to $34,999 | 59 (11.9%) | 29 (2.3%) |
| $35,000 to $49,999 | 39 (7.9%) | 74 (5.8%) |
| $50,000 to $74,999 | 23 (4.6%) | 46 (3.6%) |
| $75,000 to $99,999 | 180 (36.4%) | 210 (16.4%) |
| $100,000 to $149,999 | 97 (19.6%) | 393 (30.6%) |
| $150,000 or more | 45 (9.1%) | 142 (11.1%) |
| Total | 495 (100.0%) | 1,284 (100.0%) |
Property Value to Household Income Ratio in Mount Hood
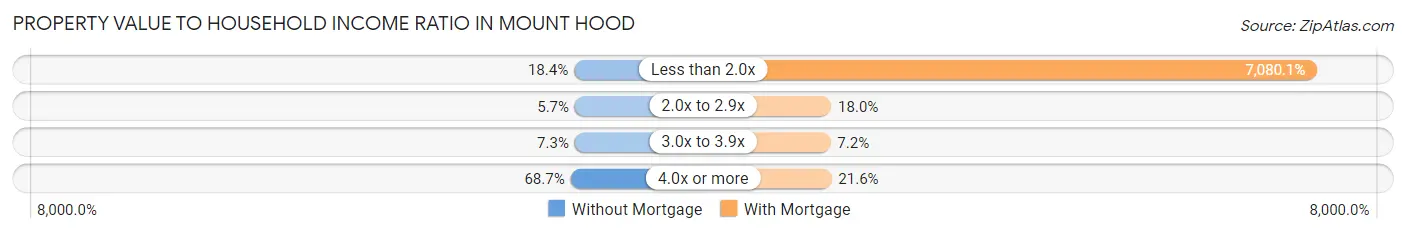
| Value-to-Income Ratio | Without Mortgage | With Mortgage |
| Less than 2.0x | 91 (18.4%) | 90,909 (7,080.1%) |
| 2.0x to 2.9x | 28 (5.7%) | 231 (18.0%) |
| 3.0x to 3.9x | 36 (7.3%) | 93 (7.2%) |
| 4.0x or more | 340 (68.7%) | 277 (21.6%) |
| Total | 495 (100.0%) | 1,284 (100.0%) |
Real Estate Taxes by Mortgage Status in Mount Hood
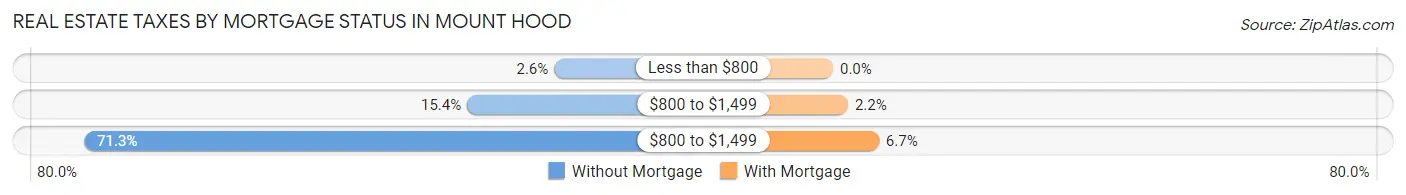
| Property Taxes | Without Mortgage | With Mortgage |
| Less than $800 | 13 (2.6%) | 0 (0.0%) |
| $800 to $1,499 | 76 (15.3%) | 28 (2.2%) |
| $800 to $1,499 | 353 (71.3%) | 86 (6.7%) |
| Total | 495 (100.0%) | 1,284 (100.0%) |
Health & Disability in Mount Hood
Health Insurance Coverage by Age in Mount Hood
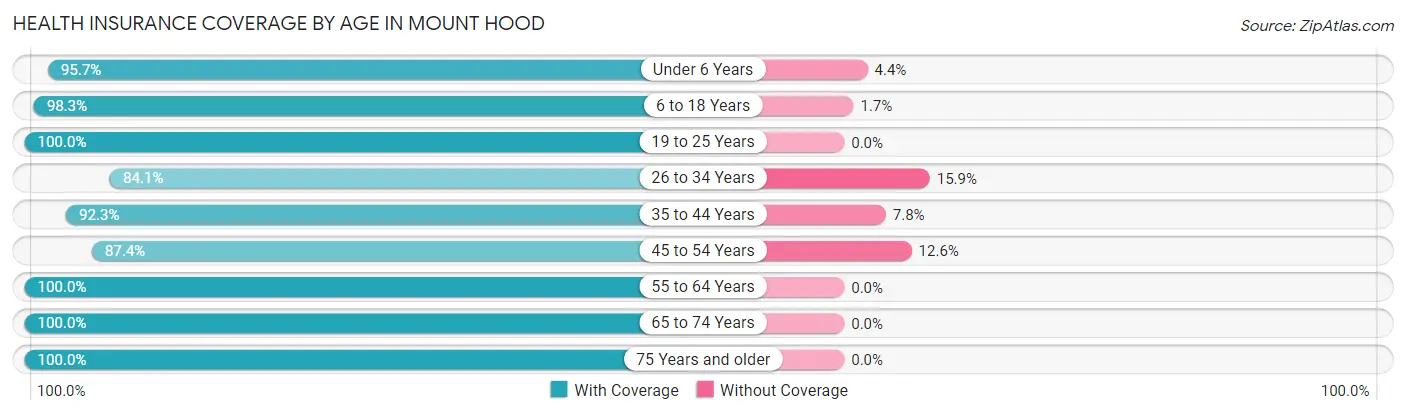
| Age Bracket | With Coverage | Without Coverage |
| Under 6 Years | 220 (95.7%) | 10 (4.3%) |
| 6 to 18 Years | 514 (98.3%) | 9 (1.7%) |
| 19 to 25 Years | 368 (100.0%) | 0 (0.0%) |
| 26 to 34 Years | 422 (84.1%) | 80 (15.9%) |
| 35 to 44 Years | 393 (92.2%) | 33 (7.7%) |
| 45 to 54 Years | 710 (87.4%) | 102 (12.6%) |
| 55 to 64 Years | 619 (100.0%) | 0 (0.0%) |
| 65 to 74 Years | 785 (100.0%) | 0 (0.0%) |
| 75 Years and older | 387 (100.0%) | 0 (0.0%) |
| Total | 4,418 (95.0%) | 234 (5.0%) |
Health Insurance Coverage by Citizenship Status in Mount Hood
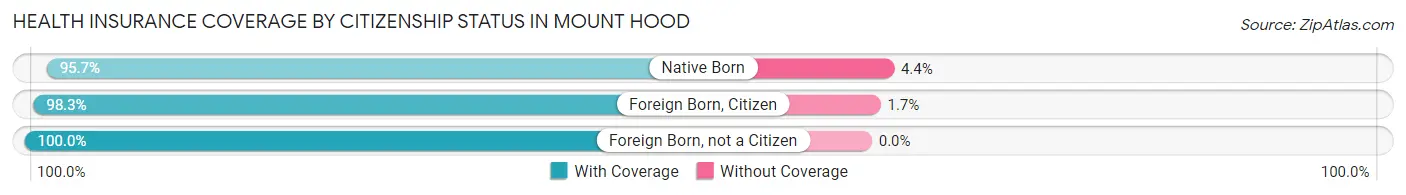
| Citizenship Status | With Coverage | Without Coverage |
| Native Born | 220 (95.7%) | 10 (4.3%) |
| Foreign Born, Citizen | 514 (98.3%) | 9 (1.7%) |
| Foreign Born, not a Citizen | 368 (100.0%) | 0 (0.0%) |
Health Insurance Coverage by Household Income in Mount Hood
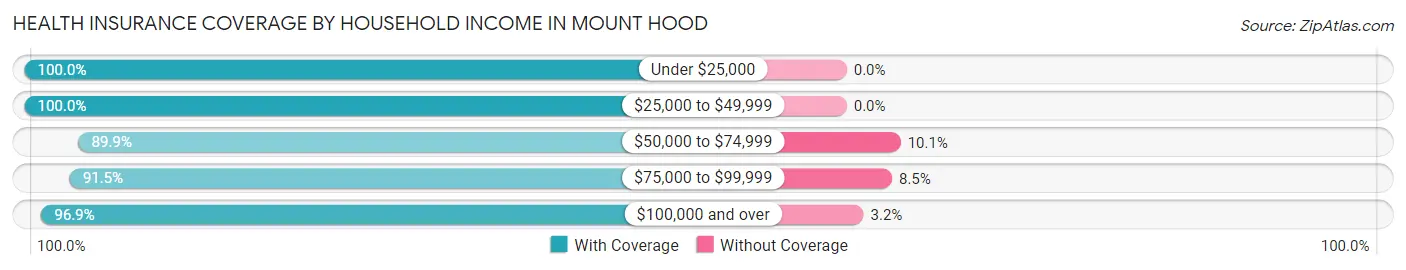
| Household Income | With Coverage | Without Coverage |
| Under $25,000 | 344 (100.0%) | 0 (0.0%) |
| $25,000 to $49,999 | 549 (100.0%) | 0 (0.0%) |
| $50,000 to $74,999 | 463 (89.9%) | 52 (10.1%) |
| $75,000 to $99,999 | 1,371 (91.5%) | 127 (8.5%) |
| $100,000 and over | 1,691 (96.9%) | 55 (3.2%) |
Public vs Private Health Insurance Coverage by Age in Mount Hood
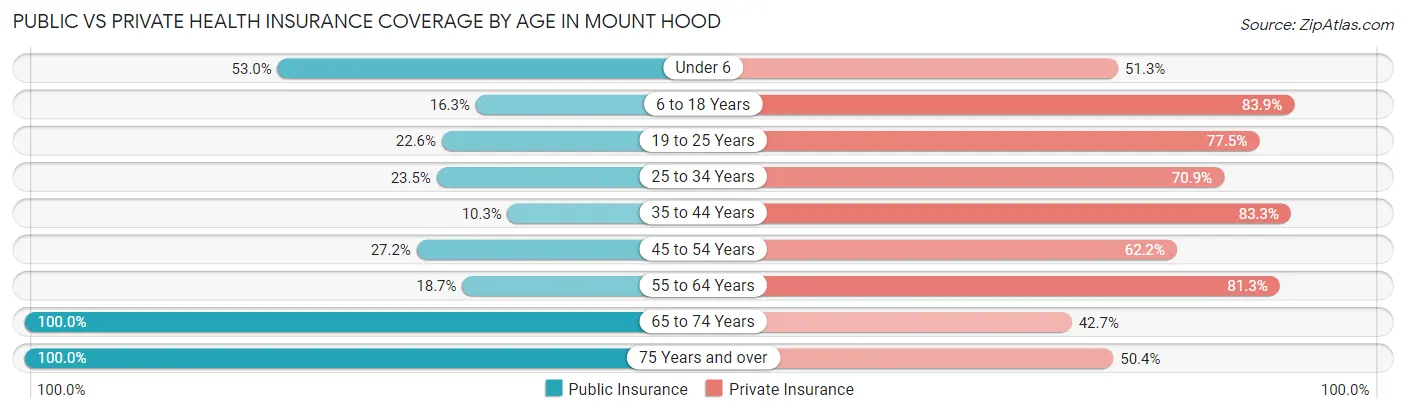
| Age Bracket | Public Insurance | Private Insurance |
| Under 6 | 122 (53.0%) | 118 (51.3%) |
| 6 to 18 Years | 85 (16.3%) | 439 (83.9%) |
| 19 to 25 Years | 83 (22.6%) | 285 (77.4%) |
| 25 to 34 Years | 118 (23.5%) | 356 (70.9%) |
| 35 to 44 Years | 44 (10.3%) | 355 (83.3%) |
| 45 to 54 Years | 221 (27.2%) | 505 (62.2%) |
| 55 to 64 Years | 116 (18.7%) | 503 (81.3%) |
| 65 to 74 Years | 785 (100.0%) | 335 (42.7%) |
| 75 Years and over | 387 (100.0%) | 195 (50.4%) |
| Total | 1,961 (42.1%) | 3,091 (66.4%) |
Disability Status by Sex by Age in Mount Hood
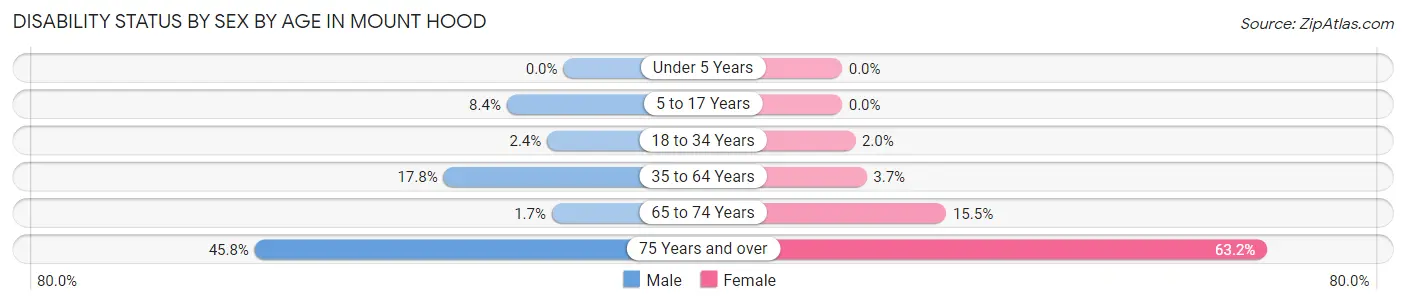
| Age Bracket | Male | Female |
| Under 5 Years | 0 (0.0%) | 0 (0.0%) |
| 5 to 17 Years | 19 (8.4%) | 0 (0.0%) |
| 18 to 34 Years | 11 (2.4%) | 9 (1.9%) |
| 35 to 64 Years | 194 (17.8%) | 28 (3.6%) |
| 65 to 74 Years | 7 (1.7%) | 58 (15.5%) |
| 75 Years and over | 99 (45.8%) | 108 (63.2%) |
Disability Class by Sex by Age in Mount Hood
Disability Class: Hearing Difficulty
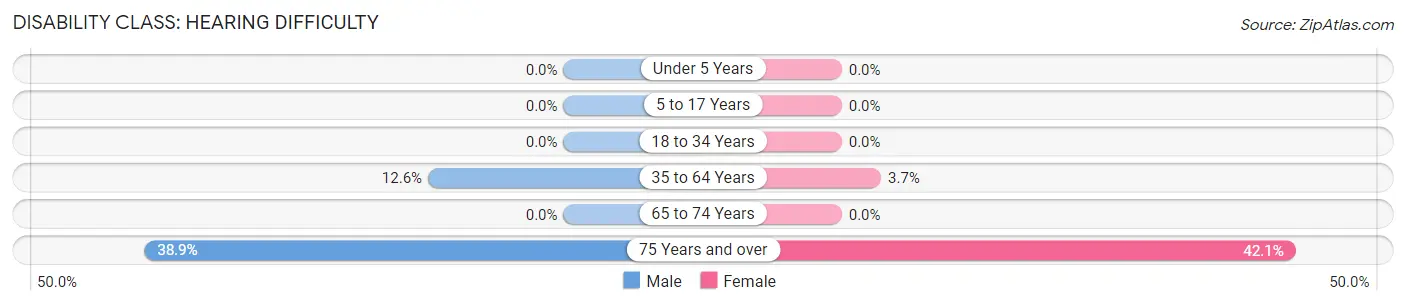
| Age Bracket | Male | Female |
| Under 5 Years | 0 (0.0%) | 0 (0.0%) |
| 5 to 17 Years | 0 (0.0%) | 0 (0.0%) |
| 18 to 34 Years | 0 (0.0%) | 0 (0.0%) |
| 35 to 64 Years | 137 (12.6%) | 28 (3.6%) |
| 65 to 74 Years | 0 (0.0%) | 0 (0.0%) |
| 75 Years and over | 84 (38.9%) | 72 (42.1%) |
Disability Class: Vision Difficulty
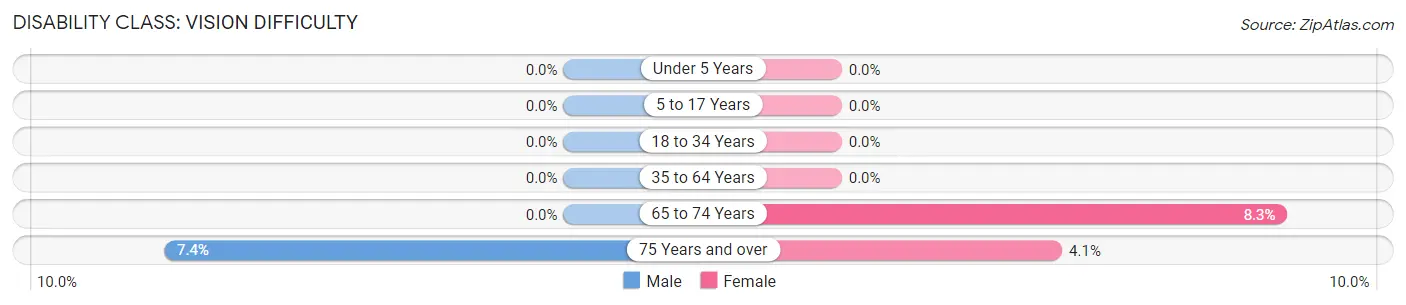
| Age Bracket | Male | Female |
| Under 5 Years | 0 (0.0%) | 0 (0.0%) |
| 5 to 17 Years | 0 (0.0%) | 0 (0.0%) |
| 18 to 34 Years | 0 (0.0%) | 0 (0.0%) |
| 35 to 64 Years | 0 (0.0%) | 0 (0.0%) |
| 65 to 74 Years | 0 (0.0%) | 31 (8.3%) |
| 75 Years and over | 16 (7.4%) | 7 (4.1%) |
Disability Class: Cognitive Difficulty
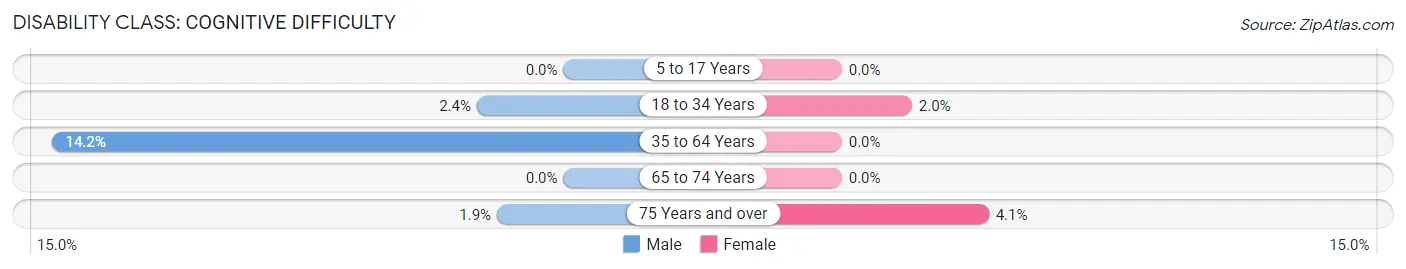
| Age Bracket | Male | Female |
| 5 to 17 Years | 0 (0.0%) | 0 (0.0%) |
| 18 to 34 Years | 11 (2.4%) | 9 (1.9%) |
| 35 to 64 Years | 155 (14.2%) | 0 (0.0%) |
| 65 to 74 Years | 0 (0.0%) | 0 (0.0%) |
| 75 Years and over | 4 (1.8%) | 7 (4.1%) |
Disability Class: Ambulatory Difficulty
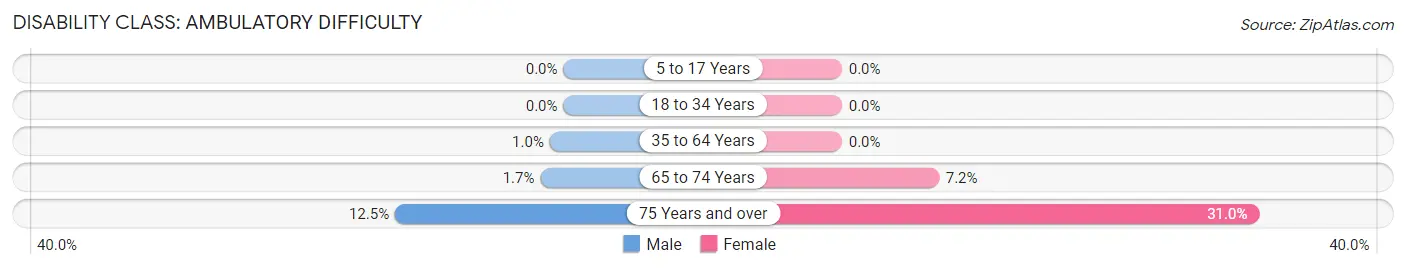
| Age Bracket | Male | Female |
| 5 to 17 Years | 0 (0.0%) | 0 (0.0%) |
| 18 to 34 Years | 0 (0.0%) | 0 (0.0%) |
| 35 to 64 Years | 11 (1.0%) | 0 (0.0%) |
| 65 to 74 Years | 7 (1.7%) | 27 (7.2%) |
| 75 Years and over | 27 (12.5%) | 53 (31.0%) |
Disability Class: Self-Care Difficulty
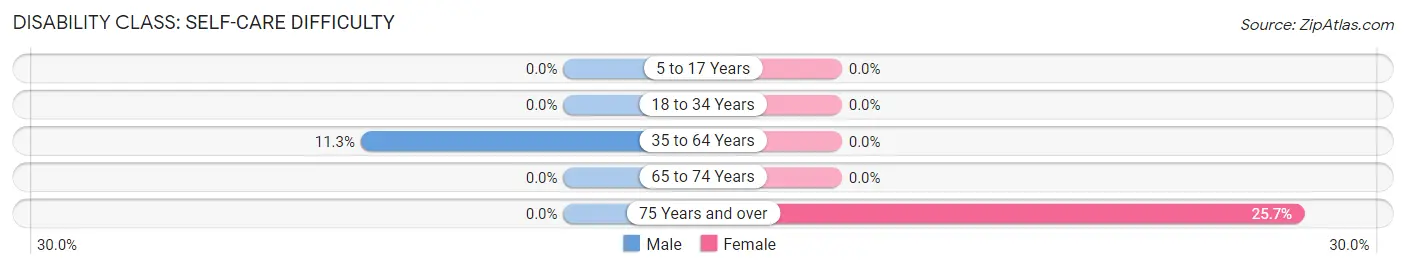
| Age Bracket | Male | Female |
| 5 to 17 Years | 0 (0.0%) | 0 (0.0%) |
| 18 to 34 Years | 0 (0.0%) | 0 (0.0%) |
| 35 to 64 Years | 123 (11.3%) | 0 (0.0%) |
| 65 to 74 Years | 0 (0.0%) | 0 (0.0%) |
| 75 Years and over | 0 (0.0%) | 44 (25.7%) |
Technology Access in Mount Hood
Computing Device Access in Mount Hood
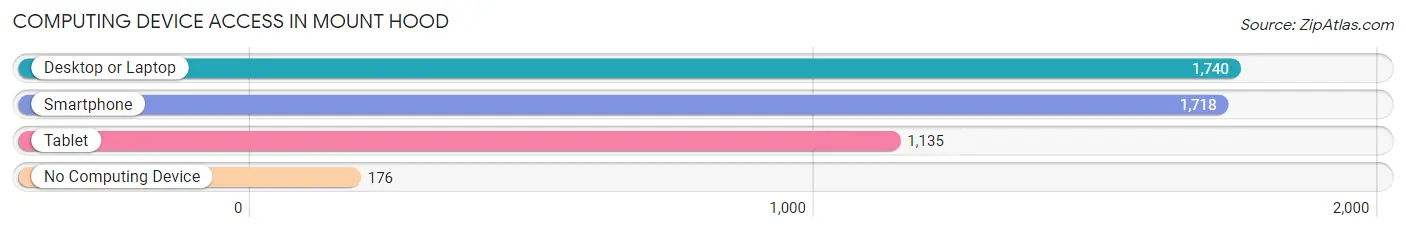
| Device Type | # Households | % Households |
| Desktop or Laptop | 1,740 | 83.9% |
| Smartphone | 1,718 | 82.8% |
| Tablet | 1,135 | 54.7% |
| No Computing Device | 176 | 8.5% |
| Total | 2,074 | 100.0% |
Internet Access in Mount Hood
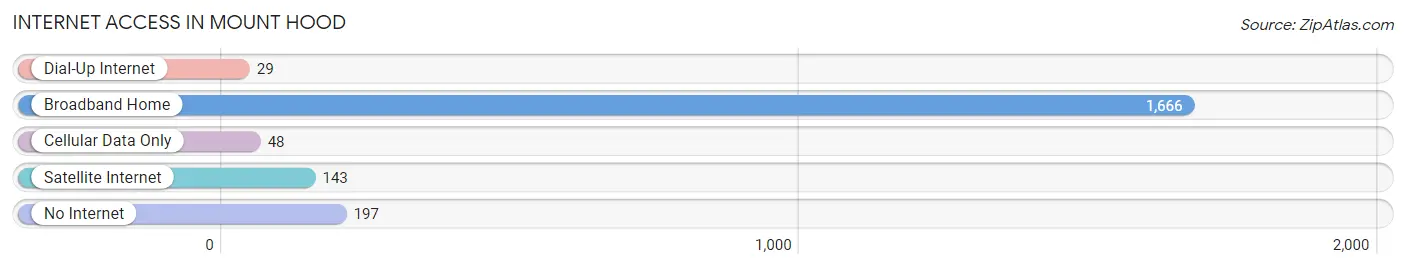
| Internet Type | # Households | % Households |
| Dial-Up Internet | 29 | 1.4% |
| Broadband Home | 1,666 | 80.3% |
| Cellular Data Only | 48 | 2.3% |
| Satellite Internet | 143 | 6.9% |
| No Internet | 197 | 9.5% |
| Total | 2,074 | 100.0% |
Mount Hood Summary
Mount Hood is a stratovolcano located in the Cascade Range of Oregon, United States. It is the highest mountain in the state and the fourth highest in the Cascade Range. Mount Hood is located about 50 miles east of Portland, Oregon and is part of the Cascade Volcanic Arc, a segment of the Pacific Ring of Fire that includes over 160 active volcanoes. The mountain is a popular destination for outdoor recreation, including skiing, hiking, and camping.
Geography
Mount Hood is located in the Cascade Range of Oregon, United States. It is the highest mountain in the state and the fourth highest in the Cascade Range. The mountain is located about 50 miles east of Portland, Oregon and is part of the Cascade Volcanic Arc, a segment of the Pacific Ring of Fire that includes over 160 active volcanoes. Mount Hood is a stratovolcano, which is a type of volcano composed of alternating layers of lava and ash. The mountain is 11,249 feet tall and is the highest point in Oregon.
Mount Hood is surrounded by the Mount Hood National Forest, which covers over 1.1 million acres of land. The forest is home to a variety of wildlife, including black bears, cougars, elk, and deer. The mountain is also home to several glaciers, including the Palmer Glacier, the White River Glacier, and the Eliot Glacier.
History
Mount Hood has been an important part of Oregon’s history for centuries. The mountain has been a sacred site for Native American tribes, including the Multnomah, Wasco, and Clackamas. The mountain was first sighted by Europeans in 1792, when British explorer George Vancouver sailed up the Columbia River. The mountain was named after British Admiral Samuel Hood by Vancouver.
In the late 19th century, the mountain became a popular destination for outdoor recreation. The first ski resort on the mountain was established in 1927, and the first ski lift was installed in 1939. The mountain has since become a popular destination for skiing, snowboarding, hiking, and camping.
Economy
Mount Hood is an important part of Oregon’s economy. The mountain is a popular destination for outdoor recreation, and the surrounding area is home to several ski resorts, including Timberline Lodge, Mount Hood Meadows, and Ski Bowl. The mountain is also home to several campgrounds, lodges, and other tourist attractions.
The mountain is also home to several timber companies, which harvest timber from the surrounding forests. The timber industry is an important part of the local economy, and the timber harvested from the mountain is used for a variety of purposes, including construction and furniture making.
Demographics
The population of Mount Hood is estimated to be around 1,000 people. The majority of the population is white (90%), followed by Hispanic (4%), Asian (2%), and African American (1%). The median household income is $50,000, and the median age is 40.
Mount Hood is a popular destination for outdoor recreation, and the surrounding area is home to several ski resorts, campgrounds, and other tourist attractions. The mountain is also home to several timber companies, which harvest timber from the surrounding forests. The mountain is an important part of Oregon’s economy and is a popular destination for outdoor recreation.
Common Questions
What is Per Capita Income in Mount Hood?
Per Capita income in Mount Hood is $49,263.
What is the Median Family Income in Mount Hood?
Median Family Income in Mount Hood is $95,789.
What is the Median Household income in Mount Hood?
Median Household Income in Mount Hood is $86,459.
What is Income or Wage Gap in Mount Hood?
Income or Wage Gap in Mount Hood is 19.3%.
Women in Mount Hood earn 80.7 cents for every dollar earned by a man.
What is Inequality or Gini Index in Mount Hood?
Inequality or Gini Index in Mount Hood is 0.42.
What is the Total Population of Mount Hood?
Total Population of Mount Hood is 4,663.
What is the Total Male Population of Mount Hood?
Total Male Population of Mount Hood is 2,539.
What is the Total Female Population of Mount Hood?
Total Female Population of Mount Hood is 2,124.
What is the Ratio of Males per 100 Females in Mount Hood?
There are 119.54 Males per 100 Females in Mount Hood.
What is the Ratio of Females per 100 Males in Mount Hood?
There are 83.65 Females per 100 Males in Mount Hood.
What is the Median Population Age in Mount Hood?
Median Population Age in Mount Hood is 49.8 Years.
What is the Average Family Size in Mount Hood
Average Family Size in Mount Hood is 2.8 People.
What is the Average Household Size in Mount Hood
Average Household Size in Mount Hood is 2.2 People.
How Large is the Labor Force in Mount Hood?
There are 2,485 People in the Labor Forcein in Mount Hood.
What is the Percentage of People in the Labor Force in Mount Hood?
61.3% of People are in the Labor Force in Mount Hood.
What is the Unemployment Rate in Mount Hood?
Unemployment Rate in Mount Hood is 4.7%.