Summit, OR Map & Demographics
Summit Map
Summit Overview
$31,131
PER CAPITA INCOME
$116,429
AVG FAMILY INCOME
$116,429
AVG HOUSEHOLD INCOME
0.19
INEQUALITY / GINI INDEX
177
TOTAL POPULATION
62
MALE POPULATION
115
FEMALE POPULATION
53.91
MALES / 100 FEMALES
185.48
FEMALES / 100 MALES
24.0
MEDIAN AGE
3.7
AVG FAMILY SIZE
4.2
AVG HOUSEHOLD SIZE
107
LABOR FORCE [ PEOPLE ]
88.4%
PERCENT IN LABOR FORCE
7.5%
UNEMPLOYMENT RATE
Income in Summit
Income Overview in Summit
Per Capita Income in Summit is $31,131, while median incomes of families and households are $116,429 and $116,429 respectively.
| Characteristic | Number | Measure |
| Per Capita Income | 177 | $31,131 |
| Median Family Income | 42 | $116,429 |
| Mean Family Income | 42 | $127,852 |
| Median Household Income | 42 | $116,429 |
| Mean Household Income | 42 | $131,160 |
| Income Deficit | 42 | $0 |
| Wage / Income Gap (%) | 177 | 0.00% |
| Wage / Income Gap ($) | 177 | 100.00¢ per $1 |
| Gini / Inequality Index | 177 | 0.19 |
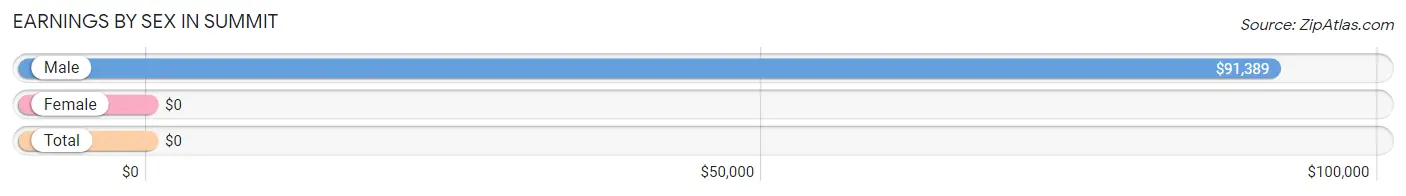
Earnings by Sex in Summit
| Sex | Number | Average Earnings |
| Male | 46 (43.0%) | $91,389 |
| Female | 61 (57.0%) | $0 |
| Total | 107 (100.0%) | $0 |
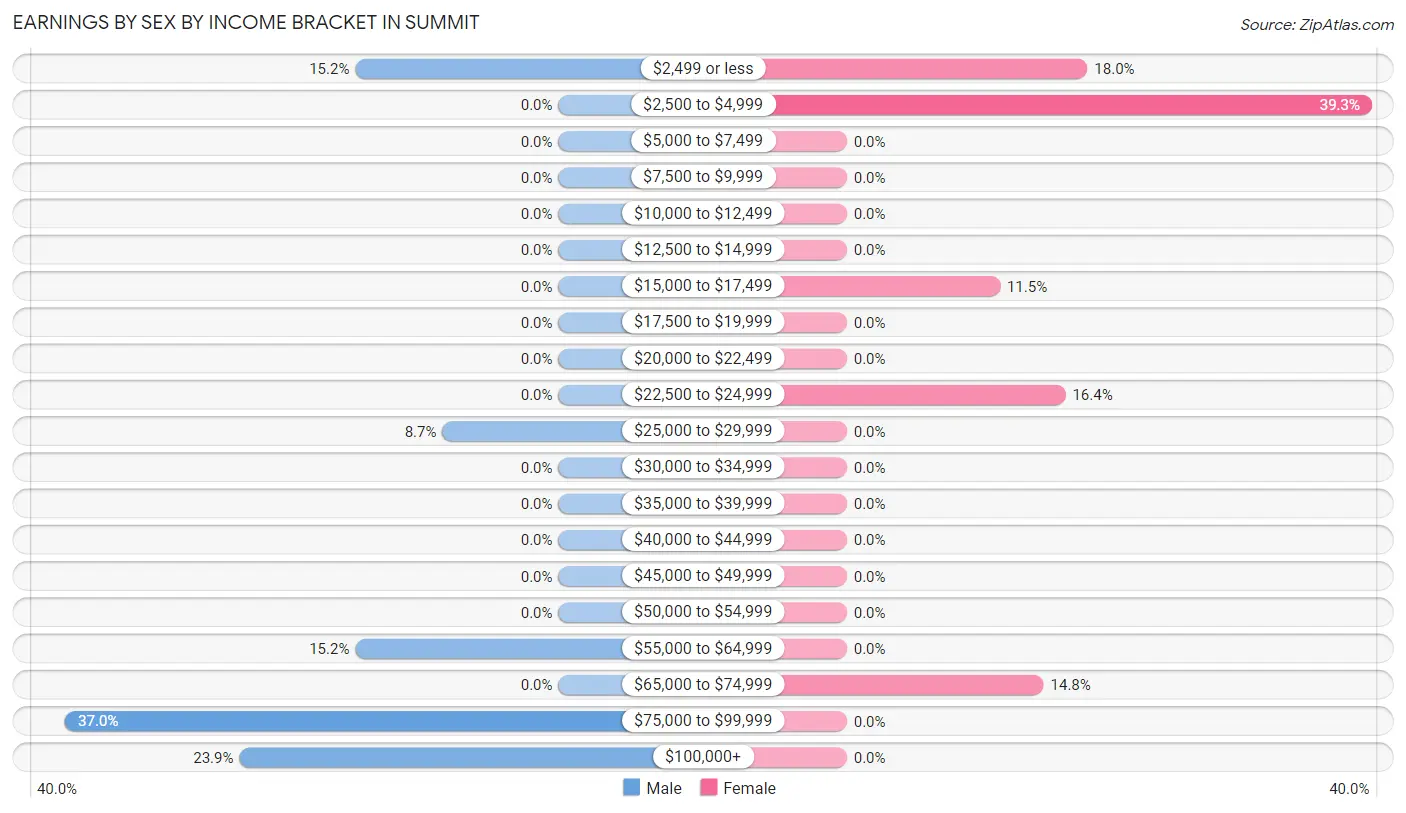
Earnings by Sex by Income Bracket in Summit
The most common earnings brackets in Summit are $75,000 to $99,999 for men (17 | 37.0%) and $2,500 to $4,999 for women (24 | 39.3%).
| Income | Male | Female |
| $2,499 or less | 7 (15.2%) | 11 (18.0%) |
| $2,500 to $4,999 | 0 (0.0%) | 24 (39.3%) |
| $5,000 to $7,499 | 0 (0.0%) | 0 (0.0%) |
| $7,500 to $9,999 | 0 (0.0%) | 0 (0.0%) |
| $10,000 to $12,499 | 0 (0.0%) | 0 (0.0%) |
| $12,500 to $14,999 | 0 (0.0%) | 0 (0.0%) |
| $15,000 to $17,499 | 0 (0.0%) | 7 (11.5%) |
| $17,500 to $19,999 | 0 (0.0%) | 0 (0.0%) |
| $20,000 to $22,499 | 0 (0.0%) | 0 (0.0%) |
| $22,500 to $24,999 | 0 (0.0%) | 10 (16.4%) |
| $25,000 to $29,999 | 4 (8.7%) | 0 (0.0%) |
| $30,000 to $34,999 | 0 (0.0%) | 0 (0.0%) |
| $35,000 to $39,999 | 0 (0.0%) | 0 (0.0%) |
| $40,000 to $44,999 | 0 (0.0%) | 0 (0.0%) |
| $45,000 to $49,999 | 0 (0.0%) | 0 (0.0%) |
| $50,000 to $54,999 | 0 (0.0%) | 0 (0.0%) |
| $55,000 to $64,999 | 7 (15.2%) | 0 (0.0%) |
| $65,000 to $74,999 | 0 (0.0%) | 9 (14.7%) |
| $75,000 to $99,999 | 17 (37.0%) | 0 (0.0%) |
| $100,000+ | 11 (23.9%) | 0 (0.0%) |
| Total | 46 (100.0%) | 61 (100.0%) |
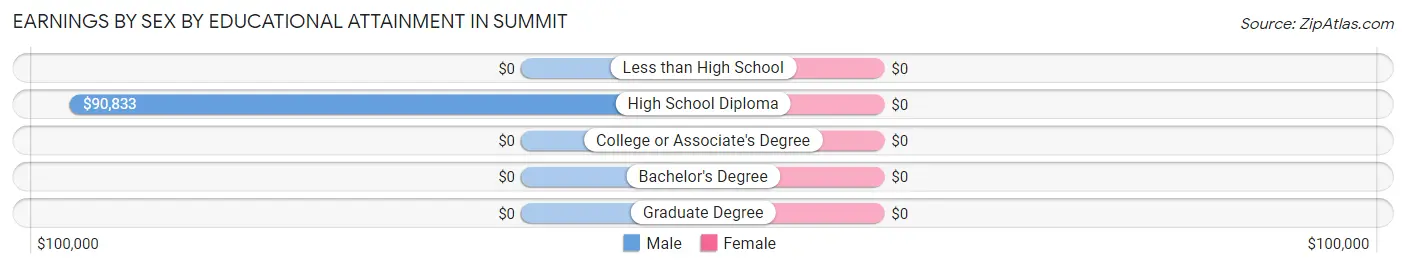
Earnings by Sex by Educational Attainment in Summit
| Educational Attainment | Male Income | Female Income |
| Less than High School | - | - |
| High School Diploma | $90,833 | $0 |
| College or Associate's Degree | - | - |
| Bachelor's Degree | - | - |
| Graduate Degree | - | - |
| Total | $91,389 | $0 |
Family Income in Summit
Family Income Brackets in Summit
According to the Summit family income data, there are 26 families falling into the $100,000 to $149,999 income range, which is the most common income bracket and makes up 61.9% of all families.
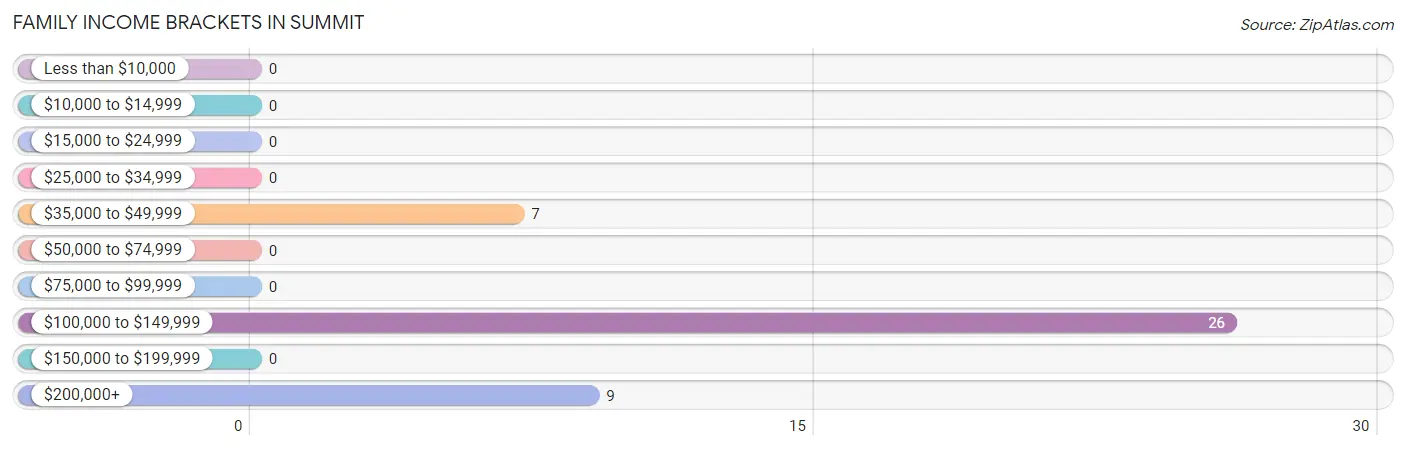
| Income Bracket | # Families | % Families |
| Less than $10,000 | 0 | 0.0% |
| $10,000 to $14,999 | 0 | 0.0% |
| $15,000 to $24,999 | 0 | 0.0% |
| $25,000 to $34,999 | 0 | 0.0% |
| $35,000 to $49,999 | 7 | 16.7% |
| $50,000 to $74,999 | 0 | 0.0% |
| $75,000 to $99,999 | 0 | 0.0% |
| $100,000 to $149,999 | 26 | 61.9% |
| $150,000 to $199,999 | 0 | 0.0% |
| $200,000+ | 9 | 21.4% |
Family Income by Famaliy Size in Summit
3-person families (24 | 57.1%) account for the highest median family income in Summit with $113,750 per family, while 3-person families (24 | 57.1%) have the highest median income of $37,917 per family member.
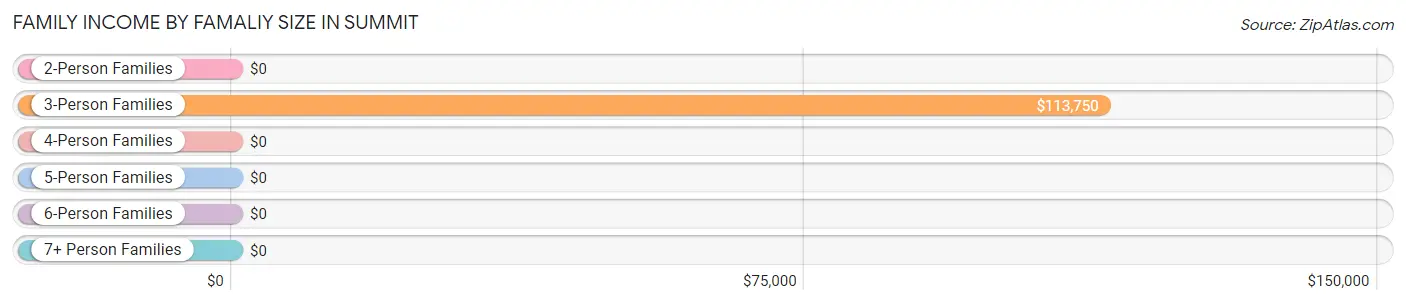
| Income Bracket | # Families | Median Income |
| 2-Person Families | 0 (0.0%) | $0 |
| 3-Person Families | 24 (57.1%) | $113,750 |
| 4-Person Families | 18 (42.9%) | $0 |
| 5-Person Families | 0 (0.0%) | $0 |
| 6-Person Families | 0 (0.0%) | $0 |
| 7+ Person Families | 0 (0.0%) | $0 |
| Total | 42 (100.0%) | $116,429 |
Family Income by Number of Earners in Summit
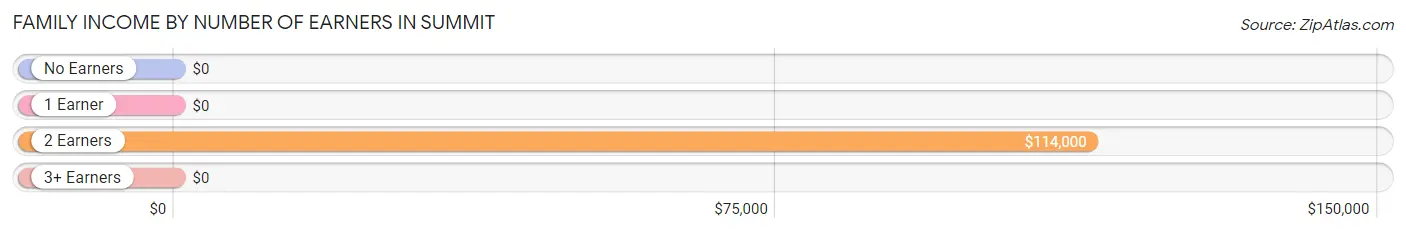
| Number of Earners | # Families | Median Income |
| No Earners | 0 (0.0%) | $0 |
| 1 Earner | 0 (0.0%) | $0 |
| 2 Earners | 26 (61.9%) | $114,000 |
| 3+ Earners | 16 (38.1%) | $0 |
| Total | 42 (100.0%) | $116,429 |
Household Income in Summit
Household Income Brackets in Summit
With 26 households falling in the category, the $100,000 to $149,999 income range is the most frequent in Summit, accounting for 61.9% of all households.
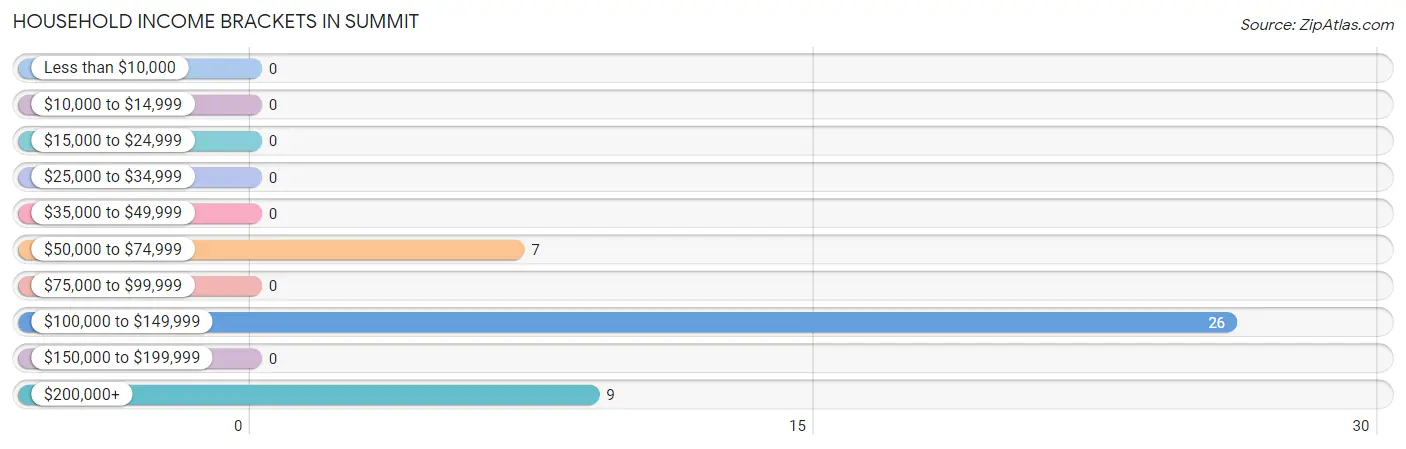
| Income Bracket | # Households | % Households |
| Less than $10,000 | 0 | 0.0% |
| $10,000 to $14,999 | 0 | 0.0% |
| $15,000 to $24,999 | 0 | 0.0% |
| $25,000 to $34,999 | 0 | 0.0% |
| $35,000 to $49,999 | 0 | 0.0% |
| $50,000 to $74,999 | 7 | 16.7% |
| $75,000 to $99,999 | 0 | 0.0% |
| $100,000 to $149,999 | 26 | 61.9% |
| $150,000 to $199,999 | 0 | 0.0% |
| $200,000+ | 9 | 21.4% |
Household Income by Householder Age in Summit
| Income Bracket | # Households | Median Income |
| 15 to 24 Years | 10 (23.8%) | $0 |
| 25 to 44 Years | 9 (21.4%) | $0 |
| 45 to 64 Years | 16 (38.1%) | $0 |
| 65+ Years | 7 (16.7%) | $0 |
| Total | 42 (100.0%) | $116,429 |
Poverty in Summit
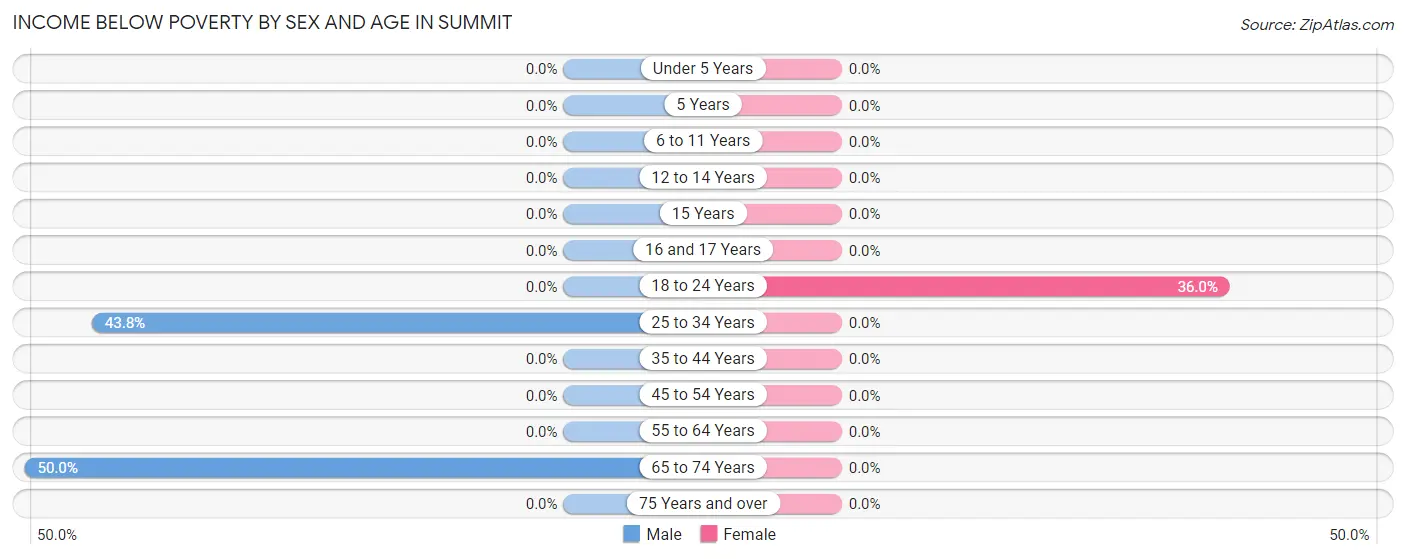
Income Below Poverty by Sex and Age in Summit
With 22.6% poverty level for males and 7.8% for females among the residents of Summit, 65 to 74 year old males and 18 to 24 year old females are the most vulnerable to poverty, with 7 males (50.0%) and 9 females (36.0%) in their respective age groups living below the poverty level.
| Age Bracket | Male | Female |
| Under 5 Years | 0 (0.0%) | 0 (0.0%) |
| 5 Years | 0 (0.0%) | 0 (0.0%) |
| 6 to 11 Years | 0 (0.0%) | 0 (0.0%) |
| 12 to 14 Years | 0 (0.0%) | 0 (0.0%) |
| 15 Years | 0 (0.0%) | 0 (0.0%) |
| 16 and 17 Years | 0 (0.0%) | 0 (0.0%) |
| 18 to 24 Years | 0 (0.0%) | 9 (36.0%) |
| 25 to 34 Years | 7 (43.8%) | 0 (0.0%) |
| 35 to 44 Years | 0 (0.0%) | 0 (0.0%) |
| 45 to 54 Years | 0 (0.0%) | 0 (0.0%) |
| 55 to 64 Years | 0 (0.0%) | 0 (0.0%) |
| 65 to 74 Years | 7 (50.0%) | 0 (0.0%) |
| 75 Years and over | 0 (0.0%) | 0 (0.0%) |
| Total | 14 (22.6%) | 9 (7.8%) |
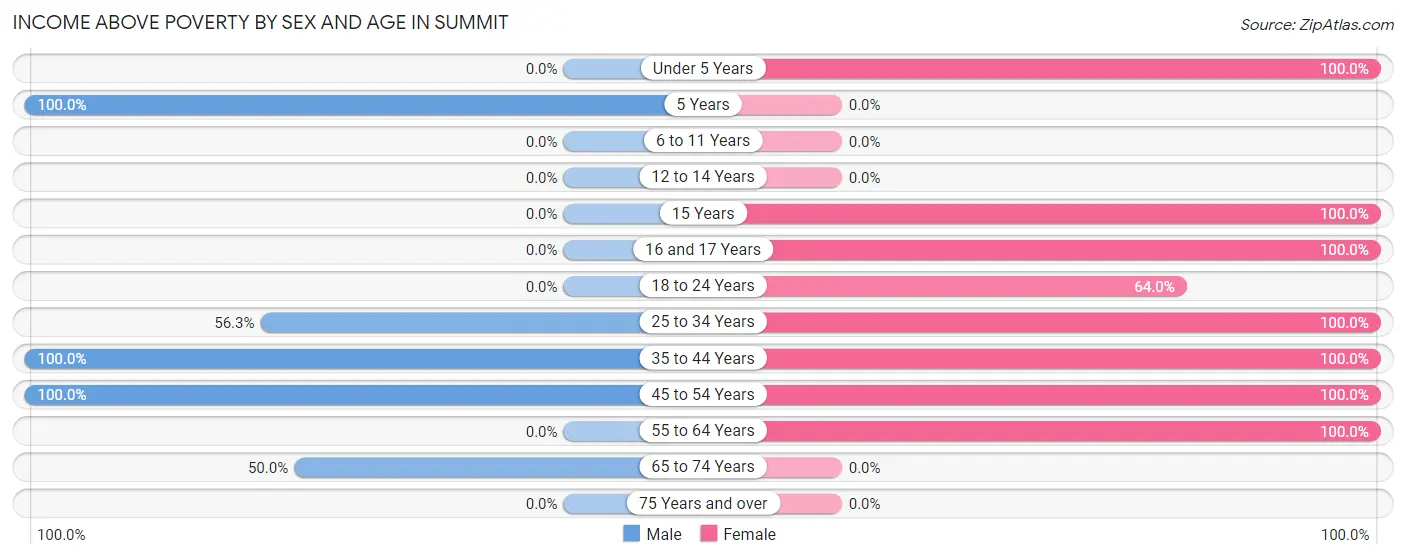
Income Above Poverty by Sex and Age in Summit
According to the poverty statistics in Summit, males aged 5 years and females aged under 5 years are the age groups that are most secure financially, with 100.0% of males and 100.0% of females in these age groups living above the poverty line.
| Age Bracket | Male | Female |
| Under 5 Years | 0 (0.0%) | 33 (100.0%) |
| 5 Years | 9 (100.0%) | 0 (0.0%) |
| 6 to 11 Years | 0 (0.0%) | 0 (0.0%) |
| 12 to 14 Years | 0 (0.0%) | 0 (0.0%) |
| 15 Years | 0 (0.0%) | 14 (100.0%) |
| 16 and 17 Years | 0 (0.0%) | 8 (100.0%) |
| 18 to 24 Years | 0 (0.0%) | 16 (64.0%) |
| 25 to 34 Years | 9 (56.2%) | 7 (100.0%) |
| 35 to 44 Years | 12 (100.0%) | 9 (100.0%) |
| 45 to 54 Years | 11 (100.0%) | 16 (100.0%) |
| 55 to 64 Years | 0 (0.0%) | 3 (100.0%) |
| 65 to 74 Years | 7 (50.0%) | 0 (0.0%) |
| 75 Years and over | 0 (0.0%) | 0 (0.0%) |
| Total | 48 (77.4%) | 106 (92.2%) |
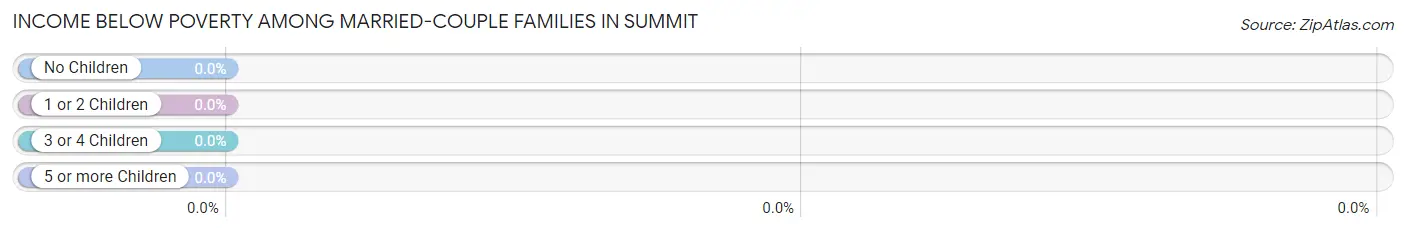
Income Below Poverty Among Married-Couple Families in Summit
| Children | Above Poverty | Below Poverty |
| No Children | 7 (100.0%) | 0 (0.0%) |
| 1 or 2 Children | 28 (100.0%) | 0 (0.0%) |
| 3 or 4 Children | 0 (0.0%) | 0 (0.0%) |
| 5 or more Children | 0 (0.0%) | 0 (0.0%) |
| Total | 35 (100.0%) | 0 (0.0%) |
Income Below Poverty Among Single-Parent Households in Summit
| Children | Single Father | Single Mother |
| No Children | 0 (0.0%) | 0 (0.0%) |
| 1 or 2 Children | 0 (0.0%) | 0 (0.0%) |
| 3 or 4 Children | 0 (0.0%) | 0 (0.0%) |
| 5 or more Children | 0 (0.0%) | 0 (0.0%) |
| Total | 0 (0.0%) | 0 (0.0%) |
Income Below Poverty Among Married-Couple vs Single-Parent Households in Summit
| Children | Married-Couple Families | Single-Parent Households |
| No Children | 0 (0.0%) | 0 (0.0%) |
| 1 or 2 Children | 0 (0.0%) | 0 (0.0%) |
| 3 or 4 Children | 0 (0.0%) | 0 (0.0%) |
| 5 or more Children | 0 (0.0%) | 0 (0.0%) |
| Total | 0 (0.0%) | 0 (0.0%) |
Race in Summit
The most populous races in Summit are White / Caucasian (170 | 96.1%), Hispanic or Latino (29 | 16.4%), and Two or more Races (7 | 4.0%).
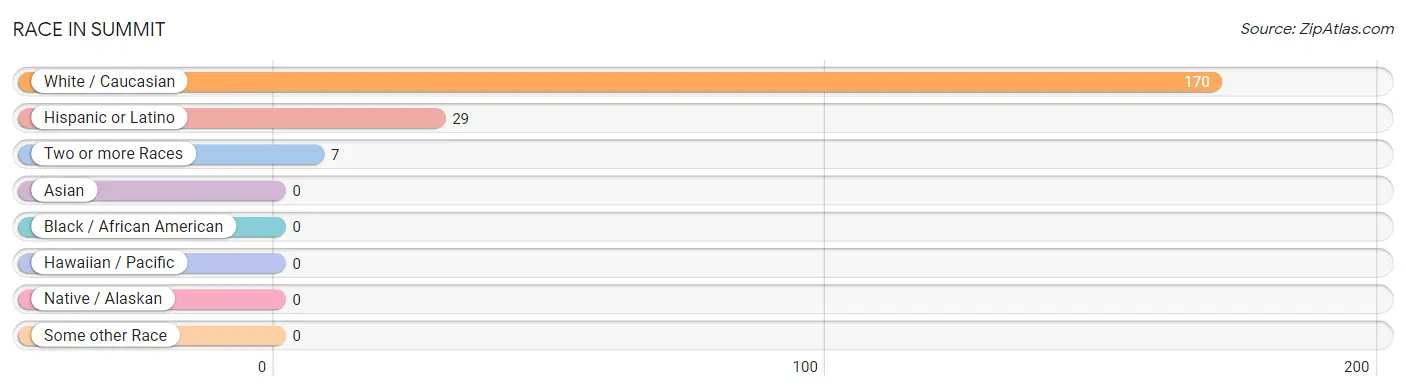
| Race | # Population | % Population |
| Asian | 0 | 0.0% |
| Black / African American | 0 | 0.0% |
| Hawaiian / Pacific | 0 | 0.0% |
| Hispanic or Latino | 29 | 16.4% |
| Native / Alaskan | 0 | 0.0% |
| White / Caucasian | 170 | 96.1% |
| Two or more Races | 7 | 4.0% |
| Some other Race | 0 | 0.0% |
| Total | 177 | 100.0% |
Ancestry in Summit
The most populous ancestries reported in Summit are Swedish (31 | 17.5%), Mexican (29 | 16.4%), German (17 | 9.6%), French (9 | 5.1%), and English (7 | 4.0%), together accounting for 52.5% of all Summit residents.
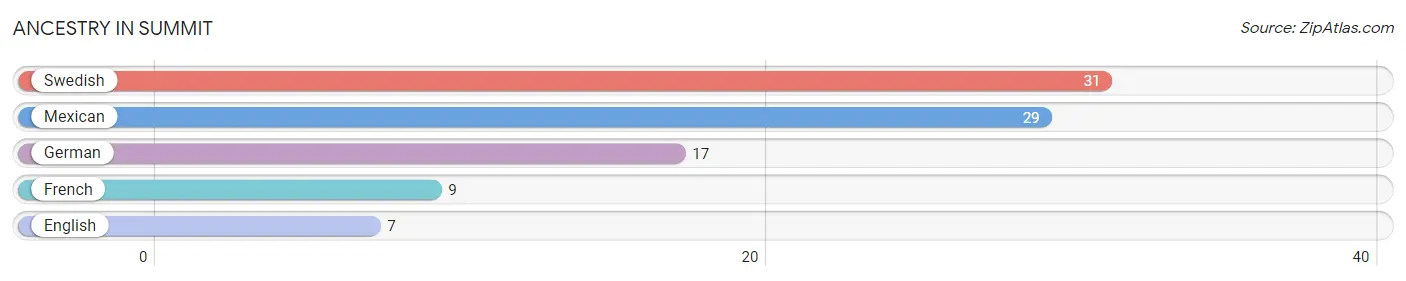
| Ancestry | # Population | % Population |
| English | 7 | 4.0% |
| French | 9 | 5.1% |
| German | 17 | 9.6% |
| Mexican | 29 | 16.4% |
| Swedish | 31 | 17.5% | View All 5 Rows |
Immigrants in Summit

| Immigration Origin | # Population | % Population | View All 0 Rows |
Sex and Age in Summit
Sex and Age in Summit
The most populous age groups in Summit are 65 to 69 Years (14 | 22.6%) for men and Under 5 Years (33 | 28.7%) for women.
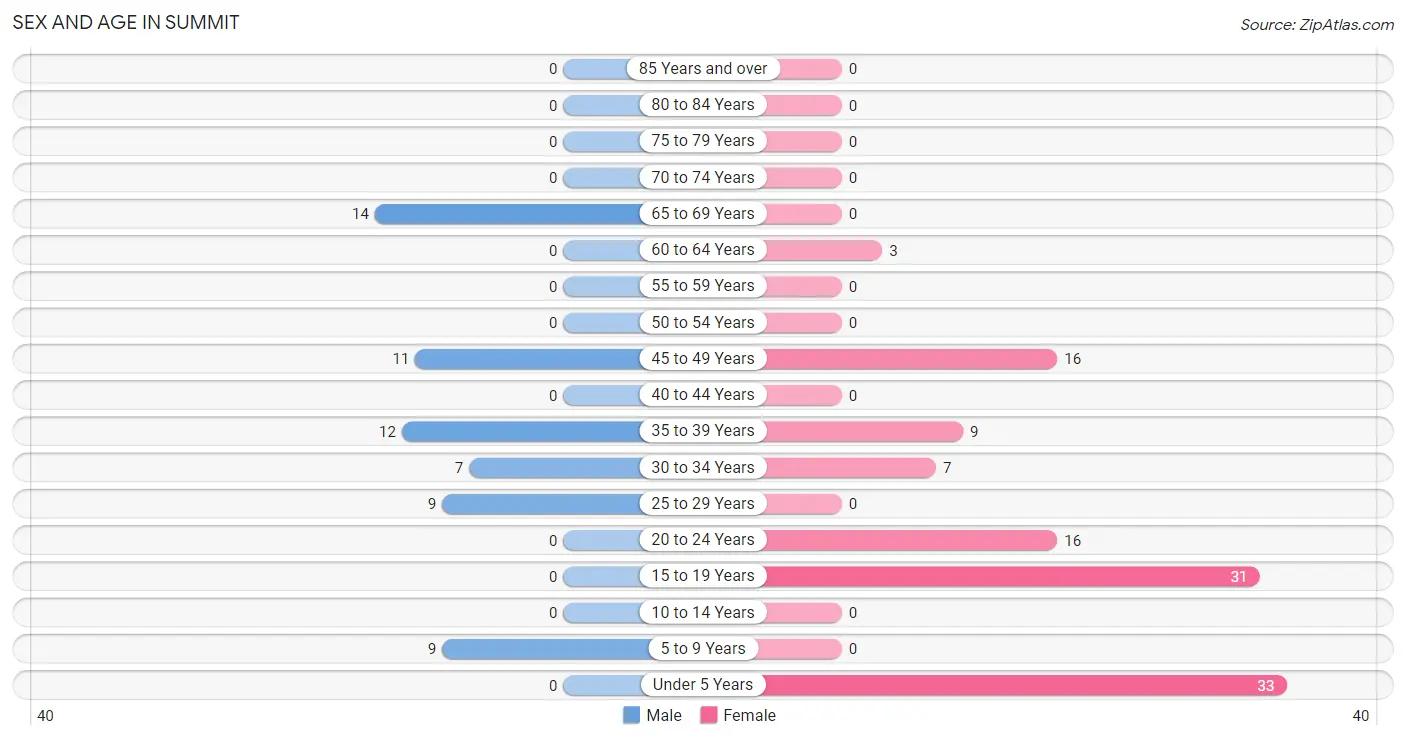
| Age Bracket | Male | Female |
| Under 5 Years | 0 (0.0%) | 33 (28.7%) |
| 5 to 9 Years | 9 (14.5%) | 0 (0.0%) |
| 10 to 14 Years | 0 (0.0%) | 0 (0.0%) |
| 15 to 19 Years | 0 (0.0%) | 31 (27.0%) |
| 20 to 24 Years | 0 (0.0%) | 16 (13.9%) |
| 25 to 29 Years | 9 (14.5%) | 0 (0.0%) |
| 30 to 34 Years | 7 (11.3%) | 7 (6.1%) |
| 35 to 39 Years | 12 (19.4%) | 9 (7.8%) |
| 40 to 44 Years | 0 (0.0%) | 0 (0.0%) |
| 45 to 49 Years | 11 (17.7%) | 16 (13.9%) |
| 50 to 54 Years | 0 (0.0%) | 0 (0.0%) |
| 55 to 59 Years | 0 (0.0%) | 0 (0.0%) |
| 60 to 64 Years | 0 (0.0%) | 3 (2.6%) |
| 65 to 69 Years | 14 (22.6%) | 0 (0.0%) |
| 70 to 74 Years | 0 (0.0%) | 0 (0.0%) |
| 75 to 79 Years | 0 (0.0%) | 0 (0.0%) |
| 80 to 84 Years | 0 (0.0%) | 0 (0.0%) |
| 85 Years and over | 0 (0.0%) | 0 (0.0%) |
| Total | 62 (100.0%) | 115 (100.0%) |
Families and Households in Summit
Median Family Size in Summit
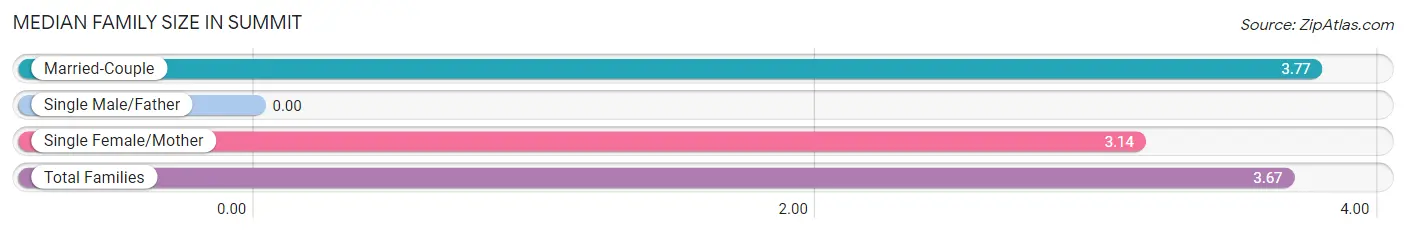
| Family Type | # Families | Family Size |
| Married-Couple | 35 (83.3%) | 3.77 |
| Single Male/Father | 0 (0.0%) | - |
| Single Female/Mother | 7 (16.7%) | 3.14 |
| Total Families | 42 (100.0%) | 3.67 |
Median Household Size in Summit
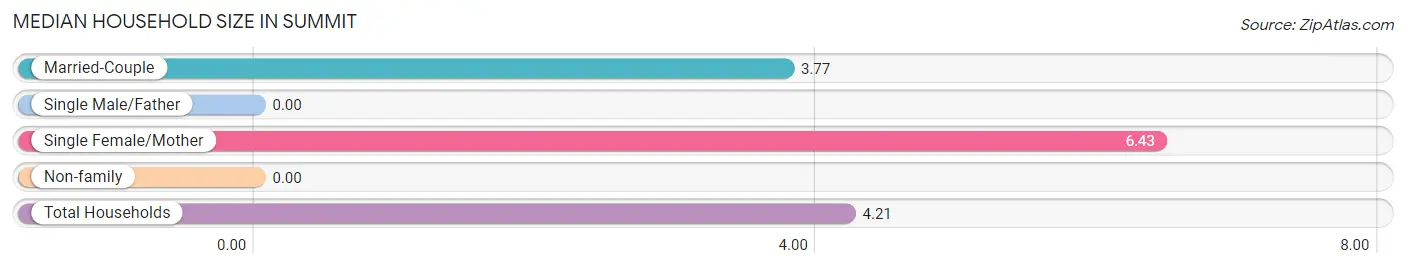
| Household Type | # Households | Household Size |
| Married-Couple | 35 (83.3%) | 3.77 |
| Single Male/Father | 0 (0.0%) | - |
| Single Female/Mother | 7 (16.7%) | 6.43 |
| Non-family | 0 (0.0%) | - |
| Total Households | 42 (100.0%) | 4.21 |
Household Size by Marriage Status in Summit
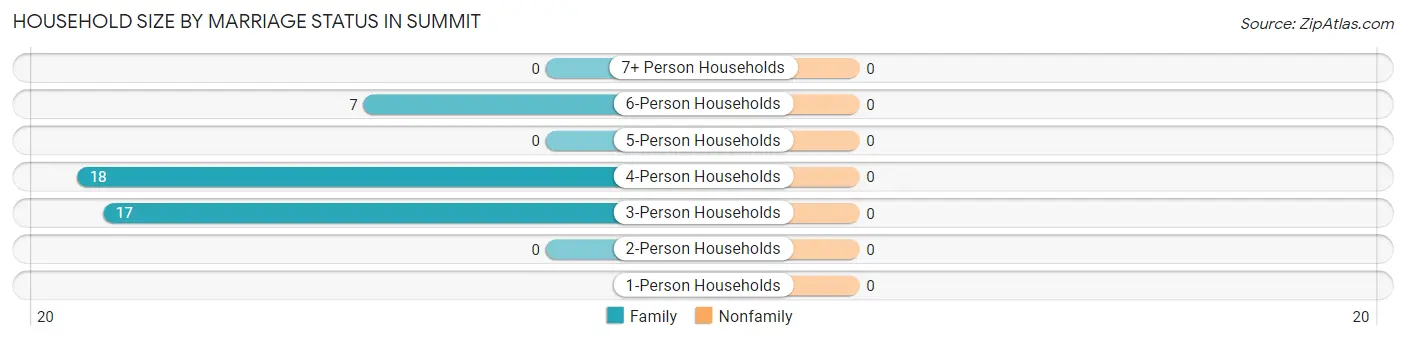
| Household Size | Family Households | Nonfamily Households |
| 1-Person Households | - | 0 (0.0%) |
| 2-Person Households | 0 (0.0%) | 0 (0.0%) |
| 3-Person Households | 17 (40.5%) | 0 (0.0%) |
| 4-Person Households | 18 (42.9%) | 0 (0.0%) |
| 5-Person Households | 0 (0.0%) | 0 (0.0%) |
| 6-Person Households | 7 (16.7%) | 0 (0.0%) |
| 7+ Person Households | 0 (0.0%) | 0 (0.0%) |
| Total | 42 (100.0%) | 0 (0.0%) |
Female Fertility in Summit
Fertility by Age in Summit
Average fertility rate in Summit is 127.0 births per 1,000 women. Women in the age bracket of 20 to 34 years have the highest fertility rate with 435.0 births per 1,000 women. Women in the age bracket of 20 to 34 years acount for 100.0% of all women with births.
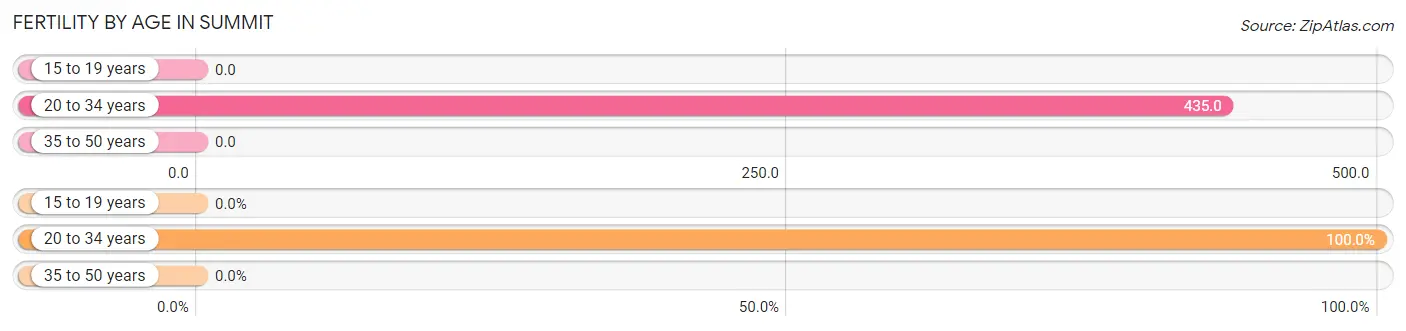
| Age Bracket | Women with Births | Births / 1,000 Women |
| 15 to 19 years | 0 (0.0%) | 0.0 |
| 20 to 34 years | 10 (100.0%) | 435.0 |
| 35 to 50 years | 0 (0.0%) | 0.0 |
| Total | 10 (100.0%) | 127.0 |
Fertility by Age by Marriage Status in Summit
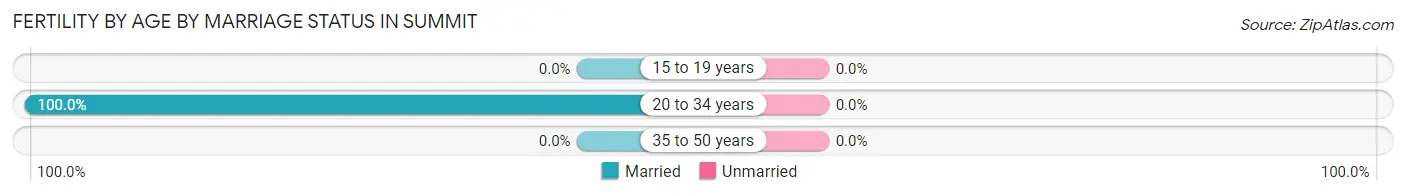
| Age Bracket | Married | Unmarried |
| 15 to 19 years | 0 (0.0%) | 0 (0.0%) |
| 20 to 34 years | 10 (100.0%) | 0 (0.0%) |
| 35 to 50 years | 0 (0.0%) | 0 (0.0%) |
| Total | 10 (100.0%) | 0 (0.0%) |
Fertility by Education in Summit
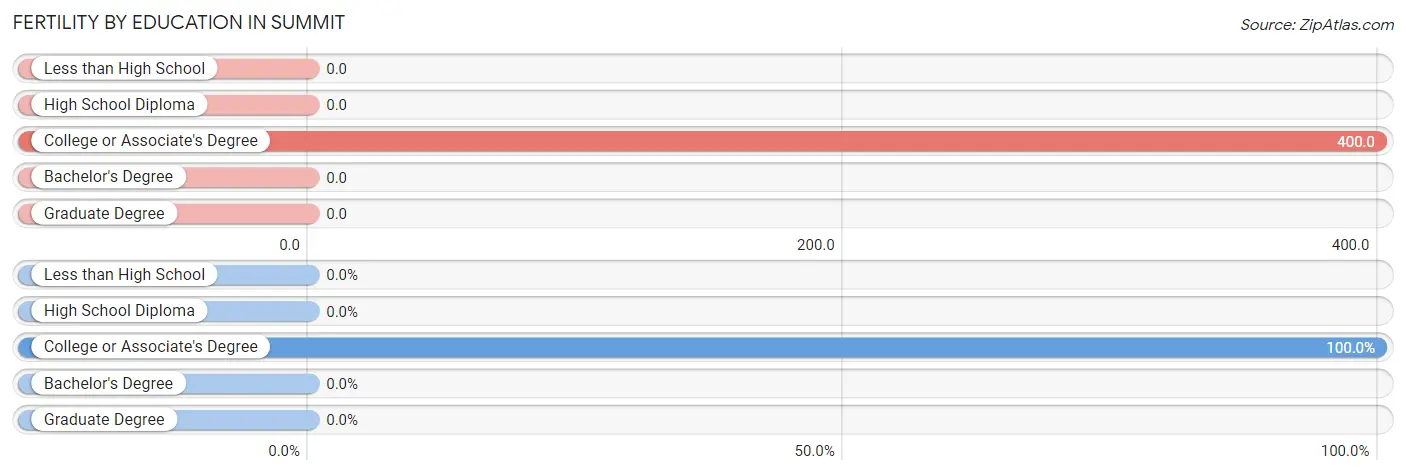
| Educational Attainment | Women with Births | Births / 1,000 Women |
| Less than High School | 0 (0.0%) | 0.0 |
| High School Diploma | 0 (0.0%) | 0.0 |
| College or Associate's Degree | 10 (100.0%) | 400.0 |
| Bachelor's Degree | 0 (0.0%) | 0.0 |
| Graduate Degree | 0 (0.0%) | 0.0 |
| Total | 10 (100.0%) | 127.0 |
Fertility by Education by Marriage Status in Summit
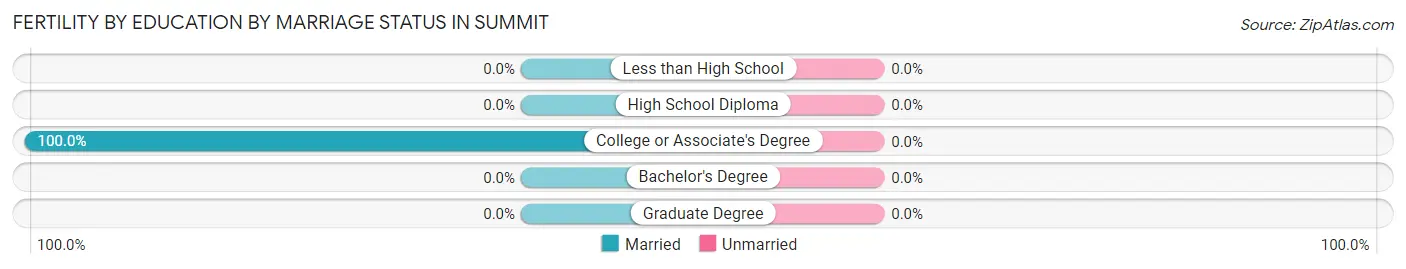
| Educational Attainment | Married | Unmarried |
| Less than High School | 0 (0.0%) | 0 (0.0%) |
| High School Diploma | 0 (0.0%) | 0 (0.0%) |
| College or Associate's Degree | 10 (100.0%) | 0 (0.0%) |
| Bachelor's Degree | 0 (0.0%) | 0 (0.0%) |
| Graduate Degree | 0 (0.0%) | 0 (0.0%) |
| Total | 10 (100.0%) | 0 (0.0%) |
Employment Characteristics in Summit
Employment by Class of Employer in Summit
Among the 99 employed individuals in Summit, private company employees (39 | 39.4%), self-employed (not incorporated) (35 | 35.3%), and self-employed (incorporated) (9 | 9.1%) make up the most common classes of employment.
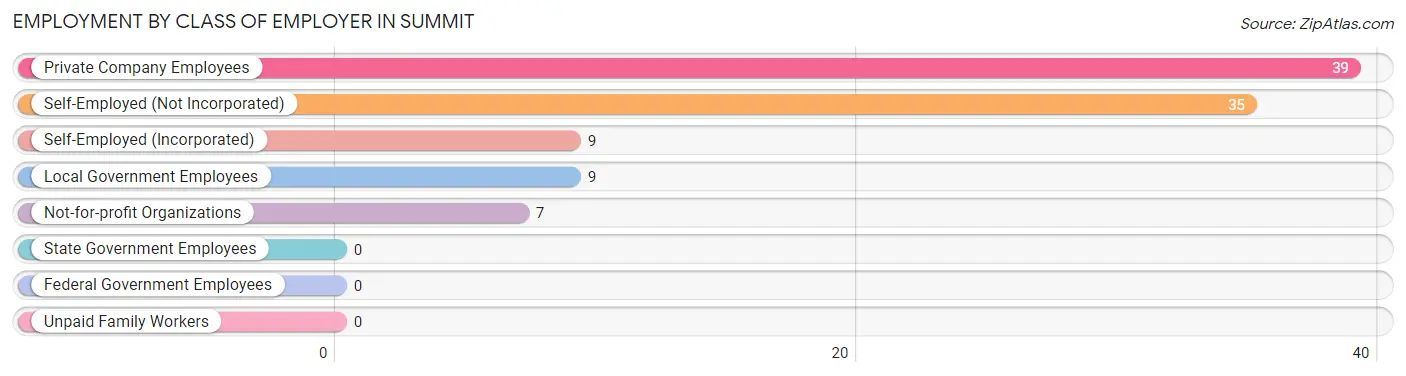
| Employer Class | # Employees | % Employees |
| Private Company Employees | 39 | 39.4% |
| Self-Employed (Incorporated) | 9 | 9.1% |
| Self-Employed (Not Incorporated) | 35 | 35.3% |
| Not-for-profit Organizations | 7 | 7.1% |
| Local Government Employees | 9 | 9.1% |
| State Government Employees | 0 | 0.0% |
| Federal Government Employees | 0 | 0.0% |
| Unpaid Family Workers | 0 | 0.0% |
| Total | 99 | 100.0% |
Employment Status by Age in Summit
According to the labor force statistics for Summit, out of the total population over 16 years of age (121), 88.4% or 107 individuals are in the labor force, with 7.5% or 8 of them unemployed. The age group with the highest labor force participation rate is 16 to 19 years, with 100.0% or 17 individuals in the labor force. Within the labor force, the 16 to 19 years age range has the highest percentage of unemployed individuals, with 47.1% or 8 of them being unemployed.
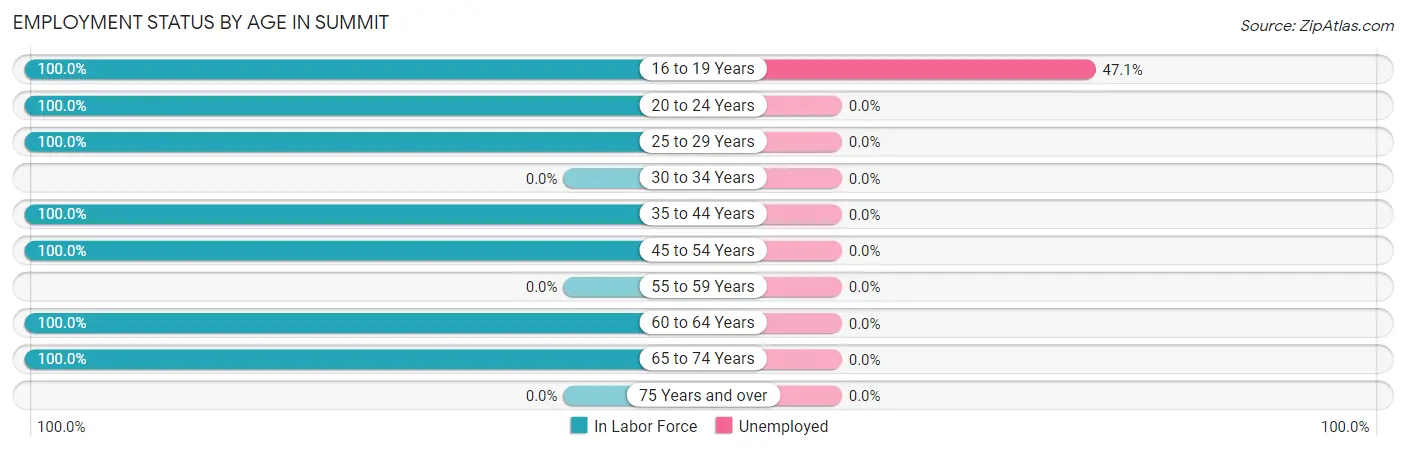
| Age Bracket | In Labor Force | Unemployed |
| 16 to 19 Years | 17 (100.0%) | 8 (47.1%) |
| 20 to 24 Years | 16 (100.0%) | 0 (0.0%) |
| 25 to 29 Years | 9 (100.0%) | 0 (0.0%) |
| 30 to 34 Years | 0 (0.0%) | 0 (0.0%) |
| 35 to 44 Years | 21 (100.0%) | 0 (0.0%) |
| 45 to 54 Years | 27 (100.0%) | 0 (0.0%) |
| 55 to 59 Years | 0 (0.0%) | 0 (0.0%) |
| 60 to 64 Years | 3 (100.0%) | 0 (0.0%) |
| 65 to 74 Years | 14 (100.0%) | 0 (0.0%) |
| 75 Years and over | 0 (0.0%) | 0 (0.0%) |
| Total | 107 (88.4%) | 8 (7.5%) |
Employment Status by Educational Attainment in Summit
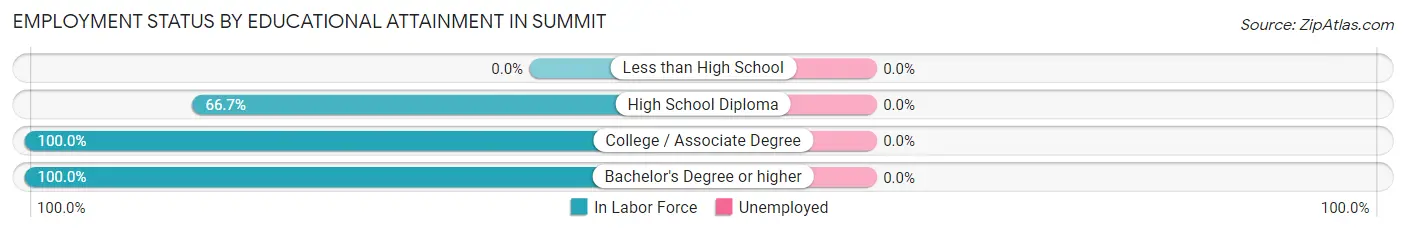
| Educational Attainment | In Labor Force | Unemployed |
| Less than High School | 0 (0.0%) | 0 (0.0%) |
| High School Diploma | 28 (66.7%) | 0 (0.0%) |
| College / Associate Degree | 23 (100.0%) | 0 (0.0%) |
| Bachelor's Degree or higher | 9 (100.0%) | 0 (0.0%) |
| Total | 60 (81.1%) | 0 (0.0%) |
Employment Occupations by Sex in Summit
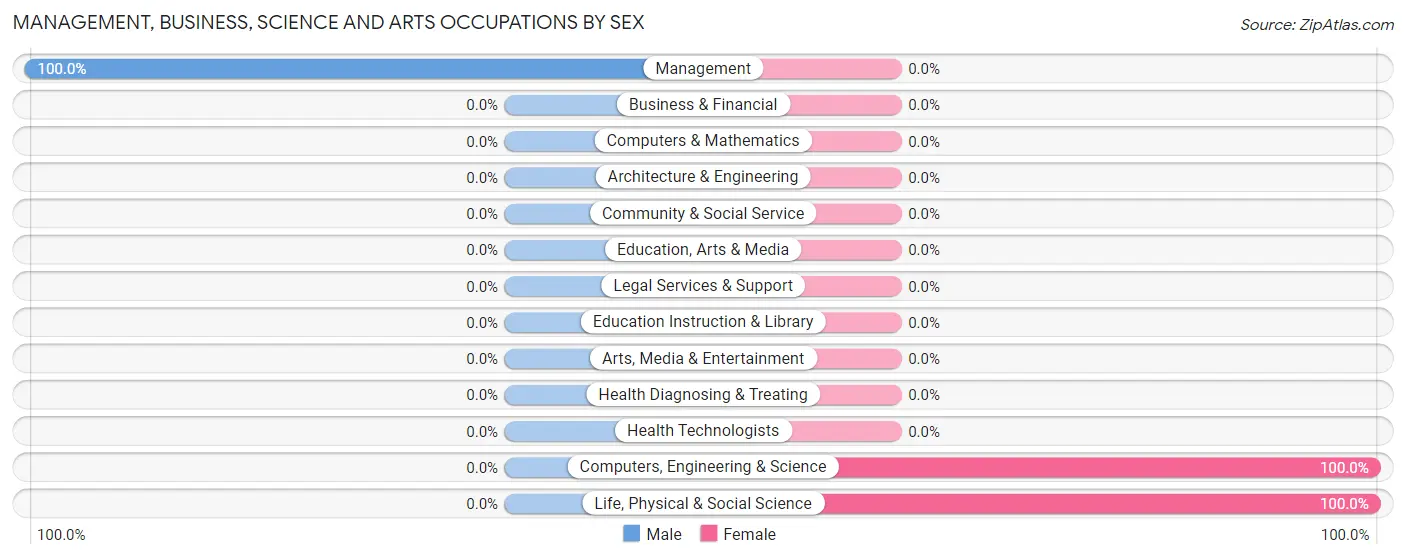
Management, Business, Science and Arts Occupations
The most common Management, Business, Science and Arts occupations in Summit are Computers, Engineering & Science (9 | 9.1%), Life, Physical & Social Science (9 | 9.1%), and Management (7 | 7.1%).
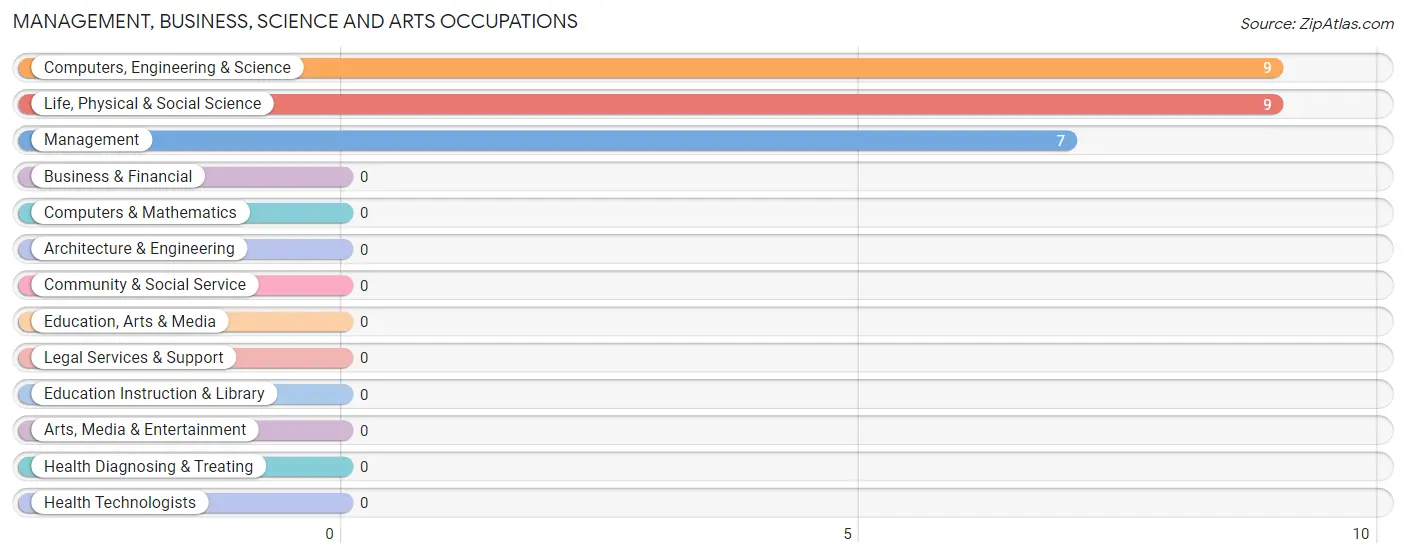
Management, Business, Science and Arts Occupations by Sex
| Occupation | Male | Female |
| Management | 7 (100.0%) | 0 (0.0%) |
| Business & Financial | 0 (0.0%) | 0 (0.0%) |
| Computers, Engineering & Science | 0 (0.0%) | 9 (100.0%) |
| Computers & Mathematics | 0 (0.0%) | 0 (0.0%) |
| Architecture & Engineering | 0 (0.0%) | 0 (0.0%) |
| Life, Physical & Social Science | 0 (0.0%) | 9 (100.0%) |
| Community & Social Service | 0 (0.0%) | 0 (0.0%) |
| Education, Arts & Media | 0 (0.0%) | 0 (0.0%) |
| Legal Services & Support | 0 (0.0%) | 0 (0.0%) |
| Education Instruction & Library | 0 (0.0%) | 0 (0.0%) |
| Arts, Media & Entertainment | 0 (0.0%) | 0 (0.0%) |
| Health Diagnosing & Treating | 0 (0.0%) | 0 (0.0%) |
| Health Technologists | 0 (0.0%) | 0 (0.0%) |
| Total (Category) | 7 (43.8%) | 9 (56.2%) |
| Total (Overall) | 46 (46.5%) | 53 (53.5%) |
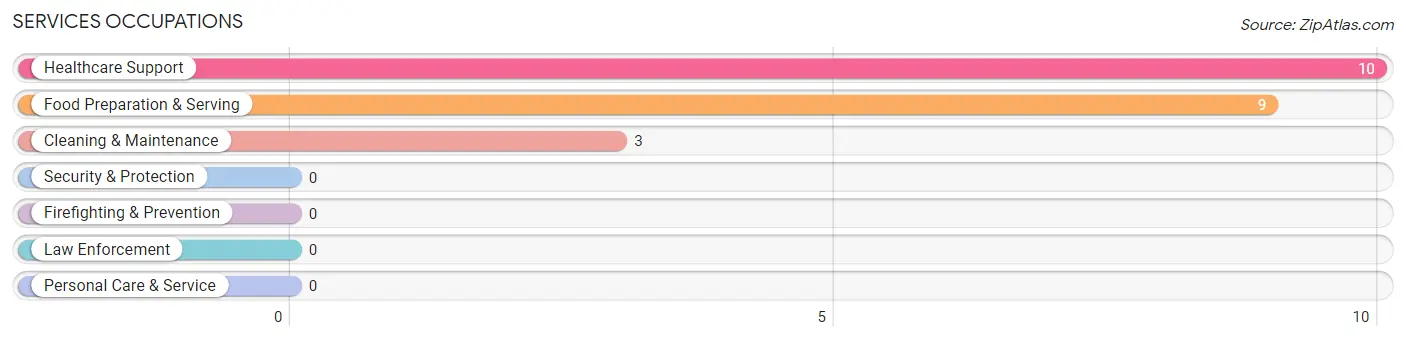
Services Occupations
The most common Services occupations in Summit are Healthcare Support (10 | 10.1%), Food Preparation & Serving (9 | 9.1%), and Cleaning & Maintenance (3 | 3.0%).
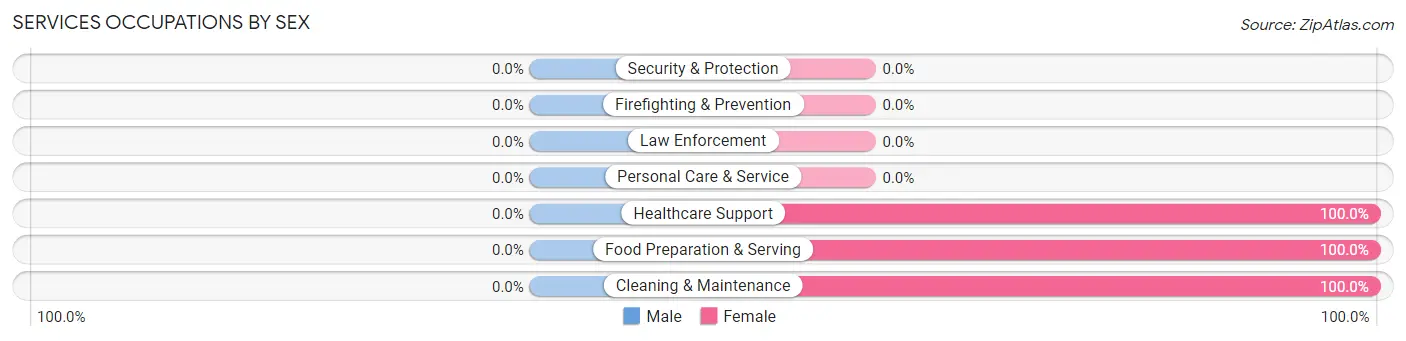
Services Occupations by Sex
| Occupation | Male | Female |
| Healthcare Support | 0 (0.0%) | 10 (100.0%) |
| Security & Protection | 0 (0.0%) | 0 (0.0%) |
| Firefighting & Prevention | 0 (0.0%) | 0 (0.0%) |
| Law Enforcement | 0 (0.0%) | 0 (0.0%) |
| Food Preparation & Serving | 0 (0.0%) | 9 (100.0%) |
| Cleaning & Maintenance | 0 (0.0%) | 3 (100.0%) |
| Personal Care & Service | 0 (0.0%) | 0 (0.0%) |
| Total (Category) | 0 (0.0%) | 22 (100.0%) |
| Total (Overall) | 46 (46.5%) | 53 (53.5%) |
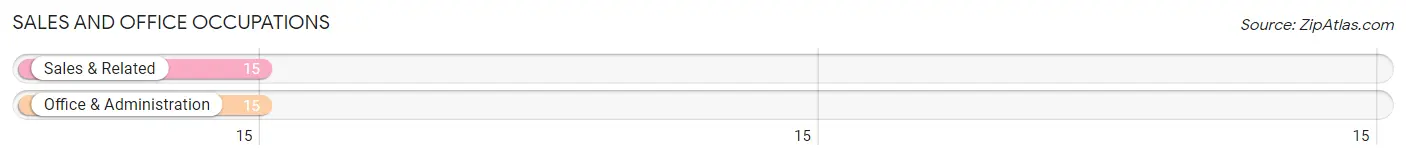
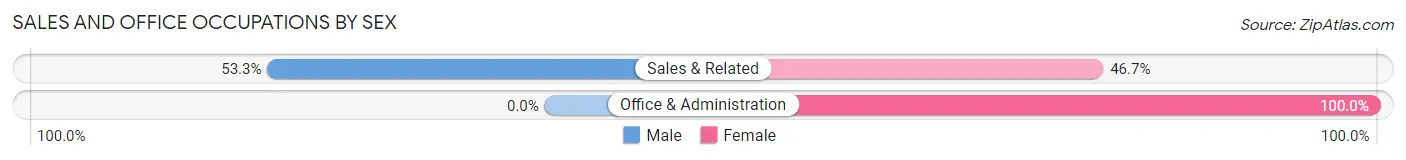
Sales and Office Occupations
The most common Sales and Office occupations in Summit are Sales & Related (15 | 15.1%), and Office & Administration (15 | 15.1%).
Sales and Office Occupations by Sex
| Occupation | Male | Female |
| Sales & Related | 8 (53.3%) | 7 (46.7%) |
| Office & Administration | 0 (0.0%) | 15 (100.0%) |
| Total (Category) | 8 (26.7%) | 22 (73.3%) |
| Total (Overall) | 46 (46.5%) | 53 (53.5%) |
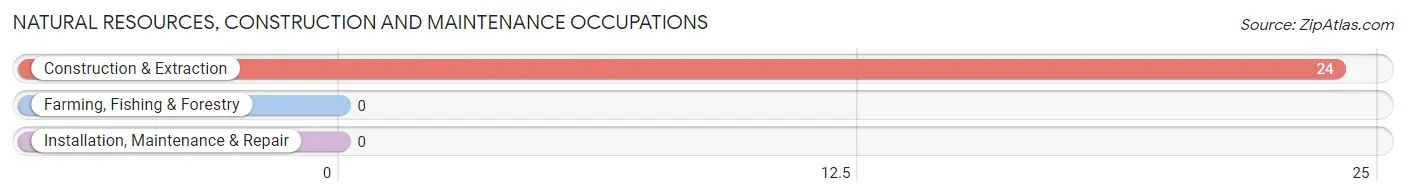
Natural Resources, Construction and Maintenance Occupations
The most common Natural Resources, Construction and Maintenance occupations in Summit are , and Construction & Extraction (24 | 24.2%).
Natural Resources, Construction and Maintenance Occupations by Sex
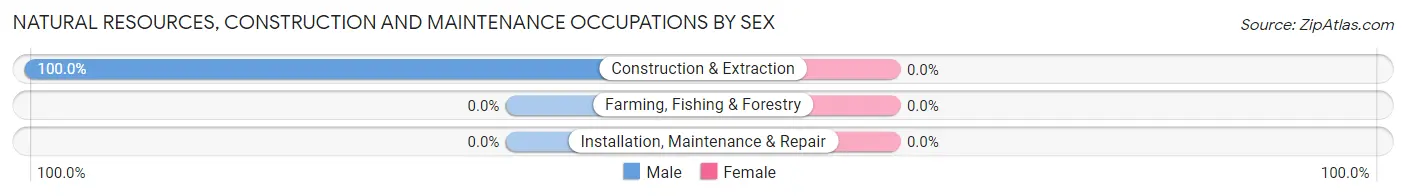
| Occupation | Male | Female |
| Farming, Fishing & Forestry | 0 (0.0%) | 0 (0.0%) |
| Construction & Extraction | 24 (100.0%) | 0 (0.0%) |
| Installation, Maintenance & Repair | 0 (0.0%) | 0 (0.0%) |
| Total (Category) | 24 (100.0%) | 0 (0.0%) |
| Total (Overall) | 46 (46.5%) | 53 (53.5%) |
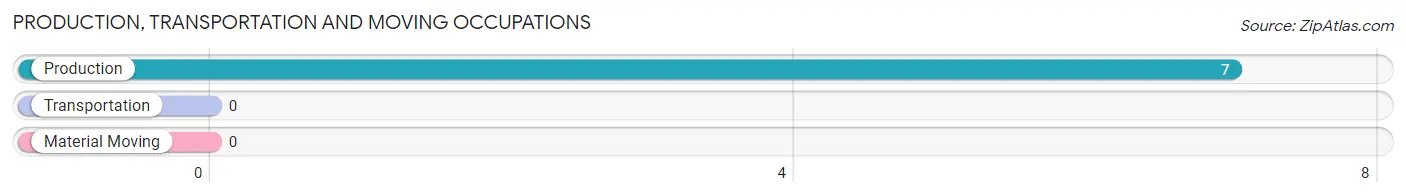
Production, Transportation and Moving Occupations
The most common Production, Transportation and Moving occupations in Summit are , and Production (7 | 7.1%).
Production, Transportation and Moving Occupations by Sex
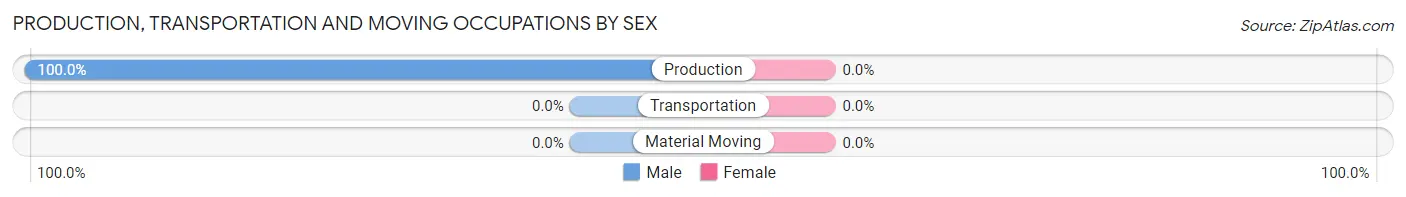
| Occupation | Male | Female |
| Production | 7 (100.0%) | 0 (0.0%) |
| Transportation | 0 (0.0%) | 0 (0.0%) |
| Material Moving | 0 (0.0%) | 0 (0.0%) |
| Total (Category) | 7 (100.0%) | 0 (0.0%) |
| Total (Overall) | 46 (46.5%) | 53 (53.5%) |
Employment Industries by Sex in Summit
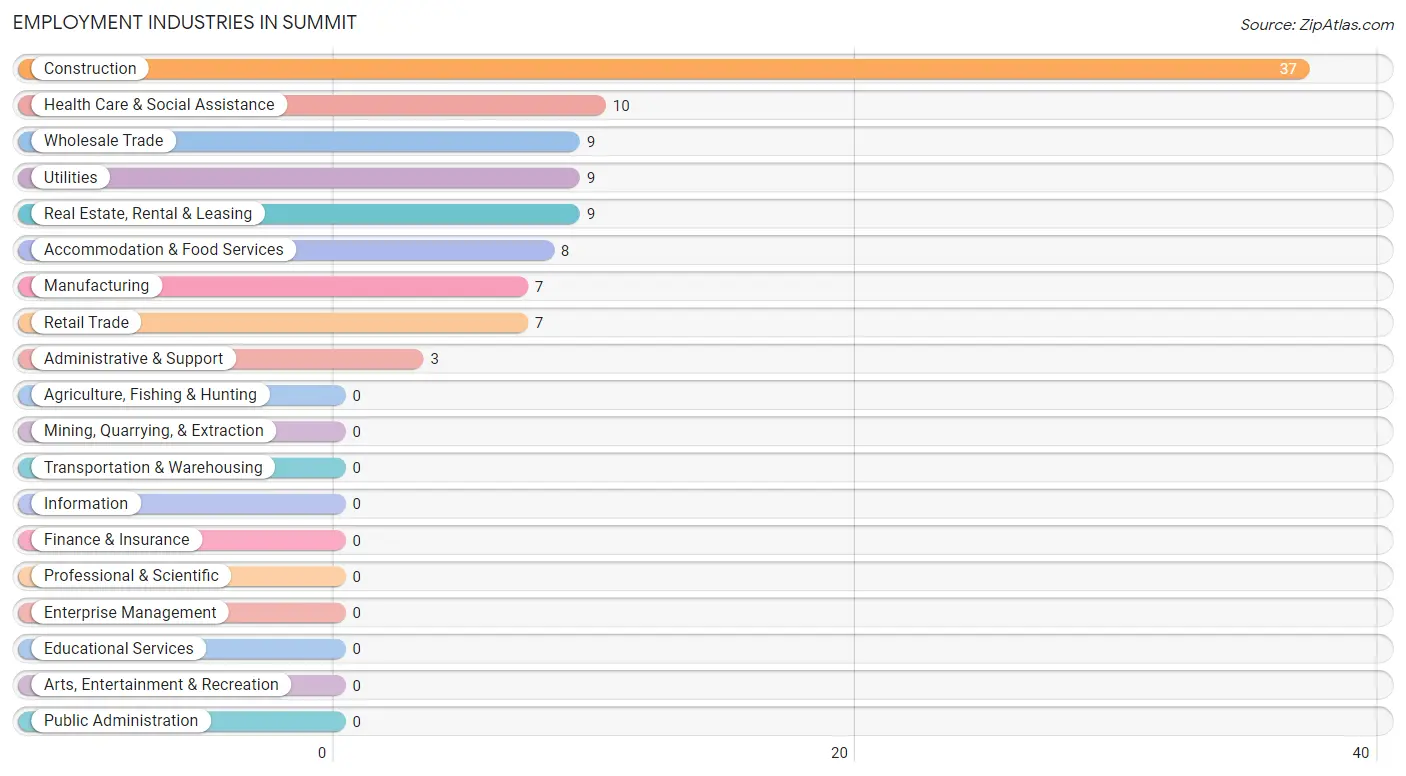
Employment Industries in Summit
The major employment industries in Summit include Construction (37 | 37.4%), Health Care & Social Assistance (10 | 10.1%), Wholesale Trade (9 | 9.1%), Utilities (9 | 9.1%), and Real Estate, Rental & Leasing (9 | 9.1%).
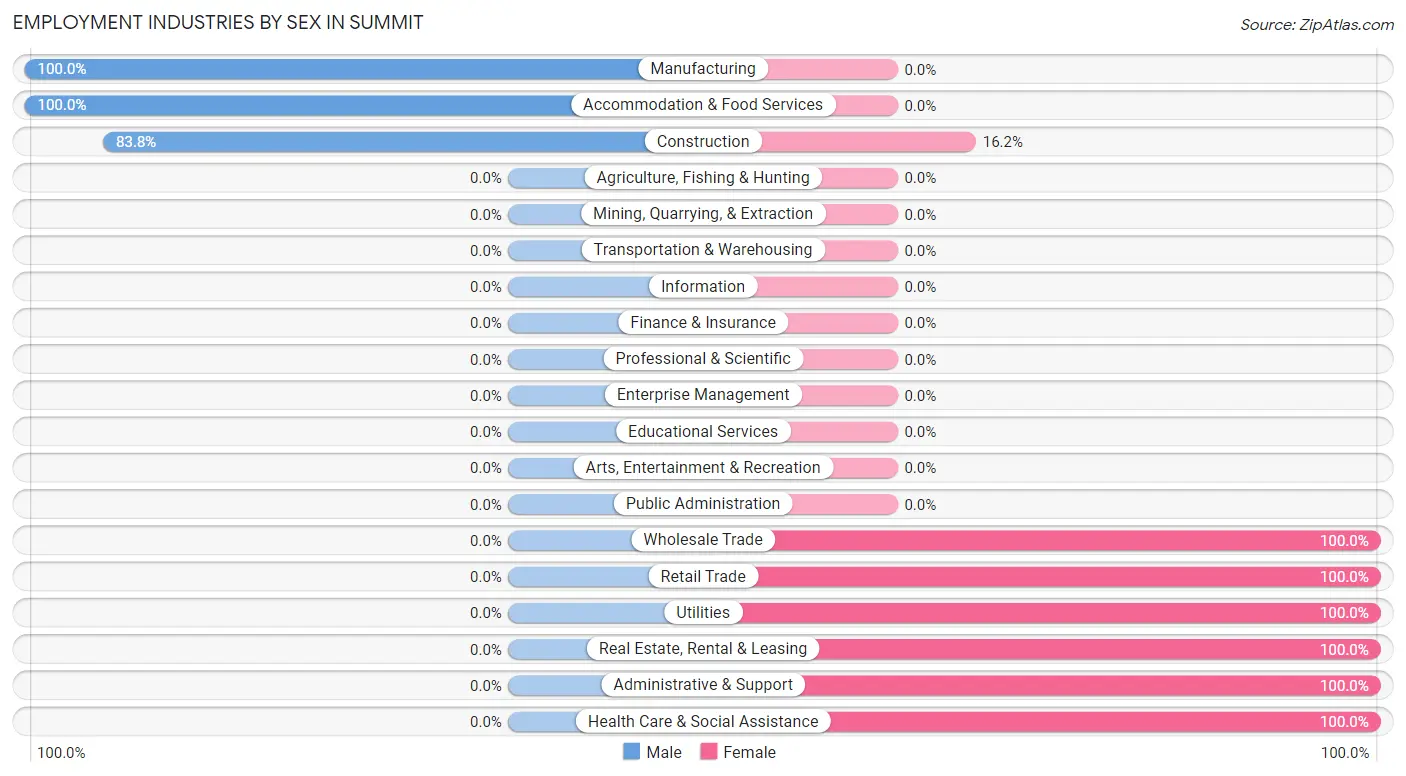
Employment Industries by Sex in Summit
The Summit industries that see more men than women are Manufacturing (100.0%), Accommodation & Food Services (100.0%), and Construction (83.8%), whereas the industries that tend to have a higher number of women are Wholesale Trade (100.0%), Retail Trade (100.0%), and Utilities (100.0%).
| Industry | Male | Female |
| Agriculture, Fishing & Hunting | 0 (0.0%) | 0 (0.0%) |
| Mining, Quarrying, & Extraction | 0 (0.0%) | 0 (0.0%) |
| Construction | 31 (83.8%) | 6 (16.2%) |
| Manufacturing | 7 (100.0%) | 0 (0.0%) |
| Wholesale Trade | 0 (0.0%) | 9 (100.0%) |
| Retail Trade | 0 (0.0%) | 7 (100.0%) |
| Transportation & Warehousing | 0 (0.0%) | 0 (0.0%) |
| Utilities | 0 (0.0%) | 9 (100.0%) |
| Information | 0 (0.0%) | 0 (0.0%) |
| Finance & Insurance | 0 (0.0%) | 0 (0.0%) |
| Real Estate, Rental & Leasing | 0 (0.0%) | 9 (100.0%) |
| Professional & Scientific | 0 (0.0%) | 0 (0.0%) |
| Enterprise Management | 0 (0.0%) | 0 (0.0%) |
| Administrative & Support | 0 (0.0%) | 3 (100.0%) |
| Educational Services | 0 (0.0%) | 0 (0.0%) |
| Health Care & Social Assistance | 0 (0.0%) | 10 (100.0%) |
| Arts, Entertainment & Recreation | 0 (0.0%) | 0 (0.0%) |
| Accommodation & Food Services | 8 (100.0%) | 0 (0.0%) |
| Public Administration | 0 (0.0%) | 0 (0.0%) |
| Total | 46 (46.5%) | 53 (53.5%) |
Education in Summit
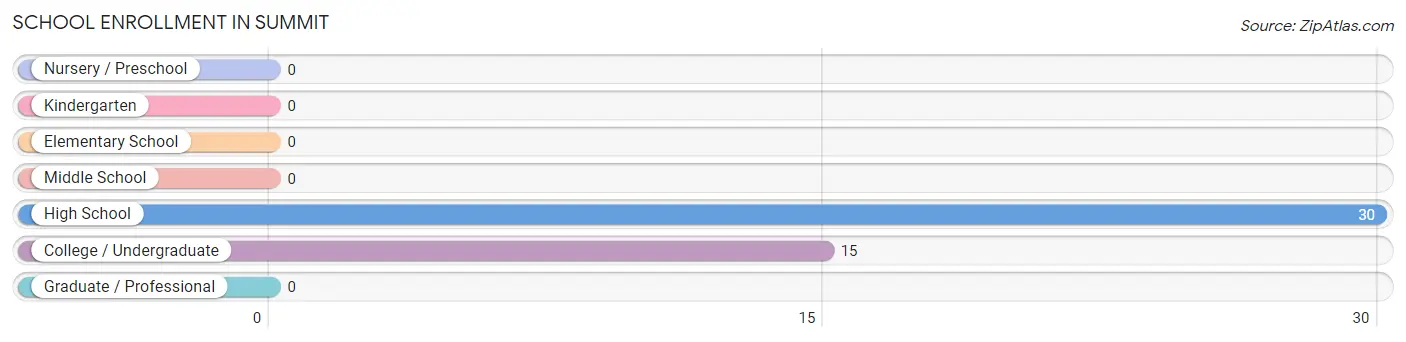
School Enrollment in Summit
The most common levels of schooling among the 45 students in Summit are high school (30 | 66.7%), and college / undergraduate (15 | 33.3%).
| School Level | # Students | % Students |
| Nursery / Preschool | 0 | 0.0% |
| Kindergarten | 0 | 0.0% |
| Elementary School | 0 | 0.0% |
| Middle School | 0 | 0.0% |
| High School | 30 | 66.7% |
| College / Undergraduate | 15 | 33.3% |
| Graduate / Professional | 0 | 0.0% |
| Total | 45 | 100.0% |
School Enrollment by Age by Funding Source in Summit
Out of a total of 45 students who are enrolled in schools in Summit, 18 (40.0%) attend a private institution, while the remaining 27 (60.0%) are enrolled in public schools. The age group of 18 to 19 year olds has the highest likelihood of being enrolled in private schools, with 9 (100.0% in the age bracket) enrolled. Conversely, the age group of 15 to 17 year olds has the lowest likelihood of being enrolled in a private school, with 14 (100.0% in the age bracket) attending a public institution.
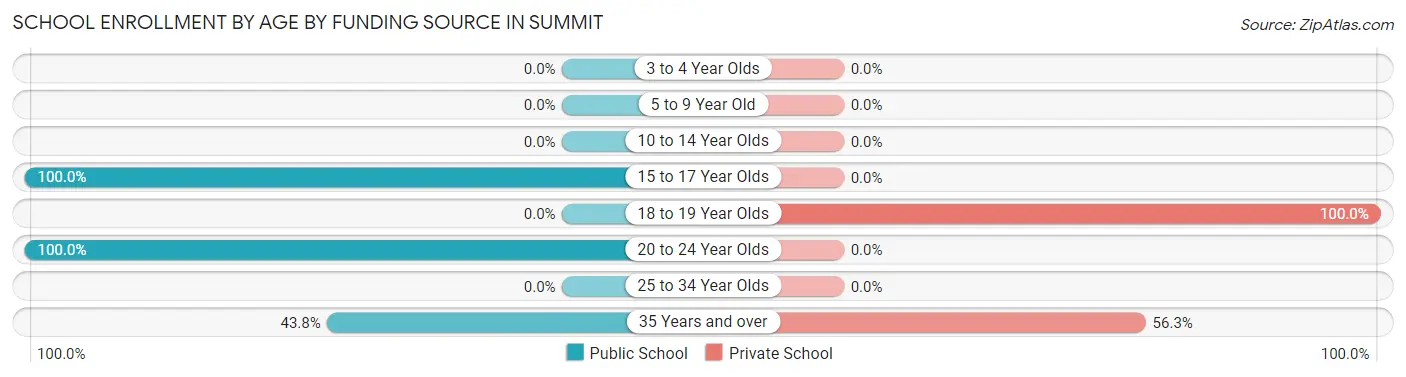
| Age Bracket | Public School | Private School |
| 3 to 4 Year Olds | 0 (0.0%) | 0 (0.0%) |
| 5 to 9 Year Old | 0 (0.0%) | 0 (0.0%) |
| 10 to 14 Year Olds | 0 (0.0%) | 0 (0.0%) |
| 15 to 17 Year Olds | 14 (100.0%) | 0 (0.0%) |
| 18 to 19 Year Olds | 0 (0.0%) | 9 (100.0%) |
| 20 to 24 Year Olds | 6 (100.0%) | 0 (0.0%) |
| 25 to 34 Year Olds | 0 (0.0%) | 0 (0.0%) |
| 35 Years and over | 7 (43.8%) | 9 (56.2%) |
| Total | 27 (60.0%) | 18 (40.0%) |
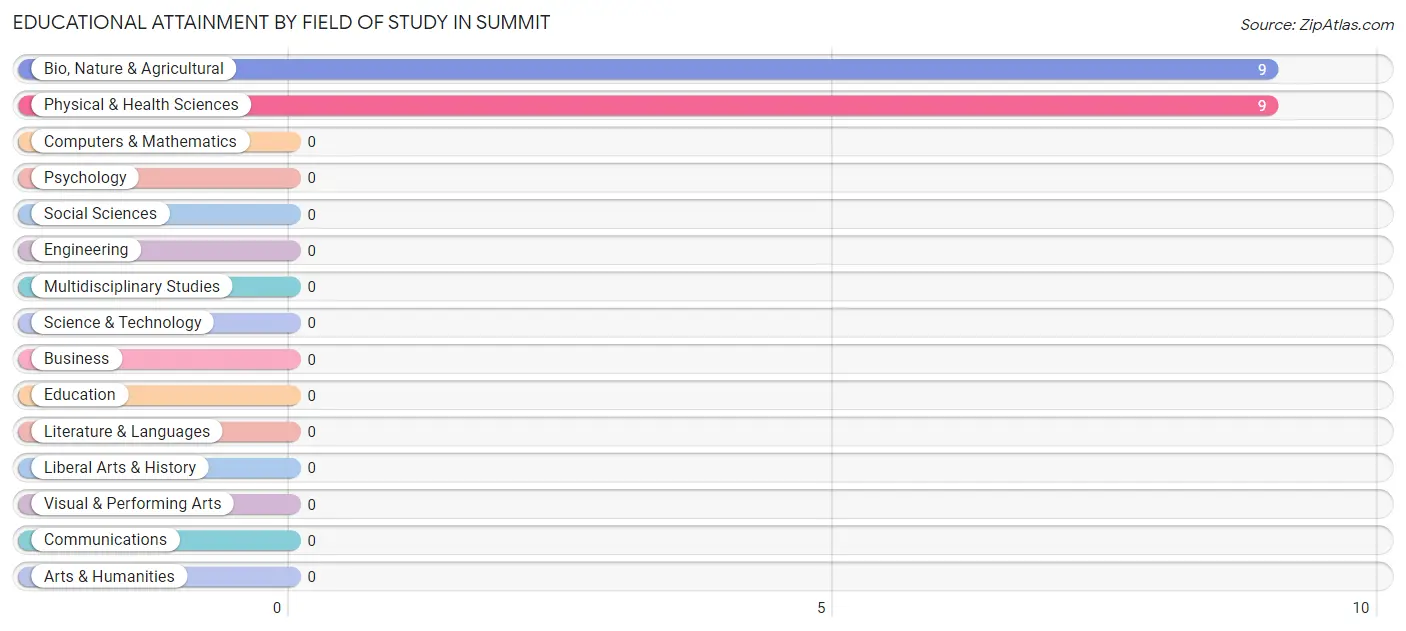
Educational Attainment by Field of Study in Summit
Bio, nature & agricultural (9 | 50.0%), and physical & health sciences (9 | 50.0%) are the most common fields of study among 18 individuals in Summit who have obtained a bachelor's degree or higher.
| Field of Study | # Graduates | % Graduates |
| Computers & Mathematics | 0 | 0.0% |
| Bio, Nature & Agricultural | 9 | 50.0% |
| Physical & Health Sciences | 9 | 50.0% |
| Psychology | 0 | 0.0% |
| Social Sciences | 0 | 0.0% |
| Engineering | 0 | 0.0% |
| Multidisciplinary Studies | 0 | 0.0% |
| Science & Technology | 0 | 0.0% |
| Business | 0 | 0.0% |
| Education | 0 | 0.0% |
| Literature & Languages | 0 | 0.0% |
| Liberal Arts & History | 0 | 0.0% |
| Visual & Performing Arts | 0 | 0.0% |
| Communications | 0 | 0.0% |
| Arts & Humanities | 0 | 0.0% |
| Total | 18 | 100.0% |
Transportation & Commute in Summit
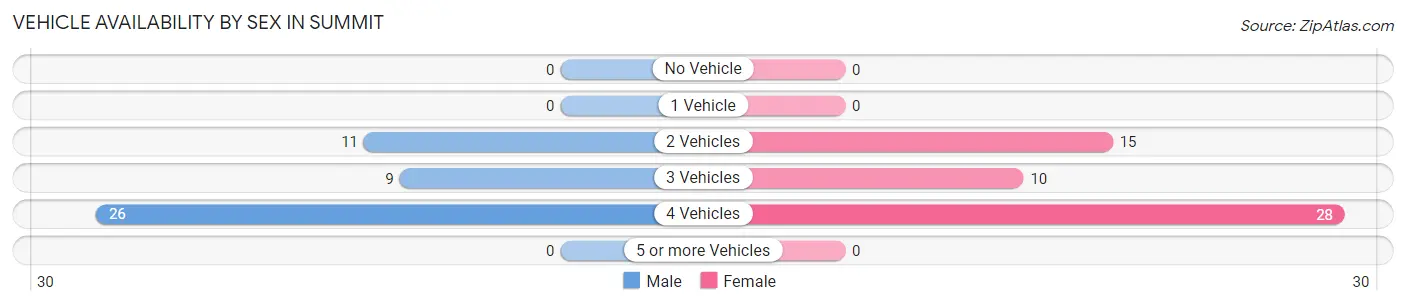
Vehicle Availability by Sex in Summit
The most prevalent vehicle ownership categories in Summit are males with 4 vehicles (26, accounting for 56.5%) and females with 4 vehicles (28, making up 49.1%).
| Vehicles Available | Male | Female |
| No Vehicle | 0 (0.0%) | 0 (0.0%) |
| 1 Vehicle | 0 (0.0%) | 0 (0.0%) |
| 2 Vehicles | 11 (23.9%) | 15 (28.3%) |
| 3 Vehicles | 9 (19.6%) | 10 (18.9%) |
| 4 Vehicles | 26 (56.5%) | 28 (52.8%) |
| 5 or more Vehicles | 0 (0.0%) | 0 (0.0%) |
| Total | 46 (100.0%) | 53 (100.0%) |
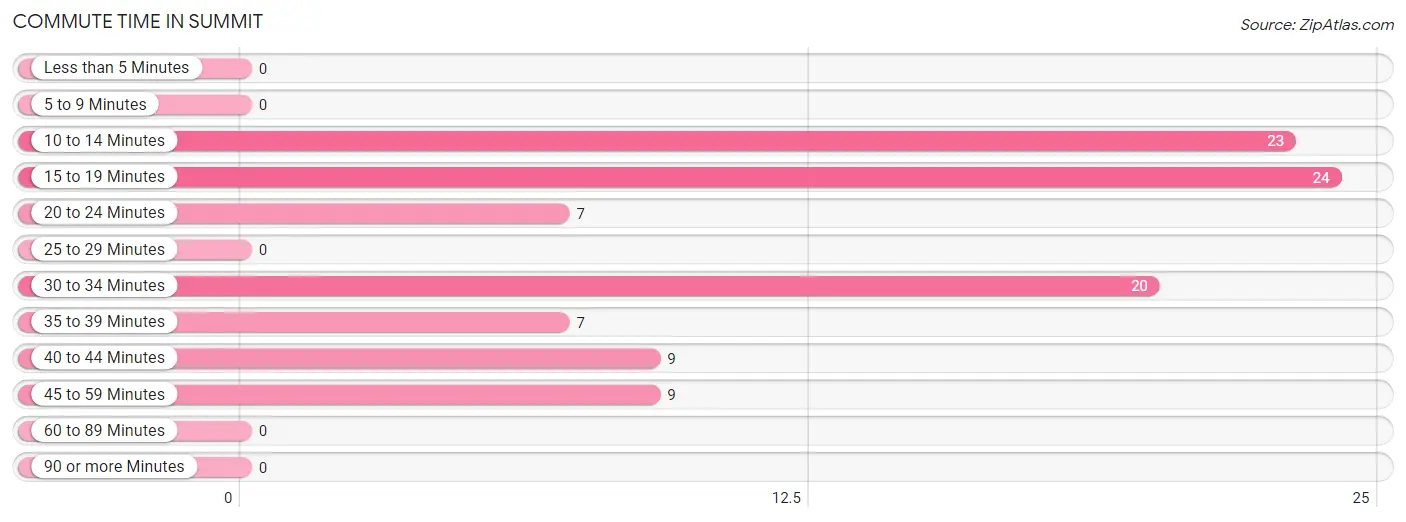
Commute Time in Summit
The most frequently occuring commute durations in Summit are 15 to 19 minutes (24 commuters, 24.2%), 10 to 14 minutes (23 commuters, 23.2%), and 30 to 34 minutes (20 commuters, 20.2%).
| Commute Time | # Commuters | % Commuters |
| Less than 5 Minutes | 0 | 0.0% |
| 5 to 9 Minutes | 0 | 0.0% |
| 10 to 14 Minutes | 23 | 23.2% |
| 15 to 19 Minutes | 24 | 24.2% |
| 20 to 24 Minutes | 7 | 7.1% |
| 25 to 29 Minutes | 0 | 0.0% |
| 30 to 34 Minutes | 20 | 20.2% |
| 35 to 39 Minutes | 7 | 7.1% |
| 40 to 44 Minutes | 9 | 9.1% |
| 45 to 59 Minutes | 9 | 9.1% |
| 60 to 89 Minutes | 0 | 0.0% |
| 90 or more Minutes | 0 | 0.0% |
Commute Time by Sex in Summit
The most common commute times in Summit are 15 to 19 minutes (24 commuters, 52.2%) for males and 10 to 14 minutes (23 commuters, 43.4%) for females.
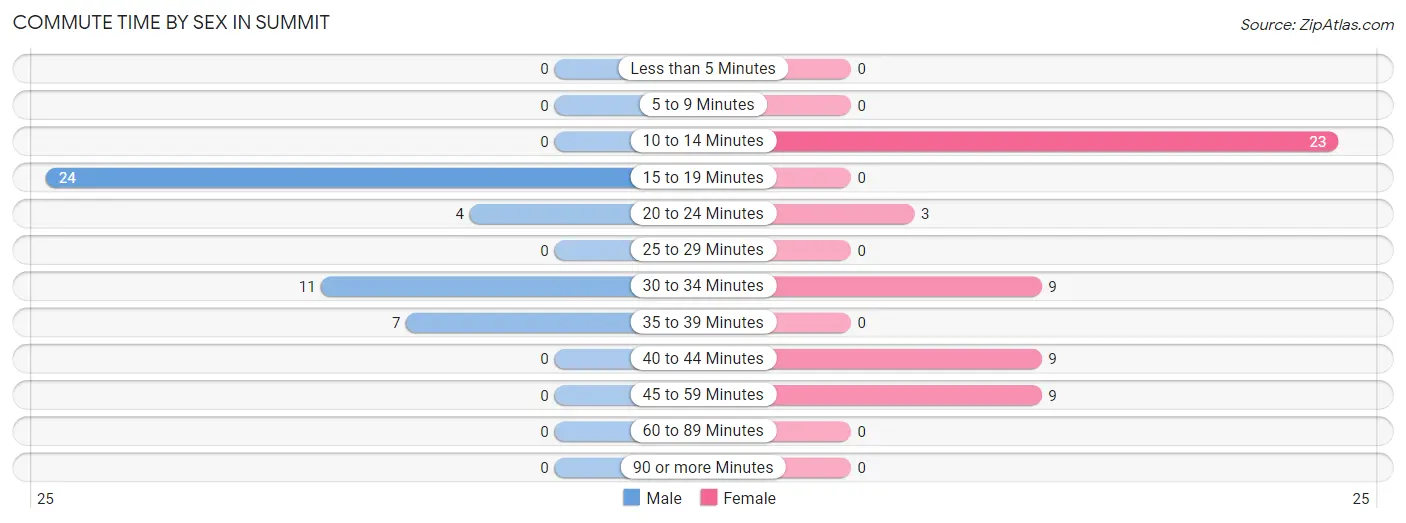
| Commute Time | Male | Female |
| Less than 5 Minutes | 0 (0.0%) | 0 (0.0%) |
| 5 to 9 Minutes | 0 (0.0%) | 0 (0.0%) |
| 10 to 14 Minutes | 0 (0.0%) | 23 (43.4%) |
| 15 to 19 Minutes | 24 (52.2%) | 0 (0.0%) |
| 20 to 24 Minutes | 4 (8.7%) | 3 (5.7%) |
| 25 to 29 Minutes | 0 (0.0%) | 0 (0.0%) |
| 30 to 34 Minutes | 11 (23.9%) | 9 (17.0%) |
| 35 to 39 Minutes | 7 (15.2%) | 0 (0.0%) |
| 40 to 44 Minutes | 0 (0.0%) | 9 (17.0%) |
| 45 to 59 Minutes | 0 (0.0%) | 9 (17.0%) |
| 60 to 89 Minutes | 0 (0.0%) | 0 (0.0%) |
| 90 or more Minutes | 0 (0.0%) | 0 (0.0%) |
Time of Departure to Work by Sex in Summit
The most frequent times of departure to work in Summit are 7:00 AM to 7:29 AM (26, 56.5%) for males and 12:00 PM to 3:59 PM (18, 34.0%) for females.
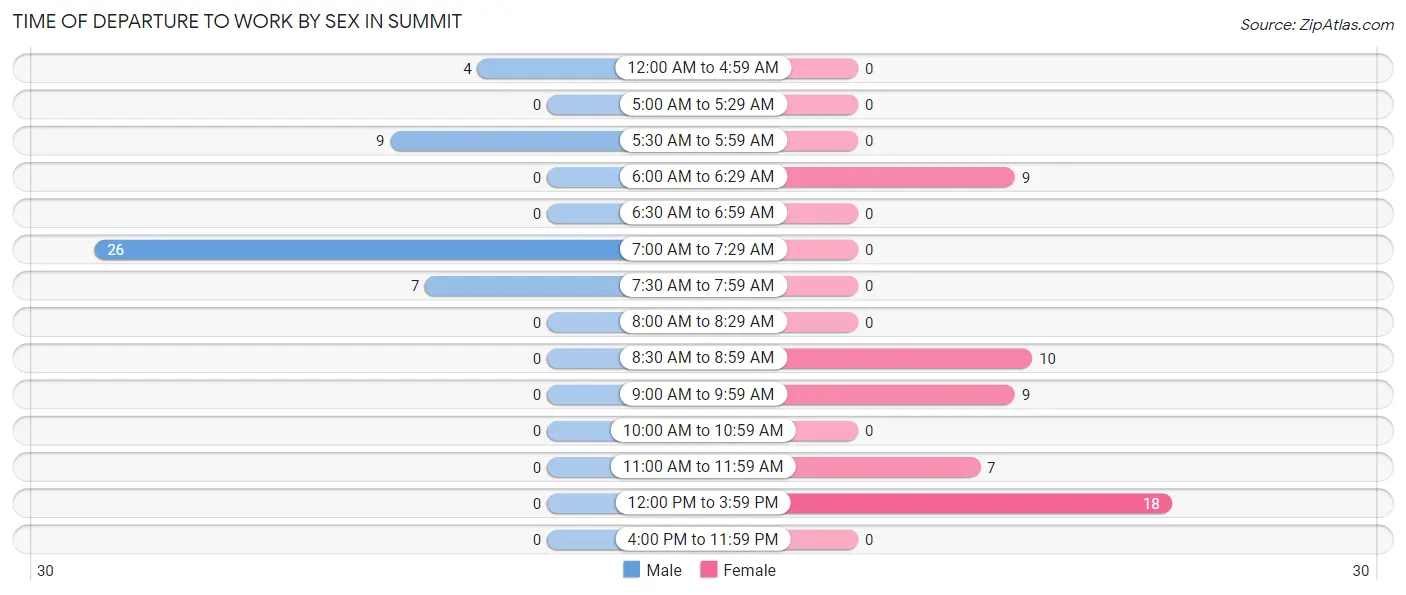
| Time of Departure | Male | Female |
| 12:00 AM to 4:59 AM | 4 (8.7%) | 0 (0.0%) |
| 5:00 AM to 5:29 AM | 0 (0.0%) | 0 (0.0%) |
| 5:30 AM to 5:59 AM | 9 (19.6%) | 0 (0.0%) |
| 6:00 AM to 6:29 AM | 0 (0.0%) | 9 (17.0%) |
| 6:30 AM to 6:59 AM | 0 (0.0%) | 0 (0.0%) |
| 7:00 AM to 7:29 AM | 26 (56.5%) | 0 (0.0%) |
| 7:30 AM to 7:59 AM | 7 (15.2%) | 0 (0.0%) |
| 8:00 AM to 8:29 AM | 0 (0.0%) | 0 (0.0%) |
| 8:30 AM to 8:59 AM | 0 (0.0%) | 10 (18.9%) |
| 9:00 AM to 9:59 AM | 0 (0.0%) | 9 (17.0%) |
| 10:00 AM to 10:59 AM | 0 (0.0%) | 0 (0.0%) |
| 11:00 AM to 11:59 AM | 0 (0.0%) | 7 (13.2%) |
| 12:00 PM to 3:59 PM | 0 (0.0%) | 18 (34.0%) |
| 4:00 PM to 11:59 PM | 0 (0.0%) | 0 (0.0%) |
| Total | 46 (100.0%) | 53 (100.0%) |
Housing Occupancy in Summit
Occupancy by Ownership in Summit
Of the total 42 dwellings in Summit, owner-occupied units account for 32 (76.2%), while renter-occupied units make up 10 (23.8%).
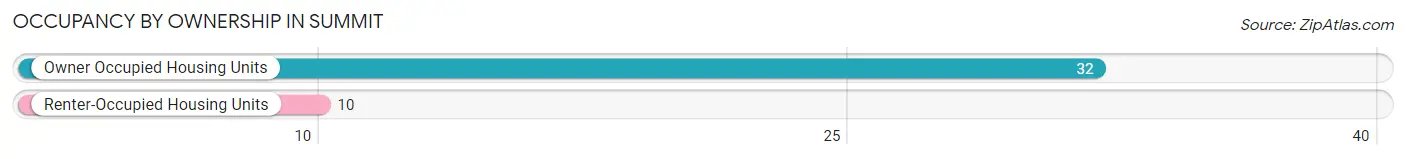
| Occupancy | # Housing Units | % Housing Units |
| Owner Occupied Housing Units | 32 | 76.2% |
| Renter-Occupied Housing Units | 10 | 23.8% |
| Total Occupied Housing Units | 42 | 100.0% |
Occupancy by Household Size in Summit
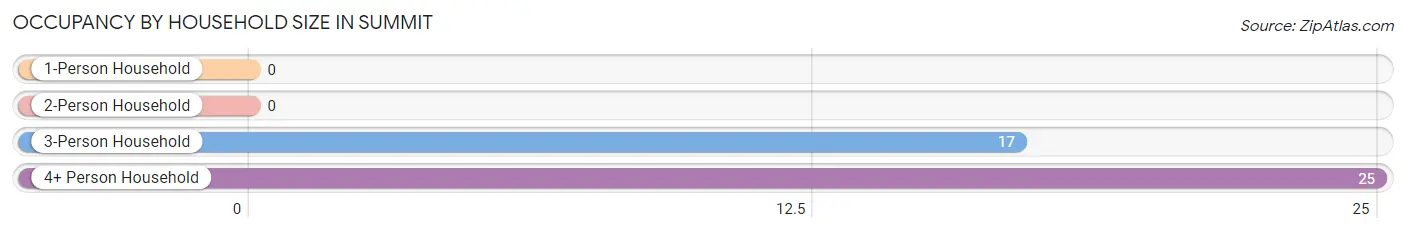
| Household Size | # Housing Units | % Housing Units |
| 1-Person Household | 0 | 0.0% |
| 2-Person Household | 0 | 0.0% |
| 3-Person Household | 17 | 40.5% |
| 4+ Person Household | 25 | 59.5% |
| Total Housing Units | 42 | 100.0% |
Occupancy by Ownership by Household Size in Summit
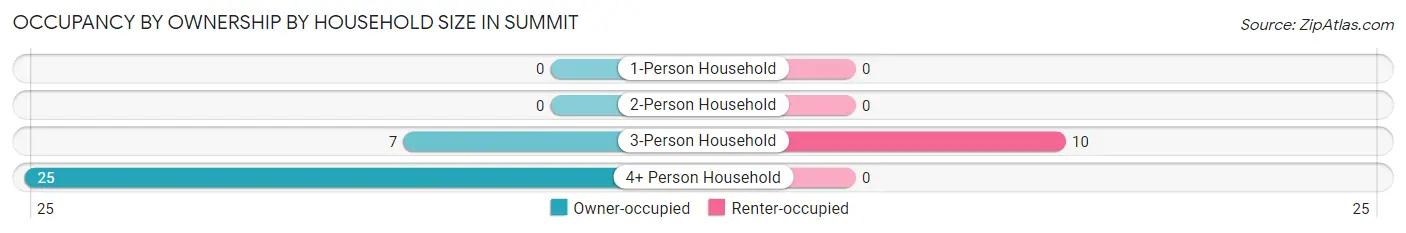
| Household Size | Owner-occupied | Renter-occupied |
| 1-Person Household | 0 (0.0%) | 0 (0.0%) |
| 2-Person Household | 0 (0.0%) | 0 (0.0%) |
| 3-Person Household | 7 (41.2%) | 10 (58.8%) |
| 4+ Person Household | 25 (100.0%) | 0 (0.0%) |
| Total Housing Units | 32 (76.2%) | 10 (23.8%) |
Occupancy by Educational Attainment in Summit
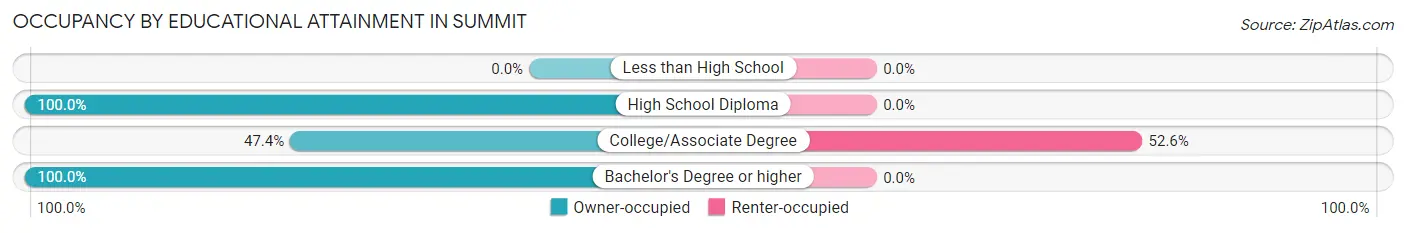
| Household Size | Owner-occupied | Renter-occupied |
| Less than High School | 0 (0.0%) | 0 (0.0%) |
| High School Diploma | 14 (100.0%) | 0 (0.0%) |
| College/Associate Degree | 9 (47.4%) | 10 (52.6%) |
| Bachelor's Degree or higher | 9 (100.0%) | 0 (0.0%) |
Occupancy by Age of Householder in Summit
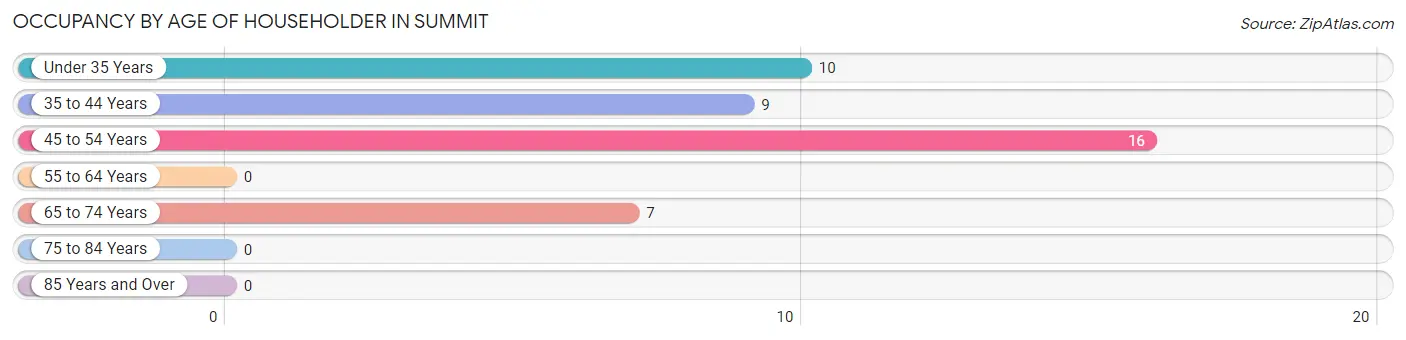
| Age Bracket | # Households | % Households |
| Under 35 Years | 10 | 23.8% |
| 35 to 44 Years | 9 | 21.4% |
| 45 to 54 Years | 16 | 38.1% |
| 55 to 64 Years | 0 | 0.0% |
| 65 to 74 Years | 7 | 16.7% |
| 75 to 84 Years | 0 | 0.0% |
| 85 Years and Over | 0 | 0.0% |
| Total | 42 | 100.0% |
Housing Finances in Summit
Median Income by Occupancy in Summit
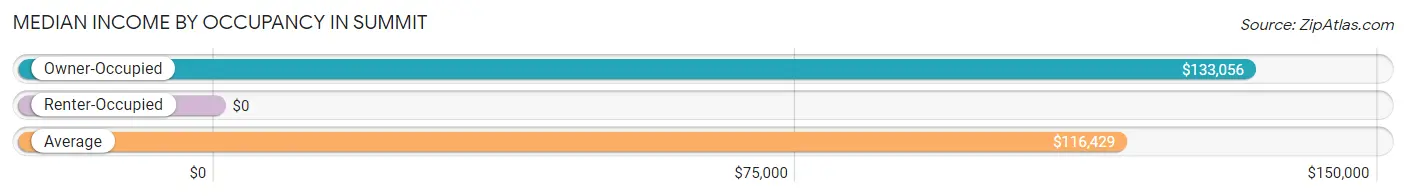
| Occupancy Type | # Households | Median Income |
| Owner-Occupied | 32 (76.2%) | $133,056 |
| Renter-Occupied | 10 (23.8%) | $0 |
| Average | 42 (100.0%) | $116,429 |
Occupancy by Householder Income Bracket in Summit
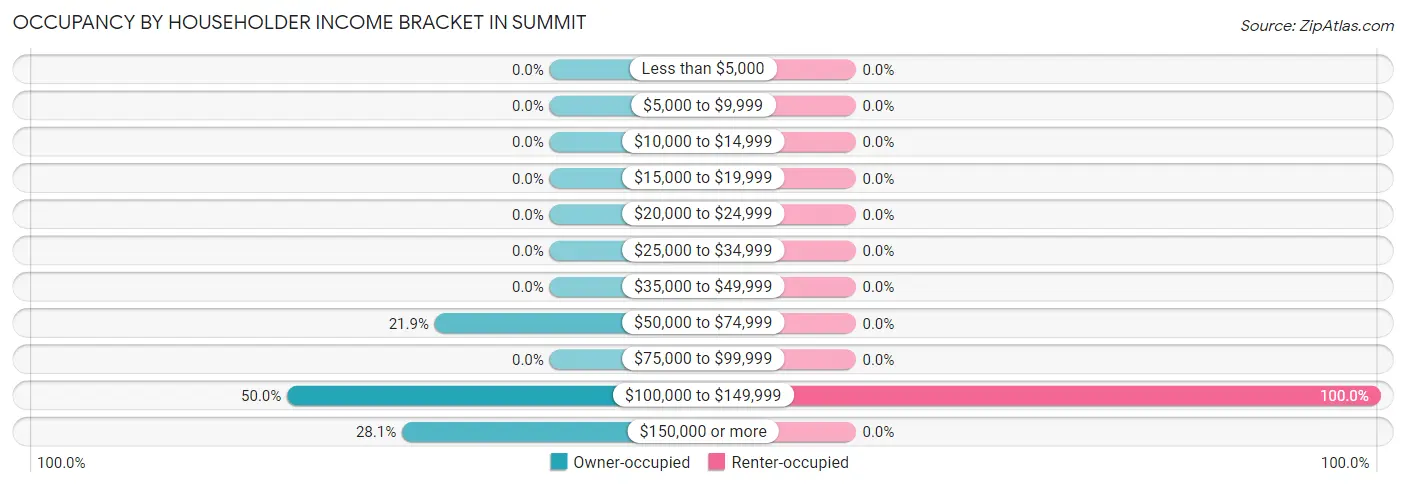
| Income Bracket | Owner-occupied | Renter-occupied |
| Less than $5,000 | 0 (0.0%) | 0 (0.0%) |
| $5,000 to $9,999 | 0 (0.0%) | 0 (0.0%) |
| $10,000 to $14,999 | 0 (0.0%) | 0 (0.0%) |
| $15,000 to $19,999 | 0 (0.0%) | 0 (0.0%) |
| $20,000 to $24,999 | 0 (0.0%) | 0 (0.0%) |
| $25,000 to $34,999 | 0 (0.0%) | 0 (0.0%) |
| $35,000 to $49,999 | 0 (0.0%) | 0 (0.0%) |
| $50,000 to $74,999 | 7 (21.9%) | 0 (0.0%) |
| $75,000 to $99,999 | 0 (0.0%) | 0 (0.0%) |
| $100,000 to $149,999 | 16 (50.0%) | 10 (100.0%) |
| $150,000 or more | 9 (28.1%) | 0 (0.0%) |
| Total | 32 (100.0%) | 10 (100.0%) |
Monthly Housing Cost Tiers in Summit
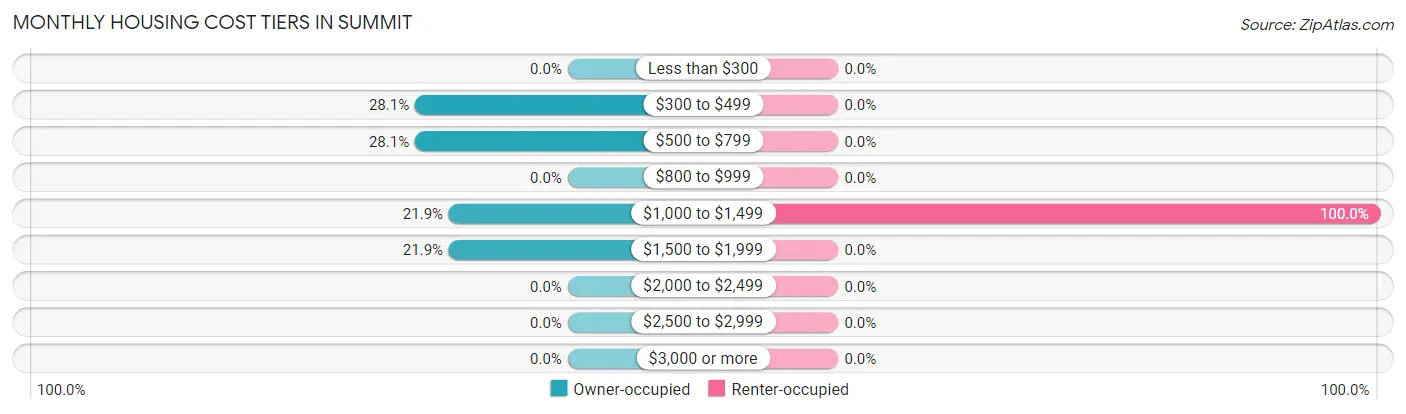
| Monthly Cost | Owner-occupied | Renter-occupied |
| Less than $300 | 0 (0.0%) | 0 (0.0%) |
| $300 to $499 | 9 (28.1%) | 0 (0.0%) |
| $500 to $799 | 9 (28.1%) | 0 (0.0%) |
| $800 to $999 | 0 (0.0%) | 0 (0.0%) |
| $1,000 to $1,499 | 7 (21.9%) | 10 (100.0%) |
| $1,500 to $1,999 | 7 (21.9%) | 0 (0.0%) |
| $2,000 to $2,499 | 0 (0.0%) | 0 (0.0%) |
| $2,500 to $2,999 | 0 (0.0%) | 0 (0.0%) |
| $3,000 or more | 0 (0.0%) | 0 (0.0%) |
| Total | 32 (100.0%) | 10 (100.0%) |
Physical Housing Characteristics in Summit
Housing Structures in Summit
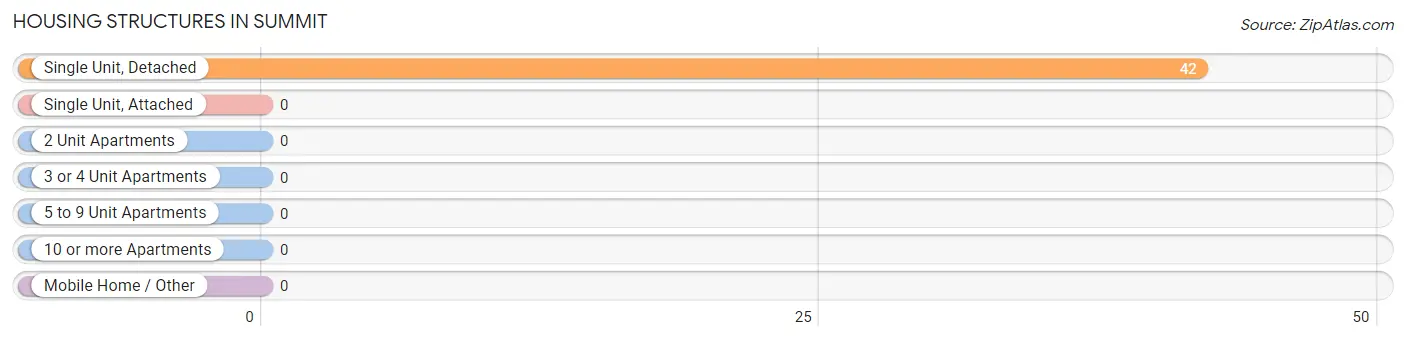
| Structure Type | # Housing Units | % Housing Units |
| Single Unit, Detached | 42 | 100.0% |
| Single Unit, Attached | 0 | 0.0% |
| 2 Unit Apartments | 0 | 0.0% |
| 3 or 4 Unit Apartments | 0 | 0.0% |
| 5 to 9 Unit Apartments | 0 | 0.0% |
| 10 or more Apartments | 0 | 0.0% |
| Mobile Home / Other | 0 | 0.0% |
| Total | 42 | 100.0% |
Housing Structures by Occupancy in Summit
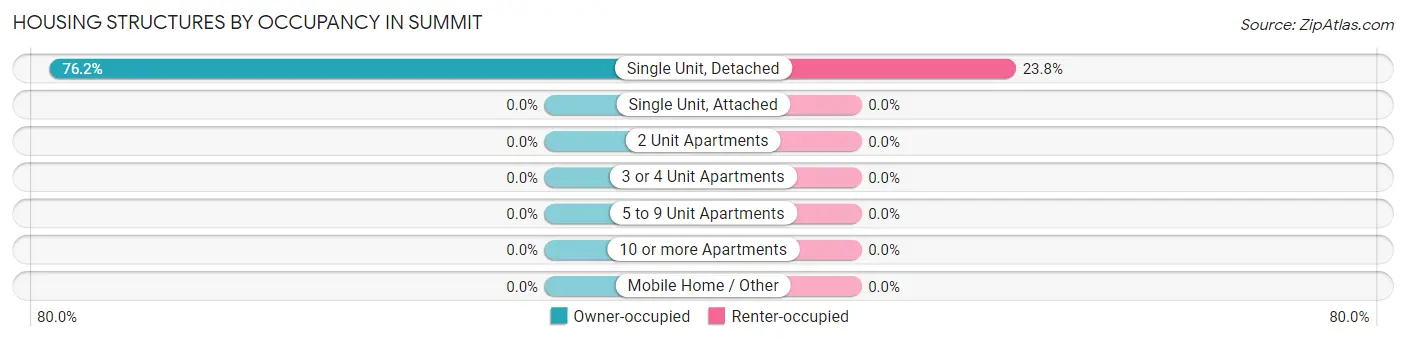
| Structure Type | Owner-occupied | Renter-occupied |
| Single Unit, Detached | 32 (76.2%) | 10 (23.8%) |
| Single Unit, Attached | 0 (0.0%) | 0 (0.0%) |
| 2 Unit Apartments | 0 (0.0%) | 0 (0.0%) |
| 3 or 4 Unit Apartments | 0 (0.0%) | 0 (0.0%) |
| 5 to 9 Unit Apartments | 0 (0.0%) | 0 (0.0%) |
| 10 or more Apartments | 0 (0.0%) | 0 (0.0%) |
| Mobile Home / Other | 0 (0.0%) | 0 (0.0%) |
| Total | 32 (76.2%) | 10 (23.8%) |
Housing Structures by Number of Rooms in Summit
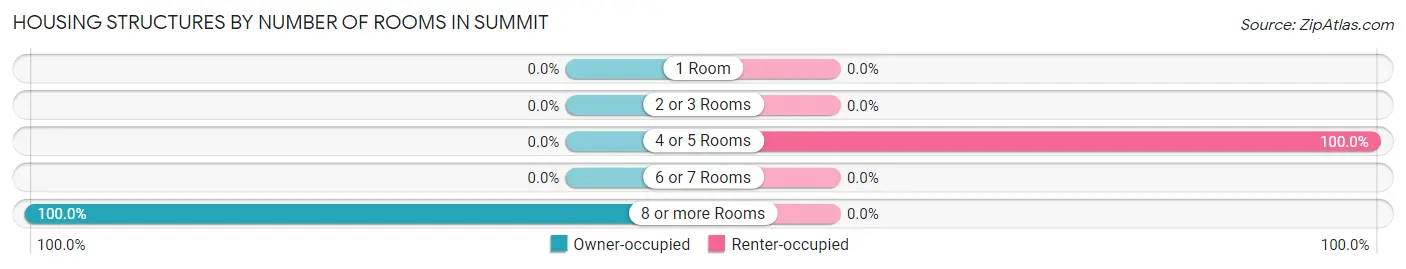
| Number of Rooms | Owner-occupied | Renter-occupied |
| 1 Room | 0 (0.0%) | 0 (0.0%) |
| 2 or 3 Rooms | 0 (0.0%) | 0 (0.0%) |
| 4 or 5 Rooms | 0 (0.0%) | 10 (100.0%) |
| 6 or 7 Rooms | 0 (0.0%) | 0 (0.0%) |
| 8 or more Rooms | 32 (100.0%) | 0 (0.0%) |
| Total | 32 (100.0%) | 10 (100.0%) |
Housing Structure by Heating Type in Summit
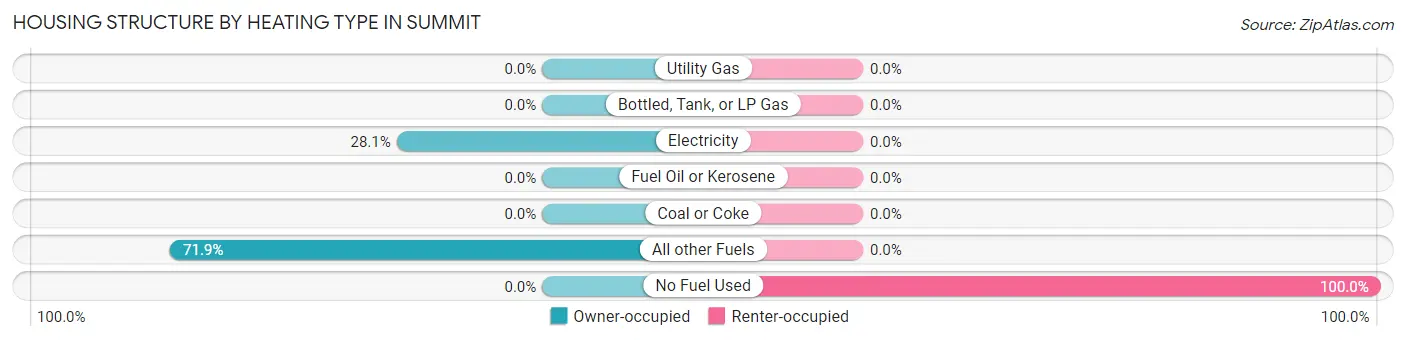
| Heating Type | Owner-occupied | Renter-occupied |
| Utility Gas | 0 (0.0%) | 0 (0.0%) |
| Bottled, Tank, or LP Gas | 0 (0.0%) | 0 (0.0%) |
| Electricity | 9 (28.1%) | 0 (0.0%) |
| Fuel Oil or Kerosene | 0 (0.0%) | 0 (0.0%) |
| Coal or Coke | 0 (0.0%) | 0 (0.0%) |
| All other Fuels | 23 (71.9%) | 0 (0.0%) |
| No Fuel Used | 0 (0.0%) | 10 (100.0%) |
| Total | 32 (100.0%) | 10 (100.0%) |
Household Vehicle Usage in Summit
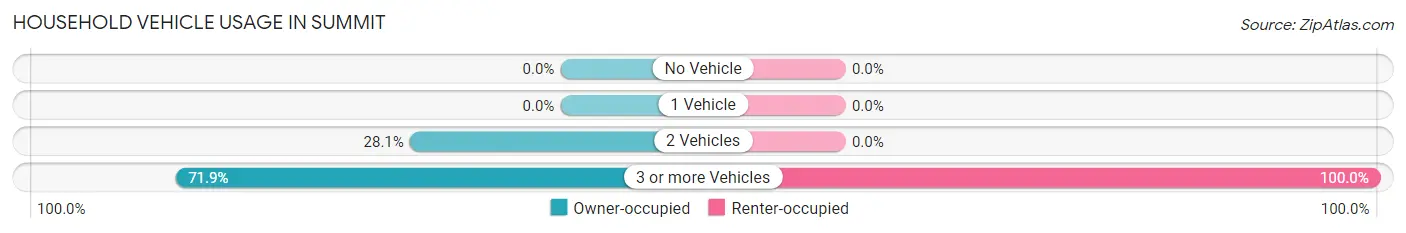
| Vehicles per Household | Owner-occupied | Renter-occupied |
| No Vehicle | 0 (0.0%) | 0 (0.0%) |
| 1 Vehicle | 0 (0.0%) | 0 (0.0%) |
| 2 Vehicles | 9 (28.1%) | 0 (0.0%) |
| 3 or more Vehicles | 23 (71.9%) | 10 (100.0%) |
| Total | 32 (100.0%) | 10 (100.0%) |
Real Estate & Mortgages in Summit
Real Estate and Mortgage Overview in Summit
| Characteristic | Without Mortgage | With Mortgage |
| Housing Units | 18 | 14 |
| Median Property Value | - | - |
| Median Household Income | - | - |
| Monthly Housing Costs | - | - |
| Real Estate Taxes | - | - |
Property Value by Mortgage Status in Summit
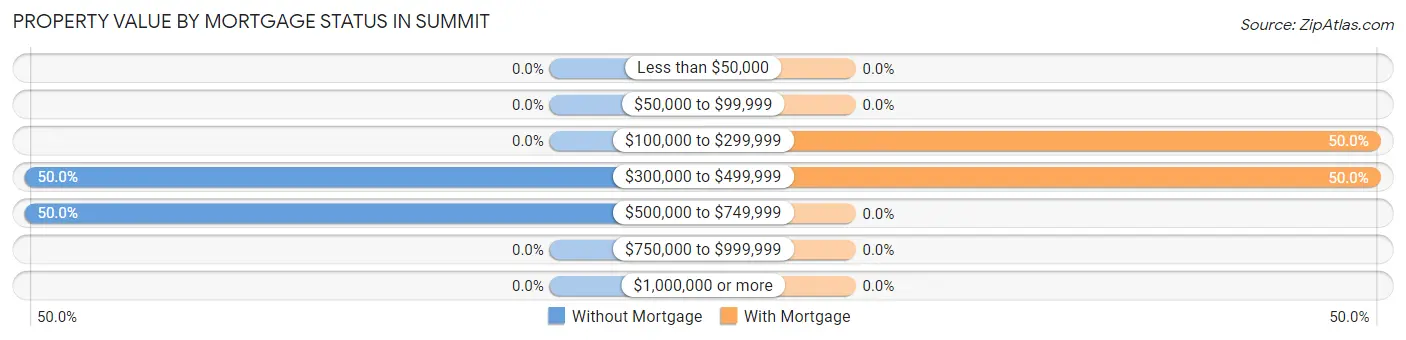
| Property Value | Without Mortgage | With Mortgage |
| Less than $50,000 | 0 (0.0%) | 0 (0.0%) |
| $50,000 to $99,999 | 0 (0.0%) | 0 (0.0%) |
| $100,000 to $299,999 | 0 (0.0%) | 7 (50.0%) |
| $300,000 to $499,999 | 9 (50.0%) | 7 (50.0%) |
| $500,000 to $749,999 | 9 (50.0%) | 0 (0.0%) |
| $750,000 to $999,999 | 0 (0.0%) | 0 (0.0%) |
| $1,000,000 or more | 0 (0.0%) | 0 (0.0%) |
| Total | 18 (100.0%) | 14 (100.0%) |
Household Income by Mortgage Status in Summit
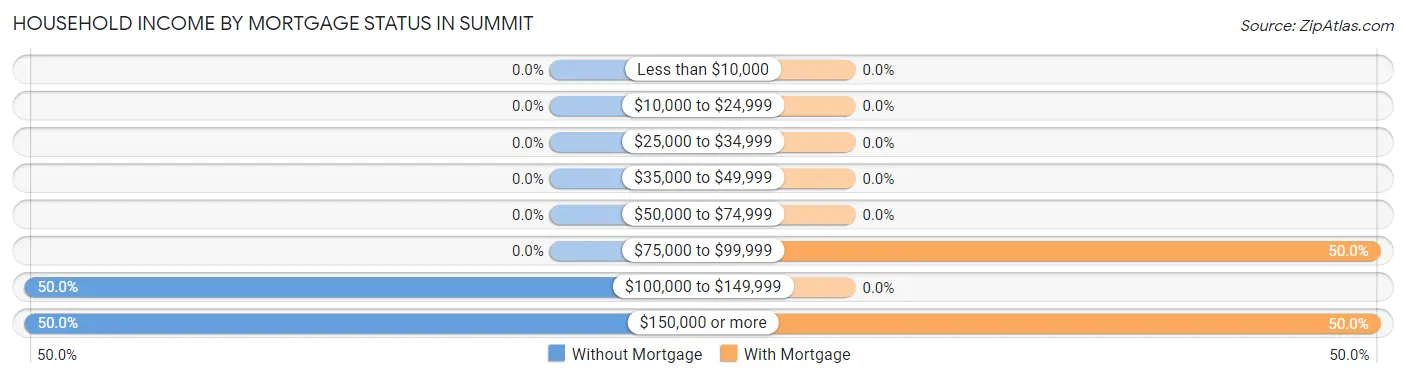
| Household Income | Without Mortgage | With Mortgage |
| Less than $10,000 | 0 (0.0%) | 0 (0.0%) |
| $10,000 to $24,999 | 0 (0.0%) | 0 (0.0%) |
| $25,000 to $34,999 | 0 (0.0%) | 0 (0.0%) |
| $35,000 to $49,999 | 0 (0.0%) | 0 (0.0%) |
| $50,000 to $74,999 | 0 (0.0%) | 0 (0.0%) |
| $75,000 to $99,999 | 0 (0.0%) | 7 (50.0%) |
| $100,000 to $149,999 | 9 (50.0%) | 0 (0.0%) |
| $150,000 or more | 9 (50.0%) | 7 (50.0%) |
| Total | 18 (100.0%) | 14 (100.0%) |
Property Value to Household Income Ratio in Summit
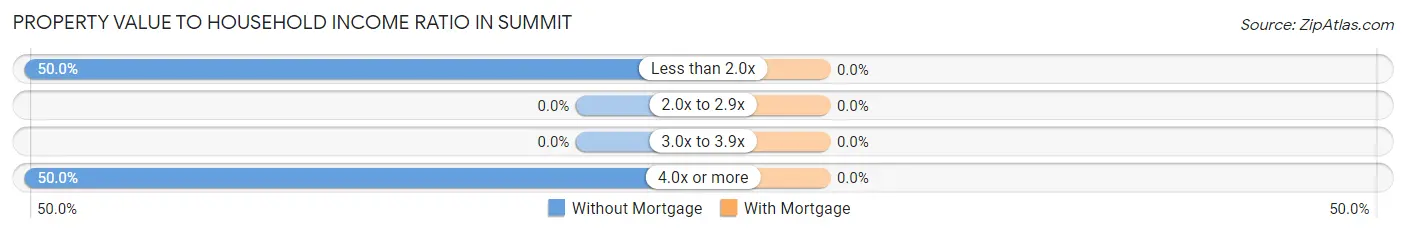
| Value-to-Income Ratio | Without Mortgage | With Mortgage |
| Less than 2.0x | 9 (50.0%) | 0 (0.0%) |
| 2.0x to 2.9x | 0 (0.0%) | 0 (0.0%) |
| 3.0x to 3.9x | 0 (0.0%) | 0 (0.0%) |
| 4.0x or more | 9 (50.0%) | 0 (0.0%) |
| Total | 18 (100.0%) | 14 (100.0%) |
Real Estate Taxes by Mortgage Status in Summit
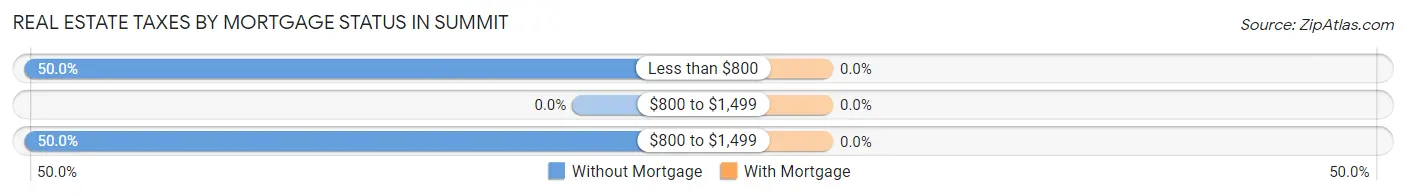
| Property Taxes | Without Mortgage | With Mortgage |
| Less than $800 | 9 (50.0%) | 0 (0.0%) |
| $800 to $1,499 | 0 (0.0%) | 0 (0.0%) |
| $800 to $1,499 | 9 (50.0%) | 0 (0.0%) |
| Total | 18 (100.0%) | 14 (100.0%) |
Health & Disability in Summit
Health Insurance Coverage by Age in Summit
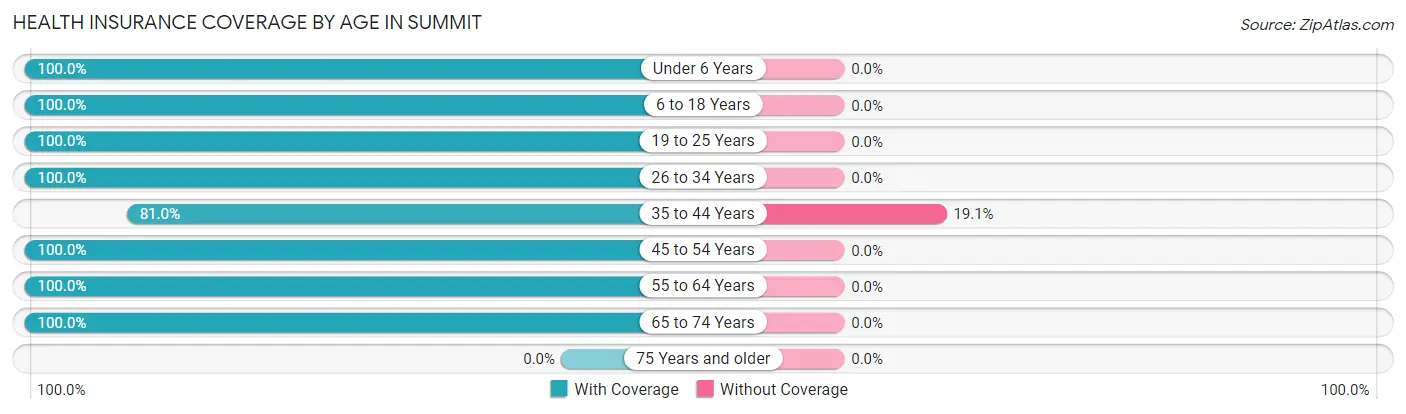
| Age Bracket | With Coverage | Without Coverage |
| Under 6 Years | 42 (100.0%) | 0 (0.0%) |
| 6 to 18 Years | 31 (100.0%) | 0 (0.0%) |
| 19 to 25 Years | 16 (100.0%) | 0 (0.0%) |
| 26 to 34 Years | 23 (100.0%) | 0 (0.0%) |
| 35 to 44 Years | 17 (80.9%) | 4 (19.1%) |
| 45 to 54 Years | 27 (100.0%) | 0 (0.0%) |
| 55 to 64 Years | 3 (100.0%) | 0 (0.0%) |
| 65 to 74 Years | 14 (100.0%) | 0 (0.0%) |
| 75 Years and older | 0 (0.0%) | 0 (0.0%) |
| Total | 173 (97.7%) | 4 (2.3%) |
Health Insurance Coverage by Citizenship Status in Summit
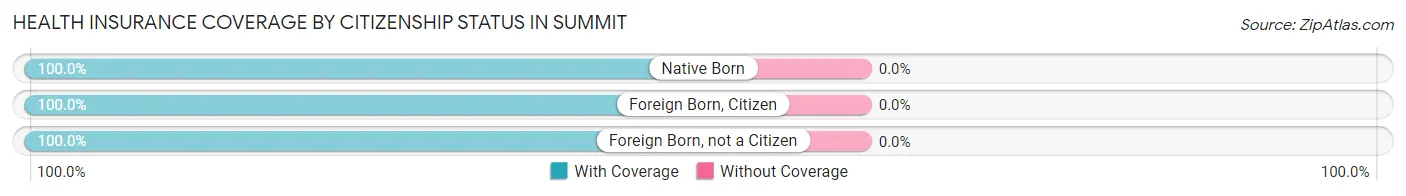
| Citizenship Status | With Coverage | Without Coverage |
| Native Born | 42 (100.0%) | 0 (0.0%) |
| Foreign Born, Citizen | 31 (100.0%) | 0 (0.0%) |
| Foreign Born, not a Citizen | 16 (100.0%) | 0 (0.0%) |
Health Insurance Coverage by Household Income in Summit
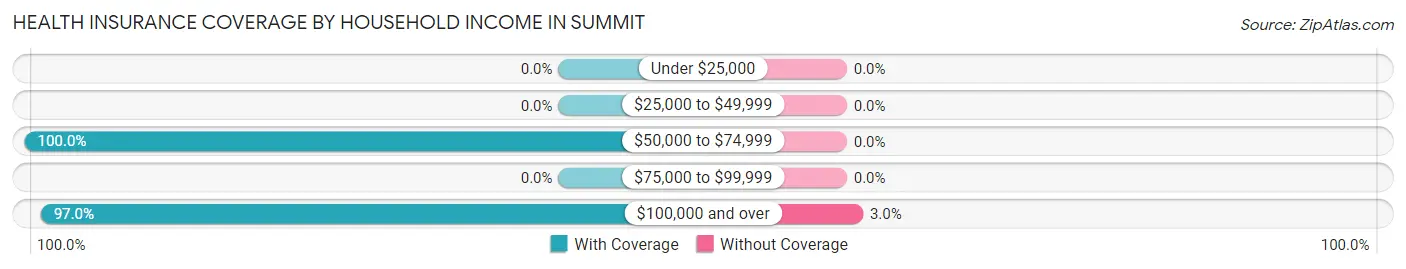
| Household Income | With Coverage | Without Coverage |
| Under $25,000 | 0 (0.0%) | 0 (0.0%) |
| $25,000 to $49,999 | 0 (0.0%) | 0 (0.0%) |
| $50,000 to $74,999 | 45 (100.0%) | 0 (0.0%) |
| $75,000 to $99,999 | 0 (0.0%) | 0 (0.0%) |
| $100,000 and over | 128 (97.0%) | 4 (3.0%) |
Public vs Private Health Insurance Coverage by Age in Summit
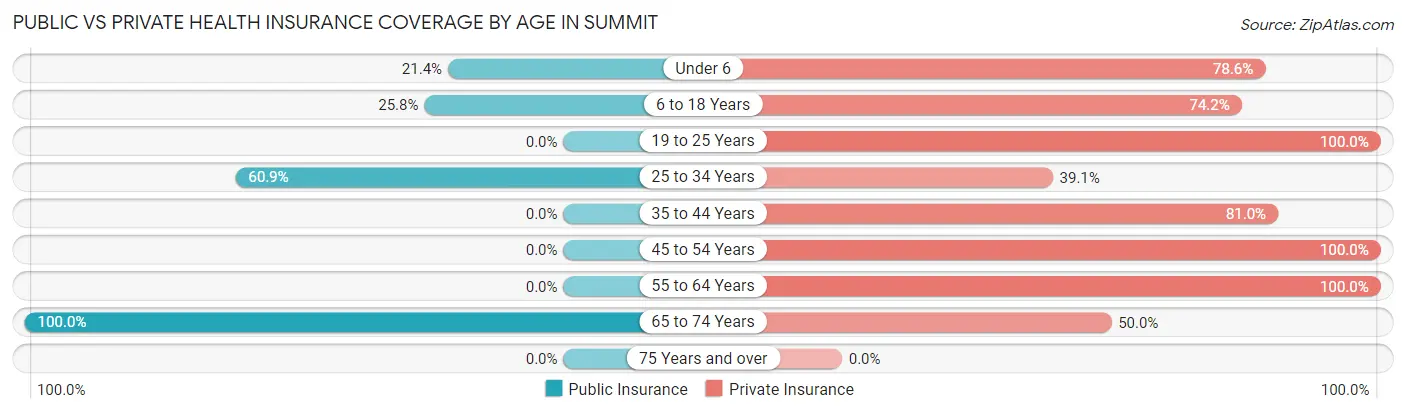
| Age Bracket | Public Insurance | Private Insurance |
| Under 6 | 9 (21.4%) | 33 (78.6%) |
| 6 to 18 Years | 8 (25.8%) | 23 (74.2%) |
| 19 to 25 Years | 0 (0.0%) | 16 (100.0%) |
| 25 to 34 Years | 14 (60.9%) | 9 (39.1%) |
| 35 to 44 Years | 0 (0.0%) | 17 (80.9%) |
| 45 to 54 Years | 0 (0.0%) | 27 (100.0%) |
| 55 to 64 Years | 0 (0.0%) | 3 (100.0%) |
| 65 to 74 Years | 14 (100.0%) | 7 (50.0%) |
| 75 Years and over | 0 (0.0%) | 0 (0.0%) |
| Total | 45 (25.4%) | 135 (76.3%) |
Disability Status by Sex by Age in Summit
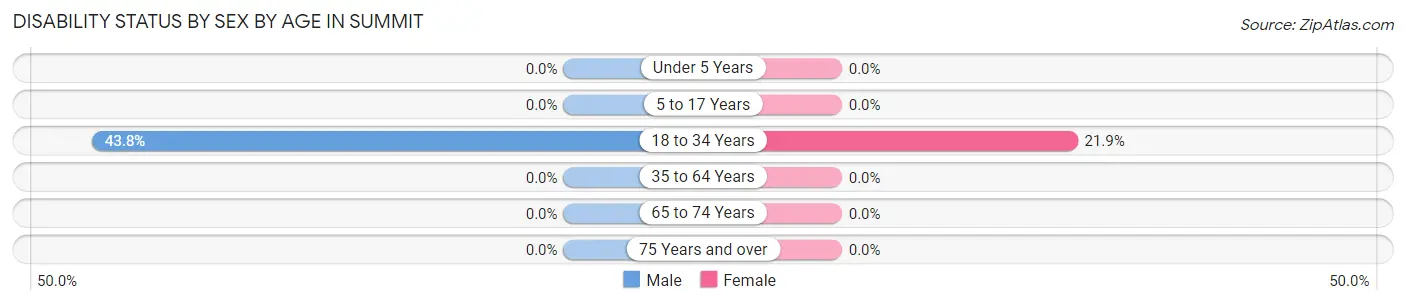
| Age Bracket | Male | Female |
| Under 5 Years | 0 (0.0%) | 0 (0.0%) |
| 5 to 17 Years | 0 (0.0%) | 0 (0.0%) |
| 18 to 34 Years | 7 (43.8%) | 7 (21.9%) |
| 35 to 64 Years | 0 (0.0%) | 0 (0.0%) |
| 65 to 74 Years | 0 (0.0%) | 0 (0.0%) |
| 75 Years and over | 0 (0.0%) | 0 (0.0%) |
Disability Class by Sex by Age in Summit
Disability Class: Hearing Difficulty
| Age Bracket | Male | Female |
| Under 5 Years | 0 (0.0%) | 0 (0.0%) |
| 5 to 17 Years | 0 (0.0%) | 0 (0.0%) |
| 18 to 34 Years | 0 (0.0%) | 0 (0.0%) |
| 35 to 64 Years | 0 (0.0%) | 0 (0.0%) |
| 65 to 74 Years | 0 (0.0%) | 0 (0.0%) |
| 75 Years and over | 0 (0.0%) | 0 (0.0%) |
Disability Class: Vision Difficulty
| Age Bracket | Male | Female |
| Under 5 Years | 0 (0.0%) | 0 (0.0%) |
| 5 to 17 Years | 0 (0.0%) | 0 (0.0%) |
| 18 to 34 Years | 0 (0.0%) | 0 (0.0%) |
| 35 to 64 Years | 0 (0.0%) | 0 (0.0%) |
| 65 to 74 Years | 0 (0.0%) | 0 (0.0%) |
| 75 Years and over | 0 (0.0%) | 0 (0.0%) |
Disability Class: Cognitive Difficulty
| Age Bracket | Male | Female |
| 5 to 17 Years | 0 (0.0%) | 0 (0.0%) |
| 18 to 34 Years | 7 (43.8%) | 7 (21.9%) |
| 35 to 64 Years | 0 (0.0%) | 0 (0.0%) |
| 65 to 74 Years | 0 (0.0%) | 0 (0.0%) |
| 75 Years and over | 0 (0.0%) | 0 (0.0%) |
Disability Class: Ambulatory Difficulty
| Age Bracket | Male | Female |
| 5 to 17 Years | 0 (0.0%) | 0 (0.0%) |
| 18 to 34 Years | 0 (0.0%) | 0 (0.0%) |
| 35 to 64 Years | 0 (0.0%) | 0 (0.0%) |
| 65 to 74 Years | 0 (0.0%) | 0 (0.0%) |
| 75 Years and over | 0 (0.0%) | 0 (0.0%) |
Disability Class: Self-Care Difficulty
| Age Bracket | Male | Female |
| 5 to 17 Years | 0 (0.0%) | 0 (0.0%) |
| 18 to 34 Years | 0 (0.0%) | 0 (0.0%) |
| 35 to 64 Years | 0 (0.0%) | 0 (0.0%) |
| 65 to 74 Years | 0 (0.0%) | 0 (0.0%) |
| 75 Years and over | 0 (0.0%) | 0 (0.0%) |
Technology Access in Summit
Computing Device Access in Summit
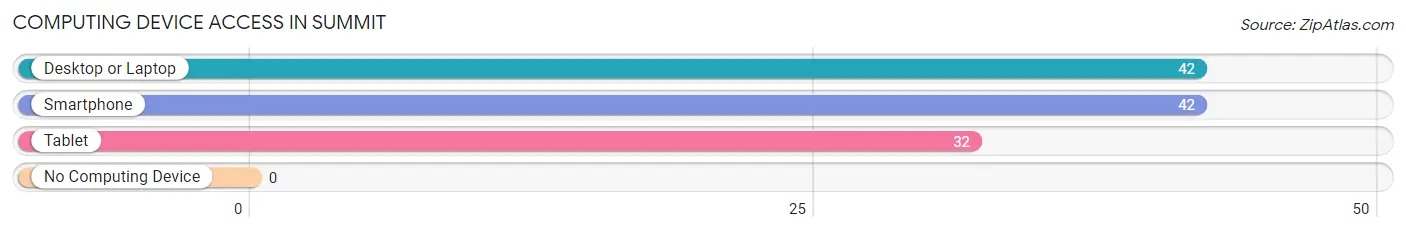
| Device Type | # Households | % Households |
| Desktop or Laptop | 42 | 100.0% |
| Smartphone | 42 | 100.0% |
| Tablet | 32 | 76.2% |
| No Computing Device | 0 | 0.0% |
| Total | 42 | 100.0% |
Internet Access in Summit
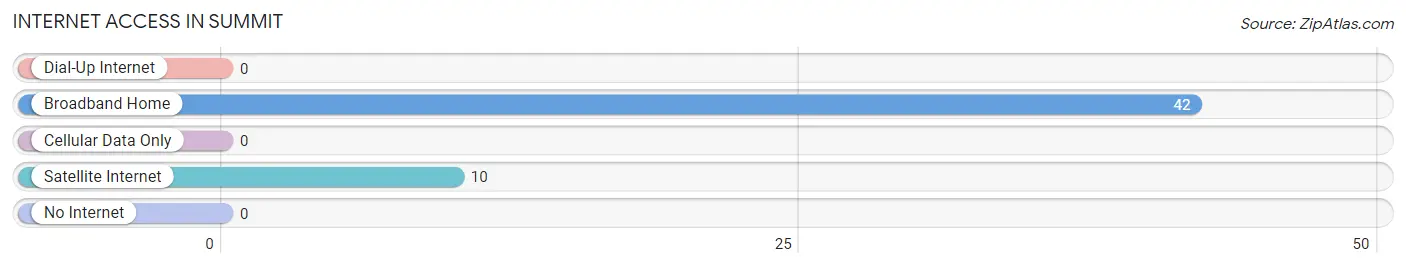
| Internet Type | # Households | % Households |
| Dial-Up Internet | 0 | 0.0% |
| Broadband Home | 42 | 100.0% |
| Cellular Data Only | 0 | 0.0% |
| Satellite Internet | 10 | 23.8% |
| No Internet | 0 | 0.0% |
| Total | 42 | 100.0% |
Summit Summary
Summit is a small unincorporated community located in the foothills of the Cascade Mountains in Clackamas County, Oregon. It is situated on the western edge of the Mount Hood National Forest, approximately 25 miles southeast of Portland. The community is home to a population of approximately 500 people, and is known for its rural atmosphere and stunning views of the surrounding mountains.
History
The area that is now Summit was first settled in the late 1800s by homesteaders who were drawn to the area by its abundant natural resources. The first post office in the area was established in 1891, and the community was officially named Summit in 1895. The name was chosen to reflect the high elevation of the area, which is the highest point in Clackamas County.
In the early 1900s, the area began to develop as a logging and farming community. The logging industry was particularly important to the local economy, and the area was home to several sawmills and logging camps. The logging industry declined in the mid-1900s, but the area remains a popular destination for outdoor recreation.
Geography
Summit is located in the foothills of the Cascade Mountains, approximately 25 miles southeast of Portland. The community is situated at an elevation of 1,800 feet, making it the highest point in Clackamas County. The area is characterized by rolling hills, dense forests, and stunning views of the surrounding mountains.
The climate in Summit is mild and temperate, with warm summers and cool winters. The average annual temperature is around 50 degrees Fahrenheit, and the average annual precipitation is around 40 inches.
Economy
The economy of Summit is largely based on tourism and outdoor recreation. The area is home to several popular hiking trails, camping sites, and fishing spots, and is a popular destination for outdoor enthusiasts. The area is also home to several small businesses, including restaurants, cafes, and retail stores.
Demographics
As of the 2010 census, the population of Summit was approximately 500 people. The racial makeup of the community was 94.2% White, 0.8% Native American, 0.4% Asian, 0.2% African American, and 4.4% from other races. The median household income was $45,000, and the median age was 44.
Summit is a small, rural community with a strong sense of community and a commitment to preserving its natural beauty. The area is known for its stunning views of the surrounding mountains, and its abundance of outdoor recreation opportunities.
Common Questions
What is Per Capita Income in Summit?
Per Capita income in Summit is $31,131.
What is the Median Family Income in Summit?
Median Family Income in Summit is $116,429.
What is the Median Household income in Summit?
Median Household Income in Summit is $116,429.
What is Inequality or Gini Index in Summit?
Inequality or Gini Index in Summit is 0.19.
What is the Total Population of Summit?
Total Population of Summit is 177.
What is the Total Male Population of Summit?
Total Male Population of Summit is 62.
What is the Total Female Population of Summit?
Total Female Population of Summit is 115.
What is the Ratio of Males per 100 Females in Summit?
There are 53.91 Males per 100 Females in Summit.
What is the Ratio of Females per 100 Males in Summit?
There are 185.48 Females per 100 Males in Summit.
What is the Median Population Age in Summit?
Median Population Age in Summit is 24.0 Years.
What is the Average Family Size in Summit
Average Family Size in Summit is 3.7 People.
What is the Average Household Size in Summit
Average Household Size in Summit is 4.2 People.
How Large is the Labor Force in Summit?
There are 107 People in the Labor Forcein in Summit.
What is the Percentage of People in the Labor Force in Summit?
88.4% of People are in the Labor Force in Summit.
What is the Unemployment Rate in Summit?
Unemployment Rate in Summit is 7.5%.