Ukiah, OR Map & Demographics
Ukiah Map
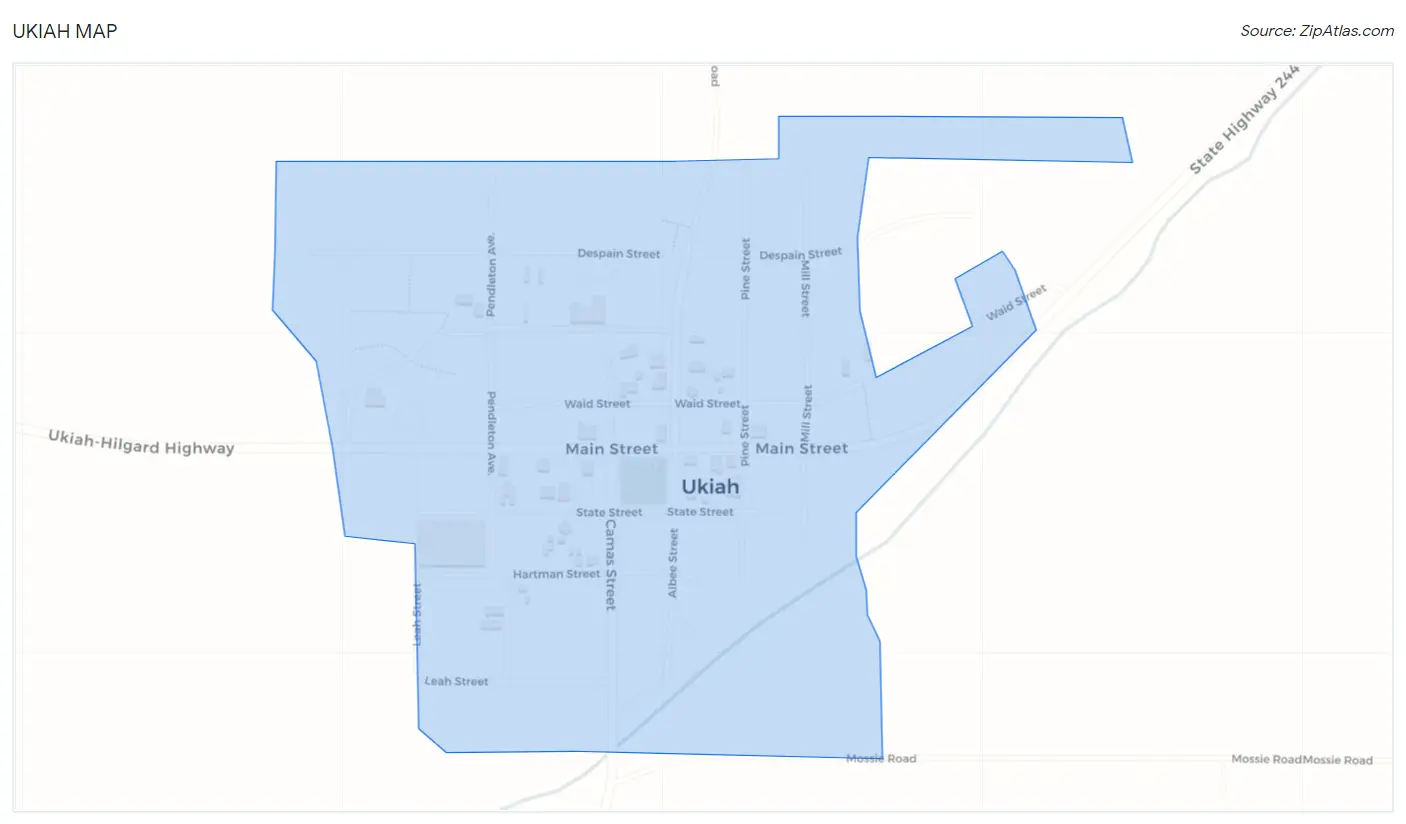
Ukiah Overview
$20,616
PER CAPITA INCOME
$78,000
AVG FAMILY INCOME
0.41
INEQUALITY / GINI INDEX
265
TOTAL POPULATION
126
MALE POPULATION
139
FEMALE POPULATION
90.65
MALES / 100 FEMALES
110.32
FEMALES / 100 MALES
46.8
MEDIAN AGE
2.6
AVG FAMILY SIZE
1.8
AVG HOUSEHOLD SIZE
113
LABOR FORCE [ PEOPLE ]
50.4%
PERCENT IN LABOR FORCE
18.6%
UNEMPLOYMENT RATE
Ukiah Zip Codes
Ukiah Area Codes
Income in Ukiah
Income Overview in Ukiah
| Characteristic | Number | Measure |
| Per Capita Income | 265 | $20,616 |
| Median Family Income | 48 | $78,000 |
| Mean Family Income | 48 | $71,715 |
| Median Household Income | 107 | $0 |
| Mean Household Income | 107 | $47,321 |
| Income Deficit | 48 | $0 |
| Wage / Income Gap (%) | 265 | 0.00% |
| Wage / Income Gap ($) | 265 | 100.00¢ per $1 |
| Gini / Inequality Index | 265 | 0.41 |
Earnings by Sex in Ukiah
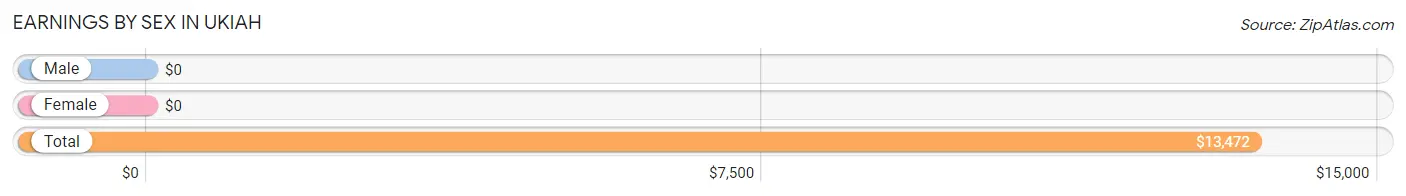
| Sex | Number | Average Earnings |
| Male | 85 (59.4%) | $0 |
| Female | 58 (40.6%) | $0 |
| Total | 143 (100.0%) | $13,472 |
Earnings by Sex by Income Bracket in Ukiah
The most common earnings brackets in Ukiah are $45,000 to $49,999 for men (15 | 17.6%) and $2,499 or less for women (23 | 39.7%).
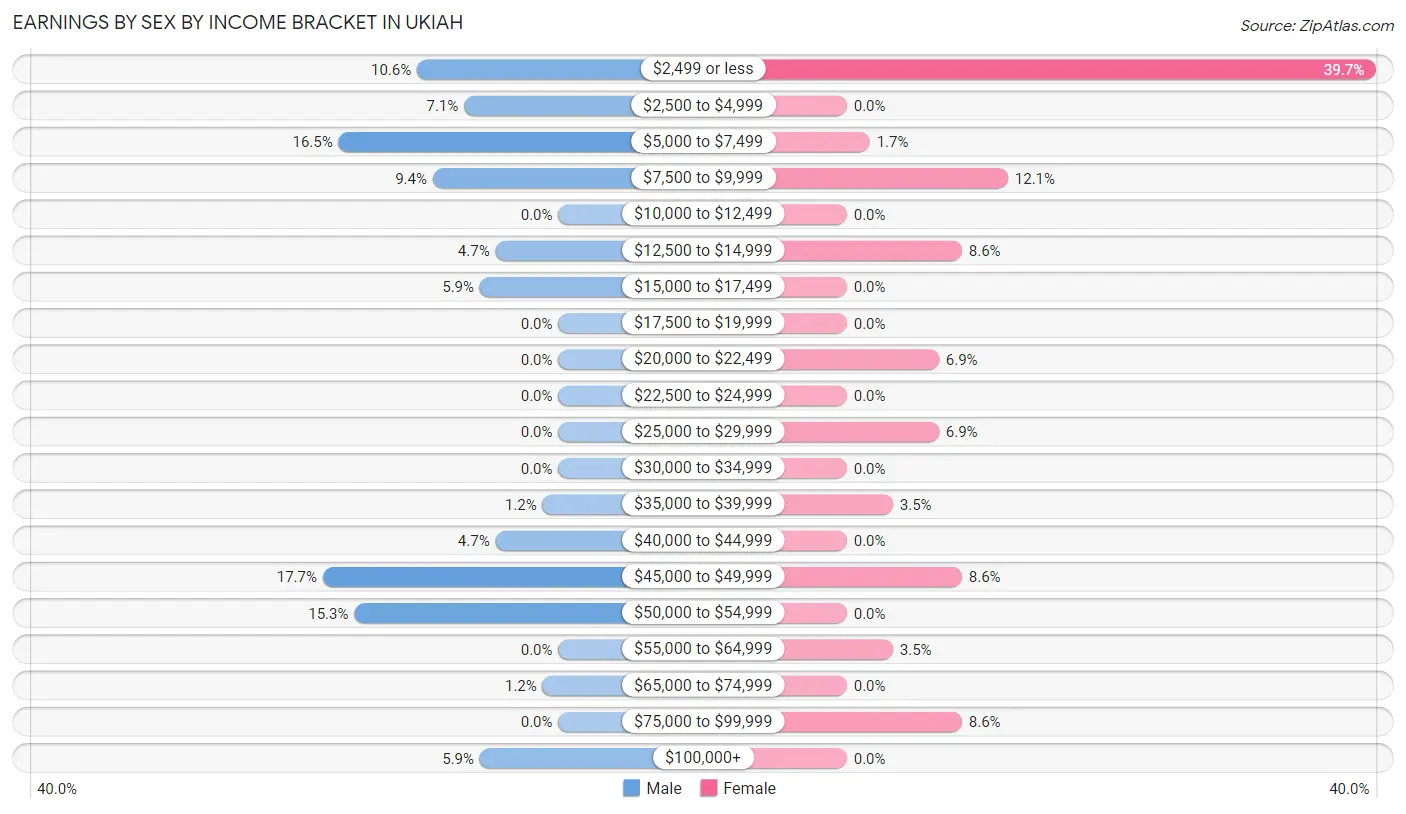
| Income | Male | Female |
| $2,499 or less | 9 (10.6%) | 23 (39.7%) |
| $2,500 to $4,999 | 6 (7.1%) | 0 (0.0%) |
| $5,000 to $7,499 | 14 (16.5%) | 1 (1.7%) |
| $7,500 to $9,999 | 8 (9.4%) | 7 (12.1%) |
| $10,000 to $12,499 | 0 (0.0%) | 0 (0.0%) |
| $12,500 to $14,999 | 4 (4.7%) | 5 (8.6%) |
| $15,000 to $17,499 | 5 (5.9%) | 0 (0.0%) |
| $17,500 to $19,999 | 0 (0.0%) | 0 (0.0%) |
| $20,000 to $22,499 | 0 (0.0%) | 4 (6.9%) |
| $22,500 to $24,999 | 0 (0.0%) | 0 (0.0%) |
| $25,000 to $29,999 | 0 (0.0%) | 4 (6.9%) |
| $30,000 to $34,999 | 0 (0.0%) | 0 (0.0%) |
| $35,000 to $39,999 | 1 (1.2%) | 2 (3.5%) |
| $40,000 to $44,999 | 4 (4.7%) | 0 (0.0%) |
| $45,000 to $49,999 | 15 (17.6%) | 5 (8.6%) |
| $50,000 to $54,999 | 13 (15.3%) | 0 (0.0%) |
| $55,000 to $64,999 | 0 (0.0%) | 2 (3.5%) |
| $65,000 to $74,999 | 1 (1.2%) | 0 (0.0%) |
| $75,000 to $99,999 | 0 (0.0%) | 5 (8.6%) |
| $100,000+ | 5 (5.9%) | 0 (0.0%) |
| Total | 85 (100.0%) | 58 (100.0%) |
Earnings by Sex by Educational Attainment in Ukiah
Average earnings in Ukiah are $47,857 for men and $27,917 for women, a difference of 41.7%. Men with an educational attainment of high school diploma enjoy the highest average annual earnings of $48,393, while those with high school diploma education earn the least with $48,393. Women with an educational attainment of high school diploma earn the most with the average annual earnings of $29,167, while those with high school diploma education have the smallest earnings of $29,167.
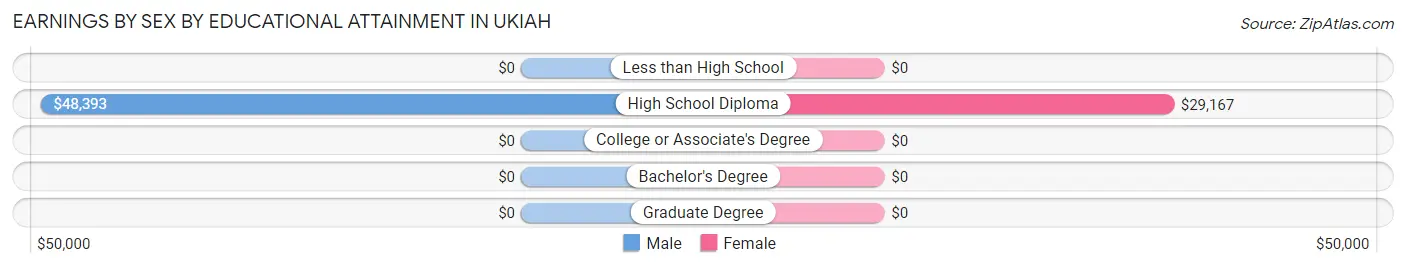
| Educational Attainment | Male Income | Female Income |
| Less than High School | - | - |
| High School Diploma | $48,393 | $29,167 |
| College or Associate's Degree | - | - |
| Bachelor's Degree | - | - |
| Graduate Degree | - | - |
| Total | $47,857 | $27,917 |
Family Income in Ukiah
Family Income Brackets in Ukiah
According to the Ukiah family income data, there are 25 families falling into the $75,000 to $99,999 income range, which is the most common income bracket and makes up 52.1% of all families.
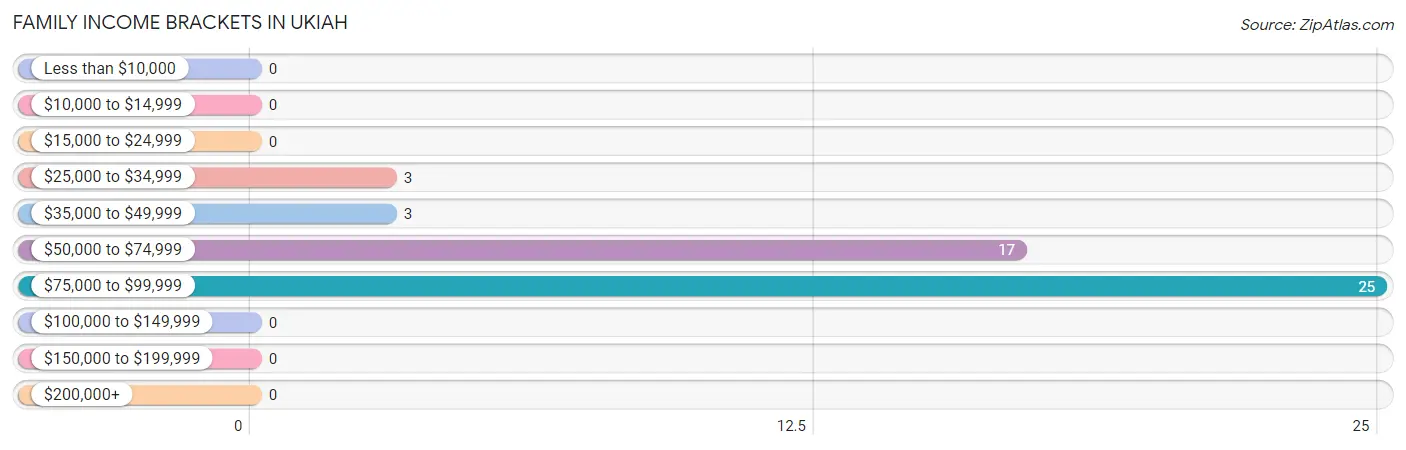
| Income Bracket | # Families | % Families |
| Less than $10,000 | 0 | 0.0% |
| $10,000 to $14,999 | 0 | 0.0% |
| $15,000 to $24,999 | 0 | 0.0% |
| $25,000 to $34,999 | 3 | 6.3% |
| $35,000 to $49,999 | 3 | 6.3% |
| $50,000 to $74,999 | 17 | 35.4% |
| $75,000 to $99,999 | 25 | 52.1% |
| $100,000 to $149,999 | 0 | 0.0% |
| $150,000 to $199,999 | 0 | 0.0% |
| $200,000+ | 0 | 0.0% |
Family Income by Famaliy Size in Ukiah
2-person families (34 | 70.8%) account for the highest median family income in Ukiah with $70,625 per family, while 2-person families (34 | 70.8%) have the highest median income of $35,312 per family member.
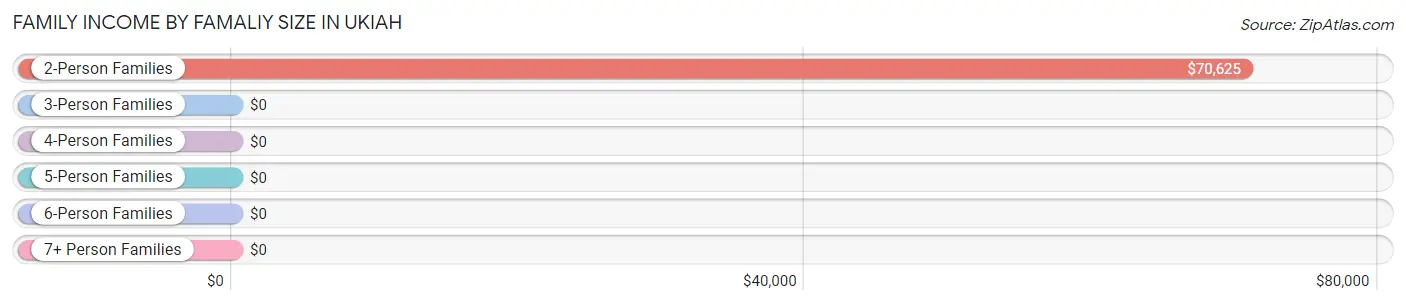
| Income Bracket | # Families | Median Income |
| 2-Person Families | 34 (70.8%) | $70,625 |
| 3-Person Families | 0 (0.0%) | $0 |
| 4-Person Families | 14 (29.2%) | $0 |
| 5-Person Families | 0 (0.0%) | $0 |
| 6-Person Families | 0 (0.0%) | $0 |
| 7+ Person Families | 0 (0.0%) | $0 |
| Total | 48 (100.0%) | $78,000 |
Family Income by Number of Earners in Ukiah
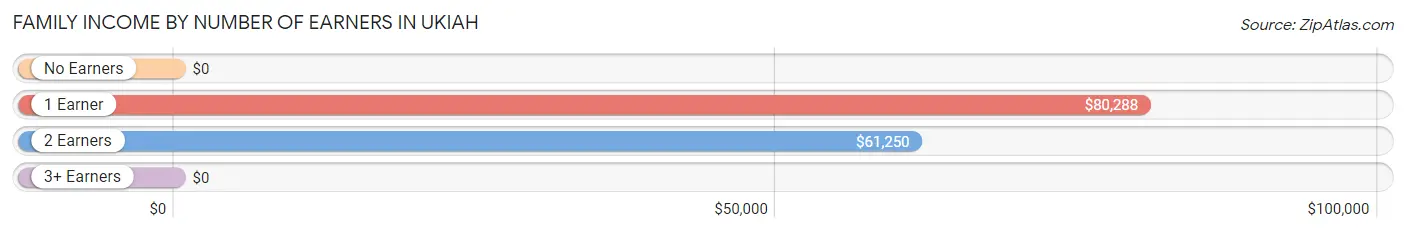
| Number of Earners | # Families | Median Income |
| No Earners | 8 (16.7%) | $0 |
| 1 Earner | 23 (47.9%) | $80,288 |
| 2 Earners | 16 (33.3%) | $61,250 |
| 3+ Earners | 1 (2.1%) | $0 |
| Total | 48 (100.0%) | $78,000 |
Household Income in Ukiah
Household Income Brackets in Ukiah
With 41 households falling in the category, the $10,000 to $14,999 income range is the most frequent in Ukiah, accounting for 38.3% of all households.
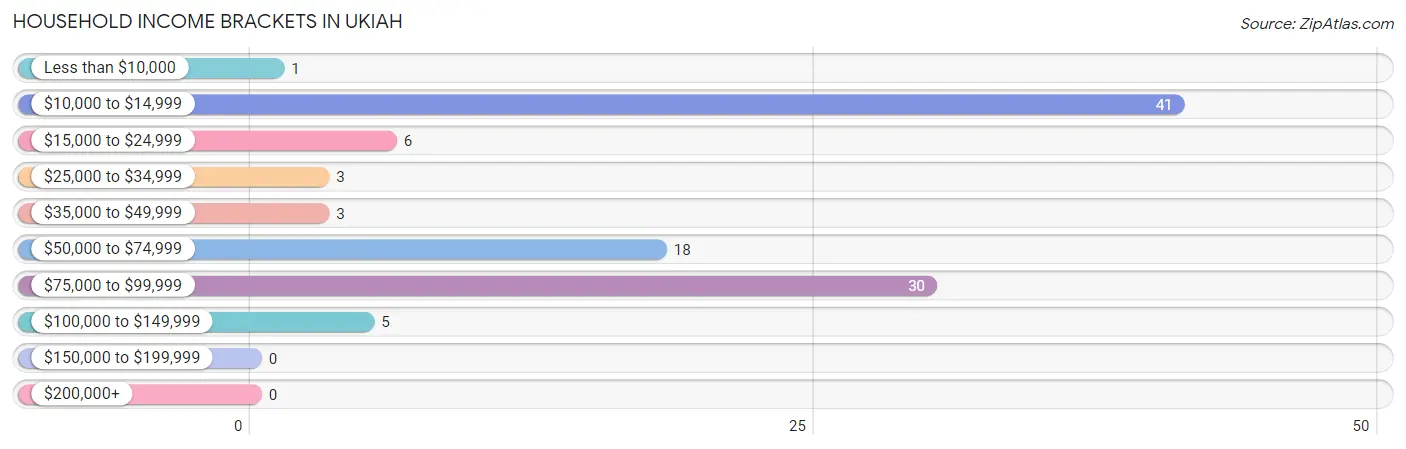
| Income Bracket | # Households | % Households |
| Less than $10,000 | 1 | 0.9% |
| $10,000 to $14,999 | 41 | 38.3% |
| $15,000 to $24,999 | 6 | 5.6% |
| $25,000 to $34,999 | 3 | 2.8% |
| $35,000 to $49,999 | 3 | 2.8% |
| $50,000 to $74,999 | 18 | 16.8% |
| $75,000 to $99,999 | 30 | 28.0% |
| $100,000 to $149,999 | 5 | 4.7% |
| $150,000 to $199,999 | 0 | 0.0% |
| $200,000+ | 0 | 0.0% |
Household Income by Householder Age in Ukiah
The median household income in Ukiah is $0, with the highest median household income of $91,250 found in the 45 to 64 years age bracket for the primary householder. A total of 28 households (26.2%) fall into this category. Meanwhile, the 15 to 24 years age bracket for the primary householder has the lowest median household income of $0, with 6 households (5.6%) in this group.
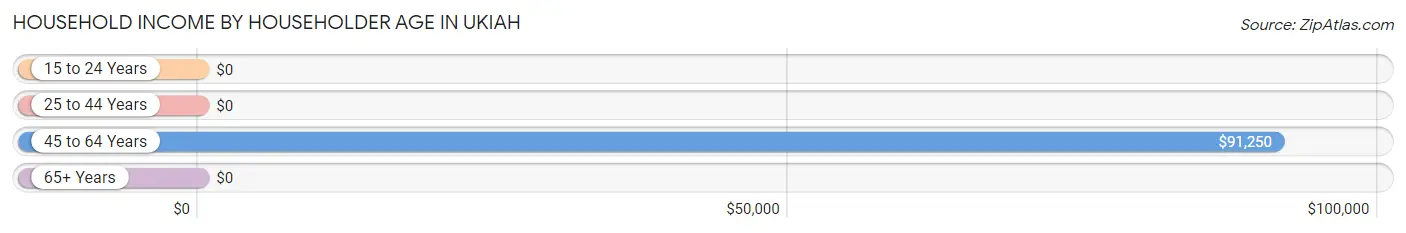
| Income Bracket | # Households | Median Income |
| 15 to 24 Years | 6 (5.6%) | $0 |
| 25 to 44 Years | 4 (3.7%) | $0 |
| 45 to 64 Years | 28 (26.2%) | $91,250 |
| 65+ Years | 69 (64.5%) | $0 |
| Total | 107 (100.0%) | $0 |
Poverty in Ukiah
Income Below Poverty by Sex and Age in Ukiah
With 5.8% poverty level for males and 46.6% for females among the residents of Ukiah, 25 to 34 year old males and 18 to 24 year old females are the most vulnerable to poverty, with 4 males (100.0%) and 11 females (91.7%) in their respective age groups living below the poverty level.
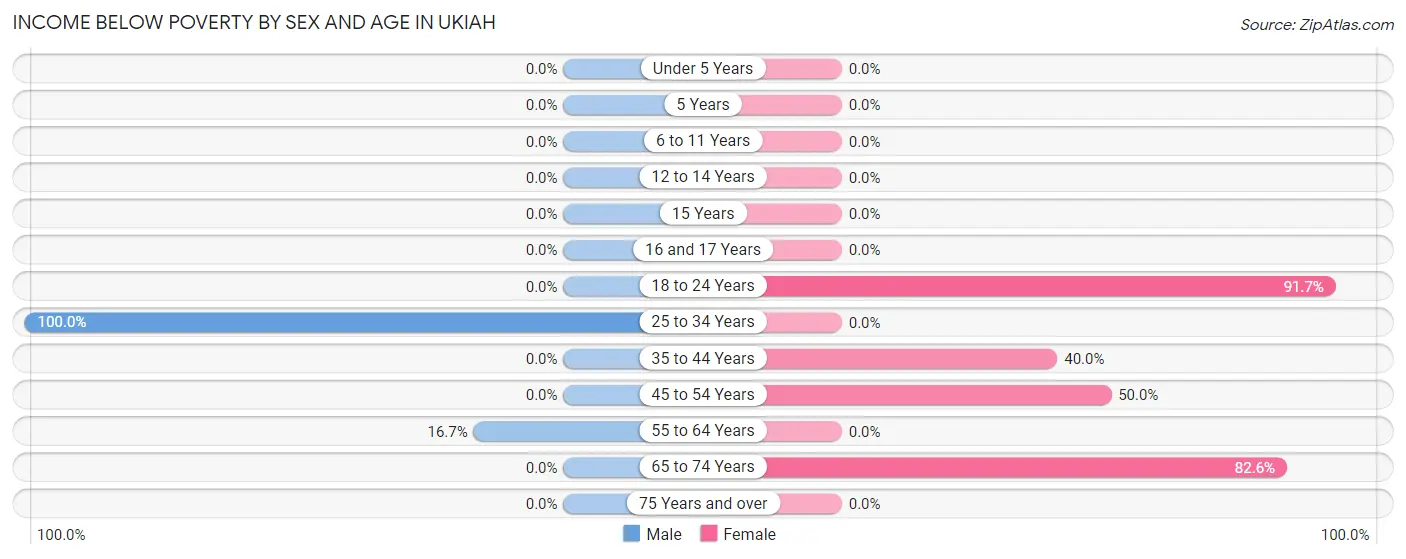
| Age Bracket | Male | Female |
| Under 5 Years | 0 (0.0%) | 0 (0.0%) |
| 5 Years | 0 (0.0%) | 0 (0.0%) |
| 6 to 11 Years | 0 (0.0%) | 0 (0.0%) |
| 12 to 14 Years | 0 (0.0%) | 0 (0.0%) |
| 15 Years | 0 (0.0%) | 0 (0.0%) |
| 16 and 17 Years | 0 (0.0%) | 0 (0.0%) |
| 18 to 24 Years | 0 (0.0%) | 11 (91.7%) |
| 25 to 34 Years | 4 (100.0%) | 0 (0.0%) |
| 35 to 44 Years | 0 (0.0%) | 2 (40.0%) |
| 45 to 54 Years | 0 (0.0%) | 4 (50.0%) |
| 55 to 64 Years | 1 (16.7%) | 0 (0.0%) |
| 65 to 74 Years | 0 (0.0%) | 38 (82.6%) |
| 75 Years and over | 0 (0.0%) | 0 (0.0%) |
| Total | 5 (5.8%) | 55 (46.6%) |
Income Above Poverty by Sex and Age in Ukiah
According to the poverty statistics in Ukiah, males aged under 5 years and females aged 6 to 11 years are the age groups that are most secure financially, with 100.0% of males and 100.0% of females in these age groups living above the poverty line.
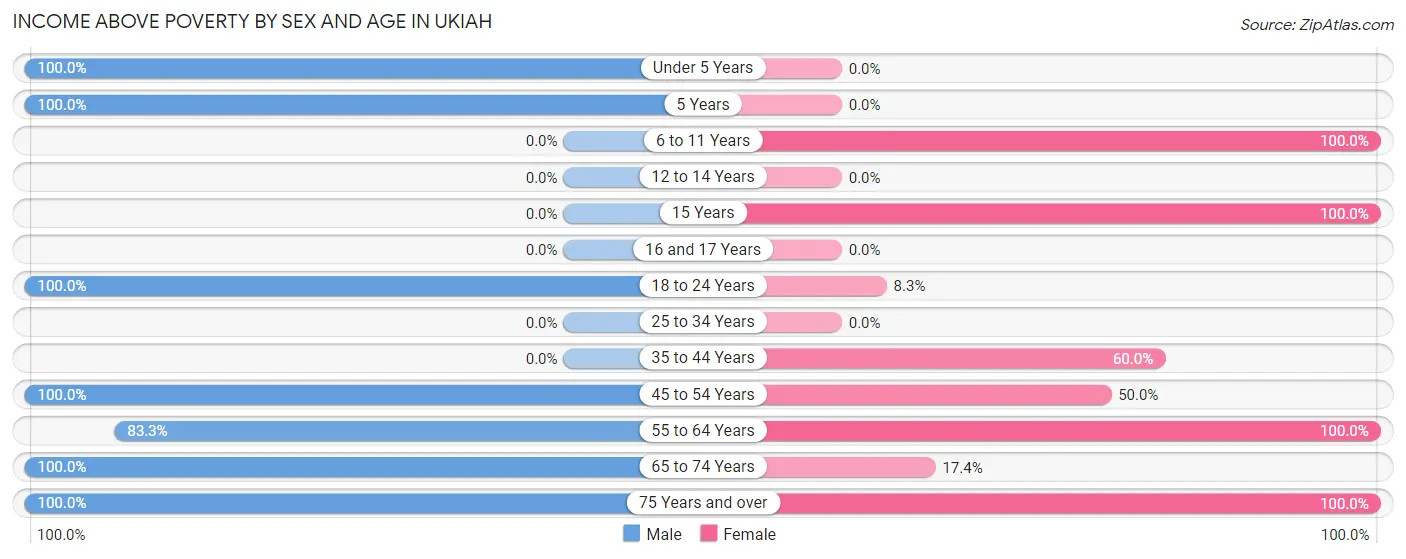
| Age Bracket | Male | Female |
| Under 5 Years | 17 (100.0%) | 0 (0.0%) |
| 5 Years | 1 (100.0%) | 0 (0.0%) |
| 6 to 11 Years | 0 (0.0%) | 12 (100.0%) |
| 12 to 14 Years | 0 (0.0%) | 0 (0.0%) |
| 15 Years | 0 (0.0%) | 11 (100.0%) |
| 16 and 17 Years | 0 (0.0%) | 0 (0.0%) |
| 18 to 24 Years | 5 (100.0%) | 1 (8.3%) |
| 25 to 34 Years | 0 (0.0%) | 0 (0.0%) |
| 35 to 44 Years | 0 (0.0%) | 3 (60.0%) |
| 45 to 54 Years | 27 (100.0%) | 4 (50.0%) |
| 55 to 64 Years | 5 (83.3%) | 14 (100.0%) |
| 65 to 74 Years | 17 (100.0%) | 8 (17.4%) |
| 75 Years and over | 10 (100.0%) | 10 (100.0%) |
| Total | 82 (94.3%) | 63 (53.4%) |
Income Below Poverty Among Married-Couple Families in Ukiah
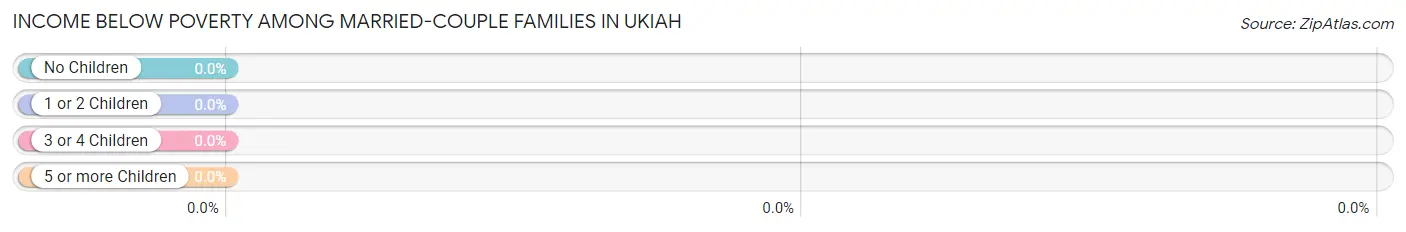
| Children | Above Poverty | Below Poverty |
| No Children | 26 (100.0%) | 0 (0.0%) |
| 1 or 2 Children | 1 (100.0%) | 0 (0.0%) |
| 3 or 4 Children | 0 (0.0%) | 0 (0.0%) |
| 5 or more Children | 0 (0.0%) | 0 (0.0%) |
| Total | 27 (100.0%) | 0 (0.0%) |
Income Below Poverty Among Single-Parent Households in Ukiah
| Children | Single Father | Single Mother |
| No Children | 0 (0.0%) | 0 (0.0%) |
| 1 or 2 Children | 0 (0.0%) | 0 (0.0%) |
| 3 or 4 Children | 0 (0.0%) | 0 (0.0%) |
| 5 or more Children | 0 (0.0%) | 0 (0.0%) |
| Total | 0 (0.0%) | 0 (0.0%) |
Income Below Poverty Among Married-Couple vs Single-Parent Households in Ukiah
| Children | Married-Couple Families | Single-Parent Households |
| No Children | 0 (0.0%) | 0 (0.0%) |
| 1 or 2 Children | 0 (0.0%) | 0 (0.0%) |
| 3 or 4 Children | 0 (0.0%) | 0 (0.0%) |
| 5 or more Children | 0 (0.0%) | 0 (0.0%) |
| Total | 0 (0.0%) | 0 (0.0%) |
Race in Ukiah
The most populous races in Ukiah are White / Caucasian (239 | 90.2%), Hispanic or Latino (17 | 6.4%), and Two or more Races (14 | 5.3%).
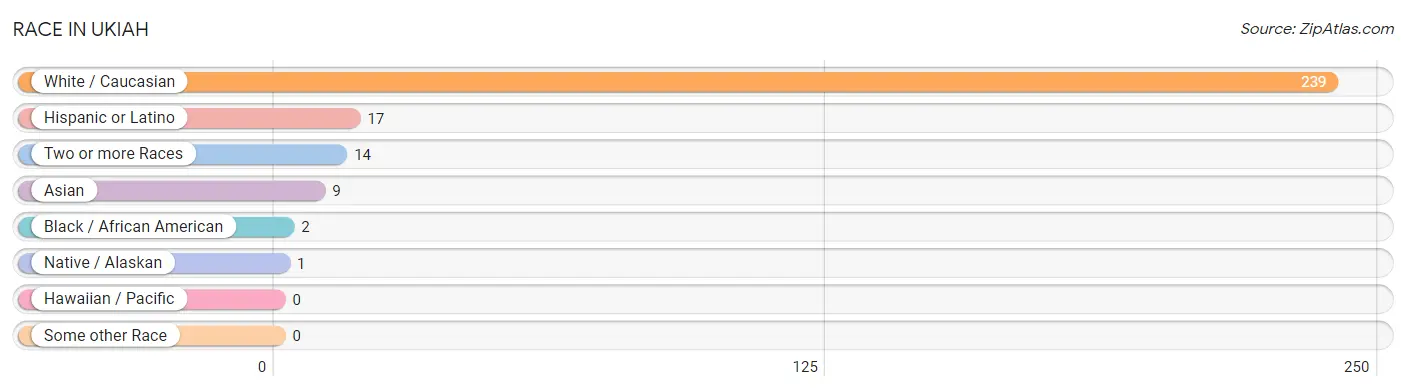
| Race | # Population | % Population |
| Asian | 9 | 3.4% |
| Black / African American | 2 | 0.7% |
| Hawaiian / Pacific | 0 | 0.0% |
| Hispanic or Latino | 17 | 6.4% |
| Native / Alaskan | 1 | 0.4% |
| White / Caucasian | 239 | 90.2% |
| Two or more Races | 14 | 5.3% |
| Some other Race | 0 | 0.0% |
| Total | 265 | 100.0% |
Ancestry in Ukiah
The most populous ancestries reported in Ukiah are German (108 | 40.7%), Scottish (53 | 20.0%), English (45 | 17.0%), Irish (41 | 15.5%), and European (16 | 6.0%), together accounting for 99.2% of all Ukiah residents.
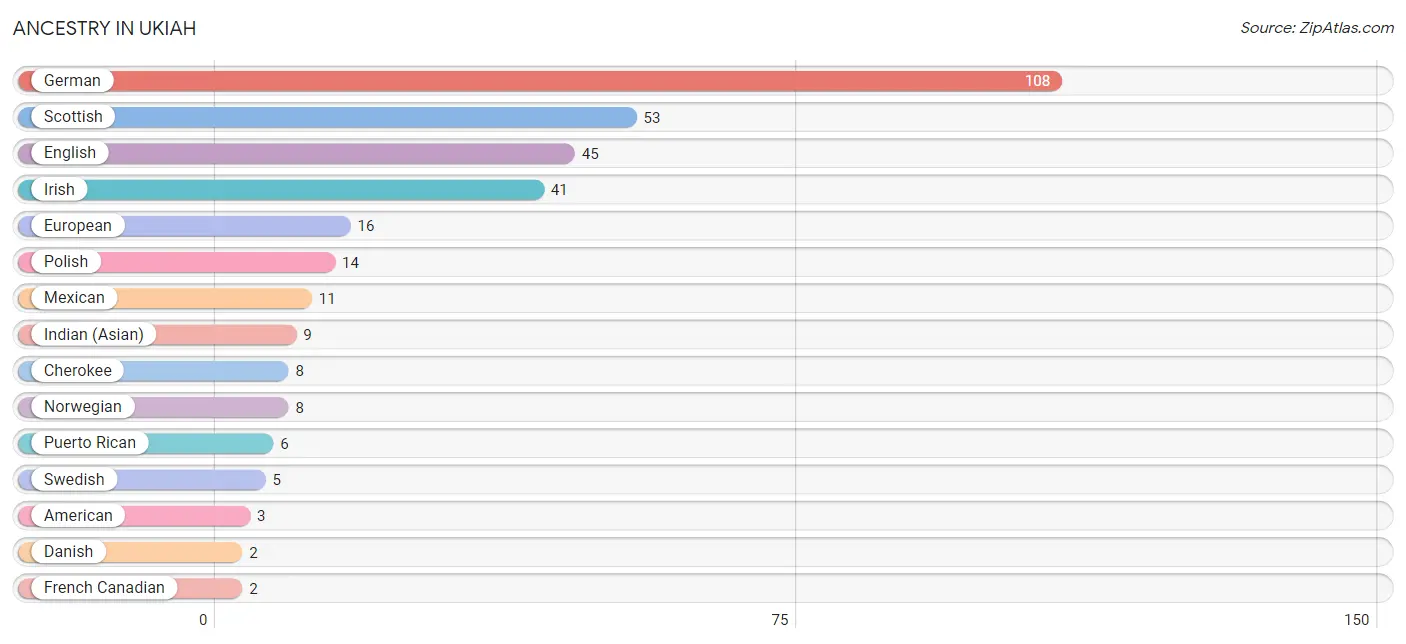
| Ancestry | # Population | % Population |
| American | 3 | 1.1% |
| Cherokee | 8 | 3.0% |
| Danish | 2 | 0.7% |
| English | 45 | 17.0% |
| European | 16 | 6.0% |
| French Canadian | 2 | 0.7% |
| German | 108 | 40.7% |
| Indian (Asian) | 9 | 3.4% |
| Irish | 41 | 15.5% |
| Mexican | 11 | 4.2% |
| Norwegian | 8 | 3.0% |
| Polish | 14 | 5.3% |
| Puerto Rican | 6 | 2.3% |
| Scottish | 53 | 20.0% |
| Swedish | 5 | 1.9% |
| Welsh | 1 | 0.4% | View All 16 Rows |
Immigrants in Ukiah
The most numerous immigrant groups reported in Ukiah came from Asia (9 | 3.4%), China (9 | 3.4%), Eastern Asia (9 | 3.4%), Central America (6 | 2.3%), and Latin America (6 | 2.3%), together accounting for 14.7% of all Ukiah residents.
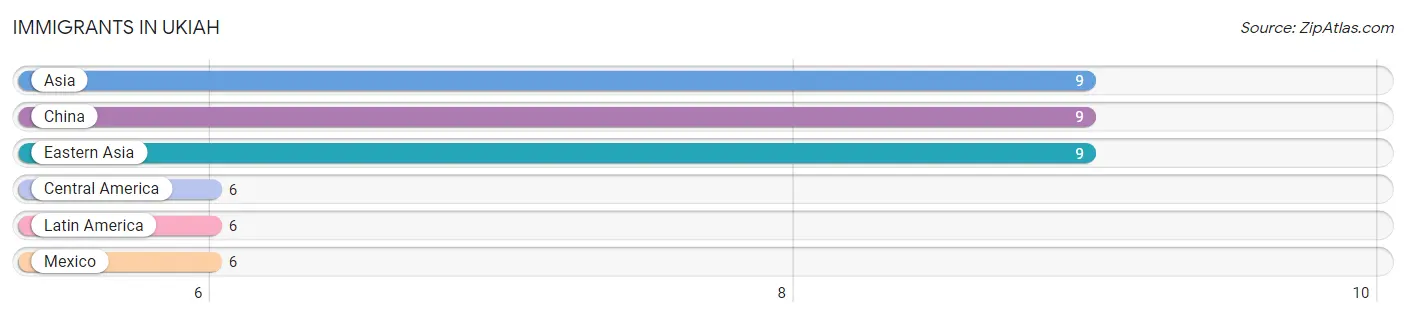
| Immigration Origin | # Population | % Population |
| Asia | 9 | 3.4% |
| Central America | 6 | 2.3% |
| China | 9 | 3.4% |
| Eastern Asia | 9 | 3.4% |
| Latin America | 6 | 2.3% |
| Mexico | 6 | 2.3% | View All 6 Rows |
Sex and Age in Ukiah
Sex and Age in Ukiah
The most populous age groups in Ukiah are 20 to 24 Years (29 | 23.0%) for men and 15 to 19 Years (43 | 30.9%) for women.
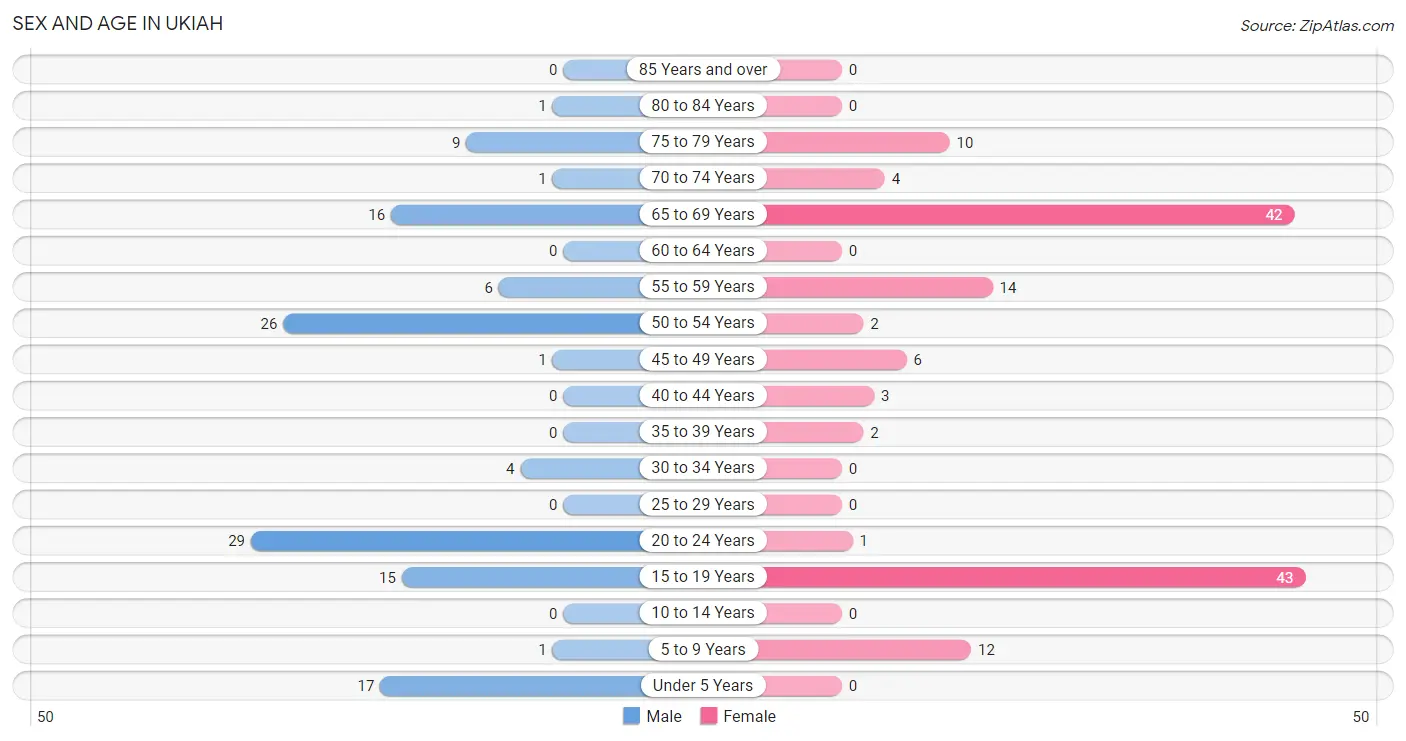
| Age Bracket | Male | Female |
| Under 5 Years | 17 (13.5%) | 0 (0.0%) |
| 5 to 9 Years | 1 (0.8%) | 12 (8.6%) |
| 10 to 14 Years | 0 (0.0%) | 0 (0.0%) |
| 15 to 19 Years | 15 (11.9%) | 43 (30.9%) |
| 20 to 24 Years | 29 (23.0%) | 1 (0.7%) |
| 25 to 29 Years | 0 (0.0%) | 0 (0.0%) |
| 30 to 34 Years | 4 (3.2%) | 0 (0.0%) |
| 35 to 39 Years | 0 (0.0%) | 2 (1.4%) |
| 40 to 44 Years | 0 (0.0%) | 3 (2.2%) |
| 45 to 49 Years | 1 (0.8%) | 6 (4.3%) |
| 50 to 54 Years | 26 (20.6%) | 2 (1.4%) |
| 55 to 59 Years | 6 (4.8%) | 14 (10.1%) |
| 60 to 64 Years | 0 (0.0%) | 0 (0.0%) |
| 65 to 69 Years | 16 (12.7%) | 42 (30.2%) |
| 70 to 74 Years | 1 (0.8%) | 4 (2.9%) |
| 75 to 79 Years | 9 (7.1%) | 10 (7.2%) |
| 80 to 84 Years | 1 (0.8%) | 0 (0.0%) |
| 85 Years and over | 0 (0.0%) | 0 (0.0%) |
| Total | 126 (100.0%) | 139 (100.0%) |
Families and Households in Ukiah
Median Family Size in Ukiah
The median family size in Ukiah is 2.58 persons per family, with single male/father families (19 | 39.6%) accounting for the largest median family size of 3.47 persons per family. On the other hand, married-couple families (27 | 56.2%) represent the smallest median family size with 2.00 persons per family.
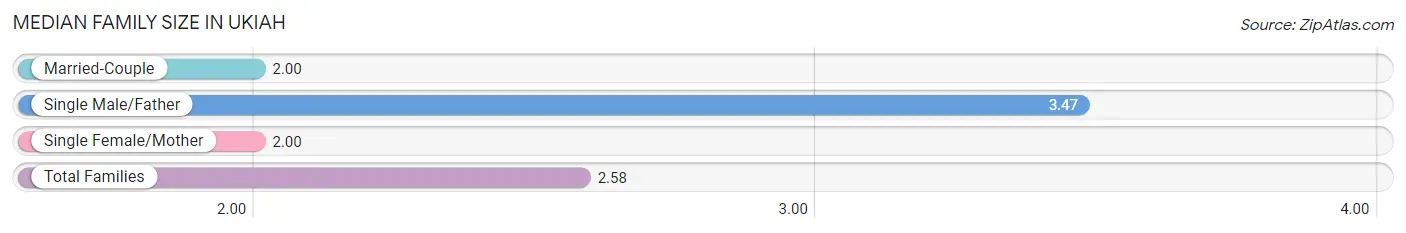
| Family Type | # Families | Family Size |
| Married-Couple | 27 (56.2%) | 2.00 |
| Single Male/Father | 19 (39.6%) | 3.47 |
| Single Female/Mother | 2 (4.2%) | 2.00 |
| Total Families | 48 (100.0%) | 2.58 |
Median Household Size in Ukiah
The median household size in Ukiah is 1.77 persons per household, with single male/father households (19 | 17.8%) accounting for the largest median household size of 3.47 persons per household. non-family households (59 | 55.1%) represent the smallest median household size with 1.10 persons per household.
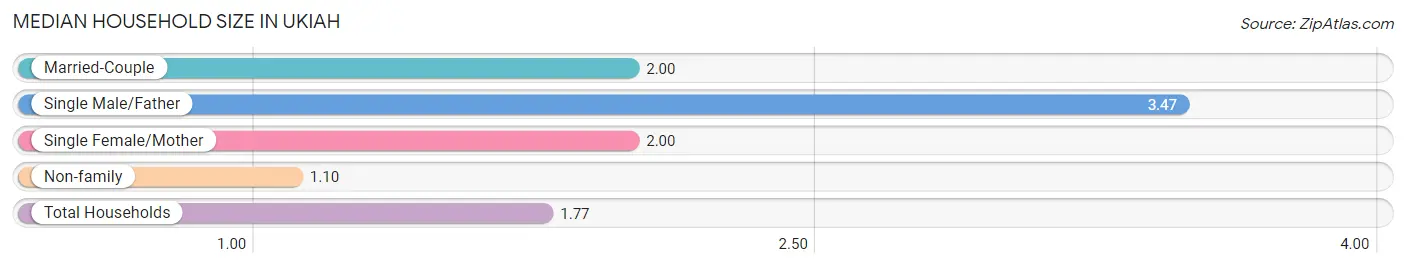
| Household Type | # Households | Household Size |
| Married-Couple | 27 (25.2%) | 2.00 |
| Single Male/Father | 19 (17.8%) | 3.47 |
| Single Female/Mother | 2 (1.9%) | 2.00 |
| Non-family | 59 (55.1%) | 1.10 |
| Total Households | 107 (100.0%) | 1.77 |
Household Size by Marriage Status in Ukiah
Out of a total of 107 households in Ukiah, 48 (44.9%) are family households, while 59 (55.1%) are nonfamily households. The most numerous type of family households are 2-person households, comprising 34, and the most common type of nonfamily households are 1-person households, comprising 52.
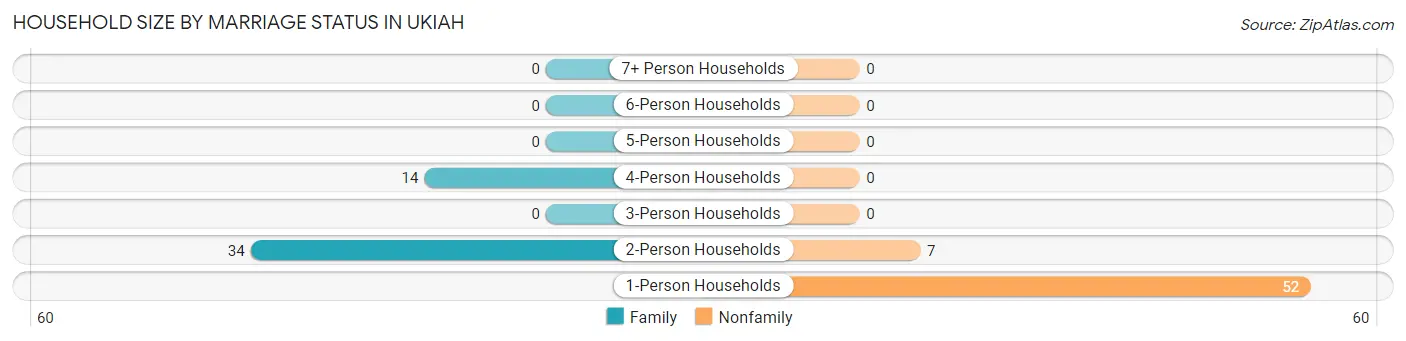
| Household Size | Family Households | Nonfamily Households |
| 1-Person Households | - | 52 (48.6%) |
| 2-Person Households | 34 (31.8%) | 7 (6.5%) |
| 3-Person Households | 0 (0.0%) | 0 (0.0%) |
| 4-Person Households | 14 (13.1%) | 0 (0.0%) |
| 5-Person Households | 0 (0.0%) | 0 (0.0%) |
| 6-Person Households | 0 (0.0%) | 0 (0.0%) |
| 7+ Person Households | 0 (0.0%) | 0 (0.0%) |
| Total | 48 (44.9%) | 59 (55.1%) |
Female Fertility in Ukiah
Fertility by Age in Ukiah
| Age Bracket | Women with Births | Births / 1,000 Women |
| 15 to 19 years | 0 (0.0%) | 0.0 |
| 20 to 34 years | 0 (0.0%) | 0.0 |
| 35 to 50 years | 0 (0.0%) | 0.0 |
| Total | 0 (0.0%) | 0.0 |
Fertility by Age by Marriage Status in Ukiah
| Age Bracket | Married | Unmarried |
| 15 to 19 years | 0 (0.0%) | 0 (0.0%) |
| 20 to 34 years | 0 (0.0%) | 0 (0.0%) |
| 35 to 50 years | 0 (0.0%) | 0 (0.0%) |
| Total | 0 (0.0%) | 0 (0.0%) |
Fertility by Education in Ukiah
| Educational Attainment | Women with Births | Births / 1,000 Women |
| Less than High School | 0 (0.0%) | 0.0 |
| High School Diploma | 0 (0.0%) | 0.0 |
| College or Associate's Degree | 0 (0.0%) | 0.0 |
| Bachelor's Degree | 0 (0.0%) | 0.0 |
| Graduate Degree | 0 (0.0%) | 0.0 |
| Total | 0 (0.0%) | 0.0 |
Fertility by Education by Marriage Status in Ukiah
| Educational Attainment | Married | Unmarried |
| Less than High School | 0 (0.0%) | 0 (0.0%) |
| High School Diploma | 0 (0.0%) | 0 (0.0%) |
| College or Associate's Degree | 0 (0.0%) | 0 (0.0%) |
| Bachelor's Degree | 0 (0.0%) | 0 (0.0%) |
| Graduate Degree | 0 (0.0%) | 0 (0.0%) |
| Total | 0 (0.0%) | 0 (0.0%) |
Employment Characteristics in Ukiah
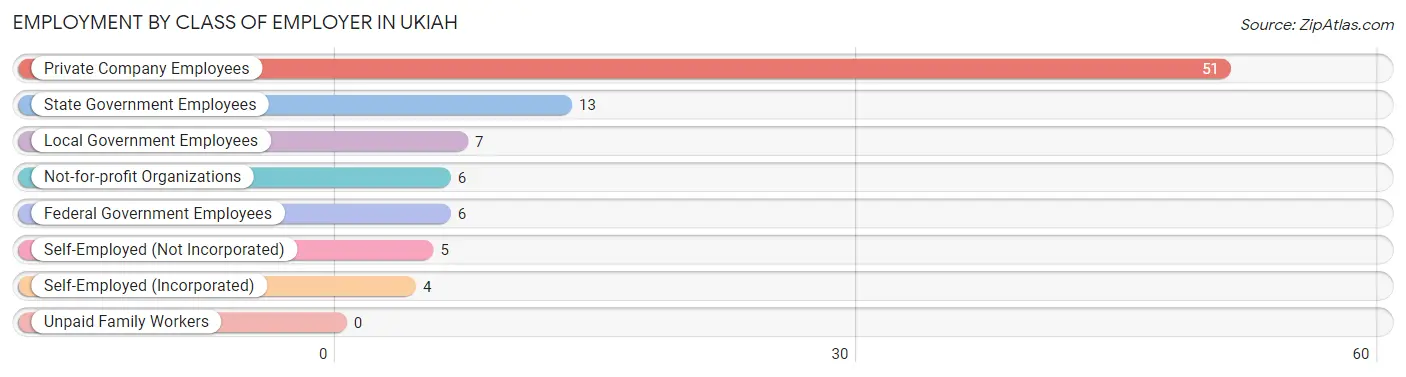
Employment by Class of Employer in Ukiah
Among the 92 employed individuals in Ukiah, private company employees (51 | 55.4%), state government employees (13 | 14.1%), and local government employees (7 | 7.6%) make up the most common classes of employment.
| Employer Class | # Employees | % Employees |
| Private Company Employees | 51 | 55.4% |
| Self-Employed (Incorporated) | 4 | 4.3% |
| Self-Employed (Not Incorporated) | 5 | 5.4% |
| Not-for-profit Organizations | 6 | 6.5% |
| Local Government Employees | 7 | 7.6% |
| State Government Employees | 13 | 14.1% |
| Federal Government Employees | 6 | 6.5% |
| Unpaid Family Workers | 0 | 0.0% |
| Total | 92 | 100.0% |
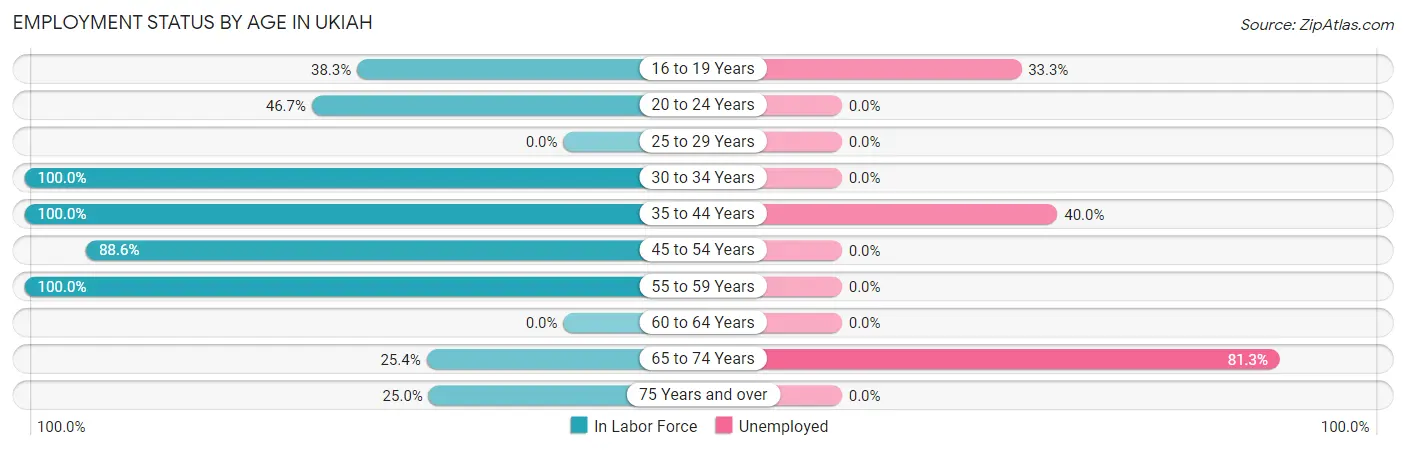
Employment Status by Age in Ukiah
According to the labor force statistics for Ukiah, out of the total population over 16 years of age (224), 50.4% or 113 individuals are in the labor force, with 18.6% or 21 of them unemployed. The age group with the highest labor force participation rate is 30 to 34 years, with 100.0% or 4 individuals in the labor force. Within the labor force, the 65 to 74 years age range has the highest percentage of unemployed individuals, with 81.3% or 13 of them being unemployed.
| Age Bracket | In Labor Force | Unemployed |
| 16 to 19 Years | 18 (38.3%) | 6 (33.3%) |
| 20 to 24 Years | 14 (46.7%) | 0 (0.0%) |
| 25 to 29 Years | 0 (0.0%) | 0 (0.0%) |
| 30 to 34 Years | 4 (100.0%) | 0 (0.0%) |
| 35 to 44 Years | 5 (100.0%) | 2 (40.0%) |
| 45 to 54 Years | 31 (88.6%) | 0 (0.0%) |
| 55 to 59 Years | 20 (100.0%) | 0 (0.0%) |
| 60 to 64 Years | 0 (0.0%) | 0 (0.0%) |
| 65 to 74 Years | 16 (25.4%) | 13 (81.3%) |
| 75 Years and over | 5 (25.0%) | 0 (0.0%) |
| Total | 113 (50.4%) | 21 (18.6%) |
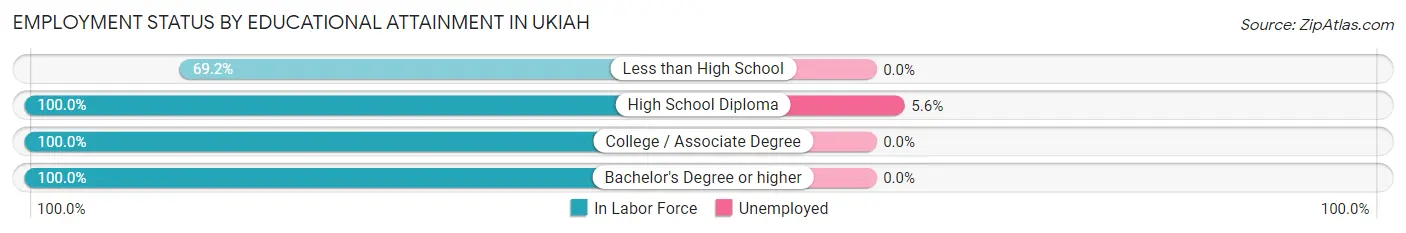
Employment Status by Educational Attainment in Ukiah
According to labor force statistics for Ukiah, 93.8% of individuals (60) out of the total population between 25 and 64 years of age (64) are in the labor force, with 3.3% or 2 of them being unemployed. The group with the highest labor force participation rate are those with the educational attainment of high school diploma, with 100.0% or 36 individuals in the labor force. Within the labor force, individuals with high school diploma education have the highest percentage of unemployment, with 5.6% or 2 of them being unemployed.
| Educational Attainment | In Labor Force | Unemployed |
| Less than High School | 9 (69.2%) | 0 (0.0%) |
| High School Diploma | 36 (100.0%) | 2 (5.6%) |
| College / Associate Degree | 10 (100.0%) | 0 (0.0%) |
| Bachelor's Degree or higher | 5 (100.0%) | 0 (0.0%) |
| Total | 60 (93.8%) | 2 (3.3%) |
Employment Occupations by Sex in Ukiah
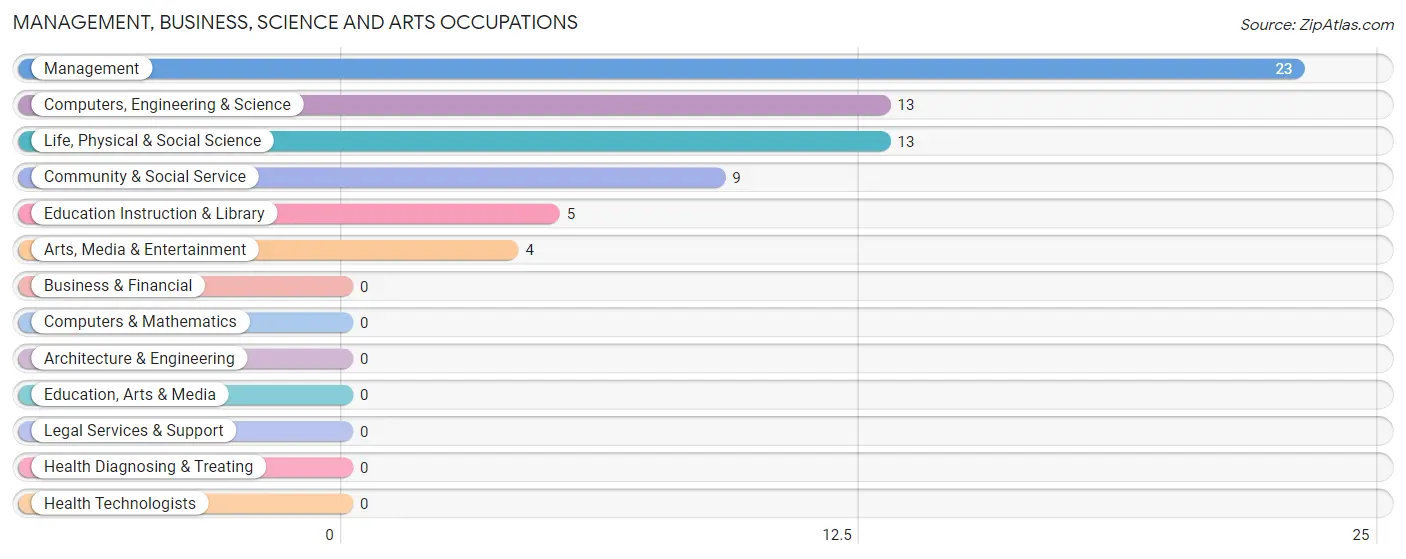
Management, Business, Science and Arts Occupations
The most common Management, Business, Science and Arts occupations in Ukiah are Management (23 | 25.0%), Computers, Engineering & Science (13 | 14.1%), Life, Physical & Social Science (13 | 14.1%), Community & Social Service (9 | 9.8%), and Education Instruction & Library (5 | 5.4%).
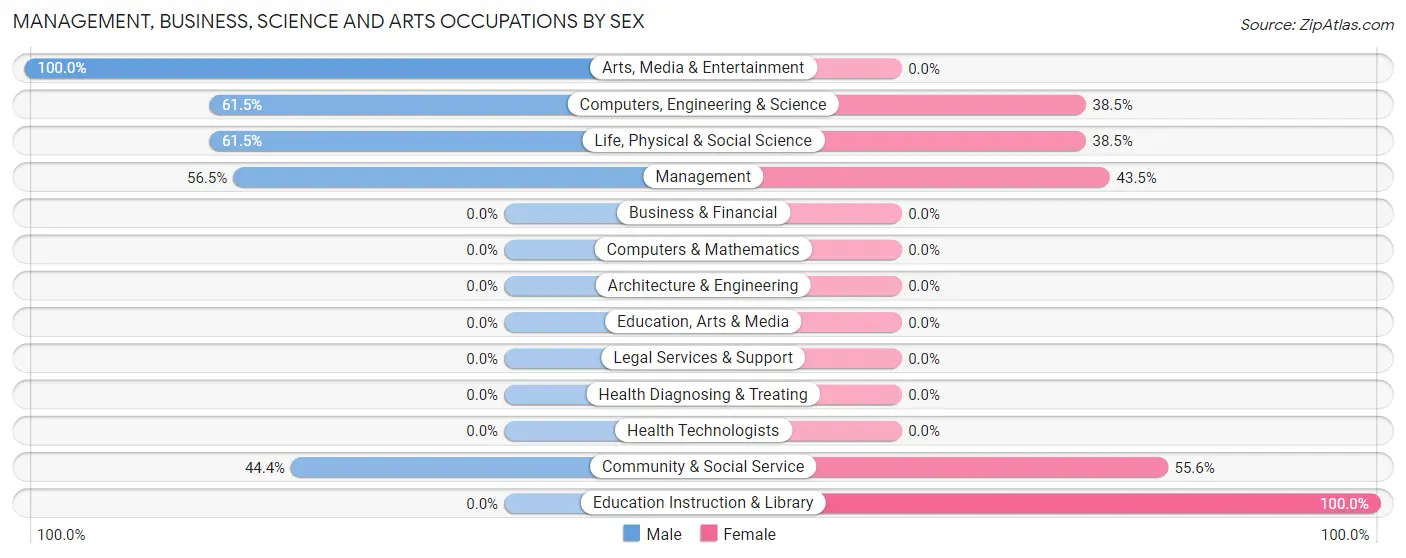
Management, Business, Science and Arts Occupations by Sex
Within the Management, Business, Science and Arts occupations in Ukiah, the most male-oriented occupations are Arts, Media & Entertainment (100.0%), Computers, Engineering & Science (61.5%), and Life, Physical & Social Science (61.5%), while the most female-oriented occupations are Education Instruction & Library (100.0%), Community & Social Service (55.6%), and Management (43.5%).
| Occupation | Male | Female |
| Management | 13 (56.5%) | 10 (43.5%) |
| Business & Financial | 0 (0.0%) | 0 (0.0%) |
| Computers, Engineering & Science | 8 (61.5%) | 5 (38.5%) |
| Computers & Mathematics | 0 (0.0%) | 0 (0.0%) |
| Architecture & Engineering | 0 (0.0%) | 0 (0.0%) |
| Life, Physical & Social Science | 8 (61.5%) | 5 (38.5%) |
| Community & Social Service | 4 (44.4%) | 5 (55.6%) |
| Education, Arts & Media | 0 (0.0%) | 0 (0.0%) |
| Legal Services & Support | 0 (0.0%) | 0 (0.0%) |
| Education Instruction & Library | 0 (0.0%) | 5 (100.0%) |
| Arts, Media & Entertainment | 4 (100.0%) | 0 (0.0%) |
| Health Diagnosing & Treating | 0 (0.0%) | 0 (0.0%) |
| Health Technologists | 0 (0.0%) | 0 (0.0%) |
| Total (Category) | 25 (55.6%) | 20 (44.4%) |
| Total (Overall) | 50 (54.3%) | 42 (45.7%) |
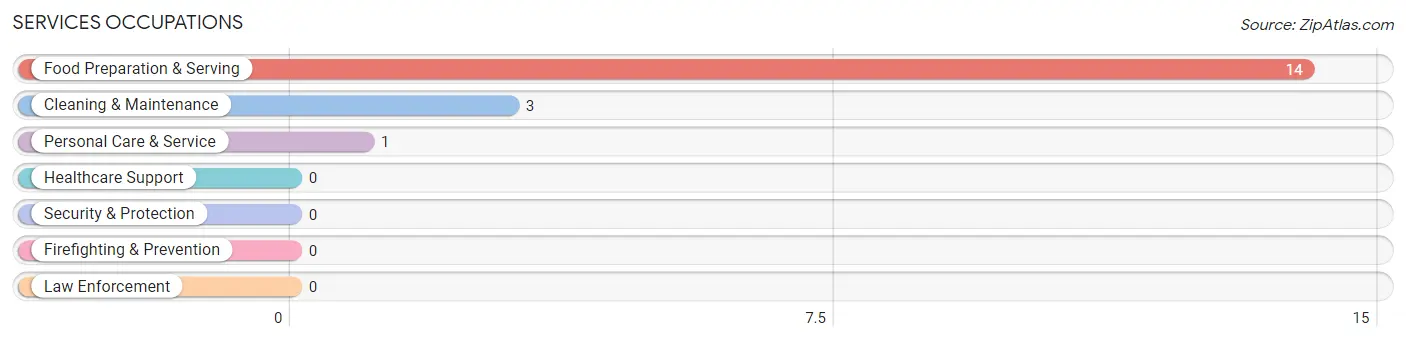
Services Occupations
The most common Services occupations in Ukiah are Food Preparation & Serving (14 | 15.2%), Cleaning & Maintenance (3 | 3.3%), and Personal Care & Service (1 | 1.1%).
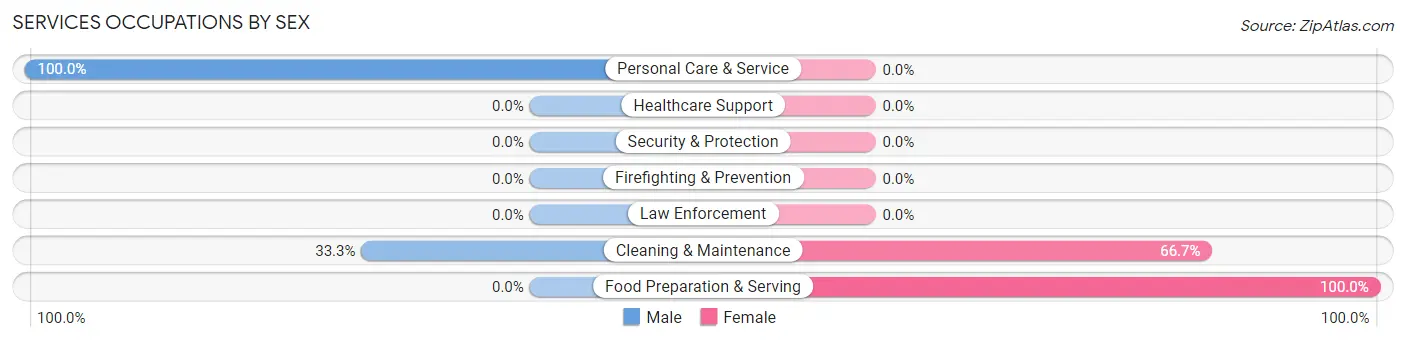
Services Occupations by Sex
Within the Services occupations in Ukiah, the most male-oriented occupations are Personal Care & Service (100.0%), and Cleaning & Maintenance (33.3%), while the most female-oriented occupations are Food Preparation & Serving (100.0%), and Cleaning & Maintenance (66.7%).
| Occupation | Male | Female |
| Healthcare Support | 0 (0.0%) | 0 (0.0%) |
| Security & Protection | 0 (0.0%) | 0 (0.0%) |
| Firefighting & Prevention | 0 (0.0%) | 0 (0.0%) |
| Law Enforcement | 0 (0.0%) | 0 (0.0%) |
| Food Preparation & Serving | 0 (0.0%) | 14 (100.0%) |
| Cleaning & Maintenance | 1 (33.3%) | 2 (66.7%) |
| Personal Care & Service | 1 (100.0%) | 0 (0.0%) |
| Total (Category) | 2 (11.1%) | 16 (88.9%) |
| Total (Overall) | 50 (54.3%) | 42 (45.7%) |
Sales and Office Occupations
The most common Sales and Office occupations in Ukiah are , and Sales & Related (4 | 4.3%).
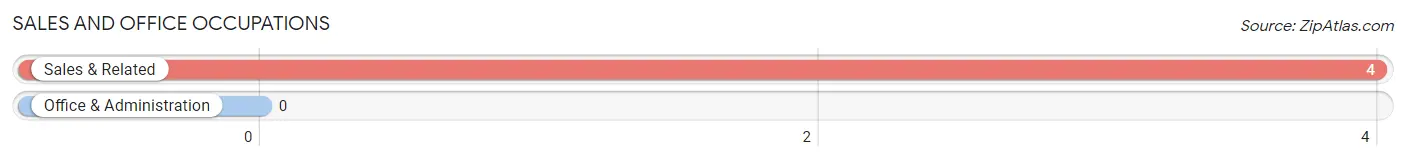
Sales and Office Occupations by Sex
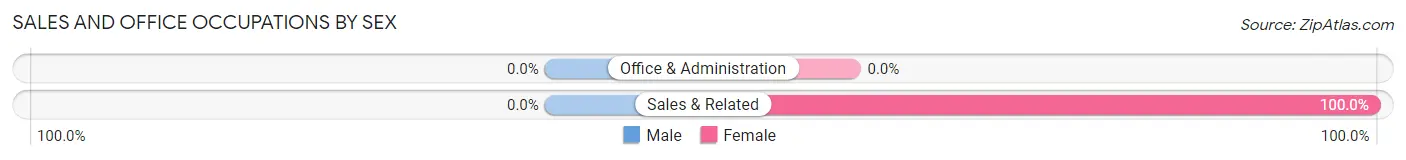
| Occupation | Male | Female |
| Sales & Related | 0 (0.0%) | 4 (100.0%) |
| Office & Administration | 0 (0.0%) | 0 (0.0%) |
| Total (Category) | 0 (0.0%) | 4 (100.0%) |
| Total (Overall) | 50 (54.3%) | 42 (45.7%) |
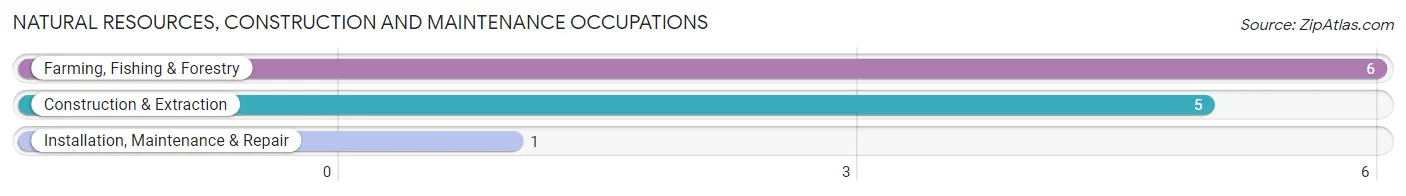
Natural Resources, Construction and Maintenance Occupations
The most common Natural Resources, Construction and Maintenance occupations in Ukiah are Farming, Fishing & Forestry (6 | 6.5%), Construction & Extraction (5 | 5.4%), and Installation, Maintenance & Repair (1 | 1.1%).
Natural Resources, Construction and Maintenance Occupations by Sex
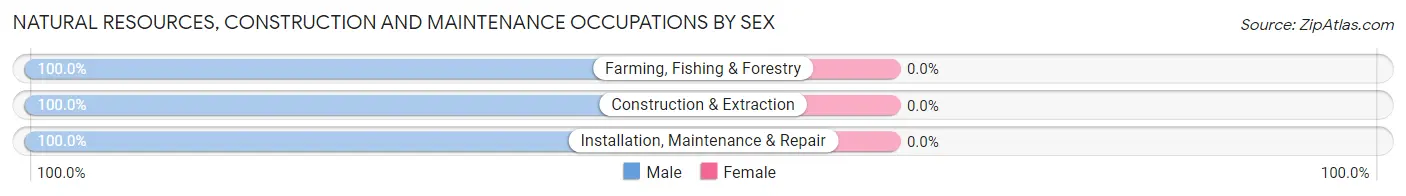
| Occupation | Male | Female |
| Farming, Fishing & Forestry | 6 (100.0%) | 0 (0.0%) |
| Construction & Extraction | 5 (100.0%) | 0 (0.0%) |
| Installation, Maintenance & Repair | 1 (100.0%) | 0 (0.0%) |
| Total (Category) | 12 (100.0%) | 0 (0.0%) |
| Total (Overall) | 50 (54.3%) | 42 (45.7%) |
Production, Transportation and Moving Occupations
The most common Production, Transportation and Moving occupations in Ukiah are Transportation (6 | 6.5%), Production (5 | 5.4%), and Material Moving (2 | 2.2%).
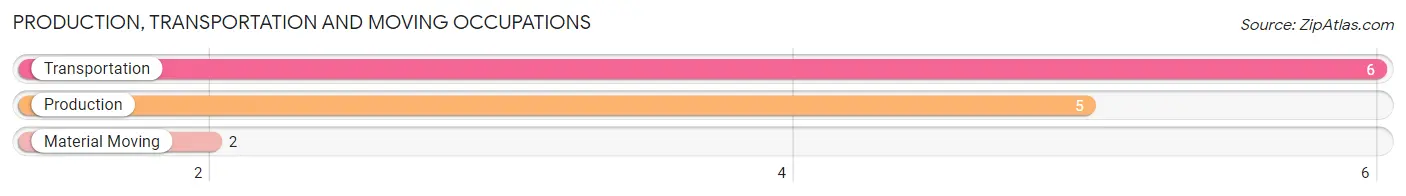
Production, Transportation and Moving Occupations by Sex
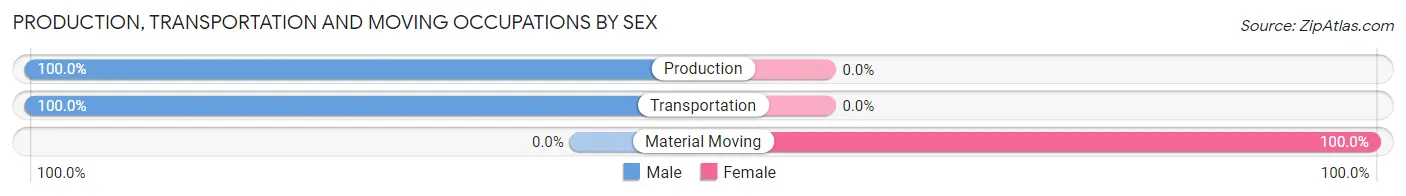
| Occupation | Male | Female |
| Production | 5 (100.0%) | 0 (0.0%) |
| Transportation | 6 (100.0%) | 0 (0.0%) |
| Material Moving | 0 (0.0%) | 2 (100.0%) |
| Total (Category) | 11 (84.6%) | 2 (15.4%) |
| Total (Overall) | 50 (54.3%) | 42 (45.7%) |
Employment Industries by Sex in Ukiah
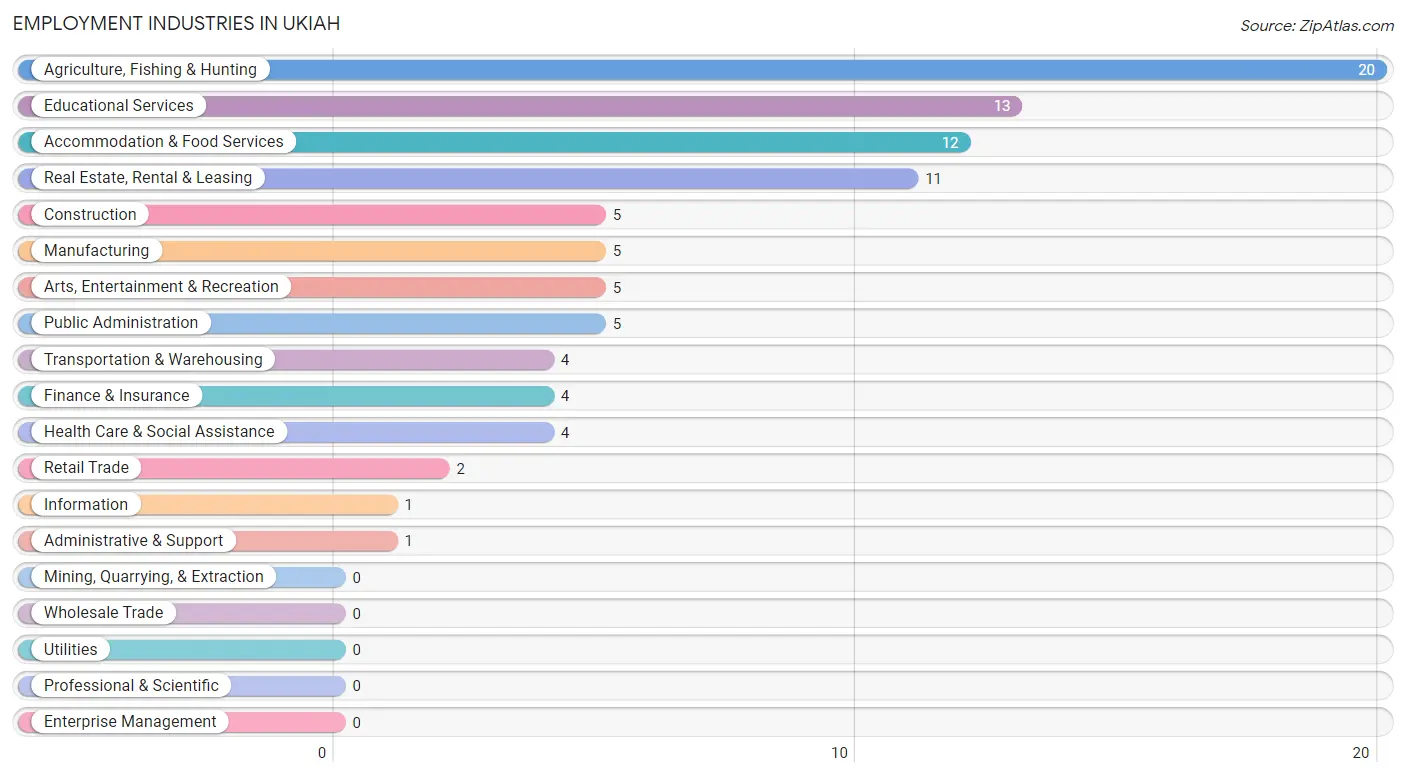
Employment Industries in Ukiah
The major employment industries in Ukiah include Agriculture, Fishing & Hunting (20 | 21.7%), Educational Services (13 | 14.1%), Accommodation & Food Services (12 | 13.0%), Real Estate, Rental & Leasing (11 | 12.0%), and Construction (5 | 5.4%).
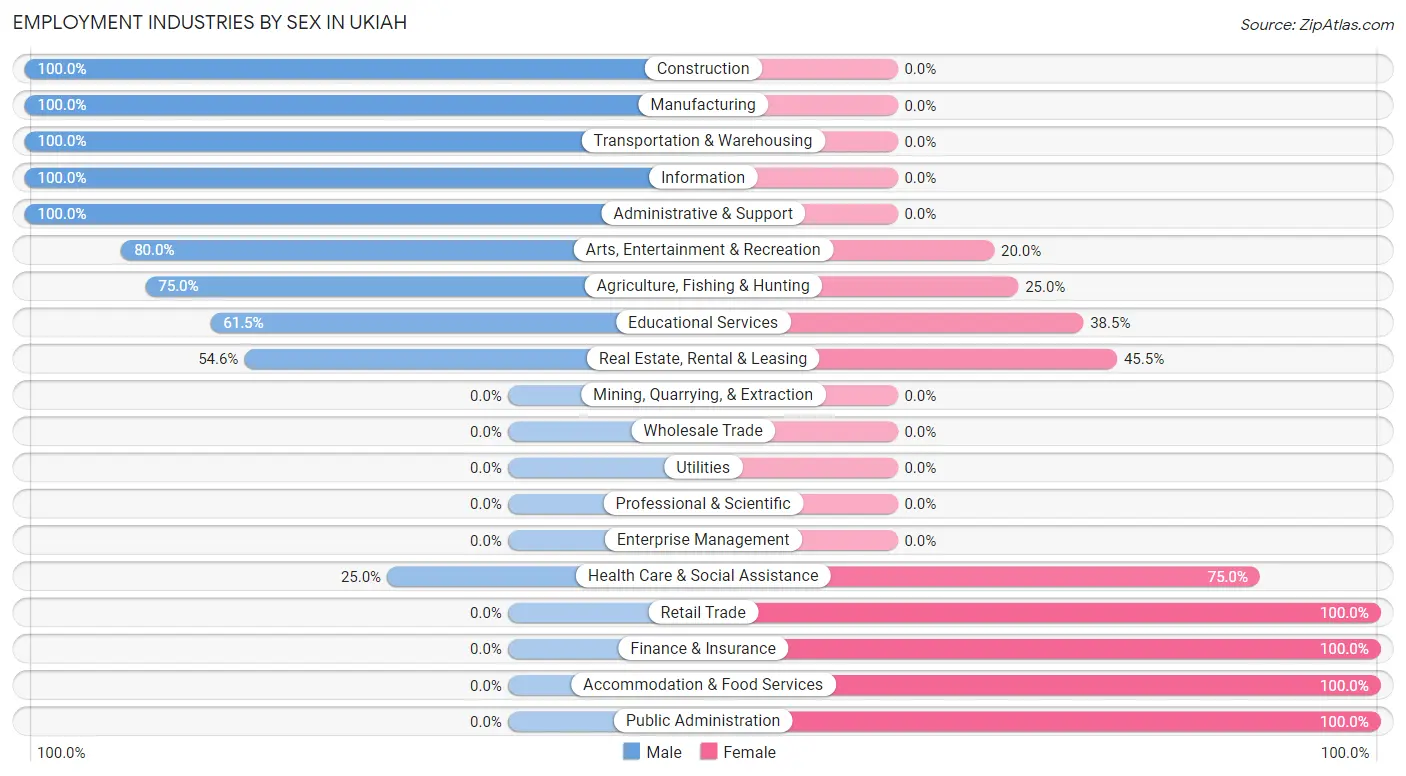
Employment Industries by Sex in Ukiah
The Ukiah industries that see more men than women are Construction (100.0%), Manufacturing (100.0%), and Transportation & Warehousing (100.0%), whereas the industries that tend to have a higher number of women are Retail Trade (100.0%), Finance & Insurance (100.0%), and Accommodation & Food Services (100.0%).
| Industry | Male | Female |
| Agriculture, Fishing & Hunting | 15 (75.0%) | 5 (25.0%) |
| Mining, Quarrying, & Extraction | 0 (0.0%) | 0 (0.0%) |
| Construction | 5 (100.0%) | 0 (0.0%) |
| Manufacturing | 5 (100.0%) | 0 (0.0%) |
| Wholesale Trade | 0 (0.0%) | 0 (0.0%) |
| Retail Trade | 0 (0.0%) | 2 (100.0%) |
| Transportation & Warehousing | 4 (100.0%) | 0 (0.0%) |
| Utilities | 0 (0.0%) | 0 (0.0%) |
| Information | 1 (100.0%) | 0 (0.0%) |
| Finance & Insurance | 0 (0.0%) | 4 (100.0%) |
| Real Estate, Rental & Leasing | 6 (54.5%) | 5 (45.5%) |
| Professional & Scientific | 0 (0.0%) | 0 (0.0%) |
| Enterprise Management | 0 (0.0%) | 0 (0.0%) |
| Administrative & Support | 1 (100.0%) | 0 (0.0%) |
| Educational Services | 8 (61.5%) | 5 (38.5%) |
| Health Care & Social Assistance | 1 (25.0%) | 3 (75.0%) |
| Arts, Entertainment & Recreation | 4 (80.0%) | 1 (20.0%) |
| Accommodation & Food Services | 0 (0.0%) | 12 (100.0%) |
| Public Administration | 0 (0.0%) | 5 (100.0%) |
| Total | 50 (54.3%) | 42 (45.7%) |
Education in Ukiah
School Enrollment in Ukiah
The most common levels of schooling among the 89 students in Ukiah are college / undergraduate (60 | 67.4%), high school (16 | 18.0%), and elementary school (12 | 13.5%).
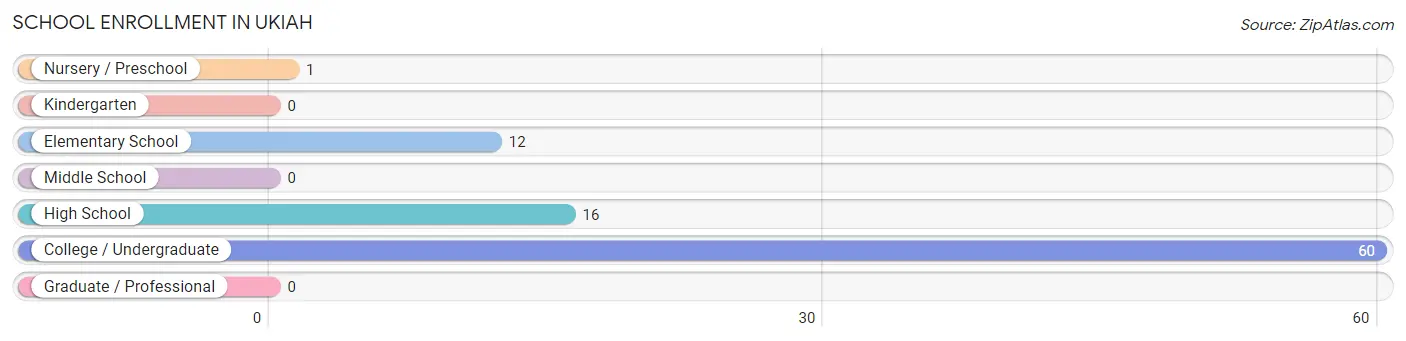
| School Level | # Students | % Students |
| Nursery / Preschool | 1 | 1.1% |
| Kindergarten | 0 | 0.0% |
| Elementary School | 12 | 13.5% |
| Middle School | 0 | 0.0% |
| High School | 16 | 18.0% |
| College / Undergraduate | 60 | 67.4% |
| Graduate / Professional | 0 | 0.0% |
| Total | 89 | 100.0% |
School Enrollment by Age by Funding Source in Ukiah
Out of a total of 89 students who are enrolled in schools in Ukiah, 21 (23.6%) attend a private institution, while the remaining 68 (76.4%) are enrolled in public schools. The age group of 18 to 19 year olds has the highest likelihood of being enrolled in private schools, with 21 (51.2% in the age bracket) enrolled. Conversely, the age group of 5 to 9 year old has the lowest likelihood of being enrolled in a private school, with 13 (100.0% in the age bracket) attending a public institution.
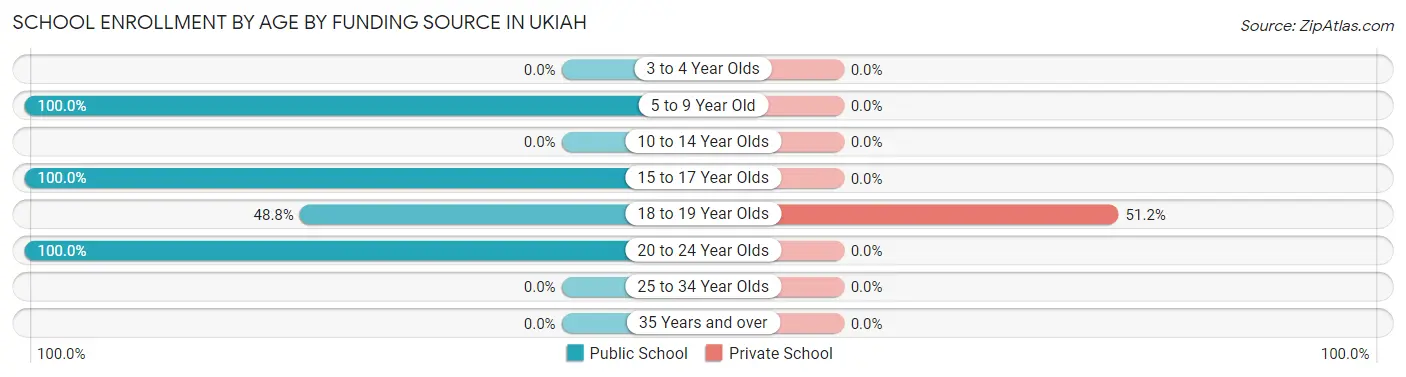
| Age Bracket | Public School | Private School |
| 3 to 4 Year Olds | 0 (0.0%) | 0 (0.0%) |
| 5 to 9 Year Old | 13 (100.0%) | 0 (0.0%) |
| 10 to 14 Year Olds | 0 (0.0%) | 0 (0.0%) |
| 15 to 17 Year Olds | 11 (100.0%) | 0 (0.0%) |
| 18 to 19 Year Olds | 20 (48.8%) | 21 (51.2%) |
| 20 to 24 Year Olds | 24 (100.0%) | 0 (0.0%) |
| 25 to 34 Year Olds | 0 (0.0%) | 0 (0.0%) |
| 35 Years and over | 0 (0.0%) | 0 (0.0%) |
| Total | 68 (76.4%) | 21 (23.6%) |
Educational Attainment by Field of Study in Ukiah
Business (7 | 43.8%), bio, nature & agricultural (5 | 31.2%), and education (4 | 25.0%) are the most common fields of study among 16 individuals in Ukiah who have obtained a bachelor's degree or higher.
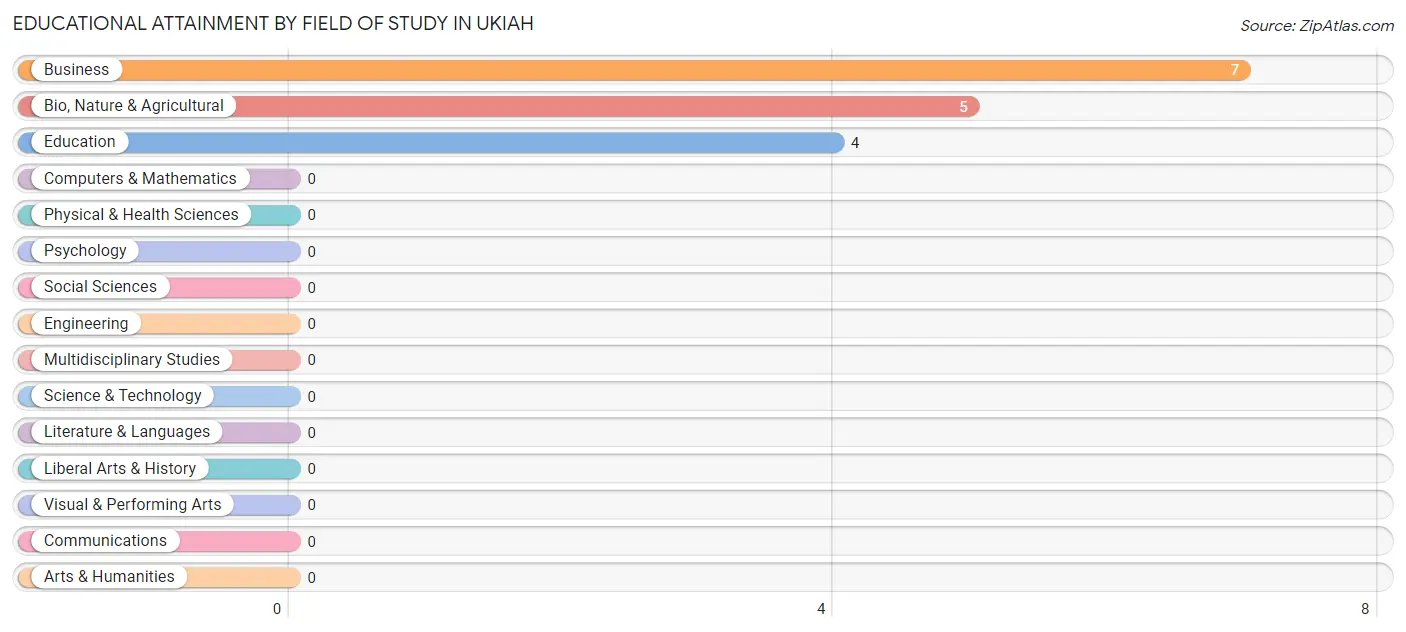
| Field of Study | # Graduates | % Graduates |
| Computers & Mathematics | 0 | 0.0% |
| Bio, Nature & Agricultural | 5 | 31.2% |
| Physical & Health Sciences | 0 | 0.0% |
| Psychology | 0 | 0.0% |
| Social Sciences | 0 | 0.0% |
| Engineering | 0 | 0.0% |
| Multidisciplinary Studies | 0 | 0.0% |
| Science & Technology | 0 | 0.0% |
| Business | 7 | 43.8% |
| Education | 4 | 25.0% |
| Literature & Languages | 0 | 0.0% |
| Liberal Arts & History | 0 | 0.0% |
| Visual & Performing Arts | 0 | 0.0% |
| Communications | 0 | 0.0% |
| Arts & Humanities | 0 | 0.0% |
| Total | 16 | 100.0% |
Transportation & Commute in Ukiah
Vehicle Availability by Sex in Ukiah
The most prevalent vehicle ownership categories in Ukiah are males with 1 vehicle (22, accounting for 52.4%) and females with 1 vehicle (5, making up 88.0%).
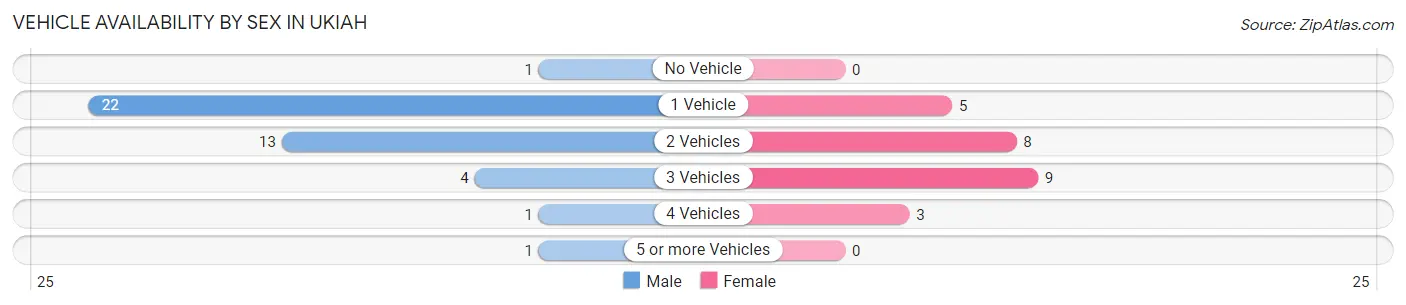
| Vehicles Available | Male | Female |
| No Vehicle | 1 (2.4%) | 0 (0.0%) |
| 1 Vehicle | 22 (52.4%) | 5 (20.0%) |
| 2 Vehicles | 13 (30.9%) | 8 (32.0%) |
| 3 Vehicles | 4 (9.5%) | 9 (36.0%) |
| 4 Vehicles | 1 (2.4%) | 3 (12.0%) |
| 5 or more Vehicles | 1 (2.4%) | 0 (0.0%) |
| Total | 42 (100.0%) | 25 (100.0%) |
Commute Time in Ukiah
The most frequently occuring commute durations in Ukiah are 5 to 9 minutes (18 commuters, 19.6%), 45 to 59 minutes (18 commuters, 19.6%), and 60 to 89 minutes (18 commuters, 19.6%).
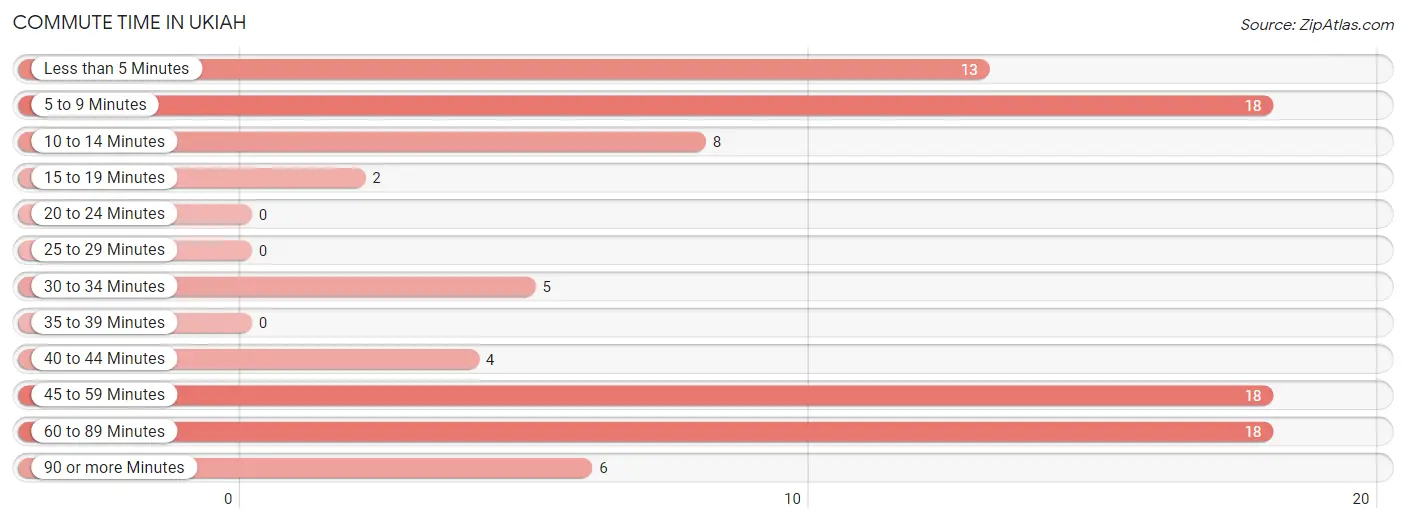
| Commute Time | # Commuters | % Commuters |
| Less than 5 Minutes | 13 | 14.1% |
| 5 to 9 Minutes | 18 | 19.6% |
| 10 to 14 Minutes | 8 | 8.7% |
| 15 to 19 Minutes | 2 | 2.2% |
| 20 to 24 Minutes | 0 | 0.0% |
| 25 to 29 Minutes | 0 | 0.0% |
| 30 to 34 Minutes | 5 | 5.4% |
| 35 to 39 Minutes | 0 | 0.0% |
| 40 to 44 Minutes | 4 | 4.3% |
| 45 to 59 Minutes | 18 | 19.6% |
| 60 to 89 Minutes | 18 | 19.6% |
| 90 or more Minutes | 6 | 6.5% |
Commute Time by Sex in Ukiah
The most common commute times in Ukiah are 5 to 9 minutes (13 commuters, 26.0%) for males and less than 5 minutes (13 commuters, 30.9%) for females.
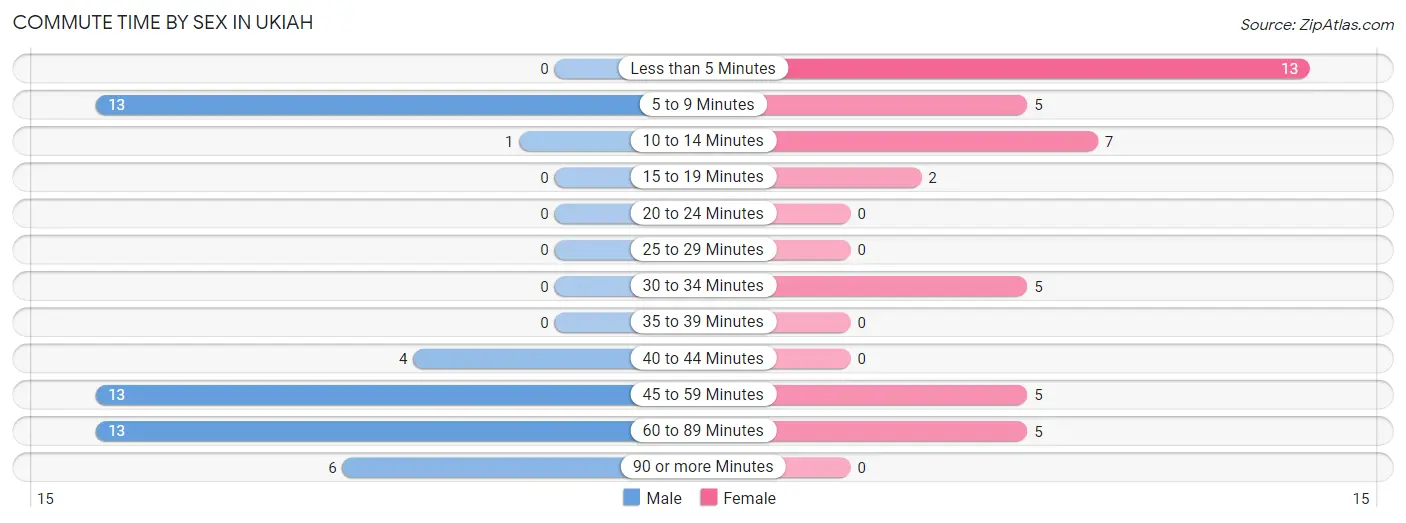
| Commute Time | Male | Female |
| Less than 5 Minutes | 0 (0.0%) | 13 (30.9%) |
| 5 to 9 Minutes | 13 (26.0%) | 5 (11.9%) |
| 10 to 14 Minutes | 1 (2.0%) | 7 (16.7%) |
| 15 to 19 Minutes | 0 (0.0%) | 2 (4.8%) |
| 20 to 24 Minutes | 0 (0.0%) | 0 (0.0%) |
| 25 to 29 Minutes | 0 (0.0%) | 0 (0.0%) |
| 30 to 34 Minutes | 0 (0.0%) | 5 (11.9%) |
| 35 to 39 Minutes | 0 (0.0%) | 0 (0.0%) |
| 40 to 44 Minutes | 4 (8.0%) | 0 (0.0%) |
| 45 to 59 Minutes | 13 (26.0%) | 5 (11.9%) |
| 60 to 89 Minutes | 13 (26.0%) | 5 (11.9%) |
| 90 or more Minutes | 6 (12.0%) | 0 (0.0%) |
Time of Departure to Work by Sex in Ukiah
The most frequent times of departure to work in Ukiah are 5:30 AM to 5:59 AM (12, 24.0%) for males and 4:00 PM to 11:59 PM (15, 35.7%) for females.
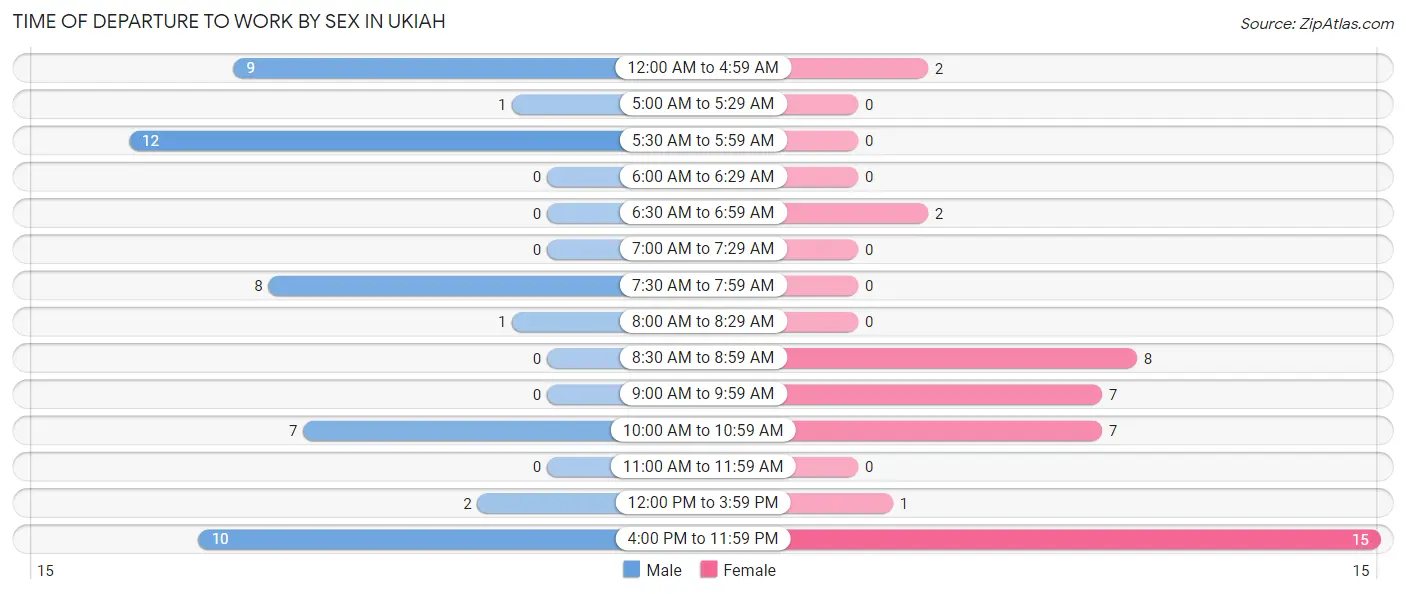
| Time of Departure | Male | Female |
| 12:00 AM to 4:59 AM | 9 (18.0%) | 2 (4.8%) |
| 5:00 AM to 5:29 AM | 1 (2.0%) | 0 (0.0%) |
| 5:30 AM to 5:59 AM | 12 (24.0%) | 0 (0.0%) |
| 6:00 AM to 6:29 AM | 0 (0.0%) | 0 (0.0%) |
| 6:30 AM to 6:59 AM | 0 (0.0%) | 2 (4.8%) |
| 7:00 AM to 7:29 AM | 0 (0.0%) | 0 (0.0%) |
| 7:30 AM to 7:59 AM | 8 (16.0%) | 0 (0.0%) |
| 8:00 AM to 8:29 AM | 1 (2.0%) | 0 (0.0%) |
| 8:30 AM to 8:59 AM | 0 (0.0%) | 8 (19.1%) |
| 9:00 AM to 9:59 AM | 0 (0.0%) | 7 (16.7%) |
| 10:00 AM to 10:59 AM | 7 (14.0%) | 7 (16.7%) |
| 11:00 AM to 11:59 AM | 0 (0.0%) | 0 (0.0%) |
| 12:00 PM to 3:59 PM | 2 (4.0%) | 1 (2.4%) |
| 4:00 PM to 11:59 PM | 10 (20.0%) | 15 (35.7%) |
| Total | 50 (100.0%) | 42 (100.0%) |
Housing Occupancy in Ukiah
Occupancy by Ownership in Ukiah
Of the total 107 dwellings in Ukiah, owner-occupied units account for 84 (78.5%), while renter-occupied units make up 23 (21.5%).
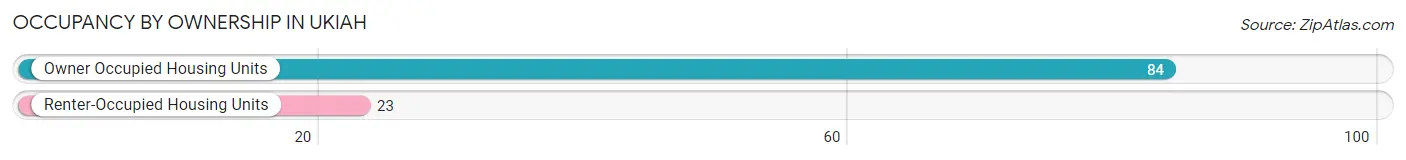
| Occupancy | # Housing Units | % Housing Units |
| Owner Occupied Housing Units | 84 | 78.5% |
| Renter-Occupied Housing Units | 23 | 21.5% |
| Total Occupied Housing Units | 107 | 100.0% |
Occupancy by Household Size in Ukiah
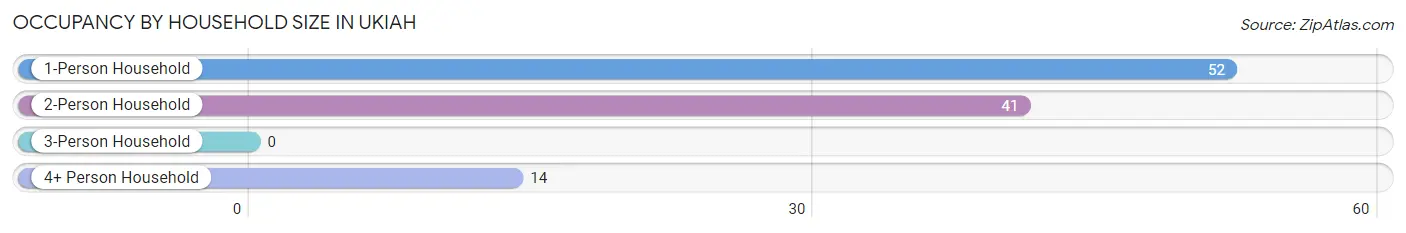
| Household Size | # Housing Units | % Housing Units |
| 1-Person Household | 52 | 48.6% |
| 2-Person Household | 41 | 38.3% |
| 3-Person Household | 0 | 0.0% |
| 4+ Person Household | 14 | 13.1% |
| Total Housing Units | 107 | 100.0% |
Occupancy by Ownership by Household Size in Ukiah
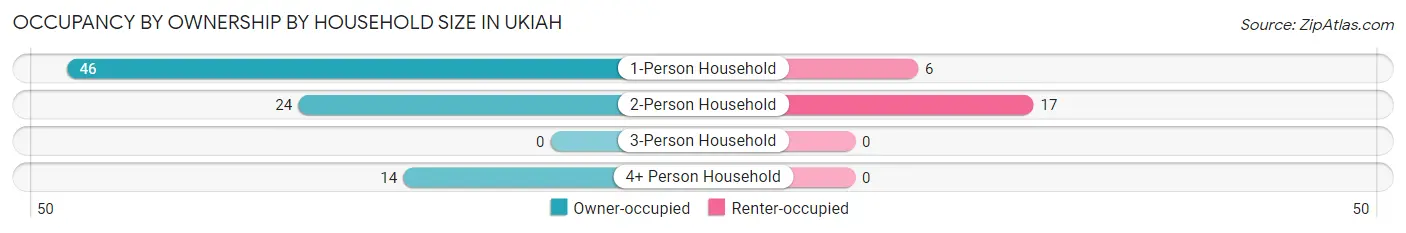
| Household Size | Owner-occupied | Renter-occupied |
| 1-Person Household | 46 (88.5%) | 6 (11.5%) |
| 2-Person Household | 24 (58.5%) | 17 (41.5%) |
| 3-Person Household | 0 (0.0%) | 0 (0.0%) |
| 4+ Person Household | 14 (100.0%) | 0 (0.0%) |
| Total Housing Units | 84 (78.5%) | 23 (21.5%) |
Occupancy by Educational Attainment in Ukiah
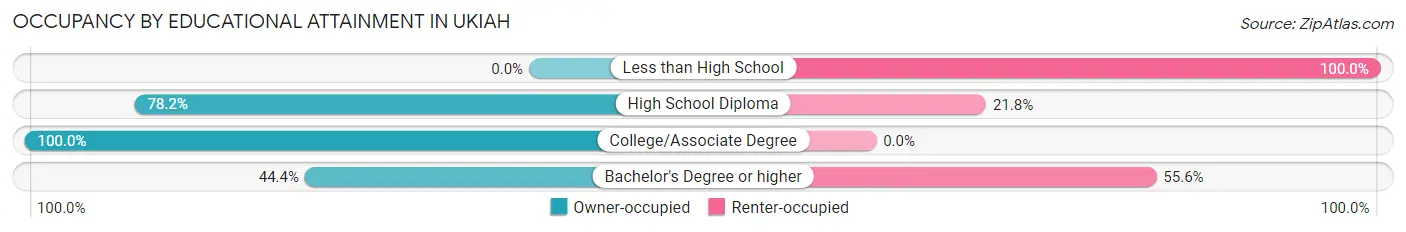
| Household Size | Owner-occupied | Renter-occupied |
| Less than High School | 0 (0.0%) | 1 (100.0%) |
| High School Diploma | 61 (78.2%) | 17 (21.8%) |
| College/Associate Degree | 19 (100.0%) | 0 (0.0%) |
| Bachelor's Degree or higher | 4 (44.4%) | 5 (55.6%) |
Occupancy by Age of Householder in Ukiah
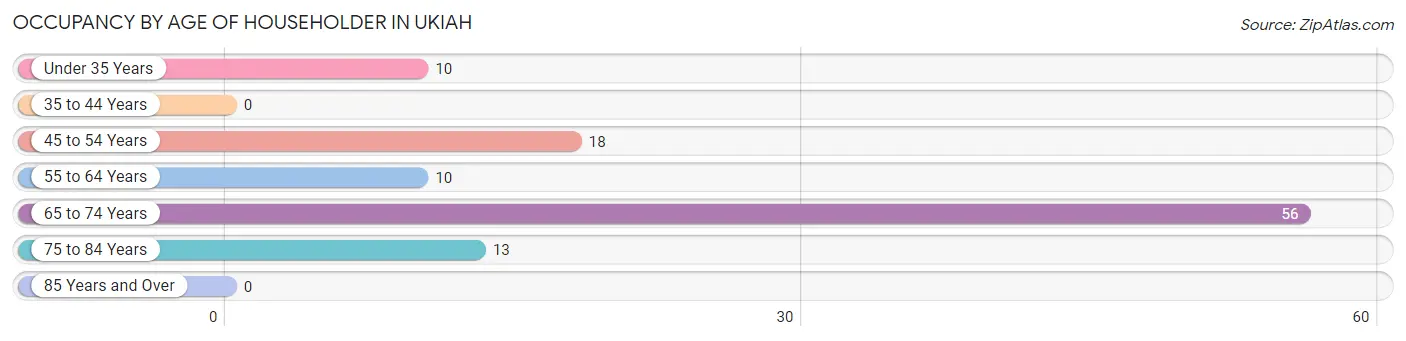
| Age Bracket | # Households | % Households |
| Under 35 Years | 10 | 9.3% |
| 35 to 44 Years | 0 | 0.0% |
| 45 to 54 Years | 18 | 16.8% |
| 55 to 64 Years | 10 | 9.3% |
| 65 to 74 Years | 56 | 52.3% |
| 75 to 84 Years | 13 | 12.1% |
| 85 Years and Over | 0 | 0.0% |
| Total | 107 | 100.0% |
Housing Finances in Ukiah
Median Income by Occupancy in Ukiah
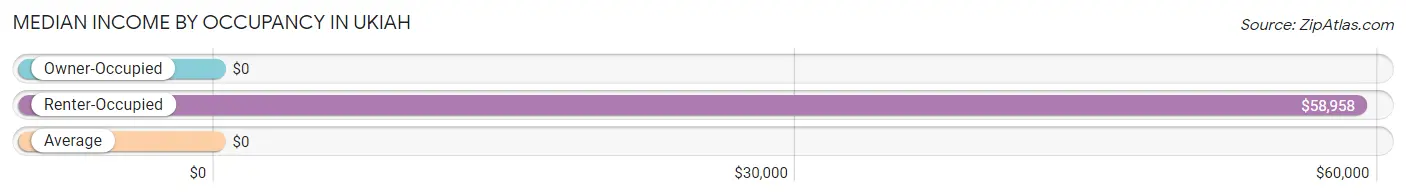
| Occupancy Type | # Households | Median Income |
| Owner-Occupied | 84 (78.5%) | $0 |
| Renter-Occupied | 23 (21.5%) | $58,958 |
| Average | 107 (100.0%) | $0 |
Occupancy by Householder Income Bracket in Ukiah
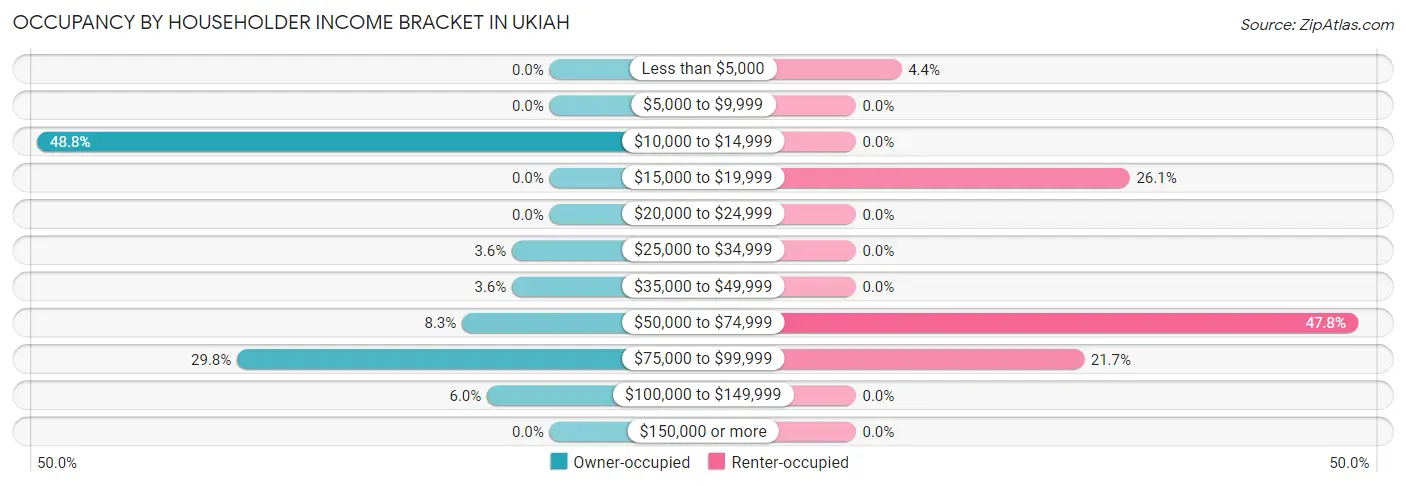
| Income Bracket | Owner-occupied | Renter-occupied |
| Less than $5,000 | 0 (0.0%) | 1 (4.3%) |
| $5,000 to $9,999 | 0 (0.0%) | 0 (0.0%) |
| $10,000 to $14,999 | 41 (48.8%) | 0 (0.0%) |
| $15,000 to $19,999 | 0 (0.0%) | 6 (26.1%) |
| $20,000 to $24,999 | 0 (0.0%) | 0 (0.0%) |
| $25,000 to $34,999 | 3 (3.6%) | 0 (0.0%) |
| $35,000 to $49,999 | 3 (3.6%) | 0 (0.0%) |
| $50,000 to $74,999 | 7 (8.3%) | 11 (47.8%) |
| $75,000 to $99,999 | 25 (29.8%) | 5 (21.7%) |
| $100,000 to $149,999 | 5 (5.9%) | 0 (0.0%) |
| $150,000 or more | 0 (0.0%) | 0 (0.0%) |
| Total | 84 (100.0%) | 23 (100.0%) |
Monthly Housing Cost Tiers in Ukiah
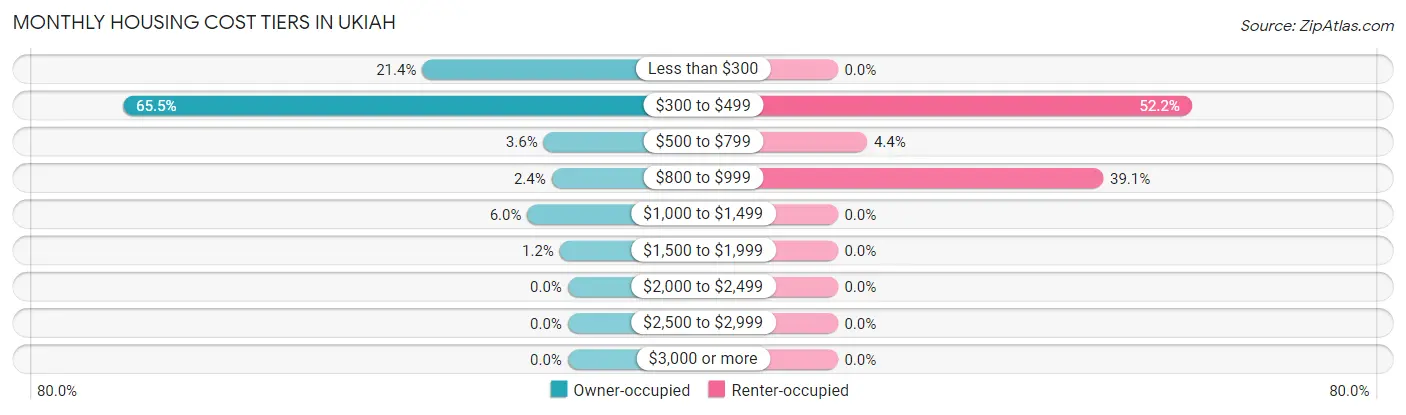
| Monthly Cost | Owner-occupied | Renter-occupied |
| Less than $300 | 18 (21.4%) | 0 (0.0%) |
| $300 to $499 | 55 (65.5%) | 12 (52.2%) |
| $500 to $799 | 3 (3.6%) | 1 (4.3%) |
| $800 to $999 | 2 (2.4%) | 9 (39.1%) |
| $1,000 to $1,499 | 5 (5.9%) | 0 (0.0%) |
| $1,500 to $1,999 | 1 (1.2%) | 0 (0.0%) |
| $2,000 to $2,499 | 0 (0.0%) | 0 (0.0%) |
| $2,500 to $2,999 | 0 (0.0%) | 0 (0.0%) |
| $3,000 or more | 0 (0.0%) | 0 (0.0%) |
| Total | 84 (100.0%) | 23 (100.0%) |
Physical Housing Characteristics in Ukiah
Housing Structures in Ukiah
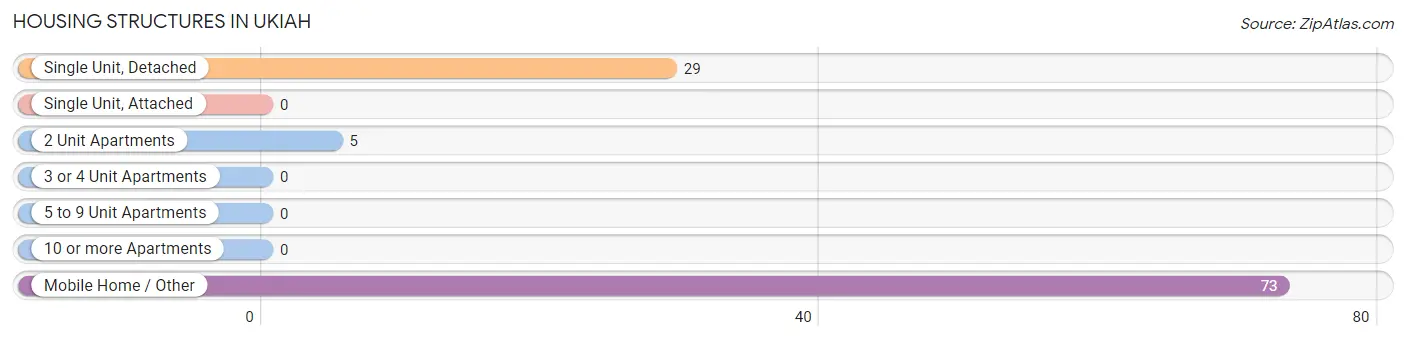
| Structure Type | # Housing Units | % Housing Units |
| Single Unit, Detached | 29 | 27.1% |
| Single Unit, Attached | 0 | 0.0% |
| 2 Unit Apartments | 5 | 4.7% |
| 3 or 4 Unit Apartments | 0 | 0.0% |
| 5 to 9 Unit Apartments | 0 | 0.0% |
| 10 or more Apartments | 0 | 0.0% |
| Mobile Home / Other | 73 | 68.2% |
| Total | 107 | 100.0% |
Housing Structures by Occupancy in Ukiah
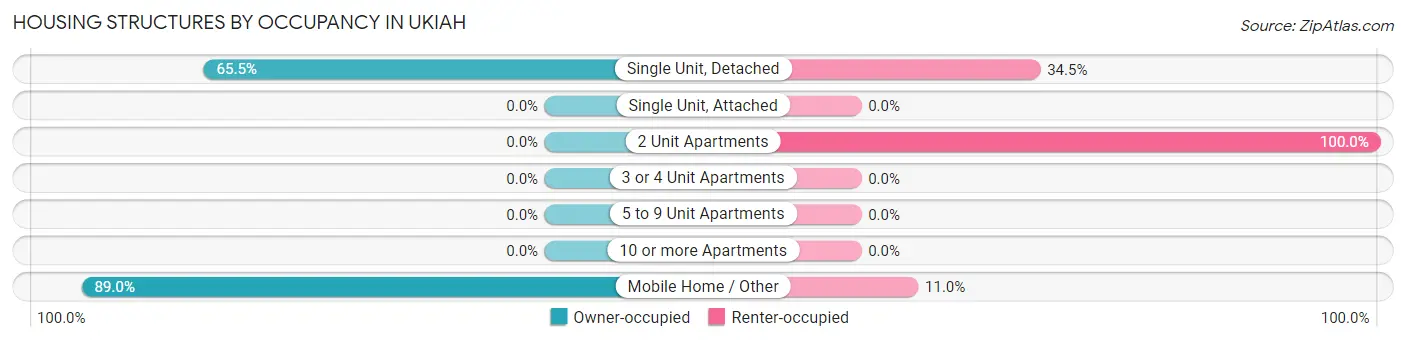
| Structure Type | Owner-occupied | Renter-occupied |
| Single Unit, Detached | 19 (65.5%) | 10 (34.5%) |
| Single Unit, Attached | 0 (0.0%) | 0 (0.0%) |
| 2 Unit Apartments | 0 (0.0%) | 5 (100.0%) |
| 3 or 4 Unit Apartments | 0 (0.0%) | 0 (0.0%) |
| 5 to 9 Unit Apartments | 0 (0.0%) | 0 (0.0%) |
| 10 or more Apartments | 0 (0.0%) | 0 (0.0%) |
| Mobile Home / Other | 65 (89.0%) | 8 (11.0%) |
| Total | 84 (78.5%) | 23 (21.5%) |
Housing Structures by Number of Rooms in Ukiah
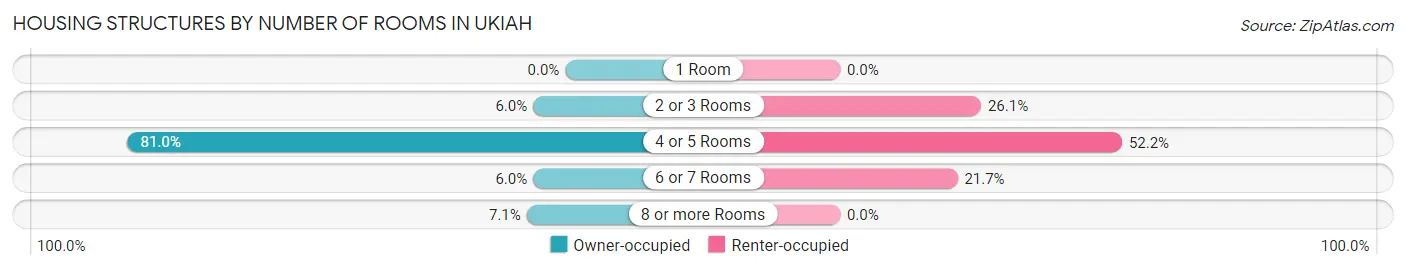
| Number of Rooms | Owner-occupied | Renter-occupied |
| 1 Room | 0 (0.0%) | 0 (0.0%) |
| 2 or 3 Rooms | 5 (5.9%) | 6 (26.1%) |
| 4 or 5 Rooms | 68 (80.9%) | 12 (52.2%) |
| 6 or 7 Rooms | 5 (5.9%) | 5 (21.7%) |
| 8 or more Rooms | 6 (7.1%) | 0 (0.0%) |
| Total | 84 (100.0%) | 23 (100.0%) |
Housing Structure by Heating Type in Ukiah
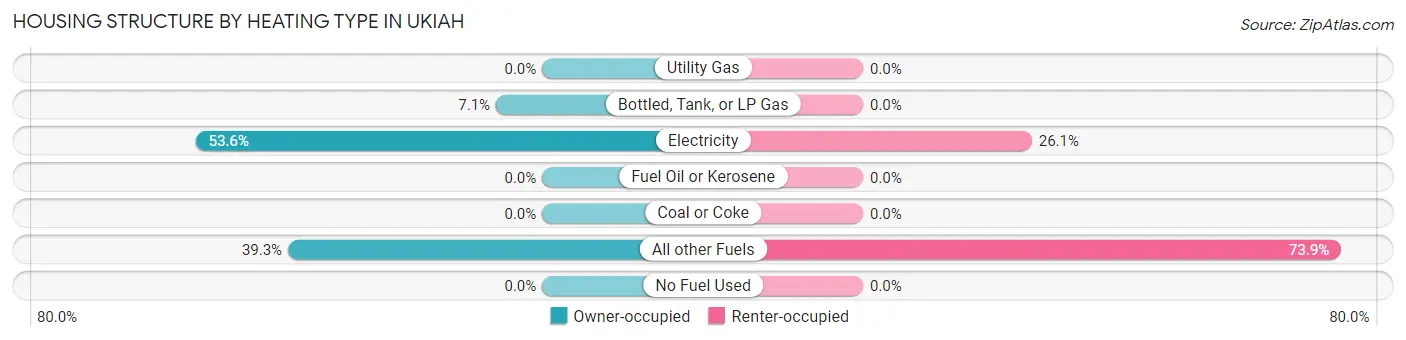
| Heating Type | Owner-occupied | Renter-occupied |
| Utility Gas | 0 (0.0%) | 0 (0.0%) |
| Bottled, Tank, or LP Gas | 6 (7.1%) | 0 (0.0%) |
| Electricity | 45 (53.6%) | 6 (26.1%) |
| Fuel Oil or Kerosene | 0 (0.0%) | 0 (0.0%) |
| Coal or Coke | 0 (0.0%) | 0 (0.0%) |
| All other Fuels | 33 (39.3%) | 17 (73.9%) |
| No Fuel Used | 0 (0.0%) | 0 (0.0%) |
| Total | 84 (100.0%) | 23 (100.0%) |
Household Vehicle Usage in Ukiah
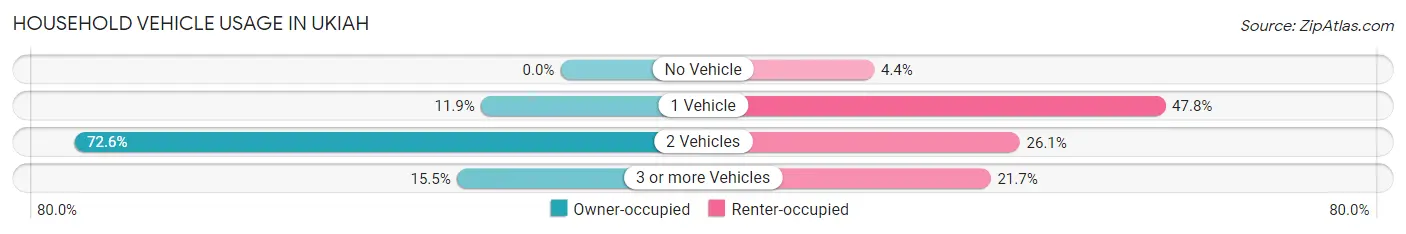
| Vehicles per Household | Owner-occupied | Renter-occupied |
| No Vehicle | 0 (0.0%) | 1 (4.3%) |
| 1 Vehicle | 10 (11.9%) | 11 (47.8%) |
| 2 Vehicles | 61 (72.6%) | 6 (26.1%) |
| 3 or more Vehicles | 13 (15.5%) | 5 (21.7%) |
| Total | 84 (100.0%) | 23 (100.0%) |
Real Estate & Mortgages in Ukiah
Real Estate and Mortgage Overview in Ukiah
| Characteristic | Without Mortgage | With Mortgage |
| Housing Units | 75 | 9 |
| Median Property Value | - | - |
| Median Household Income | - | - |
| Monthly Housing Costs | $429 | $0 |
| Real Estate Taxes | $595 | $0 |
Property Value by Mortgage Status in Ukiah
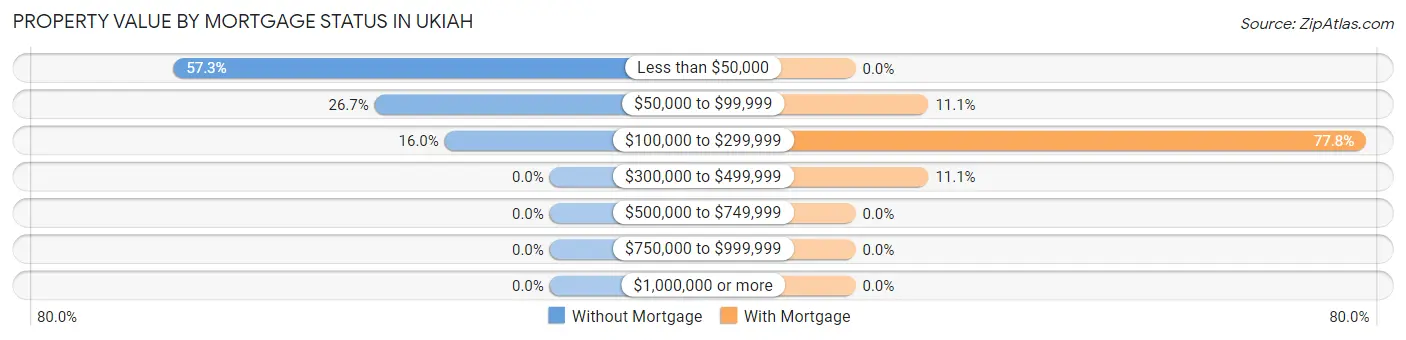
| Property Value | Without Mortgage | With Mortgage |
| Less than $50,000 | 43 (57.3%) | 0 (0.0%) |
| $50,000 to $99,999 | 20 (26.7%) | 1 (11.1%) |
| $100,000 to $299,999 | 12 (16.0%) | 7 (77.8%) |
| $300,000 to $499,999 | 0 (0.0%) | 1 (11.1%) |
| $500,000 to $749,999 | 0 (0.0%) | 0 (0.0%) |
| $750,000 to $999,999 | 0 (0.0%) | 0 (0.0%) |
| $1,000,000 or more | 0 (0.0%) | 0 (0.0%) |
| Total | 75 (100.0%) | 9 (100.0%) |
Household Income by Mortgage Status in Ukiah
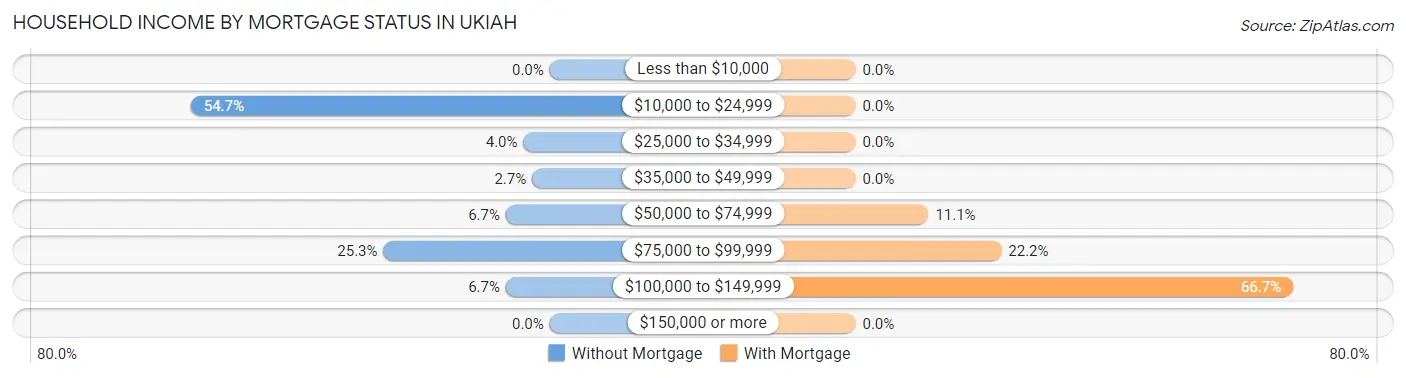
| Household Income | Without Mortgage | With Mortgage |
| Less than $10,000 | 0 (0.0%) | 0 (0.0%) |
| $10,000 to $24,999 | 41 (54.7%) | 0 (0.0%) |
| $25,000 to $34,999 | 3 (4.0%) | 0 (0.0%) |
| $35,000 to $49,999 | 2 (2.7%) | 0 (0.0%) |
| $50,000 to $74,999 | 5 (6.7%) | 1 (11.1%) |
| $75,000 to $99,999 | 19 (25.3%) | 2 (22.2%) |
| $100,000 to $149,999 | 5 (6.7%) | 6 (66.7%) |
| $150,000 or more | 0 (0.0%) | 0 (0.0%) |
| Total | 75 (100.0%) | 9 (100.0%) |
Property Value to Household Income Ratio in Ukiah
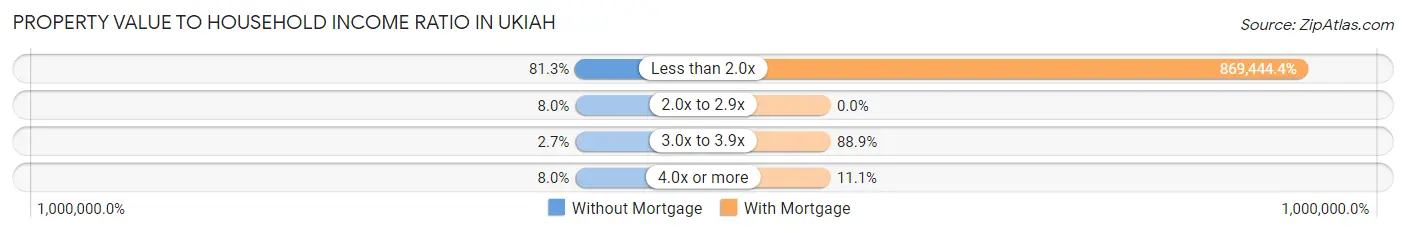
| Value-to-Income Ratio | Without Mortgage | With Mortgage |
| Less than 2.0x | 61 (81.3%) | 78,250 (869,444.4%) |
| 2.0x to 2.9x | 6 (8.0%) | 0 (0.0%) |
| 3.0x to 3.9x | 2 (2.7%) | 8 (88.9%) |
| 4.0x or more | 6 (8.0%) | 1 (11.1%) |
| Total | 75 (100.0%) | 9 (100.0%) |
Real Estate Taxes by Mortgage Status in Ukiah
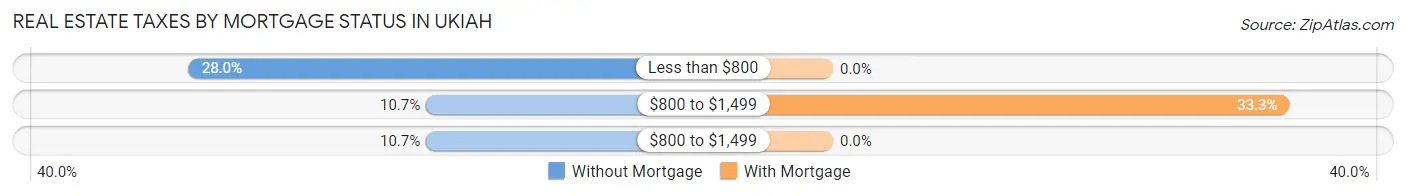
| Property Taxes | Without Mortgage | With Mortgage |
| Less than $800 | 21 (28.0%) | 0 (0.0%) |
| $800 to $1,499 | 8 (10.7%) | 3 (33.3%) |
| $800 to $1,499 | 8 (10.7%) | 0 (0.0%) |
| Total | 75 (100.0%) | 9 (100.0%) |
Health & Disability in Ukiah
Health Insurance Coverage by Age in Ukiah
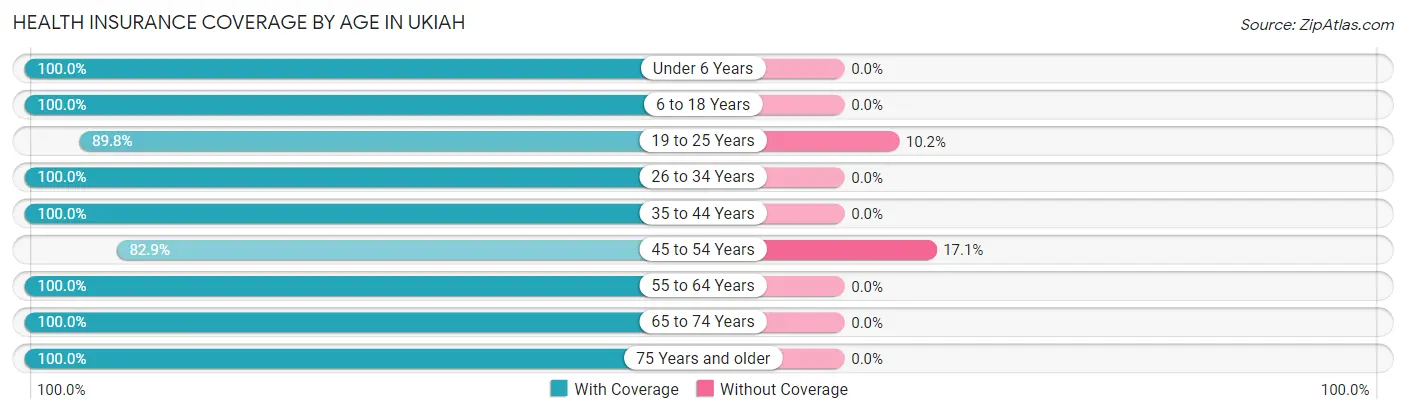
| Age Bracket | With Coverage | Without Coverage |
| Under 6 Years | 18 (100.0%) | 0 (0.0%) |
| 6 to 18 Years | 41 (100.0%) | 0 (0.0%) |
| 19 to 25 Years | 53 (89.8%) | 6 (10.2%) |
| 26 to 34 Years | 4 (100.0%) | 0 (0.0%) |
| 35 to 44 Years | 5 (100.0%) | 0 (0.0%) |
| 45 to 54 Years | 29 (82.9%) | 6 (17.1%) |
| 55 to 64 Years | 20 (100.0%) | 0 (0.0%) |
| 65 to 74 Years | 63 (100.0%) | 0 (0.0%) |
| 75 Years and older | 20 (100.0%) | 0 (0.0%) |
| Total | 253 (95.5%) | 12 (4.5%) |
Health Insurance Coverage by Citizenship Status in Ukiah
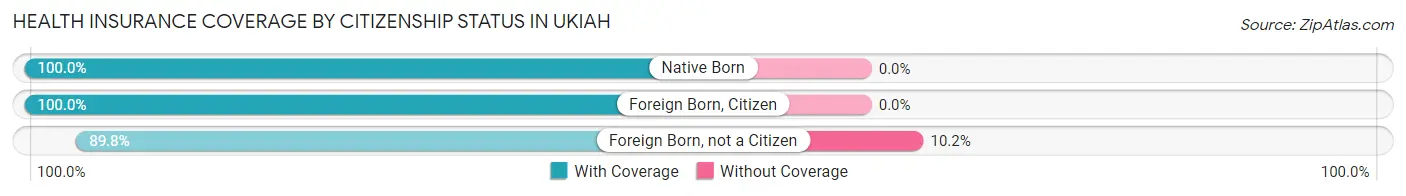
| Citizenship Status | With Coverage | Without Coverage |
| Native Born | 18 (100.0%) | 0 (0.0%) |
| Foreign Born, Citizen | 41 (100.0%) | 0 (0.0%) |
| Foreign Born, not a Citizen | 53 (89.8%) | 6 (10.2%) |
Health Insurance Coverage by Household Income in Ukiah
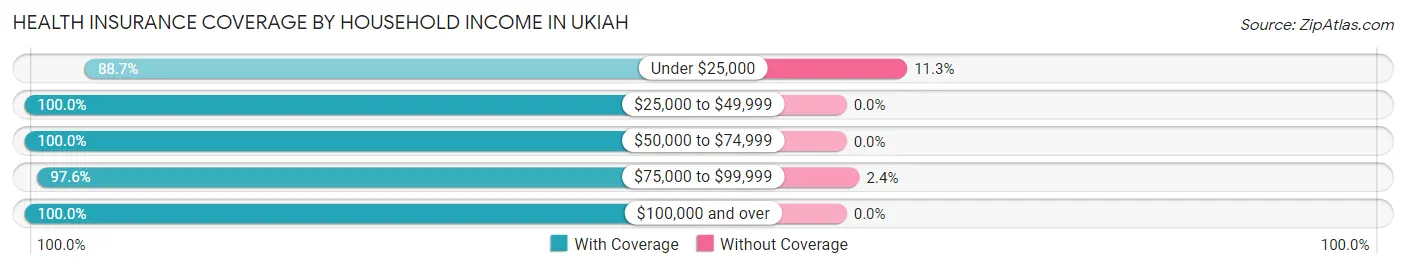
| Household Income | With Coverage | Without Coverage |
| Under $25,000 | 47 (88.7%) | 6 (11.3%) |
| $25,000 to $49,999 | 11 (100.0%) | 0 (0.0%) |
| $50,000 to $74,999 | 37 (100.0%) | 0 (0.0%) |
| $75,000 to $99,999 | 81 (97.6%) | 2 (2.4%) |
| $100,000 and over | 5 (100.0%) | 0 (0.0%) |
Public vs Private Health Insurance Coverage by Age in Ukiah
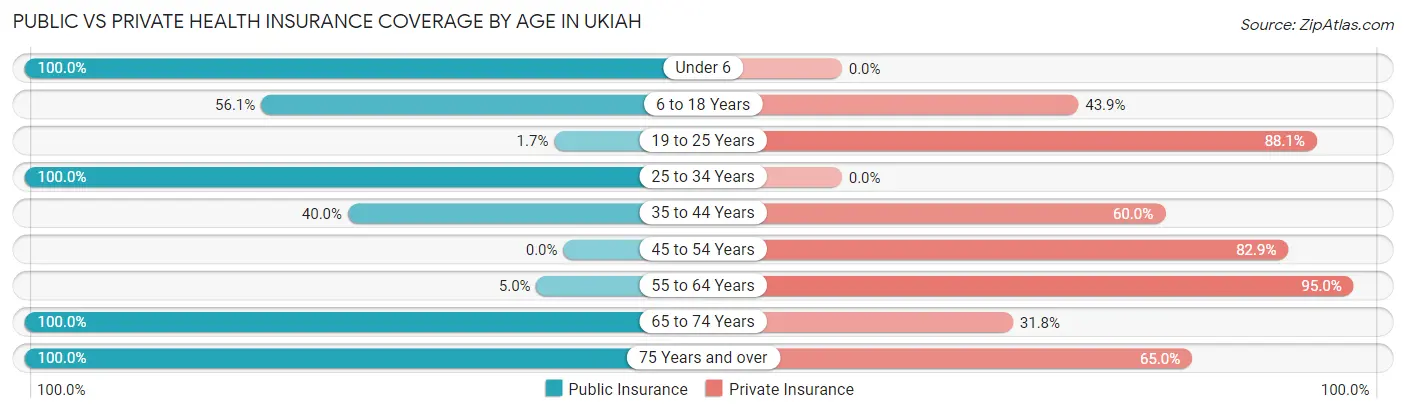
| Age Bracket | Public Insurance | Private Insurance |
| Under 6 | 18 (100.0%) | 0 (0.0%) |
| 6 to 18 Years | 23 (56.1%) | 18 (43.9%) |
| 19 to 25 Years | 1 (1.7%) | 52 (88.1%) |
| 25 to 34 Years | 4 (100.0%) | 0 (0.0%) |
| 35 to 44 Years | 2 (40.0%) | 3 (60.0%) |
| 45 to 54 Years | 0 (0.0%) | 29 (82.9%) |
| 55 to 64 Years | 1 (5.0%) | 19 (95.0%) |
| 65 to 74 Years | 63 (100.0%) | 20 (31.8%) |
| 75 Years and over | 20 (100.0%) | 13 (65.0%) |
| Total | 132 (49.8%) | 154 (58.1%) |
Disability Status by Sex by Age in Ukiah
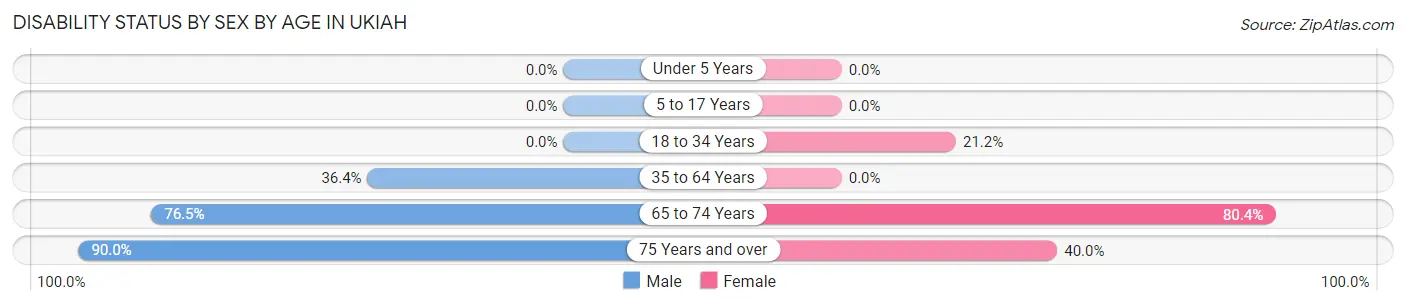
| Age Bracket | Male | Female |
| Under 5 Years | 0 (0.0%) | 0 (0.0%) |
| 5 to 17 Years | 0 (0.0%) | 0 (0.0%) |
| 18 to 34 Years | 0 (0.0%) | 7 (21.2%) |
| 35 to 64 Years | 12 (36.4%) | 0 (0.0%) |
| 65 to 74 Years | 13 (76.5%) | 37 (80.4%) |
| 75 Years and over | 9 (90.0%) | 4 (40.0%) |
Disability Class by Sex by Age in Ukiah
Disability Class: Hearing Difficulty
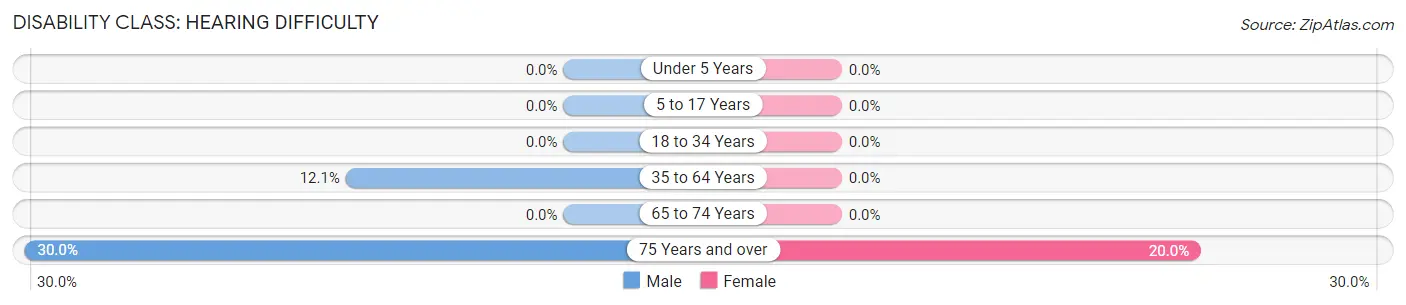
| Age Bracket | Male | Female |
| Under 5 Years | 0 (0.0%) | 0 (0.0%) |
| 5 to 17 Years | 0 (0.0%) | 0 (0.0%) |
| 18 to 34 Years | 0 (0.0%) | 0 (0.0%) |
| 35 to 64 Years | 4 (12.1%) | 0 (0.0%) |
| 65 to 74 Years | 0 (0.0%) | 0 (0.0%) |
| 75 Years and over | 3 (30.0%) | 2 (20.0%) |
Disability Class: Vision Difficulty
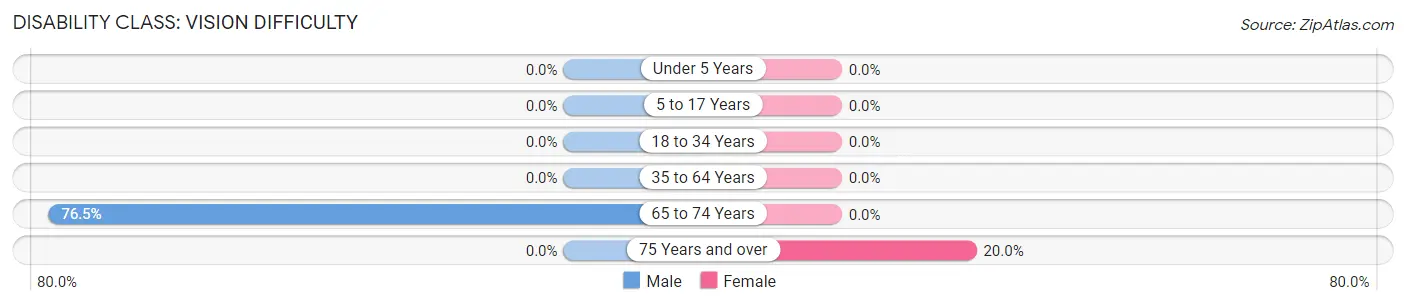
| Age Bracket | Male | Female |
| Under 5 Years | 0 (0.0%) | 0 (0.0%) |
| 5 to 17 Years | 0 (0.0%) | 0 (0.0%) |
| 18 to 34 Years | 0 (0.0%) | 0 (0.0%) |
| 35 to 64 Years | 0 (0.0%) | 0 (0.0%) |
| 65 to 74 Years | 13 (76.5%) | 0 (0.0%) |
| 75 Years and over | 0 (0.0%) | 2 (20.0%) |
Disability Class: Cognitive Difficulty
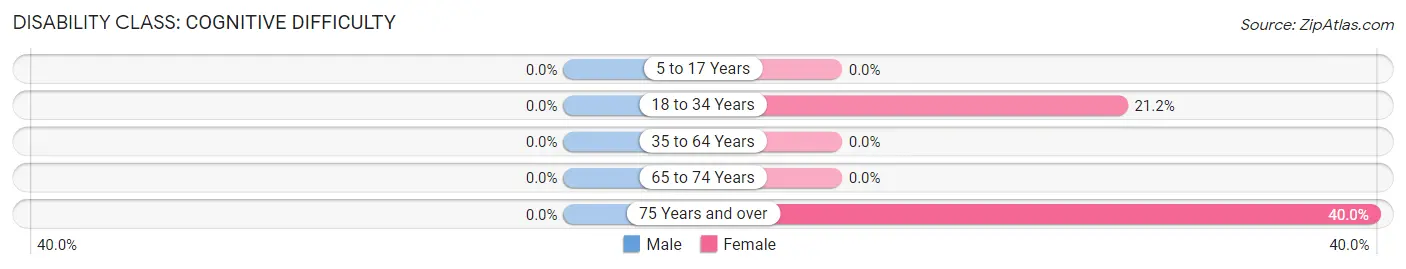
| Age Bracket | Male | Female |
| 5 to 17 Years | 0 (0.0%) | 0 (0.0%) |
| 18 to 34 Years | 0 (0.0%) | 7 (21.2%) |
| 35 to 64 Years | 0 (0.0%) | 0 (0.0%) |
| 65 to 74 Years | 0 (0.0%) | 0 (0.0%) |
| 75 Years and over | 0 (0.0%) | 4 (40.0%) |
Disability Class: Ambulatory Difficulty
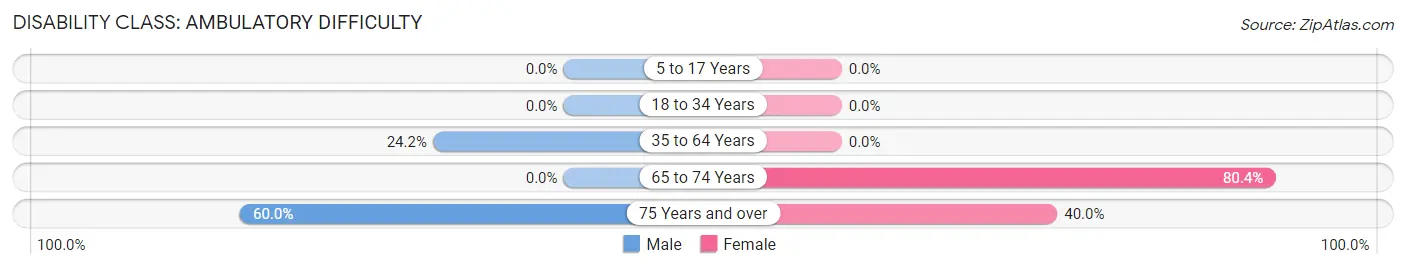
| Age Bracket | Male | Female |
| 5 to 17 Years | 0 (0.0%) | 0 (0.0%) |
| 18 to 34 Years | 0 (0.0%) | 0 (0.0%) |
| 35 to 64 Years | 8 (24.2%) | 0 (0.0%) |
| 65 to 74 Years | 0 (0.0%) | 37 (80.4%) |
| 75 Years and over | 6 (60.0%) | 4 (40.0%) |
Disability Class: Self-Care Difficulty
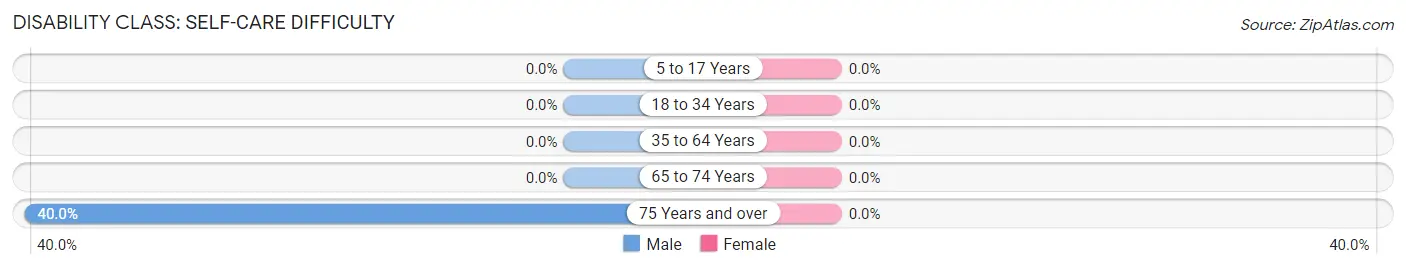
| Age Bracket | Male | Female |
| 5 to 17 Years | 0 (0.0%) | 0 (0.0%) |
| 18 to 34 Years | 0 (0.0%) | 0 (0.0%) |
| 35 to 64 Years | 0 (0.0%) | 0 (0.0%) |
| 65 to 74 Years | 0 (0.0%) | 0 (0.0%) |
| 75 Years and over | 4 (40.0%) | 0 (0.0%) |
Technology Access in Ukiah
Computing Device Access in Ukiah
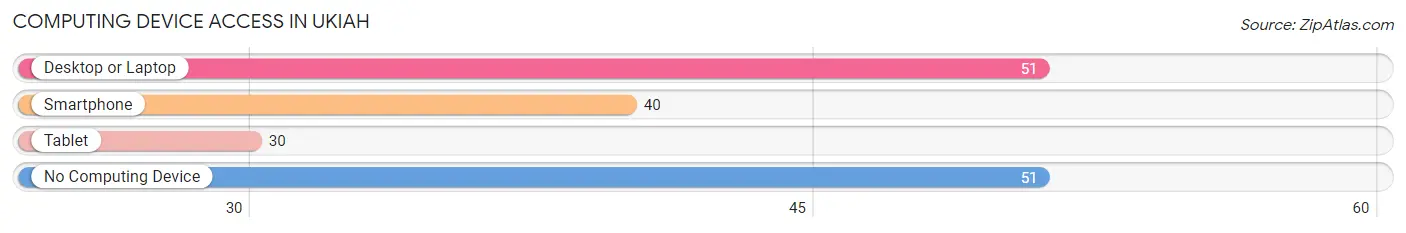
| Device Type | # Households | % Households |
| Desktop or Laptop | 51 | 47.7% |
| Smartphone | 40 | 37.4% |
| Tablet | 30 | 28.0% |
| No Computing Device | 51 | 47.7% |
| Total | 107 | 100.0% |
Internet Access in Ukiah
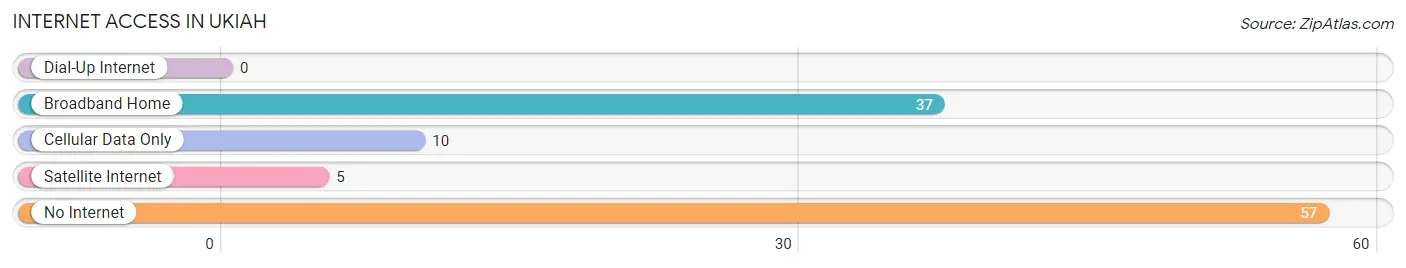
| Internet Type | # Households | % Households |
| Dial-Up Internet | 0 | 0.0% |
| Broadband Home | 37 | 34.6% |
| Cellular Data Only | 10 | 9.3% |
| Satellite Internet | 5 | 4.7% |
| No Internet | 57 | 53.3% |
| Total | 107 | 100.0% |
Ukiah Summary
History
The city of Ukiah, Oregon is located in the heart of the Willamette Valley, and is the county seat of Marion County. The city was founded in 1856 by settlers from the Oregon Trail, and was originally known as “Umpqua”. The name was changed to “Ukiah” in 1859, after the Native American word for “valley”. The city was incorporated in 1864, and has since grown to become a thriving community of over 10,000 people.
The city of Ukiah has a rich history of industry and agriculture. In the late 1800s, the city was home to a number of sawmills, flour mills, and other manufacturing businesses. The city was also home to a number of farms, which produced a variety of crops, including wheat, oats, and hay. In the early 1900s, the city was home to a number of canneries, which canned fruits and vegetables for sale throughout the region.
The city of Ukiah has also been home to a number of notable people throughout its history. In the late 1800s, the city was home to a number of prominent politicians, including Oregon Governor Sylvester Pennoyer and U.S. Senator John H. Mitchell. In the early 1900s, the city was home to a number of prominent writers, including poet and novelist William Stafford and novelist and playwright William Inge.
Geography
The city of Ukiah is located in the heart of the Willamette Valley, in the western part of Oregon. The city is situated at the confluence of the Willamette and Santiam Rivers, and is surrounded by rolling hills and lush forests. The city is located approximately 50 miles south of Portland, and is within easy driving distance of the Oregon Coast and the Cascade Mountains.
The city of Ukiah has a total area of 4.3 square miles, of which 4.2 square miles is land and 0.1 square miles is water. The city is located at an elevation of approximately 500 feet above sea level. The climate in Ukiah is mild and temperate, with warm summers and cool winters.
Economy
The economy of Ukiah is largely based on agriculture and manufacturing. The city is home to a number of farms, which produce a variety of crops, including wheat, oats, and hay. The city is also home to a number of manufacturing businesses, which produce a variety of products, including furniture, clothing, and electronics.
The city of Ukiah is also home to a number of retail businesses, which provide goods and services to the local community. The city is home to a number of restaurants, bars, and other entertainment venues, which provide a variety of dining and entertainment options. The city is also home to a number of banks, which provide financial services to the local community.
Demographics
As of the 2010 census, the city of Ukiah had a population of 10,845 people. The population is largely white (90.2%), with smaller percentages of Hispanic (3.7%), African American (2.2%), and Asian (1.7%) residents. The median household income in the city is $45,845, and the median home value is $179,400. The city has a poverty rate of 13.3%, and the unemployment rate is 5.2%.
Conclusion
The city of Ukiah, Oregon is a thriving community located in the heart of the Willamette Valley. The city has a rich history of industry and agriculture, and is home to a number of farms, manufacturing businesses, and retail businesses. The city has a population of 10,845 people, and the median household income is $45,845. The city has a mild and temperate climate, and is within easy driving distance of the Oregon Coast and the Cascade Mountains.
Common Questions
What is Per Capita Income in Ukiah?
Per Capita income in Ukiah is $20,616.
What is the Median Family Income in Ukiah?
Median Family Income in Ukiah is $78,000.
What is Inequality or Gini Index in Ukiah?
Inequality or Gini Index in Ukiah is 0.41.
What is the Total Population of Ukiah?
Total Population of Ukiah is 265.
What is the Total Male Population of Ukiah?
Total Male Population of Ukiah is 126.
What is the Total Female Population of Ukiah?
Total Female Population of Ukiah is 139.
What is the Ratio of Males per 100 Females in Ukiah?
There are 90.65 Males per 100 Females in Ukiah.
What is the Ratio of Females per 100 Males in Ukiah?
There are 110.32 Females per 100 Males in Ukiah.
What is the Median Population Age in Ukiah?
Median Population Age in Ukiah is 46.8 Years.
What is the Average Family Size in Ukiah
Average Family Size in Ukiah is 2.6 People.
What is the Average Household Size in Ukiah
Average Household Size in Ukiah is 1.8 People.
How Large is the Labor Force in Ukiah?
There are 113 People in the Labor Forcein in Ukiah.
What is the Percentage of People in the Labor Force in Ukiah?
50.4% of People are in the Labor Force in Ukiah.
What is the Unemployment Rate in Ukiah?
Unemployment Rate in Ukiah is 18.6%.