Astoria, OR Map & Demographics
Astoria Map
Astoria Overview
$38,742
PER CAPITA INCOME
$88,268
AVG FAMILY INCOME
$69,463
AVG HOUSEHOLD INCOME
7.9%
WAGE / INCOME GAP [ % ]
92.1¢/ $1
WAGE / INCOME GAP [ $ ]
0.45
INEQUALITY / GINI INDEX
10,184
TOTAL POPULATION
5,039
MALE POPULATION
5,145
FEMALE POPULATION
97.94
MALES / 100 FEMALES
102.10
FEMALES / 100 MALES
42.0
MEDIAN AGE
2.9
AVG FAMILY SIZE
2.2
AVG HOUSEHOLD SIZE
5,077
LABOR FORCE [ PEOPLE ]
61.1%
PERCENT IN LABOR FORCE
3.8%
UNEMPLOYMENT RATE
Astoria Zip Codes
Income in Astoria
Income Overview in Astoria
Per Capita Income in Astoria is $38,742, while median incomes of families and households are $88,268 and $69,463 respectively.
| Characteristic | Number | Measure |
| Per Capita Income | 10,184 | $38,742 |
| Median Family Income | 2,469 | $88,268 |
| Mean Family Income | 2,469 | $108,622 |
| Median Household Income | 4,420 | $69,463 |
| Mean Household Income | 4,420 | $89,455 |
| Income Deficit | 2,469 | $0 |
| Wage / Income Gap (%) | 10,184 | 7.85% |
| Wage / Income Gap ($) | 10,184 | 92.15¢ per $1 |
| Gini / Inequality Index | 10,184 | 0.45 |
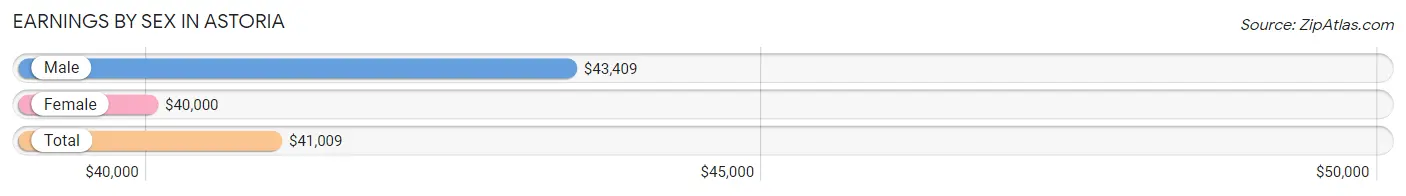
Earnings by Sex in Astoria
Average Earnings in Astoria are $41,009, $43,409 for men and $40,000 for women, a difference of 7.9%.
| Sex | Number | Average Earnings |
| Male | 2,884 (53.1%) | $43,409 |
| Female | 2,550 (46.9%) | $40,000 |
| Total | 5,434 (100.0%) | $41,009 |
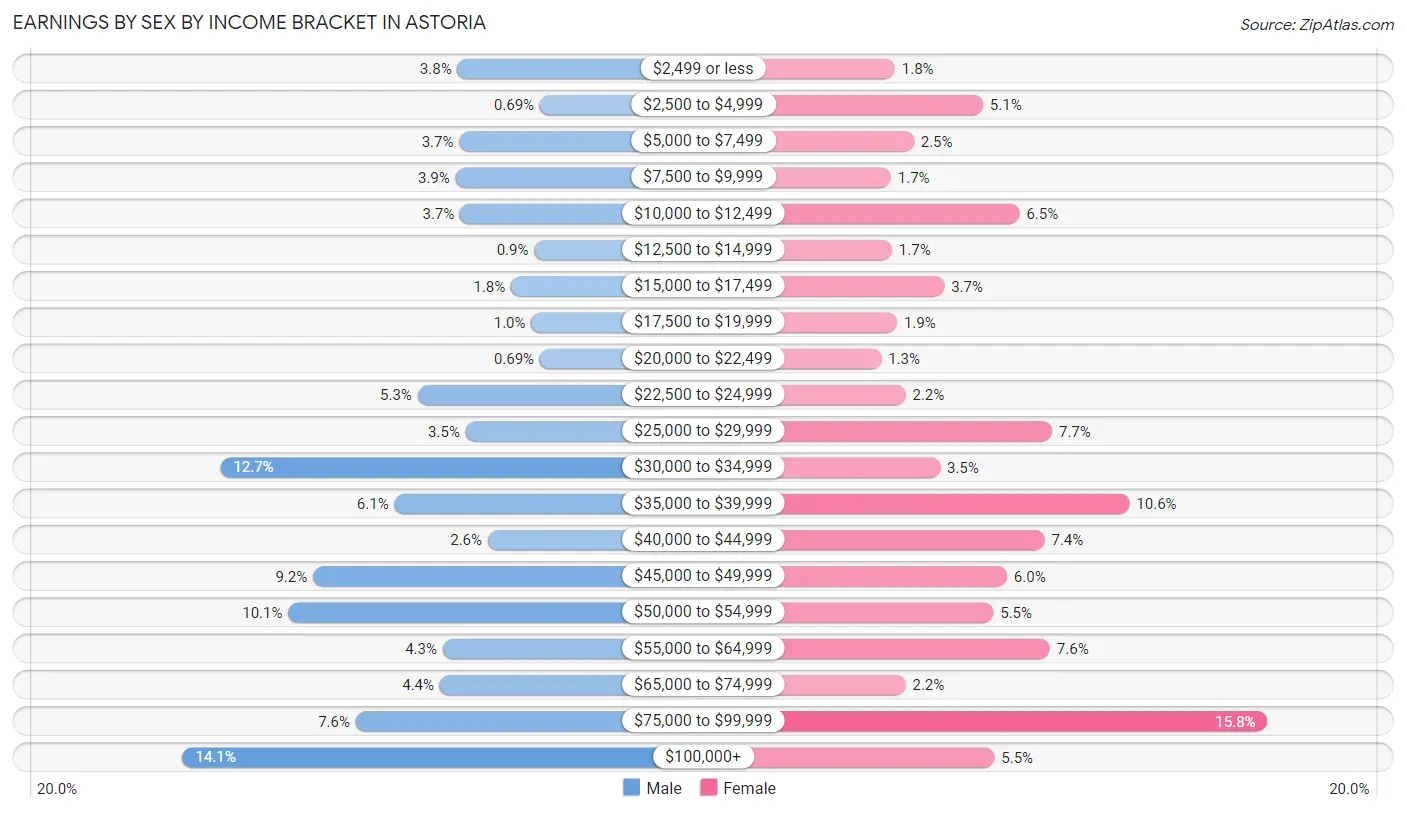
Earnings by Sex by Income Bracket in Astoria
The most common earnings brackets in Astoria are $100,000+ for men (406 | 14.1%) and $75,000 to $99,999 for women (402 | 15.8%).
| Income | Male | Female |
| $2,499 or less | 109 (3.8%) | 46 (1.8%) |
| $2,500 to $4,999 | 20 (0.7%) | 130 (5.1%) |
| $5,000 to $7,499 | 107 (3.7%) | 64 (2.5%) |
| $7,500 to $9,999 | 111 (3.8%) | 42 (1.7%) |
| $10,000 to $12,499 | 106 (3.7%) | 165 (6.5%) |
| $12,500 to $14,999 | 26 (0.9%) | 43 (1.7%) |
| $15,000 to $17,499 | 51 (1.8%) | 93 (3.6%) |
| $17,500 to $19,999 | 29 (1.0%) | 48 (1.9%) |
| $20,000 to $22,499 | 20 (0.7%) | 33 (1.3%) |
| $22,500 to $24,999 | 152 (5.3%) | 56 (2.2%) |
| $25,000 to $29,999 | 100 (3.5%) | 196 (7.7%) |
| $30,000 to $34,999 | 365 (12.7%) | 89 (3.5%) |
| $35,000 to $39,999 | 177 (6.1%) | 270 (10.6%) |
| $40,000 to $44,999 | 76 (2.6%) | 189 (7.4%) |
| $45,000 to $49,999 | 265 (9.2%) | 153 (6.0%) |
| $50,000 to $54,999 | 292 (10.1%) | 140 (5.5%) |
| $55,000 to $64,999 | 125 (4.3%) | 194 (7.6%) |
| $65,000 to $74,999 | 128 (4.4%) | 56 (2.2%) |
| $75,000 to $99,999 | 219 (7.6%) | 402 (15.8%) |
| $100,000+ | 406 (14.1%) | 141 (5.5%) |
| Total | 2,884 (100.0%) | 2,550 (100.0%) |
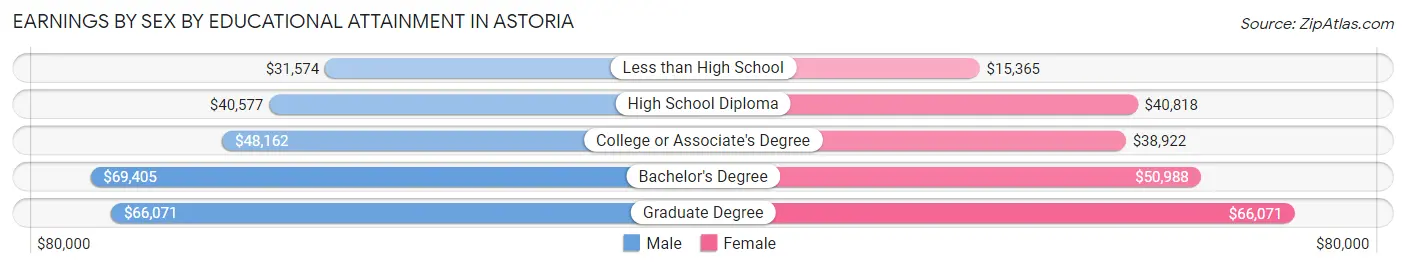
Earnings by Sex by Educational Attainment in Astoria
Average earnings in Astoria are $47,312 for men and $43,117 for women, a difference of 8.9%. Men with an educational attainment of bachelor's degree enjoy the highest average annual earnings of $69,405, while those with less than high school education earn the least with $31,574. Women with an educational attainment of graduate degree earn the most with the average annual earnings of $66,071, while those with less than high school education have the smallest earnings of $15,365.
| Educational Attainment | Male Income | Female Income |
| Less than High School | $31,574 | $15,365 |
| High School Diploma | $40,577 | $40,818 |
| College or Associate's Degree | $48,162 | $38,922 |
| Bachelor's Degree | $69,405 | $50,988 |
| Graduate Degree | $66,071 | $66,071 |
| Total | $47,312 | $43,117 |
Family Income in Astoria
Family Income Brackets in Astoria
According to the Astoria family income data, there are 506 families falling into the $75,000 to $99,999 income range, which is the most common income bracket and makes up 20.5% of all families.
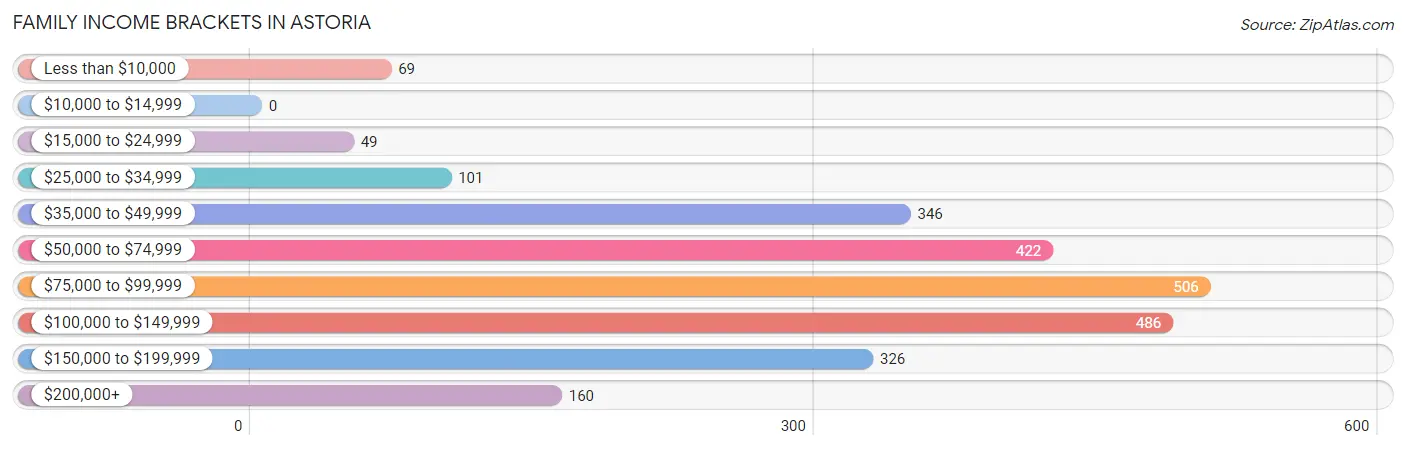
| Income Bracket | # Families | % Families |
| Less than $10,000 | 69 | 2.8% |
| $10,000 to $14,999 | 0 | 0.0% |
| $15,000 to $24,999 | 49 | 2.0% |
| $25,000 to $34,999 | 101 | 4.1% |
| $35,000 to $49,999 | 346 | 14.0% |
| $50,000 to $74,999 | 422 | 17.1% |
| $75,000 to $99,999 | 506 | 20.5% |
| $100,000 to $149,999 | 486 | 19.7% |
| $150,000 to $199,999 | 326 | 13.2% |
| $200,000+ | 160 | 6.5% |
Family Income by Famaliy Size in Astoria
5-person families (189 | 7.6%) account for the highest median family income in Astoria with $89,120 per family, while 2-person families (1,461 | 59.2%) have the highest median income of $43,584 per family member.
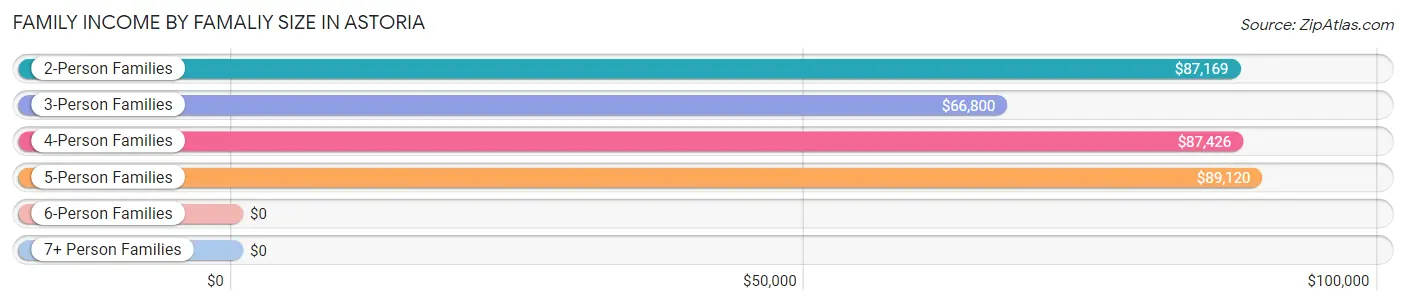
| Income Bracket | # Families | Median Income |
| 2-Person Families | 1,461 (59.2%) | $87,169 |
| 3-Person Families | 440 (17.8%) | $66,800 |
| 4-Person Families | 368 (14.9%) | $87,426 |
| 5-Person Families | 189 (7.6%) | $89,120 |
| 6-Person Families | 11 (0.4%) | $0 |
| 7+ Person Families | 0 (0.0%) | $0 |
| Total | 2,469 (100.0%) | $88,268 |
Family Income by Number of Earners in Astoria
The median family income in Astoria is $88,268, with families comprising 3+ earners (142) having the highest median family income of $128,500, while families with no earners (297) have the lowest median family income of $56,953, accounting for 5.8% and 12.0% of families, respectively.
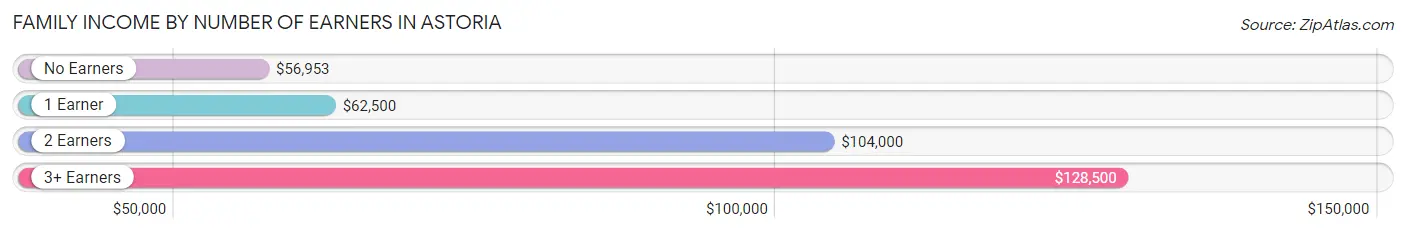
| Number of Earners | # Families | Median Income |
| No Earners | 297 (12.0%) | $56,953 |
| 1 Earner | 890 (36.0%) | $62,500 |
| 2 Earners | 1,140 (46.2%) | $104,000 |
| 3+ Earners | 142 (5.8%) | $128,500 |
| Total | 2,469 (100.0%) | $88,268 |
Household Income in Astoria
Household Income Brackets in Astoria
With 774 households falling in the category, the $50,000 to $74,999 income range is the most frequent in Astoria, accounting for 17.5% of all households. In contrast, only 133 households (3.0%) fall into the $10,000 to $14,999 income bracket, making it the least populous group.
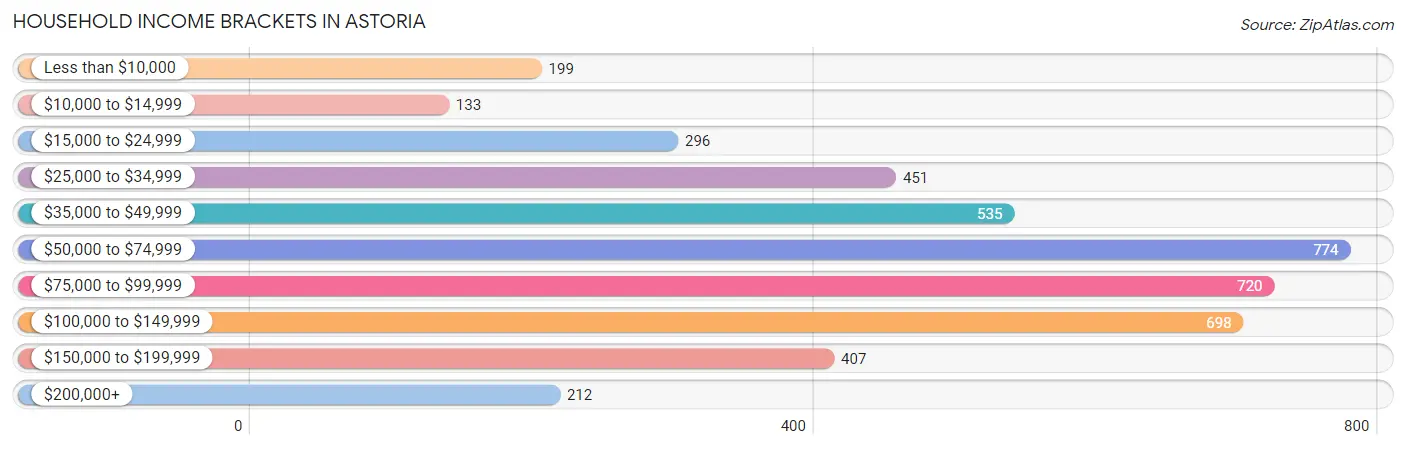
| Income Bracket | # Households | % Households |
| Less than $10,000 | 199 | 4.5% |
| $10,000 to $14,999 | 133 | 3.0% |
| $15,000 to $24,999 | 296 | 6.7% |
| $25,000 to $34,999 | 451 | 10.2% |
| $35,000 to $49,999 | 535 | 12.1% |
| $50,000 to $74,999 | 774 | 17.5% |
| $75,000 to $99,999 | 720 | 16.3% |
| $100,000 to $149,999 | 698 | 15.8% |
| $150,000 to $199,999 | 407 | 9.2% |
| $200,000+ | 212 | 4.8% |
Household Income by Householder Age in Astoria
The median household income in Astoria is $69,463, with the highest median household income of $83,724 found in the 45 to 64 years age bracket for the primary householder. A total of 1,570 households (35.5%) fall into this category. Meanwhile, the 65+ years age bracket for the primary householder has the lowest median household income of $51,161, with 1,307 households (29.6%) in this group.
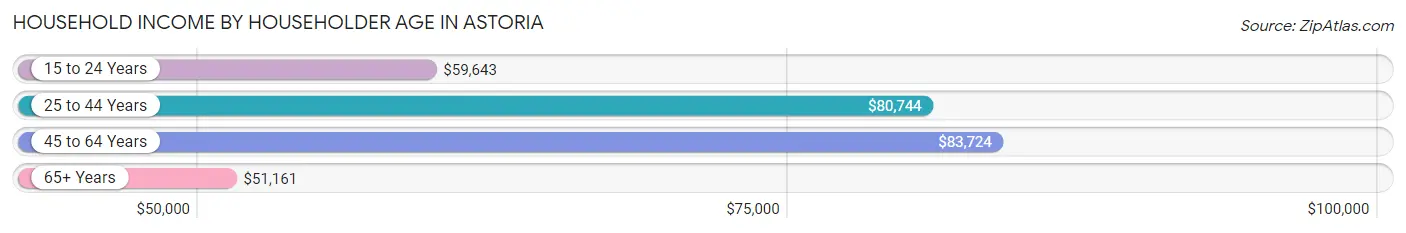
| Income Bracket | # Households | Median Income |
| 15 to 24 Years | 38 (0.9%) | $59,643 |
| 25 to 44 Years | 1,505 (34.1%) | $80,744 |
| 45 to 64 Years | 1,570 (35.5%) | $83,724 |
| 65+ Years | 1,307 (29.6%) | $51,161 |
| Total | 4,420 (100.0%) | $69,463 |
Poverty in Astoria
Income Below Poverty by Sex and Age in Astoria
With 11.0% poverty level for males and 13.2% for females among the residents of Astoria, 5 year old males and 12 to 14 year old females are the most vulnerable to poverty, with 82 males (67.8%) and 121 females (59.0%) in their respective age groups living below the poverty level.
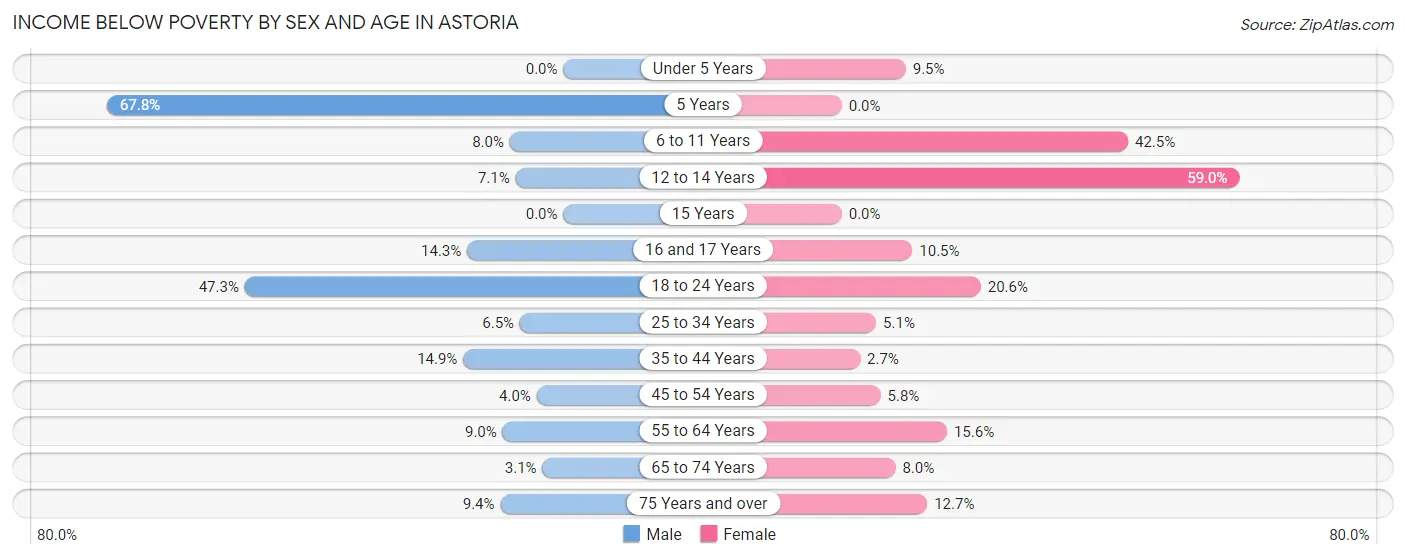
| Age Bracket | Male | Female |
| Under 5 Years | 0 (0.0%) | 19 (9.5%) |
| 5 Years | 82 (67.8%) | 0 (0.0%) |
| 6 to 11 Years | 19 (8.0%) | 119 (42.5%) |
| 12 to 14 Years | 12 (7.1%) | 121 (59.0%) |
| 15 Years | 0 (0.0%) | 0 (0.0%) |
| 16 and 17 Years | 10 (14.3%) | 11 (10.5%) |
| 18 to 24 Years | 132 (47.3%) | 71 (20.6%) |
| 25 to 34 Years | 55 (6.5%) | 32 (5.1%) |
| 35 to 44 Years | 102 (14.9%) | 21 (2.7%) |
| 45 to 54 Years | 15 (4.0%) | 27 (5.8%) |
| 55 to 64 Years | 66 (9.0%) | 152 (15.6%) |
| 65 to 74 Years | 19 (3.1%) | 51 (8.0%) |
| 75 Years and over | 26 (9.3%) | 50 (12.7%) |
| Total | 538 (11.0%) | 674 (13.2%) |
Income Above Poverty by Sex and Age in Astoria
According to the poverty statistics in Astoria, males aged under 5 years and females aged 5 years are the age groups that are most secure financially, with 100.0% of males and 100.0% of females in these age groups living above the poverty line.
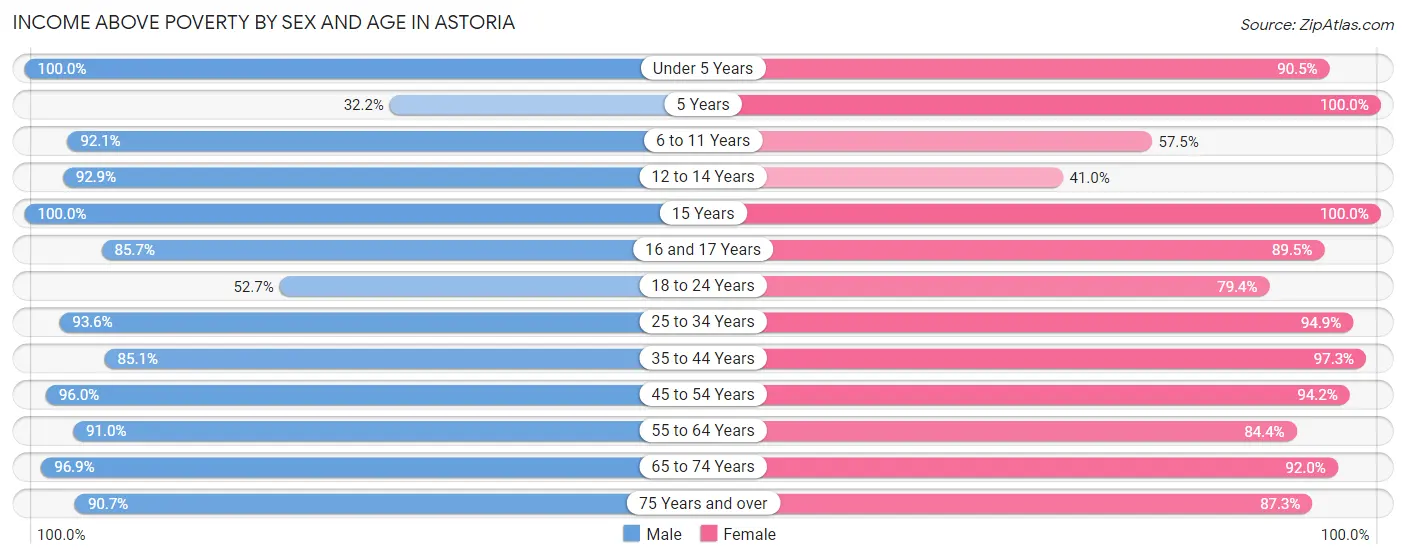
| Age Bracket | Male | Female |
| Under 5 Years | 431 (100.0%) | 181 (90.5%) |
| 5 Years | 39 (32.2%) | 68 (100.0%) |
| 6 to 11 Years | 220 (92.0%) | 161 (57.5%) |
| 12 to 14 Years | 157 (92.9%) | 84 (41.0%) |
| 15 Years | 59 (100.0%) | 47 (100.0%) |
| 16 and 17 Years | 60 (85.7%) | 94 (89.5%) |
| 18 to 24 Years | 147 (52.7%) | 273 (79.4%) |
| 25 to 34 Years | 798 (93.5%) | 596 (94.9%) |
| 35 to 44 Years | 584 (85.1%) | 750 (97.3%) |
| 45 to 54 Years | 364 (96.0%) | 442 (94.2%) |
| 55 to 64 Years | 666 (91.0%) | 821 (84.4%) |
| 65 to 74 Years | 591 (96.9%) | 589 (92.0%) |
| 75 Years and over | 252 (90.6%) | 344 (87.3%) |
| Total | 4,368 (89.0%) | 4,450 (86.9%) |
Income Below Poverty Among Married-Couple Families in Astoria
The poverty statistics for married-couple families in Astoria show that 2.6% or 49 of the total 1,860 families live below the poverty line. Families with 3 or 4 children have the highest poverty rate of 12.2%, comprising of 10 families. On the other hand, families with no children have the lowest poverty rate of 1.8%, which includes 22 families.
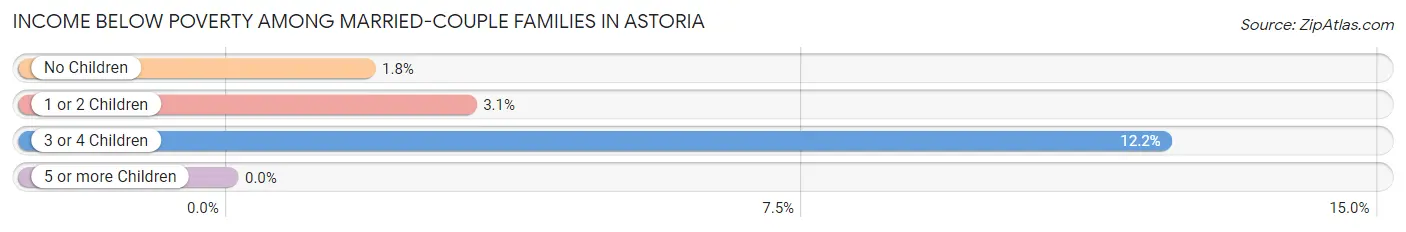
| Children | Above Poverty | Below Poverty |
| No Children | 1,209 (98.2%) | 22 (1.8%) |
| 1 or 2 Children | 530 (96.9%) | 17 (3.1%) |
| 3 or 4 Children | 72 (87.8%) | 10 (12.2%) |
| 5 or more Children | 0 (0.0%) | 0 (0.0%) |
| Total | 1,811 (97.4%) | 49 (2.6%) |
Income Below Poverty Among Single-Parent Households in Astoria
According to the poverty data in Astoria, 8.2% or 14 single-father households and 4.3% or 19 single-mother households are living below the poverty line. Among single-father households, those with 1 or 2 children have the highest poverty rate, with 14 households (13.7%) experiencing poverty. Likewise, among single-mother households, those with no children have the highest poverty rate, with 19 households (8.1%) falling below the poverty line.
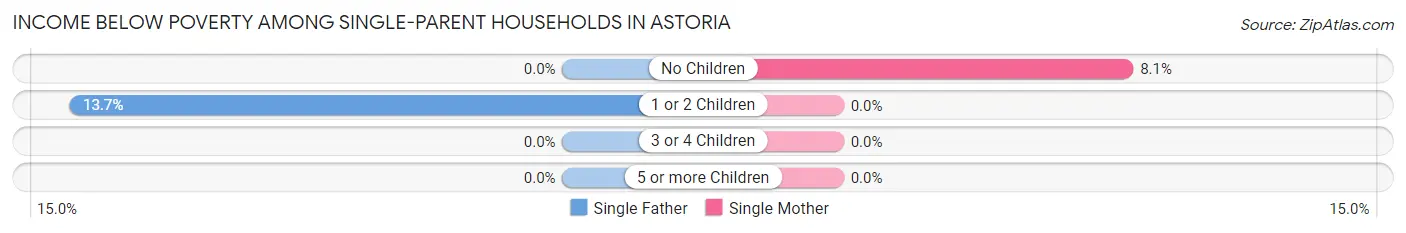
| Children | Single Father | Single Mother |
| No Children | 0 (0.0%) | 19 (8.1%) |
| 1 or 2 Children | 14 (13.7%) | 0 (0.0%) |
| 3 or 4 Children | 0 (0.0%) | 0 (0.0%) |
| 5 or more Children | 0 (0.0%) | 0 (0.0%) |
| Total | 14 (8.2%) | 19 (4.3%) |
Income Below Poverty Among Married-Couple vs Single-Parent Households in Astoria
The poverty data for Astoria shows that 49 of the married-couple family households (2.6%) and 33 of the single-parent households (5.4%) are living below the poverty level. Within the married-couple family households, those with 3 or 4 children have the highest poverty rate, with 10 households (12.2%) falling below the poverty line. Among the single-parent households, those with no children have the highest poverty rate, with 19 household (6.3%) living below poverty.
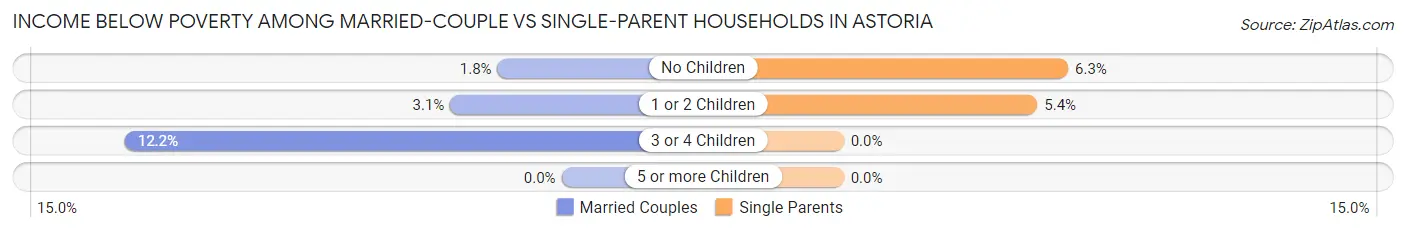
| Children | Married-Couple Families | Single-Parent Households |
| No Children | 22 (1.8%) | 19 (6.3%) |
| 1 or 2 Children | 17 (3.1%) | 14 (5.4%) |
| 3 or 4 Children | 10 (12.2%) | 0 (0.0%) |
| 5 or more Children | 0 (0.0%) | 0 (0.0%) |
| Total | 49 (2.6%) | 33 (5.4%) |
Race in Astoria
The most populous races in Astoria are White / Caucasian (8,788 | 86.3%), Hispanic or Latino (1,351 | 13.3%), and Two or more Races (803 | 7.9%).
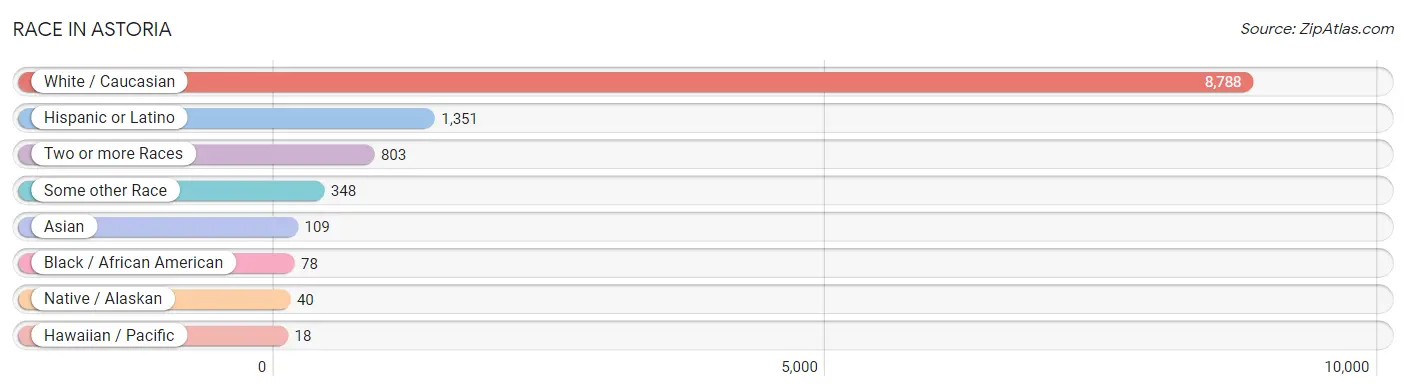
| Race | # Population | % Population |
| Asian | 109 | 1.1% |
| Black / African American | 78 | 0.8% |
| Hawaiian / Pacific | 18 | 0.2% |
| Hispanic or Latino | 1,351 | 13.3% |
| Native / Alaskan | 40 | 0.4% |
| White / Caucasian | 8,788 | 86.3% |
| Two or more Races | 803 | 7.9% |
| Some other Race | 348 | 3.4% |
| Total | 10,184 | 100.0% |
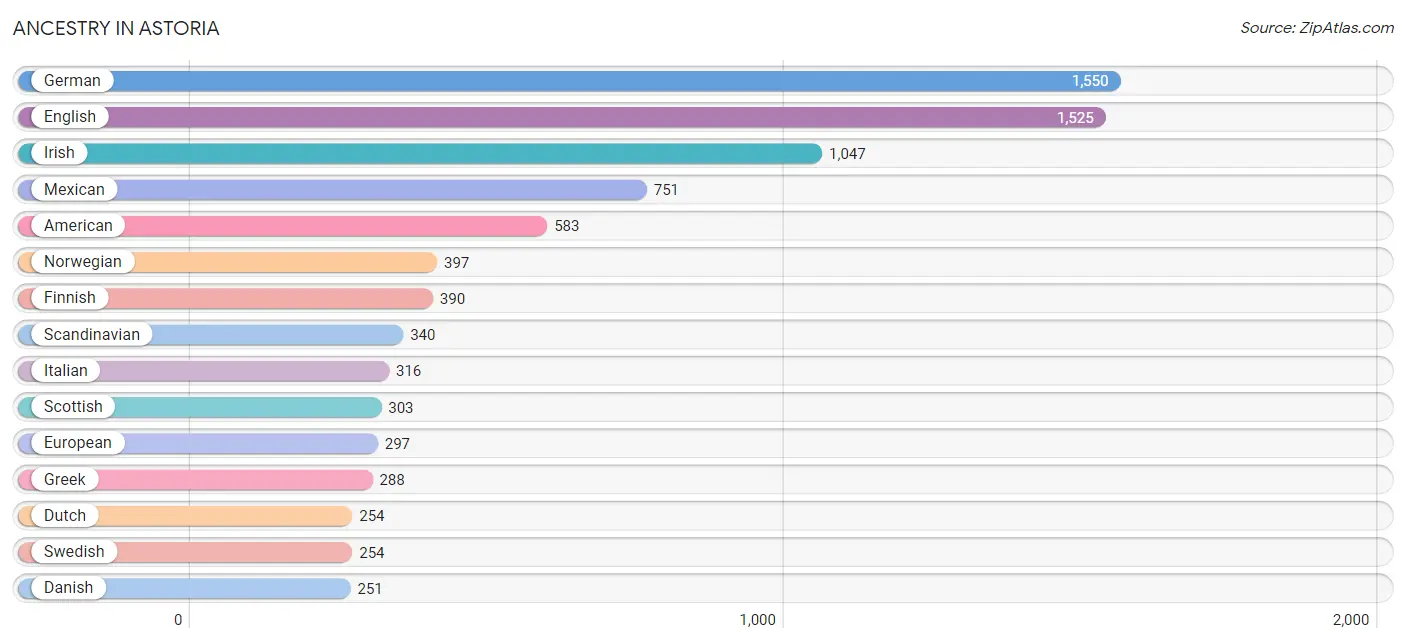
Ancestry in Astoria
The most populous ancestries reported in Astoria are German (1,550 | 15.2%), English (1,525 | 15.0%), Irish (1,047 | 10.3%), Mexican (751 | 7.4%), and American (583 | 5.7%), together accounting for 53.6% of all Astoria residents.
| Ancestry | # Population | % Population |
| African | 4 | 0.0% |
| American | 583 | 5.7% |
| Arab | 7 | 0.1% |
| Armenian | 42 | 0.4% |
| Australian | 18 | 0.2% |
| Austrian | 21 | 0.2% |
| Basque | 7 | 0.1% |
| Belgian | 20 | 0.2% |
| Bhutanese | 62 | 0.6% |
| British | 65 | 0.6% |
| Burmese | 29 | 0.3% |
| Cajun | 61 | 0.6% |
| Canadian | 66 | 0.6% |
| Central American | 58 | 0.6% |
| Cherokee | 26 | 0.3% |
| Chilean | 43 | 0.4% |
| Chippewa | 25 | 0.3% |
| Colombian | 40 | 0.4% |
| Creek | 15 | 0.2% |
| Croatian | 5 | 0.1% |
| Cuban | 12 | 0.1% |
| Czech | 28 | 0.3% |
| Danish | 251 | 2.5% |
| Dominican | 37 | 0.4% |
| Dutch | 254 | 2.5% |
| Eastern European | 44 | 0.4% |
| Egyptian | 7 | 0.1% |
| English | 1,525 | 15.0% |
| European | 297 | 2.9% |
| Finnish | 390 | 3.8% |
| French | 247 | 2.4% |
| French Canadian | 83 | 0.8% |
| German | 1,550 | 15.2% |
| German Russian | 9 | 0.1% |
| Greek | 288 | 2.8% |
| Hungarian | 7 | 0.1% |
| Indian (Asian) | 91 | 0.9% |
| Iranian | 36 | 0.4% |
| Irish | 1,047 | 10.3% |
| Italian | 316 | 3.1% |
| Korean | 119 | 1.2% |
| Laotian | 12 | 0.1% |
| Lithuanian | 11 | 0.1% |
| Mexican | 751 | 7.4% |
| Native Hawaiian | 34 | 0.3% |
| New Zealander | 13 | 0.1% |
| Nicaraguan | 58 | 0.6% |
| Northern European | 38 | 0.4% |
| Norwegian | 397 | 3.9% |
| Osage | 1 | 0.0% |
| Pakistani | 81 | 0.8% |
| Polish | 159 | 1.6% |
| Portuguese | 54 | 0.5% |
| Romanian | 4 | 0.0% |
| Russian | 43 | 0.4% |
| Scandinavian | 340 | 3.3% |
| Scotch-Irish | 151 | 1.5% |
| Scottish | 303 | 3.0% |
| Seminole | 12 | 0.1% |
| Sioux | 13 | 0.1% |
| Slavic | 60 | 0.6% |
| South American | 83 | 0.8% |
| Spaniard | 16 | 0.2% |
| Spanish | 39 | 0.4% |
| Subsaharan African | 4 | 0.0% |
| Swedish | 254 | 2.5% |
| Thai | 43 | 0.4% |
| Ukrainian | 70 | 0.7% |
| Welsh | 80 | 0.8% |
| Yugoslavian | 25 | 0.3% | View All 70 Rows |
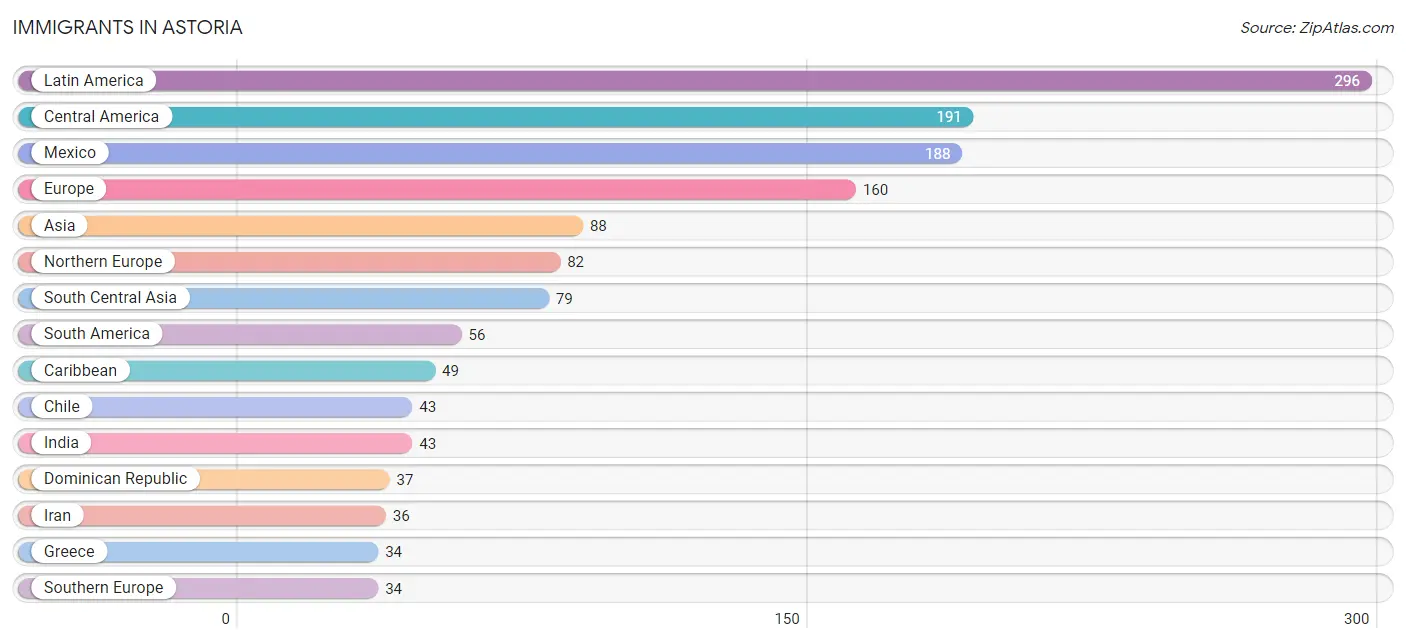
Immigrants in Astoria
The most numerous immigrant groups reported in Astoria came from Latin America (296 | 2.9%), Central America (191 | 1.9%), Mexico (188 | 1.8%), Europe (160 | 1.6%), and Asia (88 | 0.9%), together accounting for 9.1% of all Astoria residents.
| Immigration Origin | # Population | % Population |
| Africa | 17 | 0.2% |
| Asia | 88 | 0.9% |
| Australia | 18 | 0.2% |
| Cabo Verde | 17 | 0.2% |
| Canada | 9 | 0.1% |
| Caribbean | 49 | 0.5% |
| Central America | 191 | 1.9% |
| Chile | 43 | 0.4% |
| China | 2 | 0.0% |
| Colombia | 13 | 0.1% |
| Cuba | 12 | 0.1% |
| Dominican Republic | 37 | 0.4% |
| Eastern Asia | 9 | 0.1% |
| Eastern Europe | 25 | 0.3% |
| England | 17 | 0.2% |
| Europe | 160 | 1.6% |
| Germany | 19 | 0.2% |
| Greece | 34 | 0.3% |
| India | 43 | 0.4% |
| Iran | 36 | 0.4% |
| Korea | 7 | 0.1% |
| Latin America | 296 | 2.9% |
| Mexico | 188 | 1.8% |
| Nicaragua | 3 | 0.0% |
| Northern Europe | 82 | 0.8% |
| Oceania | 18 | 0.2% |
| Poland | 10 | 0.1% |
| Scotland | 17 | 0.2% |
| South America | 56 | 0.5% |
| South Central Asia | 79 | 0.8% |
| Southern Europe | 34 | 0.3% |
| Sweden | 28 | 0.3% |
| Ukraine | 15 | 0.2% |
| Western Africa | 17 | 0.2% |
| Western Europe | 19 | 0.2% | View All 35 Rows |
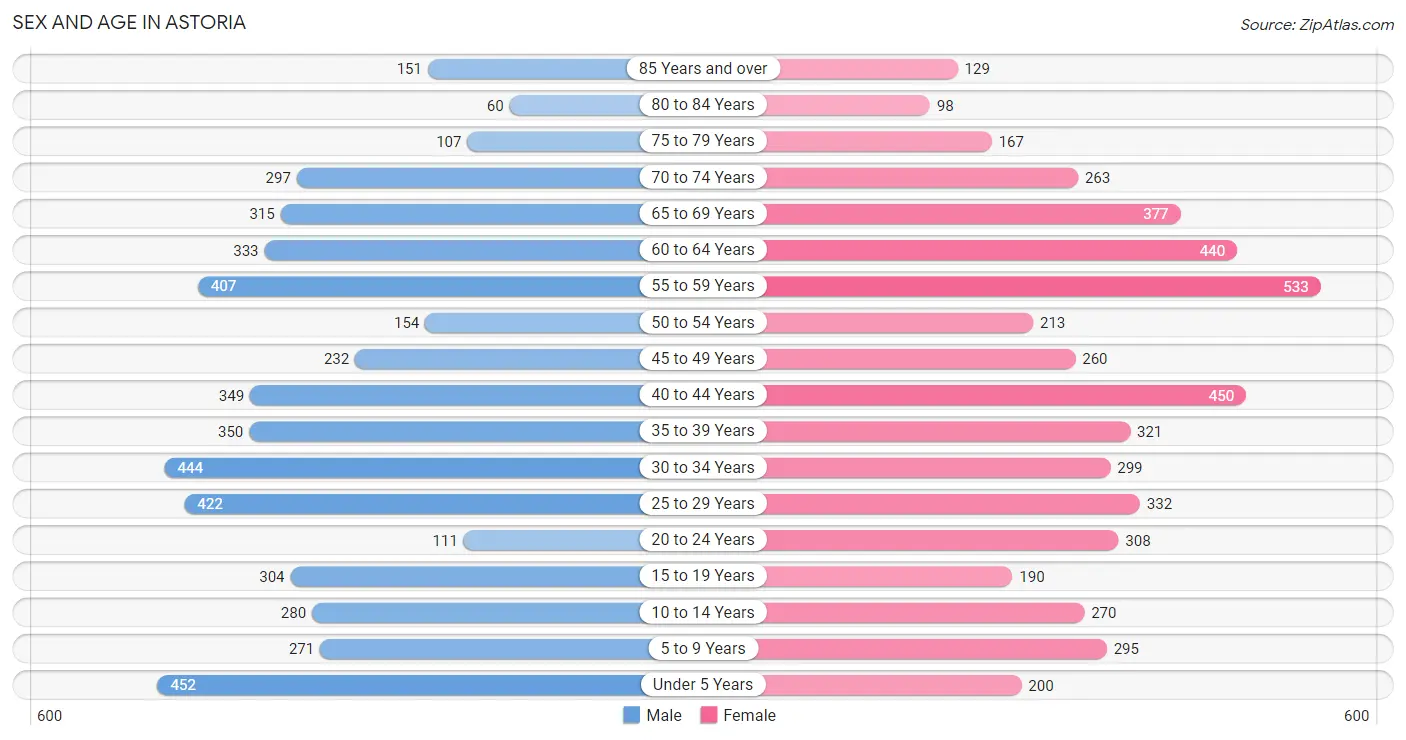
Sex and Age in Astoria
Sex and Age in Astoria
The most populous age groups in Astoria are Under 5 Years (452 | 9.0%) for men and 55 to 59 Years (533 | 10.4%) for women.
| Age Bracket | Male | Female |
| Under 5 Years | 452 (9.0%) | 200 (3.9%) |
| 5 to 9 Years | 271 (5.4%) | 295 (5.7%) |
| 10 to 14 Years | 280 (5.6%) | 270 (5.2%) |
| 15 to 19 Years | 304 (6.0%) | 190 (3.7%) |
| 20 to 24 Years | 111 (2.2%) | 308 (6.0%) |
| 25 to 29 Years | 422 (8.4%) | 332 (6.5%) |
| 30 to 34 Years | 444 (8.8%) | 299 (5.8%) |
| 35 to 39 Years | 350 (7.0%) | 321 (6.2%) |
| 40 to 44 Years | 349 (6.9%) | 450 (8.7%) |
| 45 to 49 Years | 232 (4.6%) | 260 (5.1%) |
| 50 to 54 Years | 154 (3.1%) | 213 (4.1%) |
| 55 to 59 Years | 407 (8.1%) | 533 (10.4%) |
| 60 to 64 Years | 333 (6.6%) | 440 (8.6%) |
| 65 to 69 Years | 315 (6.2%) | 377 (7.3%) |
| 70 to 74 Years | 297 (5.9%) | 263 (5.1%) |
| 75 to 79 Years | 107 (2.1%) | 167 (3.3%) |
| 80 to 84 Years | 60 (1.2%) | 98 (1.9%) |
| 85 Years and over | 151 (3.0%) | 129 (2.5%) |
| Total | 5,039 (100.0%) | 5,145 (100.0%) |
Families and Households in Astoria
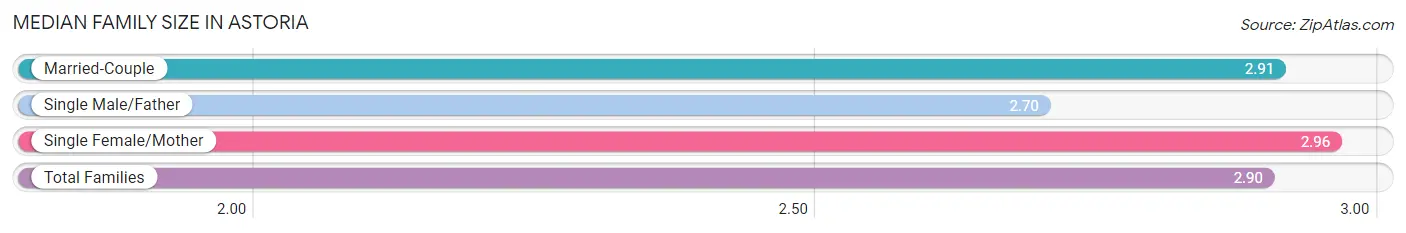
Median Family Size in Astoria
The median family size in Astoria is 2.90 persons per family, with single female/mother families (439 | 17.8%) accounting for the largest median family size of 2.96 persons per family. On the other hand, single male/father families (170 | 6.9%) represent the smallest median family size with 2.70 persons per family.
| Family Type | # Families | Family Size |
| Married-Couple | 1,860 (75.3%) | 2.91 |
| Single Male/Father | 170 (6.9%) | 2.70 |
| Single Female/Mother | 439 (17.8%) | 2.96 |
| Total Families | 2,469 (100.0%) | 2.90 |
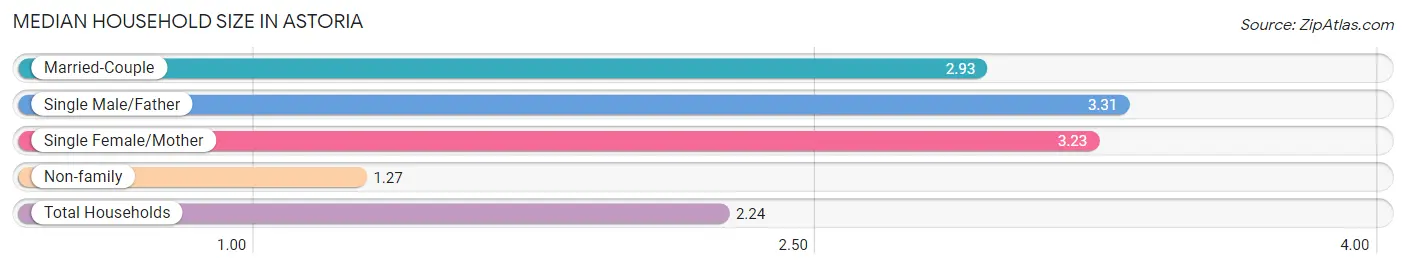
Median Household Size in Astoria
The median household size in Astoria is 2.24 persons per household, with single male/father households (170 | 3.8%) accounting for the largest median household size of 3.31 persons per household. non-family households (1,951 | 44.1%) represent the smallest median household size with 1.27 persons per household.
| Household Type | # Households | Household Size |
| Married-Couple | 1,860 (42.1%) | 2.93 |
| Single Male/Father | 170 (3.8%) | 3.31 |
| Single Female/Mother | 439 (9.9%) | 3.23 |
| Non-family | 1,951 (44.1%) | 1.27 |
| Total Households | 4,420 (100.0%) | 2.24 |
Household Size by Marriage Status in Astoria
Out of a total of 4,420 households in Astoria, 2,469 (55.9%) are family households, while 1,951 (44.1%) are nonfamily households. The most numerous type of family households are 2-person households, comprising 1,387, and the most common type of nonfamily households are 1-person households, comprising 1,534.
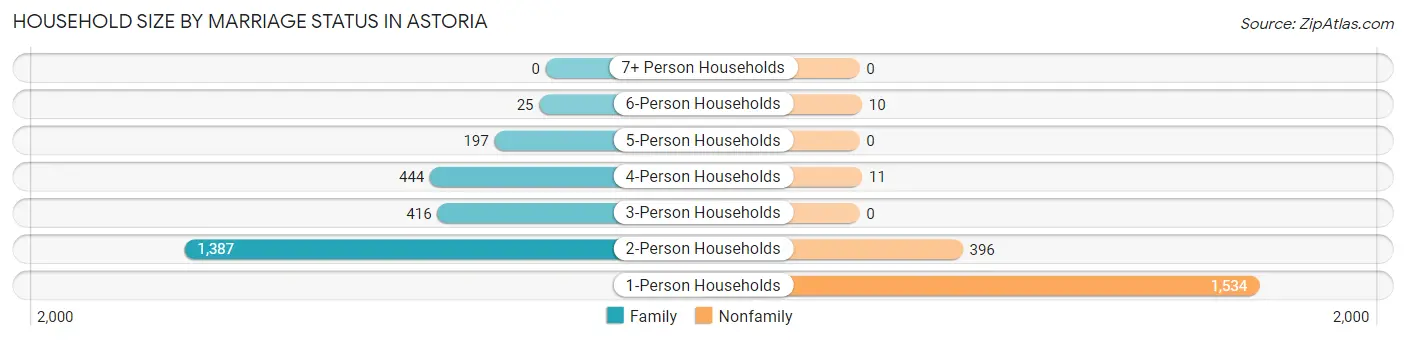
| Household Size | Family Households | Nonfamily Households |
| 1-Person Households | - | 1,534 (34.7%) |
| 2-Person Households | 1,387 (31.4%) | 396 (9.0%) |
| 3-Person Households | 416 (9.4%) | 0 (0.0%) |
| 4-Person Households | 444 (10.1%) | 11 (0.3%) |
| 5-Person Households | 197 (4.5%) | 0 (0.0%) |
| 6-Person Households | 25 (0.6%) | 10 (0.2%) |
| 7+ Person Households | 0 (0.0%) | 0 (0.0%) |
| Total | 2,469 (55.9%) | 1,951 (44.1%) |
Female Fertility in Astoria
Fertility by Age in Astoria
Average fertility rate in Astoria is 45.0 births per 1,000 women. Women in the age bracket of 20 to 34 years have the highest fertility rate with 78.0 births per 1,000 women. Women in the age bracket of 20 to 34 years acount for 74.5% of all women with births.
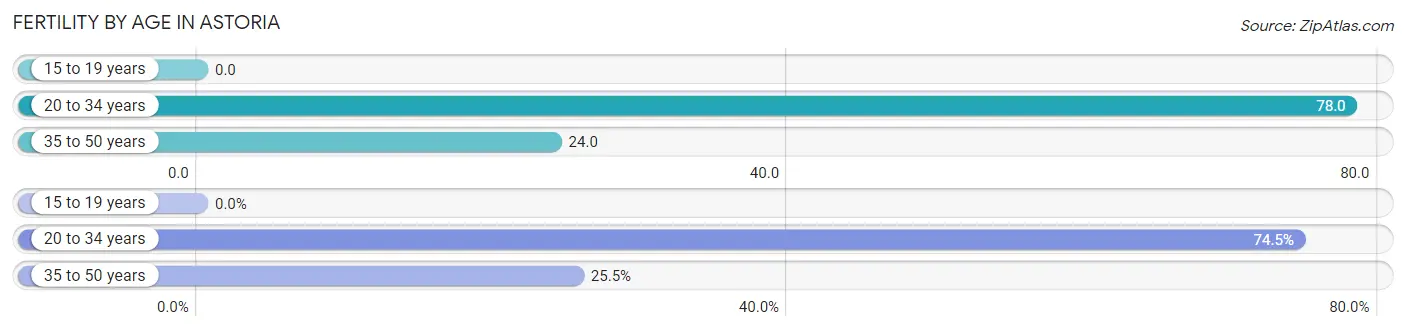
| Age Bracket | Women with Births | Births / 1,000 Women |
| 15 to 19 years | 0 (0.0%) | 0.0 |
| 20 to 34 years | 73 (74.5%) | 78.0 |
| 35 to 50 years | 25 (25.5%) | 24.0 |
| Total | 98 (100.0%) | 45.0 |
Fertility by Age by Marriage Status in Astoria
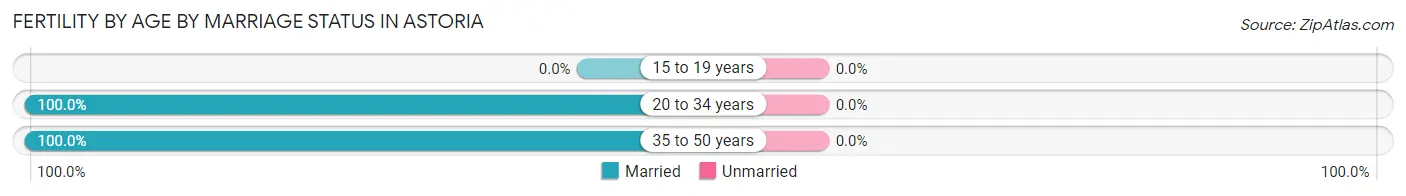
| Age Bracket | Married | Unmarried |
| 15 to 19 years | 0 (0.0%) | 0 (0.0%) |
| 20 to 34 years | 73 (100.0%) | 0 (0.0%) |
| 35 to 50 years | 25 (100.0%) | 0 (0.0%) |
| Total | 98 (100.0%) | 0 (0.0%) |
Fertility by Education in Astoria
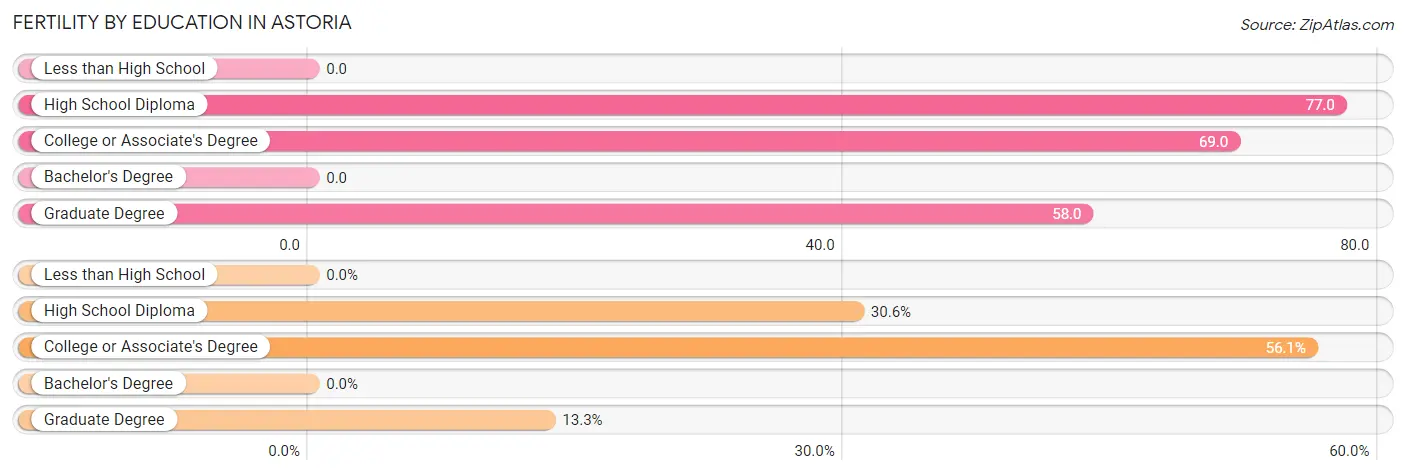
| Educational Attainment | Women with Births | Births / 1,000 Women |
| Less than High School | 0 (0.0%) | 0.0 |
| High School Diploma | 30 (30.6%) | 77.0 |
| College or Associate's Degree | 55 (56.1%) | 69.0 |
| Bachelor's Degree | 0 (0.0%) | 0.0 |
| Graduate Degree | 13 (13.3%) | 58.0 |
| Total | 98 (100.0%) | 45.0 |
Fertility by Education by Marriage Status in Astoria
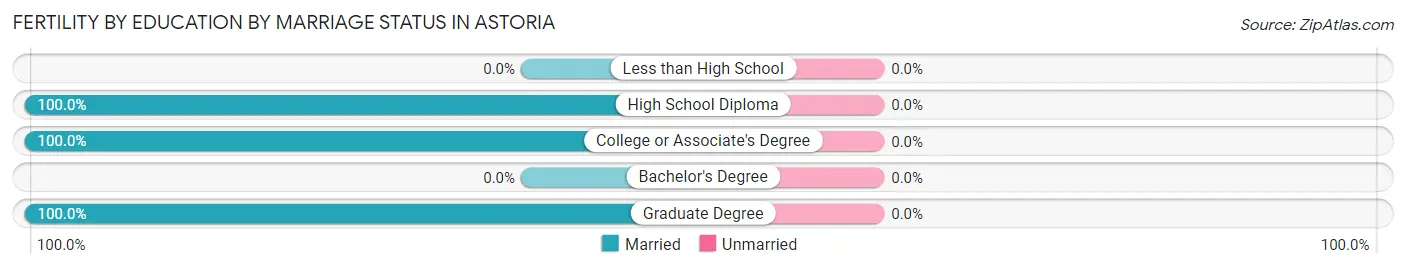
| Educational Attainment | Married | Unmarried |
| Less than High School | 0 (0.0%) | 0 (0.0%) |
| High School Diploma | 30 (100.0%) | 0 (0.0%) |
| College or Associate's Degree | 55 (100.0%) | 0 (0.0%) |
| Bachelor's Degree | 0 (0.0%) | 0 (0.0%) |
| Graduate Degree | 13 (100.0%) | 0 (0.0%) |
| Total | 98 (100.0%) | 0 (0.0%) |
Employment Characteristics in Astoria
Employment by Class of Employer in Astoria
Among the 4,609 employed individuals in Astoria, private company employees (2,752 | 59.7%), not-for-profit organizations (539 | 11.7%), and self-employed (not incorporated) (331 | 7.2%) make up the most common classes of employment.
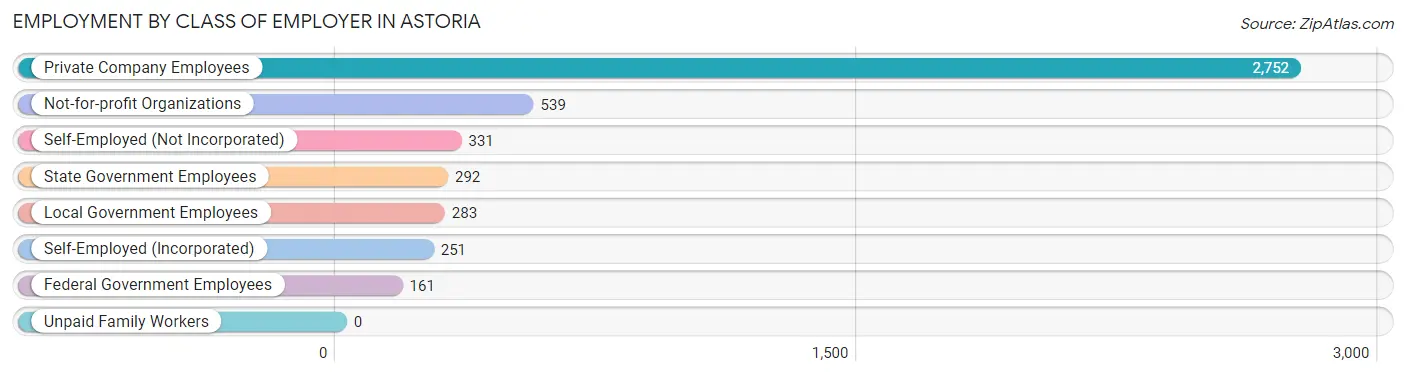
| Employer Class | # Employees | % Employees |
| Private Company Employees | 2,752 | 59.7% |
| Self-Employed (Incorporated) | 251 | 5.4% |
| Self-Employed (Not Incorporated) | 331 | 7.2% |
| Not-for-profit Organizations | 539 | 11.7% |
| Local Government Employees | 283 | 6.1% |
| State Government Employees | 292 | 6.3% |
| Federal Government Employees | 161 | 3.5% |
| Unpaid Family Workers | 0 | 0.0% |
| Total | 4,609 | 100.0% |
Employment Status by Age in Astoria
According to the labor force statistics for Astoria, out of the total population over 16 years of age (8,310), 61.1% or 5,077 individuals are in the labor force, with 3.8% or 193 of them unemployed. The age group with the highest labor force participation rate is 30 to 34 years, with 90.0% or 669 individuals in the labor force. Within the labor force, the 20 to 24 years age range has the highest percentage of unemployed individuals, with 33.5% or 102 of them being unemployed.
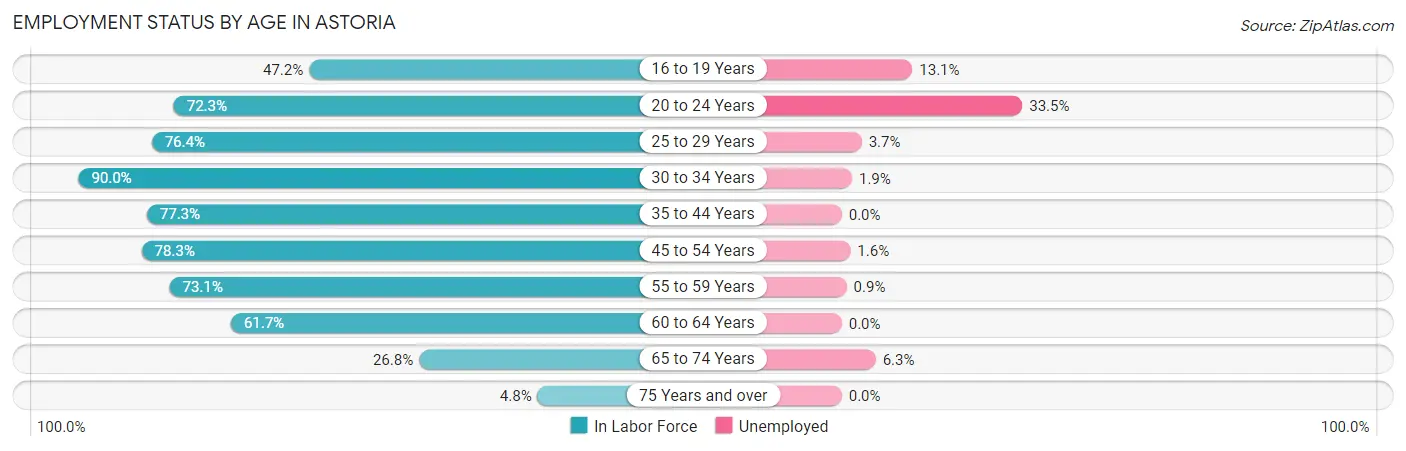
| Age Bracket | In Labor Force | Unemployed |
| 16 to 19 Years | 183 (47.2%) | 24 (13.1%) |
| 20 to 24 Years | 303 (72.3%) | 102 (33.5%) |
| 25 to 29 Years | 576 (76.4%) | 21 (3.7%) |
| 30 to 34 Years | 669 (90.0%) | 13 (1.9%) |
| 35 to 44 Years | 1,136 (77.3%) | 0 (0.0%) |
| 45 to 54 Years | 673 (78.3%) | 11 (1.6%) |
| 55 to 59 Years | 687 (73.1%) | 6 (0.9%) |
| 60 to 64 Years | 477 (61.7%) | 0 (0.0%) |
| 65 to 74 Years | 336 (26.8%) | 21 (6.3%) |
| 75 Years and over | 34 (4.8%) | 0 (0.0%) |
| Total | 5,077 (61.1%) | 193 (3.8%) |
Employment Status by Educational Attainment in Astoria
According to labor force statistics for Astoria, 76.2% of individuals (4,221) out of the total population between 25 and 64 years of age (5,539) are in the labor force, with 1.2% or 51 of them being unemployed. The group with the highest labor force participation rate are those with the educational attainment of college / associate degree, with 81.9% or 1,812 individuals in the labor force. Within the labor force, individuals with high school diploma education have the highest percentage of unemployment, with 5.8% or 39 of them being unemployed.
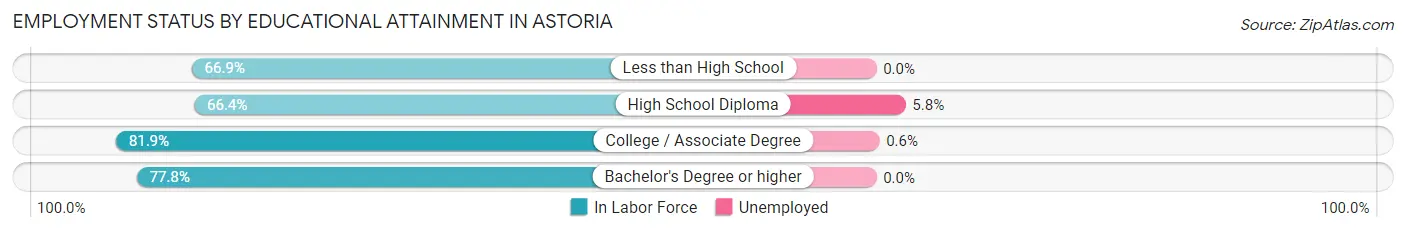
| Educational Attainment | In Labor Force | Unemployed |
| Less than High School | 397 (66.9%) | 0 (0.0%) |
| High School Diploma | 679 (66.4%) | 59 (5.8%) |
| College / Associate Degree | 1,812 (81.9%) | 13 (0.6%) |
| Bachelor's Degree or higher | 1,331 (77.8%) | 0 (0.0%) |
| Total | 4,221 (76.2%) | 66 (1.2%) |
Employment Occupations by Sex in Astoria
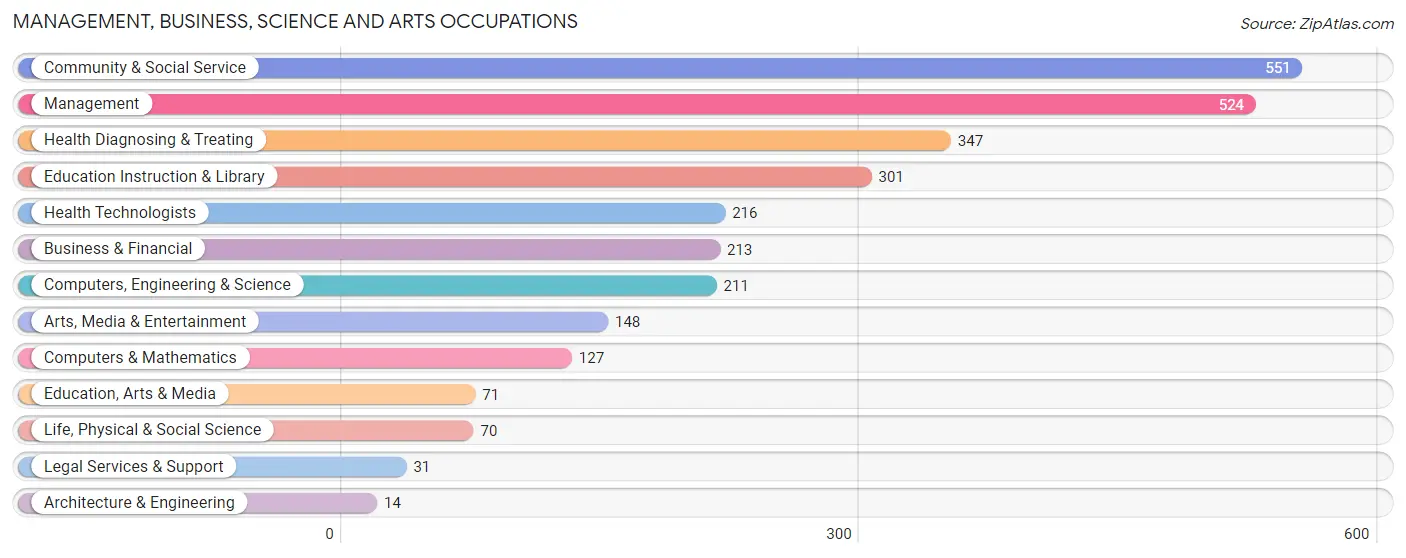
Management, Business, Science and Arts Occupations
The most common Management, Business, Science and Arts occupations in Astoria are Community & Social Service (551 | 11.6%), Management (524 | 11.0%), Health Diagnosing & Treating (347 | 7.3%), Education Instruction & Library (301 | 6.3%), and Health Technologists (216 | 4.5%).
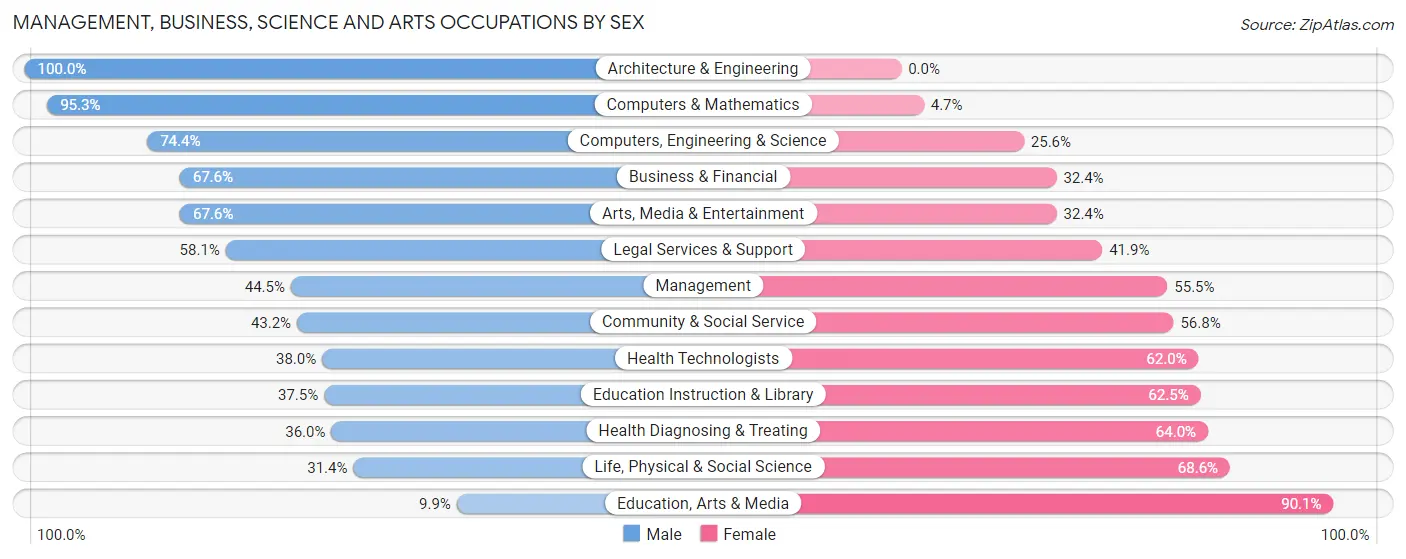
Management, Business, Science and Arts Occupations by Sex
Within the Management, Business, Science and Arts occupations in Astoria, the most male-oriented occupations are Architecture & Engineering (100.0%), Computers & Mathematics (95.3%), and Computers, Engineering & Science (74.4%), while the most female-oriented occupations are Education, Arts & Media (90.1%), Life, Physical & Social Science (68.6%), and Health Diagnosing & Treating (64.0%).
| Occupation | Male | Female |
| Management | 233 (44.5%) | 291 (55.5%) |
| Business & Financial | 144 (67.6%) | 69 (32.4%) |
| Computers, Engineering & Science | 157 (74.4%) | 54 (25.6%) |
| Computers & Mathematics | 121 (95.3%) | 6 (4.7%) |
| Architecture & Engineering | 14 (100.0%) | 0 (0.0%) |
| Life, Physical & Social Science | 22 (31.4%) | 48 (68.6%) |
| Community & Social Service | 238 (43.2%) | 313 (56.8%) |
| Education, Arts & Media | 7 (9.9%) | 64 (90.1%) |
| Legal Services & Support | 18 (58.1%) | 13 (41.9%) |
| Education Instruction & Library | 113 (37.5%) | 188 (62.5%) |
| Arts, Media & Entertainment | 100 (67.6%) | 48 (32.4%) |
| Health Diagnosing & Treating | 125 (36.0%) | 222 (64.0%) |
| Health Technologists | 82 (38.0%) | 134 (62.0%) |
| Total (Category) | 897 (48.6%) | 949 (51.4%) |
| Total (Overall) | 2,470 (51.9%) | 2,285 (48.0%) |
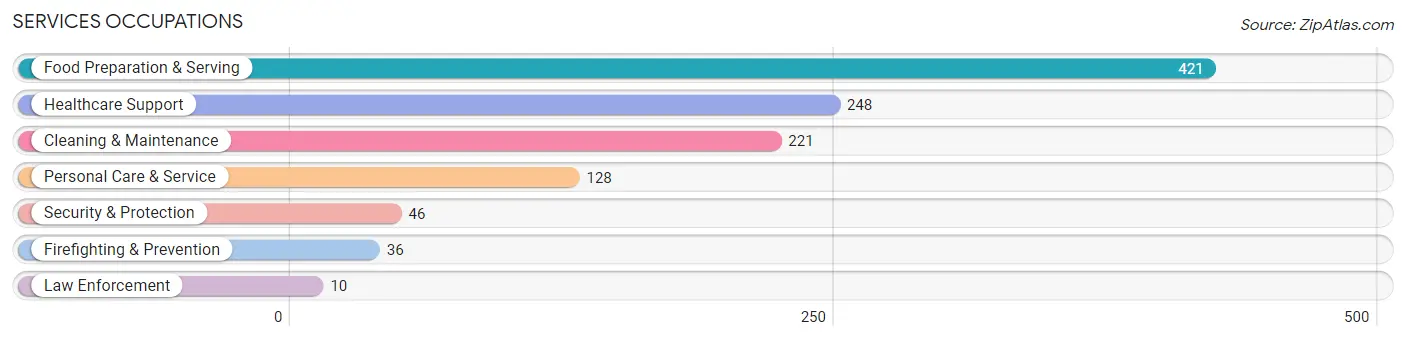
Services Occupations
The most common Services occupations in Astoria are Food Preparation & Serving (421 | 8.8%), Healthcare Support (248 | 5.2%), Cleaning & Maintenance (221 | 4.6%), Personal Care & Service (128 | 2.7%), and Security & Protection (46 | 1.0%).
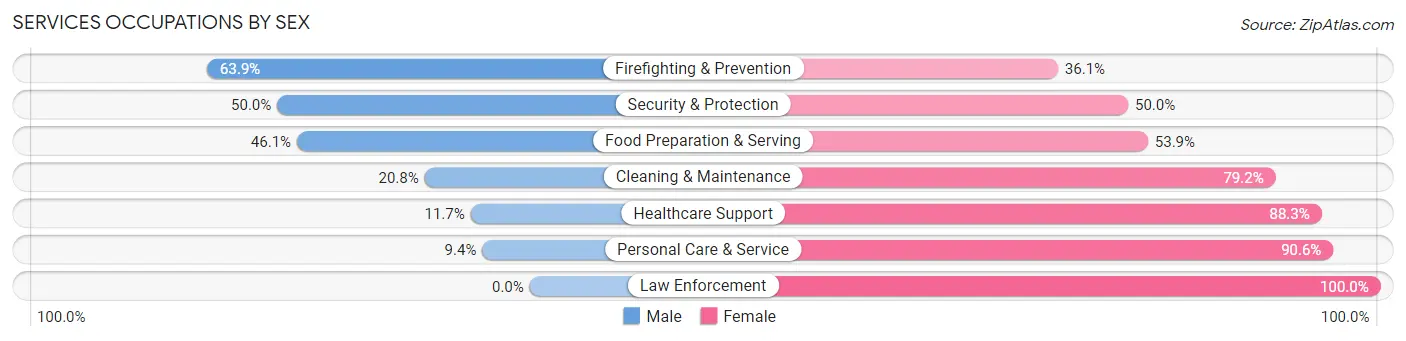
Services Occupations by Sex
Within the Services occupations in Astoria, the most male-oriented occupations are Firefighting & Prevention (63.9%), Security & Protection (50.0%), and Food Preparation & Serving (46.1%), while the most female-oriented occupations are Law Enforcement (100.0%), Personal Care & Service (90.6%), and Healthcare Support (88.3%).
| Occupation | Male | Female |
| Healthcare Support | 29 (11.7%) | 219 (88.3%) |
| Security & Protection | 23 (50.0%) | 23 (50.0%) |
| Firefighting & Prevention | 23 (63.9%) | 13 (36.1%) |
| Law Enforcement | 0 (0.0%) | 10 (100.0%) |
| Food Preparation & Serving | 194 (46.1%) | 227 (53.9%) |
| Cleaning & Maintenance | 46 (20.8%) | 175 (79.2%) |
| Personal Care & Service | 12 (9.4%) | 116 (90.6%) |
| Total (Category) | 304 (28.6%) | 760 (71.4%) |
| Total (Overall) | 2,470 (51.9%) | 2,285 (48.0%) |
Sales and Office Occupations
The most common Sales and Office occupations in Astoria are Sales & Related (626 | 13.2%), and Office & Administration (391 | 8.2%).

Sales and Office Occupations by Sex
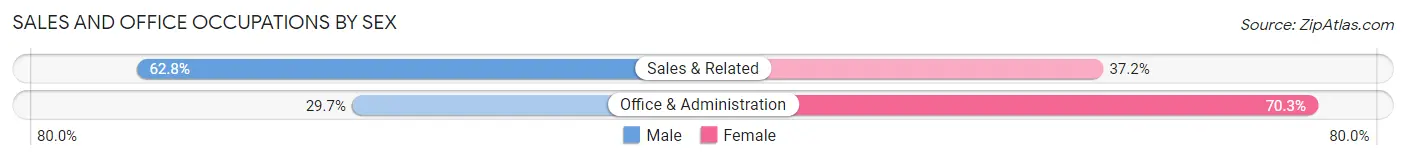
| Occupation | Male | Female |
| Sales & Related | 393 (62.8%) | 233 (37.2%) |
| Office & Administration | 116 (29.7%) | 275 (70.3%) |
| Total (Category) | 509 (50.0%) | 508 (49.9%) |
| Total (Overall) | 2,470 (51.9%) | 2,285 (48.0%) |
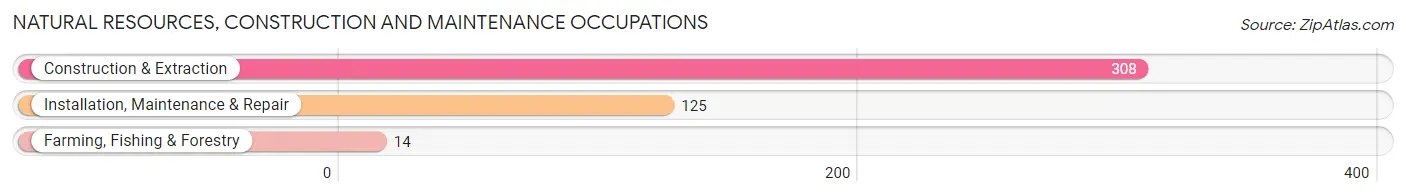
Natural Resources, Construction and Maintenance Occupations
The most common Natural Resources, Construction and Maintenance occupations in Astoria are Construction & Extraction (308 | 6.5%), Installation, Maintenance & Repair (125 | 2.6%), and Farming, Fishing & Forestry (14 | 0.3%).
Natural Resources, Construction and Maintenance Occupations by Sex
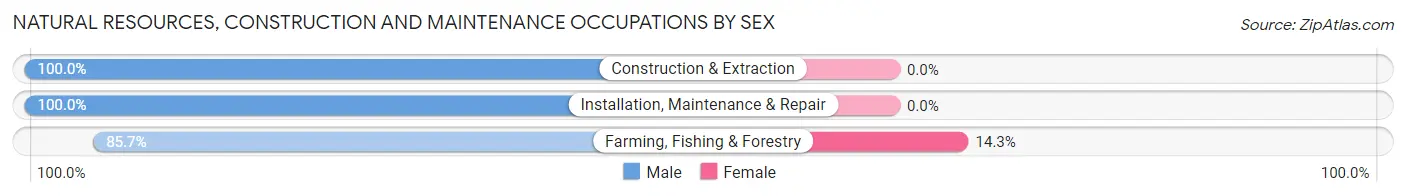
| Occupation | Male | Female |
| Farming, Fishing & Forestry | 12 (85.7%) | 2 (14.3%) |
| Construction & Extraction | 308 (100.0%) | 0 (0.0%) |
| Installation, Maintenance & Repair | 125 (100.0%) | 0 (0.0%) |
| Total (Category) | 445 (99.6%) | 2 (0.4%) |
| Total (Overall) | 2,470 (51.9%) | 2,285 (48.0%) |
Production, Transportation and Moving Occupations
The most common Production, Transportation and Moving occupations in Astoria are Transportation (208 | 4.4%), Production (109 | 2.3%), and Material Moving (64 | 1.3%).
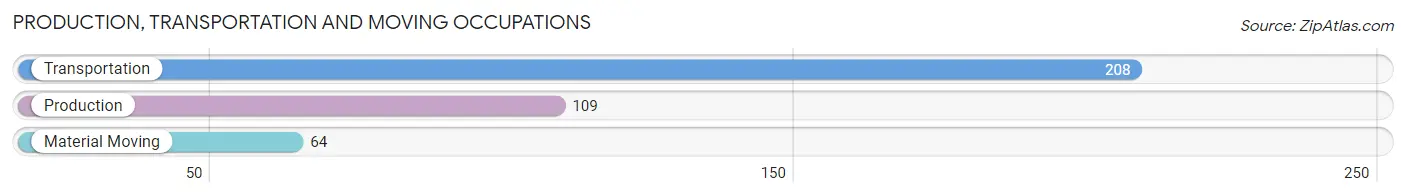
Production, Transportation and Moving Occupations by Sex
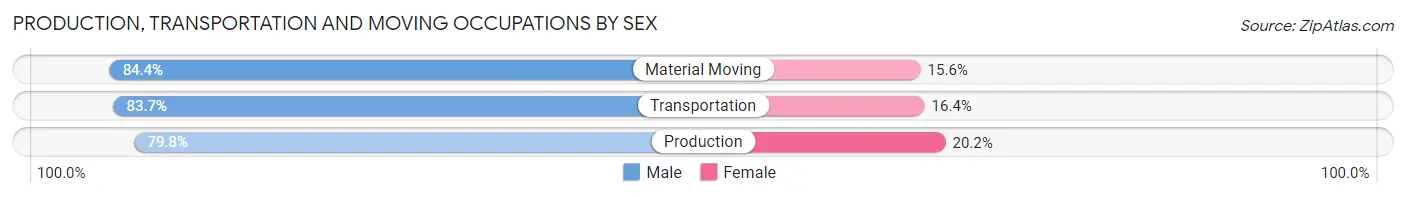
| Occupation | Male | Female |
| Production | 87 (79.8%) | 22 (20.2%) |
| Transportation | 174 (83.7%) | 34 (16.4%) |
| Material Moving | 54 (84.4%) | 10 (15.6%) |
| Total (Category) | 315 (82.7%) | 66 (17.3%) |
| Total (Overall) | 2,470 (51.9%) | 2,285 (48.0%) |
Employment Industries by Sex in Astoria
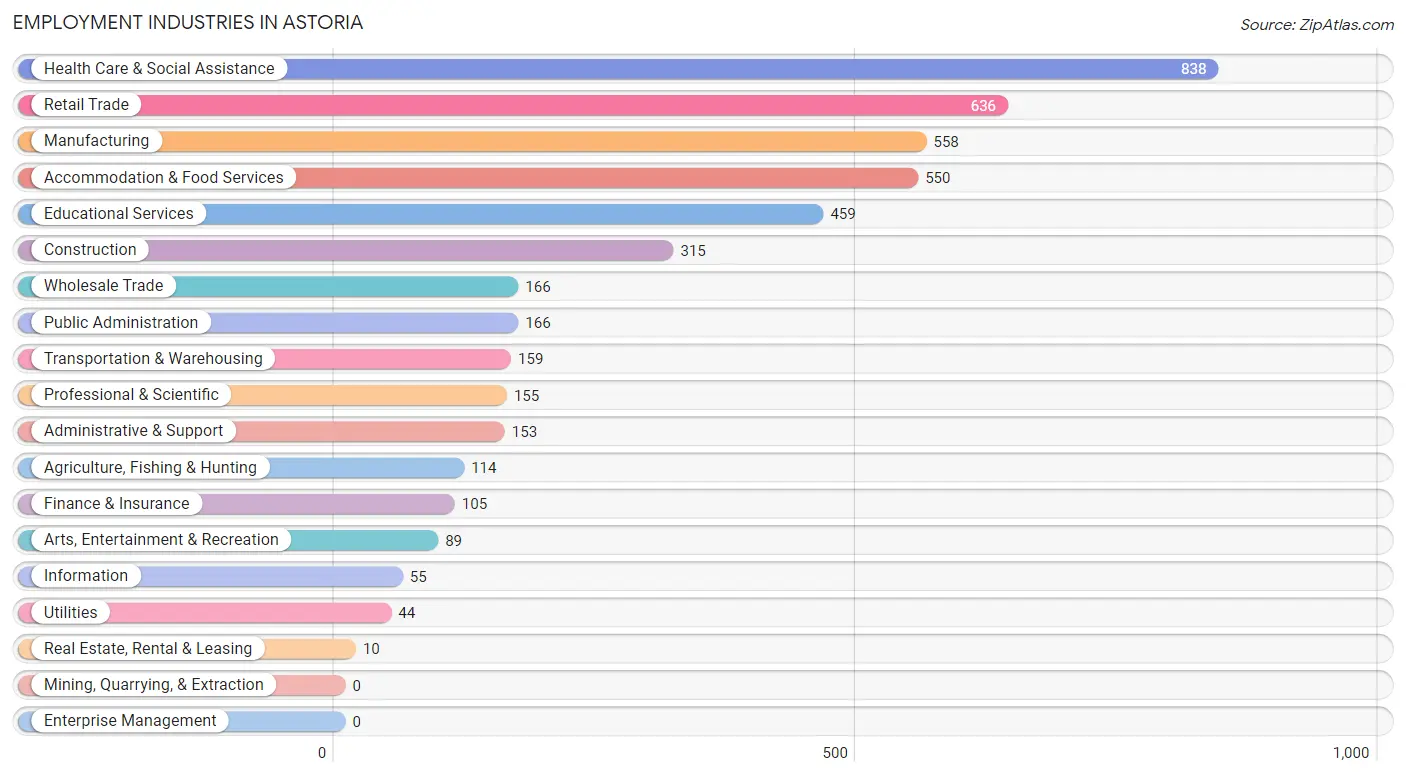
Employment Industries in Astoria
The major employment industries in Astoria include Health Care & Social Assistance (838 | 17.6%), Retail Trade (636 | 13.4%), Manufacturing (558 | 11.7%), Accommodation & Food Services (550 | 11.6%), and Educational Services (459 | 9.7%).
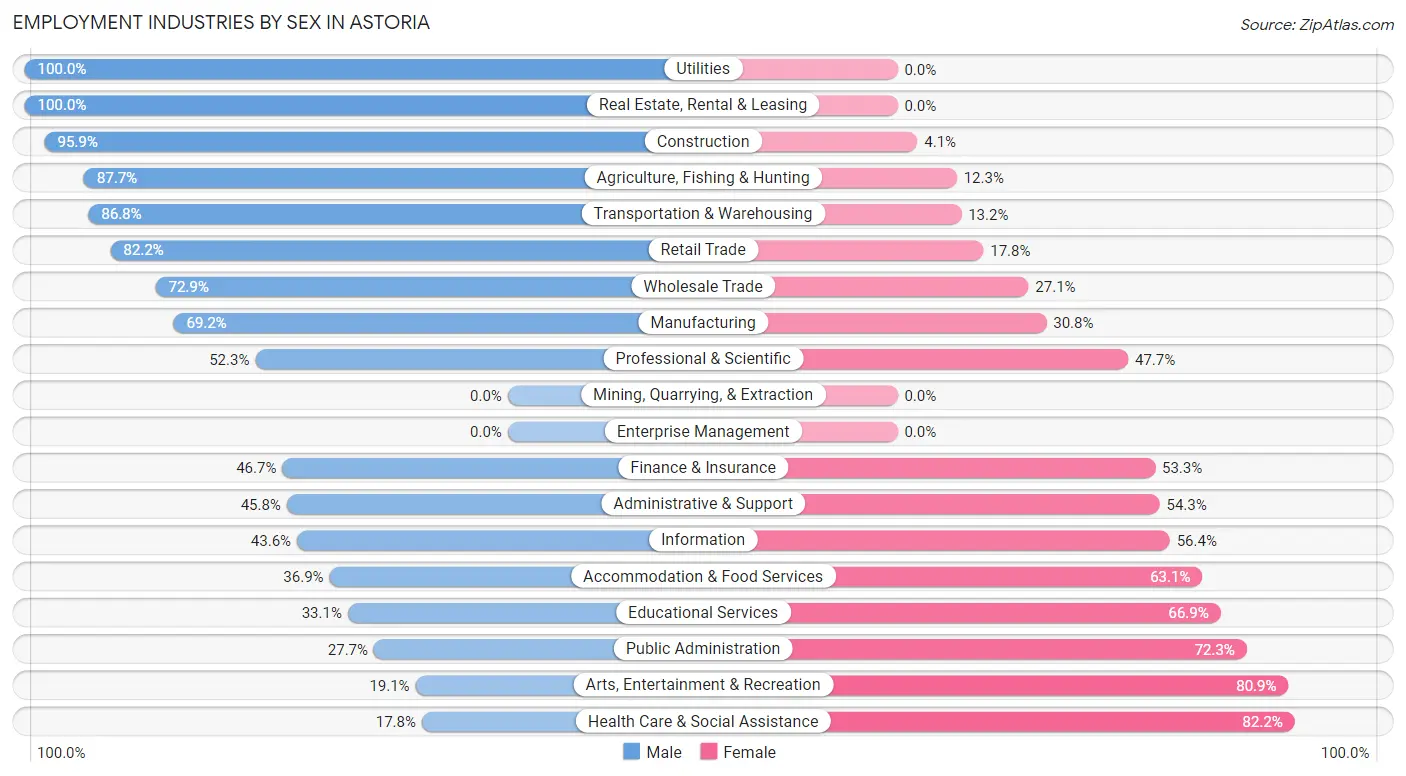
Employment Industries by Sex in Astoria
The Astoria industries that see more men than women are Utilities (100.0%), Real Estate, Rental & Leasing (100.0%), and Construction (95.9%), whereas the industries that tend to have a higher number of women are Health Care & Social Assistance (82.2%), Arts, Entertainment & Recreation (80.9%), and Public Administration (72.3%).
| Industry | Male | Female |
| Agriculture, Fishing & Hunting | 100 (87.7%) | 14 (12.3%) |
| Mining, Quarrying, & Extraction | 0 (0.0%) | 0 (0.0%) |
| Construction | 302 (95.9%) | 13 (4.1%) |
| Manufacturing | 386 (69.2%) | 172 (30.8%) |
| Wholesale Trade | 121 (72.9%) | 45 (27.1%) |
| Retail Trade | 523 (82.2%) | 113 (17.8%) |
| Transportation & Warehousing | 138 (86.8%) | 21 (13.2%) |
| Utilities | 44 (100.0%) | 0 (0.0%) |
| Information | 24 (43.6%) | 31 (56.4%) |
| Finance & Insurance | 49 (46.7%) | 56 (53.3%) |
| Real Estate, Rental & Leasing | 10 (100.0%) | 0 (0.0%) |
| Professional & Scientific | 81 (52.3%) | 74 (47.7%) |
| Enterprise Management | 0 (0.0%) | 0 (0.0%) |
| Administrative & Support | 70 (45.8%) | 83 (54.2%) |
| Educational Services | 152 (33.1%) | 307 (66.9%) |
| Health Care & Social Assistance | 149 (17.8%) | 689 (82.2%) |
| Arts, Entertainment & Recreation | 17 (19.1%) | 72 (80.9%) |
| Accommodation & Food Services | 203 (36.9%) | 347 (63.1%) |
| Public Administration | 46 (27.7%) | 120 (72.3%) |
| Total | 2,470 (51.9%) | 2,285 (48.0%) |
Education in Astoria
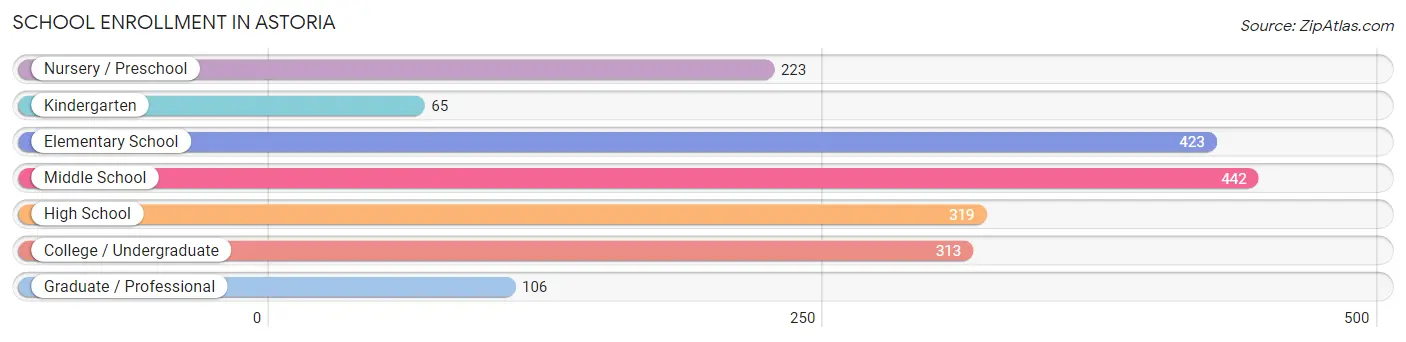
School Enrollment in Astoria
The most common levels of schooling among the 1,891 students in Astoria are middle school (442 | 23.4%), elementary school (423 | 22.4%), and high school (319 | 16.9%).
| School Level | # Students | % Students |
| Nursery / Preschool | 223 | 11.8% |
| Kindergarten | 65 | 3.4% |
| Elementary School | 423 | 22.4% |
| Middle School | 442 | 23.4% |
| High School | 319 | 16.9% |
| College / Undergraduate | 313 | 16.6% |
| Graduate / Professional | 106 | 5.6% |
| Total | 1,891 | 100.0% |
School Enrollment by Age by Funding Source in Astoria
Out of a total of 1,891 students who are enrolled in schools in Astoria, 480 (25.4%) attend a private institution, while the remaining 1,411 (74.6%) are enrolled in public schools. The age group of 3 to 4 year olds has the highest likelihood of being enrolled in private schools, with 108 (87.1% in the age bracket) enrolled. Conversely, the age group of 15 to 17 year olds has the lowest likelihood of being enrolled in a private school, with 257 (100.0% in the age bracket) attending a public institution.
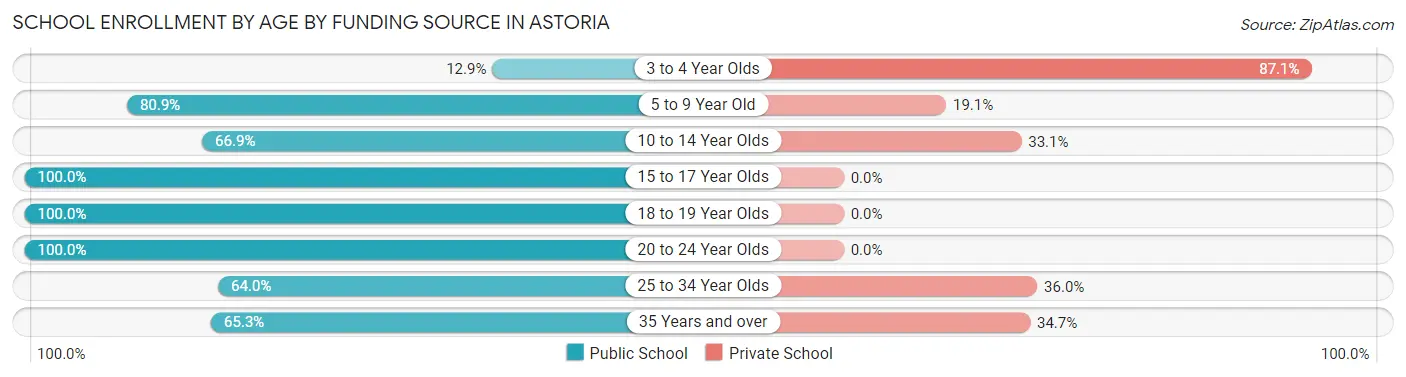
| Age Bracket | Public School | Private School |
| 3 to 4 Year Olds | 16 (12.9%) | 108 (87.1%) |
| 5 to 9 Year Old | 416 (80.9%) | 98 (19.1%) |
| 10 to 14 Year Olds | 354 (66.9%) | 175 (33.1%) |
| 15 to 17 Year Olds | 257 (100.0%) | 0 (0.0%) |
| 18 to 19 Year Olds | 134 (100.0%) | 0 (0.0%) |
| 20 to 24 Year Olds | 52 (100.0%) | 0 (0.0%) |
| 25 to 34 Year Olds | 71 (64.0%) | 40 (36.0%) |
| 35 Years and over | 111 (65.3%) | 59 (34.7%) |
| Total | 1,411 (74.6%) | 480 (25.4%) |
Educational Attainment by Field of Study in Astoria
Bio, nature & agricultural (383 | 14.5%), science & technology (301 | 11.4%), business (287 | 10.9%), education (255 | 9.7%), and visual & performing arts (196 | 7.4%) are the most common fields of study among 2,639 individuals in Astoria who have obtained a bachelor's degree or higher.
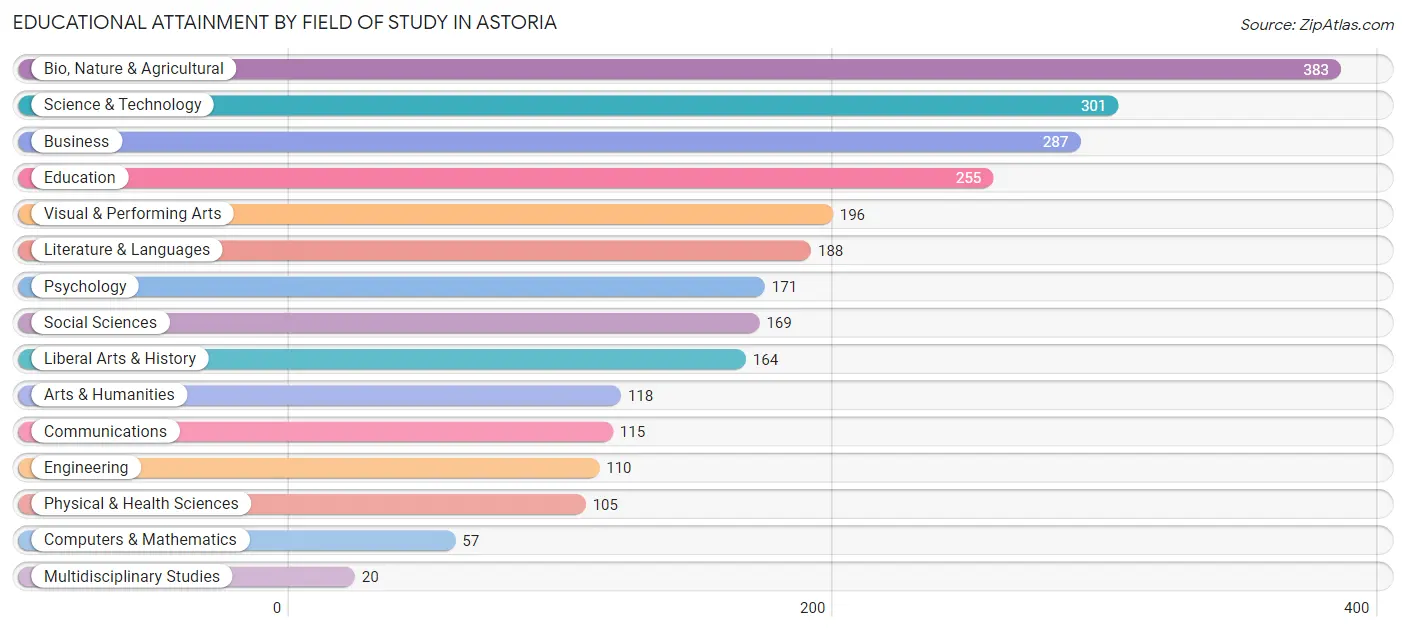
| Field of Study | # Graduates | % Graduates |
| Computers & Mathematics | 57 | 2.2% |
| Bio, Nature & Agricultural | 383 | 14.5% |
| Physical & Health Sciences | 105 | 4.0% |
| Psychology | 171 | 6.5% |
| Social Sciences | 169 | 6.4% |
| Engineering | 110 | 4.2% |
| Multidisciplinary Studies | 20 | 0.8% |
| Science & Technology | 301 | 11.4% |
| Business | 287 | 10.9% |
| Education | 255 | 9.7% |
| Literature & Languages | 188 | 7.1% |
| Liberal Arts & History | 164 | 6.2% |
| Visual & Performing Arts | 196 | 7.4% |
| Communications | 115 | 4.4% |
| Arts & Humanities | 118 | 4.5% |
| Total | 2,639 | 100.0% |
Transportation & Commute in Astoria
Vehicle Availability by Sex in Astoria
The most prevalent vehicle ownership categories in Astoria are males with 2 vehicles (1,229, accounting for 50.3%) and females with 2 vehicles (900, making up 56.9%).
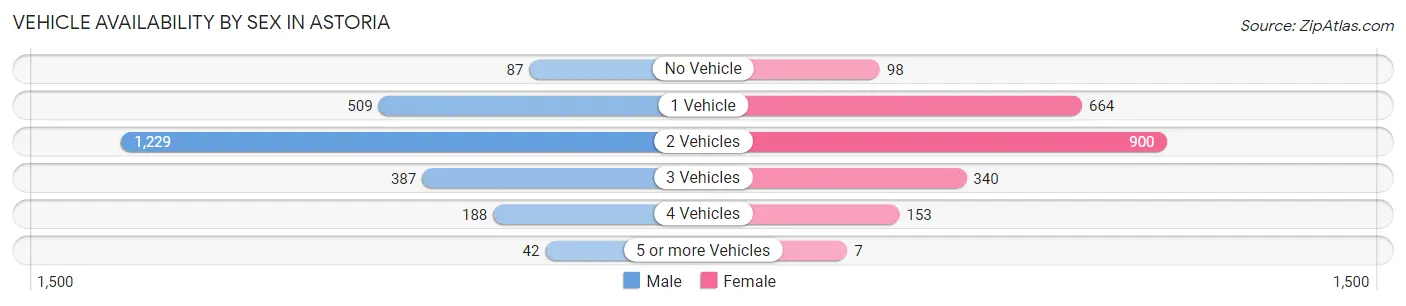
| Vehicles Available | Male | Female |
| No Vehicle | 87 (3.6%) | 98 (4.5%) |
| 1 Vehicle | 509 (20.8%) | 664 (30.7%) |
| 2 Vehicles | 1,229 (50.3%) | 900 (41.6%) |
| 3 Vehicles | 387 (15.9%) | 340 (15.7%) |
| 4 Vehicles | 188 (7.7%) | 153 (7.1%) |
| 5 or more Vehicles | 42 (1.7%) | 7 (0.3%) |
| Total | 2,442 (100.0%) | 2,162 (100.0%) |
Commute Time in Astoria
The most frequently occuring commute durations in Astoria are 5 to 9 minutes (986 commuters, 24.6%), 10 to 14 minutes (835 commuters, 20.8%), and 20 to 24 minutes (466 commuters, 11.6%).
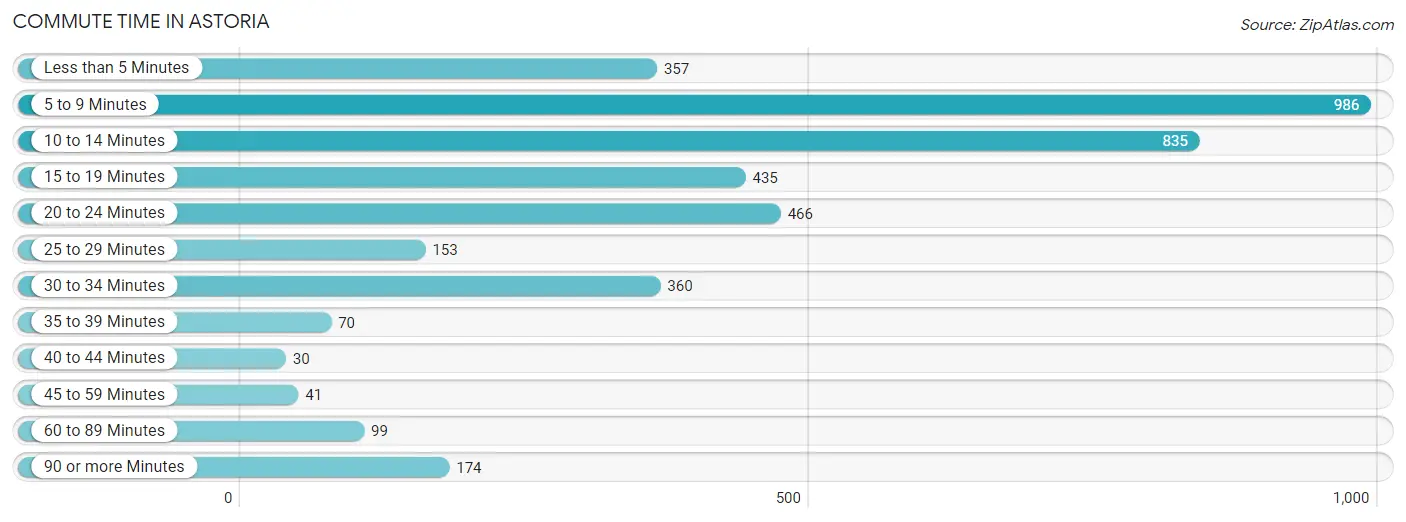
| Commute Time | # Commuters | % Commuters |
| Less than 5 Minutes | 357 | 8.9% |
| 5 to 9 Minutes | 986 | 24.6% |
| 10 to 14 Minutes | 835 | 20.8% |
| 15 to 19 Minutes | 435 | 10.9% |
| 20 to 24 Minutes | 466 | 11.6% |
| 25 to 29 Minutes | 153 | 3.8% |
| 30 to 34 Minutes | 360 | 9.0% |
| 35 to 39 Minutes | 70 | 1.8% |
| 40 to 44 Minutes | 30 | 0.7% |
| 45 to 59 Minutes | 41 | 1.0% |
| 60 to 89 Minutes | 99 | 2.5% |
| 90 or more Minutes | 174 | 4.3% |
Commute Time by Sex in Astoria
The most common commute times in Astoria are 10 to 14 minutes (449 commuters, 20.1%) for males and 5 to 9 minutes (617 commuters, 34.8%) for females.
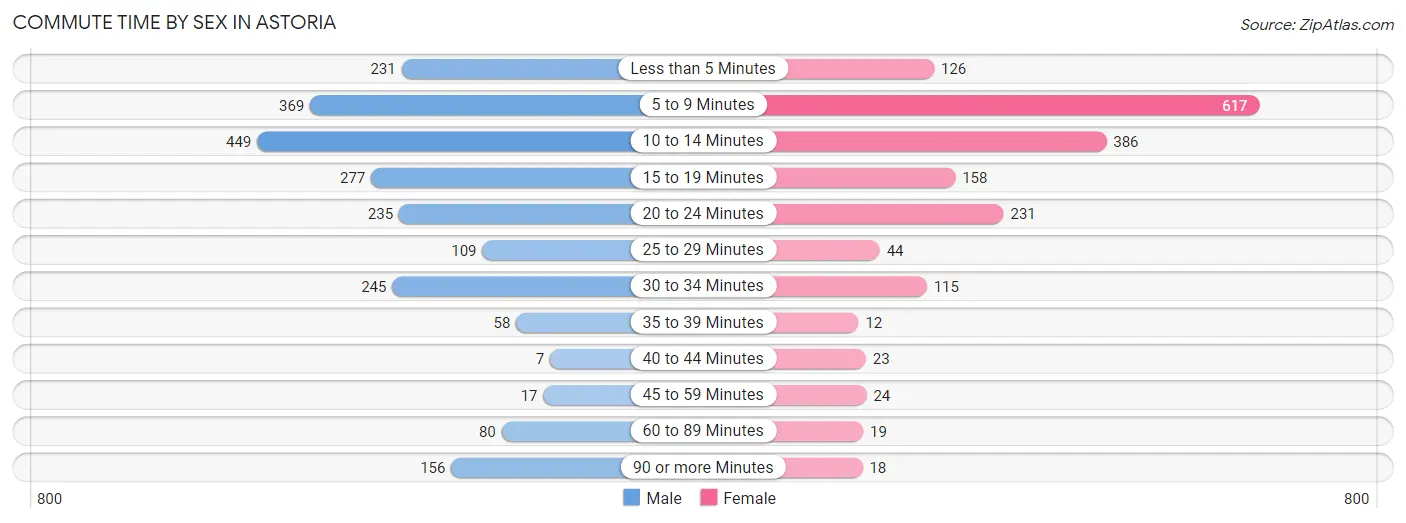
| Commute Time | Male | Female |
| Less than 5 Minutes | 231 (10.3%) | 126 (7.1%) |
| 5 to 9 Minutes | 369 (16.5%) | 617 (34.8%) |
| 10 to 14 Minutes | 449 (20.1%) | 386 (21.8%) |
| 15 to 19 Minutes | 277 (12.4%) | 158 (8.9%) |
| 20 to 24 Minutes | 235 (10.5%) | 231 (13.0%) |
| 25 to 29 Minutes | 109 (4.9%) | 44 (2.5%) |
| 30 to 34 Minutes | 245 (11.0%) | 115 (6.5%) |
| 35 to 39 Minutes | 58 (2.6%) | 12 (0.7%) |
| 40 to 44 Minutes | 7 (0.3%) | 23 (1.3%) |
| 45 to 59 Minutes | 17 (0.8%) | 24 (1.3%) |
| 60 to 89 Minutes | 80 (3.6%) | 19 (1.1%) |
| 90 or more Minutes | 156 (7.0%) | 18 (1.0%) |
Time of Departure to Work by Sex in Astoria
The most frequent times of departure to work in Astoria are 7:00 AM to 7:29 AM (413, 18.5%) for males and 7:30 AM to 7:59 AM (337, 19.0%) for females.
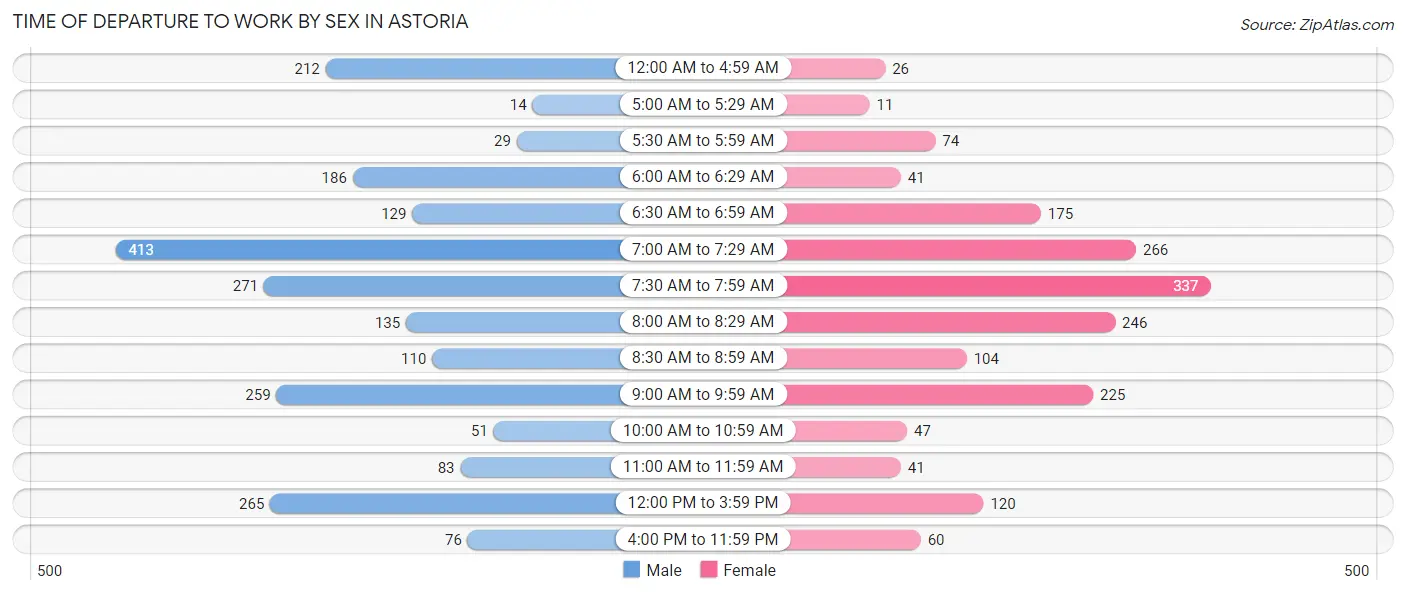
| Time of Departure | Male | Female |
| 12:00 AM to 4:59 AM | 212 (9.5%) | 26 (1.5%) |
| 5:00 AM to 5:29 AM | 14 (0.6%) | 11 (0.6%) |
| 5:30 AM to 5:59 AM | 29 (1.3%) | 74 (4.2%) |
| 6:00 AM to 6:29 AM | 186 (8.3%) | 41 (2.3%) |
| 6:30 AM to 6:59 AM | 129 (5.8%) | 175 (9.9%) |
| 7:00 AM to 7:29 AM | 413 (18.5%) | 266 (15.0%) |
| 7:30 AM to 7:59 AM | 271 (12.1%) | 337 (19.0%) |
| 8:00 AM to 8:29 AM | 135 (6.0%) | 246 (13.9%) |
| 8:30 AM to 8:59 AM | 110 (4.9%) | 104 (5.9%) |
| 9:00 AM to 9:59 AM | 259 (11.6%) | 225 (12.7%) |
| 10:00 AM to 10:59 AM | 51 (2.3%) | 47 (2.6%) |
| 11:00 AM to 11:59 AM | 83 (3.7%) | 41 (2.3%) |
| 12:00 PM to 3:59 PM | 265 (11.9%) | 120 (6.8%) |
| 4:00 PM to 11:59 PM | 76 (3.4%) | 60 (3.4%) |
| Total | 2,233 (100.0%) | 1,773 (100.0%) |
Housing Occupancy in Astoria
Occupancy by Ownership in Astoria
Of the total 4,420 dwellings in Astoria, owner-occupied units account for 2,295 (51.9%), while renter-occupied units make up 2,125 (48.1%).
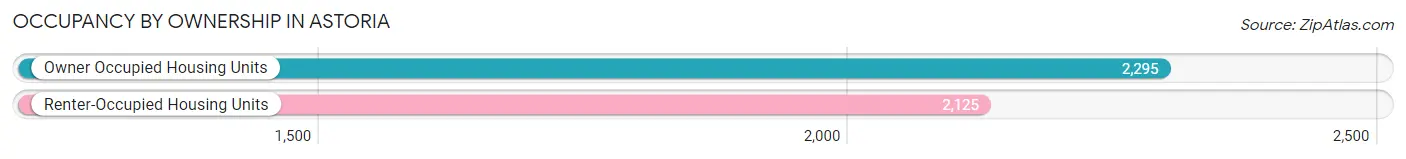
| Occupancy | # Housing Units | % Housing Units |
| Owner Occupied Housing Units | 2,295 | 51.9% |
| Renter-Occupied Housing Units | 2,125 | 48.1% |
| Total Occupied Housing Units | 4,420 | 100.0% |
Occupancy by Household Size in Astoria
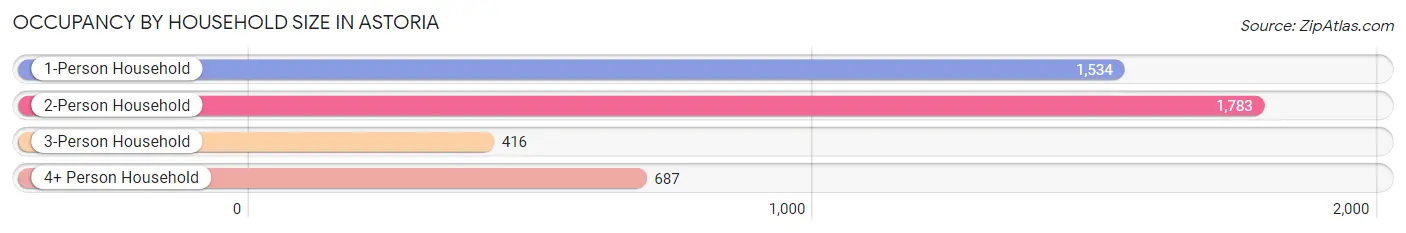
| Household Size | # Housing Units | % Housing Units |
| 1-Person Household | 1,534 | 34.7% |
| 2-Person Household | 1,783 | 40.3% |
| 3-Person Household | 416 | 9.4% |
| 4+ Person Household | 687 | 15.5% |
| Total Housing Units | 4,420 | 100.0% |
Occupancy by Ownership by Household Size in Astoria
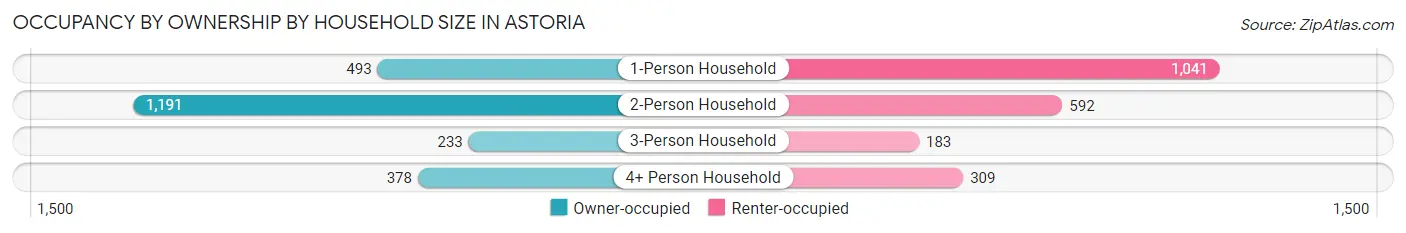
| Household Size | Owner-occupied | Renter-occupied |
| 1-Person Household | 493 (32.1%) | 1,041 (67.9%) |
| 2-Person Household | 1,191 (66.8%) | 592 (33.2%) |
| 3-Person Household | 233 (56.0%) | 183 (44.0%) |
| 4+ Person Household | 378 (55.0%) | 309 (45.0%) |
| Total Housing Units | 2,295 (51.9%) | 2,125 (48.1%) |
Occupancy by Educational Attainment in Astoria
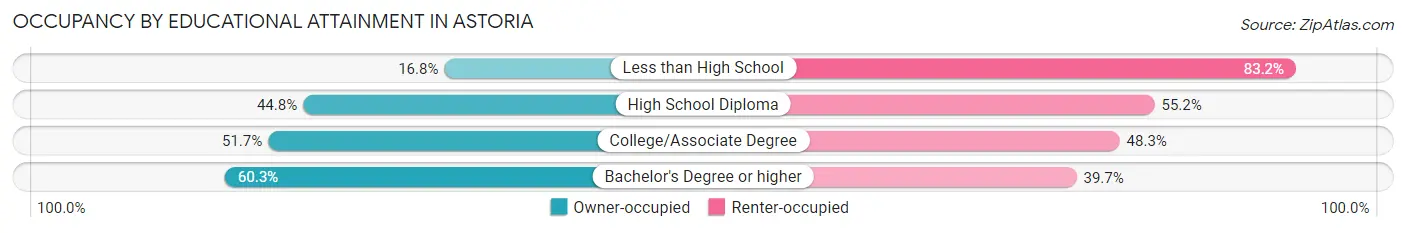
| Household Size | Owner-occupied | Renter-occupied |
| Less than High School | 41 (16.8%) | 203 (83.2%) |
| High School Diploma | 298 (44.8%) | 367 (55.2%) |
| College/Associate Degree | 971 (51.7%) | 906 (48.3%) |
| Bachelor's Degree or higher | 985 (60.3%) | 649 (39.7%) |
Occupancy by Age of Householder in Astoria
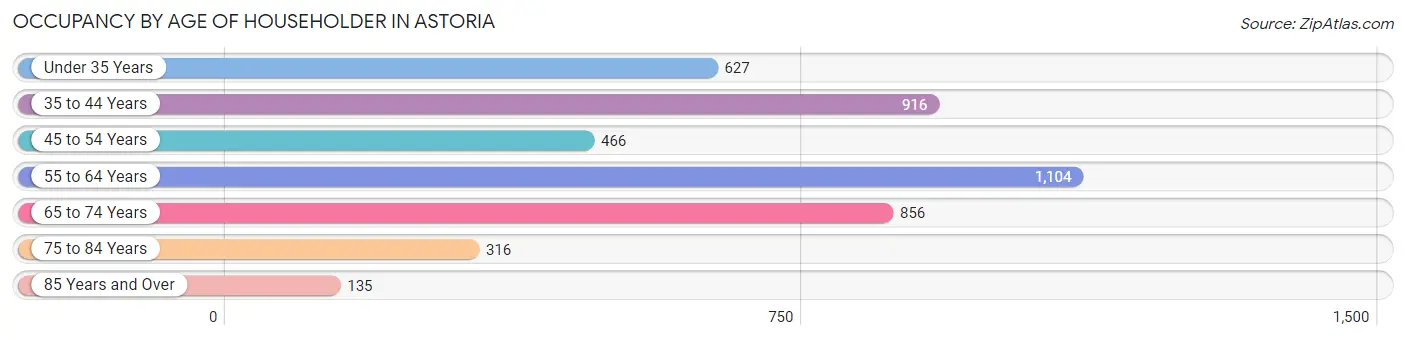
| Age Bracket | # Households | % Households |
| Under 35 Years | 627 | 14.2% |
| 35 to 44 Years | 916 | 20.7% |
| 45 to 54 Years | 466 | 10.5% |
| 55 to 64 Years | 1,104 | 25.0% |
| 65 to 74 Years | 856 | 19.4% |
| 75 to 84 Years | 316 | 7.1% |
| 85 Years and Over | 135 | 3.0% |
| Total | 4,420 | 100.0% |
Housing Finances in Astoria
Median Income by Occupancy in Astoria
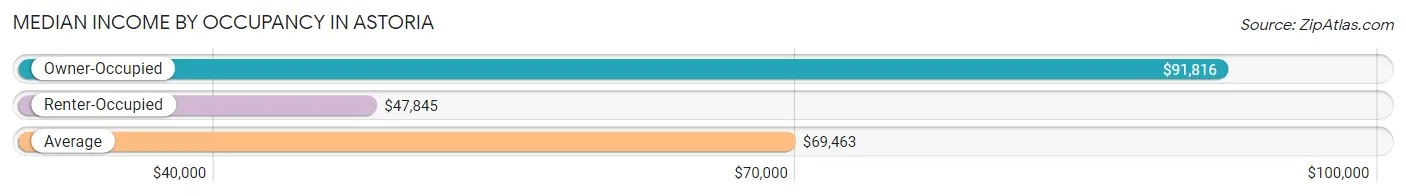
| Occupancy Type | # Households | Median Income |
| Owner-Occupied | 2,295 (51.9%) | $91,816 |
| Renter-Occupied | 2,125 (48.1%) | $47,845 |
| Average | 4,420 (100.0%) | $69,463 |
Occupancy by Householder Income Bracket in Astoria
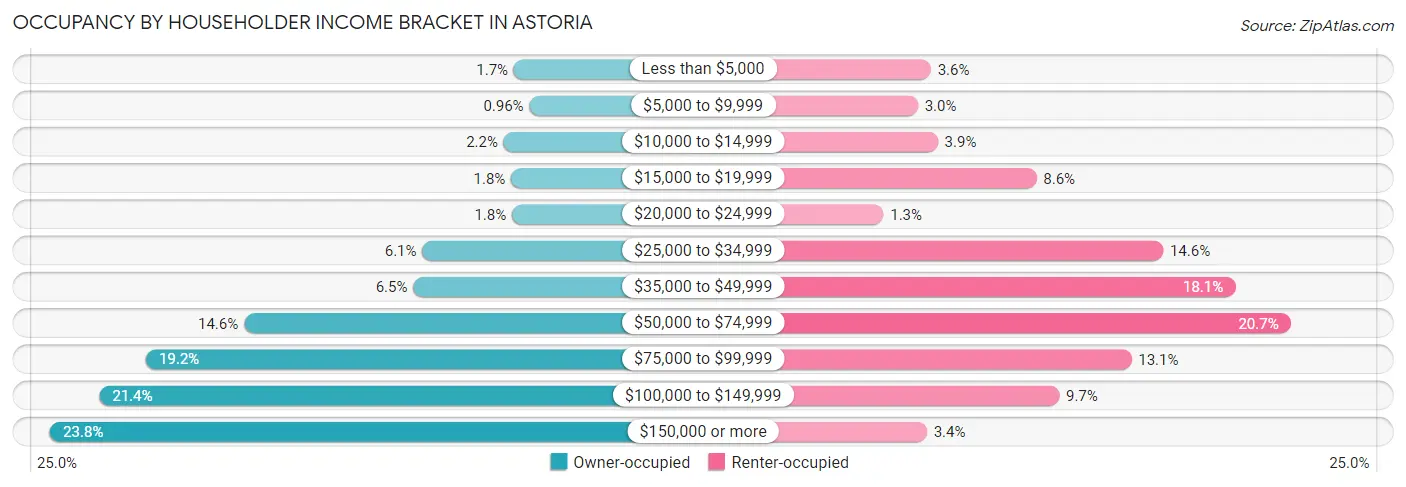
| Income Bracket | Owner-occupied | Renter-occupied |
| Less than $5,000 | 39 (1.7%) | 76 (3.6%) |
| $5,000 to $9,999 | 22 (1.0%) | 63 (3.0%) |
| $10,000 to $14,999 | 50 (2.2%) | 83 (3.9%) |
| $15,000 to $19,999 | 42 (1.8%) | 183 (8.6%) |
| $20,000 to $24,999 | 41 (1.8%) | 28 (1.3%) |
| $25,000 to $34,999 | 139 (6.1%) | 311 (14.6%) |
| $35,000 to $49,999 | 149 (6.5%) | 384 (18.1%) |
| $50,000 to $74,999 | 334 (14.5%) | 440 (20.7%) |
| $75,000 to $99,999 | 441 (19.2%) | 279 (13.1%) |
| $100,000 to $149,999 | 492 (21.4%) | 206 (9.7%) |
| $150,000 or more | 546 (23.8%) | 72 (3.4%) |
| Total | 2,295 (100.0%) | 2,125 (100.0%) |
Monthly Housing Cost Tiers in Astoria
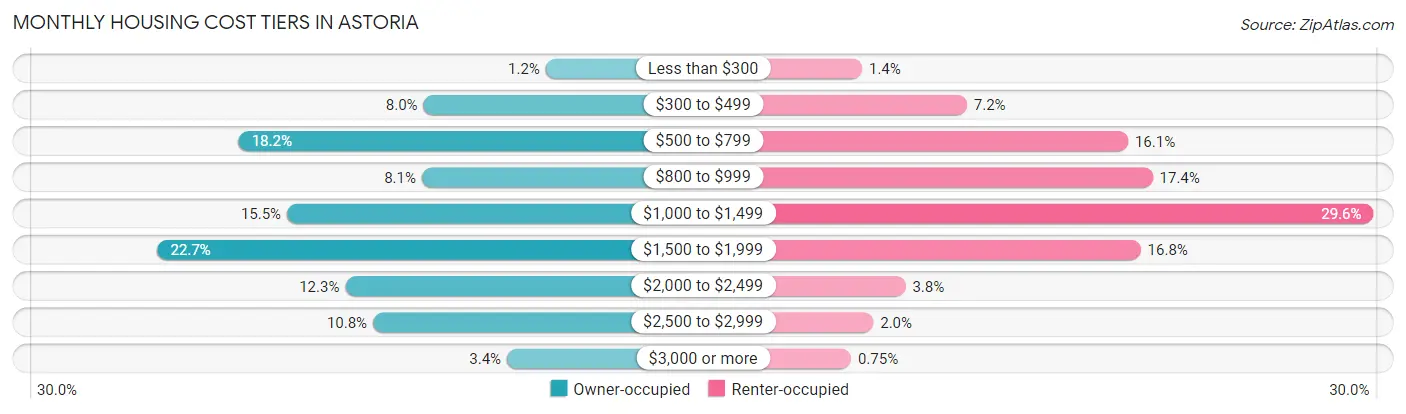
| Monthly Cost | Owner-occupied | Renter-occupied |
| Less than $300 | 28 (1.2%) | 29 (1.4%) |
| $300 to $499 | 183 (8.0%) | 152 (7.1%) |
| $500 to $799 | 417 (18.2%) | 341 (16.1%) |
| $800 to $999 | 185 (8.1%) | 370 (17.4%) |
| $1,000 to $1,499 | 356 (15.5%) | 629 (29.6%) |
| $1,500 to $1,999 | 520 (22.7%) | 356 (16.8%) |
| $2,000 to $2,499 | 282 (12.3%) | 80 (3.8%) |
| $2,500 to $2,999 | 247 (10.8%) | 42 (2.0%) |
| $3,000 or more | 77 (3.4%) | 16 (0.7%) |
| Total | 2,295 (100.0%) | 2,125 (100.0%) |
Physical Housing Characteristics in Astoria
Housing Structures in Astoria
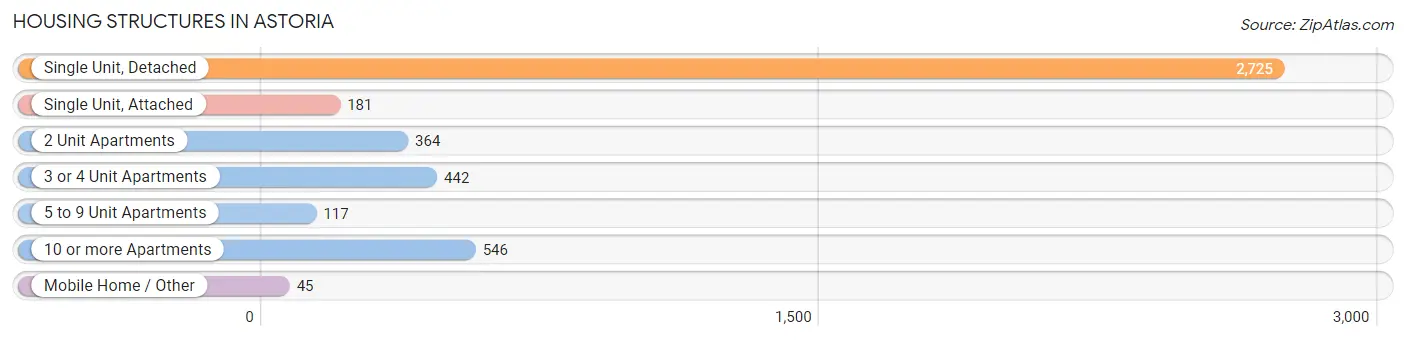
| Structure Type | # Housing Units | % Housing Units |
| Single Unit, Detached | 2,725 | 61.7% |
| Single Unit, Attached | 181 | 4.1% |
| 2 Unit Apartments | 364 | 8.2% |
| 3 or 4 Unit Apartments | 442 | 10.0% |
| 5 to 9 Unit Apartments | 117 | 2.6% |
| 10 or more Apartments | 546 | 12.3% |
| Mobile Home / Other | 45 | 1.0% |
| Total | 4,420 | 100.0% |
Housing Structures by Occupancy in Astoria
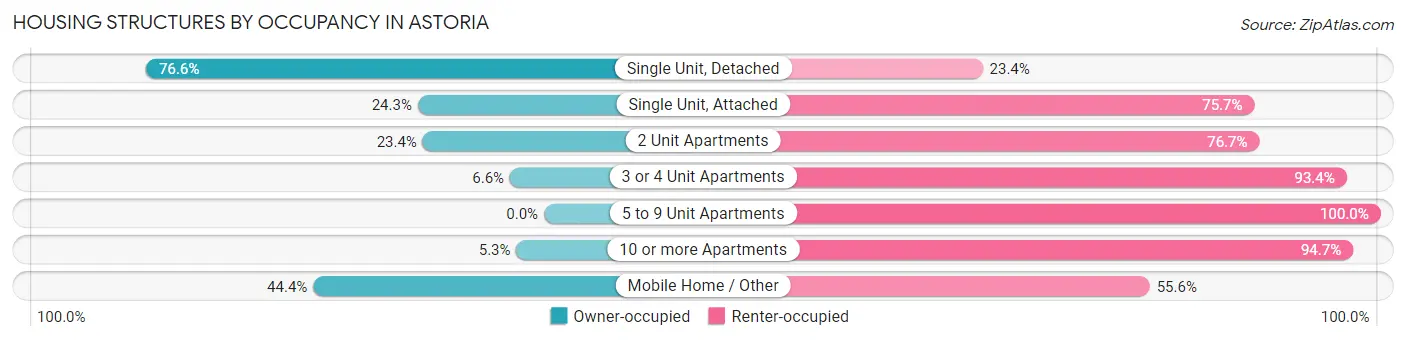
| Structure Type | Owner-occupied | Renter-occupied |
| Single Unit, Detached | 2,088 (76.6%) | 637 (23.4%) |
| Single Unit, Attached | 44 (24.3%) | 137 (75.7%) |
| 2 Unit Apartments | 85 (23.4%) | 279 (76.6%) |
| 3 or 4 Unit Apartments | 29 (6.6%) | 413 (93.4%) |
| 5 to 9 Unit Apartments | 0 (0.0%) | 117 (100.0%) |
| 10 or more Apartments | 29 (5.3%) | 517 (94.7%) |
| Mobile Home / Other | 20 (44.4%) | 25 (55.6%) |
| Total | 2,295 (51.9%) | 2,125 (48.1%) |
Housing Structures by Number of Rooms in Astoria
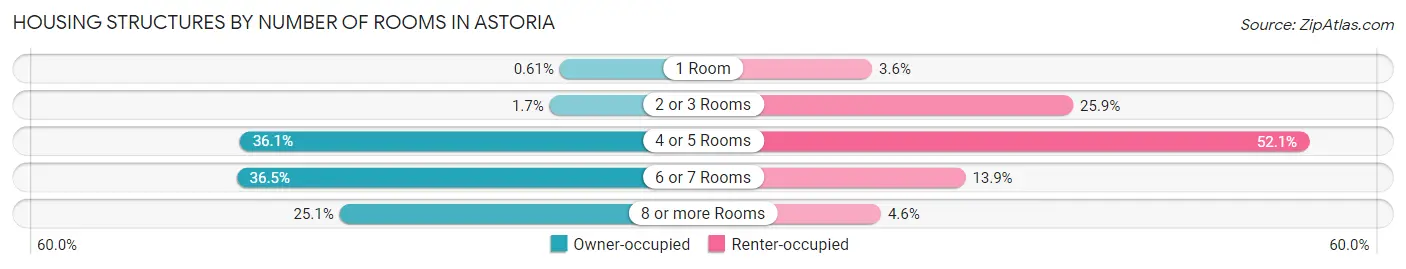
| Number of Rooms | Owner-occupied | Renter-occupied |
| 1 Room | 14 (0.6%) | 76 (3.6%) |
| 2 or 3 Rooms | 40 (1.7%) | 550 (25.9%) |
| 4 or 5 Rooms | 829 (36.1%) | 1,106 (52.0%) |
| 6 or 7 Rooms | 837 (36.5%) | 296 (13.9%) |
| 8 or more Rooms | 575 (25.1%) | 97 (4.6%) |
| Total | 2,295 (100.0%) | 2,125 (100.0%) |
Housing Structure by Heating Type in Astoria
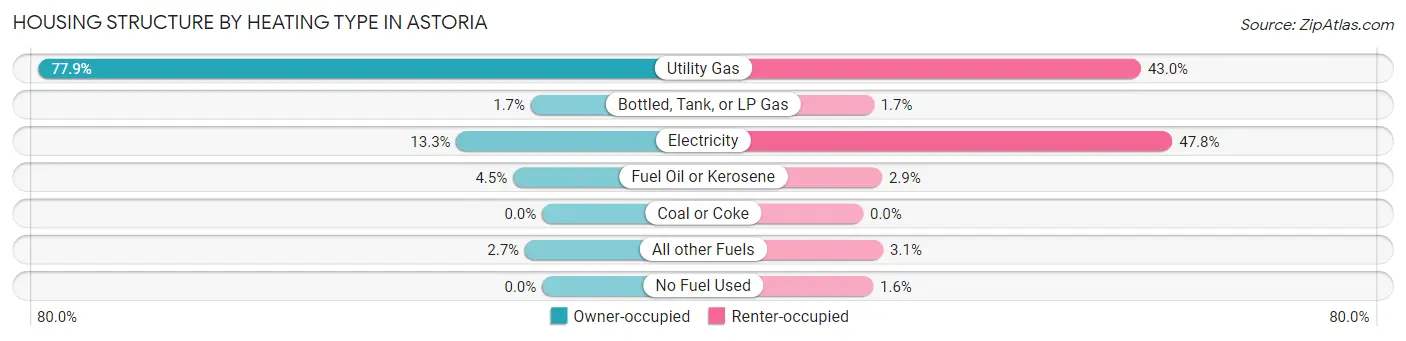
| Heating Type | Owner-occupied | Renter-occupied |
| Utility Gas | 1,787 (77.9%) | 913 (43.0%) |
| Bottled, Tank, or LP Gas | 40 (1.7%) | 35 (1.7%) |
| Electricity | 304 (13.3%) | 1,016 (47.8%) |
| Fuel Oil or Kerosene | 103 (4.5%) | 62 (2.9%) |
| Coal or Coke | 0 (0.0%) | 0 (0.0%) |
| All other Fuels | 61 (2.7%) | 66 (3.1%) |
| No Fuel Used | 0 (0.0%) | 33 (1.5%) |
| Total | 2,295 (100.0%) | 2,125 (100.0%) |
Household Vehicle Usage in Astoria
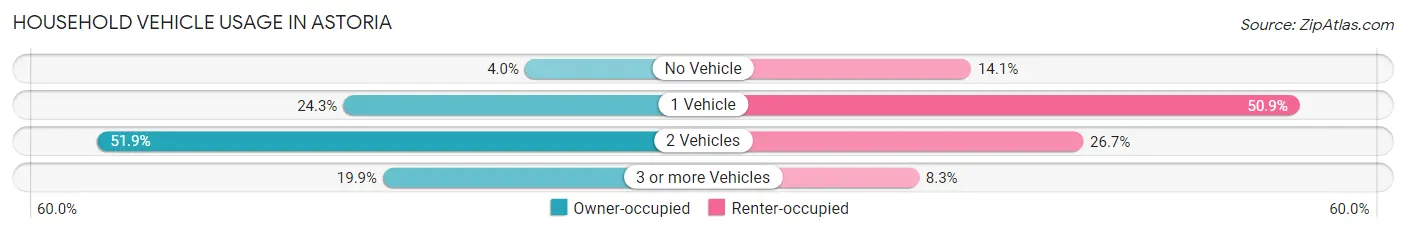
| Vehicles per Household | Owner-occupied | Renter-occupied |
| No Vehicle | 91 (4.0%) | 300 (14.1%) |
| 1 Vehicle | 558 (24.3%) | 1,082 (50.9%) |
| 2 Vehicles | 1,190 (51.8%) | 567 (26.7%) |
| 3 or more Vehicles | 456 (19.9%) | 176 (8.3%) |
| Total | 2,295 (100.0%) | 2,125 (100.0%) |
Real Estate & Mortgages in Astoria
Real Estate and Mortgage Overview in Astoria
| Characteristic | Without Mortgage | With Mortgage |
| Housing Units | 725 | 1,570 |
| Median Property Value | $356,900 | $403,300 |
| Median Household Income | $67,056 | $474 |
| Monthly Housing Costs | $599 | $77 |
| Real Estate Taxes | $3,233 | $23 |
Property Value by Mortgage Status in Astoria
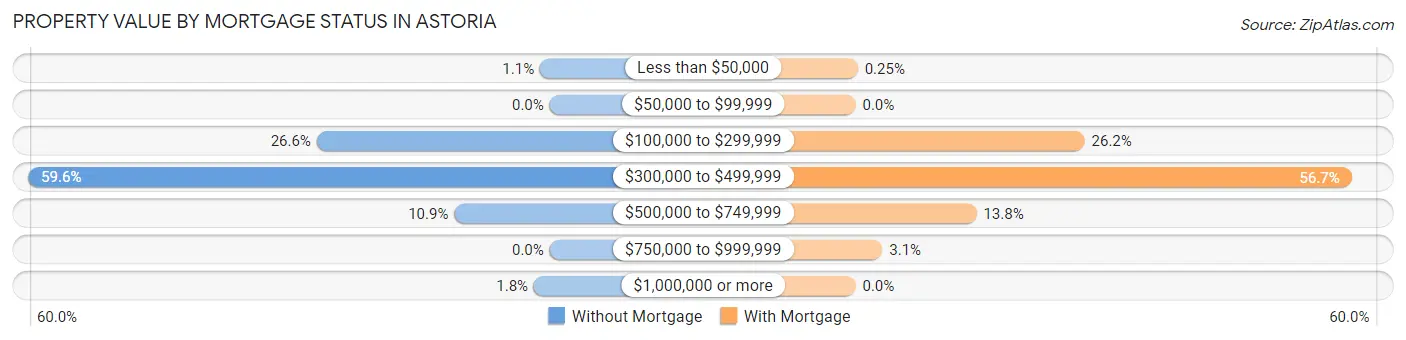
| Property Value | Without Mortgage | With Mortgage |
| Less than $50,000 | 8 (1.1%) | 4 (0.3%) |
| $50,000 to $99,999 | 0 (0.0%) | 0 (0.0%) |
| $100,000 to $299,999 | 193 (26.6%) | 411 (26.2%) |
| $300,000 to $499,999 | 432 (59.6%) | 890 (56.7%) |
| $500,000 to $749,999 | 79 (10.9%) | 217 (13.8%) |
| $750,000 to $999,999 | 0 (0.0%) | 48 (3.1%) |
| $1,000,000 or more | 13 (1.8%) | 0 (0.0%) |
| Total | 725 (100.0%) | 1,570 (100.0%) |
Household Income by Mortgage Status in Astoria
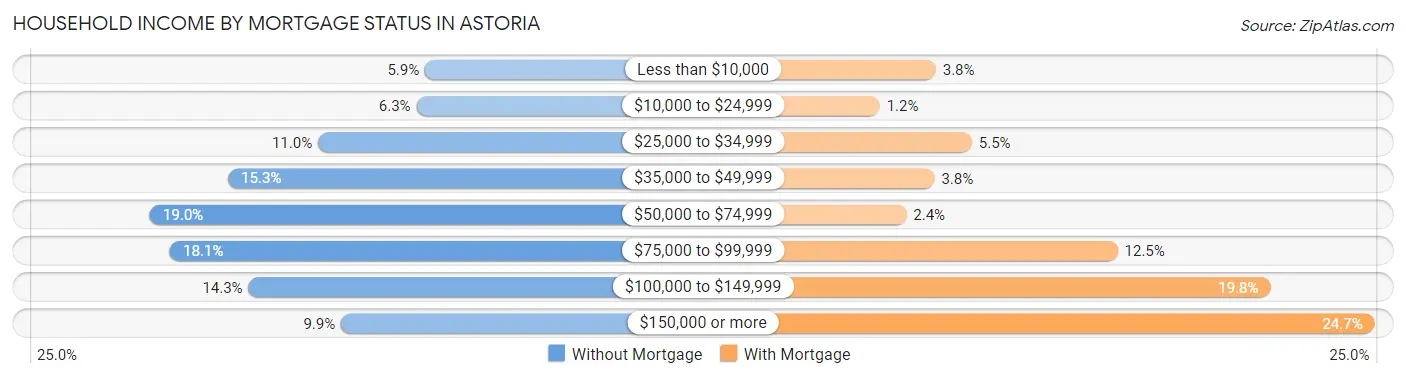
| Household Income | Without Mortgage | With Mortgage |
| Less than $10,000 | 43 (5.9%) | 60 (3.8%) |
| $10,000 to $24,999 | 46 (6.3%) | 18 (1.1%) |
| $25,000 to $34,999 | 80 (11.0%) | 87 (5.5%) |
| $35,000 to $49,999 | 111 (15.3%) | 59 (3.8%) |
| $50,000 to $74,999 | 138 (19.0%) | 38 (2.4%) |
| $75,000 to $99,999 | 131 (18.1%) | 196 (12.5%) |
| $100,000 to $149,999 | 104 (14.3%) | 310 (19.8%) |
| $150,000 or more | 72 (9.9%) | 388 (24.7%) |
| Total | 725 (100.0%) | 1,570 (100.0%) |
Property Value to Household Income Ratio in Astoria
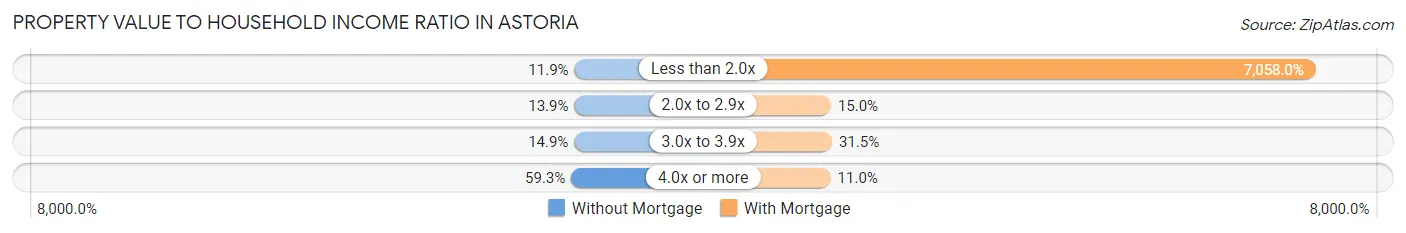
| Value-to-Income Ratio | Without Mortgage | With Mortgage |
| Less than 2.0x | 86 (11.9%) | 110,811 (7,058.0%) |
| 2.0x to 2.9x | 101 (13.9%) | 235 (15.0%) |
| 3.0x to 3.9x | 108 (14.9%) | 494 (31.5%) |
| 4.0x or more | 430 (59.3%) | 172 (11.0%) |
| Total | 725 (100.0%) | 1,570 (100.0%) |
Real Estate Taxes by Mortgage Status in Astoria
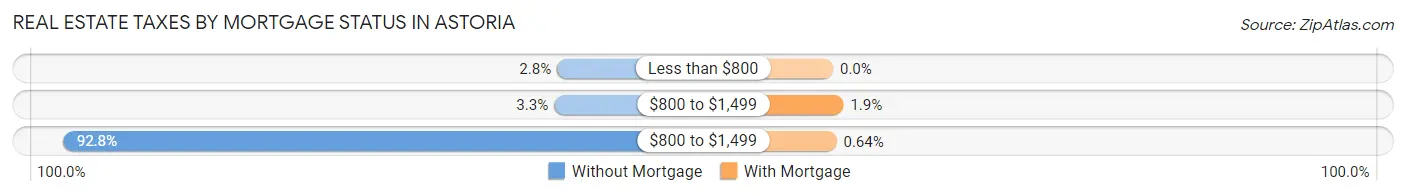
| Property Taxes | Without Mortgage | With Mortgage |
| Less than $800 | 20 (2.8%) | 0 (0.0%) |
| $800 to $1,499 | 24 (3.3%) | 30 (1.9%) |
| $800 to $1,499 | 673 (92.8%) | 10 (0.6%) |
| Total | 725 (100.0%) | 1,570 (100.0%) |
Health & Disability in Astoria
Health Insurance Coverage by Age in Astoria
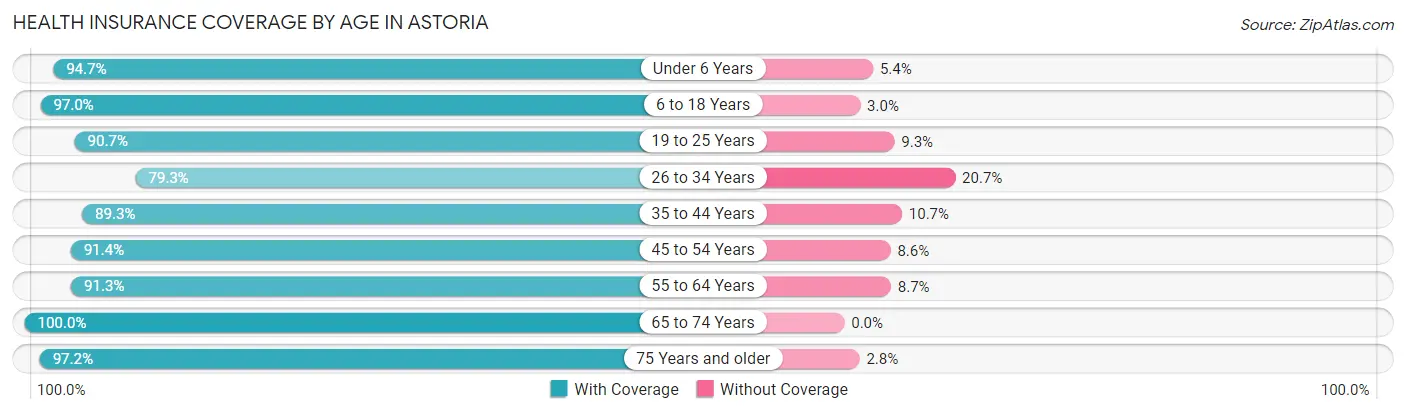
| Age Bracket | With Coverage | Without Coverage |
| Under 6 Years | 796 (94.7%) | 45 (5.3%) |
| 6 to 18 Years | 1,244 (97.0%) | 38 (3.0%) |
| 19 to 25 Years | 661 (90.7%) | 68 (9.3%) |
| 26 to 34 Years | 948 (79.3%) | 247 (20.7%) |
| 35 to 44 Years | 1,280 (89.3%) | 154 (10.7%) |
| 45 to 54 Years | 775 (91.4%) | 73 (8.6%) |
| 55 to 64 Years | 1,557 (91.3%) | 148 (8.7%) |
| 65 to 74 Years | 1,250 (100.0%) | 0 (0.0%) |
| 75 Years and older | 653 (97.2%) | 19 (2.8%) |
| Total | 9,164 (92.0%) | 792 (8.0%) |
Health Insurance Coverage by Citizenship Status in Astoria
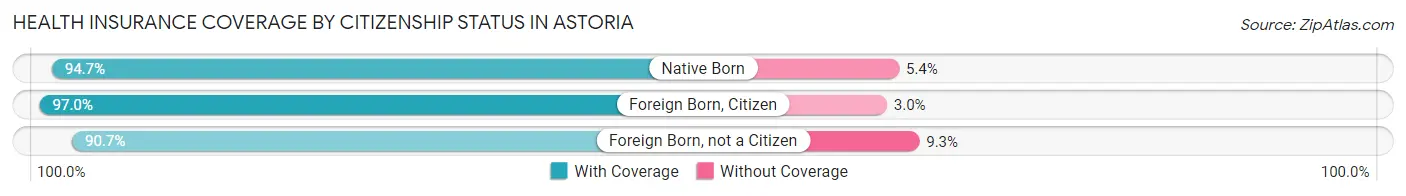
| Citizenship Status | With Coverage | Without Coverage |
| Native Born | 796 (94.7%) | 45 (5.3%) |
| Foreign Born, Citizen | 1,244 (97.0%) | 38 (3.0%) |
| Foreign Born, not a Citizen | 661 (90.7%) | 68 (9.3%) |
Health Insurance Coverage by Household Income in Astoria
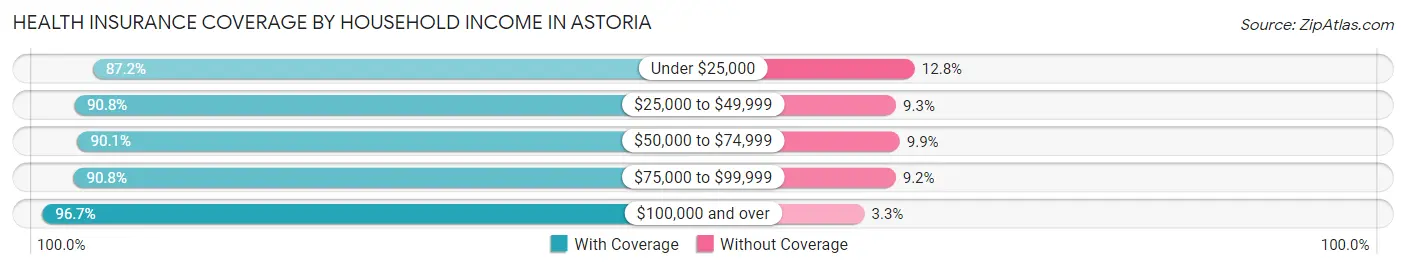
| Household Income | With Coverage | Without Coverage |
| Under $25,000 | 991 (87.2%) | 145 (12.8%) |
| $25,000 to $49,999 | 1,580 (90.7%) | 161 (9.2%) |
| $50,000 to $74,999 | 1,449 (90.1%) | 160 (9.9%) |
| $75,000 to $99,999 | 1,801 (90.8%) | 182 (9.2%) |
| $100,000 and over | 3,196 (96.7%) | 110 (3.3%) |
Public vs Private Health Insurance Coverage by Age in Astoria
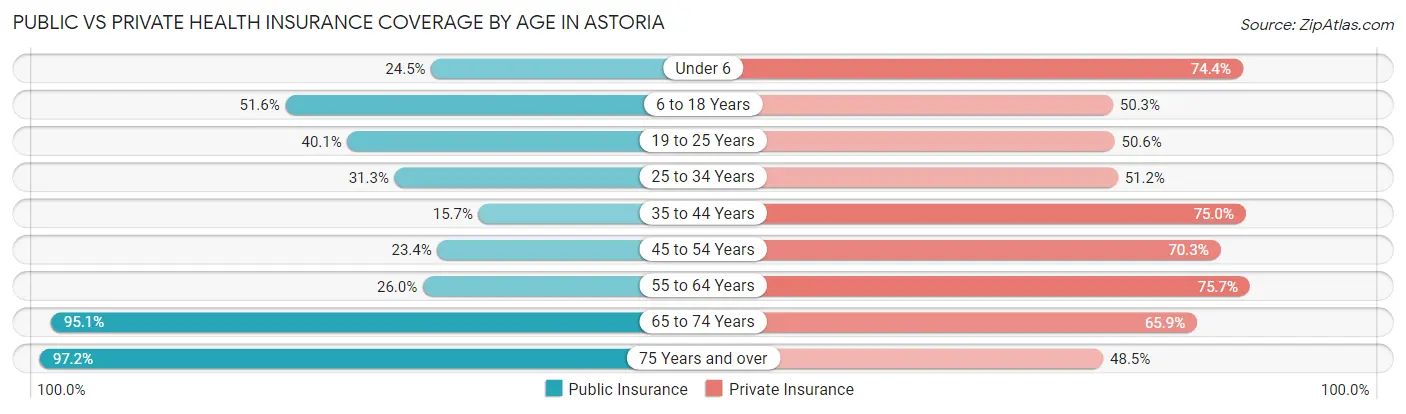
| Age Bracket | Public Insurance | Private Insurance |
| Under 6 | 206 (24.5%) | 626 (74.4%) |
| 6 to 18 Years | 661 (51.6%) | 645 (50.3%) |
| 19 to 25 Years | 292 (40.1%) | 369 (50.6%) |
| 25 to 34 Years | 374 (31.3%) | 612 (51.2%) |
| 35 to 44 Years | 225 (15.7%) | 1,075 (75.0%) |
| 45 to 54 Years | 198 (23.4%) | 596 (70.3%) |
| 55 to 64 Years | 444 (26.0%) | 1,291 (75.7%) |
| 65 to 74 Years | 1,189 (95.1%) | 824 (65.9%) |
| 75 Years and over | 653 (97.2%) | 326 (48.5%) |
| Total | 4,242 (42.6%) | 6,364 (63.9%) |
Disability Status by Sex by Age in Astoria

| Age Bracket | Male | Female |
| Under 5 Years | 0 (0.0%) | 0 (0.0%) |
| 5 to 17 Years | 44 (6.5%) | 5 (0.7%) |
| 18 to 34 Years | 149 (14.1%) | 101 (10.7%) |
| 35 to 64 Years | 319 (18.0%) | 356 (16.1%) |
| 65 to 74 Years | 87 (14.3%) | 173 (27.0%) |
| 75 Years and over | 163 (58.6%) | 228 (57.9%) |
Disability Class by Sex by Age in Astoria
Disability Class: Hearing Difficulty
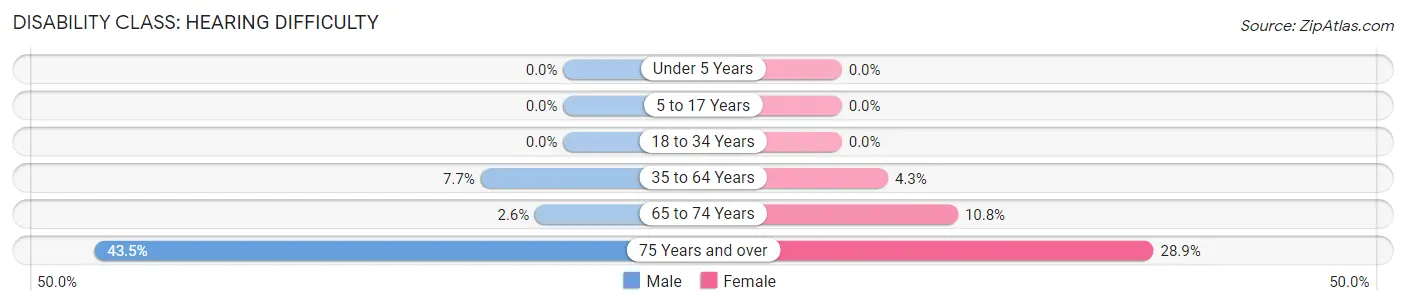
| Age Bracket | Male | Female |
| Under 5 Years | 0 (0.0%) | 0 (0.0%) |
| 5 to 17 Years | 0 (0.0%) | 0 (0.0%) |
| 18 to 34 Years | 0 (0.0%) | 0 (0.0%) |
| 35 to 64 Years | 136 (7.7%) | 95 (4.3%) |
| 65 to 74 Years | 16 (2.6%) | 69 (10.8%) |
| 75 Years and over | 121 (43.5%) | 114 (28.9%) |
Disability Class: Vision Difficulty
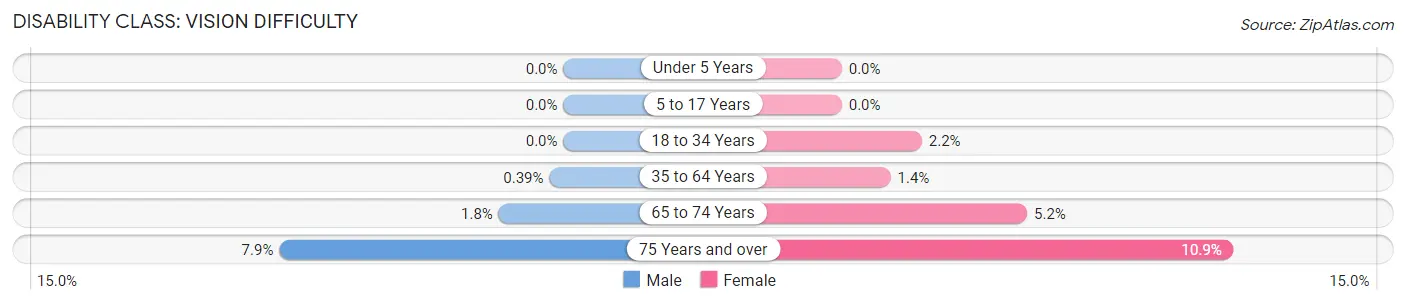
| Age Bracket | Male | Female |
| Under 5 Years | 0 (0.0%) | 0 (0.0%) |
| 5 to 17 Years | 0 (0.0%) | 0 (0.0%) |
| 18 to 34 Years | 0 (0.0%) | 21 (2.2%) |
| 35 to 64 Years | 7 (0.4%) | 30 (1.4%) |
| 65 to 74 Years | 11 (1.8%) | 33 (5.2%) |
| 75 Years and over | 22 (7.9%) | 43 (10.9%) |
Disability Class: Cognitive Difficulty
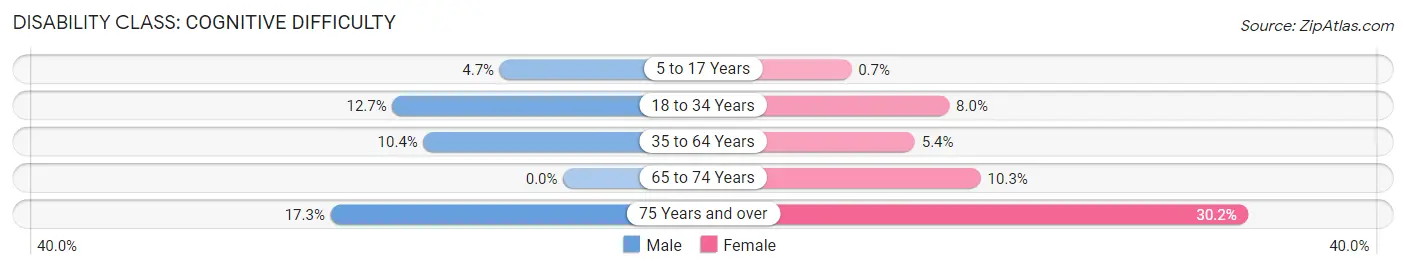
| Age Bracket | Male | Female |
| 5 to 17 Years | 32 (4.7%) | 5 (0.7%) |
| 18 to 34 Years | 134 (12.7%) | 75 (8.0%) |
| 35 to 64 Years | 184 (10.4%) | 120 (5.4%) |
| 65 to 74 Years | 0 (0.0%) | 66 (10.3%) |
| 75 Years and over | 48 (17.3%) | 119 (30.2%) |
Disability Class: Ambulatory Difficulty
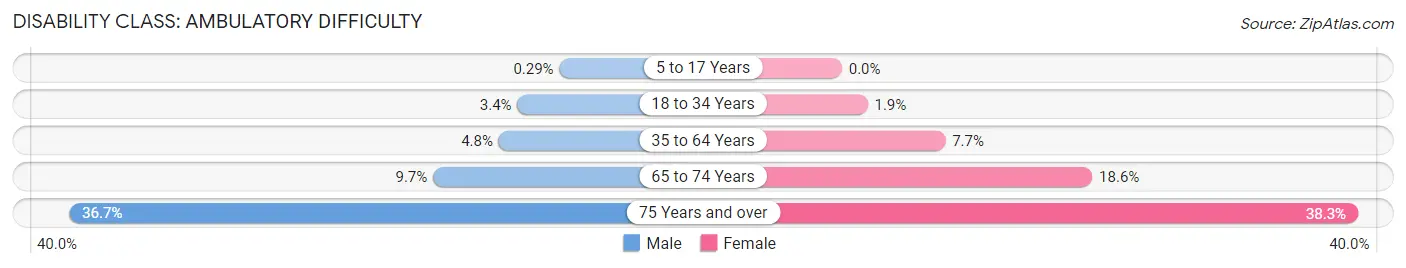
| Age Bracket | Male | Female |
| 5 to 17 Years | 2 (0.3%) | 0 (0.0%) |
| 18 to 34 Years | 36 (3.4%) | 18 (1.9%) |
| 35 to 64 Years | 85 (4.8%) | 170 (7.7%) |
| 65 to 74 Years | 59 (9.7%) | 119 (18.6%) |
| 75 Years and over | 102 (36.7%) | 151 (38.3%) |
Disability Class: Self-Care Difficulty
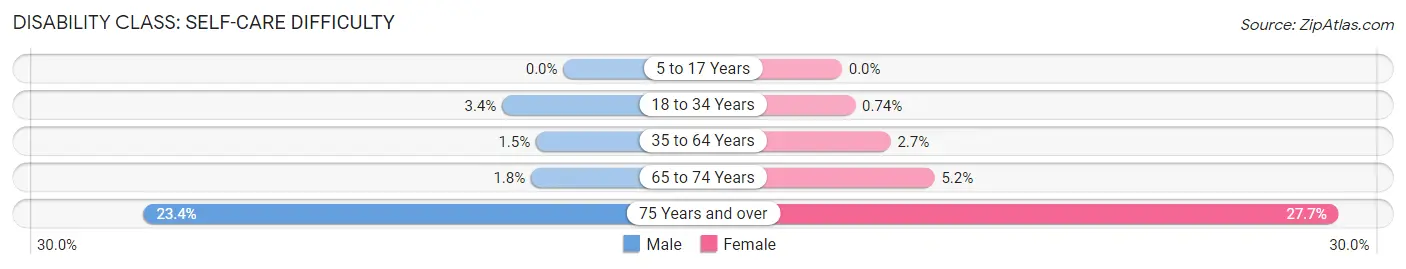
| Age Bracket | Male | Female |
| 5 to 17 Years | 0 (0.0%) | 0 (0.0%) |
| 18 to 34 Years | 36 (3.4%) | 7 (0.7%) |
| 35 to 64 Years | 27 (1.5%) | 60 (2.7%) |
| 65 to 74 Years | 11 (1.8%) | 33 (5.2%) |
| 75 Years and over | 65 (23.4%) | 109 (27.7%) |
Technology Access in Astoria
Computing Device Access in Astoria
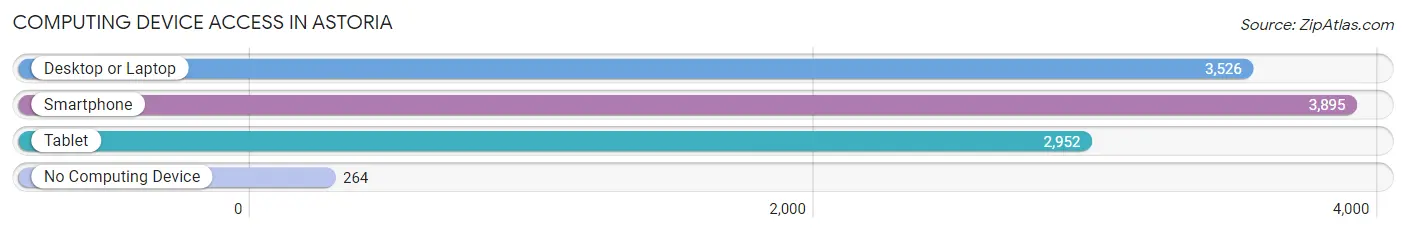
| Device Type | # Households | % Households |
| Desktop or Laptop | 3,526 | 79.8% |
| Smartphone | 3,895 | 88.1% |
| Tablet | 2,952 | 66.8% |
| No Computing Device | 264 | 6.0% |
| Total | 4,420 | 100.0% |
Internet Access in Astoria
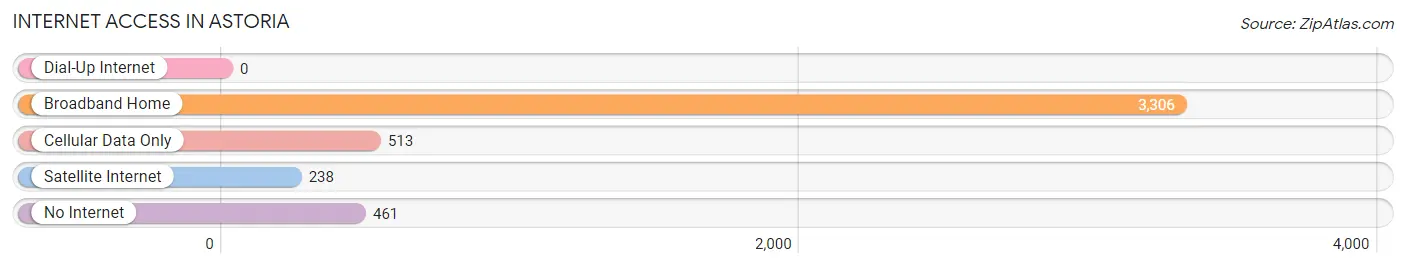
| Internet Type | # Households | % Households |
| Dial-Up Internet | 0 | 0.0% |
| Broadband Home | 3,306 | 74.8% |
| Cellular Data Only | 513 | 11.6% |
| Satellite Internet | 238 | 5.4% |
| No Internet | 461 | 10.4% |
| Total | 4,420 | 100.0% |
Astoria Summary
Astoria, Oregon is a city located in the northwest corner of the state, at the mouth of the Columbia River. It is the oldest American settlement west of the Rocky Mountains, and has a rich history of exploration, industry, and culture.
History
Astoria was founded in 1811 by John Jacob Astor, a German-American fur trader and entrepreneur. Astor had established the Pacific Fur Company in 1810, and sent a group of men to establish a trading post at the mouth of the Columbia River. The post was named Fort Astoria, and was the first permanent American settlement on the Pacific Coast.
The settlement quickly grew, and by 1813 it had become a bustling port town. It was a major hub for the fur trade, and also served as a supply point for ships traveling to and from the Pacific Northwest.
In 1846, the Oregon Treaty was signed, which established the border between the United States and British North America. This border ran through the middle of the Columbia River, and Astoria was divided between the two countries.
In 1848, the United States purchased the portion of Astoria that was in British North America, and the city was officially incorporated in 1876.
Geography
Astoria is located at the mouth of the Columbia River, where it meets the Pacific Ocean. The city is situated on a peninsula, with the Columbia River to the east and the Pacific Ocean to the west.
The city is surrounded by the Columbia River estuary, which is home to a variety of wildlife, including bald eagles, ospreys, and seals. The estuary is also a popular destination for fishing, boating, and other recreational activities.
The city is located in the temperate rainforest climate zone, and receives an average of over 80 inches of rain per year.
Economy
Astoria’s economy is largely based on fishing, tourism, and timber. The city is home to several seafood processing plants, and is a major port for commercial fishing vessels.
Tourism is also a major industry in Astoria, with visitors coming to explore the city’s rich history and natural beauty. The city is home to several museums, galleries, and other attractions, as well as a variety of outdoor activities.
The timber industry is also an important part of the local economy, with several sawmills and lumber yards located in the area.
Demographics
As of the 2010 census, Astoria had a population of 9,477. The city is predominantly white (90.2%), with smaller percentages of Hispanic (4.2%), Asian (2.2%), and African American (1.2%) residents.
The median household income in Astoria is $41,945, and the median home value is $182,400. The city has a poverty rate of 16.2%, and the unemployment rate is 6.2%.
Astoria is a diverse and vibrant city, with a rich history and a bright future. It is a great place to live, work, and play, and is a wonderful place to call home.
Common Questions
What is Per Capita Income in Astoria?
Per Capita income in Astoria is $38,742.
What is the Median Family Income in Astoria?
Median Family Income in Astoria is $88,268.
What is the Median Household income in Astoria?
Median Household Income in Astoria is $69,463.
What is Income or Wage Gap in Astoria?
Income or Wage Gap in Astoria is 7.9%.
Women in Astoria earn 92.1 cents for every dollar earned by a man.
What is Inequality or Gini Index in Astoria?
Inequality or Gini Index in Astoria is 0.45.
What is the Total Population of Astoria?
Total Population of Astoria is 10,184.
What is the Total Male Population of Astoria?
Total Male Population of Astoria is 5,039.
What is the Total Female Population of Astoria?
Total Female Population of Astoria is 5,145.
What is the Ratio of Males per 100 Females in Astoria?
There are 97.94 Males per 100 Females in Astoria.
What is the Ratio of Females per 100 Males in Astoria?
There are 102.10 Females per 100 Males in Astoria.
What is the Median Population Age in Astoria?
Median Population Age in Astoria is 42.0 Years.
What is the Average Family Size in Astoria
Average Family Size in Astoria is 2.9 People.
What is the Average Household Size in Astoria
Average Household Size in Astoria is 2.2 People.
How Large is the Labor Force in Astoria?
There are 5,077 People in the Labor Forcein in Astoria.
What is the Percentage of People in the Labor Force in Astoria?
61.1% of People are in the Labor Force in Astoria.
What is the Unemployment Rate in Astoria?
Unemployment Rate in Astoria is 3.8%.