Zip Codes with the Highest Percentage of Population Employed in Food Preparation & Serving in Klamath Falls, OR
RELATED REPORTS & OPTIONS
Food Preparation & Serving
Klamath Falls
Compare Zip Codes
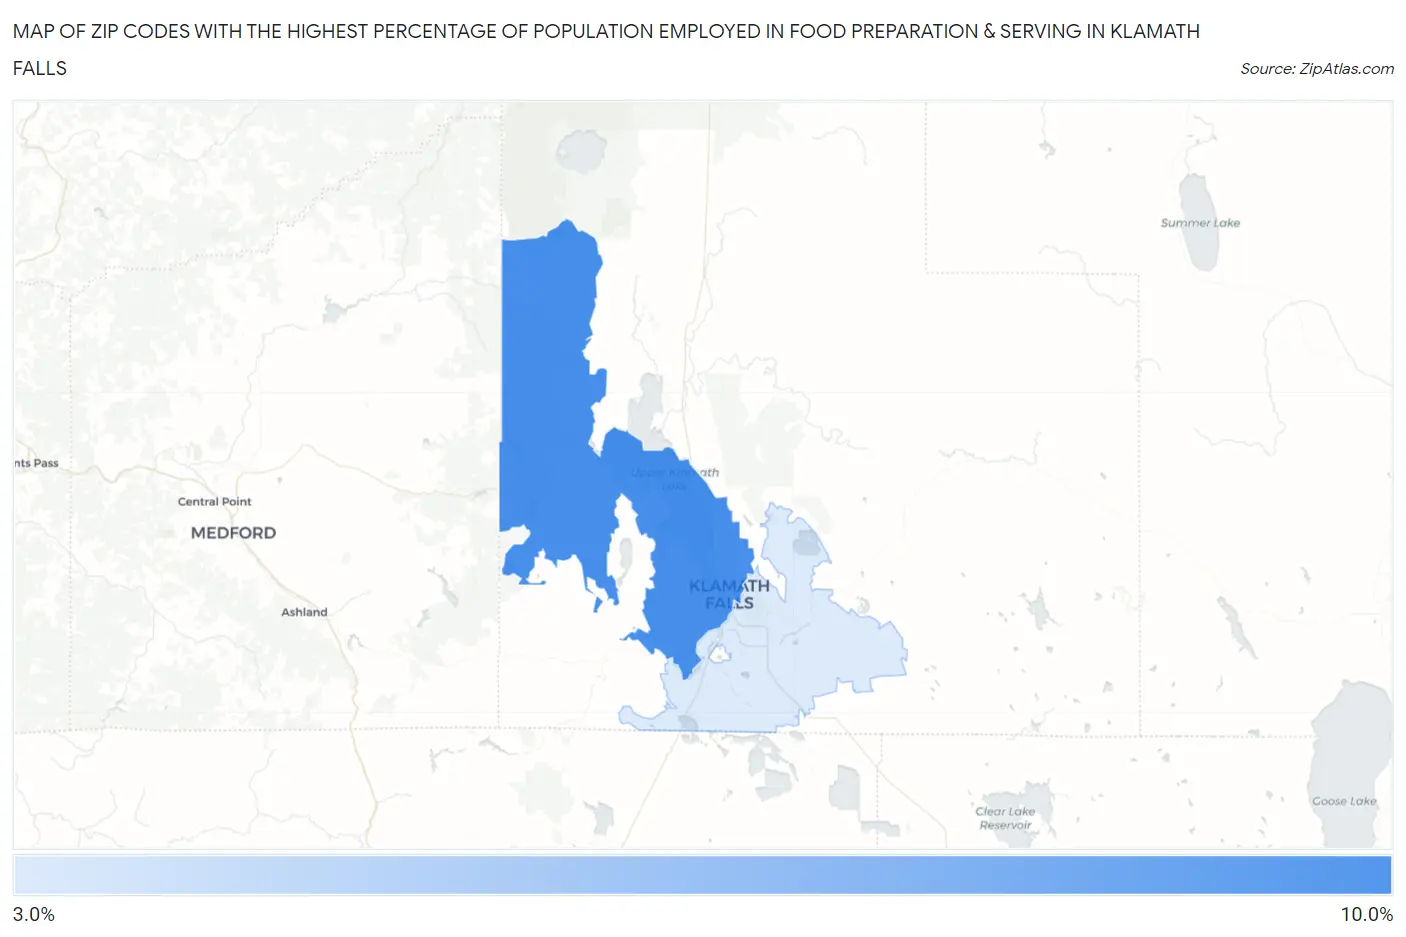
Map of Zip Codes with the Highest Percentage of Population Employed in Food Preparation & Serving in Klamath Falls
3.5%
8.3%
Zip Codes with the Highest Percentage of Population Employed in Food Preparation & Serving in Klamath Falls, OR
| Zip Code | % Employed | vs State | vs National | |
| 1. | 97601 | 8.3% | 5.9%(+2.34)#76 | 5.3%(+2.98)#4,354 |
| 2. | 97603 | 3.5% | 5.9%(-2.43)#251 | 5.3%(-1.79)#19,217 |
1
Common Questions
What are the Top Zip Codes with the Highest Percentage of Population Employed in Food Preparation & Serving in Klamath Falls, OR?
Top Zip Codes with the Highest Percentage of Population Employed in Food Preparation & Serving in Klamath Falls, OR are:
What zip code has the Highest Percentage of Population Employed in Food Preparation & Serving in Klamath Falls, OR?
97601 has the Highest Percentage of Population Employed in Food Preparation & Serving in Klamath Falls, OR with 8.3%.
What is the Percentage of Population Employed in Food Preparation & Serving in Klamath Falls, OR?
Percentage of Population Employed in Food Preparation & Serving in Klamath Falls is 7.2%.
What is the Percentage of Population Employed in Food Preparation & Serving in Oregon?
Percentage of Population Employed in Food Preparation & Serving in Oregon is 5.9%.
What is the Percentage of Population Employed in Food Preparation & Serving in the United States?
Percentage of Population Employed in Food Preparation & Serving in the United States is 5.3%.