Ashland, OR Map & Demographics
Ashland Map
Ashland Overview
$44,580
PER CAPITA INCOME
$108,403
AVG FAMILY INCOME
$64,767
AVG HOUSEHOLD INCOME
37.6%
WAGE / INCOME GAP [ % ]
62.4¢/ $1
WAGE / INCOME GAP [ $ ]
0.50
INEQUALITY / GINI INDEX
21,401
TOTAL POPULATION
9,872
MALE POPULATION
11,529
FEMALE POPULATION
85.63
MALES / 100 FEMALES
116.78
FEMALES / 100 MALES
48.2
MEDIAN AGE
2.6
AVG FAMILY SIZE
2.0
AVG HOUSEHOLD SIZE
10,862
LABOR FORCE [ PEOPLE ]
57.4%
PERCENT IN LABOR FORCE
5.7%
UNEMPLOYMENT RATE
Ashland Zip Codes
Ashland Area Codes
Income in Ashland
Income Overview in Ashland
Per Capita Income in Ashland is $44,580, while median incomes of families and households are $108,403 and $64,767 respectively.
| Characteristic | Number | Measure |
| Per Capita Income | 21,401 | $44,580 |
| Median Family Income | 5,150 | $108,403 |
| Mean Family Income | 5,150 | $128,994 |
| Median Household Income | 10,120 | $64,767 |
| Mean Household Income | 10,120 | $94,159 |
| Income Deficit | 5,150 | $0 |
| Wage / Income Gap (%) | 21,401 | 37.62% |
| Wage / Income Gap ($) | 21,401 | 62.38¢ per $1 |
| Gini / Inequality Index | 21,401 | 0.50 |
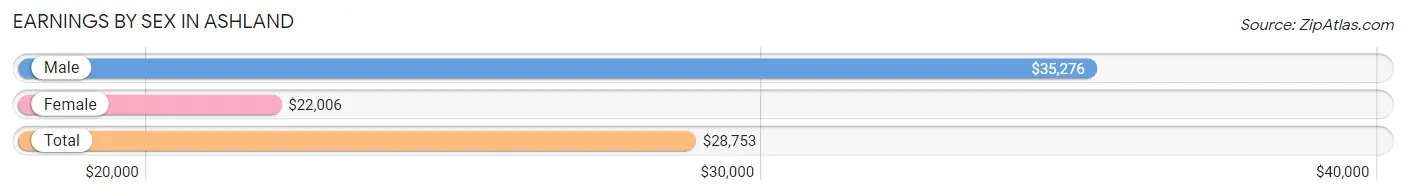
Earnings by Sex in Ashland
Average Earnings in Ashland are $28,753, $35,276 for men and $22,006 for women, a difference of 37.6%.
| Sex | Number | Average Earnings |
| Male | 5,788 (48.4%) | $35,276 |
| Female | 6,167 (51.6%) | $22,006 |
| Total | 11,955 (100.0%) | $28,753 |
Earnings by Sex by Income Bracket in Ashland
The most common earnings brackets in Ashland are $100,000+ for men (1,112 | 19.2%) and $2,499 or less for women (708 | 11.5%).
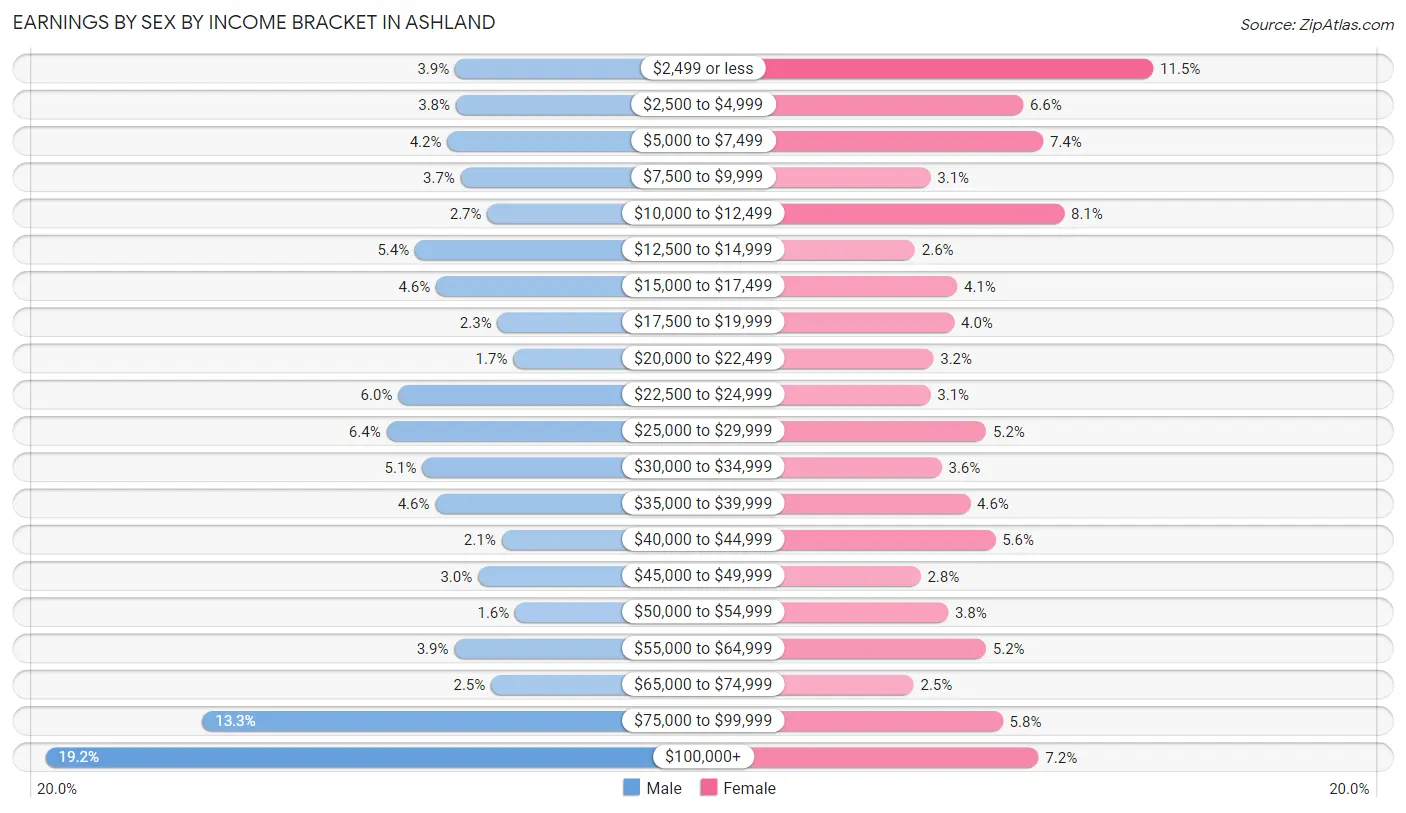
| Income | Male | Female |
| $2,499 or less | 224 (3.9%) | 708 (11.5%) |
| $2,500 to $4,999 | 222 (3.8%) | 407 (6.6%) |
| $5,000 to $7,499 | 241 (4.2%) | 453 (7.3%) |
| $7,500 to $9,999 | 212 (3.7%) | 193 (3.1%) |
| $10,000 to $12,499 | 154 (2.7%) | 502 (8.1%) |
| $12,500 to $14,999 | 311 (5.4%) | 157 (2.5%) |
| $15,000 to $17,499 | 265 (4.6%) | 255 (4.1%) |
| $17,500 to $19,999 | 132 (2.3%) | 248 (4.0%) |
| $20,000 to $22,499 | 98 (1.7%) | 200 (3.2%) |
| $22,500 to $24,999 | 347 (6.0%) | 193 (3.1%) |
| $25,000 to $29,999 | 373 (6.4%) | 322 (5.2%) |
| $30,000 to $34,999 | 295 (5.1%) | 219 (3.5%) |
| $35,000 to $39,999 | 267 (4.6%) | 285 (4.6%) |
| $40,000 to $44,999 | 123 (2.1%) | 343 (5.6%) |
| $45,000 to $49,999 | 174 (3.0%) | 170 (2.8%) |
| $50,000 to $54,999 | 94 (1.6%) | 234 (3.8%) |
| $55,000 to $64,999 | 226 (3.9%) | 321 (5.2%) |
| $65,000 to $74,999 | 146 (2.5%) | 154 (2.5%) |
| $75,000 to $99,999 | 772 (13.3%) | 360 (5.8%) |
| $100,000+ | 1,112 (19.2%) | 443 (7.2%) |
| Total | 5,788 (100.0%) | 6,167 (100.0%) |
Earnings by Sex by Educational Attainment in Ashland
Average earnings in Ashland are $45,801 for men and $35,436 for women, a difference of 22.6%. Men with an educational attainment of graduate degree enjoy the highest average annual earnings of $87,345, while those with high school diploma education earn the least with $26,042. Women with an educational attainment of graduate degree earn the most with the average annual earnings of $53,194, while those with high school diploma education have the smallest earnings of $11,302.
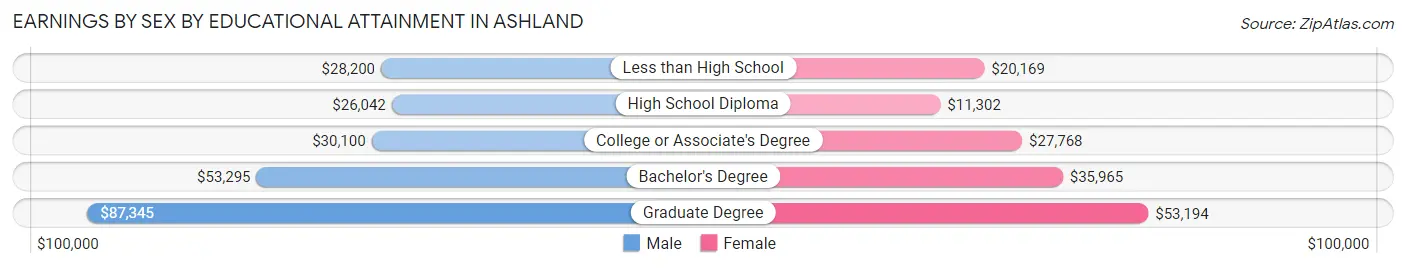
| Educational Attainment | Male Income | Female Income |
| Less than High School | $28,200 | $20,169 |
| High School Diploma | $26,042 | $11,302 |
| College or Associate's Degree | $30,100 | $27,768 |
| Bachelor's Degree | $53,295 | $35,965 |
| Graduate Degree | $87,345 | $53,194 |
| Total | $45,801 | $35,436 |
Family Income in Ashland
Family Income Brackets in Ashland
According to the Ashland family income data, there are 1,385 families falling into the $100,000 to $149,999 income range, which is the most common income bracket and makes up 26.9% of all families. Conversely, the $10,000 to $14,999 income bracket is the least frequent group with only 67 families (1.3%) belonging to this category.
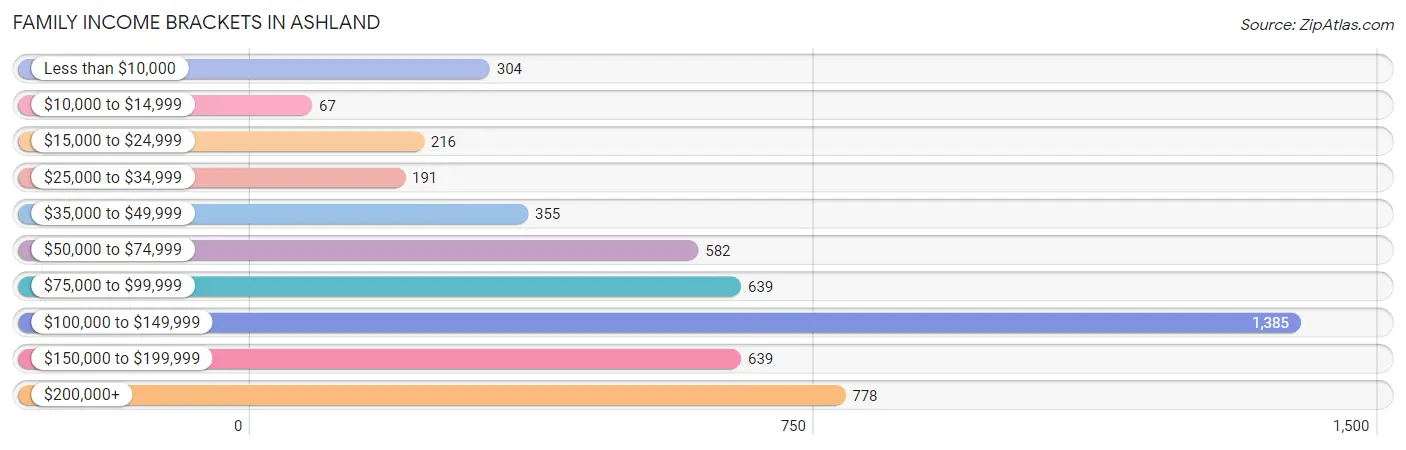
| Income Bracket | # Families | % Families |
| Less than $10,000 | 304 | 5.9% |
| $10,000 to $14,999 | 67 | 1.3% |
| $15,000 to $24,999 | 216 | 4.2% |
| $25,000 to $34,999 | 191 | 3.7% |
| $35,000 to $49,999 | 355 | 6.9% |
| $50,000 to $74,999 | 582 | 11.3% |
| $75,000 to $99,999 | 639 | 12.4% |
| $100,000 to $149,999 | 1,385 | 26.9% |
| $150,000 to $199,999 | 639 | 12.4% |
| $200,000+ | 778 | 15.1% |
Family Income by Famaliy Size in Ashland
6-person families (73 | 1.4%) account for the highest median family income in Ashland with $153,679 per family, while 2-person families (3,204 | 62.2%) have the highest median income of $49,896 per family member.
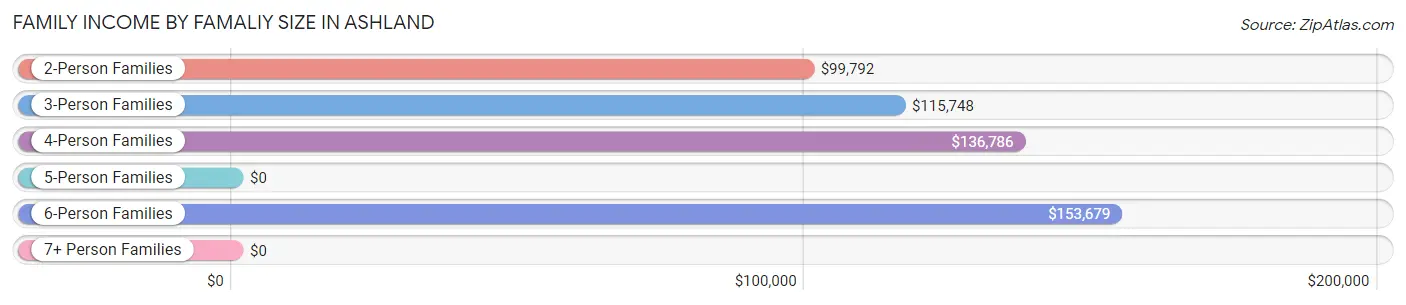
| Income Bracket | # Families | Median Income |
| 2-Person Families | 3,204 (62.2%) | $99,792 |
| 3-Person Families | 1,073 (20.8%) | $115,748 |
| 4-Person Families | 664 (12.9%) | $136,786 |
| 5-Person Families | 136 (2.6%) | $0 |
| 6-Person Families | 73 (1.4%) | $153,679 |
| 7+ Person Families | 0 (0.0%) | $0 |
| Total | 5,150 (100.0%) | $108,403 |
Family Income by Number of Earners in Ashland
The median family income in Ashland is $108,403, with families comprising 2 earners (2,069) having the highest median family income of $127,440, while families with no earners (1,065) have the lowest median family income of $81,631, accounting for 40.2% and 20.7% of families, respectively.
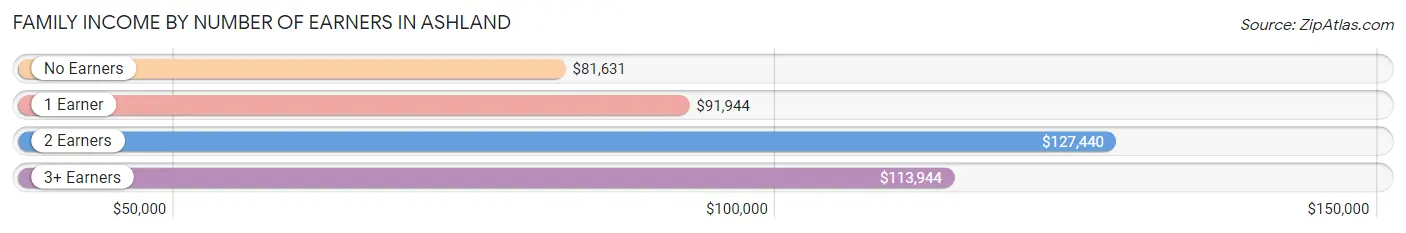
| Number of Earners | # Families | Median Income |
| No Earners | 1,065 (20.7%) | $81,631 |
| 1 Earner | 1,774 (34.4%) | $91,944 |
| 2 Earners | 2,069 (40.2%) | $127,440 |
| 3+ Earners | 242 (4.7%) | $113,944 |
| Total | 5,150 (100.0%) | $108,403 |
Household Income in Ashland
Household Income Brackets in Ashland
With 1,690 households falling in the category, the $100,000 to $149,999 income range is the most frequent in Ashland, accounting for 16.7% of all households. In contrast, only 385 households (3.8%) fall into the $10,000 to $14,999 income bracket, making it the least populous group.
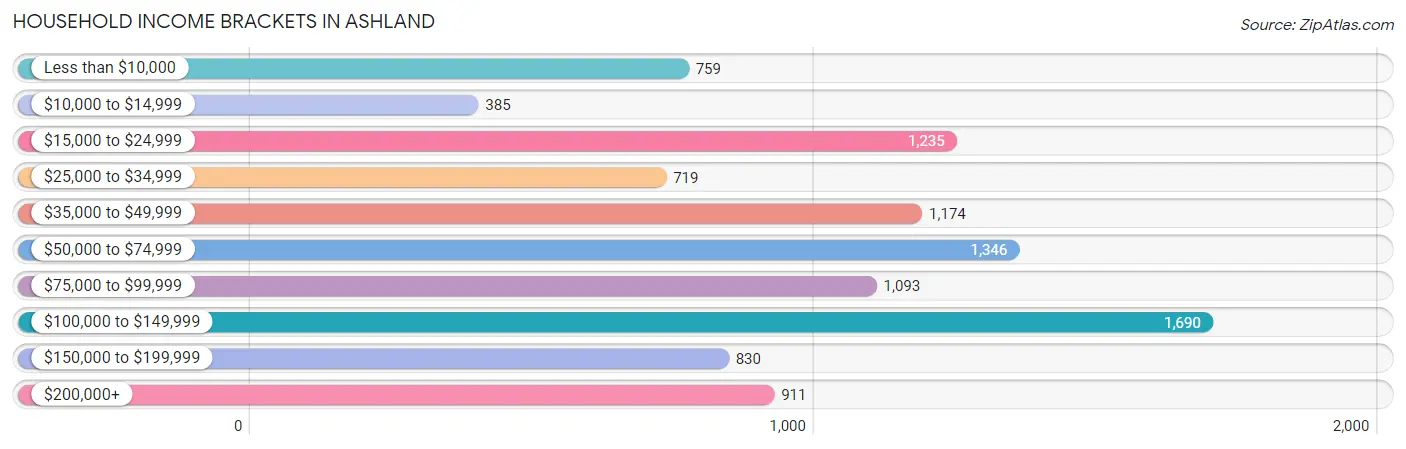
| Income Bracket | # Households | % Households |
| Less than $10,000 | 759 | 7.5% |
| $10,000 to $14,999 | 385 | 3.8% |
| $15,000 to $24,999 | 1,235 | 12.2% |
| $25,000 to $34,999 | 719 | 7.1% |
| $35,000 to $49,999 | 1,174 | 11.6% |
| $50,000 to $74,999 | 1,346 | 13.3% |
| $75,000 to $99,999 | 1,093 | 10.8% |
| $100,000 to $149,999 | 1,690 | 16.7% |
| $150,000 to $199,999 | 830 | 8.2% |
| $200,000+ | 911 | 9.0% |
Household Income by Householder Age in Ashland
The median household income in Ashland is $64,767, with the highest median household income of $104,263 found in the 45 to 64 years age bracket for the primary householder. A total of 3,161 households (31.2%) fall into this category. Meanwhile, the 15 to 24 years age bracket for the primary householder has the lowest median household income of $22,970, with 941 households (9.3%) in this group.
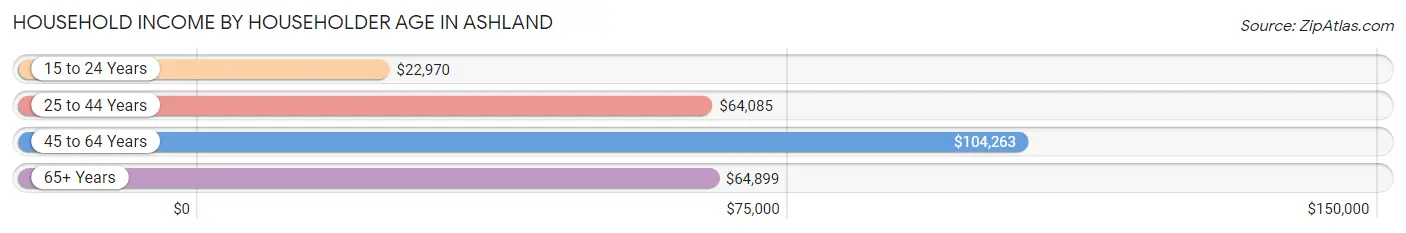
| Income Bracket | # Households | Median Income |
| 15 to 24 Years | 941 (9.3%) | $22,970 |
| 25 to 44 Years | 2,061 (20.4%) | $64,085 |
| 45 to 64 Years | 3,161 (31.2%) | $104,263 |
| 65+ Years | 3,957 (39.1%) | $64,899 |
| Total | 10,120 (100.0%) | $64,767 |
Poverty in Ashland
Income Below Poverty by Sex and Age in Ashland
With 17.3% poverty level for males and 18.5% for females among the residents of Ashland, 18 to 24 year old males and 18 to 24 year old females are the most vulnerable to poverty, with 529 males (57.1%) and 696 females (53.0%) in their respective age groups living below the poverty level.
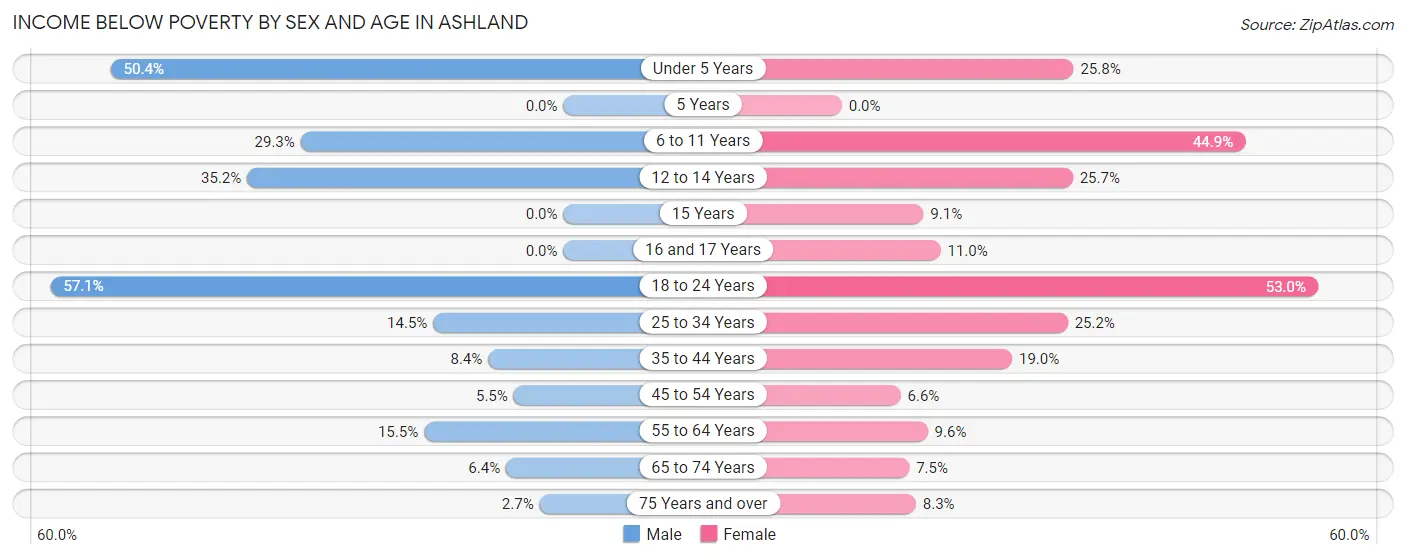
| Age Bracket | Male | Female |
| Under 5 Years | 246 (50.4%) | 81 (25.8%) |
| 5 Years | 0 (0.0%) | 0 (0.0%) |
| 6 to 11 Years | 122 (29.3%) | 207 (44.9%) |
| 12 to 14 Years | 81 (35.2%) | 71 (25.7%) |
| 15 Years | 0 (0.0%) | 8 (9.1%) |
| 16 and 17 Years | 0 (0.0%) | 23 (11.0%) |
| 18 to 24 Years | 529 (57.1%) | 696 (53.0%) |
| 25 to 34 Years | 157 (14.5%) | 241 (25.2%) |
| 35 to 44 Years | 98 (8.4%) | 196 (19.0%) |
| 45 to 54 Years | 57 (5.5%) | 88 (6.6%) |
| 55 to 64 Years | 243 (15.5%) | 136 (9.6%) |
| 65 to 74 Years | 108 (6.4%) | 163 (7.5%) |
| 75 Years and over | 21 (2.7%) | 103 (8.3%) |
| Total | 1,662 (17.3%) | 2,013 (18.5%) |
Income Above Poverty by Sex and Age in Ashland
According to the poverty statistics in Ashland, males aged 5 years and females aged 5 years are the age groups that are most secure financially, with 100.0% of males and 100.0% of females in these age groups living above the poverty line.
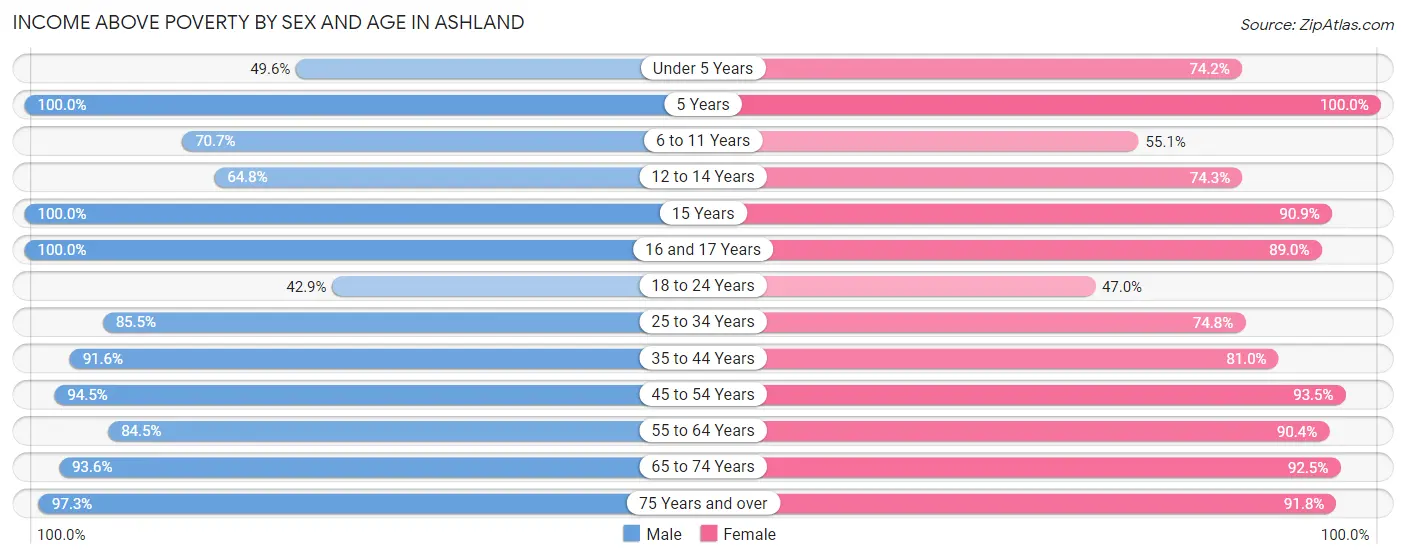
| Age Bracket | Male | Female |
| Under 5 Years | 242 (49.6%) | 233 (74.2%) |
| 5 Years | 38 (100.0%) | 66 (100.0%) |
| 6 to 11 Years | 295 (70.7%) | 254 (55.1%) |
| 12 to 14 Years | 149 (64.8%) | 205 (74.3%) |
| 15 Years | 97 (100.0%) | 80 (90.9%) |
| 16 and 17 Years | 91 (100.0%) | 186 (89.0%) |
| 18 to 24 Years | 397 (42.9%) | 617 (47.0%) |
| 25 to 34 Years | 926 (85.5%) | 717 (74.8%) |
| 35 to 44 Years | 1,071 (91.6%) | 838 (81.0%) |
| 45 to 54 Years | 972 (94.5%) | 1,255 (93.4%) |
| 55 to 64 Years | 1,323 (84.5%) | 1,287 (90.4%) |
| 65 to 74 Years | 1,581 (93.6%) | 2,008 (92.5%) |
| 75 Years and over | 767 (97.3%) | 1,146 (91.7%) |
| Total | 7,949 (82.7%) | 8,892 (81.5%) |
Income Below Poverty Among Married-Couple Families in Ashland
The poverty statistics for married-couple families in Ashland show that 3.1% or 123 of the total 3,976 families live below the poverty line. Families with 3 or 4 children have the highest poverty rate of 23.9%, comprising of 11 families. On the other hand, families with no children have the lowest poverty rate of 2.4%, which includes 71 families.
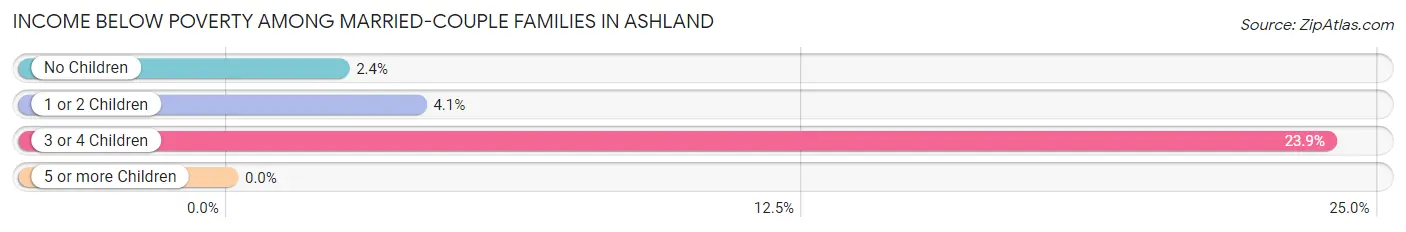
| Children | Above Poverty | Below Poverty |
| No Children | 2,860 (97.6%) | 71 (2.4%) |
| 1 or 2 Children | 958 (95.9%) | 41 (4.1%) |
| 3 or 4 Children | 35 (76.1%) | 11 (23.9%) |
| 5 or more Children | 0 (0.0%) | 0 (0.0%) |
| Total | 3,853 (96.9%) | 123 (3.1%) |
Income Below Poverty Among Single-Parent Households in Ashland
According to the poverty data in Ashland, 6.4% or 19 single-father households and 42.1% or 368 single-mother households are living below the poverty line. Among single-father households, those with 1 or 2 children have the highest poverty rate, with 19 households (18.6%) experiencing poverty. Likewise, among single-mother households, those with 3 or 4 children have the highest poverty rate, with 135 households (91.2%) falling below the poverty line.
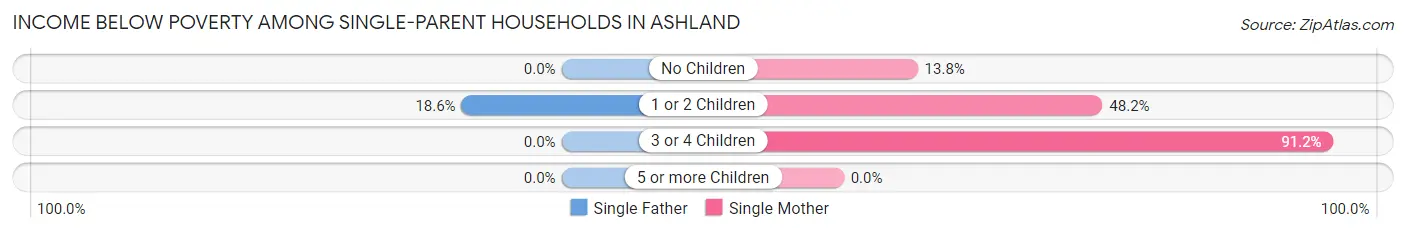
| Children | Single Father | Single Mother |
| No Children | 0 (0.0%) | 47 (13.8%) |
| 1 or 2 Children | 19 (18.6%) | 186 (48.2%) |
| 3 or 4 Children | 0 (0.0%) | 135 (91.2%) |
| 5 or more Children | 0 (0.0%) | 0 (0.0%) |
| Total | 19 (6.4%) | 368 (42.1%) |
Income Below Poverty Among Married-Couple vs Single-Parent Households in Ashland
The poverty data for Ashland shows that 123 of the married-couple family households (3.1%) and 387 of the single-parent households (33.0%) are living below the poverty level. Within the married-couple family households, those with 3 or 4 children have the highest poverty rate, with 11 households (23.9%) falling below the poverty line. Among the single-parent households, those with 3 or 4 children have the highest poverty rate, with 135 household (91.2%) living below poverty.
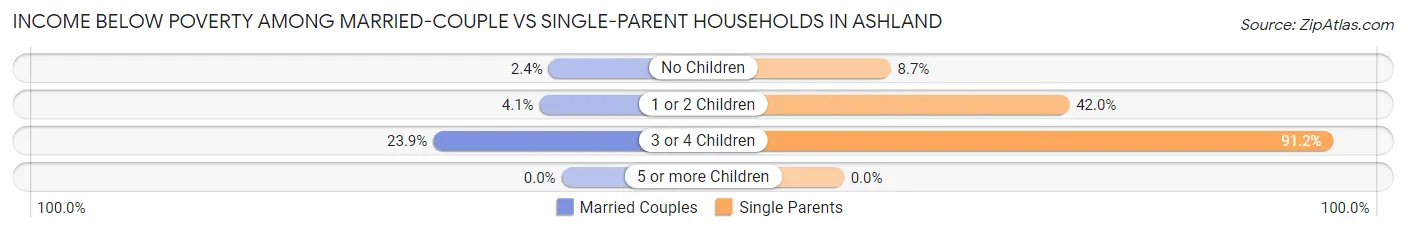
| Children | Married-Couple Families | Single-Parent Households |
| No Children | 71 (2.4%) | 47 (8.7%) |
| 1 or 2 Children | 41 (4.1%) | 205 (42.0%) |
| 3 or 4 Children | 11 (23.9%) | 135 (91.2%) |
| 5 or more Children | 0 (0.0%) | 0 (0.0%) |
| Total | 123 (3.1%) | 387 (33.0%) |
Race in Ashland
The most populous races in Ashland are White / Caucasian (18,585 | 86.8%), Hispanic or Latino (2,156 | 10.1%), and Two or more Races (1,803 | 8.4%).
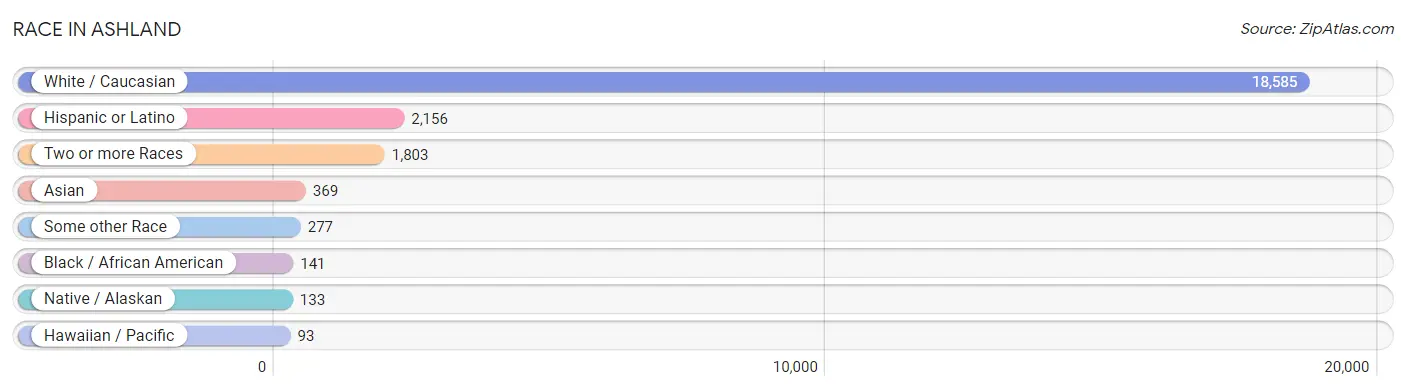
| Race | # Population | % Population |
| Asian | 369 | 1.7% |
| Black / African American | 141 | 0.7% |
| Hawaiian / Pacific | 93 | 0.4% |
| Hispanic or Latino | 2,156 | 10.1% |
| Native / Alaskan | 133 | 0.6% |
| White / Caucasian | 18,585 | 86.8% |
| Two or more Races | 1,803 | 8.4% |
| Some other Race | 277 | 1.3% |
| Total | 21,401 | 100.0% |
Ancestry in Ashland
The most populous ancestries reported in Ashland are English (4,161 | 19.4%), German (3,697 | 17.3%), Irish (3,193 | 14.9%), Italian (1,556 | 7.3%), and French (1,321 | 6.2%), together accounting for 65.1% of all Ashland residents.
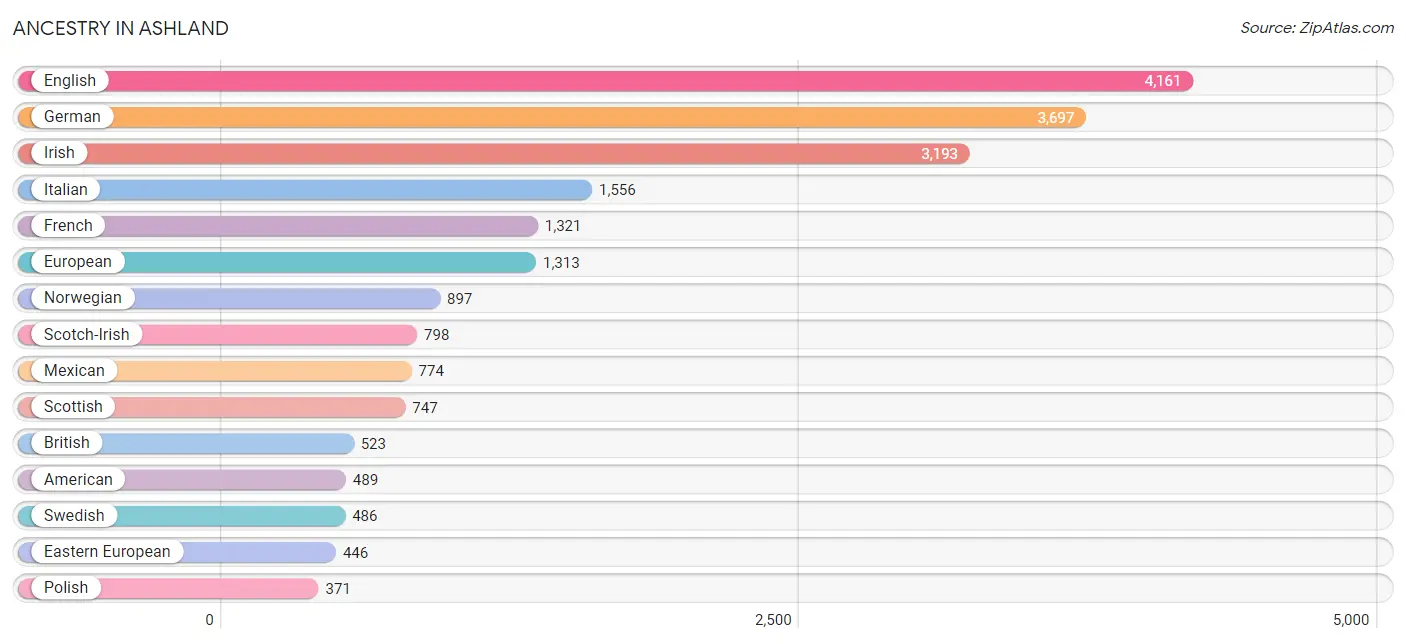
| Ancestry | # Population | % Population |
| African | 89 | 0.4% |
| Alsatian | 13 | 0.1% |
| American | 489 | 2.3% |
| Apache | 25 | 0.1% |
| Arab | 225 | 1.1% |
| Argentinean | 21 | 0.1% |
| Armenian | 48 | 0.2% |
| Austrian | 204 | 0.9% |
| Basque | 72 | 0.3% |
| Belgian | 88 | 0.4% |
| Bhutanese | 264 | 1.2% |
| Blackfeet | 38 | 0.2% |
| Brazilian | 20 | 0.1% |
| British | 523 | 2.4% |
| Burmese | 155 | 0.7% |
| Canadian | 50 | 0.2% |
| Central American | 290 | 1.4% |
| Central American Indian | 24 | 0.1% |
| Cherokee | 168 | 0.8% |
| Choctaw | 12 | 0.1% |
| Colombian | 86 | 0.4% |
| Costa Rican | 181 | 0.9% |
| Creek | 30 | 0.1% |
| Croatian | 129 | 0.6% |
| Cuban | 53 | 0.3% |
| Czech | 222 | 1.0% |
| Czechoslovakian | 95 | 0.4% |
| Danish | 142 | 0.7% |
| Dominican | 25 | 0.1% |
| Dutch | 215 | 1.0% |
| Eastern European | 446 | 2.1% |
| English | 4,161 | 19.4% |
| European | 1,313 | 6.1% |
| Finnish | 123 | 0.6% |
| French | 1,321 | 6.2% |
| French Canadian | 113 | 0.5% |
| German | 3,697 | 17.3% |
| Greek | 38 | 0.2% |
| Guamanian / Chamorro | 4 | 0.0% |
| Guatemalan | 36 | 0.2% |
| Honduran | 3 | 0.0% |
| Hungarian | 145 | 0.7% |
| Icelander | 45 | 0.2% |
| Indian (Asian) | 280 | 1.3% |
| Irish | 3,193 | 14.9% |
| Iroquois | 50 | 0.2% |
| Israeli | 5 | 0.0% |
| Italian | 1,556 | 7.3% |
| Japanese | 13 | 0.1% |
| Korean | 80 | 0.4% |
| Latvian | 19 | 0.1% |
| Lebanese | 28 | 0.1% |
| Lithuanian | 45 | 0.2% |
| Malaysian | 4 | 0.0% |
| Mexican | 774 | 3.6% |
| Mexican American Indian | 35 | 0.2% |
| Native Hawaiian | 99 | 0.5% |
| Nicaraguan | 6 | 0.0% |
| Northern European | 140 | 0.6% |
| Norwegian | 897 | 4.2% |
| Pakistani | 4 | 0.0% |
| Pennsylvania German | 19 | 0.1% |
| Peruvian | 38 | 0.2% |
| Polish | 371 | 1.7% |
| Portuguese | 74 | 0.4% |
| Pueblo | 15 | 0.1% |
| Puerto Rican | 122 | 0.6% |
| Romanian | 51 | 0.2% |
| Russian | 305 | 1.4% |
| Salvadoran | 64 | 0.3% |
| Samoan | 37 | 0.2% |
| Scandinavian | 166 | 0.8% |
| Scotch-Irish | 798 | 3.7% |
| Scottish | 747 | 3.5% |
| Sioux | 29 | 0.1% |
| Slovak | 88 | 0.4% |
| Slovene | 20 | 0.1% |
| South American | 216 | 1.0% |
| South American Indian | 16 | 0.1% |
| Spaniard | 344 | 1.6% |
| Spanish | 188 | 0.9% |
| Sri Lankan | 58 | 0.3% |
| Subsaharan African | 96 | 0.4% |
| Swedish | 486 | 2.3% |
| Swiss | 127 | 0.6% |
| Thai | 48 | 0.2% |
| Tongan | 35 | 0.2% |
| Ukrainian | 98 | 0.5% |
| Venezuelan | 71 | 0.3% |
| Welsh | 150 | 0.7% |
| Yugoslavian | 18 | 0.1% | View All 91 Rows |
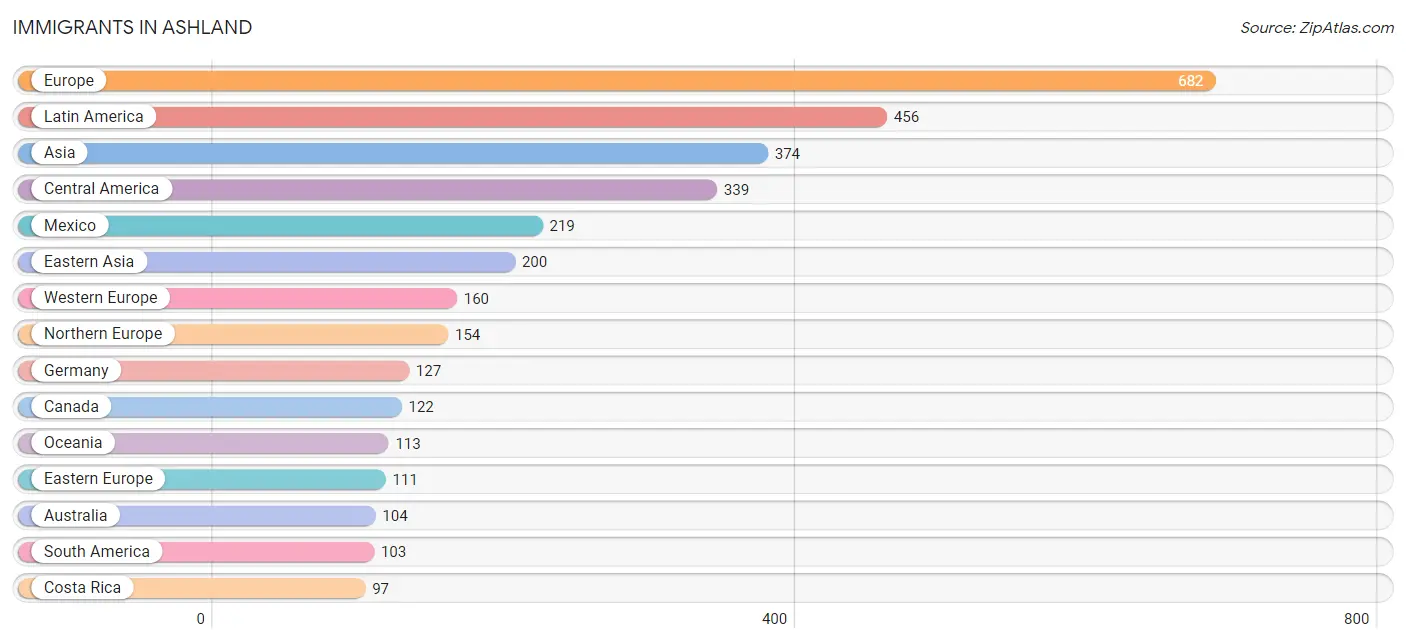
Immigrants in Ashland
The most numerous immigrant groups reported in Ashland came from Europe (682 | 3.2%), Latin America (456 | 2.1%), Asia (374 | 1.8%), Central America (339 | 1.6%), and Mexico (219 | 1.0%), together accounting for 9.7% of all Ashland residents.
| Immigration Origin | # Population | % Population |
| Africa | 4 | 0.0% |
| Argentina | 21 | 0.1% |
| Asia | 374 | 1.8% |
| Australia | 104 | 0.5% |
| Austria | 10 | 0.1% |
| Canada | 122 | 0.6% |
| Caribbean | 14 | 0.1% |
| Central America | 339 | 1.6% |
| China | 89 | 0.4% |
| Costa Rica | 97 | 0.4% |
| Cuba | 14 | 0.1% |
| Czechoslovakia | 54 | 0.3% |
| Denmark | 16 | 0.1% |
| Eastern Asia | 200 | 0.9% |
| Eastern Europe | 111 | 0.5% |
| England | 54 | 0.3% |
| Europe | 682 | 3.2% |
| France | 14 | 0.1% |
| Germany | 127 | 0.6% |
| Guatemala | 20 | 0.1% |
| Honduras | 3 | 0.0% |
| India | 28 | 0.1% |
| Israel | 45 | 0.2% |
| Italy | 14 | 0.1% |
| Japan | 56 | 0.3% |
| Kazakhstan | 5 | 0.0% |
| Korea | 55 | 0.3% |
| Latin America | 456 | 2.1% |
| Latvia | 19 | 0.1% |
| Mexico | 219 | 1.0% |
| Netherlands | 9 | 0.0% |
| Northern Europe | 154 | 0.7% |
| Norway | 6 | 0.0% |
| Oceania | 113 | 0.5% |
| Philippines | 46 | 0.2% |
| Romania | 12 | 0.1% |
| Russia | 26 | 0.1% |
| South Africa | 4 | 0.0% |
| South America | 103 | 0.5% |
| South Central Asia | 33 | 0.2% |
| South Eastern Asia | 96 | 0.4% |
| Southern Europe | 30 | 0.1% |
| Spain | 16 | 0.1% |
| Venezuela | 82 | 0.4% |
| Vietnam | 50 | 0.2% |
| Western Asia | 45 | 0.2% |
| Western Europe | 160 | 0.7% | View All 47 Rows |
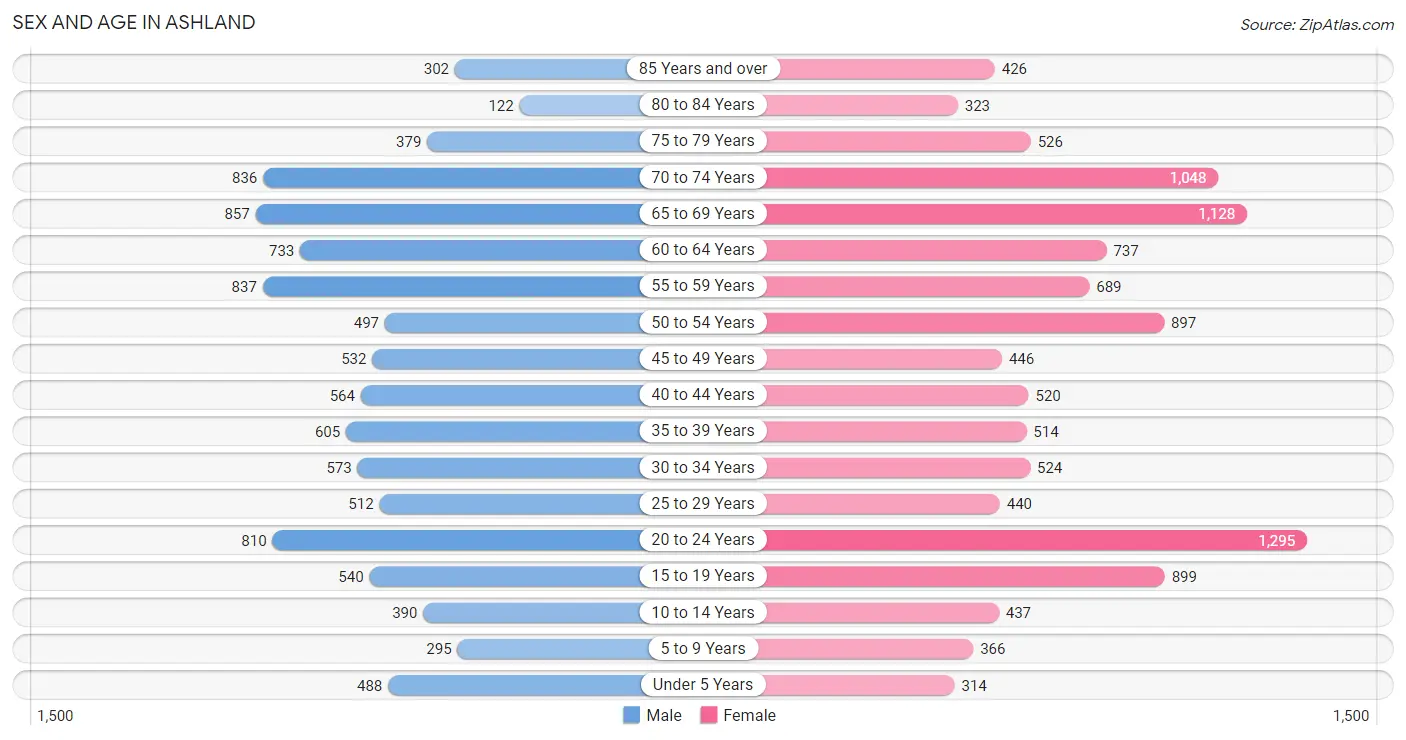
Sex and Age in Ashland
Sex and Age in Ashland
The most populous age groups in Ashland are 65 to 69 Years (857 | 8.7%) for men and 20 to 24 Years (1,295 | 11.2%) for women.
| Age Bracket | Male | Female |
| Under 5 Years | 488 (4.9%) | 314 (2.7%) |
| 5 to 9 Years | 295 (3.0%) | 366 (3.2%) |
| 10 to 14 Years | 390 (4.0%) | 437 (3.8%) |
| 15 to 19 Years | 540 (5.5%) | 899 (7.8%) |
| 20 to 24 Years | 810 (8.2%) | 1,295 (11.2%) |
| 25 to 29 Years | 512 (5.2%) | 440 (3.8%) |
| 30 to 34 Years | 573 (5.8%) | 524 (4.5%) |
| 35 to 39 Years | 605 (6.1%) | 514 (4.5%) |
| 40 to 44 Years | 564 (5.7%) | 520 (4.5%) |
| 45 to 49 Years | 532 (5.4%) | 446 (3.9%) |
| 50 to 54 Years | 497 (5.0%) | 897 (7.8%) |
| 55 to 59 Years | 837 (8.5%) | 689 (6.0%) |
| 60 to 64 Years | 733 (7.4%) | 737 (6.4%) |
| 65 to 69 Years | 857 (8.7%) | 1,128 (9.8%) |
| 70 to 74 Years | 836 (8.5%) | 1,048 (9.1%) |
| 75 to 79 Years | 379 (3.8%) | 526 (4.6%) |
| 80 to 84 Years | 122 (1.2%) | 323 (2.8%) |
| 85 Years and over | 302 (3.1%) | 426 (3.7%) |
| Total | 9,872 (100.0%) | 11,529 (100.0%) |
Families and Households in Ashland
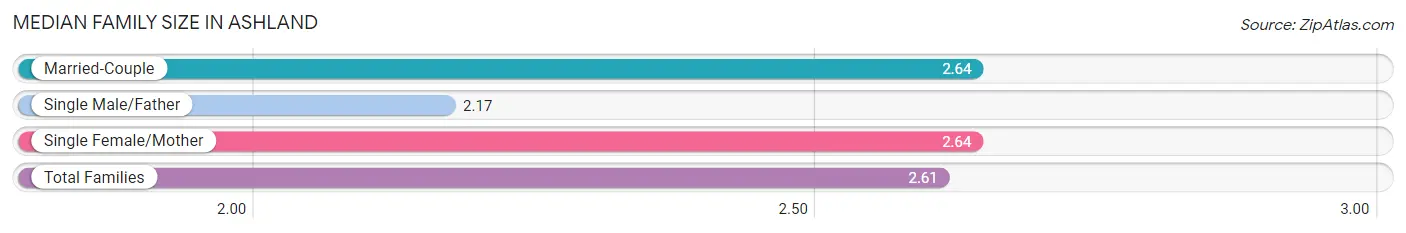
Median Family Size in Ashland
The median family size in Ashland is 2.61 persons per family, with married-couple families (3,976 | 77.2%) accounting for the largest median family size of 2.64 persons per family. On the other hand, single male/father families (299 | 5.8%) represent the smallest median family size with 2.17 persons per family.
| Family Type | # Families | Family Size |
| Married-Couple | 3,976 (77.2%) | 2.64 |
| Single Male/Father | 299 (5.8%) | 2.17 |
| Single Female/Mother | 875 (17.0%) | 2.64 |
| Total Families | 5,150 (100.0%) | 2.61 |
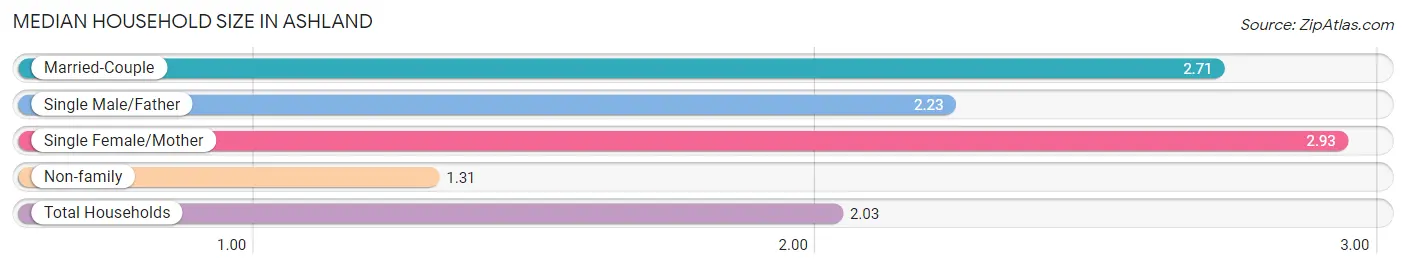
Median Household Size in Ashland
The median household size in Ashland is 2.03 persons per household, with single female/mother households (875 | 8.6%) accounting for the largest median household size of 2.93 persons per household. non-family households (4,970 | 49.1%) represent the smallest median household size with 1.31 persons per household.
| Household Type | # Households | Household Size |
| Married-Couple | 3,976 (39.3%) | 2.71 |
| Single Male/Father | 299 (2.9%) | 2.23 |
| Single Female/Mother | 875 (8.6%) | 2.93 |
| Non-family | 4,970 (49.1%) | 1.31 |
| Total Households | 10,120 (100.0%) | 2.03 |
Household Size by Marriage Status in Ashland
Out of a total of 10,120 households in Ashland, 5,150 (50.9%) are family households, while 4,970 (49.1%) are nonfamily households. The most numerous type of family households are 2-person households, comprising 2,980, and the most common type of nonfamily households are 1-person households, comprising 3,664.
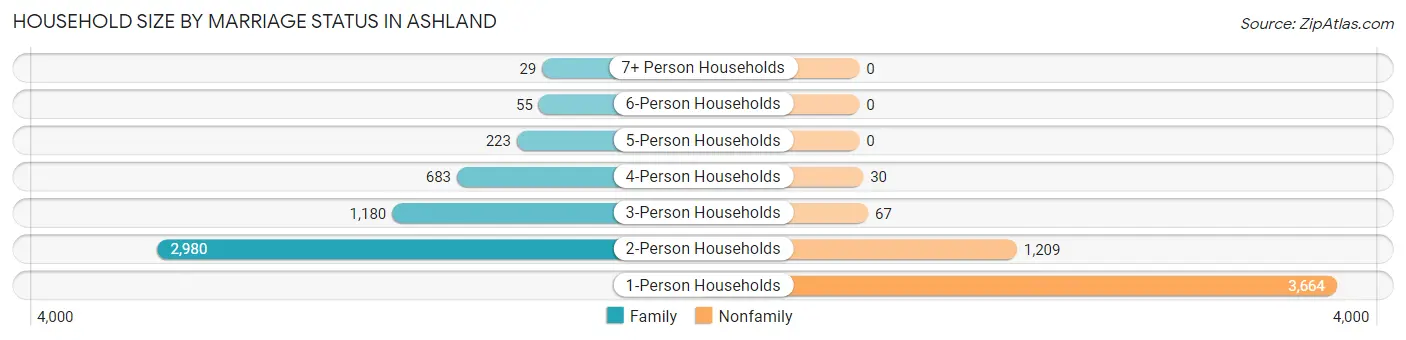
| Household Size | Family Households | Nonfamily Households |
| 1-Person Households | - | 3,664 (36.2%) |
| 2-Person Households | 2,980 (29.4%) | 1,209 (11.9%) |
| 3-Person Households | 1,180 (11.7%) | 67 (0.7%) |
| 4-Person Households | 683 (6.8%) | 30 (0.3%) |
| 5-Person Households | 223 (2.2%) | 0 (0.0%) |
| 6-Person Households | 55 (0.5%) | 0 (0.0%) |
| 7+ Person Households | 29 (0.3%) | 0 (0.0%) |
| Total | 5,150 (50.9%) | 4,970 (49.1%) |
Female Fertility in Ashland
Fertility by Age in Ashland
Average fertility rate in Ashland is 24.0 births per 1,000 women. Women in the age bracket of 20 to 34 years have the highest fertility rate with 36.0 births per 1,000 women. Women in the age bracket of 20 to 34 years acount for 69.2% of all women with births.
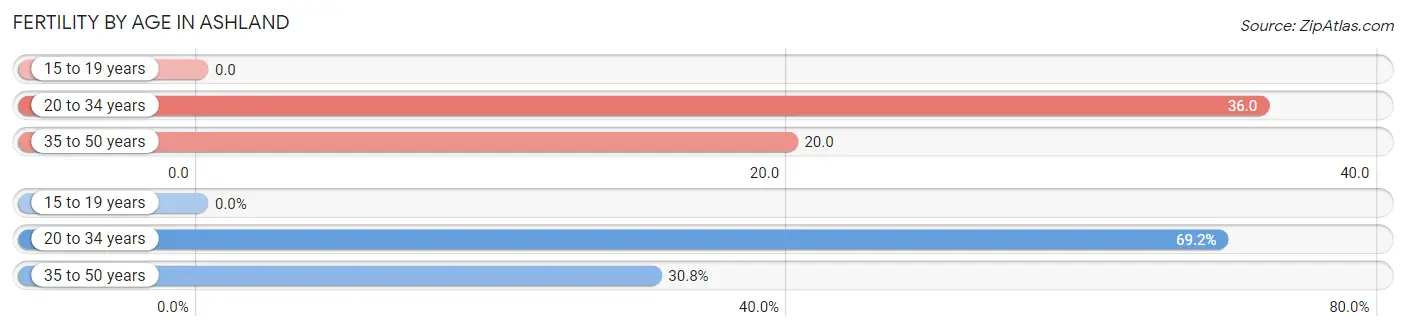
| Age Bracket | Women with Births | Births / 1,000 Women |
| 15 to 19 years | 0 (0.0%) | 0.0 |
| 20 to 34 years | 81 (69.2%) | 36.0 |
| 35 to 50 years | 36 (30.8%) | 20.0 |
| Total | 117 (100.0%) | 24.0 |
Fertility by Age by Marriage Status in Ashland
87.2% of women with births (117) in Ashland are married. The highest percentage of unmarried women with births falls into 20 to 34 years age bracket with 18.5% of them unmarried at the time of birth, while the lowest percentage of unmarried women with births belong to 35 to 50 years age bracket with 0.0% of them unmarried.
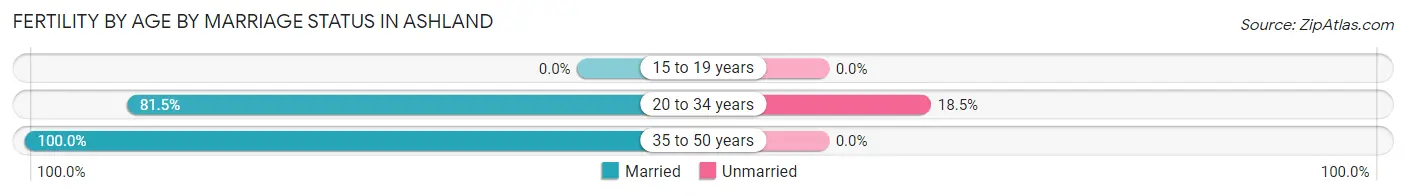
| Age Bracket | Married | Unmarried |
| 15 to 19 years | 0 (0.0%) | 0 (0.0%) |
| 20 to 34 years | 66 (81.5%) | 15 (18.5%) |
| 35 to 50 years | 36 (100.0%) | 0 (0.0%) |
| Total | 102 (87.2%) | 15 (12.8%) |
Fertility by Education in Ashland
Average fertility rate in Ashland is 24.0 births per 1,000 women. Women with the education attainment of bachelor's degree have the highest fertility rate of 41.0 births per 1,000 women, while women with the education attainment of less than high school have the lowest fertility at 3.0 births per 1,000 women. Women with the education attainment of bachelor's degree represent 39.3% of all women with births.
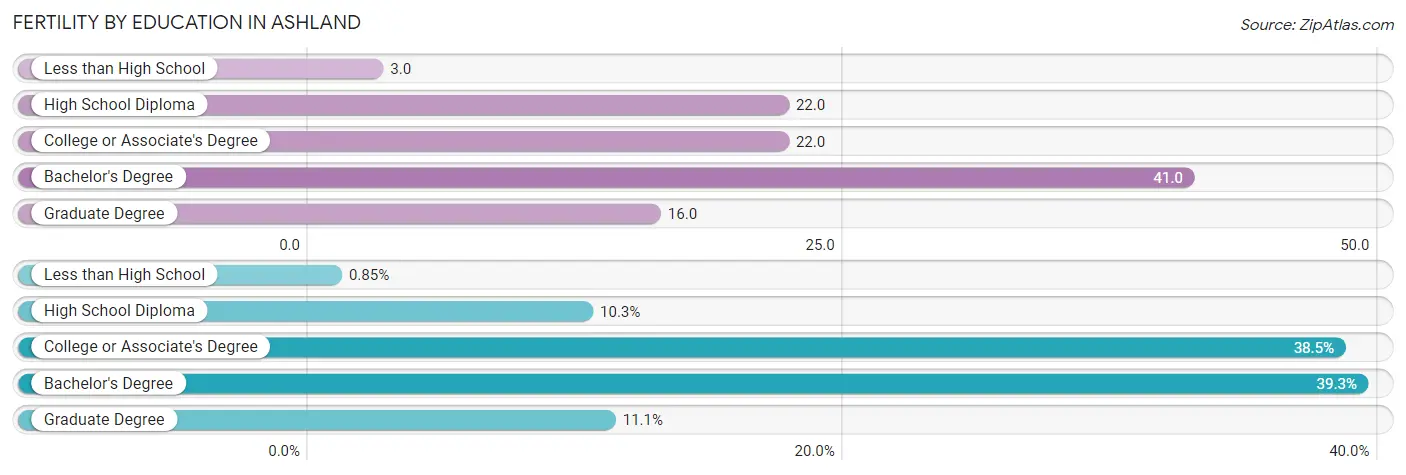
| Educational Attainment | Women with Births | Births / 1,000 Women |
| Less than High School | 1 (0.9%) | 3.0 |
| High School Diploma | 12 (10.3%) | 22.0 |
| College or Associate's Degree | 45 (38.5%) | 22.0 |
| Bachelor's Degree | 46 (39.3%) | 41.0 |
| Graduate Degree | 13 (11.1%) | 16.0 |
| Total | 117 (100.0%) | 24.0 |
Fertility by Education by Marriage Status in Ashland
12.8% of women with births in Ashland are unmarried. Women with the educational attainment of high school diploma are most likely to be married with 100.0% of them married at childbirth, while women with the educational attainment of less than high school are least likely to be married with 100.0% of them unmarried at childbirth.
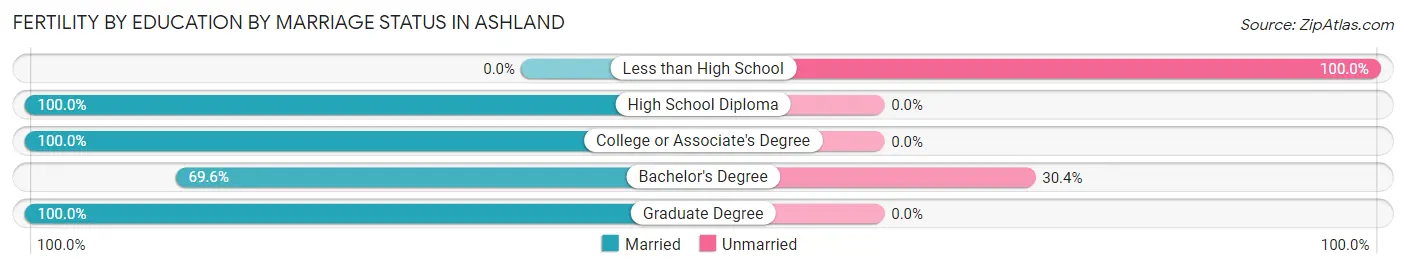
| Educational Attainment | Married | Unmarried |
| Less than High School | 0 (0.0%) | 1 (100.0%) |
| High School Diploma | 12 (100.0%) | 0 (0.0%) |
| College or Associate's Degree | 45 (100.0%) | 0 (0.0%) |
| Bachelor's Degree | 32 (69.6%) | 14 (30.4%) |
| Graduate Degree | 13 (100.0%) | 0 (0.0%) |
| Total | 102 (87.2%) | 15 (12.8%) |
Employment Characteristics in Ashland
Employment by Class of Employer in Ashland
Among the 10,004 employed individuals in Ashland, private company employees (5,121 | 51.2%), not-for-profit organizations (1,333 | 13.3%), and self-employed (not incorporated) (1,148 | 11.5%) make up the most common classes of employment.
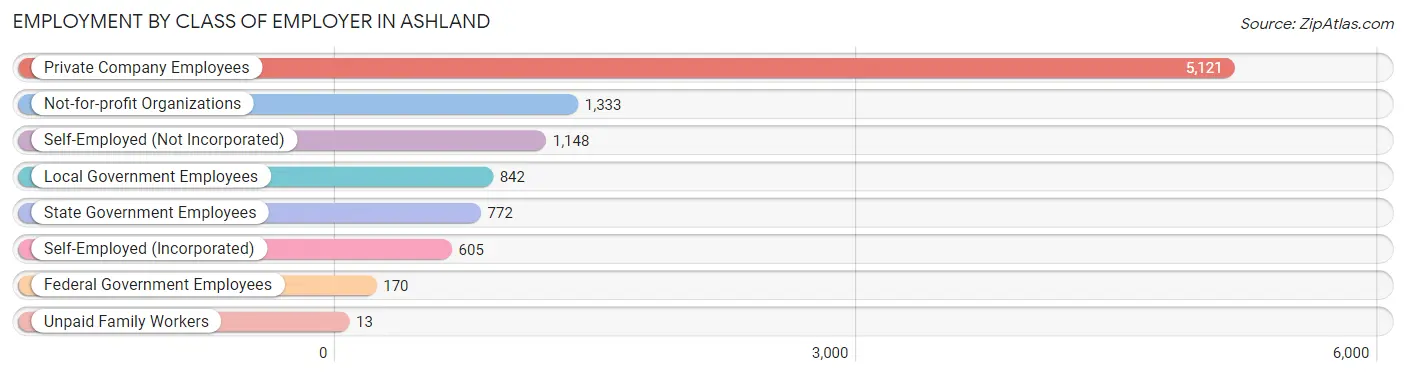
| Employer Class | # Employees | % Employees |
| Private Company Employees | 5,121 | 51.2% |
| Self-Employed (Incorporated) | 605 | 6.0% |
| Self-Employed (Not Incorporated) | 1,148 | 11.5% |
| Not-for-profit Organizations | 1,333 | 13.3% |
| Local Government Employees | 842 | 8.4% |
| State Government Employees | 772 | 7.7% |
| Federal Government Employees | 170 | 1.7% |
| Unpaid Family Workers | 13 | 0.1% |
| Total | 10,004 | 100.0% |
Employment Status by Age in Ashland
According to the labor force statistics for Ashland, out of the total population over 16 years of age (18,923), 57.4% or 10,862 individuals are in the labor force, with 5.7% or 619 of them unemployed. The age group with the highest labor force participation rate is 45 to 54 years, with 90.1% or 2,137 individuals in the labor force. Within the labor force, the 55 to 59 years age range has the highest percentage of unemployed individuals, with 15.1% or 154 of them being unemployed.
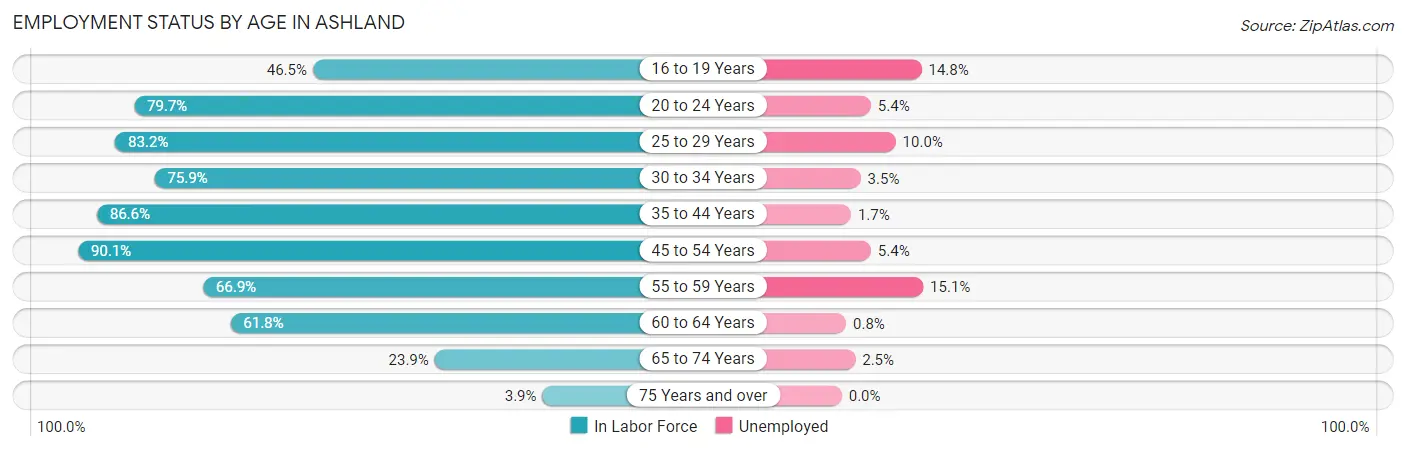
| Age Bracket | In Labor Force | Unemployed |
| 16 to 19 Years | 582 (46.5%) | 86 (14.8%) |
| 20 to 24 Years | 1,678 (79.7%) | 91 (5.4%) |
| 25 to 29 Years | 792 (83.2%) | 79 (10.0%) |
| 30 to 34 Years | 833 (75.9%) | 29 (3.5%) |
| 35 to 44 Years | 1,908 (86.6%) | 32 (1.7%) |
| 45 to 54 Years | 2,137 (90.1%) | 115 (5.4%) |
| 55 to 59 Years | 1,021 (66.9%) | 154 (15.1%) |
| 60 to 64 Years | 908 (61.8%) | 7 (0.8%) |
| 65 to 74 Years | 925 (23.9%) | 23 (2.5%) |
| 75 Years and over | 81 (3.9%) | 0 (0.0%) |
| Total | 10,862 (57.4%) | 619 (5.7%) |
Employment Status by Educational Attainment in Ashland
According to labor force statistics for Ashland, 79.0% of individuals (7,600) out of the total population between 25 and 64 years of age (9,620) are in the labor force, with 5.5% or 418 of them being unemployed. The group with the highest labor force participation rate are those with the educational attainment of bachelor's degree or higher, with 82.8% or 4,930 individuals in the labor force. Within the labor force, individuals with high school diploma education have the highest percentage of unemployment, with 6.8% or 41 of them being unemployed.
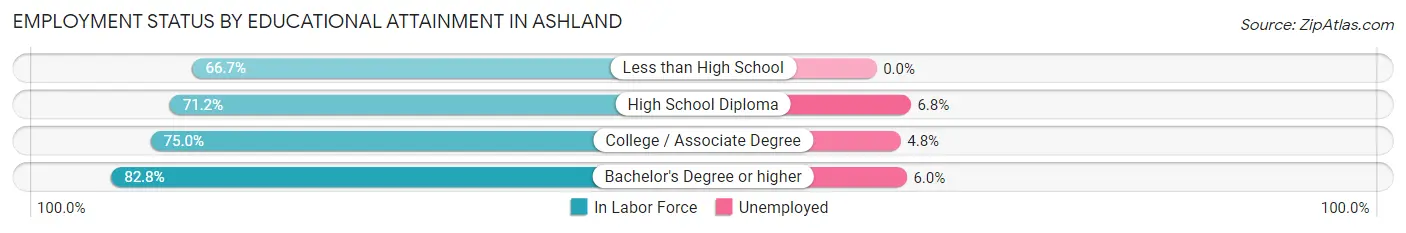
| Educational Attainment | In Labor Force | Unemployed |
| Less than High School | 401 (66.7%) | 0 (0.0%) |
| High School Diploma | 603 (71.2%) | 58 (6.8%) |
| College / Associate Degree | 1,664 (75.0%) | 106 (4.8%) |
| Bachelor's Degree or higher | 4,930 (82.8%) | 357 (6.0%) |
| Total | 7,600 (79.0%) | 529 (5.5%) |
Employment Occupations by Sex in Ashland
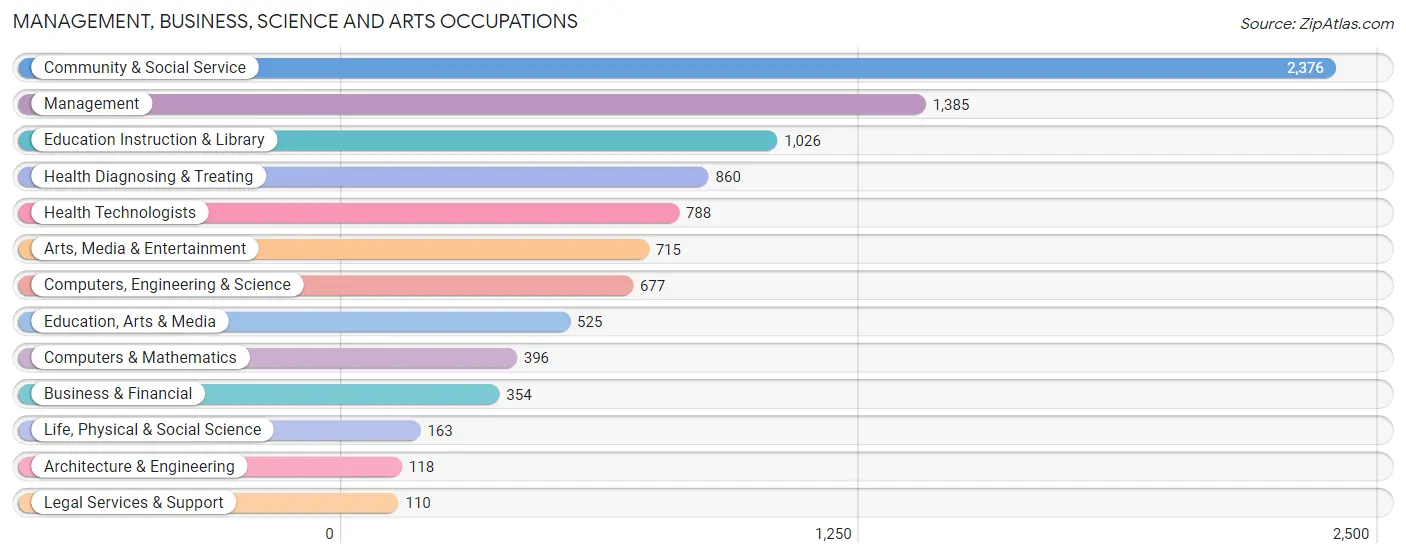
Management, Business, Science and Arts Occupations
The most common Management, Business, Science and Arts occupations in Ashland are Community & Social Service (2,376 | 23.2%), Management (1,385 | 13.5%), Education Instruction & Library (1,026 | 10.0%), Health Diagnosing & Treating (860 | 8.4%), and Health Technologists (788 | 7.7%).
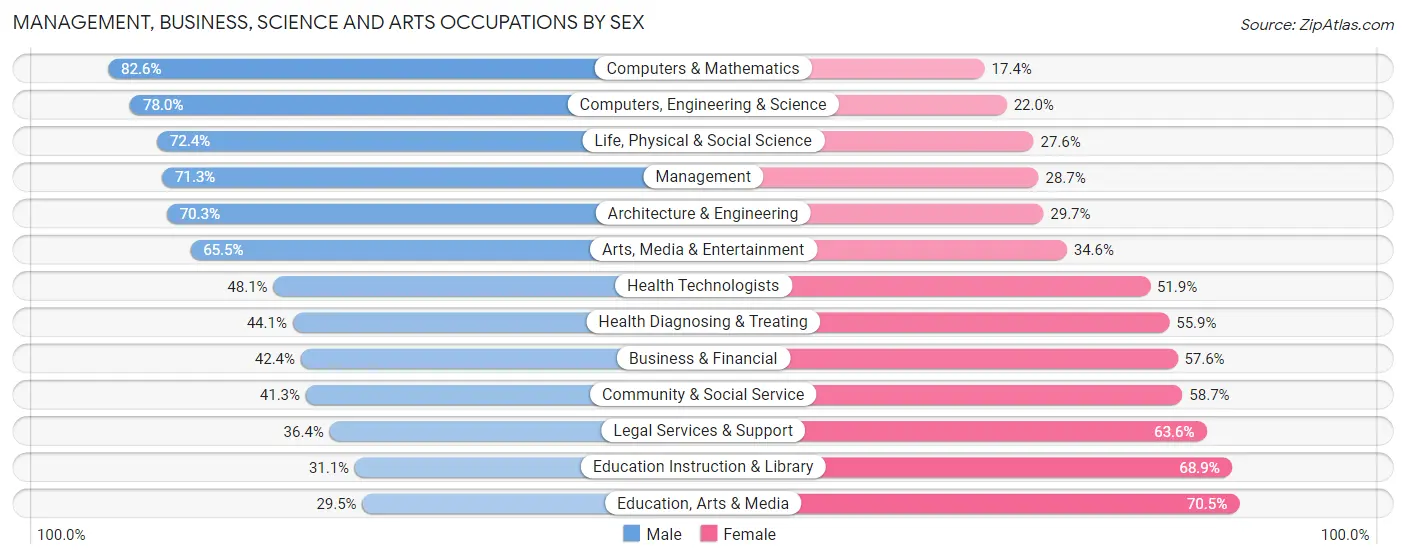
Management, Business, Science and Arts Occupations by Sex
Within the Management, Business, Science and Arts occupations in Ashland, the most male-oriented occupations are Computers & Mathematics (82.6%), Computers, Engineering & Science (78.0%), and Life, Physical & Social Science (72.4%), while the most female-oriented occupations are Education, Arts & Media (70.5%), Education Instruction & Library (68.9%), and Legal Services & Support (63.6%).
| Occupation | Male | Female |
| Management | 988 (71.3%) | 397 (28.7%) |
| Business & Financial | 150 (42.4%) | 204 (57.6%) |
| Computers, Engineering & Science | 528 (78.0%) | 149 (22.0%) |
| Computers & Mathematics | 327 (82.6%) | 69 (17.4%) |
| Architecture & Engineering | 83 (70.3%) | 35 (29.7%) |
| Life, Physical & Social Science | 118 (72.4%) | 45 (27.6%) |
| Community & Social Service | 982 (41.3%) | 1,394 (58.7%) |
| Education, Arts & Media | 155 (29.5%) | 370 (70.5%) |
| Legal Services & Support | 40 (36.4%) | 70 (63.6%) |
| Education Instruction & Library | 319 (31.1%) | 707 (68.9%) |
| Arts, Media & Entertainment | 468 (65.4%) | 247 (34.5%) |
| Health Diagnosing & Treating | 379 (44.1%) | 481 (55.9%) |
| Health Technologists | 379 (48.1%) | 409 (51.9%) |
| Total (Category) | 3,027 (53.6%) | 2,625 (46.4%) |
| Total (Overall) | 4,973 (48.5%) | 5,272 (51.5%) |
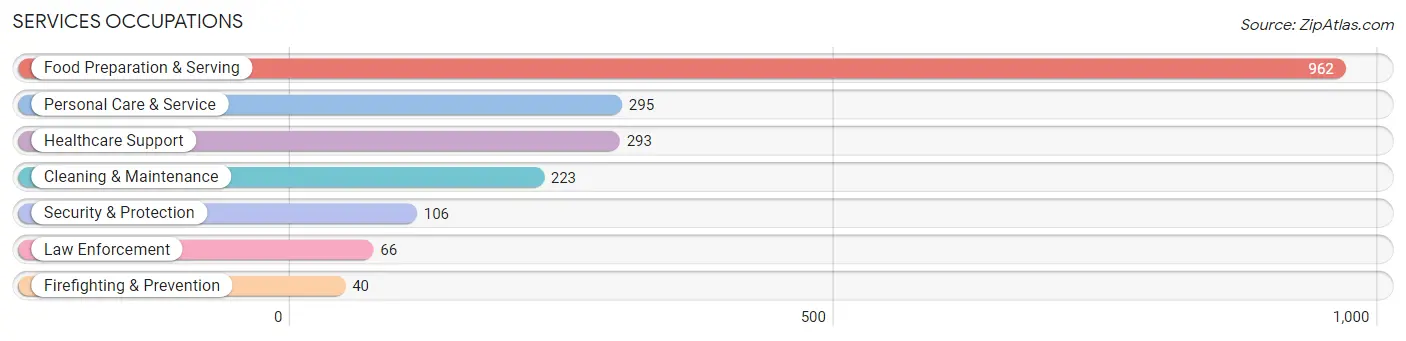
Services Occupations
The most common Services occupations in Ashland are Food Preparation & Serving (962 | 9.4%), Personal Care & Service (295 | 2.9%), Healthcare Support (293 | 2.9%), Cleaning & Maintenance (223 | 2.2%), and Security & Protection (106 | 1.0%).
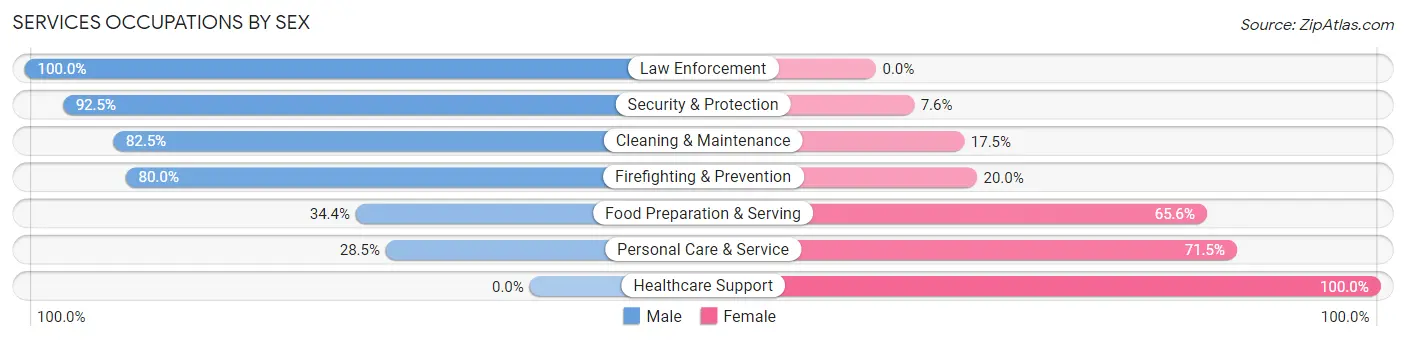
Services Occupations by Sex
Within the Services occupations in Ashland, the most male-oriented occupations are Law Enforcement (100.0%), Security & Protection (92.4%), and Cleaning & Maintenance (82.5%), while the most female-oriented occupations are Healthcare Support (100.0%), Personal Care & Service (71.5%), and Food Preparation & Serving (65.6%).
| Occupation | Male | Female |
| Healthcare Support | 0 (0.0%) | 293 (100.0%) |
| Security & Protection | 98 (92.4%) | 8 (7.5%) |
| Firefighting & Prevention | 32 (80.0%) | 8 (20.0%) |
| Law Enforcement | 66 (100.0%) | 0 (0.0%) |
| Food Preparation & Serving | 331 (34.4%) | 631 (65.6%) |
| Cleaning & Maintenance | 184 (82.5%) | 39 (17.5%) |
| Personal Care & Service | 84 (28.5%) | 211 (71.5%) |
| Total (Category) | 697 (37.1%) | 1,182 (62.9%) |
| Total (Overall) | 4,973 (48.5%) | 5,272 (51.5%) |
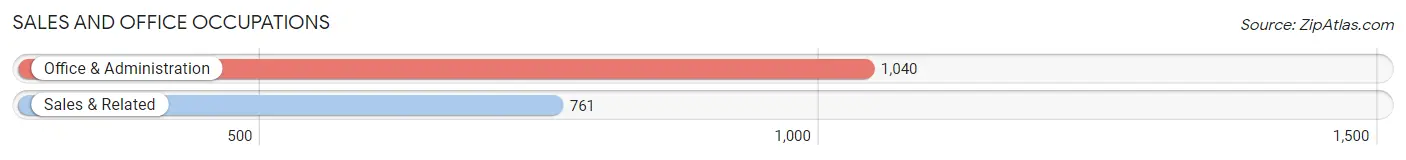
Sales and Office Occupations
The most common Sales and Office occupations in Ashland are Office & Administration (1,040 | 10.2%), and Sales & Related (761 | 7.4%).
Sales and Office Occupations by Sex
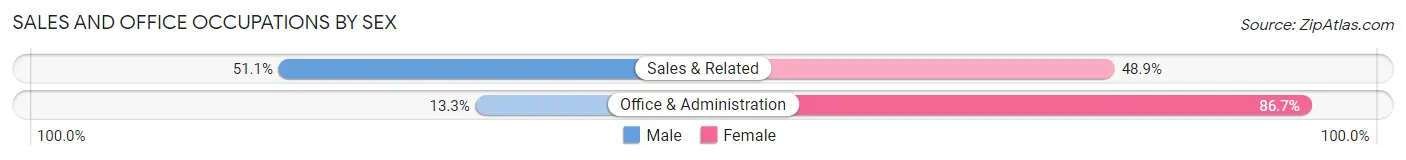
| Occupation | Male | Female |
| Sales & Related | 389 (51.1%) | 372 (48.9%) |
| Office & Administration | 138 (13.3%) | 902 (86.7%) |
| Total (Category) | 527 (29.3%) | 1,274 (70.7%) |
| Total (Overall) | 4,973 (48.5%) | 5,272 (51.5%) |
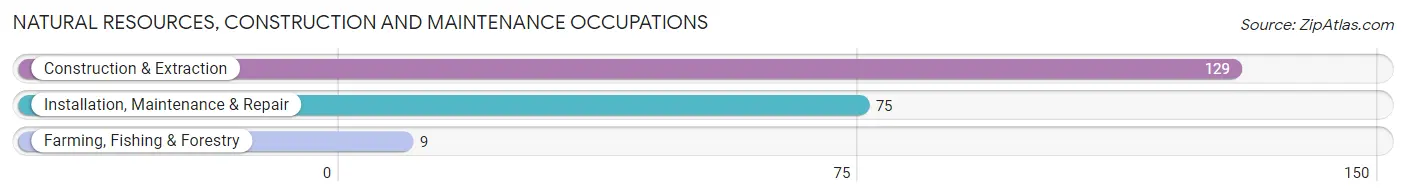
Natural Resources, Construction and Maintenance Occupations
The most common Natural Resources, Construction and Maintenance occupations in Ashland are Construction & Extraction (129 | 1.3%), Installation, Maintenance & Repair (75 | 0.7%), and Farming, Fishing & Forestry (9 | 0.1%).
Natural Resources, Construction and Maintenance Occupations by Sex
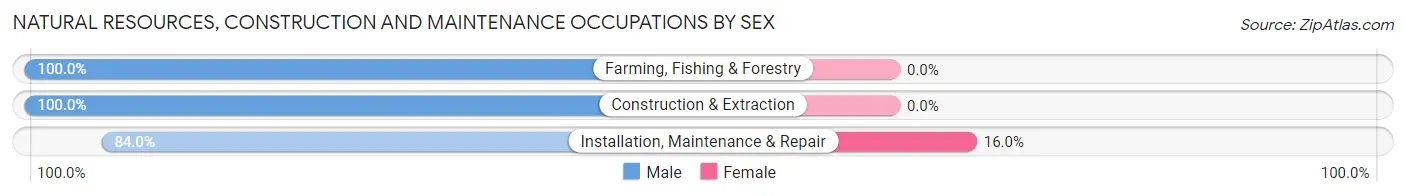
| Occupation | Male | Female |
| Farming, Fishing & Forestry | 9 (100.0%) | 0 (0.0%) |
| Construction & Extraction | 129 (100.0%) | 0 (0.0%) |
| Installation, Maintenance & Repair | 63 (84.0%) | 12 (16.0%) |
| Total (Category) | 201 (94.4%) | 12 (5.6%) |
| Total (Overall) | 4,973 (48.5%) | 5,272 (51.5%) |
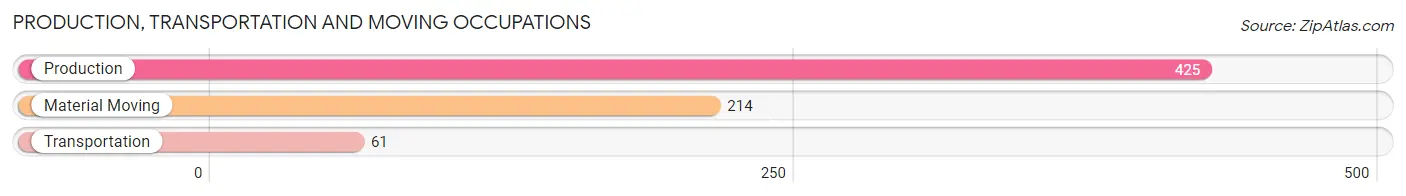
Production, Transportation and Moving Occupations
The most common Production, Transportation and Moving occupations in Ashland are Production (425 | 4.2%), Material Moving (214 | 2.1%), and Transportation (61 | 0.6%).
Production, Transportation and Moving Occupations by Sex
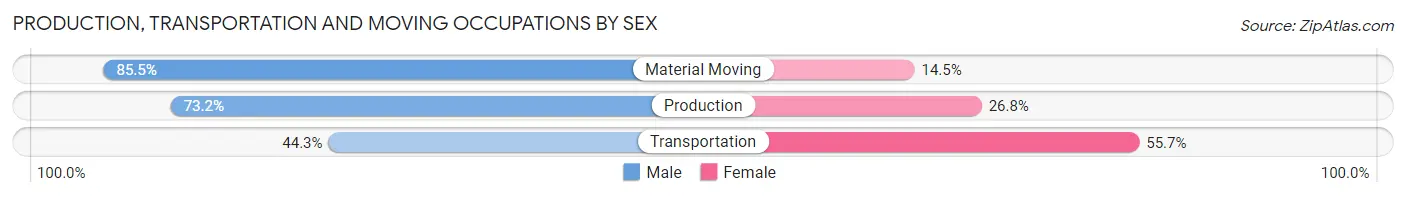
| Occupation | Male | Female |
| Production | 311 (73.2%) | 114 (26.8%) |
| Transportation | 27 (44.3%) | 34 (55.7%) |
| Material Moving | 183 (85.5%) | 31 (14.5%) |
| Total (Category) | 521 (74.4%) | 179 (25.6%) |
| Total (Overall) | 4,973 (48.5%) | 5,272 (51.5%) |
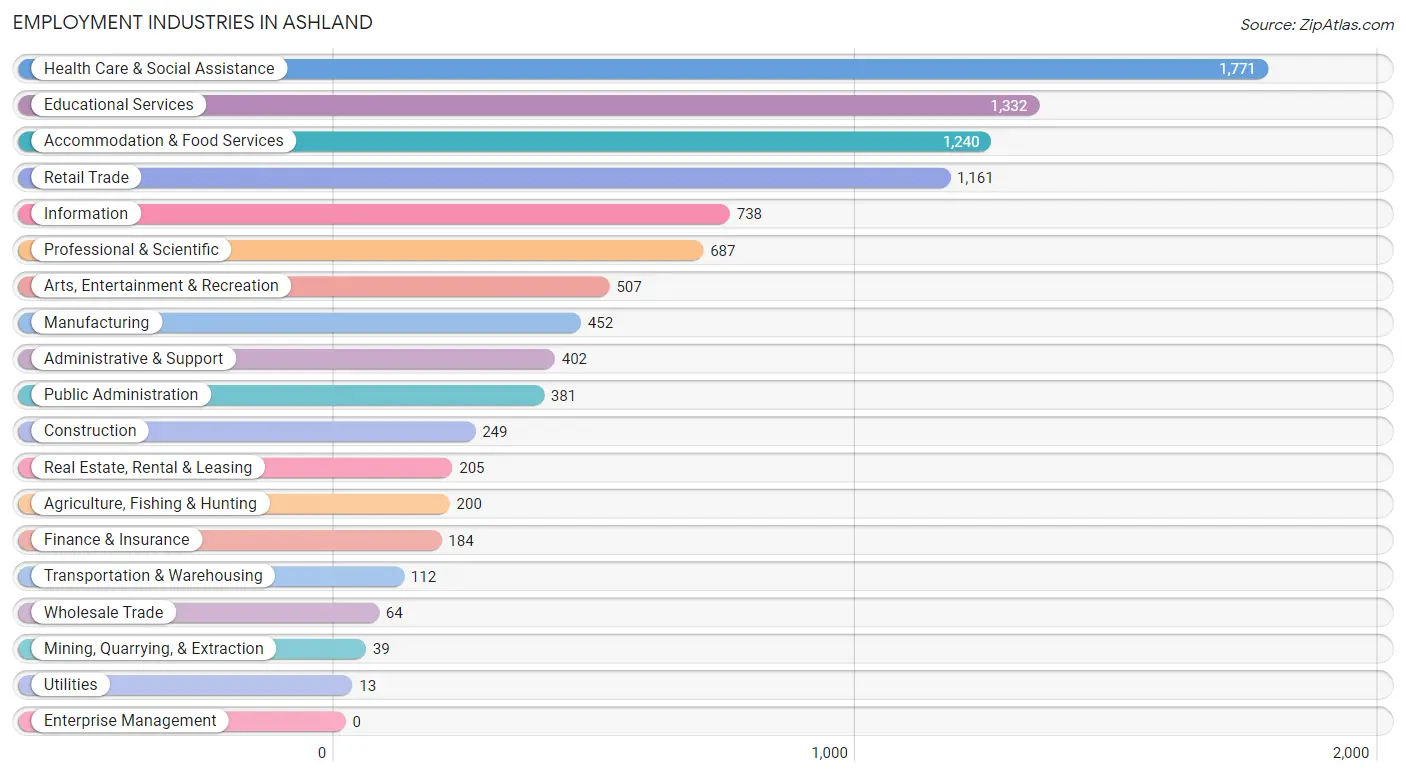
Employment Industries by Sex in Ashland
Employment Industries in Ashland
The major employment industries in Ashland include Health Care & Social Assistance (1,771 | 17.3%), Educational Services (1,332 | 13.0%), Accommodation & Food Services (1,240 | 12.1%), Retail Trade (1,161 | 11.3%), and Information (738 | 7.2%).
Employment Industries by Sex in Ashland
The Ashland industries that see more men than women are Mining, Quarrying, & Extraction (100.0%), Agriculture, Fishing & Hunting (94.0%), and Wholesale Trade (87.5%), whereas the industries that tend to have a higher number of women are Health Care & Social Assistance (74.3%), Transportation & Warehousing (66.1%), and Educational Services (61.5%).
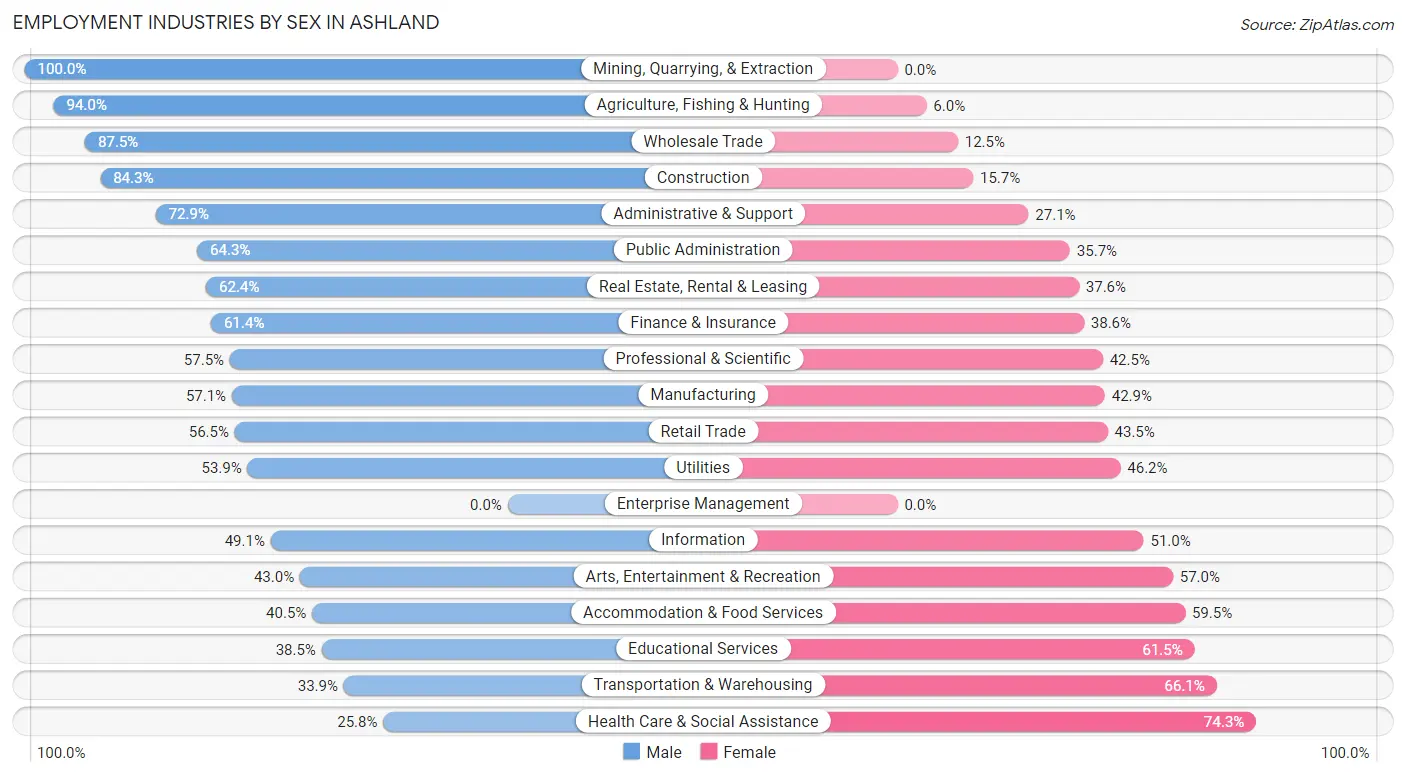
| Industry | Male | Female |
| Agriculture, Fishing & Hunting | 188 (94.0%) | 12 (6.0%) |
| Mining, Quarrying, & Extraction | 39 (100.0%) | 0 (0.0%) |
| Construction | 210 (84.3%) | 39 (15.7%) |
| Manufacturing | 258 (57.1%) | 194 (42.9%) |
| Wholesale Trade | 56 (87.5%) | 8 (12.5%) |
| Retail Trade | 656 (56.5%) | 505 (43.5%) |
| Transportation & Warehousing | 38 (33.9%) | 74 (66.1%) |
| Utilities | 7 (53.8%) | 6 (46.2%) |
| Information | 362 (49.0%) | 376 (50.9%) |
| Finance & Insurance | 113 (61.4%) | 71 (38.6%) |
| Real Estate, Rental & Leasing | 128 (62.4%) | 77 (37.6%) |
| Professional & Scientific | 395 (57.5%) | 292 (42.5%) |
| Enterprise Management | 0 (0.0%) | 0 (0.0%) |
| Administrative & Support | 293 (72.9%) | 109 (27.1%) |
| Educational Services | 513 (38.5%) | 819 (61.5%) |
| Health Care & Social Assistance | 456 (25.8%) | 1,315 (74.3%) |
| Arts, Entertainment & Recreation | 218 (43.0%) | 289 (57.0%) |
| Accommodation & Food Services | 502 (40.5%) | 738 (59.5%) |
| Public Administration | 245 (64.3%) | 136 (35.7%) |
| Total | 4,973 (48.5%) | 5,272 (51.5%) |
Education in Ashland
School Enrollment in Ashland
The most common levels of schooling among the 5,009 students in Ashland are college / undergraduate (2,470 | 49.3%), high school (833 | 16.6%), and middle school (627 | 12.5%).
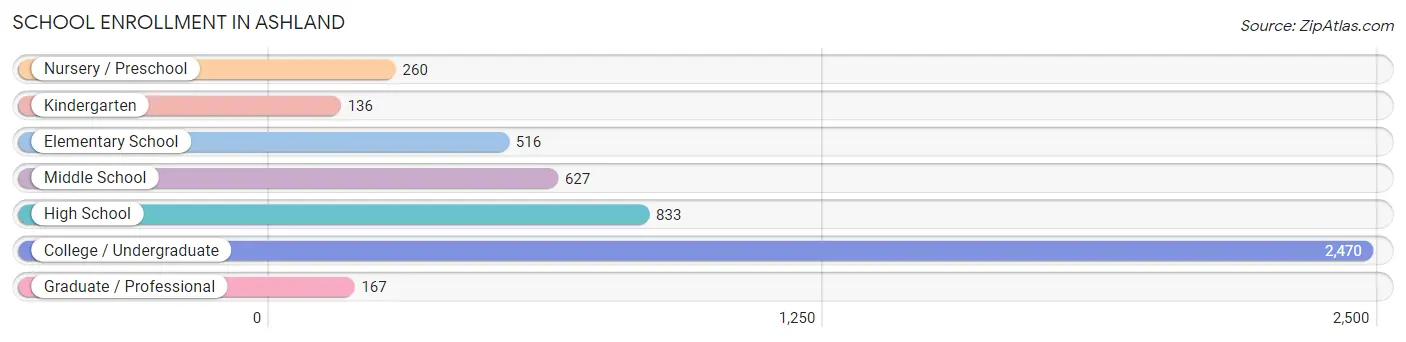
| School Level | # Students | % Students |
| Nursery / Preschool | 260 | 5.2% |
| Kindergarten | 136 | 2.7% |
| Elementary School | 516 | 10.3% |
| Middle School | 627 | 12.5% |
| High School | 833 | 16.6% |
| College / Undergraduate | 2,470 | 49.3% |
| Graduate / Professional | 167 | 3.3% |
| Total | 5,009 | 100.0% |
School Enrollment by Age by Funding Source in Ashland
Out of a total of 5,009 students who are enrolled in schools in Ashland, 556 (11.1%) attend a private institution, while the remaining 4,453 (88.9%) are enrolled in public schools. The age group of 3 to 4 year olds has the highest likelihood of being enrolled in private schools, with 153 (67.4% in the age bracket) enrolled. Conversely, the age group of 25 to 34 year olds has the lowest likelihood of being enrolled in a private school, with 350 (96.7% in the age bracket) attending a public institution.
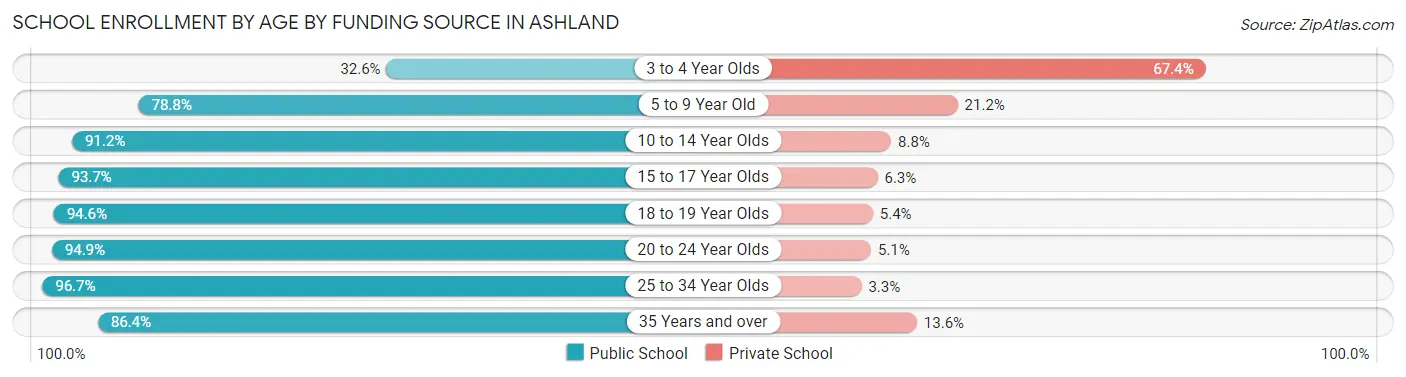
| Age Bracket | Public School | Private School |
| 3 to 4 Year Olds | 74 (32.6%) | 153 (67.4%) |
| 5 to 9 Year Old | 501 (78.8%) | 135 (21.2%) |
| 10 to 14 Year Olds | 754 (91.2%) | 73 (8.8%) |
| 15 to 17 Year Olds | 475 (93.7%) | 32 (6.3%) |
| 18 to 19 Year Olds | 784 (94.6%) | 45 (5.4%) |
| 20 to 24 Year Olds | 1,288 (94.9%) | 69 (5.1%) |
| 25 to 34 Year Olds | 350 (96.7%) | 12 (3.3%) |
| 35 Years and over | 228 (86.4%) | 36 (13.6%) |
| Total | 4,453 (88.9%) | 556 (11.1%) |
Educational Attainment by Field of Study in Ashland
Social sciences (1,477 | 14.1%), visual & performing arts (1,150 | 11.0%), education (1,094 | 10.4%), bio, nature & agricultural (943 | 9.0%), and psychology (943 | 9.0%) are the most common fields of study among 10,484 individuals in Ashland who have obtained a bachelor's degree or higher.
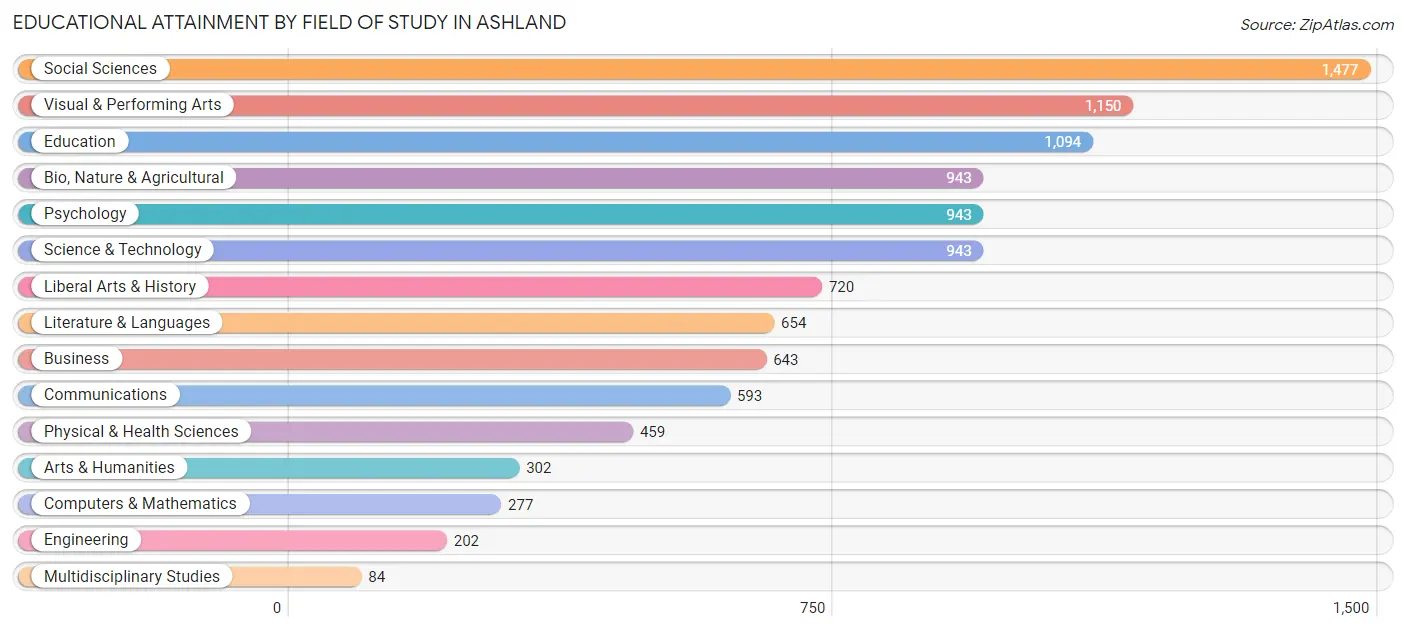
| Field of Study | # Graduates | % Graduates |
| Computers & Mathematics | 277 | 2.6% |
| Bio, Nature & Agricultural | 943 | 9.0% |
| Physical & Health Sciences | 459 | 4.4% |
| Psychology | 943 | 9.0% |
| Social Sciences | 1,477 | 14.1% |
| Engineering | 202 | 1.9% |
| Multidisciplinary Studies | 84 | 0.8% |
| Science & Technology | 943 | 9.0% |
| Business | 643 | 6.1% |
| Education | 1,094 | 10.4% |
| Literature & Languages | 654 | 6.2% |
| Liberal Arts & History | 720 | 6.9% |
| Visual & Performing Arts | 1,150 | 11.0% |
| Communications | 593 | 5.7% |
| Arts & Humanities | 302 | 2.9% |
| Total | 10,484 | 100.0% |
Transportation & Commute in Ashland
Vehicle Availability by Sex in Ashland
The most prevalent vehicle ownership categories in Ashland are males with 2 vehicles (2,134, accounting for 43.8%) and females with 2 vehicles (2,451, making up 44.2%).
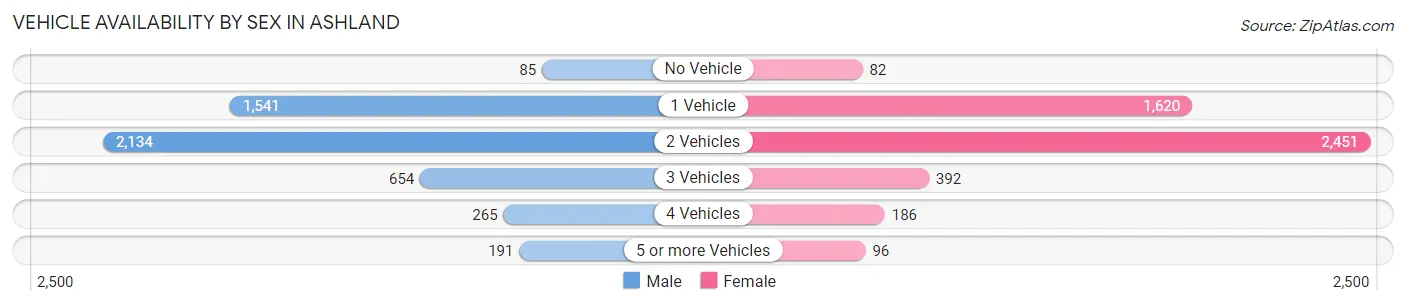
| Vehicles Available | Male | Female |
| No Vehicle | 85 (1.8%) | 82 (1.7%) |
| 1 Vehicle | 1,541 (31.6%) | 1,620 (33.6%) |
| 2 Vehicles | 2,134 (43.8%) | 2,451 (50.8%) |
| 3 Vehicles | 654 (13.4%) | 392 (8.1%) |
| 4 Vehicles | 265 (5.4%) | 186 (3.8%) |
| 5 or more Vehicles | 191 (3.9%) | 96 (2.0%) |
| Total | 4,870 (100.0%) | 4,827 (100.0%) |
Commute Time in Ashland
The most frequently occuring commute durations in Ashland are 5 to 9 minutes (2,049 commuters, 25.8%), 10 to 14 minutes (1,628 commuters, 20.5%), and 20 to 24 minutes (1,030 commuters, 13.0%).
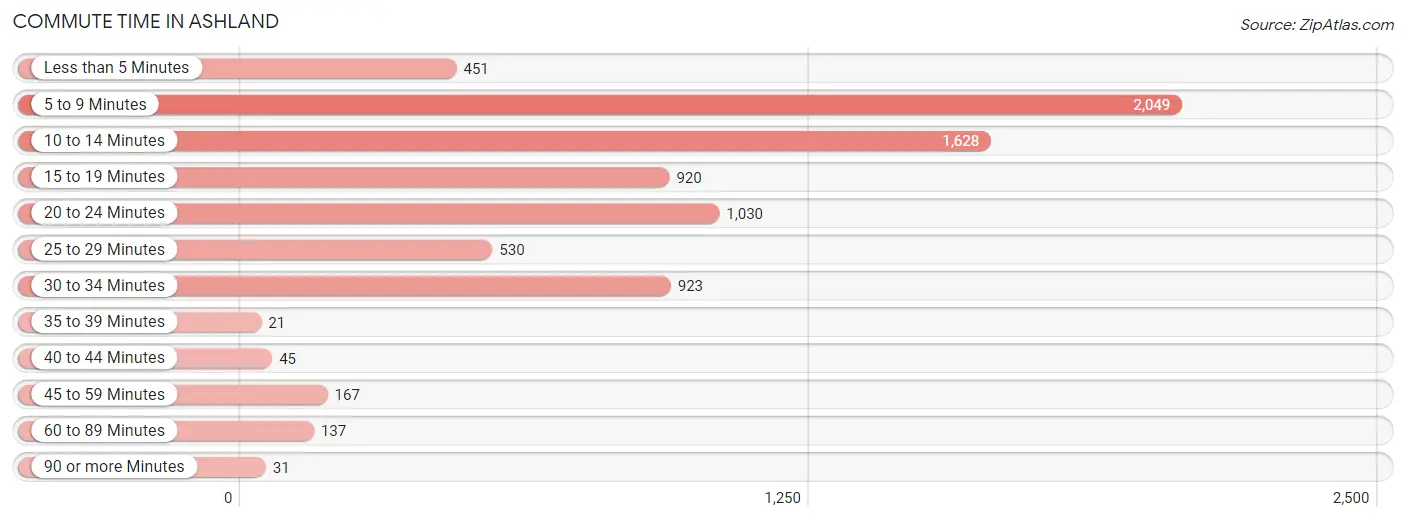
| Commute Time | # Commuters | % Commuters |
| Less than 5 Minutes | 451 | 5.7% |
| 5 to 9 Minutes | 2,049 | 25.8% |
| 10 to 14 Minutes | 1,628 | 20.5% |
| 15 to 19 Minutes | 920 | 11.6% |
| 20 to 24 Minutes | 1,030 | 13.0% |
| 25 to 29 Minutes | 530 | 6.7% |
| 30 to 34 Minutes | 923 | 11.6% |
| 35 to 39 Minutes | 21 | 0.3% |
| 40 to 44 Minutes | 45 | 0.6% |
| 45 to 59 Minutes | 167 | 2.1% |
| 60 to 89 Minutes | 137 | 1.7% |
| 90 or more Minutes | 31 | 0.4% |
Commute Time by Sex in Ashland
The most common commute times in Ashland are 5 to 9 minutes (1,022 commuters, 26.6%) for males and 5 to 9 minutes (1,027 commuters, 25.2%) for females.
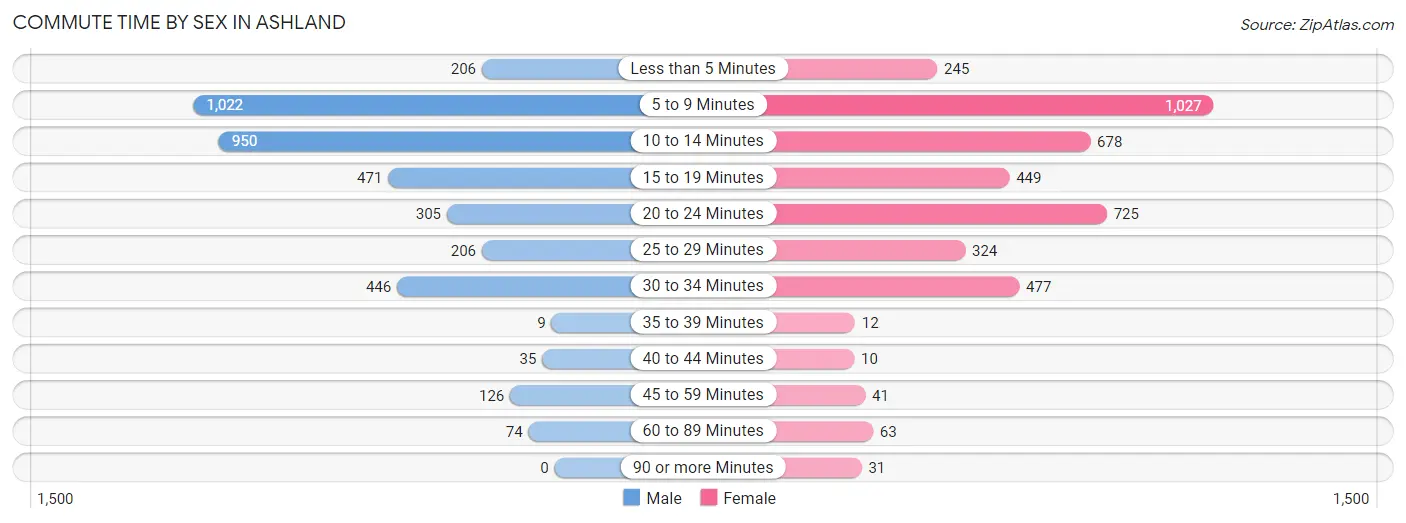
| Commute Time | Male | Female |
| Less than 5 Minutes | 206 (5.3%) | 245 (6.0%) |
| 5 to 9 Minutes | 1,022 (26.6%) | 1,027 (25.2%) |
| 10 to 14 Minutes | 950 (24.7%) | 678 (16.6%) |
| 15 to 19 Minutes | 471 (12.2%) | 449 (11.0%) |
| 20 to 24 Minutes | 305 (7.9%) | 725 (17.8%) |
| 25 to 29 Minutes | 206 (5.3%) | 324 (7.9%) |
| 30 to 34 Minutes | 446 (11.6%) | 477 (11.7%) |
| 35 to 39 Minutes | 9 (0.2%) | 12 (0.3%) |
| 40 to 44 Minutes | 35 (0.9%) | 10 (0.2%) |
| 45 to 59 Minutes | 126 (3.3%) | 41 (1.0%) |
| 60 to 89 Minutes | 74 (1.9%) | 63 (1.5%) |
| 90 or more Minutes | 0 (0.0%) | 31 (0.8%) |
Time of Departure to Work by Sex in Ashland
The most frequent times of departure to work in Ashland are 7:30 AM to 7:59 AM (625, 16.2%) for males and 9:00 AM to 9:59 AM (857, 21.0%) for females.
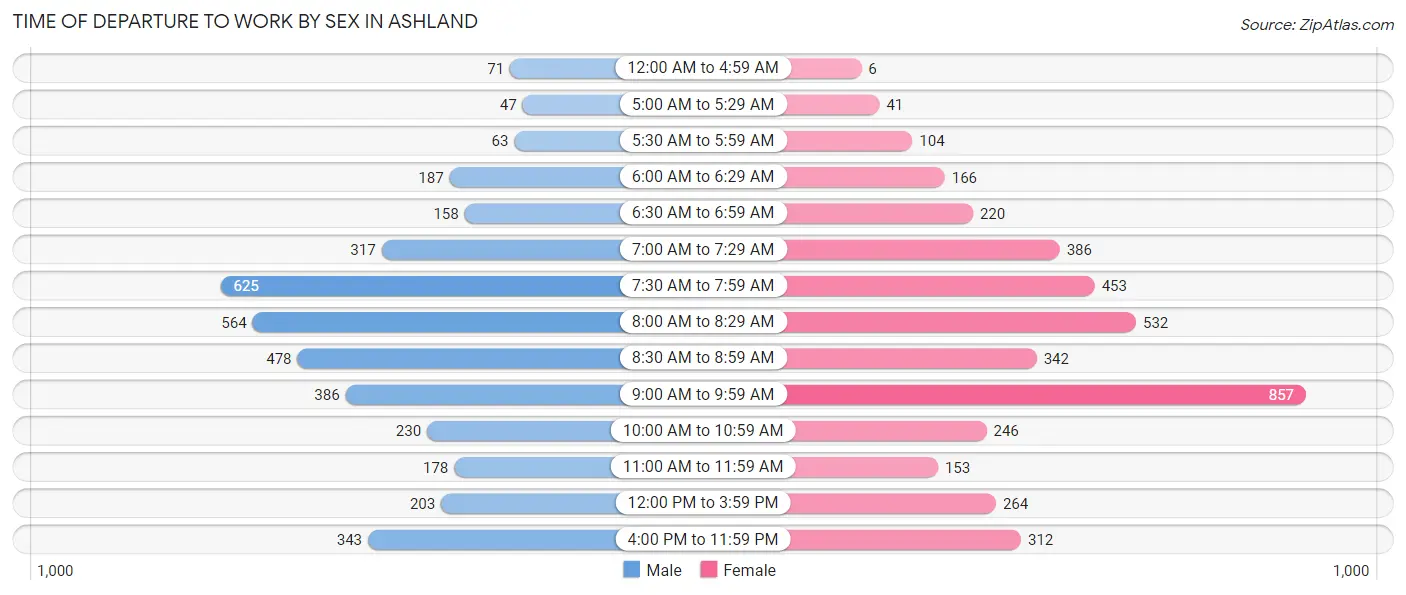
| Time of Departure | Male | Female |
| 12:00 AM to 4:59 AM | 71 (1.8%) | 6 (0.2%) |
| 5:00 AM to 5:29 AM | 47 (1.2%) | 41 (1.0%) |
| 5:30 AM to 5:59 AM | 63 (1.6%) | 104 (2.5%) |
| 6:00 AM to 6:29 AM | 187 (4.9%) | 166 (4.1%) |
| 6:30 AM to 6:59 AM | 158 (4.1%) | 220 (5.4%) |
| 7:00 AM to 7:29 AM | 317 (8.2%) | 386 (9.5%) |
| 7:30 AM to 7:59 AM | 625 (16.2%) | 453 (11.1%) |
| 8:00 AM to 8:29 AM | 564 (14.6%) | 532 (13.0%) |
| 8:30 AM to 8:59 AM | 478 (12.4%) | 342 (8.4%) |
| 9:00 AM to 9:59 AM | 386 (10.0%) | 857 (21.0%) |
| 10:00 AM to 10:59 AM | 230 (6.0%) | 246 (6.0%) |
| 11:00 AM to 11:59 AM | 178 (4.6%) | 153 (3.7%) |
| 12:00 PM to 3:59 PM | 203 (5.3%) | 264 (6.5%) |
| 4:00 PM to 11:59 PM | 343 (8.9%) | 312 (7.6%) |
| Total | 3,850 (100.0%) | 4,082 (100.0%) |
Housing Occupancy in Ashland
Occupancy by Ownership in Ashland
Of the total 10,120 dwellings in Ashland, owner-occupied units account for 5,347 (52.8%), while renter-occupied units make up 4,773 (47.2%).
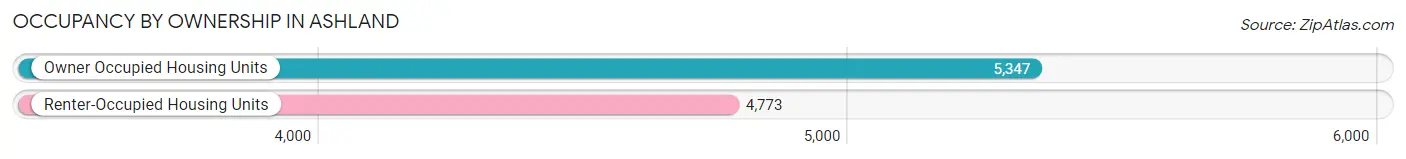
| Occupancy | # Housing Units | % Housing Units |
| Owner Occupied Housing Units | 5,347 | 52.8% |
| Renter-Occupied Housing Units | 4,773 | 47.2% |
| Total Occupied Housing Units | 10,120 | 100.0% |
Occupancy by Household Size in Ashland
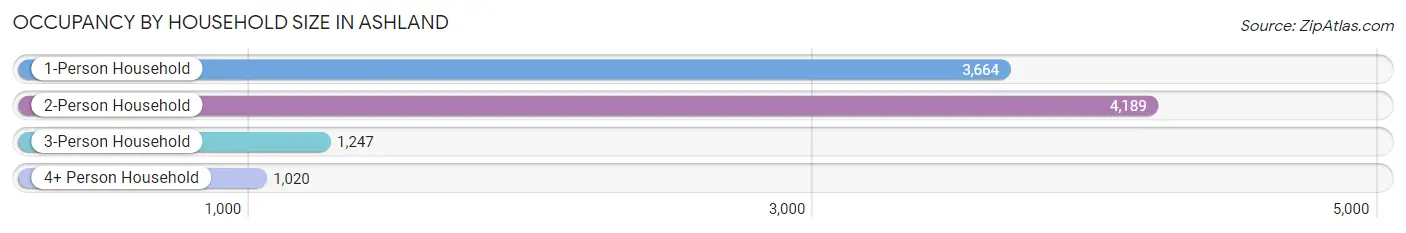
| Household Size | # Housing Units | % Housing Units |
| 1-Person Household | 3,664 | 36.2% |
| 2-Person Household | 4,189 | 41.4% |
| 3-Person Household | 1,247 | 12.3% |
| 4+ Person Household | 1,020 | 10.1% |
| Total Housing Units | 10,120 | 100.0% |
Occupancy by Ownership by Household Size in Ashland
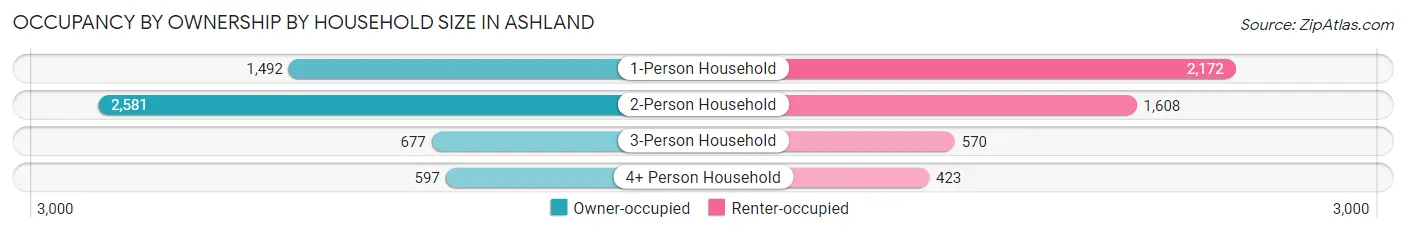
| Household Size | Owner-occupied | Renter-occupied |
| 1-Person Household | 1,492 (40.7%) | 2,172 (59.3%) |
| 2-Person Household | 2,581 (61.6%) | 1,608 (38.4%) |
| 3-Person Household | 677 (54.3%) | 570 (45.7%) |
| 4+ Person Household | 597 (58.5%) | 423 (41.5%) |
| Total Housing Units | 5,347 (52.8%) | 4,773 (47.2%) |
Occupancy by Educational Attainment in Ashland
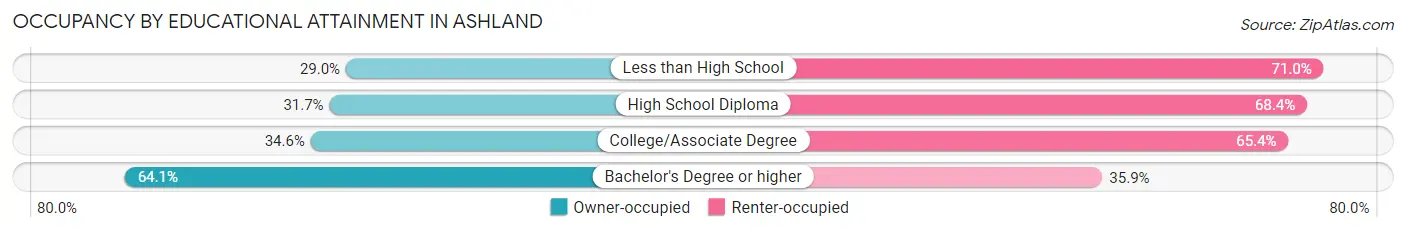
| Household Size | Owner-occupied | Renter-occupied |
| Less than High School | 54 (29.0%) | 132 (71.0%) |
| High School Diploma | 238 (31.7%) | 514 (68.3%) |
| College/Associate Degree | 977 (34.6%) | 1,845 (65.4%) |
| Bachelor's Degree or higher | 4,078 (64.1%) | 2,282 (35.9%) |
Occupancy by Age of Householder in Ashland
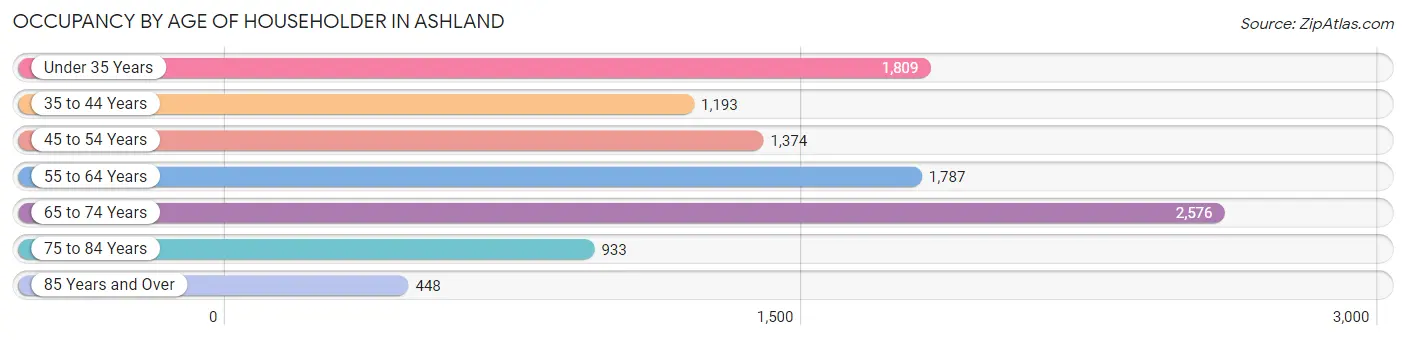
| Age Bracket | # Households | % Households |
| Under 35 Years | 1,809 | 17.9% |
| 35 to 44 Years | 1,193 | 11.8% |
| 45 to 54 Years | 1,374 | 13.6% |
| 55 to 64 Years | 1,787 | 17.7% |
| 65 to 74 Years | 2,576 | 25.5% |
| 75 to 84 Years | 933 | 9.2% |
| 85 Years and Over | 448 | 4.4% |
| Total | 10,120 | 100.0% |
Housing Finances in Ashland
Median Income by Occupancy in Ashland
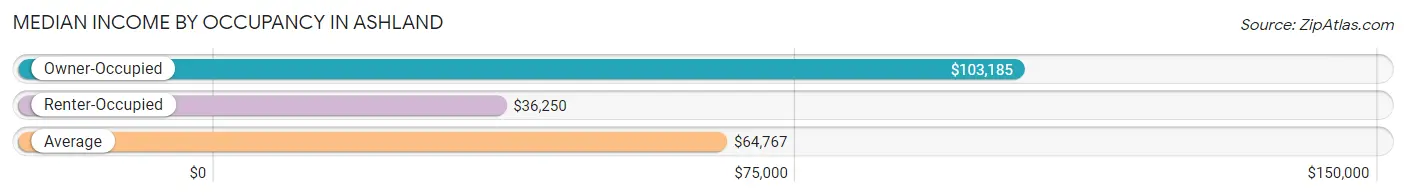
| Occupancy Type | # Households | Median Income |
| Owner-Occupied | 5,347 (52.8%) | $103,185 |
| Renter-Occupied | 4,773 (47.2%) | $36,250 |
| Average | 10,120 (100.0%) | $64,767 |
Occupancy by Householder Income Bracket in Ashland
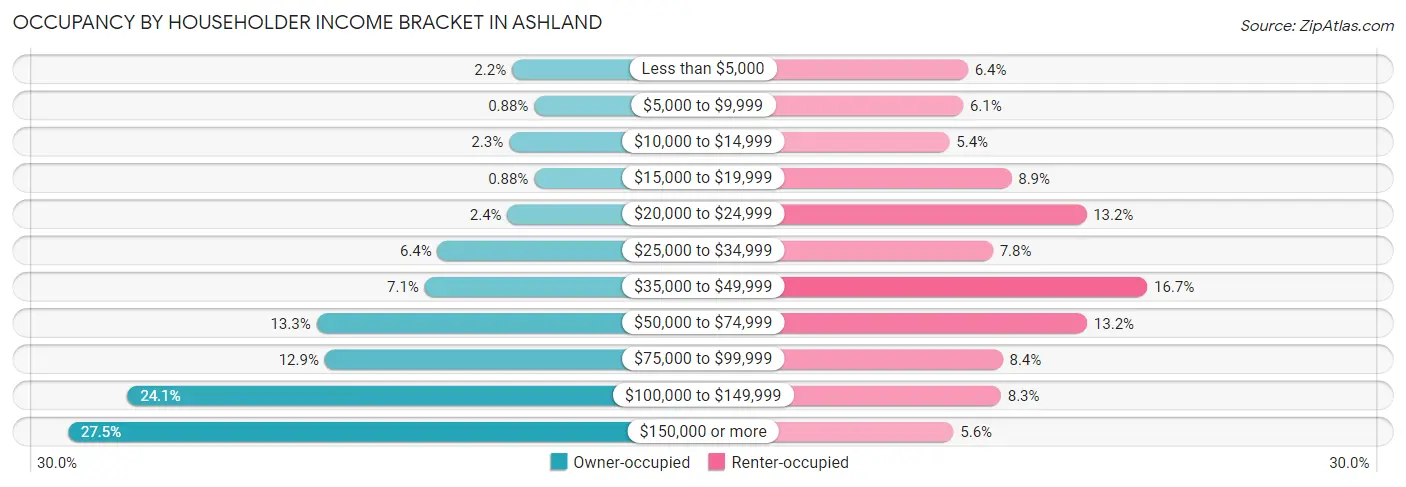
| Income Bracket | Owner-occupied | Renter-occupied |
| Less than $5,000 | 115 (2.1%) | 306 (6.4%) |
| $5,000 to $9,999 | 47 (0.9%) | 293 (6.1%) |
| $10,000 to $14,999 | 124 (2.3%) | 256 (5.4%) |
| $15,000 to $19,999 | 47 (0.9%) | 425 (8.9%) |
| $20,000 to $24,999 | 129 (2.4%) | 629 (13.2%) |
| $25,000 to $34,999 | 342 (6.4%) | 374 (7.8%) |
| $35,000 to $49,999 | 382 (7.1%) | 795 (16.7%) |
| $50,000 to $74,999 | 712 (13.3%) | 631 (13.2%) |
| $75,000 to $99,999 | 687 (12.9%) | 401 (8.4%) |
| $100,000 to $149,999 | 1,290 (24.1%) | 396 (8.3%) |
| $150,000 or more | 1,472 (27.5%) | 267 (5.6%) |
| Total | 5,347 (100.0%) | 4,773 (100.0%) |
Monthly Housing Cost Tiers in Ashland
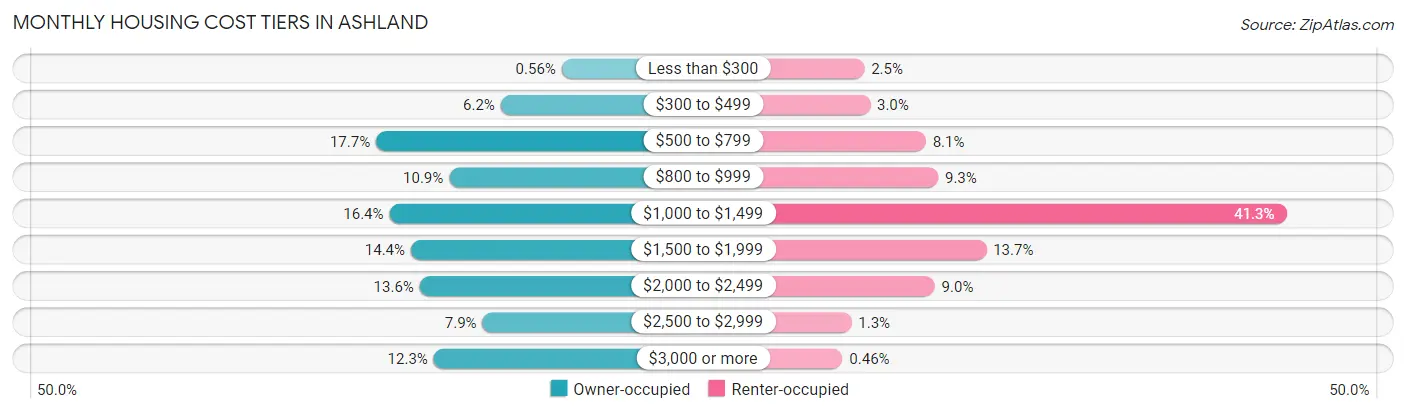
| Monthly Cost | Owner-occupied | Renter-occupied |
| Less than $300 | 30 (0.6%) | 118 (2.5%) |
| $300 to $499 | 330 (6.2%) | 143 (3.0%) |
| $500 to $799 | 944 (17.6%) | 388 (8.1%) |
| $800 to $999 | 584 (10.9%) | 442 (9.3%) |
| $1,000 to $1,499 | 878 (16.4%) | 1,972 (41.3%) |
| $1,500 to $1,999 | 772 (14.4%) | 654 (13.7%) |
| $2,000 to $2,499 | 729 (13.6%) | 427 (8.9%) |
| $2,500 to $2,999 | 420 (7.9%) | 61 (1.3%) |
| $3,000 or more | 660 (12.3%) | 22 (0.5%) |
| Total | 5,347 (100.0%) | 4,773 (100.0%) |
Physical Housing Characteristics in Ashland
Housing Structures in Ashland
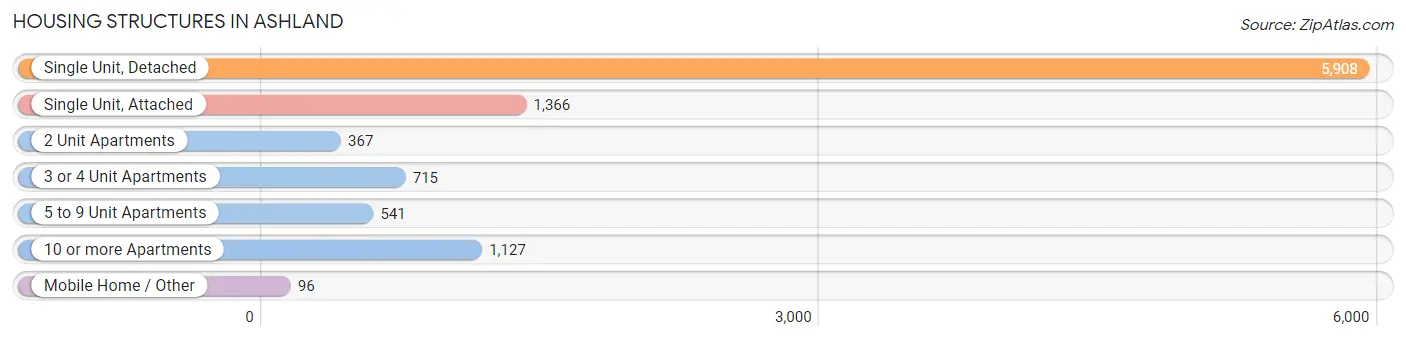
| Structure Type | # Housing Units | % Housing Units |
| Single Unit, Detached | 5,908 | 58.4% |
| Single Unit, Attached | 1,366 | 13.5% |
| 2 Unit Apartments | 367 | 3.6% |
| 3 or 4 Unit Apartments | 715 | 7.1% |
| 5 to 9 Unit Apartments | 541 | 5.3% |
| 10 or more Apartments | 1,127 | 11.1% |
| Mobile Home / Other | 96 | 0.9% |
| Total | 10,120 | 100.0% |
Housing Structures by Occupancy in Ashland
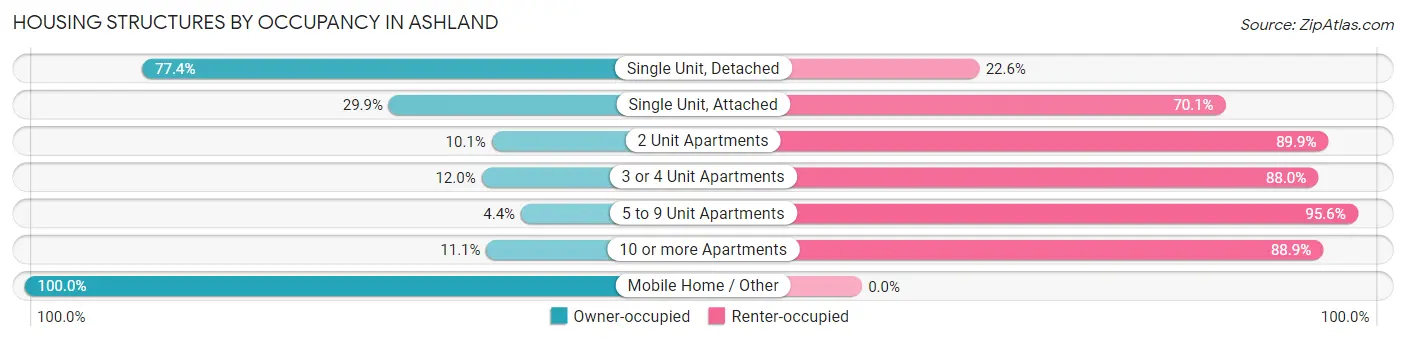
| Structure Type | Owner-occupied | Renter-occupied |
| Single Unit, Detached | 4,571 (77.4%) | 1,337 (22.6%) |
| Single Unit, Attached | 408 (29.9%) | 958 (70.1%) |
| 2 Unit Apartments | 37 (10.1%) | 330 (89.9%) |
| 3 or 4 Unit Apartments | 86 (12.0%) | 629 (88.0%) |
| 5 to 9 Unit Apartments | 24 (4.4%) | 517 (95.6%) |
| 10 or more Apartments | 125 (11.1%) | 1,002 (88.9%) |
| Mobile Home / Other | 96 (100.0%) | 0 (0.0%) |
| Total | 5,347 (52.8%) | 4,773 (47.2%) |
Housing Structures by Number of Rooms in Ashland
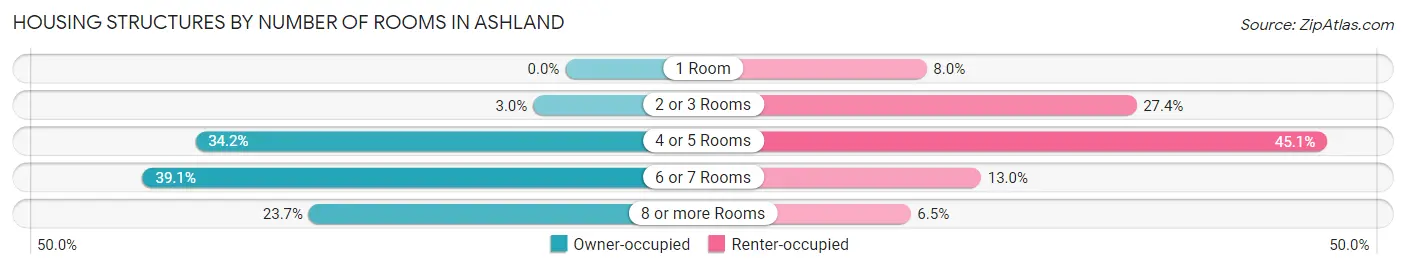
| Number of Rooms | Owner-occupied | Renter-occupied |
| 1 Room | 0 (0.0%) | 382 (8.0%) |
| 2 or 3 Rooms | 159 (3.0%) | 1,308 (27.4%) |
| 4 or 5 Rooms | 1,830 (34.2%) | 2,150 (45.1%) |
| 6 or 7 Rooms | 2,090 (39.1%) | 622 (13.0%) |
| 8 or more Rooms | 1,268 (23.7%) | 311 (6.5%) |
| Total | 5,347 (100.0%) | 4,773 (100.0%) |
Housing Structure by Heating Type in Ashland
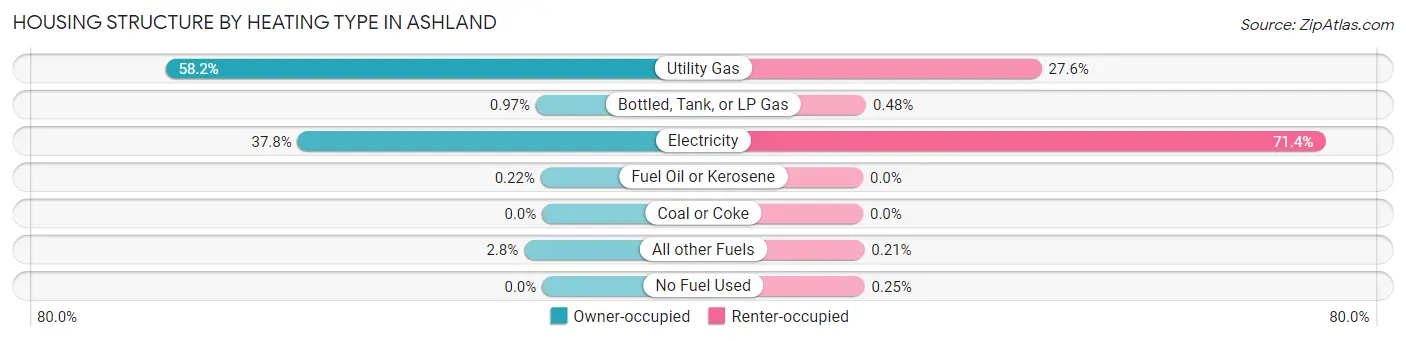
| Heating Type | Owner-occupied | Renter-occupied |
| Utility Gas | 3,113 (58.2%) | 1,318 (27.6%) |
| Bottled, Tank, or LP Gas | 52 (1.0%) | 23 (0.5%) |
| Electricity | 2,021 (37.8%) | 3,410 (71.4%) |
| Fuel Oil or Kerosene | 12 (0.2%) | 0 (0.0%) |
| Coal or Coke | 0 (0.0%) | 0 (0.0%) |
| All other Fuels | 149 (2.8%) | 10 (0.2%) |
| No Fuel Used | 0 (0.0%) | 12 (0.3%) |
| Total | 5,347 (100.0%) | 4,773 (100.0%) |
Household Vehicle Usage in Ashland
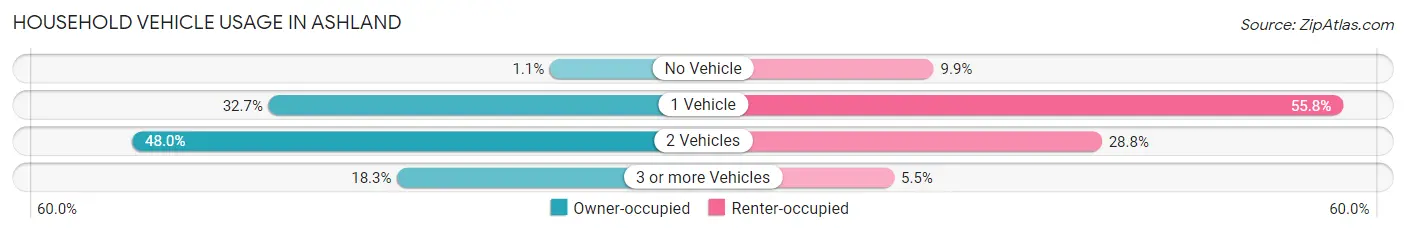
| Vehicles per Household | Owner-occupied | Renter-occupied |
| No Vehicle | 61 (1.1%) | 474 (9.9%) |
| 1 Vehicle | 1,746 (32.7%) | 2,663 (55.8%) |
| 2 Vehicles | 2,564 (47.9%) | 1,373 (28.8%) |
| 3 or more Vehicles | 976 (18.2%) | 263 (5.5%) |
| Total | 5,347 (100.0%) | 4,773 (100.0%) |
Real Estate & Mortgages in Ashland
Real Estate and Mortgage Overview in Ashland
| Characteristic | Without Mortgage | With Mortgage |
| Housing Units | 2,372 | 2,975 |
| Median Property Value | $568,500 | $588,300 |
| Median Household Income | $80,423 | $1,040 |
| Monthly Housing Costs | $773 | $660 |
| Real Estate Taxes | $4,850 | $35 |
Property Value by Mortgage Status in Ashland
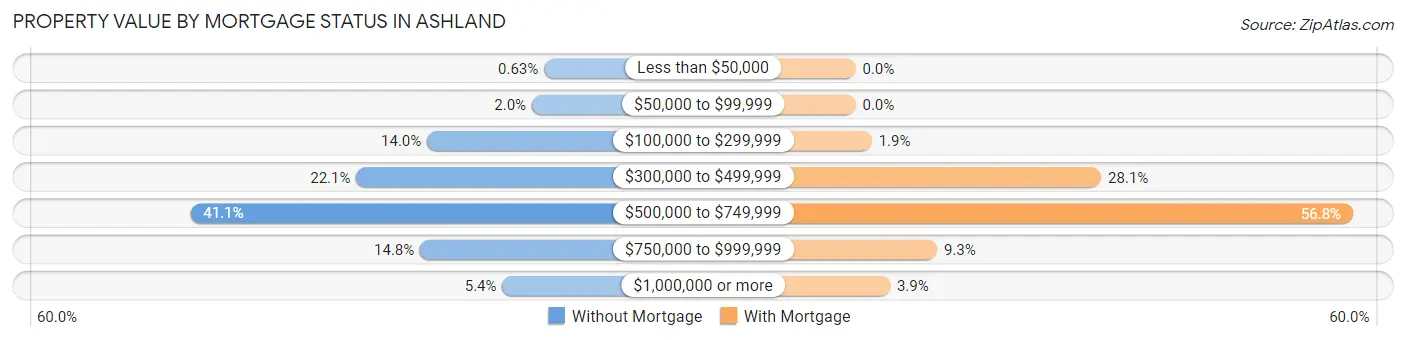
| Property Value | Without Mortgage | With Mortgage |
| Less than $50,000 | 15 (0.6%) | 0 (0.0%) |
| $50,000 to $99,999 | 48 (2.0%) | 0 (0.0%) |
| $100,000 to $299,999 | 332 (14.0%) | 55 (1.8%) |
| $300,000 to $499,999 | 524 (22.1%) | 835 (28.1%) |
| $500,000 to $749,999 | 974 (41.1%) | 1,691 (56.8%) |
| $750,000 to $999,999 | 351 (14.8%) | 277 (9.3%) |
| $1,000,000 or more | 128 (5.4%) | 117 (3.9%) |
| Total | 2,372 (100.0%) | 2,975 (100.0%) |
Household Income by Mortgage Status in Ashland
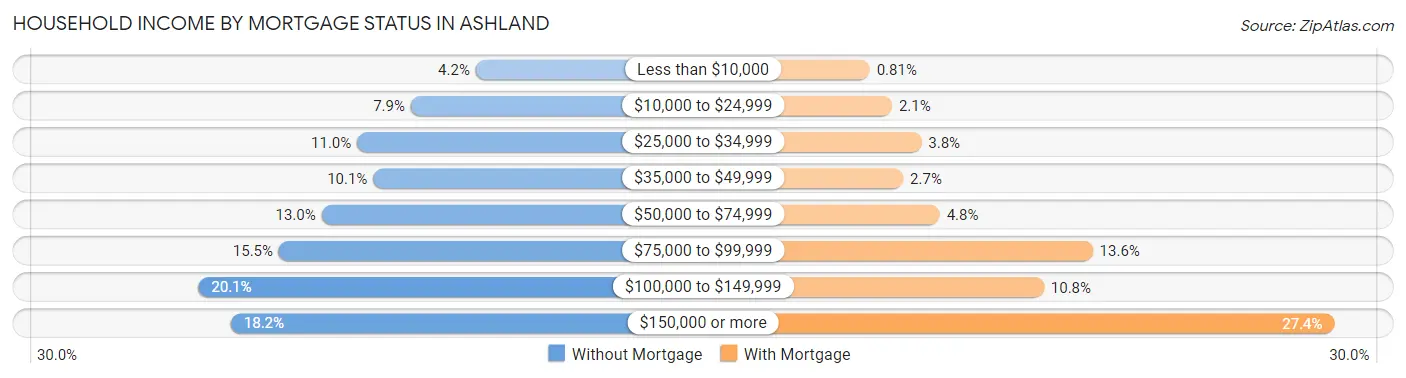
| Household Income | Without Mortgage | With Mortgage |
| Less than $10,000 | 100 (4.2%) | 24 (0.8%) |
| $10,000 to $24,999 | 188 (7.9%) | 62 (2.1%) |
| $25,000 to $34,999 | 261 (11.0%) | 112 (3.8%) |
| $35,000 to $49,999 | 239 (10.1%) | 81 (2.7%) |
| $50,000 to $74,999 | 309 (13.0%) | 143 (4.8%) |
| $75,000 to $99,999 | 367 (15.5%) | 403 (13.6%) |
| $100,000 to $149,999 | 476 (20.1%) | 320 (10.8%) |
| $150,000 or more | 432 (18.2%) | 814 (27.4%) |
| Total | 2,372 (100.0%) | 2,975 (100.0%) |
Property Value to Household Income Ratio in Ashland
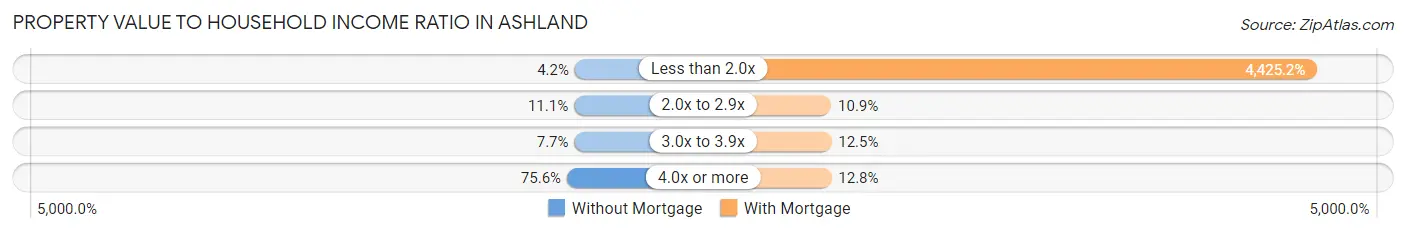
| Value-to-Income Ratio | Without Mortgage | With Mortgage |
| Less than 2.0x | 99 (4.2%) | 131,650 (4,425.2%) |
| 2.0x to 2.9x | 262 (11.1%) | 323 (10.9%) |
| 3.0x to 3.9x | 182 (7.7%) | 371 (12.5%) |
| 4.0x or more | 1,794 (75.6%) | 381 (12.8%) |
| Total | 2,372 (100.0%) | 2,975 (100.0%) |
Real Estate Taxes by Mortgage Status in Ashland
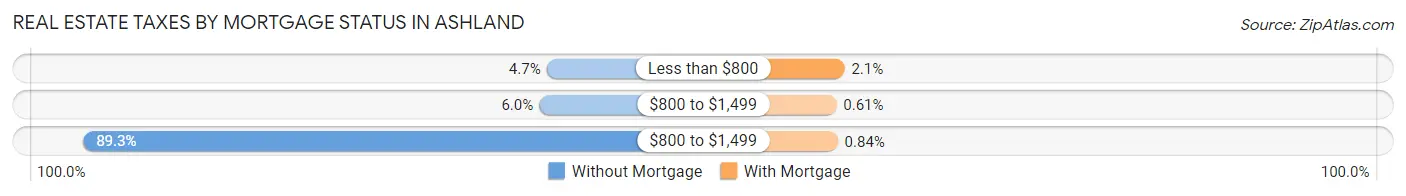
| Property Taxes | Without Mortgage | With Mortgage |
| Less than $800 | 111 (4.7%) | 62 (2.1%) |
| $800 to $1,499 | 143 (6.0%) | 18 (0.6%) |
| $800 to $1,499 | 2,118 (89.3%) | 25 (0.8%) |
| Total | 2,372 (100.0%) | 2,975 (100.0%) |
Health & Disability in Ashland
Health Insurance Coverage by Age in Ashland
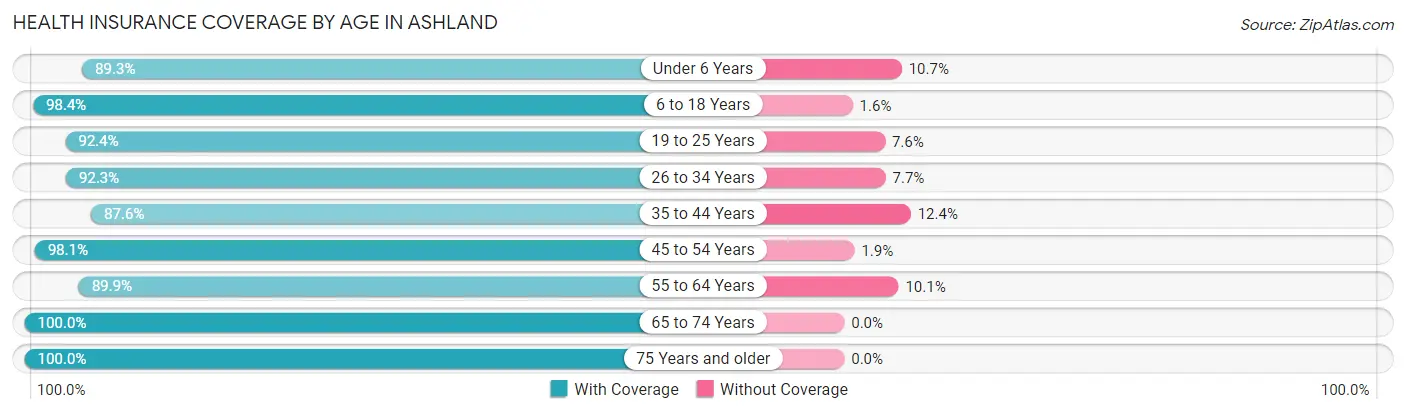
| Age Bracket | With Coverage | Without Coverage |
| Under 6 Years | 809 (89.3%) | 97 (10.7%) |
| 6 to 18 Years | 2,274 (98.4%) | 36 (1.6%) |
| 19 to 25 Years | 2,604 (92.4%) | 214 (7.6%) |
| 26 to 34 Years | 1,701 (92.3%) | 142 (7.7%) |
| 35 to 44 Years | 1,930 (87.6%) | 273 (12.4%) |
| 45 to 54 Years | 2,327 (98.1%) | 45 (1.9%) |
| 55 to 64 Years | 2,687 (89.9%) | 302 (10.1%) |
| 65 to 74 Years | 3,860 (100.0%) | 0 (0.0%) |
| 75 Years and older | 2,037 (100.0%) | 0 (0.0%) |
| Total | 20,229 (94.8%) | 1,109 (5.2%) |
Health Insurance Coverage by Citizenship Status in Ashland
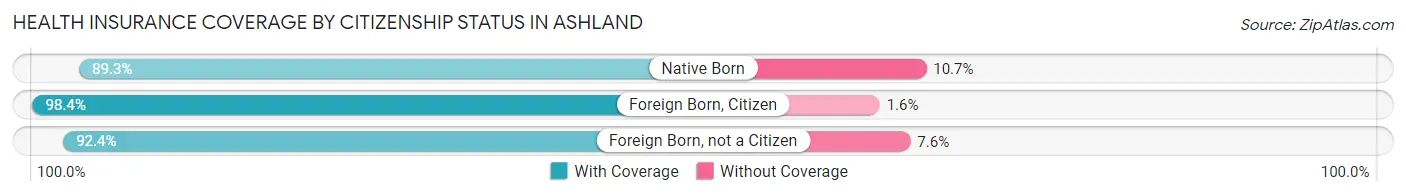
| Citizenship Status | With Coverage | Without Coverage |
| Native Born | 809 (89.3%) | 97 (10.7%) |
| Foreign Born, Citizen | 2,274 (98.4%) | 36 (1.6%) |
| Foreign Born, not a Citizen | 2,604 (92.4%) | 214 (7.6%) |
Health Insurance Coverage by Household Income in Ashland
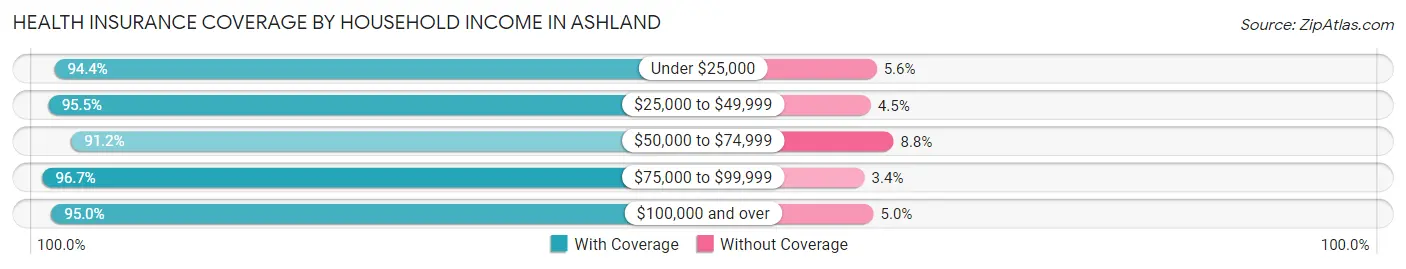
| Household Income | With Coverage | Without Coverage |
| Under $25,000 | 3,575 (94.4%) | 212 (5.6%) |
| $25,000 to $49,999 | 2,977 (95.5%) | 141 (4.5%) |
| $50,000 to $74,999 | 2,459 (91.2%) | 236 (8.8%) |
| $75,000 to $99,999 | 2,075 (96.7%) | 72 (3.4%) |
| $100,000 and over | 8,308 (95.0%) | 439 (5.0%) |
Public vs Private Health Insurance Coverage by Age in Ashland
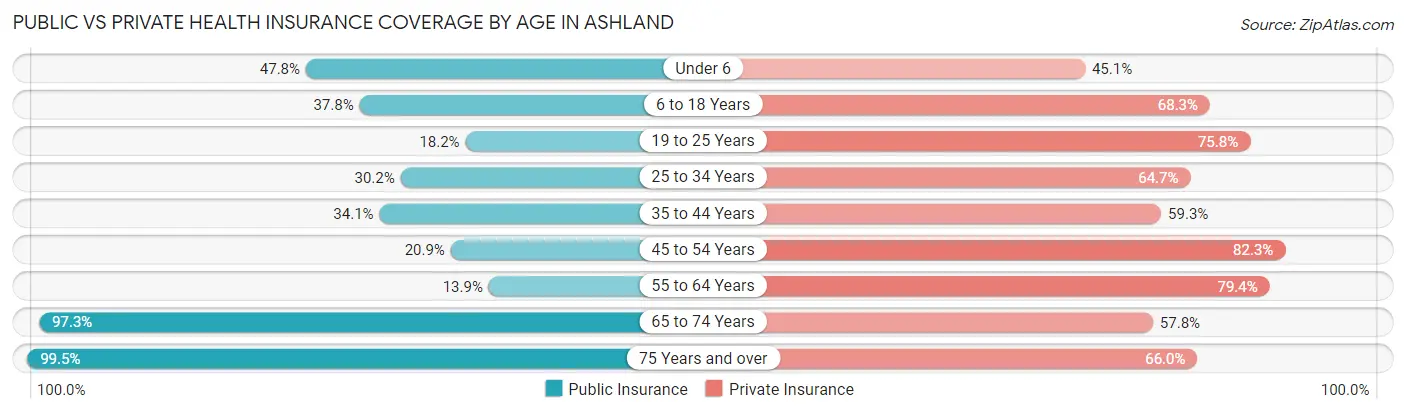
| Age Bracket | Public Insurance | Private Insurance |
| Under 6 | 433 (47.8%) | 409 (45.1%) |
| 6 to 18 Years | 874 (37.8%) | 1,578 (68.3%) |
| 19 to 25 Years | 512 (18.2%) | 2,135 (75.8%) |
| 25 to 34 Years | 557 (30.2%) | 1,192 (64.7%) |
| 35 to 44 Years | 752 (34.1%) | 1,306 (59.3%) |
| 45 to 54 Years | 496 (20.9%) | 1,952 (82.3%) |
| 55 to 64 Years | 414 (13.9%) | 2,373 (79.4%) |
| 65 to 74 Years | 3,757 (97.3%) | 2,229 (57.8%) |
| 75 Years and over | 2,027 (99.5%) | 1,344 (66.0%) |
| Total | 9,822 (46.0%) | 14,518 (68.0%) |
Disability Status by Sex by Age in Ashland
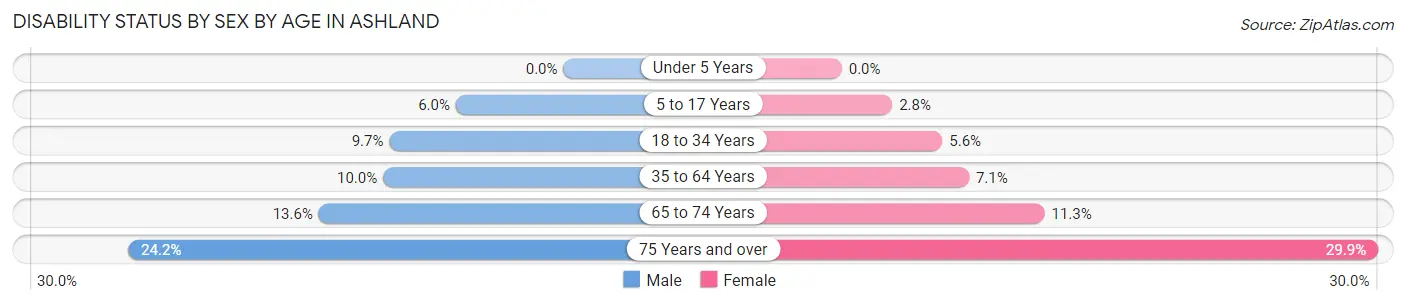
| Age Bracket | Male | Female |
| Under 5 Years | 0 (0.0%) | 0 (0.0%) |
| 5 to 17 Years | 53 (6.0%) | 31 (2.8%) |
| 18 to 34 Years | 216 (9.7%) | 160 (5.6%) |
| 35 to 64 Years | 378 (10.0%) | 269 (7.1%) |
| 65 to 74 Years | 230 (13.6%) | 245 (11.3%) |
| 75 Years and over | 191 (24.2%) | 373 (29.9%) |
Disability Class by Sex by Age in Ashland
Disability Class: Hearing Difficulty
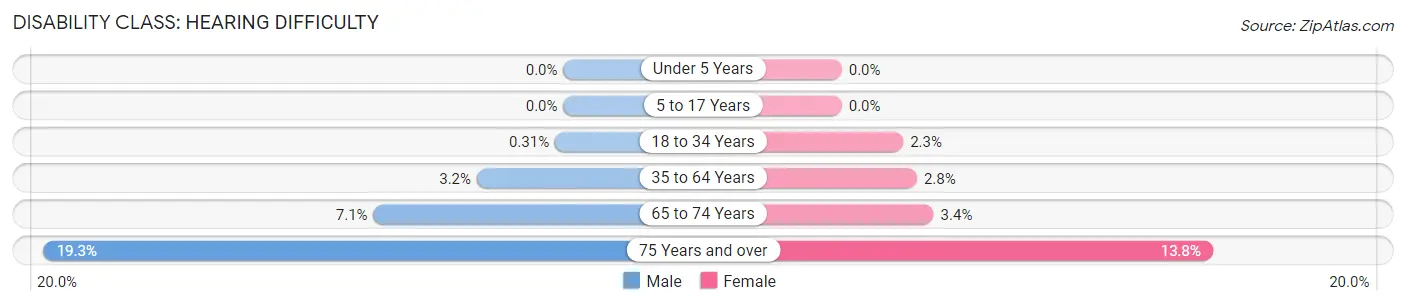
| Age Bracket | Male | Female |
| Under 5 Years | 0 (0.0%) | 0 (0.0%) |
| 5 to 17 Years | 0 (0.0%) | 0 (0.0%) |
| 18 to 34 Years | 7 (0.3%) | 65 (2.3%) |
| 35 to 64 Years | 121 (3.2%) | 106 (2.8%) |
| 65 to 74 Years | 119 (7.0%) | 74 (3.4%) |
| 75 Years and over | 152 (19.3%) | 172 (13.8%) |
Disability Class: Vision Difficulty
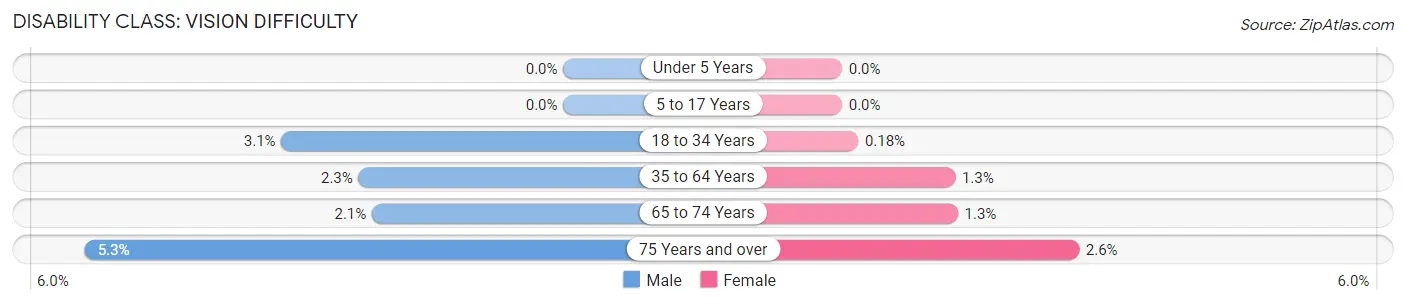
| Age Bracket | Male | Female |
| Under 5 Years | 0 (0.0%) | 0 (0.0%) |
| 5 to 17 Years | 0 (0.0%) | 0 (0.0%) |
| 18 to 34 Years | 70 (3.1%) | 5 (0.2%) |
| 35 to 64 Years | 86 (2.3%) | 48 (1.3%) |
| 65 to 74 Years | 36 (2.1%) | 28 (1.3%) |
| 75 Years and over | 42 (5.3%) | 33 (2.6%) |
Disability Class: Cognitive Difficulty
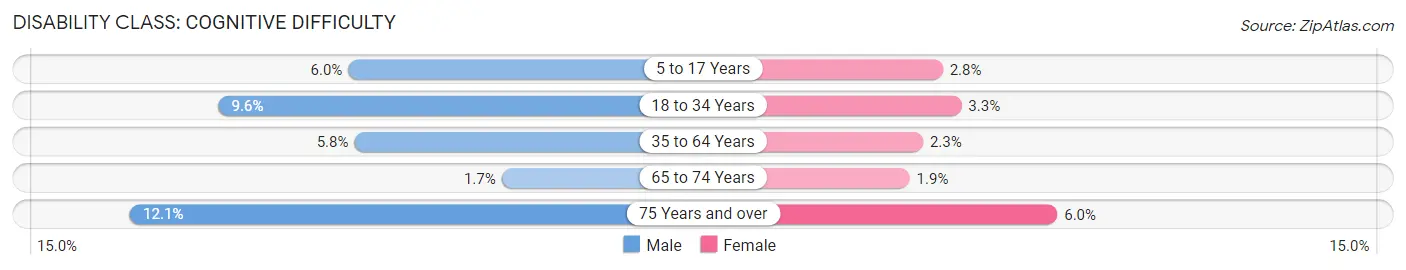
| Age Bracket | Male | Female |
| 5 to 17 Years | 53 (6.0%) | 31 (2.8%) |
| 18 to 34 Years | 214 (9.6%) | 95 (3.3%) |
| 35 to 64 Years | 219 (5.8%) | 86 (2.3%) |
| 65 to 74 Years | 29 (1.7%) | 41 (1.9%) |
| 75 Years and over | 95 (12.1%) | 75 (6.0%) |
Disability Class: Ambulatory Difficulty
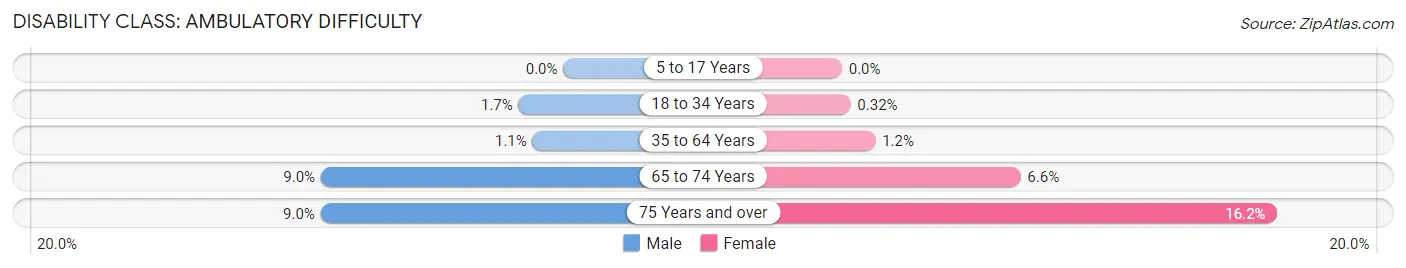
| Age Bracket | Male | Female |
| 5 to 17 Years | 0 (0.0%) | 0 (0.0%) |
| 18 to 34 Years | 37 (1.7%) | 9 (0.3%) |
| 35 to 64 Years | 43 (1.1%) | 47 (1.2%) |
| 65 to 74 Years | 152 (9.0%) | 144 (6.6%) |
| 75 Years and over | 71 (9.0%) | 202 (16.2%) |
Disability Class: Self-Care Difficulty
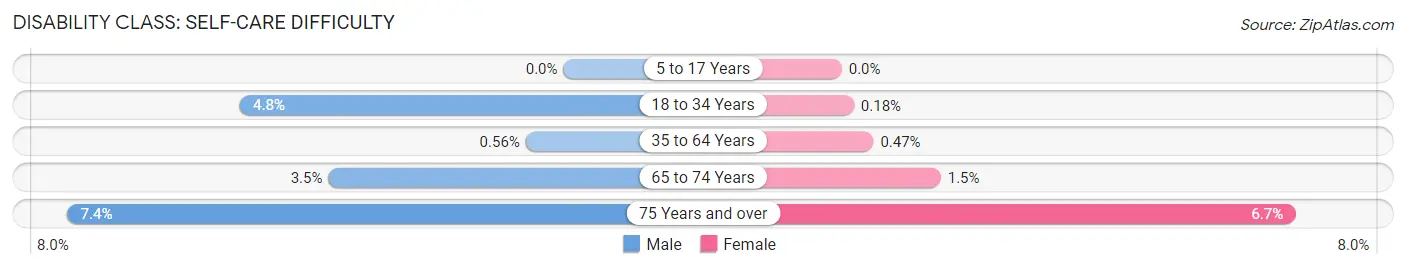
| Age Bracket | Male | Female |
| 5 to 17 Years | 0 (0.0%) | 0 (0.0%) |
| 18 to 34 Years | 107 (4.8%) | 5 (0.2%) |
| 35 to 64 Years | 21 (0.6%) | 18 (0.5%) |
| 65 to 74 Years | 59 (3.5%) | 32 (1.5%) |
| 75 Years and over | 58 (7.4%) | 84 (6.7%) |
Technology Access in Ashland
Computing Device Access in Ashland
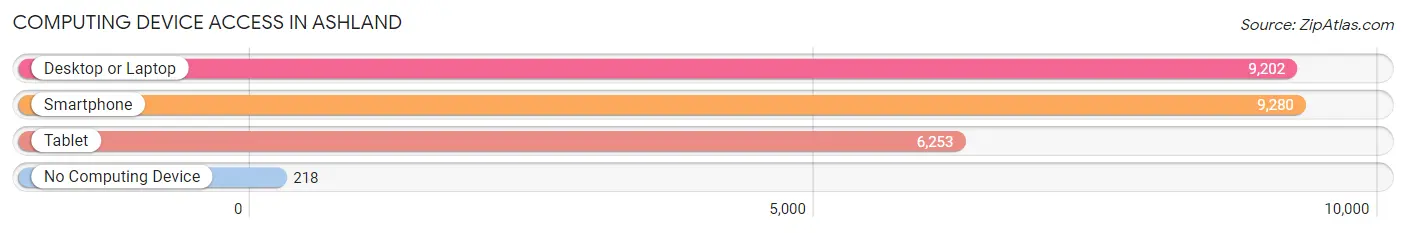
| Device Type | # Households | % Households |
| Desktop or Laptop | 9,202 | 90.9% |
| Smartphone | 9,280 | 91.7% |
| Tablet | 6,253 | 61.8% |
| No Computing Device | 218 | 2.1% |
| Total | 10,120 | 100.0% |
Internet Access in Ashland
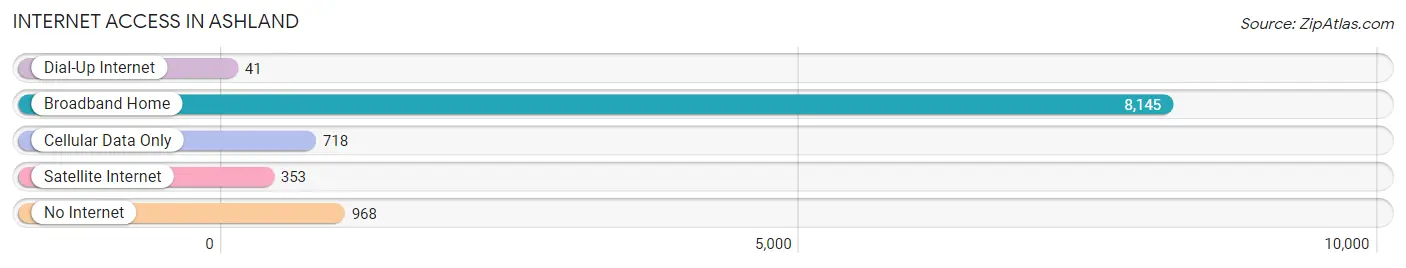
| Internet Type | # Households | % Households |
| Dial-Up Internet | 41 | 0.4% |
| Broadband Home | 8,145 | 80.5% |
| Cellular Data Only | 718 | 7.1% |
| Satellite Internet | 353 | 3.5% |
| No Internet | 968 | 9.6% |
| Total | 10,120 | 100.0% |
Ashland Summary
Ashland, Oregon is a small city located in the southwestern corner of the state, in Jackson County. It is situated in the foothills of the Cascade Mountains, and is known for its vibrant arts and culture scene, as well as its outdoor recreation opportunities. The city has a population of approximately 21,000 people, and is the home of Southern Oregon University.
History
The area that is now Ashland was originally inhabited by the Takelma Native Americans, who lived in the area for thousands of years before the arrival of European settlers. The first European settlers arrived in the area in 1852, and the city was officially incorporated in 1855. The city was named after Ashland County, Ohio, which was the hometown of one of the city’s founders.
In the late 19th century, Ashland became a popular destination for tourists, due to its proximity to the Cascade Mountains and its mild climate. The city was also home to a number of resorts, which attracted visitors from all over the country.
In the early 20th century, Ashland became a center for the timber industry, and the city’s economy was largely based on the lumber industry. The city also became a popular destination for retirees, and the population began to grow.
Geography
Ashland is located in the southwestern corner of Oregon, in Jackson County. The city is situated in the foothills of the Cascade Mountains, and is surrounded by the Siskiyou National Forest. The city is located at an elevation of 1,945 feet, and has a total area of 8.3 square miles.
The climate in Ashland is mild and temperate, with warm summers and cool winters. The average annual temperature is around 50 degrees Fahrenheit, and the average annual precipitation is around 30 inches.
Economy
The economy of Ashland is largely based on tourism, education, and the timber industry. The city is home to Southern Oregon University, which has an enrollment of over 5,000 students. The university is a major employer in the city, and provides a number of jobs in the education sector.
The city is also home to a number of tourist attractions, including the Oregon Shakespeare Festival, the Ashland Independent Film Festival, and the Lithia Park. These attractions bring in a large number of visitors to the city each year, and provide a boost to the local economy.
The timber industry is also an important part of the economy in Ashland. The city is home to a number of lumber mills, and the timber industry provides a number of jobs in the area.
Demographics
As of the 2010 census, the population of Ashland was 21,099. The racial makeup of the city was 87.3% White, 4.2% Hispanic or Latino, 2.7% Asian, 1.7% African American, 0.4% Native American, and 0.2% Pacific Islander.
The median household income in Ashland was $41,945, and the median family income was $50,945. The per capita income in the city was $25,945. The unemployment rate in Ashland was 6.2%, which was lower than the national average of 8.7%.
Conclusion
Ashland, Oregon is a small city located in the southwestern corner of the state, in Jackson County. It is situated in the foothills of the Cascade Mountains, and is known for its vibrant arts and culture scene, as well as its outdoor recreation opportunities. The city has a population of approximately 21,000 people, and is the home of Southern Oregon University. The economy of Ashland is largely based on tourism, education, and the timber industry, and the city is home to a number of tourist attractions, including the Oregon Shakespeare Festival, the Ashland Independent Film Festival, and the Lithia Park. The racial makeup of the city was 87.3% White, 4.2% Hispanic or Latino, 2.7% Asian, 1.7% African American, 0.4% Native American, and 0.2% Pacific Islander. The median household income in Ashland was $41,945, and the median family income was $50,945. The per capita income in the city was $25,945.
Common Questions
What is Per Capita Income in Ashland?
Per Capita income in Ashland is $44,580.
What is the Median Family Income in Ashland?
Median Family Income in Ashland is $108,403.
What is the Median Household income in Ashland?
Median Household Income in Ashland is $64,767.
What is Income or Wage Gap in Ashland?
Income or Wage Gap in Ashland is 37.6%.
Women in Ashland earn 62.4 cents for every dollar earned by a man.
What is Inequality or Gini Index in Ashland?
Inequality or Gini Index in Ashland is 0.50.
What is the Total Population of Ashland?
Total Population of Ashland is 21,401.
What is the Total Male Population of Ashland?
Total Male Population of Ashland is 9,872.
What is the Total Female Population of Ashland?
Total Female Population of Ashland is 11,529.
What is the Ratio of Males per 100 Females in Ashland?
There are 85.63 Males per 100 Females in Ashland.
What is the Ratio of Females per 100 Males in Ashland?
There are 116.78 Females per 100 Males in Ashland.
What is the Median Population Age in Ashland?
Median Population Age in Ashland is 48.2 Years.
What is the Average Family Size in Ashland
Average Family Size in Ashland is 2.6 People.
What is the Average Household Size in Ashland
Average Household Size in Ashland is 2.0 People.
How Large is the Labor Force in Ashland?
There are 10,862 People in the Labor Forcein in Ashland.
What is the Percentage of People in the Labor Force in Ashland?
57.4% of People are in the Labor Force in Ashland.
What is the Unemployment Rate in Ashland?
Unemployment Rate in Ashland is 5.7%.