Yale, OK Map & Demographics
Yale Map
Yale Overview
$18,746
PER CAPITA INCOME
$40,532
AVG FAMILY INCOME
$33,583
AVG HOUSEHOLD INCOME
59.9%
WAGE / INCOME GAP [ % ]
40.1¢/ $1
WAGE / INCOME GAP [ $ ]
0.44
INEQUALITY / GINI INDEX
1,179
TOTAL POPULATION
562
MALE POPULATION
617
FEMALE POPULATION
91.09
MALES / 100 FEMALES
109.79
FEMALES / 100 MALES
34.1
MEDIAN AGE
2.9
AVG FAMILY SIZE
2.4
AVG HOUSEHOLD SIZE
457
LABOR FORCE [ PEOPLE ]
48.7%
PERCENT IN LABOR FORCE
7.7%
UNEMPLOYMENT RATE
Yale Zip Codes
Yale Area Codes
Income in Yale
Income Overview in Yale
Per Capita Income in Yale is $18,746, while median incomes of families and households are $40,532 and $33,583 respectively.
| Characteristic | Number | Measure |
| Per Capita Income | 1,179 | $18,746 |
| Median Family Income | 320 | $40,532 |
| Mean Family Income | 320 | $53,583 |
| Median Household Income | 494 | $33,583 |
| Mean Household Income | 494 | $44,903 |
| Income Deficit | 320 | $0 |
| Wage / Income Gap (%) | 1,179 | 59.89% |
| Wage / Income Gap ($) | 1,179 | 40.11¢ per $1 |
| Gini / Inequality Index | 1,179 | 0.44 |
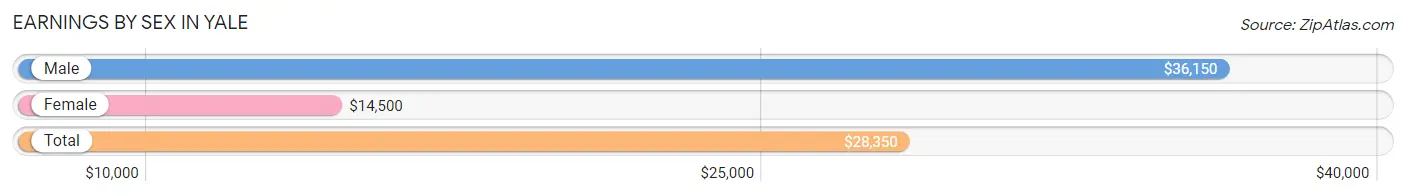
Earnings by Sex in Yale
Average Earnings in Yale are $28,350, $36,150 for men and $14,500 for women, a difference of 59.9%.
| Sex | Number | Average Earnings |
| Male | 247 (53.8%) | $36,150 |
| Female | 212 (46.2%) | $14,500 |
| Total | 459 (100.0%) | $28,350 |
Earnings by Sex by Income Bracket in Yale
The most common earnings brackets in Yale are $65,000 to $74,999 for men (33 | 13.4%) and $30,000 to $34,999 for women (39 | 18.4%).
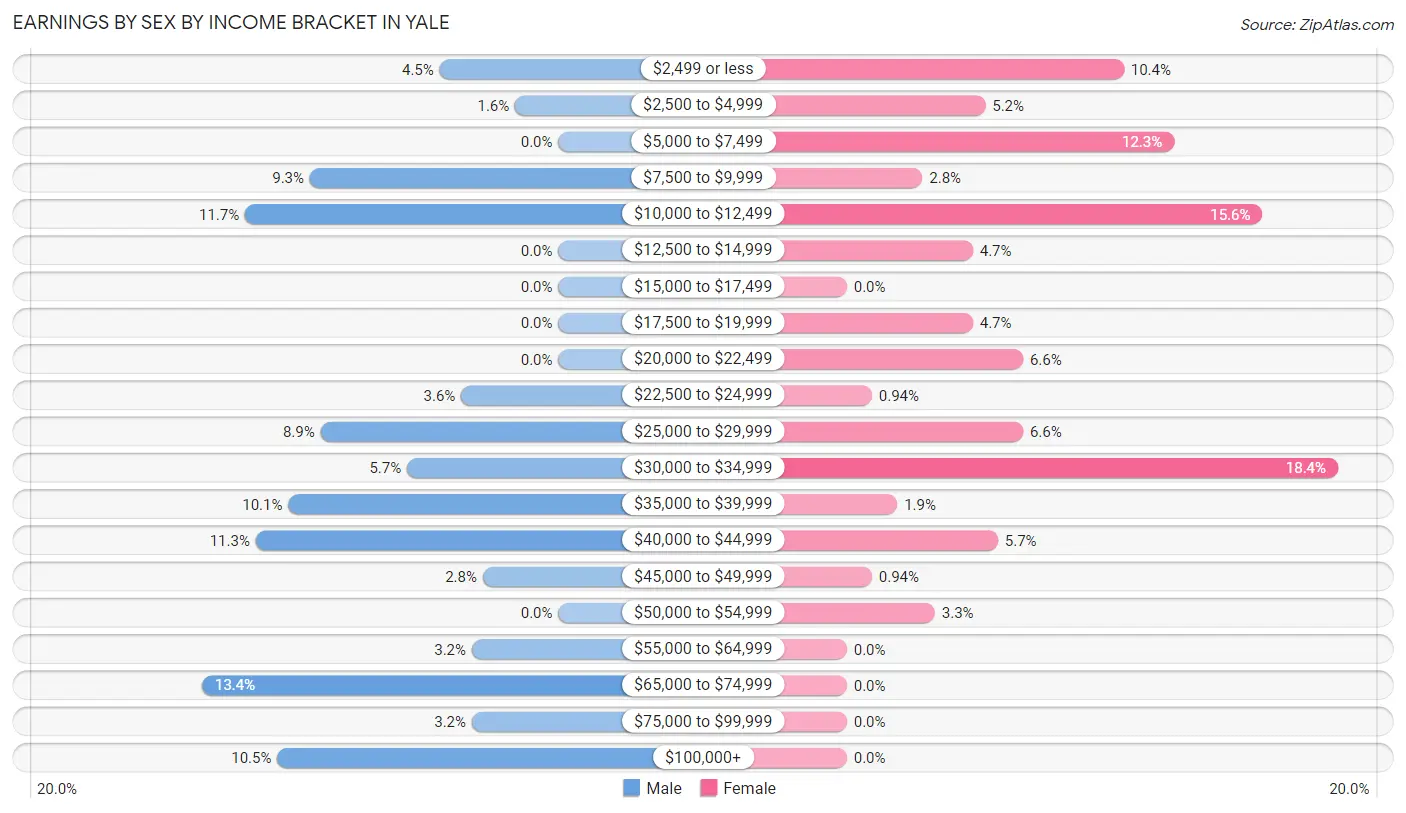
| Income | Male | Female |
| $2,499 or less | 11 (4.4%) | 22 (10.4%) |
| $2,500 to $4,999 | 4 (1.6%) | 11 (5.2%) |
| $5,000 to $7,499 | 0 (0.0%) | 26 (12.3%) |
| $7,500 to $9,999 | 23 (9.3%) | 6 (2.8%) |
| $10,000 to $12,499 | 29 (11.7%) | 33 (15.6%) |
| $12,500 to $14,999 | 0 (0.0%) | 10 (4.7%) |
| $15,000 to $17,499 | 0 (0.0%) | 0 (0.0%) |
| $17,500 to $19,999 | 0 (0.0%) | 10 (4.7%) |
| $20,000 to $22,499 | 0 (0.0%) | 14 (6.6%) |
| $22,500 to $24,999 | 9 (3.6%) | 2 (0.9%) |
| $25,000 to $29,999 | 22 (8.9%) | 14 (6.6%) |
| $30,000 to $34,999 | 14 (5.7%) | 39 (18.4%) |
| $35,000 to $39,999 | 25 (10.1%) | 4 (1.9%) |
| $40,000 to $44,999 | 28 (11.3%) | 12 (5.7%) |
| $45,000 to $49,999 | 7 (2.8%) | 2 (0.9%) |
| $50,000 to $54,999 | 0 (0.0%) | 7 (3.3%) |
| $55,000 to $64,999 | 8 (3.2%) | 0 (0.0%) |
| $65,000 to $74,999 | 33 (13.4%) | 0 (0.0%) |
| $75,000 to $99,999 | 8 (3.2%) | 0 (0.0%) |
| $100,000+ | 26 (10.5%) | 0 (0.0%) |
| Total | 247 (100.0%) | 212 (100.0%) |
Earnings by Sex by Educational Attainment in Yale
Average earnings in Yale are $36,500 for men and $23,750 for women, a difference of 34.9%. Men with an educational attainment of bachelor's degree enjoy the highest average annual earnings of $73,512, while those with college or associate's degree education earn the least with $35,250. Women with an educational attainment of college or associate's degree earn the most with the average annual earnings of $31,250, while those with high school diploma education have the smallest earnings of $18,375.
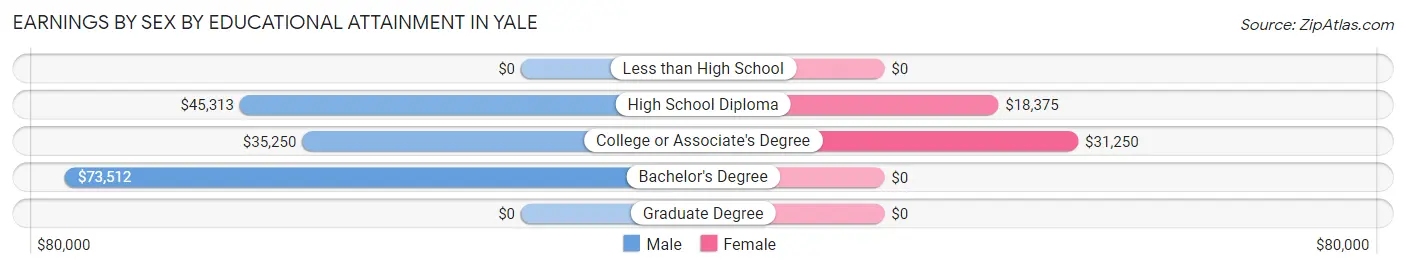
| Educational Attainment | Male Income | Female Income |
| Less than High School | - | - |
| High School Diploma | $45,313 | $18,375 |
| College or Associate's Degree | $35,250 | $31,250 |
| Bachelor's Degree | $73,512 | $0 |
| Graduate Degree | - | - |
| Total | $36,500 | $23,750 |
Family Income in Yale
Family Income Brackets in Yale
According to the Yale family income data, there are 75 families falling into the $35,000 to $49,999 income range, which is the most common income bracket and makes up 23.4% of all families. Conversely, the $150,000 to $199,999 income bracket is the least frequent group with only 5 families (1.6%) belonging to this category.
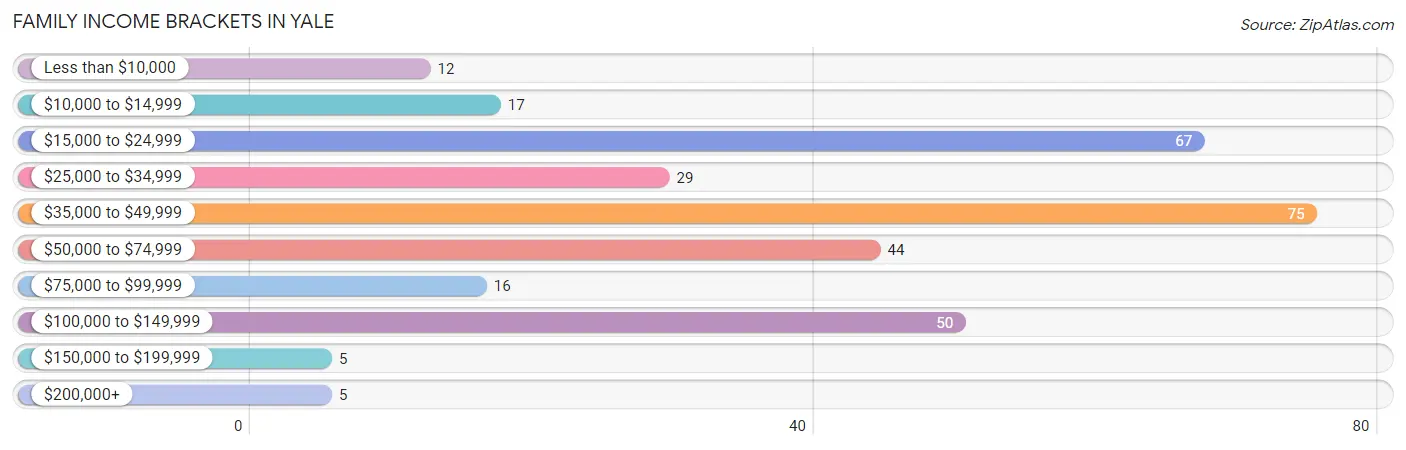
| Income Bracket | # Families | % Families |
| Less than $10,000 | 12 | 3.8% |
| $10,000 to $14,999 | 17 | 5.3% |
| $15,000 to $24,999 | 67 | 20.9% |
| $25,000 to $34,999 | 29 | 9.1% |
| $35,000 to $49,999 | 75 | 23.4% |
| $50,000 to $74,999 | 44 | 13.8% |
| $75,000 to $99,999 | 16 | 5.0% |
| $100,000 to $149,999 | 50 | 15.6% |
| $150,000 to $199,999 | 5 | 1.6% |
| $200,000+ | 5 | 1.6% |
Family Income by Famaliy Size in Yale
2-person families (138 | 43.1%) account for the highest median family income in Yale with $41,210 per family, while 2-person families (138 | 43.1%) have the highest median income of $20,605 per family member.
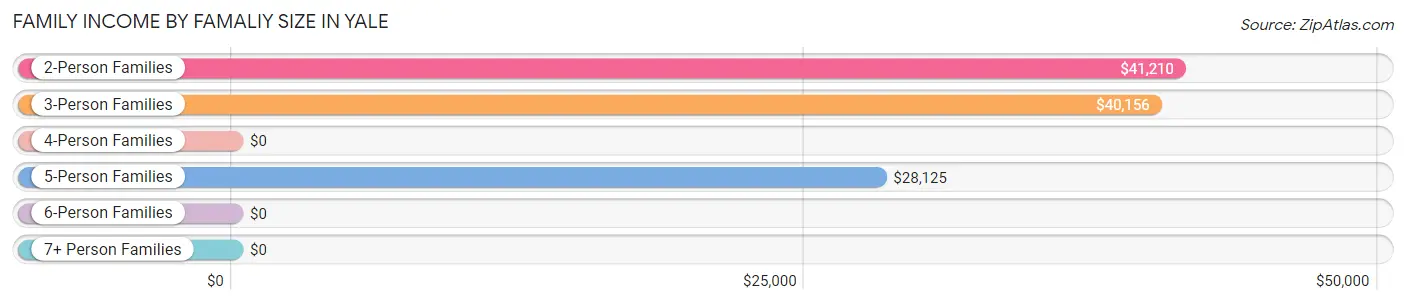
| Income Bracket | # Families | Median Income |
| 2-Person Families | 138 (43.1%) | $41,210 |
| 3-Person Families | 96 (30.0%) | $40,156 |
| 4-Person Families | 64 (20.0%) | $0 |
| 5-Person Families | 18 (5.6%) | $28,125 |
| 6-Person Families | 4 (1.3%) | $0 |
| 7+ Person Families | 0 (0.0%) | $0 |
| Total | 320 (100.0%) | $40,532 |
Family Income by Number of Earners in Yale
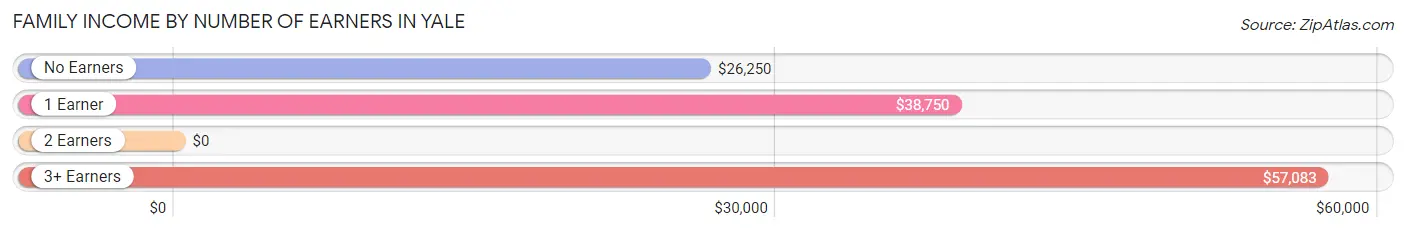
| Number of Earners | # Families | Median Income |
| No Earners | 78 (24.4%) | $26,250 |
| 1 Earner | 150 (46.9%) | $38,750 |
| 2 Earners | 82 (25.6%) | $0 |
| 3+ Earners | 10 (3.1%) | $57,083 |
| Total | 320 (100.0%) | $40,532 |
Household Income in Yale
Household Income Brackets in Yale
With 92 households falling in the category, the $15,000 to $24,999 income range is the most frequent in Yale, accounting for 18.6% of all households. In contrast, only 5 households (1.0%) fall into the $150,000 to $199,999 income bracket, making it the least populous group.
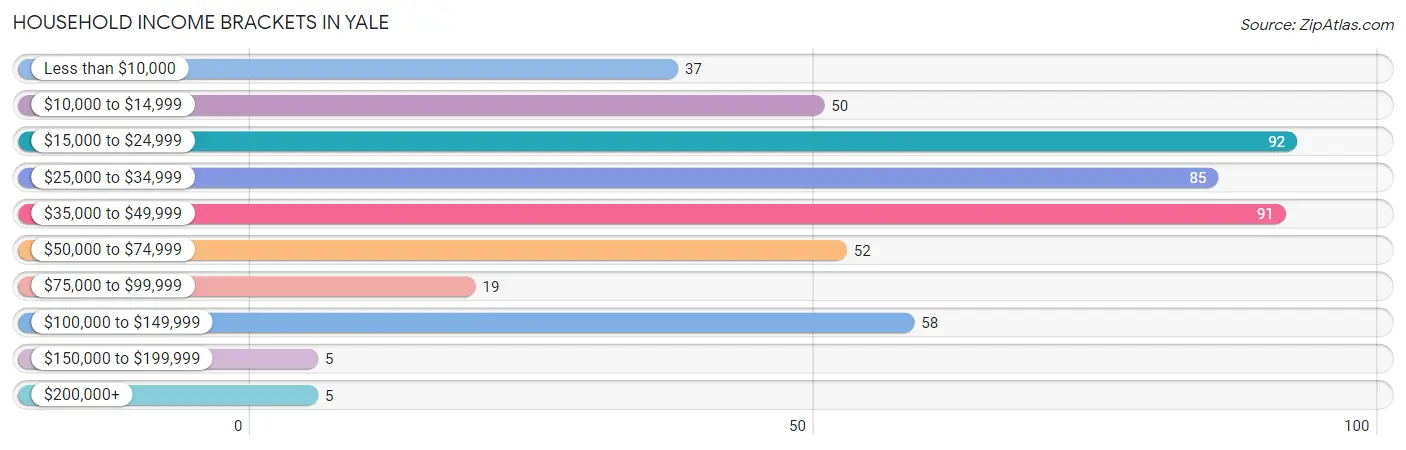
| Income Bracket | # Households | % Households |
| Less than $10,000 | 37 | 7.5% |
| $10,000 to $14,999 | 50 | 10.1% |
| $15,000 to $24,999 | 92 | 18.6% |
| $25,000 to $34,999 | 85 | 17.2% |
| $35,000 to $49,999 | 91 | 18.4% |
| $50,000 to $74,999 | 52 | 10.5% |
| $75,000 to $99,999 | 19 | 3.8% |
| $100,000 to $149,999 | 58 | 11.7% |
| $150,000 to $199,999 | 5 | 1.0% |
| $200,000+ | 5 | 1.0% |
Household Income by Householder Age in Yale
The median household income in Yale is $33,583, with the highest median household income of $52,188 found in the 45 to 64 years age bracket for the primary householder. A total of 133 households (26.9%) fall into this category. Meanwhile, the 15 to 24 years age bracket for the primary householder has the lowest median household income of $0, with 44 households (8.9%) in this group.
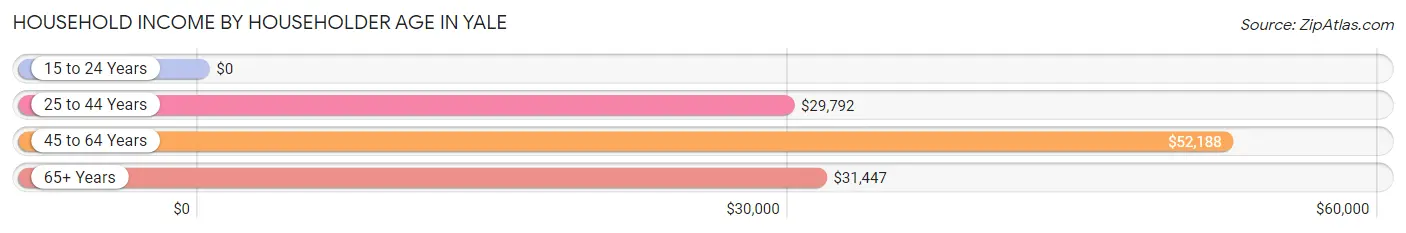
| Income Bracket | # Households | Median Income |
| 15 to 24 Years | 44 (8.9%) | $0 |
| 25 to 44 Years | 161 (32.6%) | $29,792 |
| 45 to 64 Years | 133 (26.9%) | $52,188 |
| 65+ Years | 156 (31.6%) | $31,447 |
| Total | 494 (100.0%) | $33,583 |
Poverty in Yale
Income Below Poverty by Sex and Age in Yale
With 44.3% poverty level for males and 39.2% for females among the residents of Yale, 6 to 11 year old males and 16 and 17 year old females are the most vulnerable to poverty, with 35 males (100.0%) and 17 females (100.0%) in their respective age groups living below the poverty level.
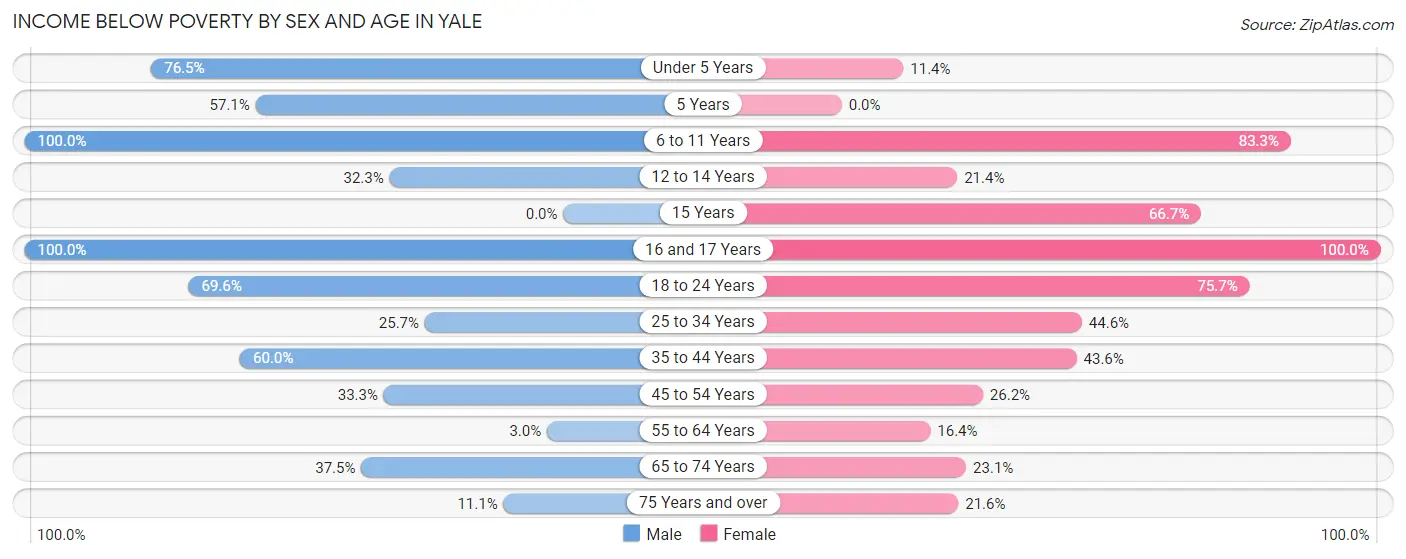
| Age Bracket | Male | Female |
| Under 5 Years | 26 (76.5%) | 4 (11.4%) |
| 5 Years | 12 (57.1%) | 0 (0.0%) |
| 6 to 11 Years | 35 (100.0%) | 20 (83.3%) |
| 12 to 14 Years | 10 (32.3%) | 3 (21.4%) |
| 15 Years | 0 (0.0%) | 12 (66.7%) |
| 16 and 17 Years | 20 (100.0%) | 17 (100.0%) |
| 18 to 24 Years | 32 (69.6%) | 56 (75.7%) |
| 25 to 34 Years | 27 (25.7%) | 41 (44.6%) |
| 35 to 44 Years | 33 (60.0%) | 34 (43.6%) |
| 45 to 54 Years | 27 (33.3%) | 11 (26.2%) |
| 55 to 64 Years | 1 (3.0%) | 12 (16.4%) |
| 65 to 74 Years | 21 (37.5%) | 21 (23.1%) |
| 75 Years and over | 4 (11.1%) | 8 (21.6%) |
| Total | 248 (44.3%) | 239 (39.2%) |
Income Above Poverty by Sex and Age in Yale
According to the poverty statistics in Yale, males aged 15 years and females aged 5 years are the age groups that are most secure financially, with 100.0% of males and 100.0% of females in these age groups living above the poverty line.
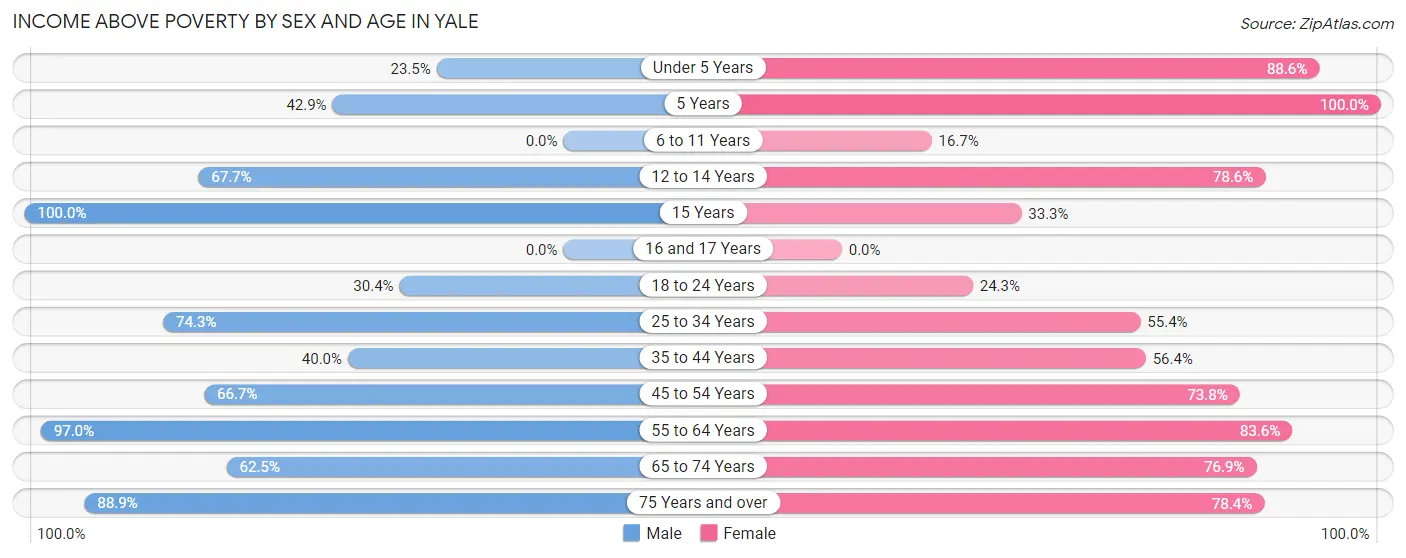
| Age Bracket | Male | Female |
| Under 5 Years | 8 (23.5%) | 31 (88.6%) |
| 5 Years | 9 (42.9%) | 14 (100.0%) |
| 6 to 11 Years | 0 (0.0%) | 4 (16.7%) |
| 12 to 14 Years | 21 (67.7%) | 11 (78.6%) |
| 15 Years | 7 (100.0%) | 6 (33.3%) |
| 16 and 17 Years | 0 (0.0%) | 0 (0.0%) |
| 18 to 24 Years | 14 (30.4%) | 18 (24.3%) |
| 25 to 34 Years | 78 (74.3%) | 51 (55.4%) |
| 35 to 44 Years | 22 (40.0%) | 44 (56.4%) |
| 45 to 54 Years | 54 (66.7%) | 31 (73.8%) |
| 55 to 64 Years | 32 (97.0%) | 61 (83.6%) |
| 65 to 74 Years | 35 (62.5%) | 70 (76.9%) |
| 75 Years and over | 32 (88.9%) | 29 (78.4%) |
| Total | 312 (55.7%) | 370 (60.8%) |
Income Below Poverty Among Married-Couple Families in Yale
The poverty statistics for married-couple families in Yale show that 20.6% or 45 of the total 218 families live below the poverty line. Families with 3 or 4 children have the highest poverty rate of 83.3%, comprising of 15 families. On the other hand, families with no children have the lowest poverty rate of 9.1%, which includes 11 families.
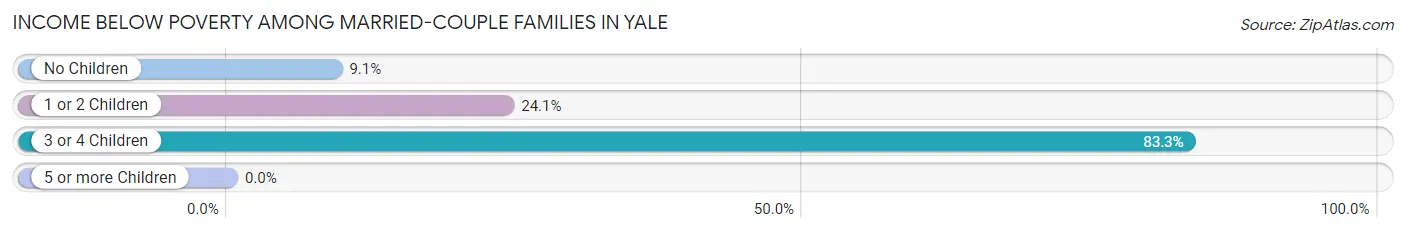
| Children | Above Poverty | Below Poverty |
| No Children | 110 (90.9%) | 11 (9.1%) |
| 1 or 2 Children | 60 (75.9%) | 19 (24.0%) |
| 3 or 4 Children | 3 (16.7%) | 15 (83.3%) |
| 5 or more Children | 0 (0.0%) | 0 (0.0%) |
| Total | 173 (79.4%) | 45 (20.6%) |
Income Below Poverty Among Single-Parent Households in Yale
According to the poverty data in Yale, 44.4% or 12 single-father households and 64.0% or 48 single-mother households are living below the poverty line. Among single-father households, those with no children have the highest poverty rate, with 12 households (48.0%) experiencing poverty. Likewise, among single-mother households, those with 3 or 4 children have the highest poverty rate, with 3 households (100.0%) falling below the poverty line.
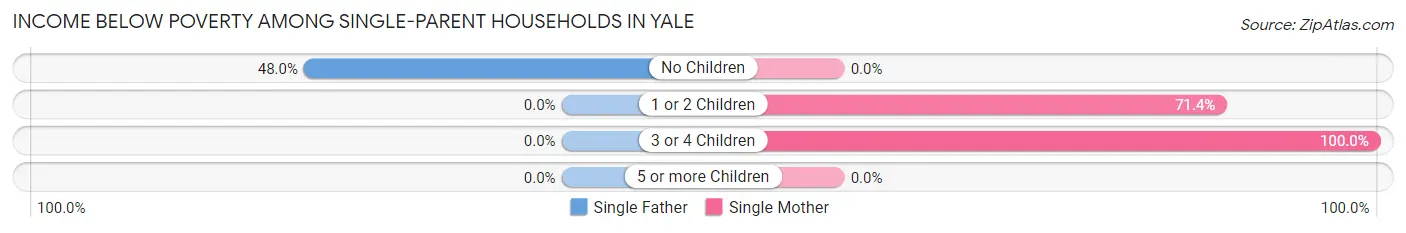
| Children | Single Father | Single Mother |
| No Children | 12 (48.0%) | 0 (0.0%) |
| 1 or 2 Children | 0 (0.0%) | 45 (71.4%) |
| 3 or 4 Children | 0 (0.0%) | 3 (100.0%) |
| 5 or more Children | 0 (0.0%) | 0 (0.0%) |
| Total | 12 (44.4%) | 48 (64.0%) |
Income Below Poverty Among Married-Couple vs Single-Parent Households in Yale
The poverty data for Yale shows that 45 of the married-couple family households (20.6%) and 60 of the single-parent households (58.8%) are living below the poverty level. Within the married-couple family households, those with 3 or 4 children have the highest poverty rate, with 15 households (83.3%) falling below the poverty line. Among the single-parent households, those with 3 or 4 children have the highest poverty rate, with 3 household (100.0%) living below poverty.
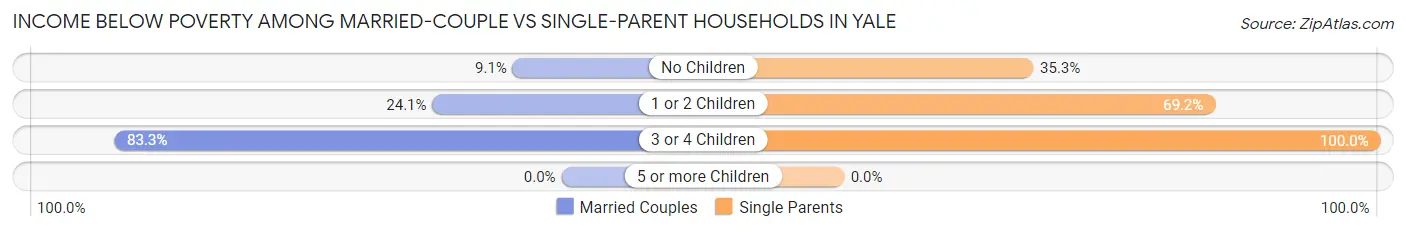
| Children | Married-Couple Families | Single-Parent Households |
| No Children | 11 (9.1%) | 12 (35.3%) |
| 1 or 2 Children | 19 (24.0%) | 45 (69.2%) |
| 3 or 4 Children | 15 (83.3%) | 3 (100.0%) |
| 5 or more Children | 0 (0.0%) | 0 (0.0%) |
| Total | 45 (20.6%) | 60 (58.8%) |
Race in Yale
The most populous races in Yale are White / Caucasian (975 | 82.7%), Two or more Races (136 | 11.5%), and Hispanic or Latino (60 | 5.1%).
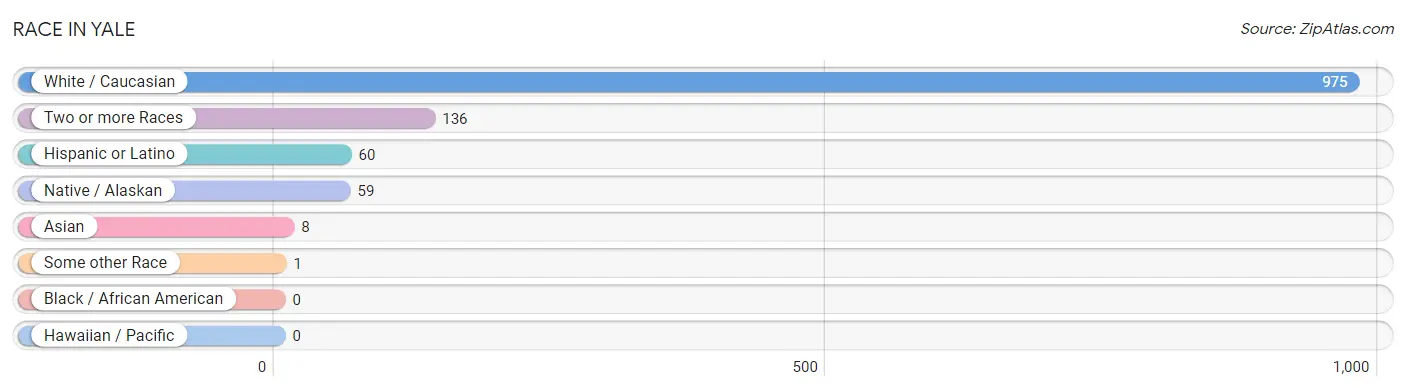
| Race | # Population | % Population |
| Asian | 8 | 0.7% |
| Black / African American | 0 | 0.0% |
| Hawaiian / Pacific | 0 | 0.0% |
| Hispanic or Latino | 60 | 5.1% |
| Native / Alaskan | 59 | 5.0% |
| White / Caucasian | 975 | 82.7% |
| Two or more Races | 136 | 11.5% |
| Some other Race | 1 | 0.1% |
| Total | 1,179 | 100.0% |
Ancestry in Yale
The most populous ancestries reported in Yale are German (198 | 16.8%), Irish (192 | 16.3%), American (92 | 7.8%), Cherokee (82 | 7.0%), and English (73 | 6.2%), together accounting for 54.0% of all Yale residents.
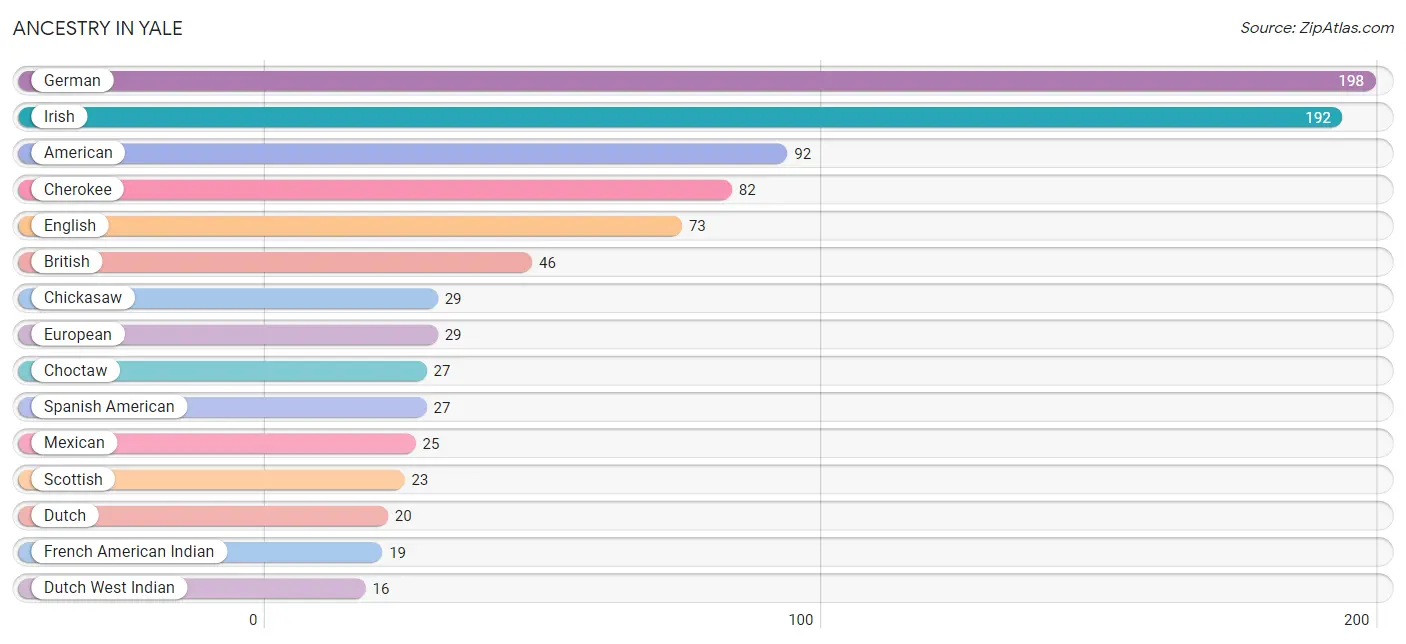
| Ancestry | # Population | % Population |
| American | 92 | 7.8% |
| British | 46 | 3.9% |
| Cherokee | 82 | 7.0% |
| Chickasaw | 29 | 2.5% |
| Choctaw | 27 | 2.3% |
| Comanche | 2 | 0.2% |
| Creek | 4 | 0.3% |
| Czech | 9 | 0.8% |
| Czechoslovakian | 2 | 0.2% |
| Dutch | 20 | 1.7% |
| Dutch West Indian | 16 | 1.4% |
| Eastern European | 8 | 0.7% |
| English | 73 | 6.2% |
| European | 29 | 2.5% |
| French | 14 | 1.2% |
| French American Indian | 19 | 1.6% |
| German | 198 | 16.8% |
| Irish | 192 | 16.3% |
| Italian | 8 | 0.7% |
| Korean | 5 | 0.4% |
| Mexican | 25 | 2.1% |
| Navajo | 8 | 0.7% |
| Norwegian | 5 | 0.4% |
| Scandinavian | 3 | 0.3% |
| Scotch-Irish | 5 | 0.4% |
| Scottish | 23 | 1.9% |
| Spaniard | 8 | 0.7% |
| Spanish American | 27 | 2.3% |
| Sri Lankan | 8 | 0.7% |
| Swedish | 6 | 0.5% | View All 30 Rows |
Immigrants in Yale
The most numerous immigrant groups reported in Yale came from Europe (5 | 0.4%), Germany (5 | 0.4%), Western Europe (5 | 0.4%), Asia (4 | 0.3%), and South Eastern Asia (4 | 0.3%), together accounting for 1.9% of all Yale residents.
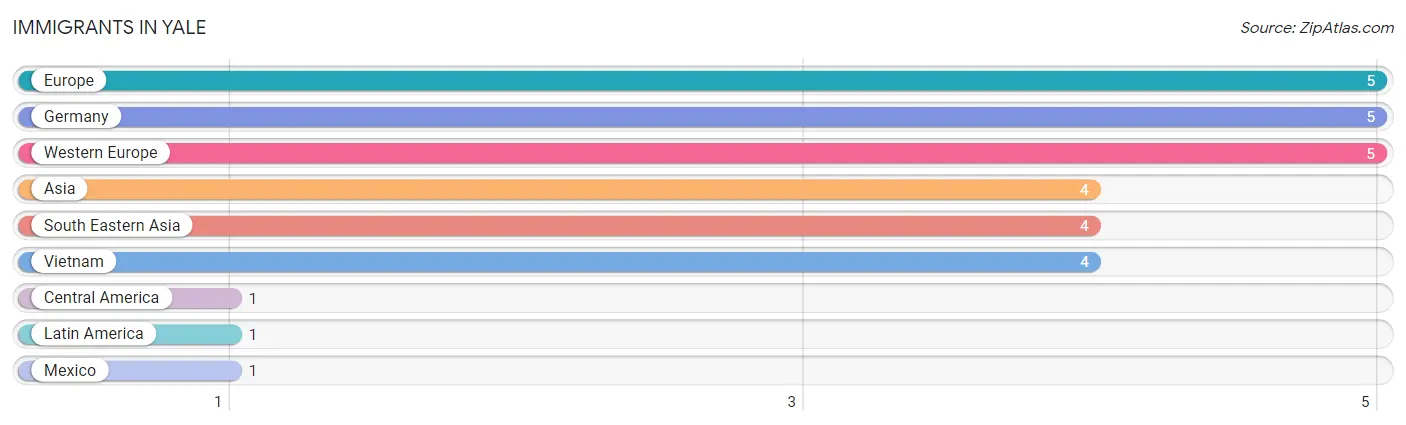
| Immigration Origin | # Population | % Population |
| Asia | 4 | 0.3% |
| Central America | 1 | 0.1% |
| Europe | 5 | 0.4% |
| Germany | 5 | 0.4% |
| Latin America | 1 | 0.1% |
| Mexico | 1 | 0.1% |
| South Eastern Asia | 4 | 0.3% |
| Vietnam | 4 | 0.3% |
| Western Europe | 5 | 0.4% | View All 9 Rows |
Sex and Age in Yale
Sex and Age in Yale
The most populous age groups in Yale are 25 to 29 Years (73 | 13.0%) for men and 65 to 69 Years (64 | 10.4%) for women.
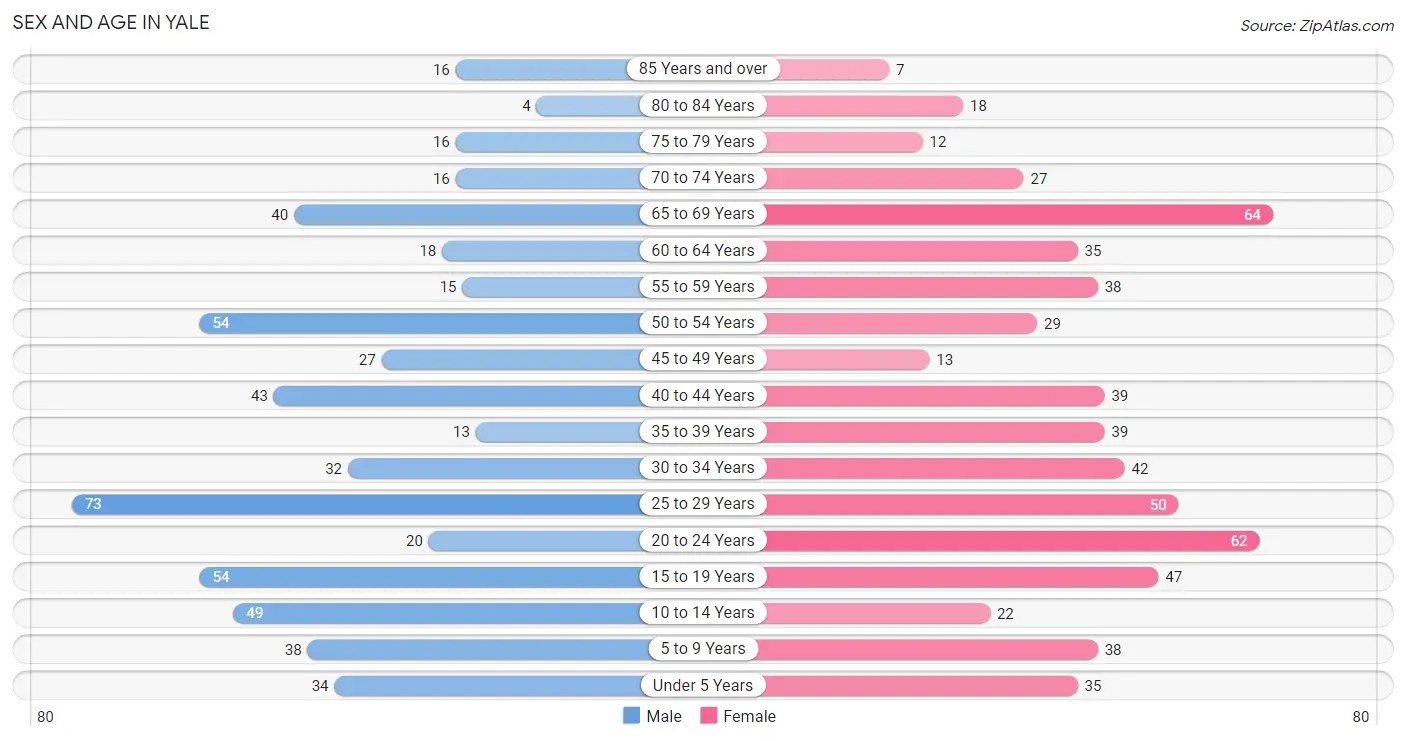
| Age Bracket | Male | Female |
| Under 5 Years | 34 (6.0%) | 35 (5.7%) |
| 5 to 9 Years | 38 (6.8%) | 38 (6.2%) |
| 10 to 14 Years | 49 (8.7%) | 22 (3.6%) |
| 15 to 19 Years | 54 (9.6%) | 47 (7.6%) |
| 20 to 24 Years | 20 (3.6%) | 62 (10.1%) |
| 25 to 29 Years | 73 (13.0%) | 50 (8.1%) |
| 30 to 34 Years | 32 (5.7%) | 42 (6.8%) |
| 35 to 39 Years | 13 (2.3%) | 39 (6.3%) |
| 40 to 44 Years | 43 (7.6%) | 39 (6.3%) |
| 45 to 49 Years | 27 (4.8%) | 13 (2.1%) |
| 50 to 54 Years | 54 (9.6%) | 29 (4.7%) |
| 55 to 59 Years | 15 (2.7%) | 38 (6.2%) |
| 60 to 64 Years | 18 (3.2%) | 35 (5.7%) |
| 65 to 69 Years | 40 (7.1%) | 64 (10.4%) |
| 70 to 74 Years | 16 (2.9%) | 27 (4.4%) |
| 75 to 79 Years | 16 (2.9%) | 12 (1.9%) |
| 80 to 84 Years | 4 (0.7%) | 18 (2.9%) |
| 85 Years and over | 16 (2.9%) | 7 (1.1%) |
| Total | 562 (100.0%) | 617 (100.0%) |
Families and Households in Yale
Median Family Size in Yale
The median family size in Yale is 2.86 persons per family, with married-couple families (218 | 68.1%) accounting for the largest median family size of 3 persons per family. On the other hand, single male/father families (27 | 8.4%) represent the smallest median family size with 2.52 persons per family.
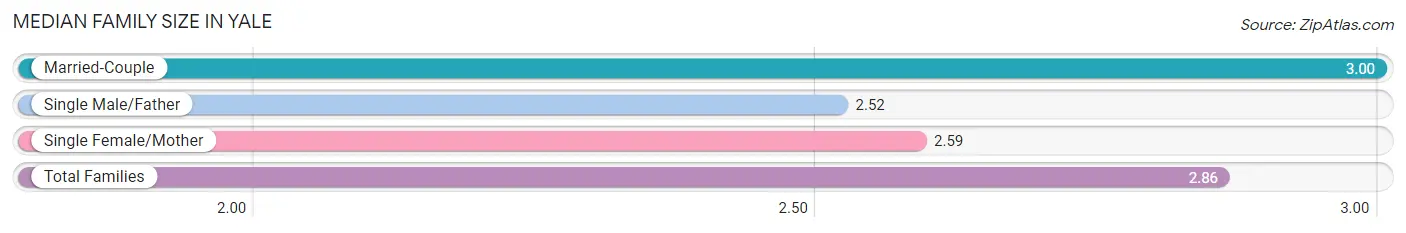
| Family Type | # Families | Family Size |
| Married-Couple | 218 (68.1%) | 3.00 |
| Single Male/Father | 27 (8.4%) | 2.52 |
| Single Female/Mother | 75 (23.4%) | 2.59 |
| Total Families | 320 (100.0%) | 2.86 |
Median Household Size in Yale
The median household size in Yale is 2.37 persons per household, with single female/mother households (75 | 15.2%) accounting for the largest median household size of 3.49 persons per household. non-family households (174 | 35.2%) represent the smallest median household size with 1.05 persons per household.
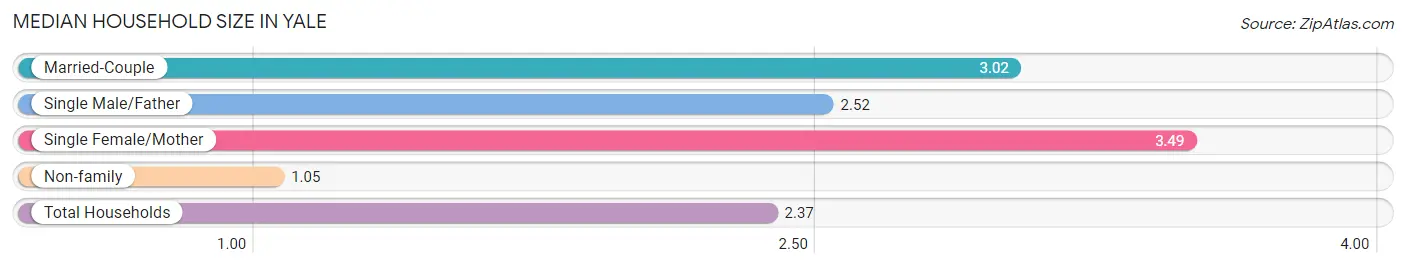
| Household Type | # Households | Household Size |
| Married-Couple | 218 (44.1%) | 3.02 |
| Single Male/Father | 27 (5.5%) | 2.52 |
| Single Female/Mother | 75 (15.2%) | 3.49 |
| Non-family | 174 (35.2%) | 1.05 |
| Total Households | 494 (100.0%) | 2.37 |
Household Size by Marriage Status in Yale
Out of a total of 494 households in Yale, 320 (64.8%) are family households, while 174 (35.2%) are nonfamily households. The most numerous type of family households are 2-person households, comprising 120, and the most common type of nonfamily households are 1-person households, comprising 163.
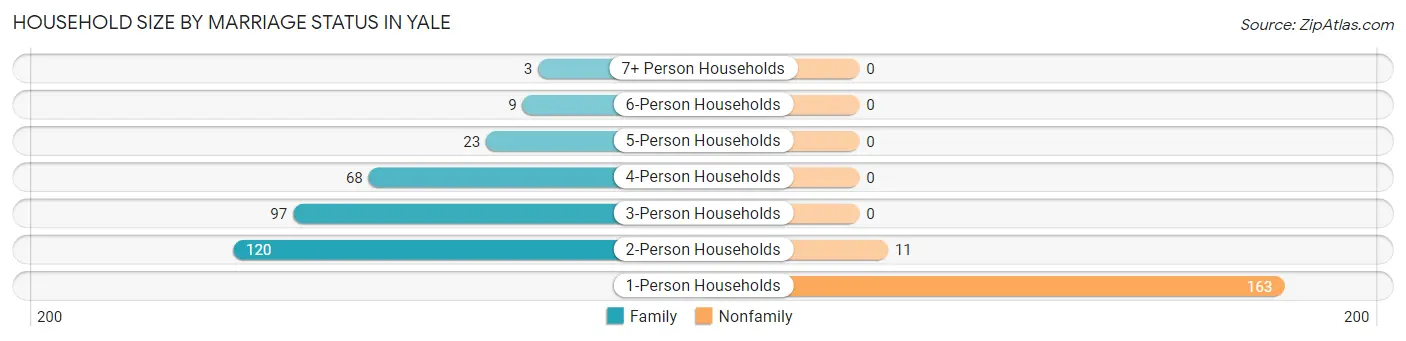
| Household Size | Family Households | Nonfamily Households |
| 1-Person Households | - | 163 (33.0%) |
| 2-Person Households | 120 (24.3%) | 11 (2.2%) |
| 3-Person Households | 97 (19.6%) | 0 (0.0%) |
| 4-Person Households | 68 (13.8%) | 0 (0.0%) |
| 5-Person Households | 23 (4.7%) | 0 (0.0%) |
| 6-Person Households | 9 (1.8%) | 0 (0.0%) |
| 7+ Person Households | 3 (0.6%) | 0 (0.0%) |
| Total | 320 (64.8%) | 174 (35.2%) |
Female Fertility in Yale
Fertility by Age in Yale
Average fertility rate in Yale is 37.0 births per 1,000 women. Women in the age bracket of 20 to 34 years have the highest fertility rate with 71.0 births per 1,000 women. Women in the age bracket of 20 to 34 years acount for 100.0% of all women with births.
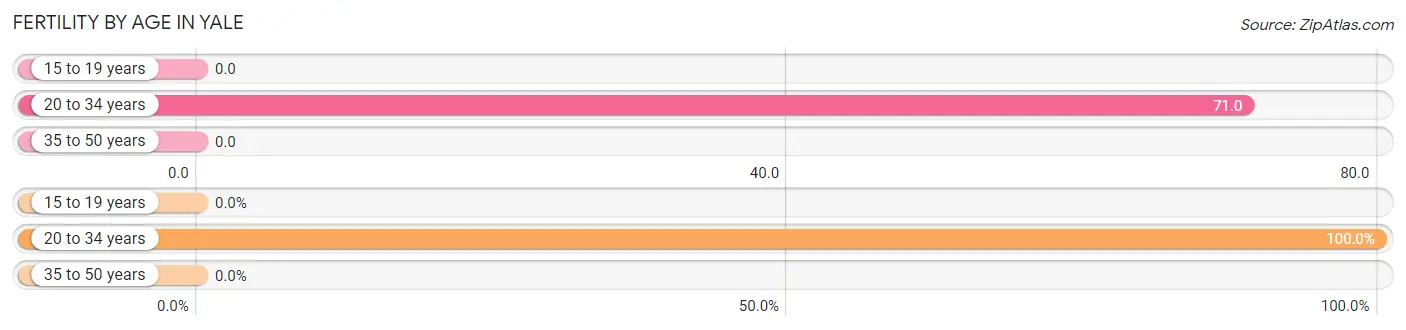
| Age Bracket | Women with Births | Births / 1,000 Women |
| 15 to 19 years | 0 (0.0%) | 0.0 |
| 20 to 34 years | 11 (100.0%) | 71.0 |
| 35 to 50 years | 0 (0.0%) | 0.0 |
| Total | 11 (100.0%) | 37.0 |
Fertility by Age by Marriage Status in Yale
45.5% of women with births (11) in Yale are married. The highest percentage of unmarried women with births falls into 20 to 34 years age bracket with 54.5% of them unmarried at the time of birth, while the lowest percentage of unmarried women with births belong to 20 to 34 years age bracket with 54.5% of them unmarried.
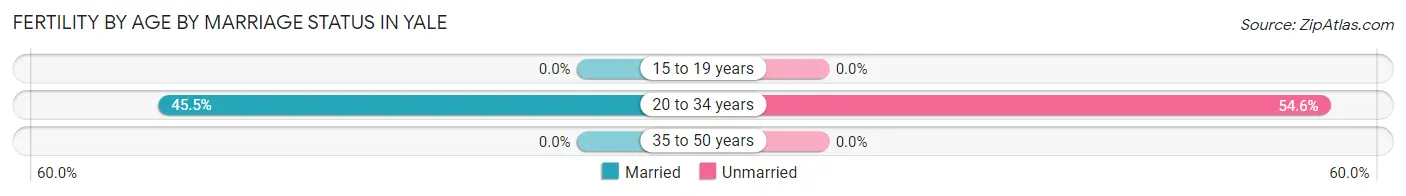
| Age Bracket | Married | Unmarried |
| 15 to 19 years | 0 (0.0%) | 0 (0.0%) |
| 20 to 34 years | 5 (45.5%) | 6 (54.5%) |
| 35 to 50 years | 0 (0.0%) | 0 (0.0%) |
| Total | 5 (45.5%) | 6 (54.5%) |
Fertility by Education in Yale
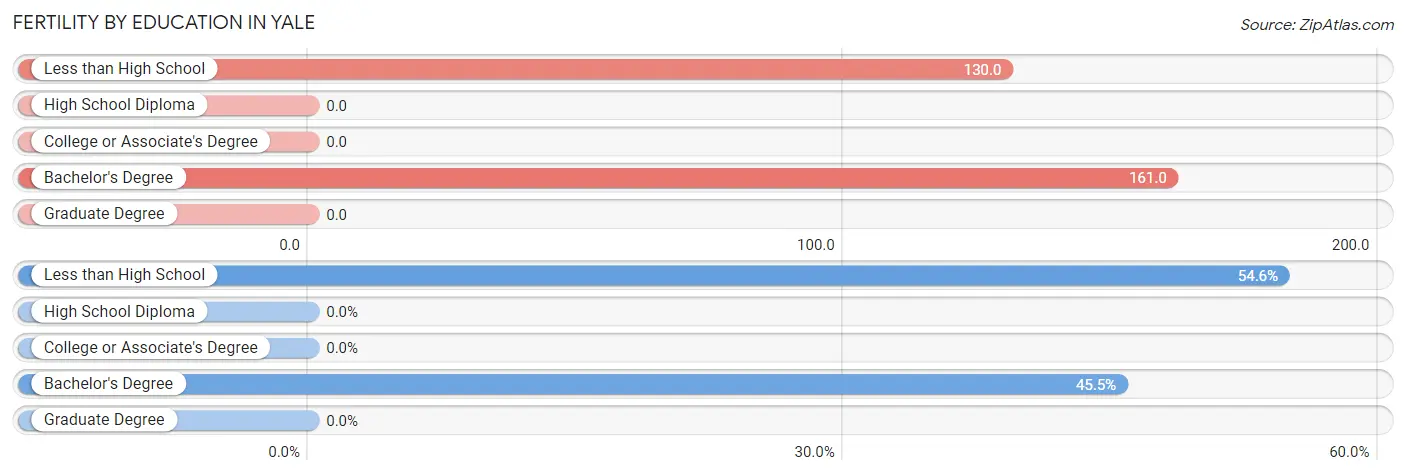
| Educational Attainment | Women with Births | Births / 1,000 Women |
| Less than High School | 6 (54.5%) | 130.0 |
| High School Diploma | 0 (0.0%) | 0.0 |
| College or Associate's Degree | 0 (0.0%) | 0.0 |
| Bachelor's Degree | 5 (45.5%) | 161.0 |
| Graduate Degree | 0 (0.0%) | 0.0 |
| Total | 11 (100.0%) | 37.0 |
Fertility by Education by Marriage Status in Yale
54.5% of women with births in Yale are unmarried. Women with the educational attainment of bachelor's degree are most likely to be married with 100.0% of them married at childbirth, while women with the educational attainment of less than high school are least likely to be married with 100.0% of them unmarried at childbirth.
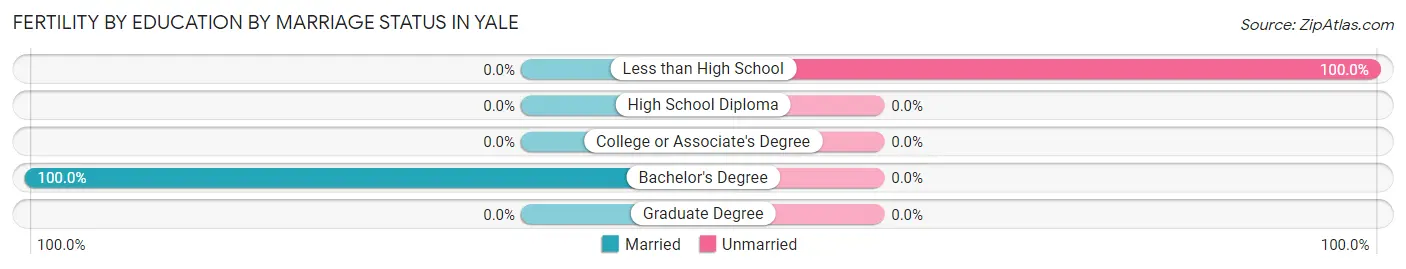
| Educational Attainment | Married | Unmarried |
| Less than High School | 0 (0.0%) | 6 (100.0%) |
| High School Diploma | 0 (0.0%) | 0 (0.0%) |
| College or Associate's Degree | 0 (0.0%) | 0 (0.0%) |
| Bachelor's Degree | 5 (100.0%) | 0 (0.0%) |
| Graduate Degree | 0 (0.0%) | 0 (0.0%) |
| Total | 5 (45.5%) | 6 (54.5%) |
Employment Characteristics in Yale
Employment by Class of Employer in Yale
Among the 419 employed individuals in Yale, private company employees (308 | 73.5%), local government employees (45 | 10.7%), and self-employed (not incorporated) (36 | 8.6%) make up the most common classes of employment.
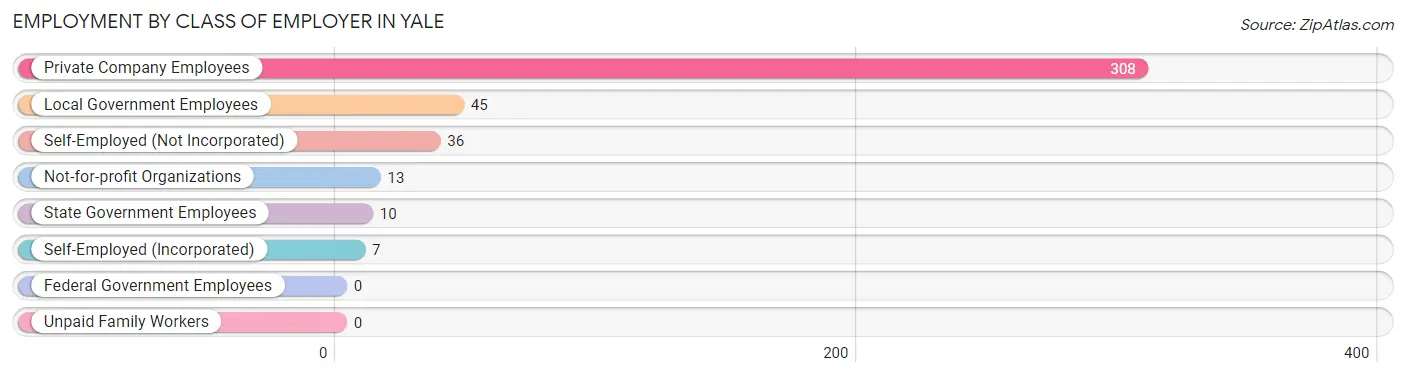
| Employer Class | # Employees | % Employees |
| Private Company Employees | 308 | 73.5% |
| Self-Employed (Incorporated) | 7 | 1.7% |
| Self-Employed (Not Incorporated) | 36 | 8.6% |
| Not-for-profit Organizations | 13 | 3.1% |
| Local Government Employees | 45 | 10.7% |
| State Government Employees | 10 | 2.4% |
| Federal Government Employees | 0 | 0.0% |
| Unpaid Family Workers | 0 | 0.0% |
| Total | 419 | 100.0% |
Employment Status by Age in Yale
According to the labor force statistics for Yale, out of the total population over 16 years of age (938), 48.7% or 457 individuals are in the labor force, with 7.7% or 35 of them unemployed. The age group with the highest labor force participation rate is 25 to 29 years, with 87.0% or 107 individuals in the labor force. Within the labor force, the 45 to 54 years age range has the highest percentage of unemployed individuals, with 18.6% or 11 of them being unemployed.
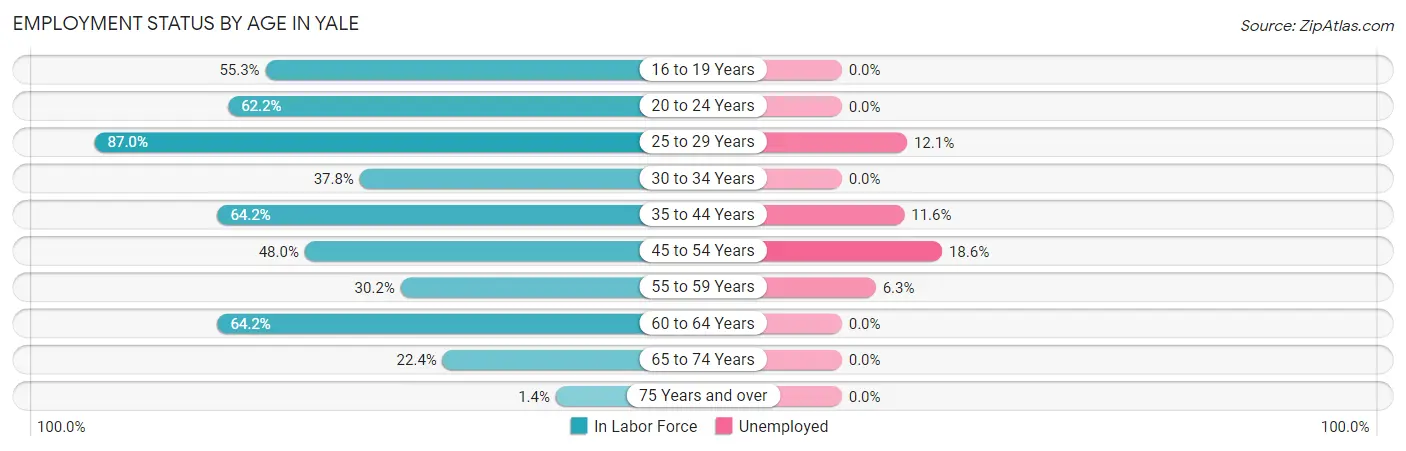
| Age Bracket | In Labor Force | Unemployed |
| 16 to 19 Years | 42 (55.3%) | 0 (0.0%) |
| 20 to 24 Years | 51 (62.2%) | 0 (0.0%) |
| 25 to 29 Years | 107 (87.0%) | 13 (12.1%) |
| 30 to 34 Years | 28 (37.8%) | 0 (0.0%) |
| 35 to 44 Years | 86 (64.2%) | 10 (11.6%) |
| 45 to 54 Years | 59 (48.0%) | 11 (18.6%) |
| 55 to 59 Years | 16 (30.2%) | 1 (6.3%) |
| 60 to 64 Years | 34 (64.2%) | 0 (0.0%) |
| 65 to 74 Years | 33 (22.4%) | 0 (0.0%) |
| 75 Years and over | 1 (1.4%) | 0 (0.0%) |
| Total | 457 (48.7%) | 35 (7.7%) |
Employment Status by Educational Attainment in Yale
According to labor force statistics for Yale, 58.9% of individuals (330) out of the total population between 25 and 64 years of age (560) are in the labor force, with 10.6% or 35 of them being unemployed. The group with the highest labor force participation rate are those with the educational attainment of college / associate degree, with 87.7% or 93 individuals in the labor force. Within the labor force, individuals with high school diploma education have the highest percentage of unemployment, with 18.3% or 26 of them being unemployed.
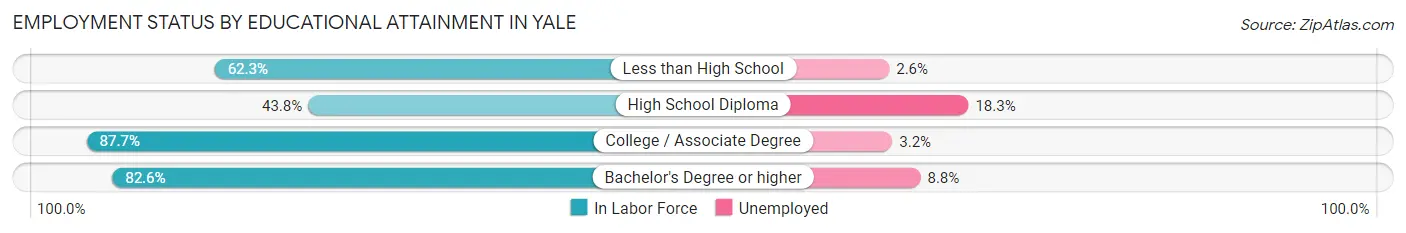
| Educational Attainment | In Labor Force | Unemployed |
| Less than High School | 38 (62.3%) | 2 (2.6%) |
| High School Diploma | 142 (43.8%) | 59 (18.3%) |
| College / Associate Degree | 93 (87.7%) | 3 (3.2%) |
| Bachelor's Degree or higher | 57 (82.6%) | 6 (8.8%) |
| Total | 330 (58.9%) | 59 (10.6%) |
Employment Occupations by Sex in Yale
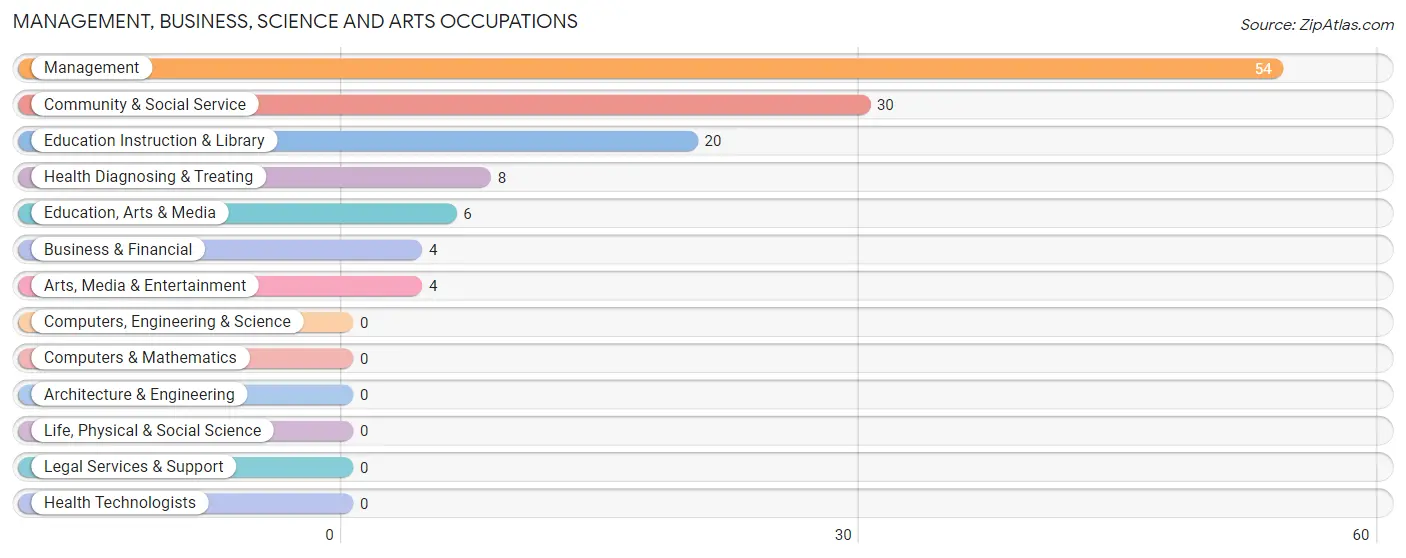
Management, Business, Science and Arts Occupations
The most common Management, Business, Science and Arts occupations in Yale are Management (54 | 12.8%), Community & Social Service (30 | 7.1%), Education Instruction & Library (20 | 4.7%), Health Diagnosing & Treating (8 | 1.9%), and Education, Arts & Media (6 | 1.4%).
Management, Business, Science and Arts Occupations by Sex
Within the Management, Business, Science and Arts occupations in Yale, the most male-oriented occupations are Management (87.0%), Education Instruction & Library (40.0%), and Community & Social Service (26.7%), while the most female-oriented occupations are Business & Financial (100.0%), Education, Arts & Media (100.0%), and Arts, Media & Entertainment (100.0%).
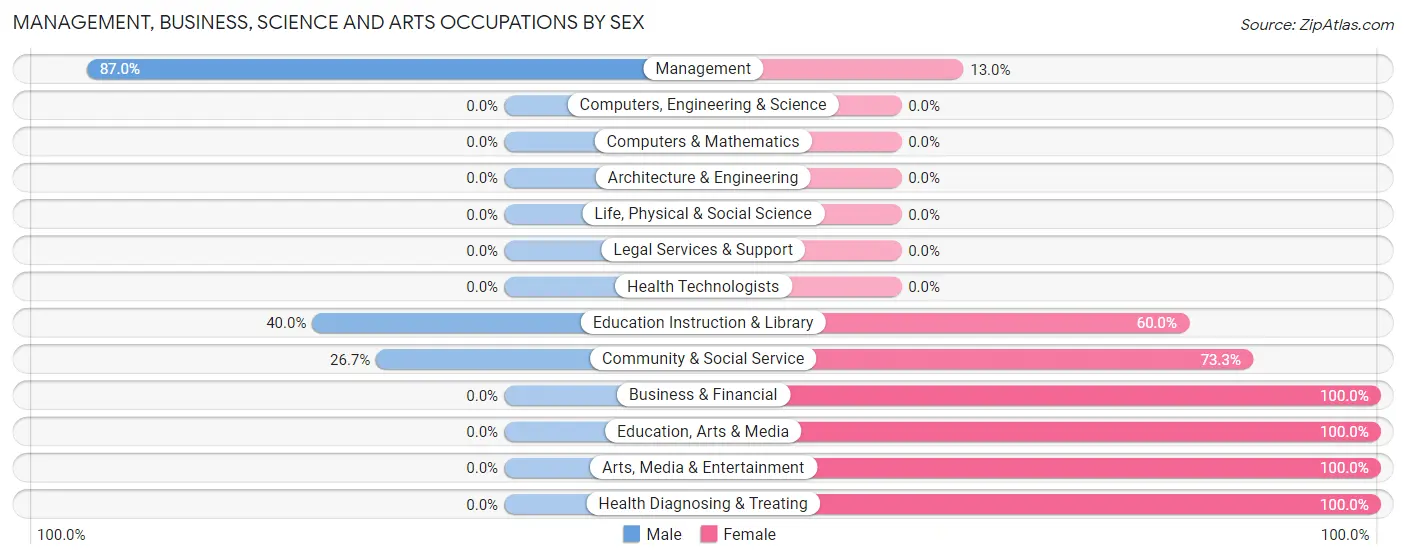
| Occupation | Male | Female |
| Management | 47 (87.0%) | 7 (13.0%) |
| Business & Financial | 0 (0.0%) | 4 (100.0%) |
| Computers, Engineering & Science | 0 (0.0%) | 0 (0.0%) |
| Computers & Mathematics | 0 (0.0%) | 0 (0.0%) |
| Architecture & Engineering | 0 (0.0%) | 0 (0.0%) |
| Life, Physical & Social Science | 0 (0.0%) | 0 (0.0%) |
| Community & Social Service | 8 (26.7%) | 22 (73.3%) |
| Education, Arts & Media | 0 (0.0%) | 6 (100.0%) |
| Legal Services & Support | 0 (0.0%) | 0 (0.0%) |
| Education Instruction & Library | 8 (40.0%) | 12 (60.0%) |
| Arts, Media & Entertainment | 0 (0.0%) | 4 (100.0%) |
| Health Diagnosing & Treating | 0 (0.0%) | 8 (100.0%) |
| Health Technologists | 0 (0.0%) | 0 (0.0%) |
| Total (Category) | 55 (57.3%) | 41 (42.7%) |
| Total (Overall) | 218 (51.7%) | 204 (48.3%) |
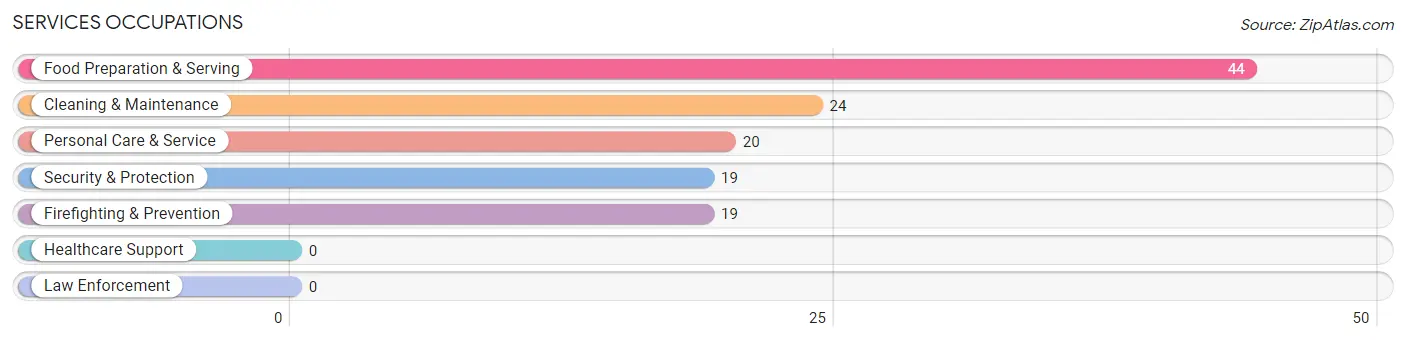
Services Occupations
The most common Services occupations in Yale are Food Preparation & Serving (44 | 10.4%), Cleaning & Maintenance (24 | 5.7%), Personal Care & Service (20 | 4.7%), Security & Protection (19 | 4.5%), and Firefighting & Prevention (19 | 4.5%).
Services Occupations by Sex
Within the Services occupations in Yale, the most male-oriented occupations are Security & Protection (100.0%), Firefighting & Prevention (100.0%), and Cleaning & Maintenance (50.0%), while the most female-oriented occupations are Personal Care & Service (100.0%), Food Preparation & Serving (72.7%), and Cleaning & Maintenance (50.0%).
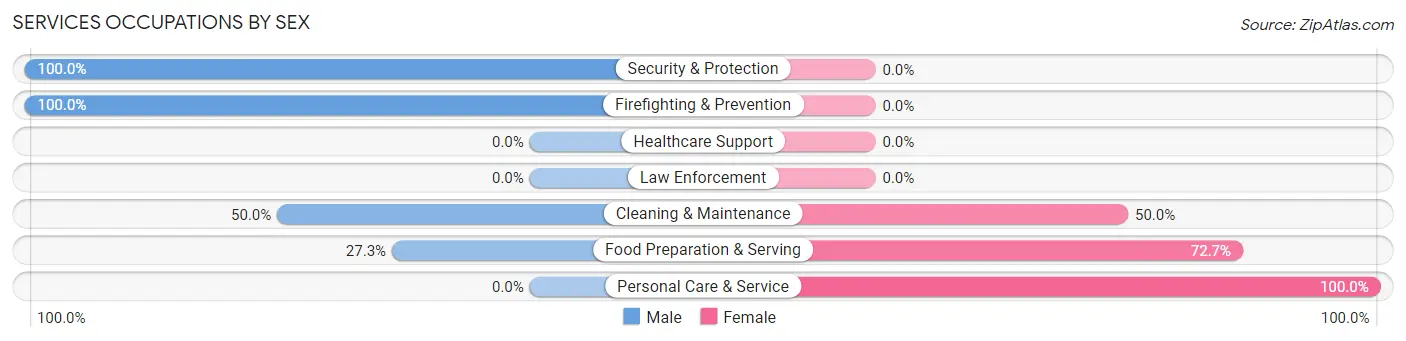
| Occupation | Male | Female |
| Healthcare Support | 0 (0.0%) | 0 (0.0%) |
| Security & Protection | 19 (100.0%) | 0 (0.0%) |
| Firefighting & Prevention | 19 (100.0%) | 0 (0.0%) |
| Law Enforcement | 0 (0.0%) | 0 (0.0%) |
| Food Preparation & Serving | 12 (27.3%) | 32 (72.7%) |
| Cleaning & Maintenance | 12 (50.0%) | 12 (50.0%) |
| Personal Care & Service | 0 (0.0%) | 20 (100.0%) |
| Total (Category) | 43 (40.2%) | 64 (59.8%) |
| Total (Overall) | 218 (51.7%) | 204 (48.3%) |
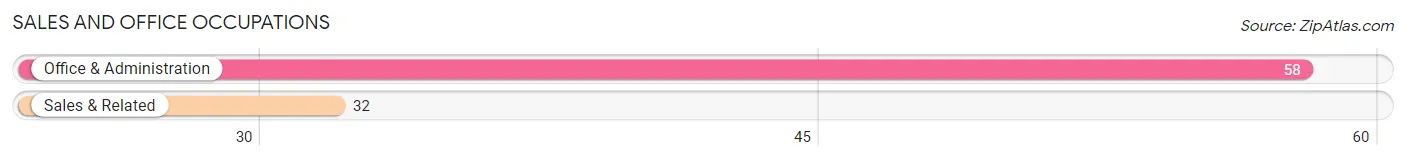
Sales and Office Occupations
The most common Sales and Office occupations in Yale are Office & Administration (58 | 13.7%), and Sales & Related (32 | 7.6%).
Sales and Office Occupations by Sex
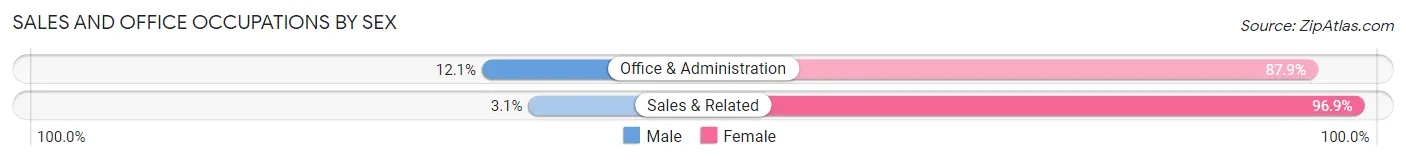
| Occupation | Male | Female |
| Sales & Related | 1 (3.1%) | 31 (96.9%) |
| Office & Administration | 7 (12.1%) | 51 (87.9%) |
| Total (Category) | 8 (8.9%) | 82 (91.1%) |
| Total (Overall) | 218 (51.7%) | 204 (48.3%) |
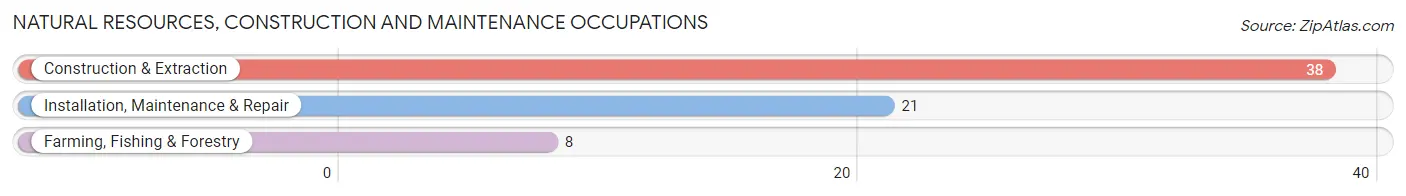
Natural Resources, Construction and Maintenance Occupations
The most common Natural Resources, Construction and Maintenance occupations in Yale are Construction & Extraction (38 | 9.0%), Installation, Maintenance & Repair (21 | 5.0%), and Farming, Fishing & Forestry (8 | 1.9%).
Natural Resources, Construction and Maintenance Occupations by Sex
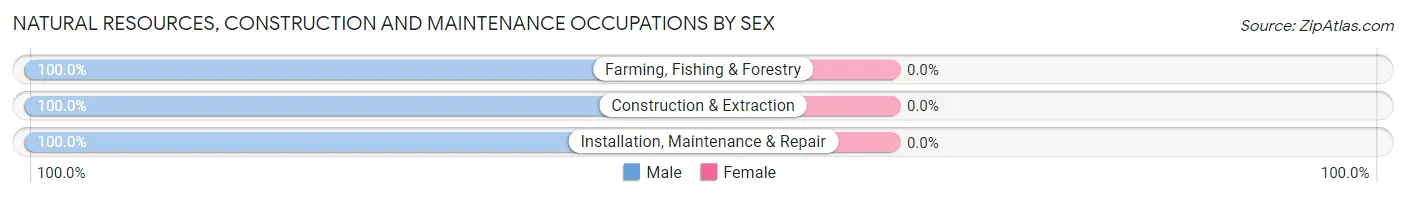
| Occupation | Male | Female |
| Farming, Fishing & Forestry | 8 (100.0%) | 0 (0.0%) |
| Construction & Extraction | 38 (100.0%) | 0 (0.0%) |
| Installation, Maintenance & Repair | 21 (100.0%) | 0 (0.0%) |
| Total (Category) | 67 (100.0%) | 0 (0.0%) |
| Total (Overall) | 218 (51.7%) | 204 (48.3%) |
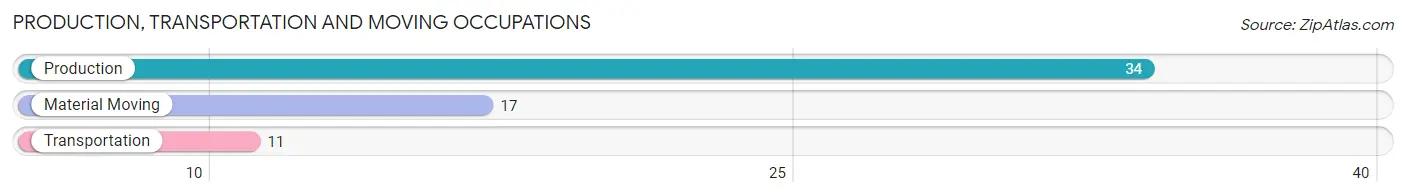
Production, Transportation and Moving Occupations
The most common Production, Transportation and Moving occupations in Yale are Production (34 | 8.1%), Material Moving (17 | 4.0%), and Transportation (11 | 2.6%).
Production, Transportation and Moving Occupations by Sex
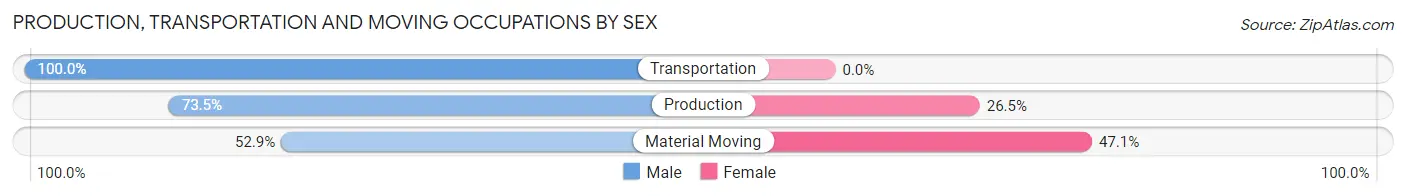
| Occupation | Male | Female |
| Production | 25 (73.5%) | 9 (26.5%) |
| Transportation | 11 (100.0%) | 0 (0.0%) |
| Material Moving | 9 (52.9%) | 8 (47.1%) |
| Total (Category) | 45 (72.6%) | 17 (27.4%) |
| Total (Overall) | 218 (51.7%) | 204 (48.3%) |
Employment Industries by Sex in Yale
Employment Industries in Yale
The major employment industries in Yale include Construction (86 | 20.4%), Accommodation & Food Services (59 | 14.0%), Retail Trade (34 | 8.1%), Educational Services (31 | 7.3%), and Administrative & Support (24 | 5.7%).
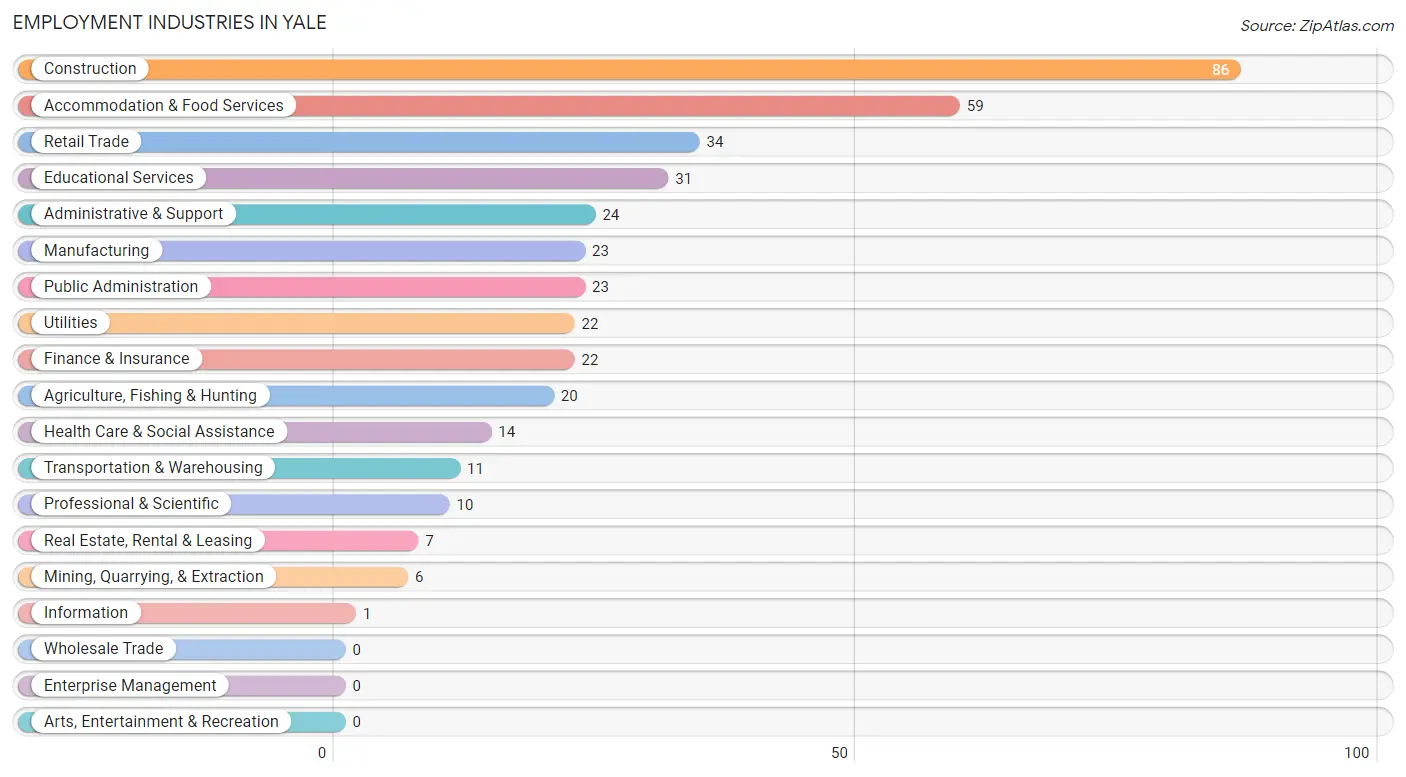
Employment Industries by Sex in Yale
The Yale industries that see more men than women are Agriculture, Fishing & Hunting (100.0%), Mining, Quarrying, & Extraction (100.0%), and Information (100.0%), whereas the industries that tend to have a higher number of women are Health Care & Social Assistance (100.0%), Retail Trade (82.4%), and Accommodation & Food Services (74.6%).
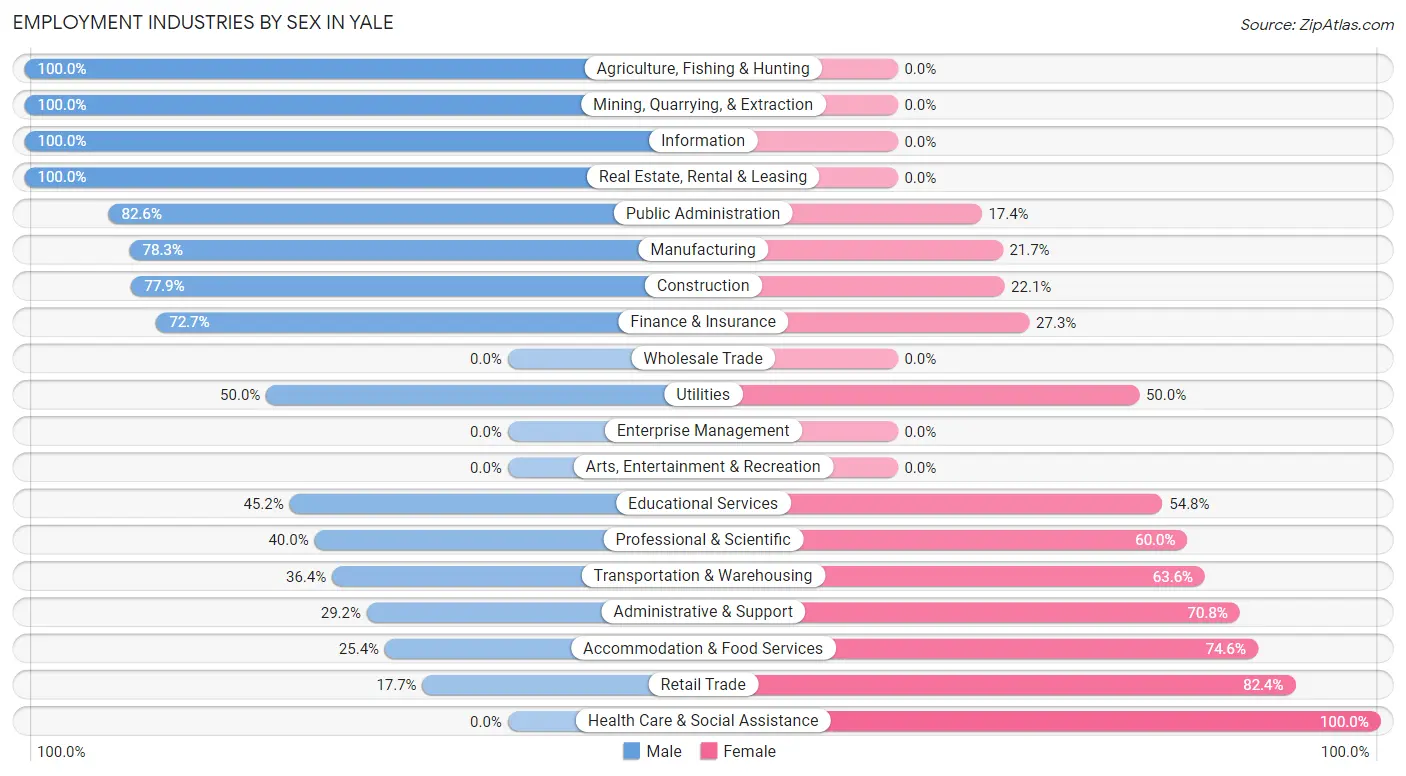
| Industry | Male | Female |
| Agriculture, Fishing & Hunting | 20 (100.0%) | 0 (0.0%) |
| Mining, Quarrying, & Extraction | 6 (100.0%) | 0 (0.0%) |
| Construction | 67 (77.9%) | 19 (22.1%) |
| Manufacturing | 18 (78.3%) | 5 (21.7%) |
| Wholesale Trade | 0 (0.0%) | 0 (0.0%) |
| Retail Trade | 6 (17.6%) | 28 (82.4%) |
| Transportation & Warehousing | 4 (36.4%) | 7 (63.6%) |
| Utilities | 11 (50.0%) | 11 (50.0%) |
| Information | 1 (100.0%) | 0 (0.0%) |
| Finance & Insurance | 16 (72.7%) | 6 (27.3%) |
| Real Estate, Rental & Leasing | 7 (100.0%) | 0 (0.0%) |
| Professional & Scientific | 4 (40.0%) | 6 (60.0%) |
| Enterprise Management | 0 (0.0%) | 0 (0.0%) |
| Administrative & Support | 7 (29.2%) | 17 (70.8%) |
| Educational Services | 14 (45.2%) | 17 (54.8%) |
| Health Care & Social Assistance | 0 (0.0%) | 14 (100.0%) |
| Arts, Entertainment & Recreation | 0 (0.0%) | 0 (0.0%) |
| Accommodation & Food Services | 15 (25.4%) | 44 (74.6%) |
| Public Administration | 19 (82.6%) | 4 (17.4%) |
| Total | 218 (51.7%) | 204 (48.3%) |
Education in Yale
School Enrollment in Yale
The most common levels of schooling among the 283 students in Yale are high school (76 | 26.9%), middle school (62 | 21.9%), and elementary school (50 | 17.7%).
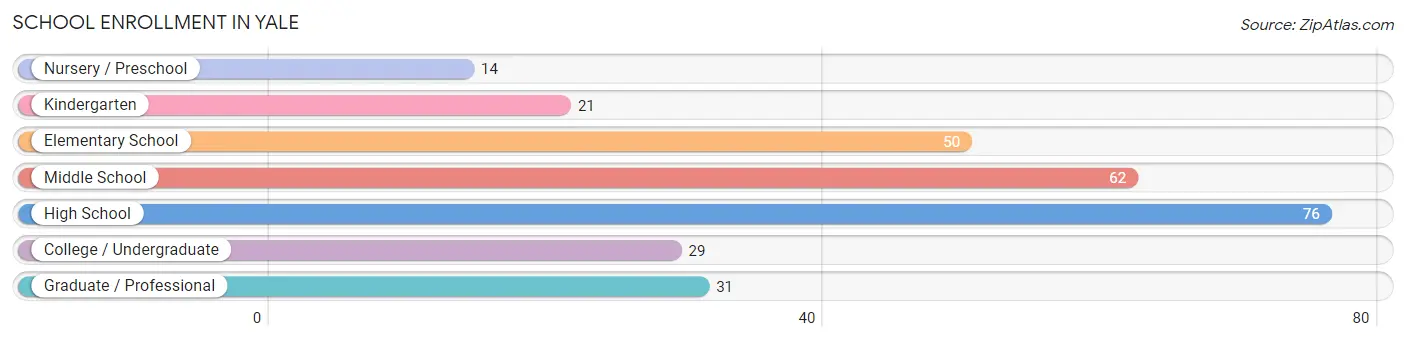
| School Level | # Students | % Students |
| Nursery / Preschool | 14 | 5.0% |
| Kindergarten | 21 | 7.4% |
| Elementary School | 50 | 17.7% |
| Middle School | 62 | 21.9% |
| High School | 76 | 26.9% |
| College / Undergraduate | 29 | 10.2% |
| Graduate / Professional | 31 | 11.0% |
| Total | 283 | 100.0% |
School Enrollment by Age by Funding Source in Yale
Out of a total of 283 students who are enrolled in schools in Yale, 43 (15.2%) attend a private institution, while the remaining 240 (84.8%) are enrolled in public schools. The age group of 35 years and over has the highest likelihood of being enrolled in private schools, with 4 (40.0% in the age bracket) enrolled. Conversely, the age group of 10 to 14 year olds has the lowest likelihood of being enrolled in a private school, with 71 (100.0% in the age bracket) attending a public institution.
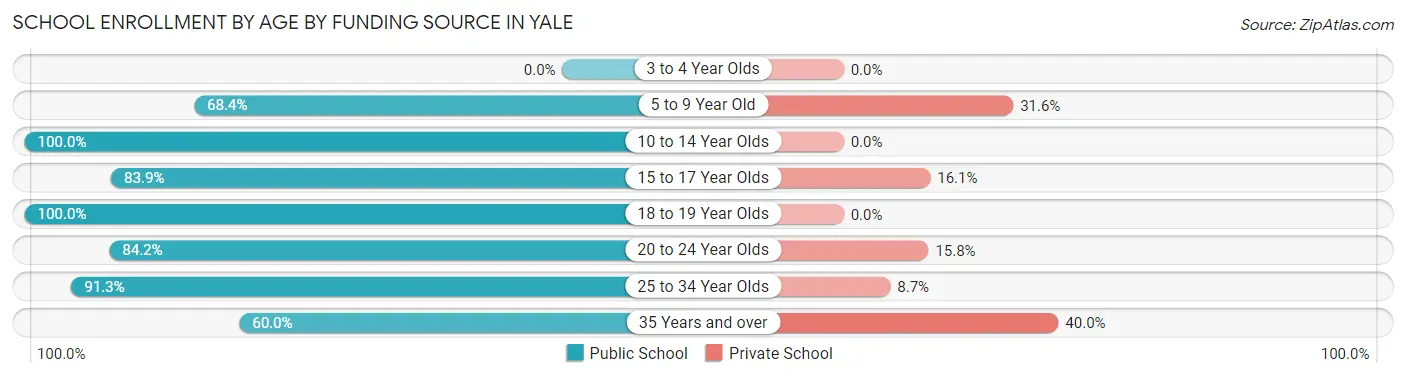
| Age Bracket | Public School | Private School |
| 3 to 4 Year Olds | 0 (0.0%) | 0 (0.0%) |
| 5 to 9 Year Old | 52 (68.4%) | 24 (31.6%) |
| 10 to 14 Year Olds | 71 (100.0%) | 0 (0.0%) |
| 15 to 17 Year Olds | 52 (83.9%) | 10 (16.1%) |
| 18 to 19 Year Olds | 22 (100.0%) | 0 (0.0%) |
| 20 to 24 Year Olds | 16 (84.2%) | 3 (15.8%) |
| 25 to 34 Year Olds | 21 (91.3%) | 2 (8.7%) |
| 35 Years and over | 6 (60.0%) | 4 (40.0%) |
| Total | 240 (84.8%) | 43 (15.2%) |
Educational Attainment by Field of Study in Yale
Business (52 | 41.3%), education (21 | 16.7%), bio, nature & agricultural (18 | 14.3%), psychology (15 | 11.9%), and physical & health sciences (6 | 4.8%) are the most common fields of study among 126 individuals in Yale who have obtained a bachelor's degree or higher.
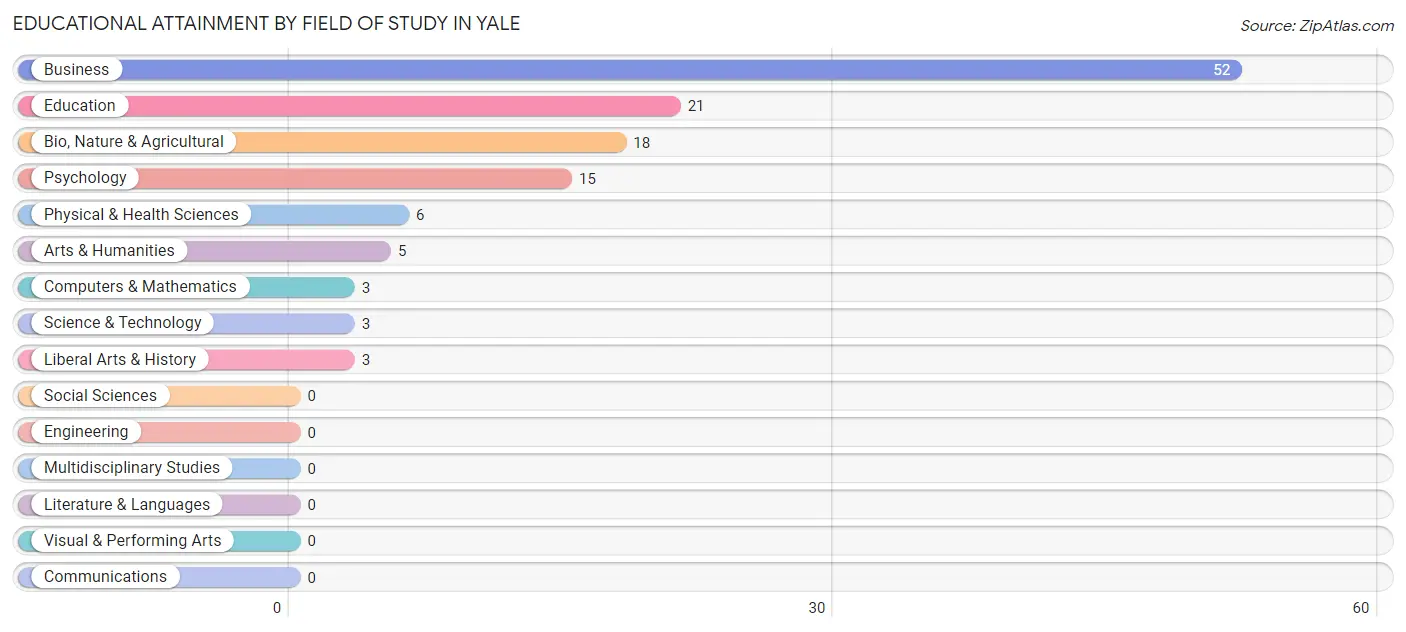
| Field of Study | # Graduates | % Graduates |
| Computers & Mathematics | 3 | 2.4% |
| Bio, Nature & Agricultural | 18 | 14.3% |
| Physical & Health Sciences | 6 | 4.8% |
| Psychology | 15 | 11.9% |
| Social Sciences | 0 | 0.0% |
| Engineering | 0 | 0.0% |
| Multidisciplinary Studies | 0 | 0.0% |
| Science & Technology | 3 | 2.4% |
| Business | 52 | 41.3% |
| Education | 21 | 16.7% |
| Literature & Languages | 0 | 0.0% |
| Liberal Arts & History | 3 | 2.4% |
| Visual & Performing Arts | 0 | 0.0% |
| Communications | 0 | 0.0% |
| Arts & Humanities | 5 | 4.0% |
| Total | 126 | 100.0% |
Transportation & Commute in Yale
Vehicle Availability by Sex in Yale
The most prevalent vehicle ownership categories in Yale are males with 2 vehicles (136, accounting for 62.4%) and females with 2 vehicles (66, making up 67.7%).
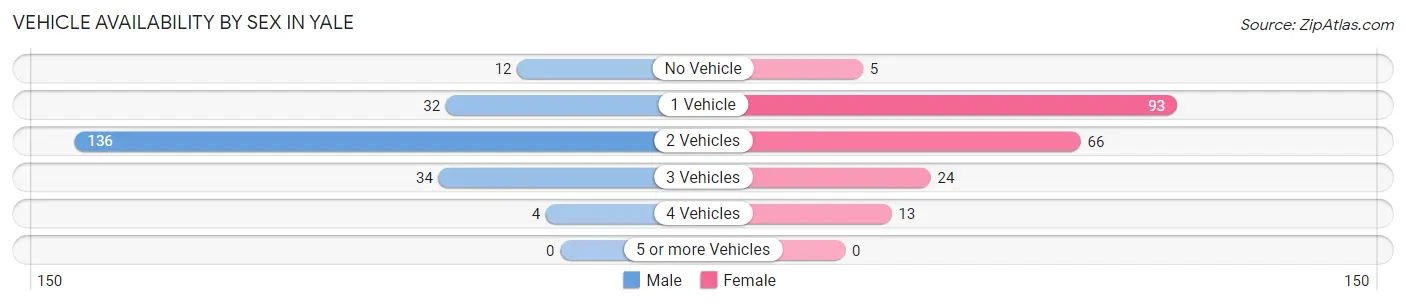
| Vehicles Available | Male | Female |
| No Vehicle | 12 (5.5%) | 5 (2.5%) |
| 1 Vehicle | 32 (14.7%) | 93 (46.3%) |
| 2 Vehicles | 136 (62.4%) | 66 (32.8%) |
| 3 Vehicles | 34 (15.6%) | 24 (11.9%) |
| 4 Vehicles | 4 (1.8%) | 13 (6.5%) |
| 5 or more Vehicles | 0 (0.0%) | 0 (0.0%) |
| Total | 218 (100.0%) | 201 (100.0%) |
Commute Time in Yale
The most frequently occuring commute durations in Yale are less than 5 minutes (83 commuters, 20.9%), 30 to 34 minutes (58 commuters, 14.6%), and 5 to 9 minutes (55 commuters, 13.9%).
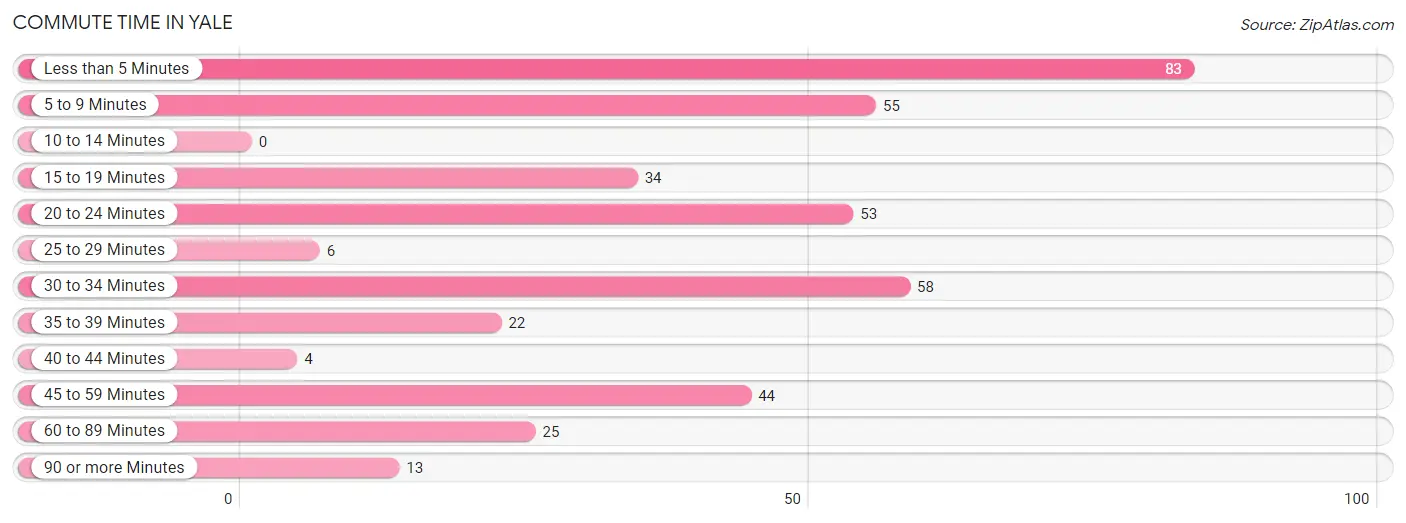
| Commute Time | # Commuters | % Commuters |
| Less than 5 Minutes | 83 | 20.9% |
| 5 to 9 Minutes | 55 | 13.9% |
| 10 to 14 Minutes | 0 | 0.0% |
| 15 to 19 Minutes | 34 | 8.6% |
| 20 to 24 Minutes | 53 | 13.4% |
| 25 to 29 Minutes | 6 | 1.5% |
| 30 to 34 Minutes | 58 | 14.6% |
| 35 to 39 Minutes | 22 | 5.5% |
| 40 to 44 Minutes | 4 | 1.0% |
| 45 to 59 Minutes | 44 | 11.1% |
| 60 to 89 Minutes | 25 | 6.3% |
| 90 or more Minutes | 13 | 3.3% |
Commute Time by Sex in Yale
The most common commute times in Yale are 45 to 59 minutes (39 commuters, 18.4%) for males and less than 5 minutes (54 commuters, 29.2%) for females.
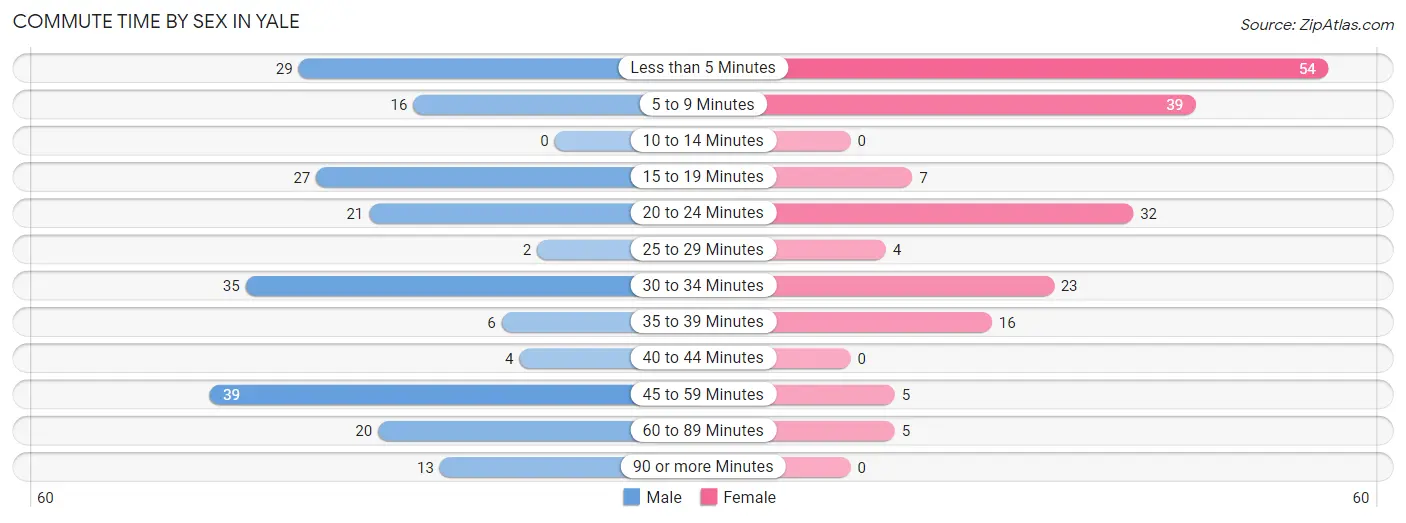
| Commute Time | Male | Female |
| Less than 5 Minutes | 29 (13.7%) | 54 (29.2%) |
| 5 to 9 Minutes | 16 (7.5%) | 39 (21.1%) |
| 10 to 14 Minutes | 0 (0.0%) | 0 (0.0%) |
| 15 to 19 Minutes | 27 (12.7%) | 7 (3.8%) |
| 20 to 24 Minutes | 21 (9.9%) | 32 (17.3%) |
| 25 to 29 Minutes | 2 (0.9%) | 4 (2.2%) |
| 30 to 34 Minutes | 35 (16.5%) | 23 (12.4%) |
| 35 to 39 Minutes | 6 (2.8%) | 16 (8.6%) |
| 40 to 44 Minutes | 4 (1.9%) | 0 (0.0%) |
| 45 to 59 Minutes | 39 (18.4%) | 5 (2.7%) |
| 60 to 89 Minutes | 20 (9.4%) | 5 (2.7%) |
| 90 or more Minutes | 13 (6.1%) | 0 (0.0%) |
Time of Departure to Work by Sex in Yale
The most frequent times of departure to work in Yale are 6:00 AM to 6:29 AM (61, 28.8%) for males and 7:00 AM to 7:29 AM (39, 21.1%) for females.
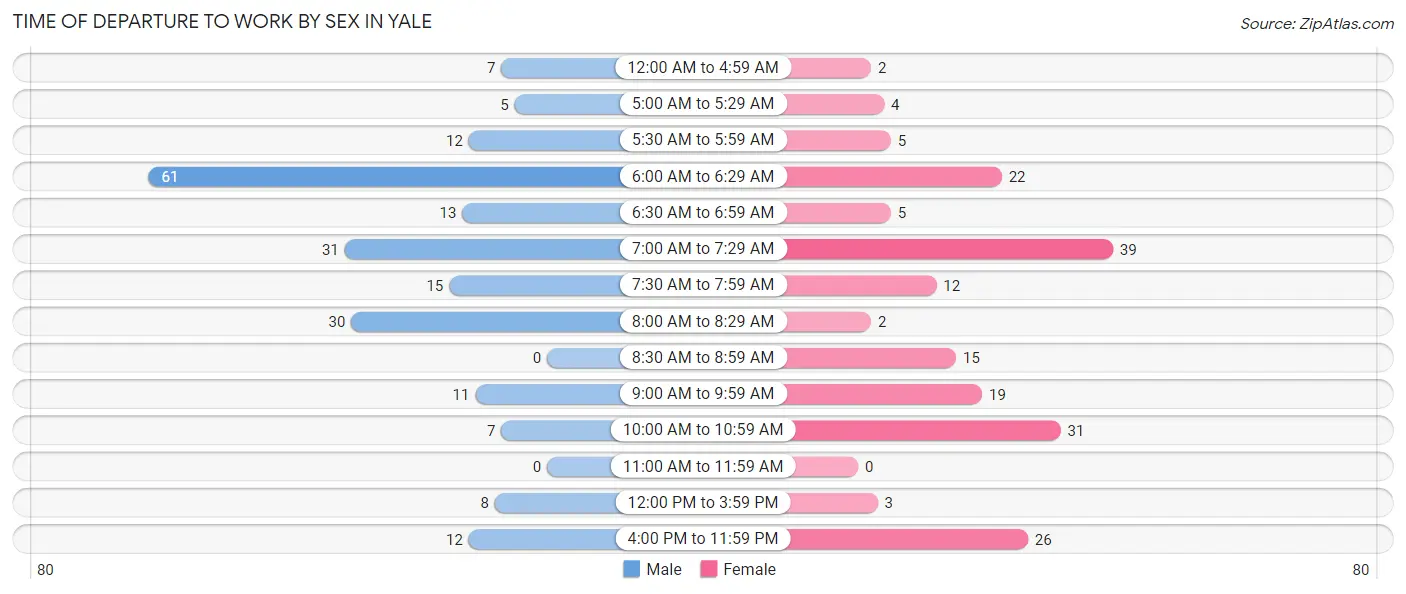
| Time of Departure | Male | Female |
| 12:00 AM to 4:59 AM | 7 (3.3%) | 2 (1.1%) |
| 5:00 AM to 5:29 AM | 5 (2.4%) | 4 (2.2%) |
| 5:30 AM to 5:59 AM | 12 (5.7%) | 5 (2.7%) |
| 6:00 AM to 6:29 AM | 61 (28.8%) | 22 (11.9%) |
| 6:30 AM to 6:59 AM | 13 (6.1%) | 5 (2.7%) |
| 7:00 AM to 7:29 AM | 31 (14.6%) | 39 (21.1%) |
| 7:30 AM to 7:59 AM | 15 (7.1%) | 12 (6.5%) |
| 8:00 AM to 8:29 AM | 30 (14.1%) | 2 (1.1%) |
| 8:30 AM to 8:59 AM | 0 (0.0%) | 15 (8.1%) |
| 9:00 AM to 9:59 AM | 11 (5.2%) | 19 (10.3%) |
| 10:00 AM to 10:59 AM | 7 (3.3%) | 31 (16.8%) |
| 11:00 AM to 11:59 AM | 0 (0.0%) | 0 (0.0%) |
| 12:00 PM to 3:59 PM | 8 (3.8%) | 3 (1.6%) |
| 4:00 PM to 11:59 PM | 12 (5.7%) | 26 (14.1%) |
| Total | 212 (100.0%) | 185 (100.0%) |
Housing Occupancy in Yale
Occupancy by Ownership in Yale
Of the total 494 dwellings in Yale, owner-occupied units account for 313 (63.4%), while renter-occupied units make up 181 (36.6%).
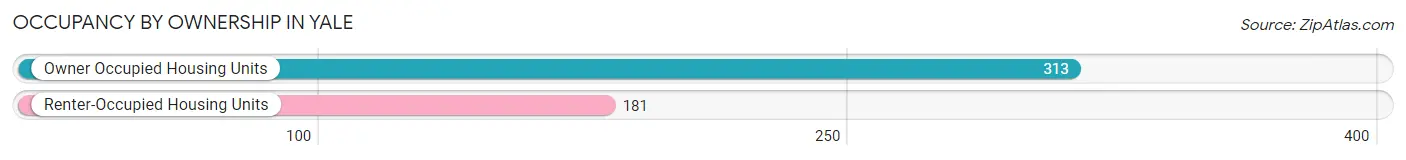
| Occupancy | # Housing Units | % Housing Units |
| Owner Occupied Housing Units | 313 | 63.4% |
| Renter-Occupied Housing Units | 181 | 36.6% |
| Total Occupied Housing Units | 494 | 100.0% |
Occupancy by Household Size in Yale
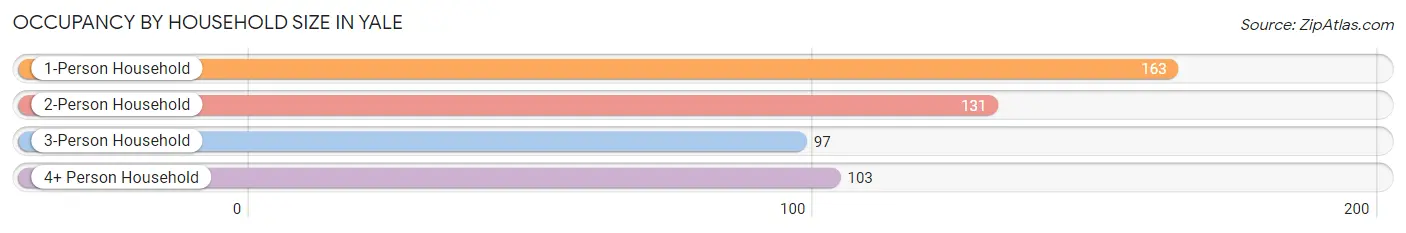
| Household Size | # Housing Units | % Housing Units |
| 1-Person Household | 163 | 33.0% |
| 2-Person Household | 131 | 26.5% |
| 3-Person Household | 97 | 19.6% |
| 4+ Person Household | 103 | 20.8% |
| Total Housing Units | 494 | 100.0% |
Occupancy by Ownership by Household Size in Yale
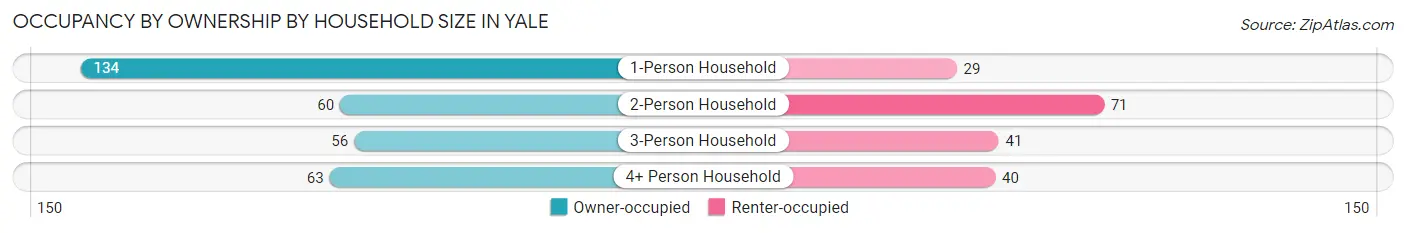
| Household Size | Owner-occupied | Renter-occupied |
| 1-Person Household | 134 (82.2%) | 29 (17.8%) |
| 2-Person Household | 60 (45.8%) | 71 (54.2%) |
| 3-Person Household | 56 (57.7%) | 41 (42.3%) |
| 4+ Person Household | 63 (61.2%) | 40 (38.8%) |
| Total Housing Units | 313 (63.4%) | 181 (36.6%) |
Occupancy by Educational Attainment in Yale
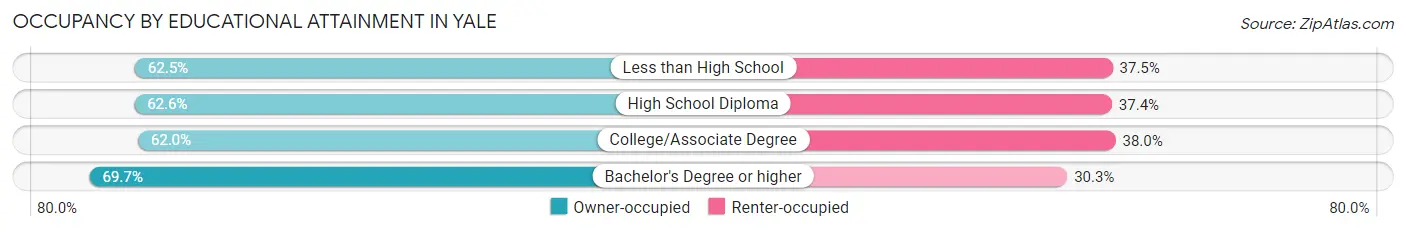
| Household Size | Owner-occupied | Renter-occupied |
| Less than High School | 30 (62.5%) | 18 (37.5%) |
| High School Diploma | 139 (62.6%) | 83 (37.4%) |
| College/Associate Degree | 98 (62.0%) | 60 (38.0%) |
| Bachelor's Degree or higher | 46 (69.7%) | 20 (30.3%) |
Occupancy by Age of Householder in Yale
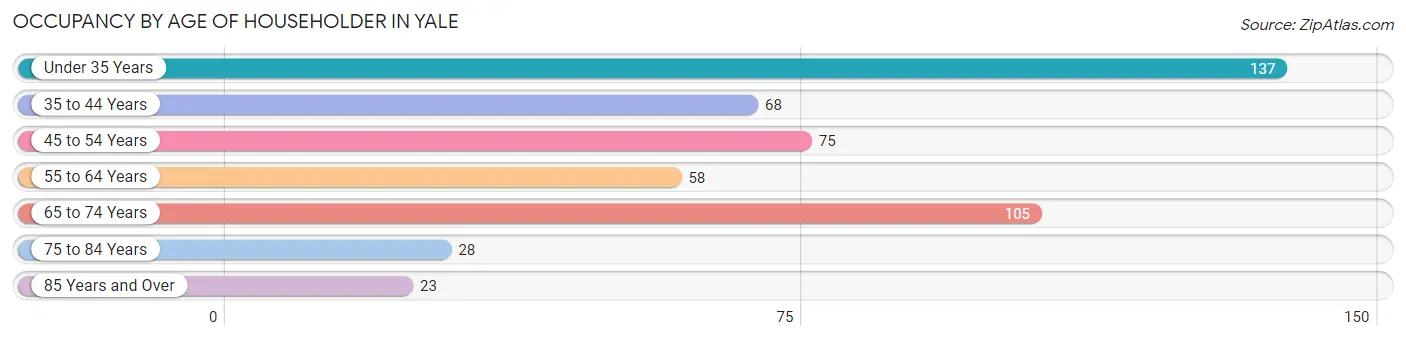
| Age Bracket | # Households | % Households |
| Under 35 Years | 137 | 27.7% |
| 35 to 44 Years | 68 | 13.8% |
| 45 to 54 Years | 75 | 15.2% |
| 55 to 64 Years | 58 | 11.7% |
| 65 to 74 Years | 105 | 21.3% |
| 75 to 84 Years | 28 | 5.7% |
| 85 Years and Over | 23 | 4.7% |
| Total | 494 | 100.0% |
Housing Finances in Yale
Median Income by Occupancy in Yale
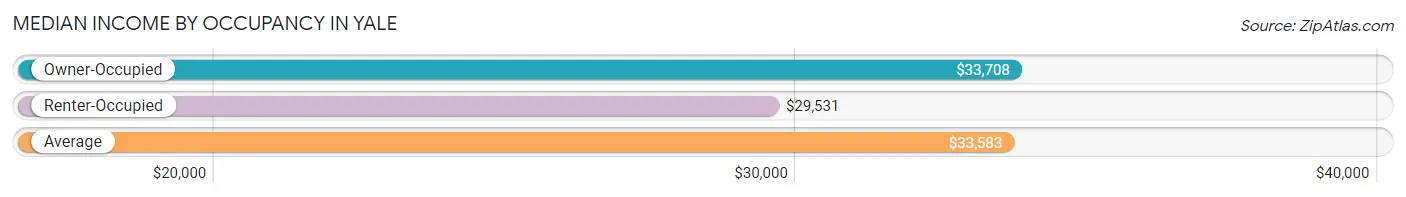
| Occupancy Type | # Households | Median Income |
| Owner-Occupied | 313 (63.4%) | $33,708 |
| Renter-Occupied | 181 (36.6%) | $29,531 |
| Average | 494 (100.0%) | $33,583 |
Occupancy by Householder Income Bracket in Yale
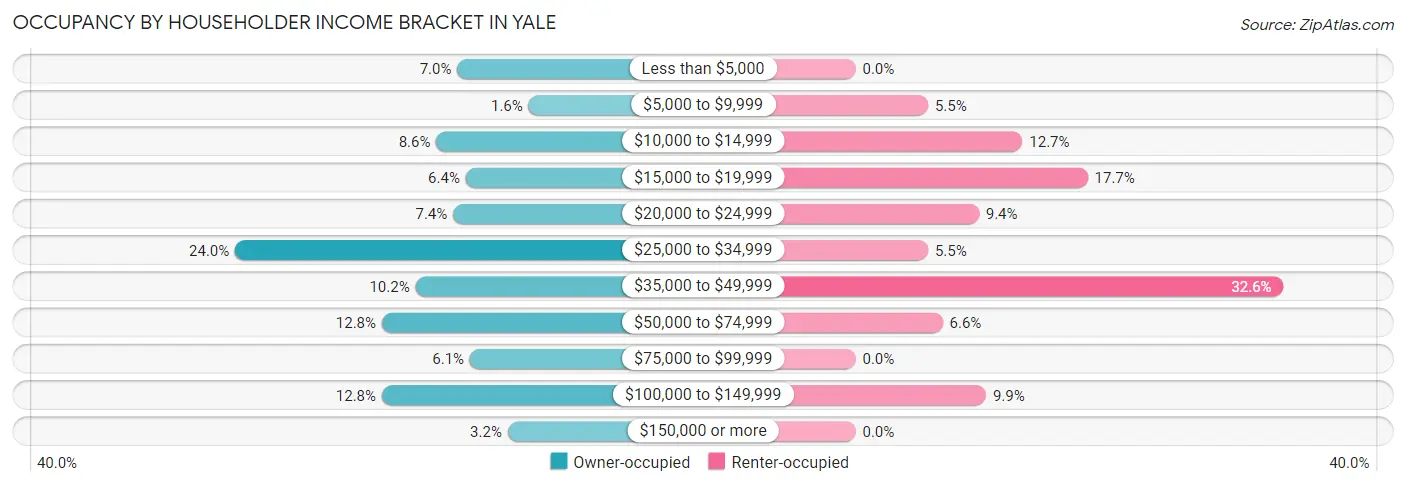
| Income Bracket | Owner-occupied | Renter-occupied |
| Less than $5,000 | 22 (7.0%) | 0 (0.0%) |
| $5,000 to $9,999 | 5 (1.6%) | 10 (5.5%) |
| $10,000 to $14,999 | 27 (8.6%) | 23 (12.7%) |
| $15,000 to $19,999 | 20 (6.4%) | 32 (17.7%) |
| $20,000 to $24,999 | 23 (7.3%) | 17 (9.4%) |
| $25,000 to $34,999 | 75 (24.0%) | 10 (5.5%) |
| $35,000 to $49,999 | 32 (10.2%) | 59 (32.6%) |
| $50,000 to $74,999 | 40 (12.8%) | 12 (6.6%) |
| $75,000 to $99,999 | 19 (6.1%) | 0 (0.0%) |
| $100,000 to $149,999 | 40 (12.8%) | 18 (9.9%) |
| $150,000 or more | 10 (3.2%) | 0 (0.0%) |
| Total | 313 (100.0%) | 181 (100.0%) |
Monthly Housing Cost Tiers in Yale
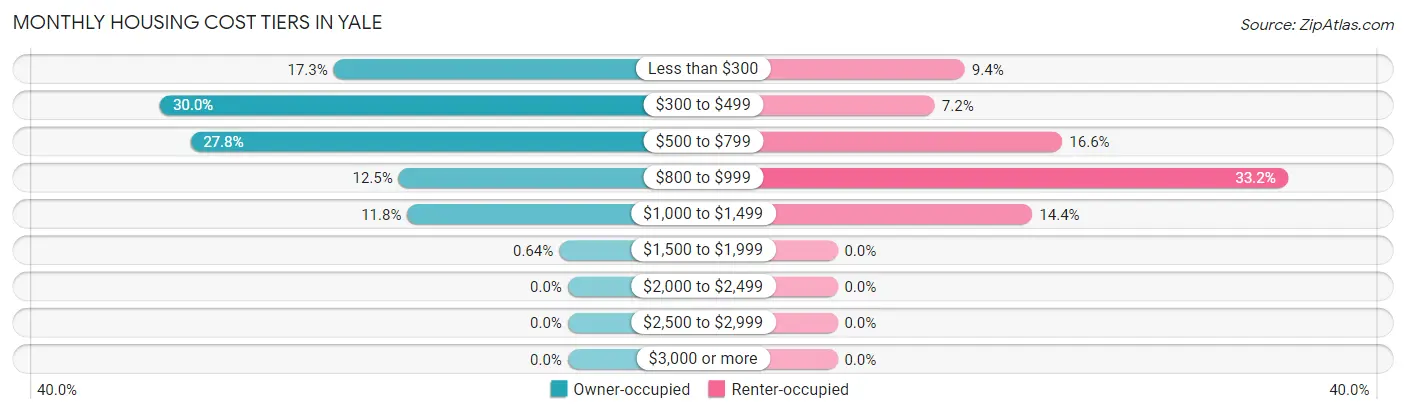
| Monthly Cost | Owner-occupied | Renter-occupied |
| Less than $300 | 54 (17.2%) | 17 (9.4%) |
| $300 to $499 | 94 (30.0%) | 13 (7.2%) |
| $500 to $799 | 87 (27.8%) | 30 (16.6%) |
| $800 to $999 | 39 (12.5%) | 60 (33.2%) |
| $1,000 to $1,499 | 37 (11.8%) | 26 (14.4%) |
| $1,500 to $1,999 | 2 (0.6%) | 0 (0.0%) |
| $2,000 to $2,499 | 0 (0.0%) | 0 (0.0%) |
| $2,500 to $2,999 | 0 (0.0%) | 0 (0.0%) |
| $3,000 or more | 0 (0.0%) | 0 (0.0%) |
| Total | 313 (100.0%) | 181 (100.0%) |
Physical Housing Characteristics in Yale
Housing Structures in Yale
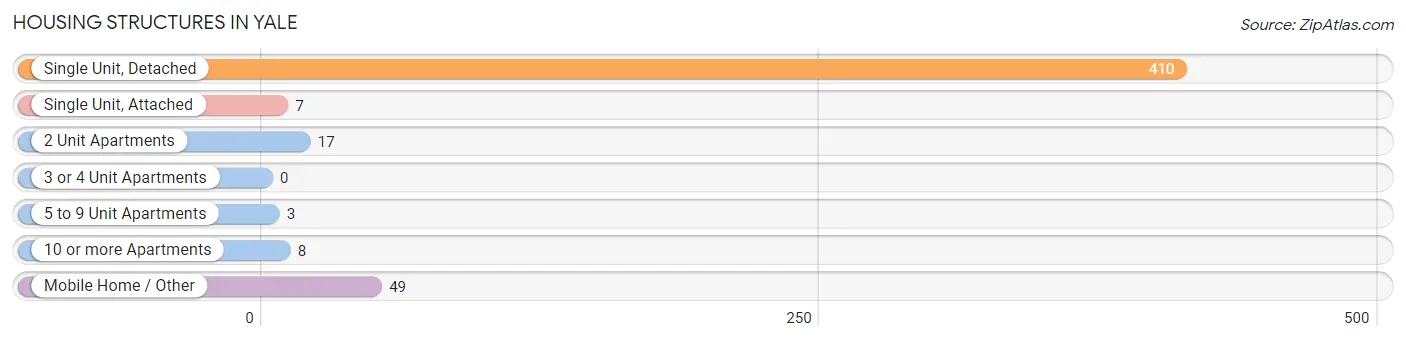
| Structure Type | # Housing Units | % Housing Units |
| Single Unit, Detached | 410 | 83.0% |
| Single Unit, Attached | 7 | 1.4% |
| 2 Unit Apartments | 17 | 3.4% |
| 3 or 4 Unit Apartments | 0 | 0.0% |
| 5 to 9 Unit Apartments | 3 | 0.6% |
| 10 or more Apartments | 8 | 1.6% |
| Mobile Home / Other | 49 | 9.9% |
| Total | 494 | 100.0% |
Housing Structures by Occupancy in Yale
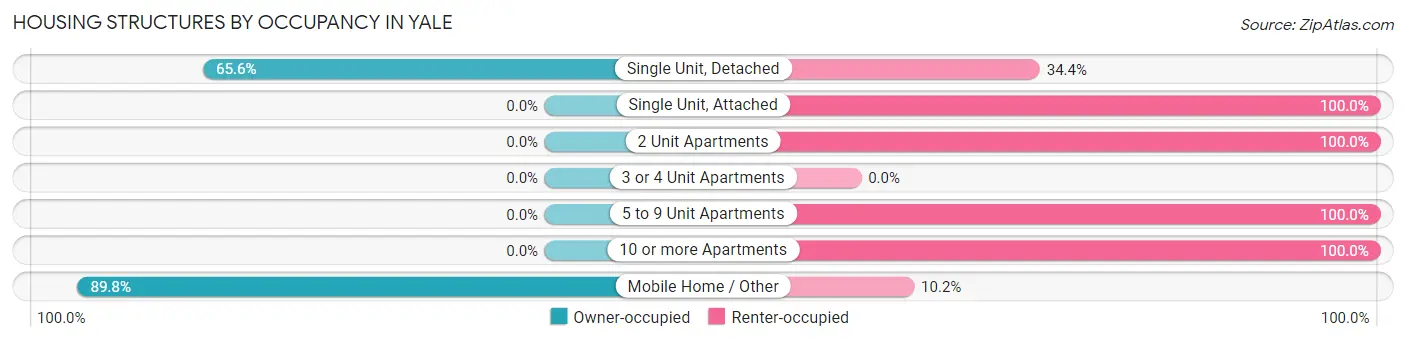
| Structure Type | Owner-occupied | Renter-occupied |
| Single Unit, Detached | 269 (65.6%) | 141 (34.4%) |
| Single Unit, Attached | 0 (0.0%) | 7 (100.0%) |
| 2 Unit Apartments | 0 (0.0%) | 17 (100.0%) |
| 3 or 4 Unit Apartments | 0 (0.0%) | 0 (0.0%) |
| 5 to 9 Unit Apartments | 0 (0.0%) | 3 (100.0%) |
| 10 or more Apartments | 0 (0.0%) | 8 (100.0%) |
| Mobile Home / Other | 44 (89.8%) | 5 (10.2%) |
| Total | 313 (63.4%) | 181 (36.6%) |
Housing Structures by Number of Rooms in Yale
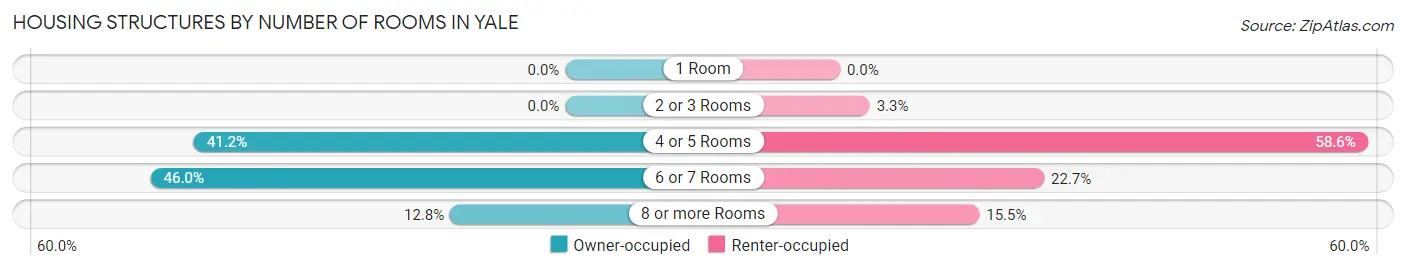
| Number of Rooms | Owner-occupied | Renter-occupied |
| 1 Room | 0 (0.0%) | 0 (0.0%) |
| 2 or 3 Rooms | 0 (0.0%) | 6 (3.3%) |
| 4 or 5 Rooms | 129 (41.2%) | 106 (58.6%) |
| 6 or 7 Rooms | 144 (46.0%) | 41 (22.7%) |
| 8 or more Rooms | 40 (12.8%) | 28 (15.5%) |
| Total | 313 (100.0%) | 181 (100.0%) |
Housing Structure by Heating Type in Yale
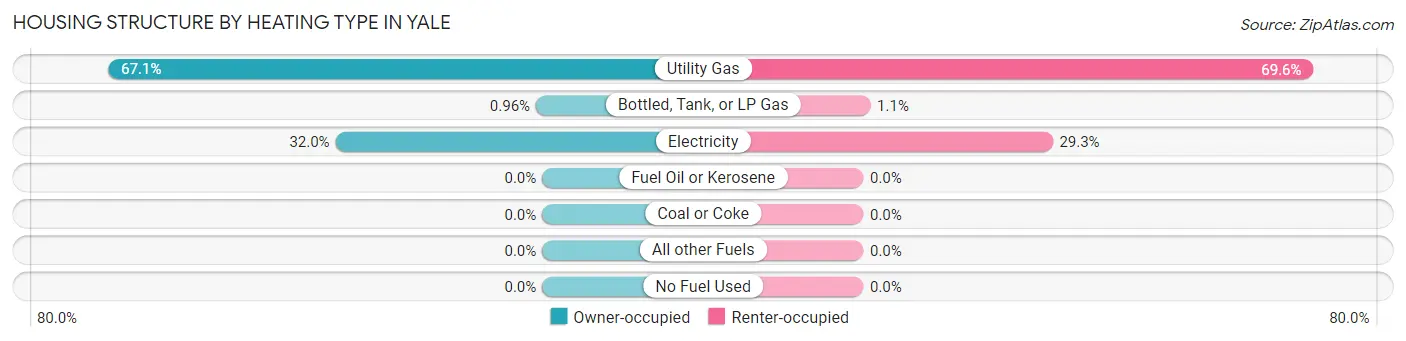
| Heating Type | Owner-occupied | Renter-occupied |
| Utility Gas | 210 (67.1%) | 126 (69.6%) |
| Bottled, Tank, or LP Gas | 3 (1.0%) | 2 (1.1%) |
| Electricity | 100 (32.0%) | 53 (29.3%) |
| Fuel Oil or Kerosene | 0 (0.0%) | 0 (0.0%) |
| Coal or Coke | 0 (0.0%) | 0 (0.0%) |
| All other Fuels | 0 (0.0%) | 0 (0.0%) |
| No Fuel Used | 0 (0.0%) | 0 (0.0%) |
| Total | 313 (100.0%) | 181 (100.0%) |
Household Vehicle Usage in Yale
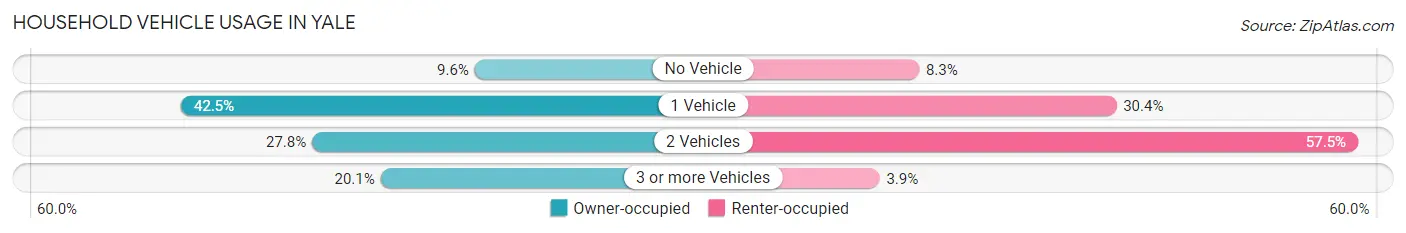
| Vehicles per Household | Owner-occupied | Renter-occupied |
| No Vehicle | 30 (9.6%) | 15 (8.3%) |
| 1 Vehicle | 133 (42.5%) | 55 (30.4%) |
| 2 Vehicles | 87 (27.8%) | 104 (57.5%) |
| 3 or more Vehicles | 63 (20.1%) | 7 (3.9%) |
| Total | 313 (100.0%) | 181 (100.0%) |
Real Estate & Mortgages in Yale
Real Estate and Mortgage Overview in Yale
| Characteristic | Without Mortgage | With Mortgage |
| Housing Units | 215 | 98 |
| Median Property Value | $65,800 | $97,300 |
| Median Household Income | $33,875 | $0 |
| Monthly Housing Costs | $380 | $0 |
| Real Estate Taxes | $639 | $12 |
Property Value by Mortgage Status in Yale
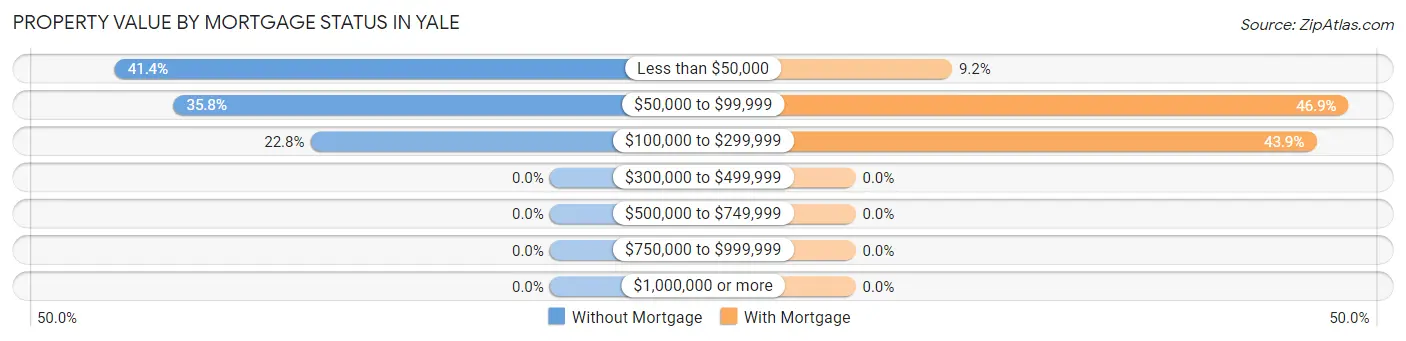
| Property Value | Without Mortgage | With Mortgage |
| Less than $50,000 | 89 (41.4%) | 9 (9.2%) |
| $50,000 to $99,999 | 77 (35.8%) | 46 (46.9%) |
| $100,000 to $299,999 | 49 (22.8%) | 43 (43.9%) |
| $300,000 to $499,999 | 0 (0.0%) | 0 (0.0%) |
| $500,000 to $749,999 | 0 (0.0%) | 0 (0.0%) |
| $750,000 to $999,999 | 0 (0.0%) | 0 (0.0%) |
| $1,000,000 or more | 0 (0.0%) | 0 (0.0%) |
| Total | 215 (100.0%) | 98 (100.0%) |
Household Income by Mortgage Status in Yale
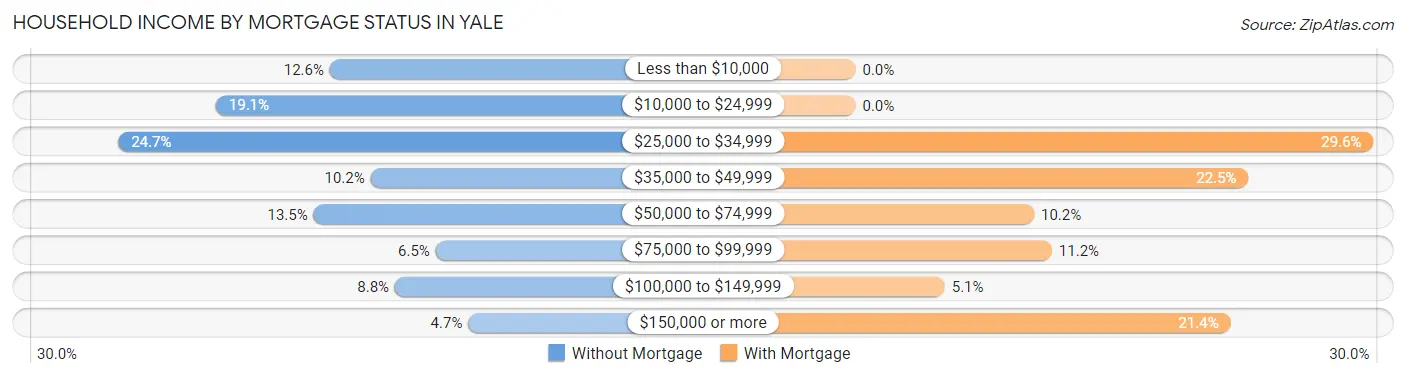
| Household Income | Without Mortgage | With Mortgage |
| Less than $10,000 | 27 (12.6%) | 0 (0.0%) |
| $10,000 to $24,999 | 41 (19.1%) | 0 (0.0%) |
| $25,000 to $34,999 | 53 (24.6%) | 29 (29.6%) |
| $35,000 to $49,999 | 22 (10.2%) | 22 (22.5%) |
| $50,000 to $74,999 | 29 (13.5%) | 10 (10.2%) |
| $75,000 to $99,999 | 14 (6.5%) | 11 (11.2%) |
| $100,000 to $149,999 | 19 (8.8%) | 5 (5.1%) |
| $150,000 or more | 10 (4.6%) | 21 (21.4%) |
| Total | 215 (100.0%) | 98 (100.0%) |
Property Value to Household Income Ratio in Yale
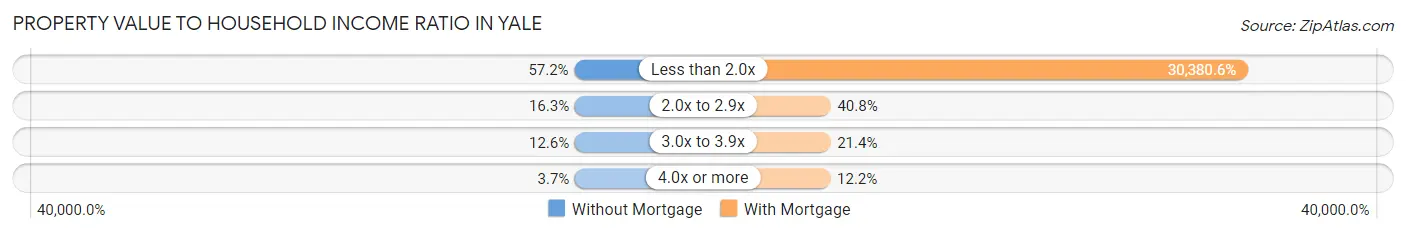
| Value-to-Income Ratio | Without Mortgage | With Mortgage |
| Less than 2.0x | 123 (57.2%) | 29,773 (30,380.6%) |
| 2.0x to 2.9x | 35 (16.3%) | 40 (40.8%) |
| 3.0x to 3.9x | 27 (12.6%) | 21 (21.4%) |
| 4.0x or more | 8 (3.7%) | 12 (12.2%) |
| Total | 215 (100.0%) | 98 (100.0%) |
Real Estate Taxes by Mortgage Status in Yale
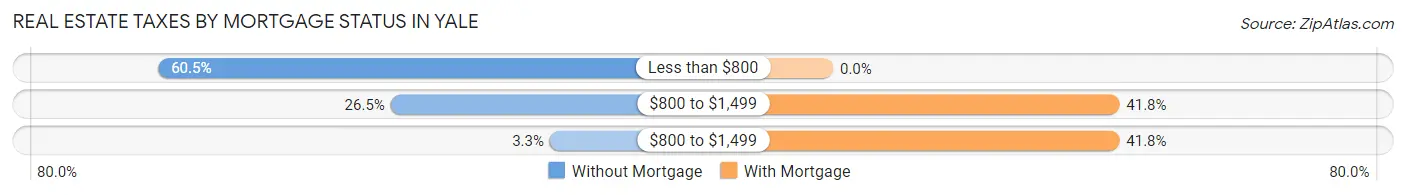
| Property Taxes | Without Mortgage | With Mortgage |
| Less than $800 | 130 (60.5%) | 0 (0.0%) |
| $800 to $1,499 | 57 (26.5%) | 41 (41.8%) |
| $800 to $1,499 | 7 (3.3%) | 41 (41.8%) |
| Total | 215 (100.0%) | 98 (100.0%) |
Health & Disability in Yale
Health Insurance Coverage by Age in Yale

| Age Bracket | With Coverage | Without Coverage |
| Under 6 Years | 58 (55.8%) | 46 (44.2%) |
| 6 to 18 Years | 138 (75.8%) | 44 (24.2%) |
| 19 to 25 Years | 106 (77.9%) | 30 (22.1%) |
| 26 to 34 Years | 95 (54.9%) | 78 (45.1%) |
| 35 to 44 Years | 87 (65.4%) | 46 (34.6%) |
| 45 to 54 Years | 39 (31.7%) | 84 (68.3%) |
| 55 to 64 Years | 81 (76.4%) | 25 (23.6%) |
| 65 to 74 Years | 141 (95.9%) | 6 (4.1%) |
| 75 Years and older | 73 (100.0%) | 0 (0.0%) |
| Total | 818 (69.5%) | 359 (30.5%) |
Health Insurance Coverage by Citizenship Status in Yale
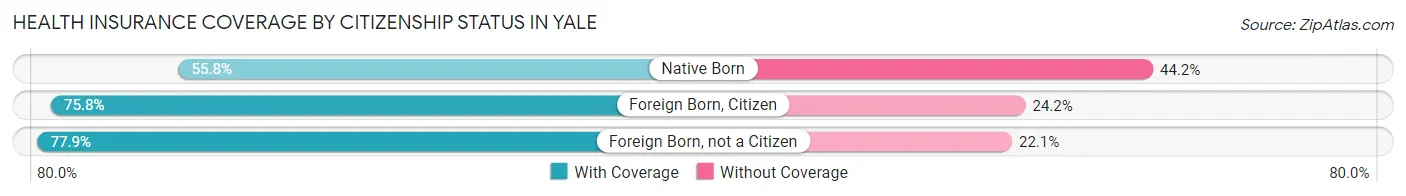
| Citizenship Status | With Coverage | Without Coverage |
| Native Born | 58 (55.8%) | 46 (44.2%) |
| Foreign Born, Citizen | 138 (75.8%) | 44 (24.2%) |
| Foreign Born, not a Citizen | 106 (77.9%) | 30 (22.1%) |
Health Insurance Coverage by Household Income in Yale
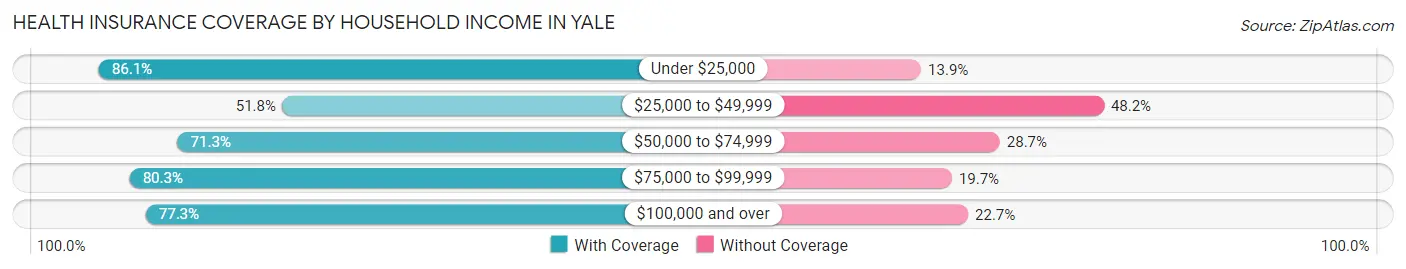
| Household Income | With Coverage | Without Coverage |
| Under $25,000 | 309 (86.1%) | 50 (13.9%) |
| $25,000 to $49,999 | 228 (51.8%) | 212 (48.2%) |
| $50,000 to $74,999 | 92 (71.3%) | 37 (28.7%) |
| $75,000 to $99,999 | 53 (80.3%) | 13 (19.7%) |
| $100,000 and over | 136 (77.3%) | 40 (22.7%) |
Public vs Private Health Insurance Coverage by Age in Yale
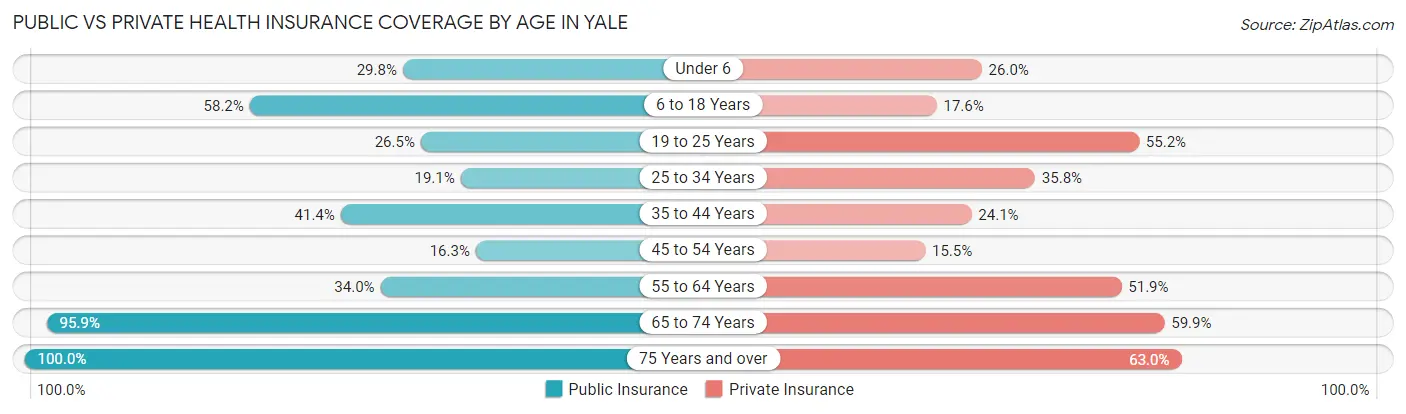
| Age Bracket | Public Insurance | Private Insurance |
| Under 6 | 31 (29.8%) | 27 (26.0%) |
| 6 to 18 Years | 106 (58.2%) | 32 (17.6%) |
| 19 to 25 Years | 36 (26.5%) | 75 (55.1%) |
| 25 to 34 Years | 33 (19.1%) | 62 (35.8%) |
| 35 to 44 Years | 55 (41.3%) | 32 (24.1%) |
| 45 to 54 Years | 20 (16.3%) | 19 (15.4%) |
| 55 to 64 Years | 36 (34.0%) | 55 (51.9%) |
| 65 to 74 Years | 141 (95.9%) | 88 (59.9%) |
| 75 Years and over | 73 (100.0%) | 46 (63.0%) |
| Total | 531 (45.1%) | 436 (37.0%) |
Disability Status by Sex by Age in Yale
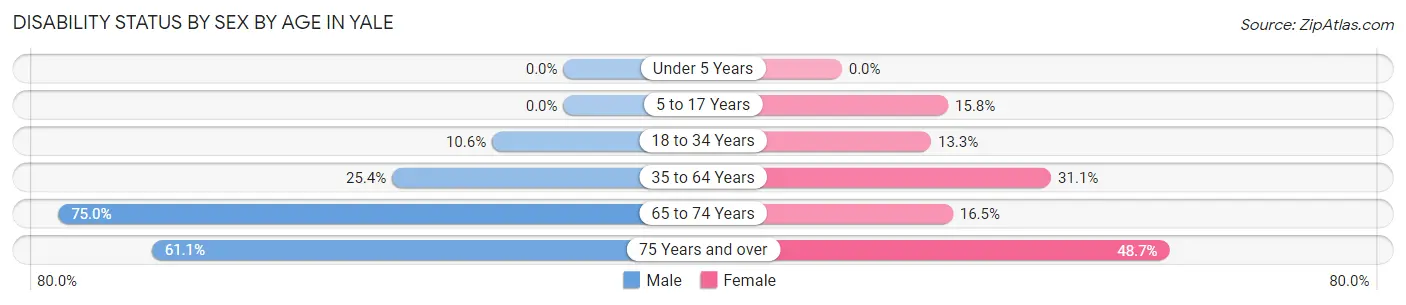
| Age Bracket | Male | Female |
| Under 5 Years | 0 (0.0%) | 0 (0.0%) |
| 5 to 17 Years | 0 (0.0%) | 15 (15.8%) |
| 18 to 34 Years | 16 (10.6%) | 22 (13.3%) |
| 35 to 64 Years | 43 (25.4%) | 60 (31.1%) |
| 65 to 74 Years | 42 (75.0%) | 15 (16.5%) |
| 75 Years and over | 22 (61.1%) | 18 (48.6%) |
Disability Class by Sex by Age in Yale
Disability Class: Hearing Difficulty
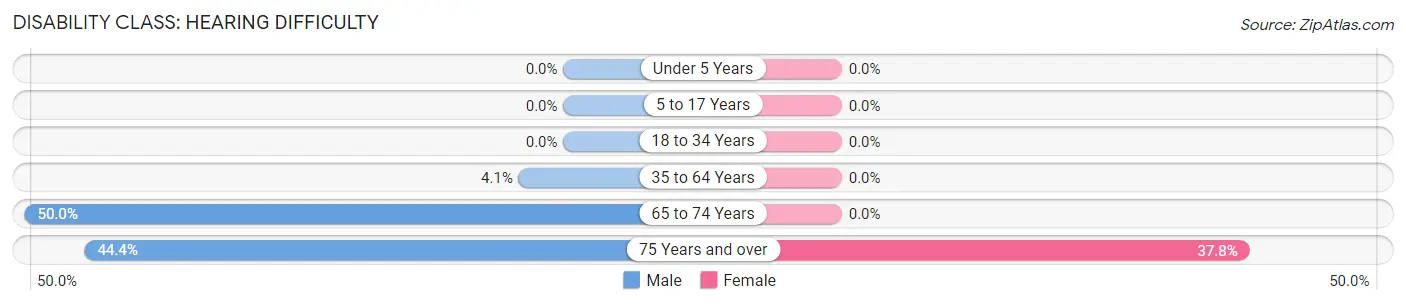
| Age Bracket | Male | Female |
| Under 5 Years | 0 (0.0%) | 0 (0.0%) |
| 5 to 17 Years | 0 (0.0%) | 0 (0.0%) |
| 18 to 34 Years | 0 (0.0%) | 0 (0.0%) |
| 35 to 64 Years | 7 (4.1%) | 0 (0.0%) |
| 65 to 74 Years | 28 (50.0%) | 0 (0.0%) |
| 75 Years and over | 16 (44.4%) | 14 (37.8%) |
Disability Class: Vision Difficulty
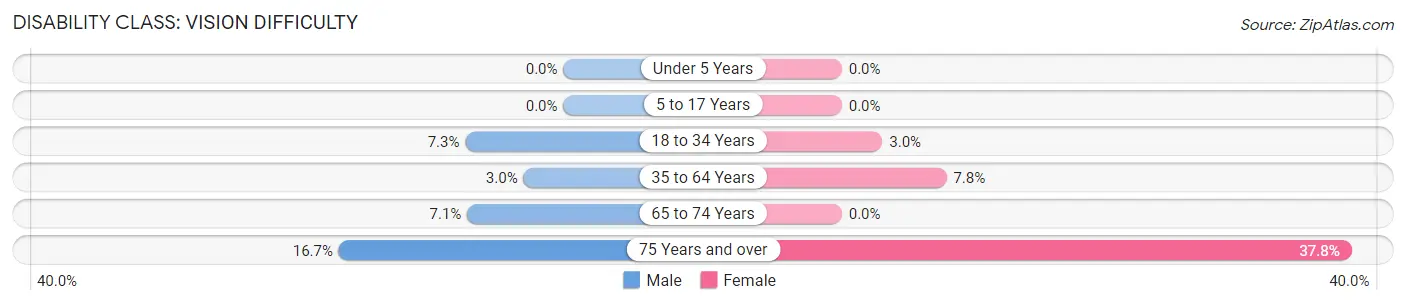
| Age Bracket | Male | Female |
| Under 5 Years | 0 (0.0%) | 0 (0.0%) |
| 5 to 17 Years | 0 (0.0%) | 0 (0.0%) |
| 18 to 34 Years | 11 (7.3%) | 5 (3.0%) |
| 35 to 64 Years | 5 (3.0%) | 15 (7.8%) |
| 65 to 74 Years | 4 (7.1%) | 0 (0.0%) |
| 75 Years and over | 6 (16.7%) | 14 (37.8%) |
Disability Class: Cognitive Difficulty
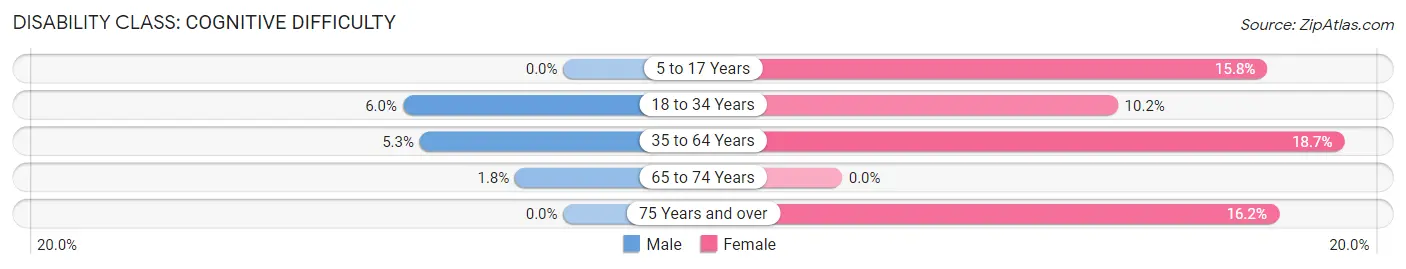
| Age Bracket | Male | Female |
| 5 to 17 Years | 0 (0.0%) | 15 (15.8%) |
| 18 to 34 Years | 9 (6.0%) | 17 (10.2%) |
| 35 to 64 Years | 9 (5.3%) | 36 (18.6%) |
| 65 to 74 Years | 1 (1.8%) | 0 (0.0%) |
| 75 Years and over | 0 (0.0%) | 6 (16.2%) |
Disability Class: Ambulatory Difficulty
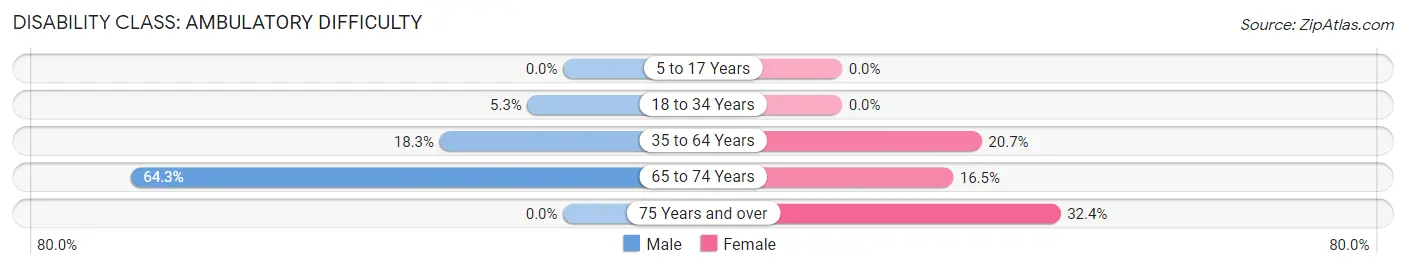
| Age Bracket | Male | Female |
| 5 to 17 Years | 0 (0.0%) | 0 (0.0%) |
| 18 to 34 Years | 8 (5.3%) | 0 (0.0%) |
| 35 to 64 Years | 31 (18.3%) | 40 (20.7%) |
| 65 to 74 Years | 36 (64.3%) | 15 (16.5%) |
| 75 Years and over | 0 (0.0%) | 12 (32.4%) |
Disability Class: Self-Care Difficulty
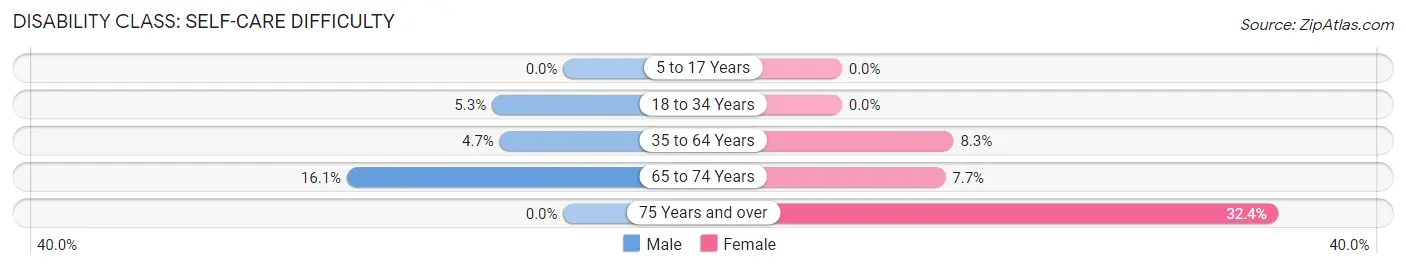
| Age Bracket | Male | Female |
| 5 to 17 Years | 0 (0.0%) | 0 (0.0%) |
| 18 to 34 Years | 8 (5.3%) | 0 (0.0%) |
| 35 to 64 Years | 8 (4.7%) | 16 (8.3%) |
| 65 to 74 Years | 9 (16.1%) | 7 (7.7%) |
| 75 Years and over | 0 (0.0%) | 12 (32.4%) |
Technology Access in Yale
Computing Device Access in Yale
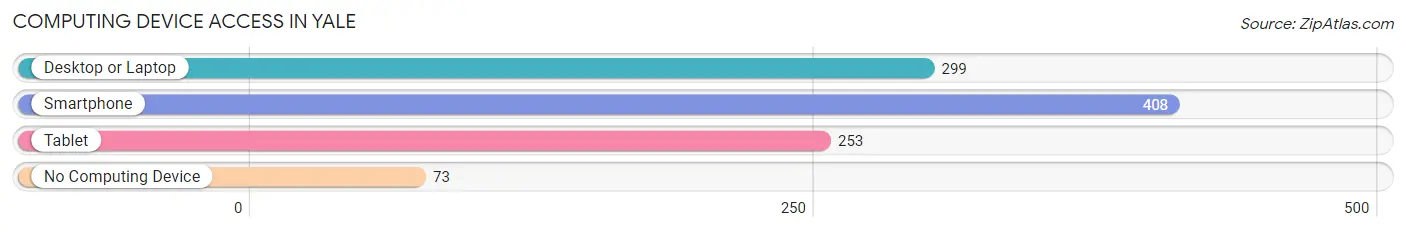
| Device Type | # Households | % Households |
| Desktop or Laptop | 299 | 60.5% |
| Smartphone | 408 | 82.6% |
| Tablet | 253 | 51.2% |
| No Computing Device | 73 | 14.8% |
| Total | 494 | 100.0% |
Internet Access in Yale
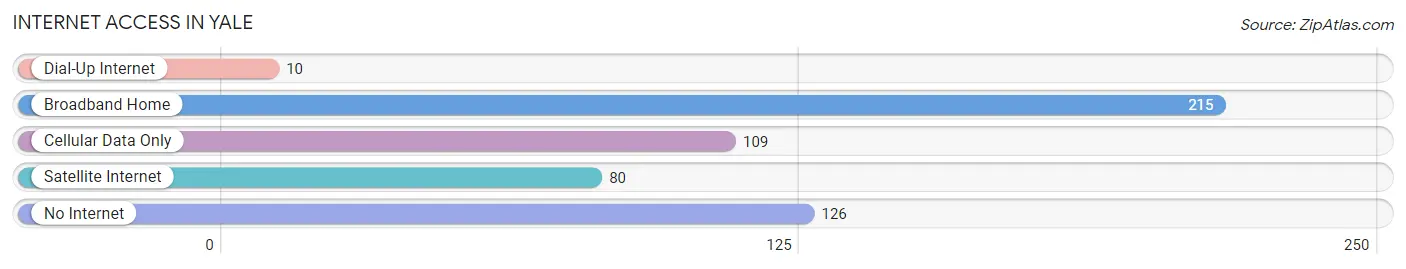
| Internet Type | # Households | % Households |
| Dial-Up Internet | 10 | 2.0% |
| Broadband Home | 215 | 43.5% |
| Cellular Data Only | 109 | 22.1% |
| Satellite Internet | 80 | 16.2% |
| No Internet | 126 | 25.5% |
| Total | 494 | 100.0% |
Yale Summary
Yale is a small town located in Payne County, Oklahoma. It is situated in the northeastern part of the state, about 25 miles northeast of Stillwater. The town was founded in 1891 and was named after Yale University in Connecticut. The population of Yale in 2000 was 1,717.
Geography
Yale is located in the rolling hills of Payne County, Oklahoma. The town is situated in the Cross Timbers region of the state, which is characterized by its oak-hickory forests and tallgrass prairies. The town is located on the banks of the Cimarron River, which flows through the area. The town is also located near the intersection of State Highway 33 and State Highway 51.
Economy
The economy of Yale is largely based on agriculture. The town is home to several farms and ranches, which produce a variety of crops, including wheat, corn, soybeans, and hay. The town is also home to several businesses, including a grocery store, a hardware store, and a restaurant.
Demographics
The population of Yale in 2000 was 1,717. The racial makeup of the town was 95.2% White, 0.6% African American, 0.9% Native American, 0.2% Asian, 0.1% Pacific Islander, 1.2% from other races, and 1.8% from two or more races. Hispanic or Latino of any race were 3.2% of the population.
The median income for a household in the town was $30,938, and the median income for a family was $36,250. Males had a median income of $27,500 versus $20,000 for females. The per capita income for the town was $14,945. About 11.2% of families and 13.2% of the population were below the poverty line, including 16.2% of those under age 18 and 8.2% of those age 65 or over.
Conclusion
Yale is a small town located in Payne County, Oklahoma. It is situated in the northeastern part of the state, about 25 miles northeast of Stillwater. The town was founded in 1891 and was named after Yale University in Connecticut. The population of Yale in 2000 was 1,717. The economy of Yale is largely based on agriculture, and the town is home to several businesses. The racial makeup of the town was 95.2% White, 0.6% African American, 0.9% Native American, 0.2% Asian, 0.1% Pacific Islander, 1.2% from other races, and 1.8% from two or more races. The median income for a household in the town was $30,938, and the median income for a family was $36,250. About 11.2% of families and 13.2% of the population were below the poverty line.
Common Questions
What is Per Capita Income in Yale?
Per Capita income in Yale is $18,746.
What is the Median Family Income in Yale?
Median Family Income in Yale is $40,532.
What is the Median Household income in Yale?
Median Household Income in Yale is $33,583.
What is Income or Wage Gap in Yale?
Income or Wage Gap in Yale is 59.9%.
Women in Yale earn 40.1 cents for every dollar earned by a man.
What is Inequality or Gini Index in Yale?
Inequality or Gini Index in Yale is 0.44.
What is the Total Population of Yale?
Total Population of Yale is 1,179.
What is the Total Male Population of Yale?
Total Male Population of Yale is 562.
What is the Total Female Population of Yale?
Total Female Population of Yale is 617.
What is the Ratio of Males per 100 Females in Yale?
There are 91.09 Males per 100 Females in Yale.
What is the Ratio of Females per 100 Males in Yale?
There are 109.79 Females per 100 Males in Yale.
What is the Median Population Age in Yale?
Median Population Age in Yale is 34.1 Years.
What is the Average Family Size in Yale
Average Family Size in Yale is 2.9 People.
What is the Average Household Size in Yale
Average Household Size in Yale is 2.4 People.
How Large is the Labor Force in Yale?
There are 457 People in the Labor Forcein in Yale.
What is the Percentage of People in the Labor Force in Yale?
48.7% of People are in the Labor Force in Yale.
What is the Unemployment Rate in Yale?
Unemployment Rate in Yale is 7.7%.