Arapaho, OK Map & Demographics
Arapaho Map
Arapaho Overview
$15,253
PER CAPITA INCOME
$47,981
AVG FAMILY INCOME
$37,361
AVG HOUSEHOLD INCOME
43.8%
WAGE / INCOME GAP [ % ]
56.2¢/ $1
WAGE / INCOME GAP [ $ ]
$8,688
FAMILY INCOME DEFICIT
0.38
INEQUALITY / GINI INDEX
795
TOTAL POPULATION
360
MALE POPULATION
435
FEMALE POPULATION
82.76
MALES / 100 FEMALES
120.83
FEMALES / 100 MALES
38.1
MEDIAN AGE
3.8
AVG FAMILY SIZE
3.2
AVG HOUSEHOLD SIZE
256
LABOR FORCE [ PEOPLE ]
44.4%
PERCENT IN LABOR FORCE
3.5%
UNEMPLOYMENT RATE
Arapaho Zip Codes
Arapaho Area Codes
Income in Arapaho
Income Overview in Arapaho
Per Capita Income in Arapaho is $15,253, while median incomes of families and households are $47,981 and $37,361 respectively.
| Characteristic | Number | Measure |
| Per Capita Income | 795 | $15,253 |
| Median Family Income | 175 | $47,981 |
| Mean Family Income | 175 | $54,886 |
| Median Household Income | 225 | $37,361 |
| Mean Household Income | 225 | $48,601 |
| Income Deficit | 175 | $8,688 |
| Wage / Income Gap (%) | 795 | 43.83% |
| Wage / Income Gap ($) | 795 | 56.17¢ per $1 |
| Gini / Inequality Index | 795 | 0.38 |
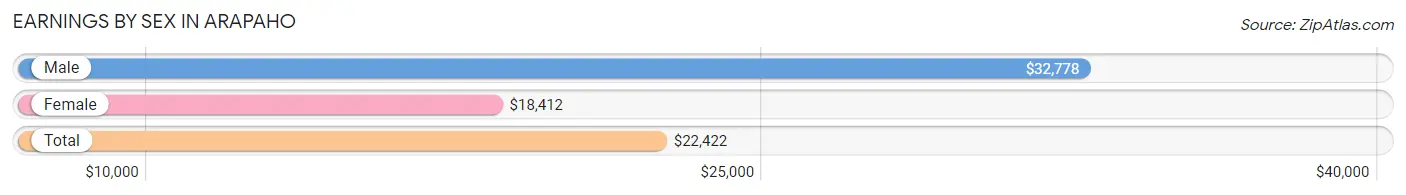
Earnings by Sex in Arapaho
Average Earnings in Arapaho are $22,422, $32,778 for men and $18,412 for women, a difference of 43.8%.
| Sex | Number | Average Earnings |
| Male | 134 (43.9%) | $32,778 |
| Female | 171 (56.1%) | $18,412 |
| Total | 305 (100.0%) | $22,422 |
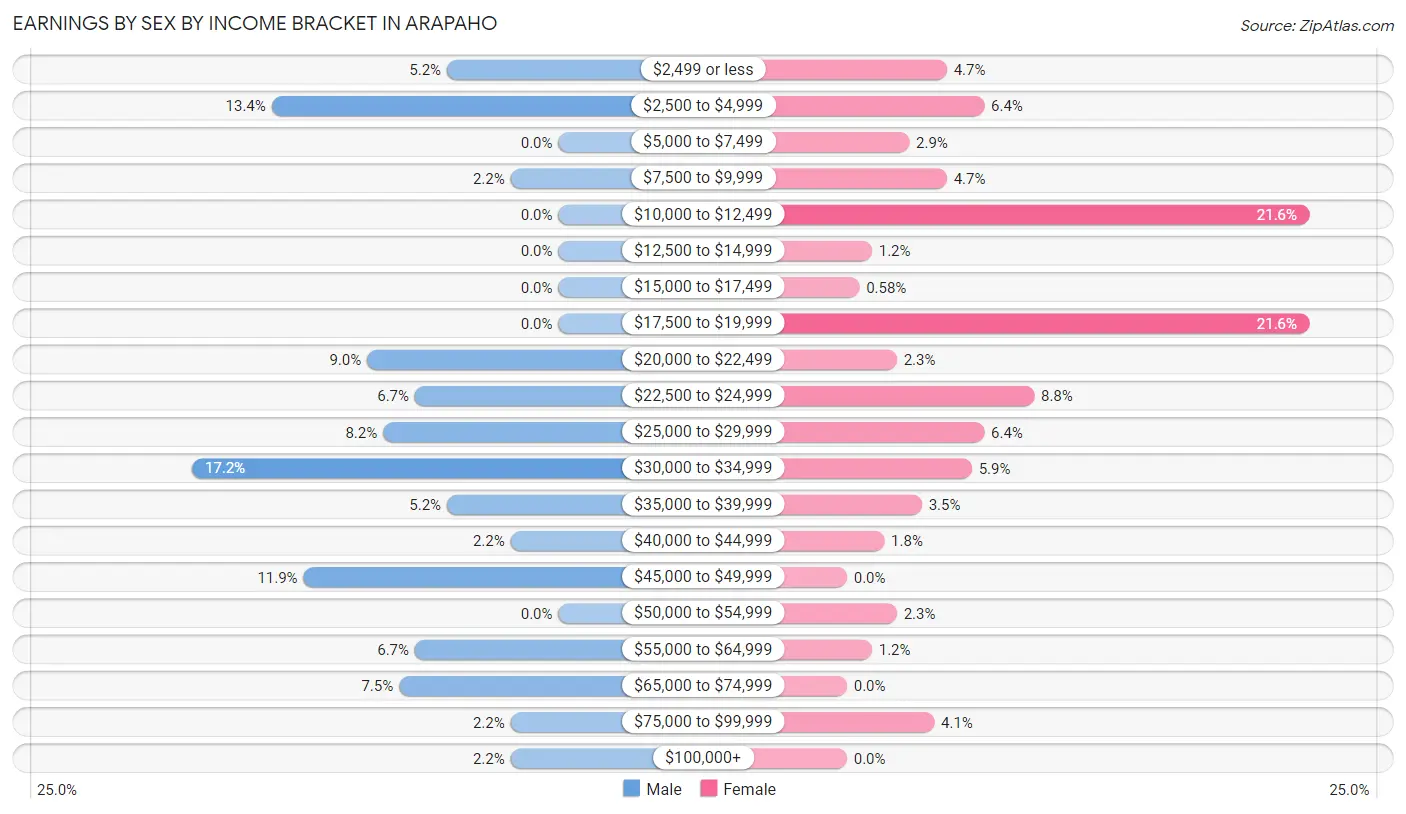
Earnings by Sex by Income Bracket in Arapaho
The most common earnings brackets in Arapaho are $30,000 to $34,999 for men (23 | 17.2%) and $10,000 to $12,499 for women (37 | 21.6%).
| Income | Male | Female |
| $2,499 or less | 7 (5.2%) | 8 (4.7%) |
| $2,500 to $4,999 | 18 (13.4%) | 11 (6.4%) |
| $5,000 to $7,499 | 0 (0.0%) | 5 (2.9%) |
| $7,500 to $9,999 | 3 (2.2%) | 8 (4.7%) |
| $10,000 to $12,499 | 0 (0.0%) | 37 (21.6%) |
| $12,500 to $14,999 | 0 (0.0%) | 2 (1.2%) |
| $15,000 to $17,499 | 0 (0.0%) | 1 (0.6%) |
| $17,500 to $19,999 | 0 (0.0%) | 37 (21.6%) |
| $20,000 to $22,499 | 12 (9.0%) | 4 (2.3%) |
| $22,500 to $24,999 | 9 (6.7%) | 15 (8.8%) |
| $25,000 to $29,999 | 11 (8.2%) | 11 (6.4%) |
| $30,000 to $34,999 | 23 (17.2%) | 10 (5.9%) |
| $35,000 to $39,999 | 7 (5.2%) | 6 (3.5%) |
| $40,000 to $44,999 | 3 (2.2%) | 3 (1.8%) |
| $45,000 to $49,999 | 16 (11.9%) | 0 (0.0%) |
| $50,000 to $54,999 | 0 (0.0%) | 4 (2.3%) |
| $55,000 to $64,999 | 9 (6.7%) | 2 (1.2%) |
| $65,000 to $74,999 | 10 (7.5%) | 0 (0.0%) |
| $75,000 to $99,999 | 3 (2.2%) | 7 (4.1%) |
| $100,000+ | 3 (2.2%) | 0 (0.0%) |
| Total | 134 (100.0%) | 171 (100.0%) |
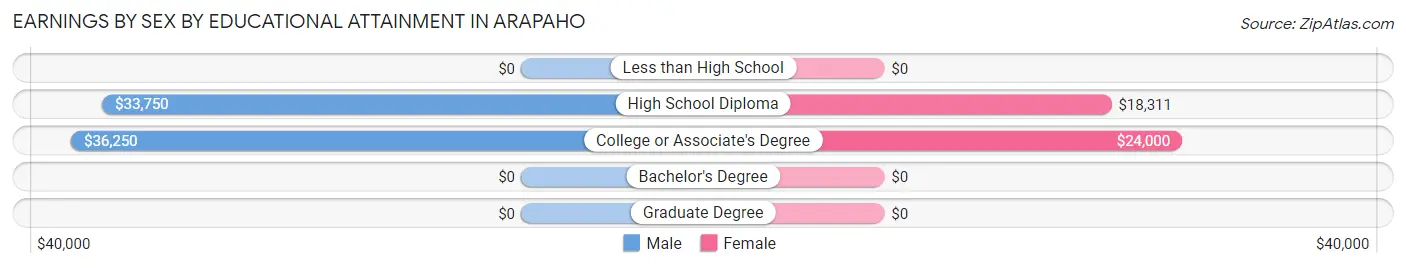
Earnings by Sex by Educational Attainment in Arapaho
Average earnings in Arapaho are $33,819 for men and $19,155 for women, a difference of 43.4%. Men with an educational attainment of college or associate's degree enjoy the highest average annual earnings of $36,250, while those with high school diploma education earn the least with $33,750. Women with an educational attainment of college or associate's degree earn the most with the average annual earnings of $24,000, while those with high school diploma education have the smallest earnings of $18,311.
| Educational Attainment | Male Income | Female Income |
| Less than High School | - | - |
| High School Diploma | $33,750 | $18,311 |
| College or Associate's Degree | $36,250 | $24,000 |
| Bachelor's Degree | - | - |
| Graduate Degree | - | - |
| Total | $33,819 | $19,155 |
Family Income in Arapaho
Family Income Brackets in Arapaho
According to the Arapaho family income data, there are 43 families falling into the $25,000 to $34,999 income range, which is the most common income bracket and makes up 24.6% of all families.
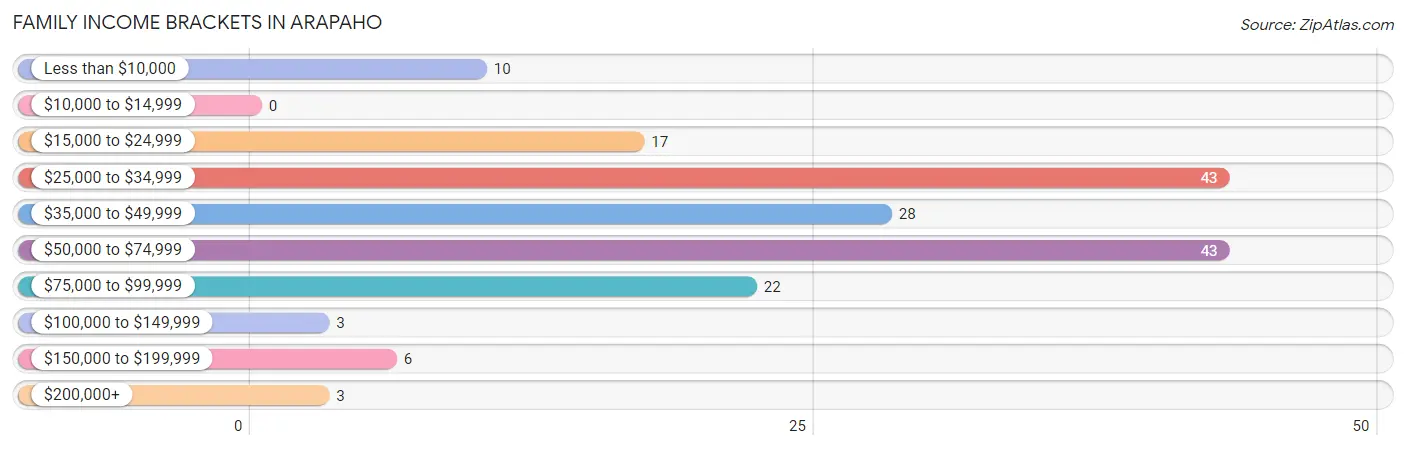
| Income Bracket | # Families | % Families |
| Less than $10,000 | 10 | 5.7% |
| $10,000 to $14,999 | 0 | 0.0% |
| $15,000 to $24,999 | 17 | 9.7% |
| $25,000 to $34,999 | 43 | 24.6% |
| $35,000 to $49,999 | 28 | 16.0% |
| $50,000 to $74,999 | 43 | 24.6% |
| $75,000 to $99,999 | 22 | 12.6% |
| $100,000 to $149,999 | 3 | 1.7% |
| $150,000 to $199,999 | 6 | 3.4% |
| $200,000+ | 3 | 1.7% |
Family Income by Famaliy Size in Arapaho
5-person families (34 | 19.4%) account for the highest median family income in Arapaho with $50,625 per family, while 2-person families (58 | 33.1%) have the highest median income of $24,327 per family member.
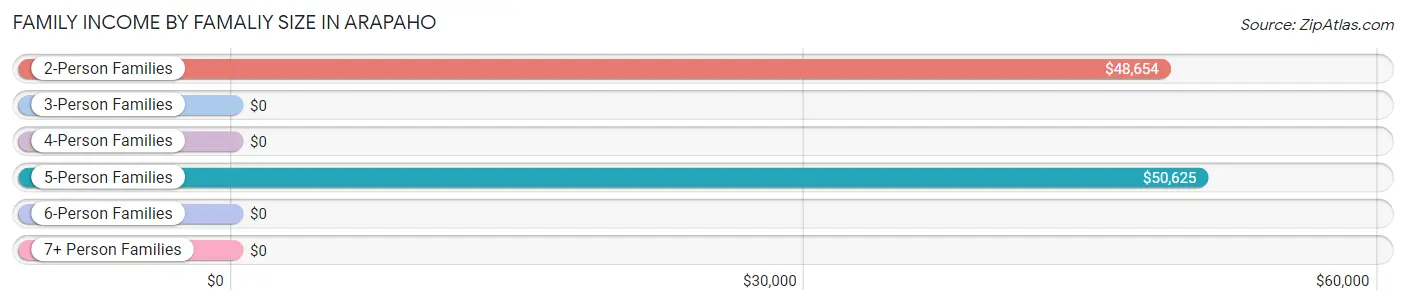
| Income Bracket | # Families | Median Income |
| 2-Person Families | 58 (33.1%) | $48,654 |
| 3-Person Families | 49 (28.0%) | $0 |
| 4-Person Families | 30 (17.1%) | $0 |
| 5-Person Families | 34 (19.4%) | $50,625 |
| 6-Person Families | 4 (2.3%) | $0 |
| 7+ Person Families | 0 (0.0%) | $0 |
| Total | 175 (100.0%) | $47,981 |
Family Income by Number of Earners in Arapaho
The median family income in Arapaho is $47,981, with families comprising 2 earners (38) having the highest median family income of $71,458, while families with no earners (40) have the lowest median family income of $29,375, accounting for 21.7% and 22.9% of families, respectively.
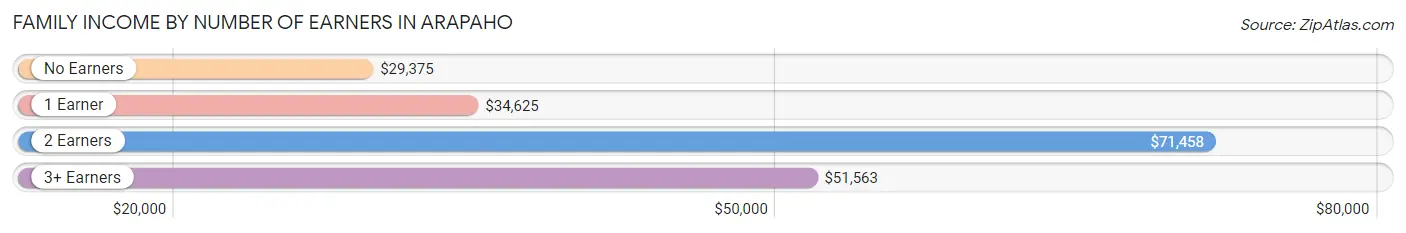
| Number of Earners | # Families | Median Income |
| No Earners | 40 (22.9%) | $29,375 |
| 1 Earner | 83 (47.4%) | $34,625 |
| 2 Earners | 38 (21.7%) | $71,458 |
| 3+ Earners | 14 (8.0%) | $51,563 |
| Total | 175 (100.0%) | $47,981 |
Household Income in Arapaho
Household Income Brackets in Arapaho
With 53 households falling in the category, the $25,000 to $34,999 income range is the most frequent in Arapaho, accounting for 23.6% of all households. In contrast, only 3 households (1.3%) fall into the $100,000 to $149,999 income bracket, making it the least populous group.
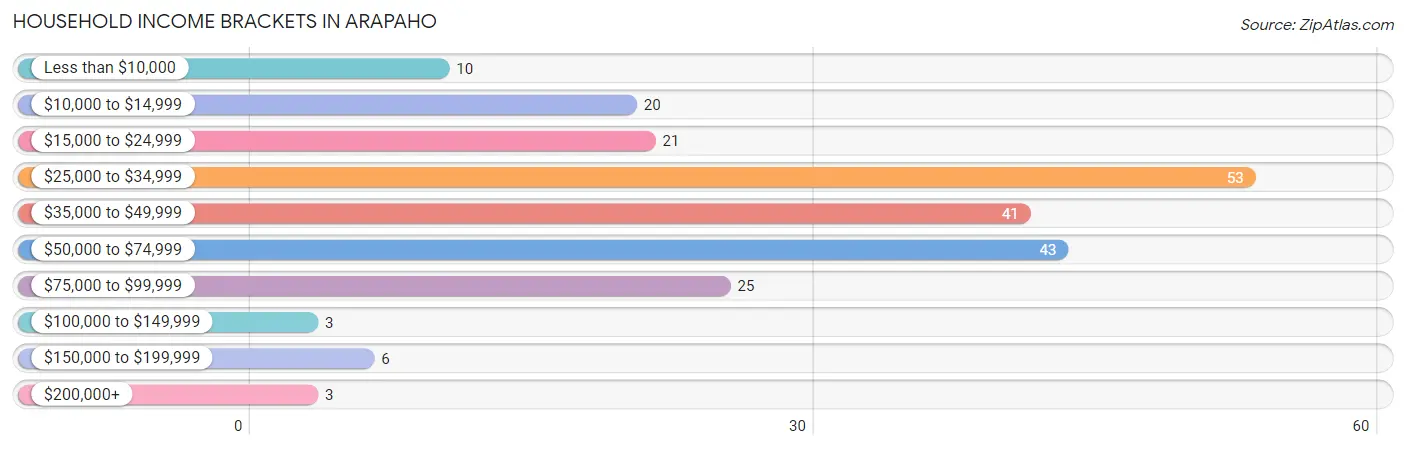
| Income Bracket | # Households | % Households |
| Less than $10,000 | 10 | 4.4% |
| $10,000 to $14,999 | 20 | 8.9% |
| $15,000 to $24,999 | 21 | 9.3% |
| $25,000 to $34,999 | 53 | 23.6% |
| $35,000 to $49,999 | 41 | 18.2% |
| $50,000 to $74,999 | 43 | 19.1% |
| $75,000 to $99,999 | 25 | 11.1% |
| $100,000 to $149,999 | 3 | 1.3% |
| $150,000 to $199,999 | 6 | 2.7% |
| $200,000+ | 3 | 1.3% |
Household Income by Householder Age in Arapaho
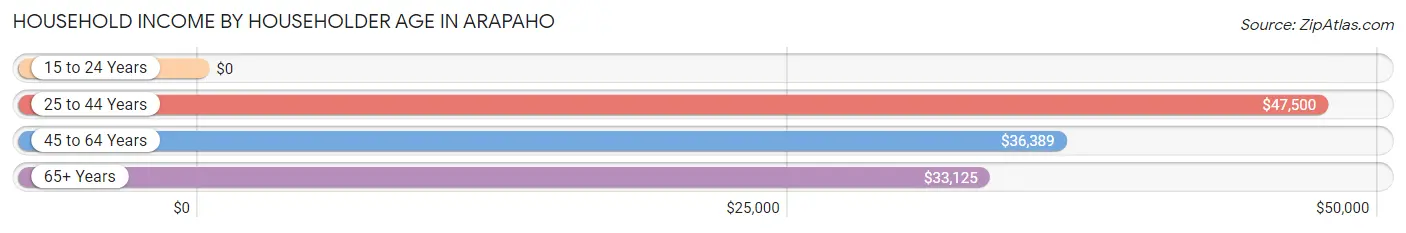
The median household income in Arapaho is $37,361, with the highest median household income of $47,500 found in the 25 to 44 years age bracket for the primary householder. A total of 82 households (36.4%) fall into this category.
| Income Bracket | # Households | Median Income |
| 15 to 24 Years | 0 (0.0%) | $0 |
| 25 to 44 Years | 82 (36.4%) | $47,500 |
| 45 to 64 Years | 88 (39.1%) | $36,389 |
| 65+ Years | 55 (24.4%) | $33,125 |
| Total | 225 (100.0%) | $37,361 |
Poverty in Arapaho
Income Below Poverty by Sex and Age in Arapaho
With 26.1% poverty level for males and 22.5% for females among the residents of Arapaho, 45 to 54 year old males and 25 to 34 year old females are the most vulnerable to poverty, with 38 males (79.2%) and 18 females (40.9%) in their respective age groups living below the poverty level.
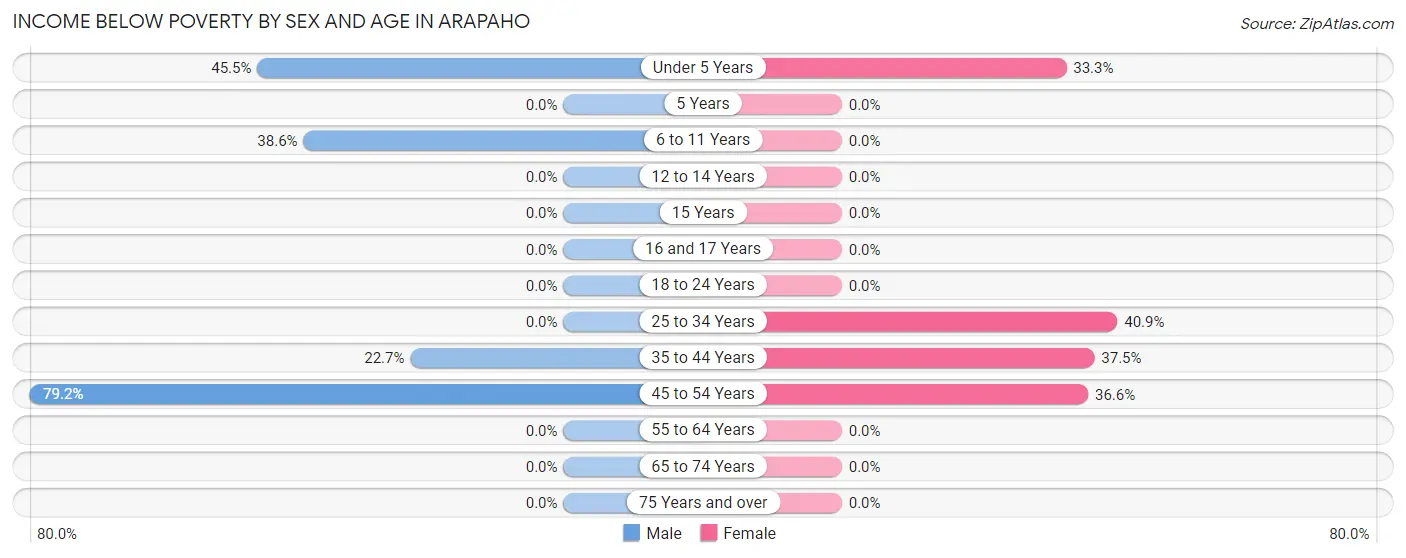
| Age Bracket | Male | Female |
| Under 5 Years | 10 (45.5%) | 10 (33.3%) |
| 5 Years | 0 (0.0%) | 0 (0.0%) |
| 6 to 11 Years | 22 (38.6%) | 0 (0.0%) |
| 12 to 14 Years | 0 (0.0%) | 0 (0.0%) |
| 15 Years | 0 (0.0%) | 0 (0.0%) |
| 16 and 17 Years | 0 (0.0%) | 0 (0.0%) |
| 18 to 24 Years | 0 (0.0%) | 0 (0.0%) |
| 25 to 34 Years | 0 (0.0%) | 18 (40.9%) |
| 35 to 44 Years | 10 (22.7%) | 18 (37.5%) |
| 45 to 54 Years | 38 (79.2%) | 49 (36.6%) |
| 55 to 64 Years | 0 (0.0%) | 0 (0.0%) |
| 65 to 74 Years | 0 (0.0%) | 0 (0.0%) |
| 75 Years and over | 0 (0.0%) | 0 (0.0%) |
| Total | 80 (26.1%) | 95 (22.5%) |
Income Above Poverty by Sex and Age in Arapaho
According to the poverty statistics in Arapaho, males aged 5 years and females aged 6 to 11 years are the age groups that are most secure financially, with 100.0% of males and 100.0% of females in these age groups living above the poverty line.
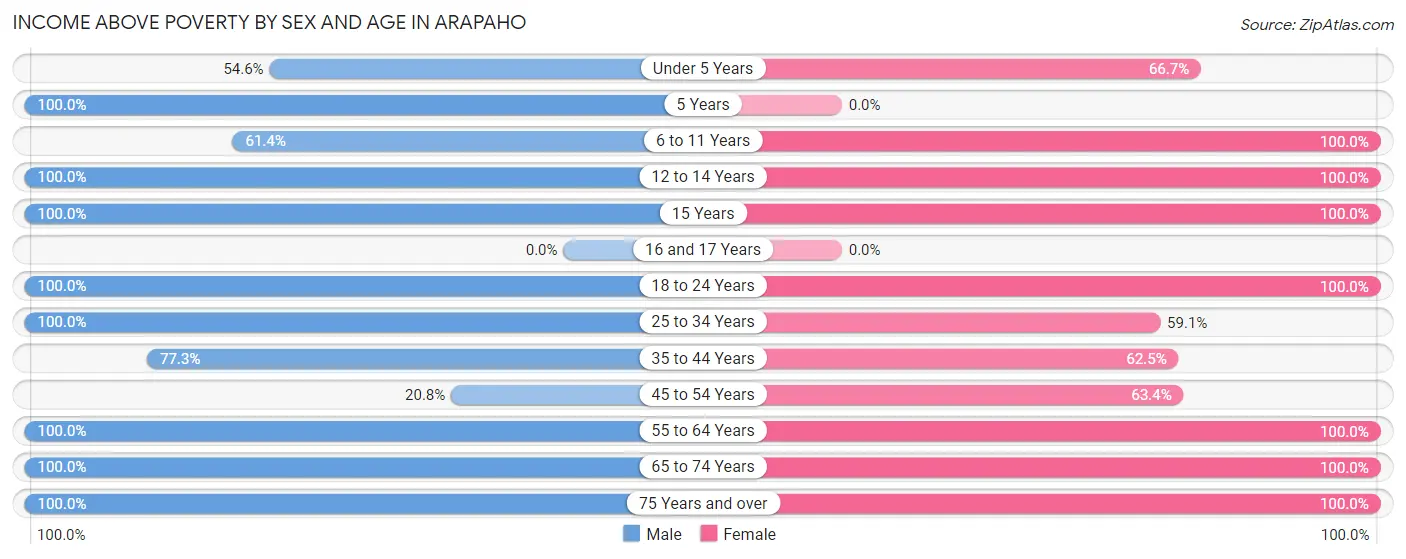
| Age Bracket | Male | Female |
| Under 5 Years | 12 (54.5%) | 20 (66.7%) |
| 5 Years | 12 (100.0%) | 0 (0.0%) |
| 6 to 11 Years | 35 (61.4%) | 15 (100.0%) |
| 12 to 14 Years | 10 (100.0%) | 68 (100.0%) |
| 15 Years | 2 (100.0%) | 3 (100.0%) |
| 16 and 17 Years | 0 (0.0%) | 0 (0.0%) |
| 18 to 24 Years | 11 (100.0%) | 22 (100.0%) |
| 25 to 34 Years | 28 (100.0%) | 26 (59.1%) |
| 35 to 44 Years | 34 (77.3%) | 30 (62.5%) |
| 45 to 54 Years | 10 (20.8%) | 85 (63.4%) |
| 55 to 64 Years | 31 (100.0%) | 16 (100.0%) |
| 65 to 74 Years | 34 (100.0%) | 36 (100.0%) |
| 75 Years and over | 7 (100.0%) | 7 (100.0%) |
| Total | 226 (73.9%) | 328 (77.5%) |
Income Below Poverty Among Married-Couple Families in Arapaho
The poverty statistics for married-couple families in Arapaho show that 23.6% or 33 of the total 140 families live below the poverty line. Families with 1 or 2 children have the highest poverty rate of 45.5%, comprising of 25 families. On the other hand, families with 3 or 4 children have the lowest poverty rate of 0.0%, which includes 0 families.
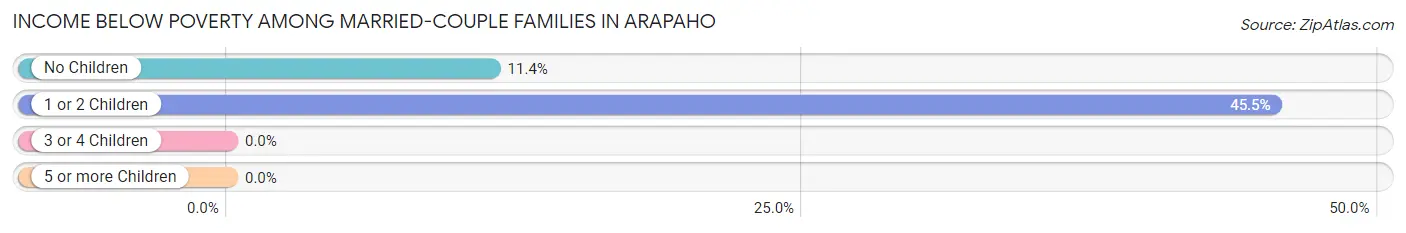
| Children | Above Poverty | Below Poverty |
| No Children | 62 (88.6%) | 8 (11.4%) |
| 1 or 2 Children | 30 (54.5%) | 25 (45.5%) |
| 3 or 4 Children | 15 (100.0%) | 0 (0.0%) |
| 5 or more Children | 0 (0.0%) | 0 (0.0%) |
| Total | 107 (76.4%) | 33 (23.6%) |
Income Below Poverty Among Single-Parent Households in Arapaho
| Children | Single Father | Single Mother |
| No Children | 0 (0.0%) | 0 (0.0%) |
| 1 or 2 Children | 0 (0.0%) | 0 (0.0%) |
| 3 or 4 Children | 0 (0.0%) | 0 (0.0%) |
| 5 or more Children | 0 (0.0%) | 0 (0.0%) |
| Total | 0 (0.0%) | 0 (0.0%) |
Income Below Poverty Among Married-Couple vs Single-Parent Households in Arapaho
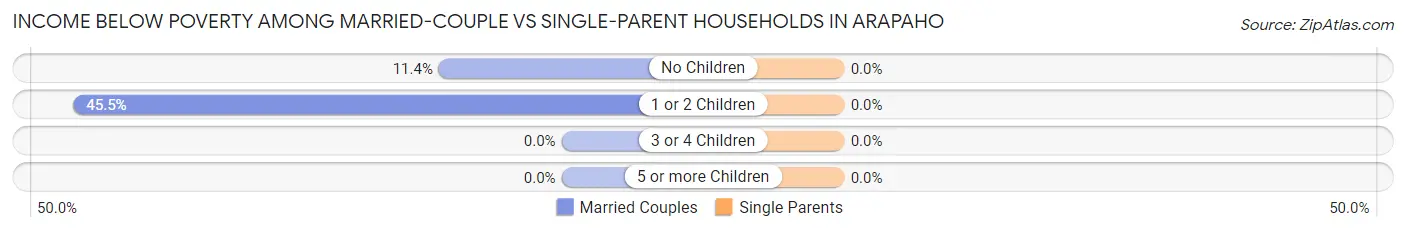
| Children | Married-Couple Families | Single-Parent Households |
| No Children | 8 (11.4%) | 0 (0.0%) |
| 1 or 2 Children | 25 (45.5%) | 0 (0.0%) |
| 3 or 4 Children | 0 (0.0%) | 0 (0.0%) |
| 5 or more Children | 0 (0.0%) | 0 (0.0%) |
| Total | 33 (23.6%) | 0 (0.0%) |
Race in Arapaho
The most populous races in Arapaho are White / Caucasian (686 | 86.3%), Hispanic or Latino (136 | 17.1%), and Native / Alaskan (47 | 5.9%).
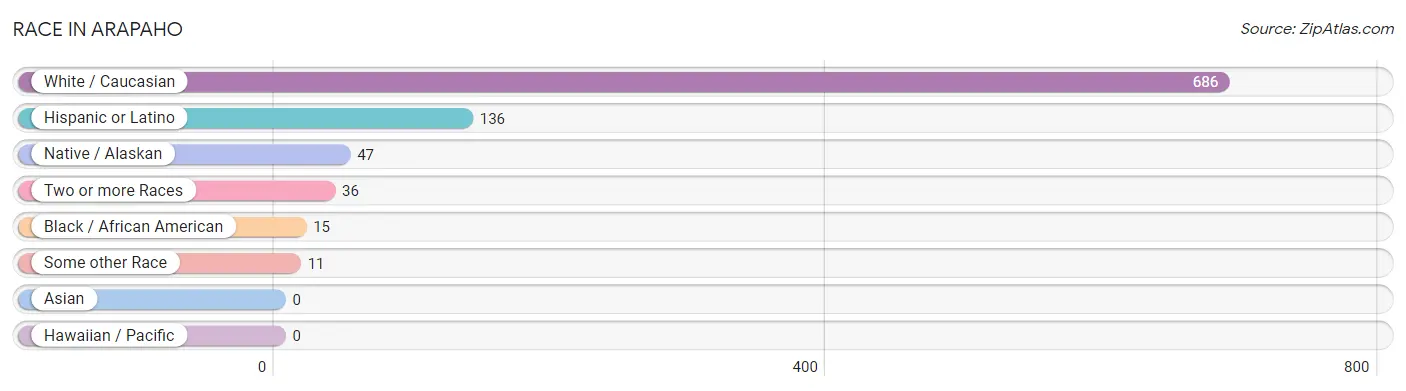
| Race | # Population | % Population |
| Asian | 0 | 0.0% |
| Black / African American | 15 | 1.9% |
| Hawaiian / Pacific | 0 | 0.0% |
| Hispanic or Latino | 136 | 17.1% |
| Native / Alaskan | 47 | 5.9% |
| White / Caucasian | 686 | 86.3% |
| Two or more Races | 36 | 4.5% |
| Some other Race | 11 | 1.4% |
| Total | 795 | 100.0% |
Ancestry in Arapaho
The most populous ancestries reported in Arapaho are German (206 | 25.9%), Mexican (132 | 16.6%), Irish (118 | 14.8%), English (96 | 12.1%), and Norwegian (46 | 5.8%), together accounting for 75.2% of all Arapaho residents.
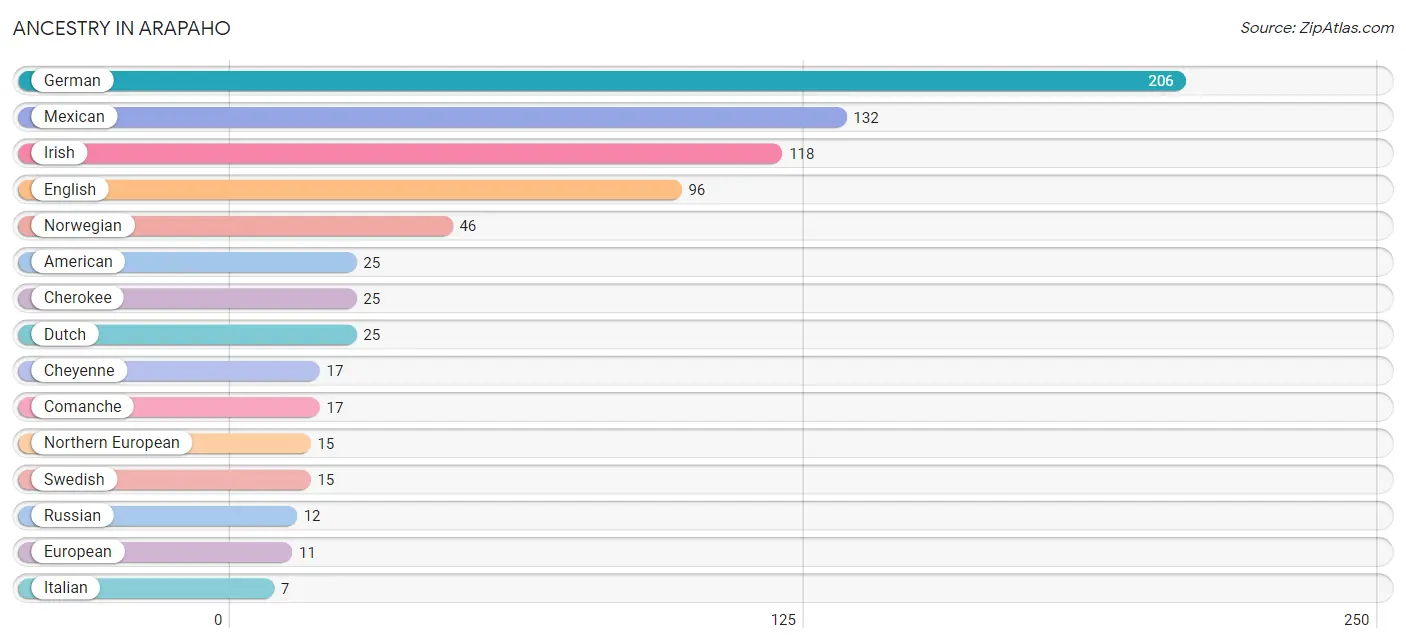
| Ancestry | # Population | % Population |
| American | 25 | 3.1% |
| Cherokee | 25 | 3.1% |
| Cheyenne | 17 | 2.1% |
| Comanche | 17 | 2.1% |
| Dutch | 25 | 3.1% |
| English | 96 | 12.1% |
| European | 11 | 1.4% |
| French | 6 | 0.7% |
| German | 206 | 25.9% |
| Irish | 118 | 14.8% |
| Italian | 7 | 0.9% |
| Kiowa | 2 | 0.3% |
| Mexican | 132 | 16.6% |
| Northern European | 15 | 1.9% |
| Norwegian | 46 | 5.8% |
| Russian | 12 | 1.5% |
| Scotch-Irish | 3 | 0.4% |
| Scottish | 6 | 0.7% |
| Shoshone | 2 | 0.3% |
| Swedish | 15 | 1.9% | View All 20 Rows |
Immigrants in Arapaho
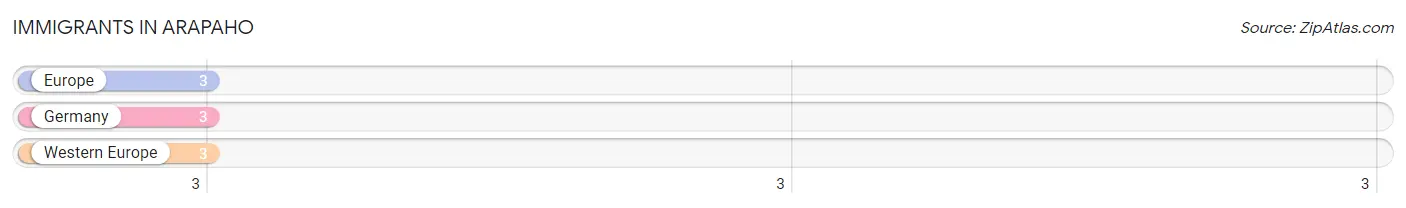
The most numerous immigrant groups reported in Arapaho came from Europe (3 | 0.4%), Germany (3 | 0.4%), and Western Europe (3 | 0.4%), together accounting for 1.1% of all Arapaho residents.
| Immigration Origin | # Population | % Population |
| Europe | 3 | 0.4% |
| Germany | 3 | 0.4% |
| Western Europe | 3 | 0.4% | View All 3 Rows |
Sex and Age in Arapaho
Sex and Age in Arapaho
The most populous age groups in Arapaho are 5 to 9 Years (49 | 13.6%) for men and 50 to 54 Years (107 | 24.6%) for women.
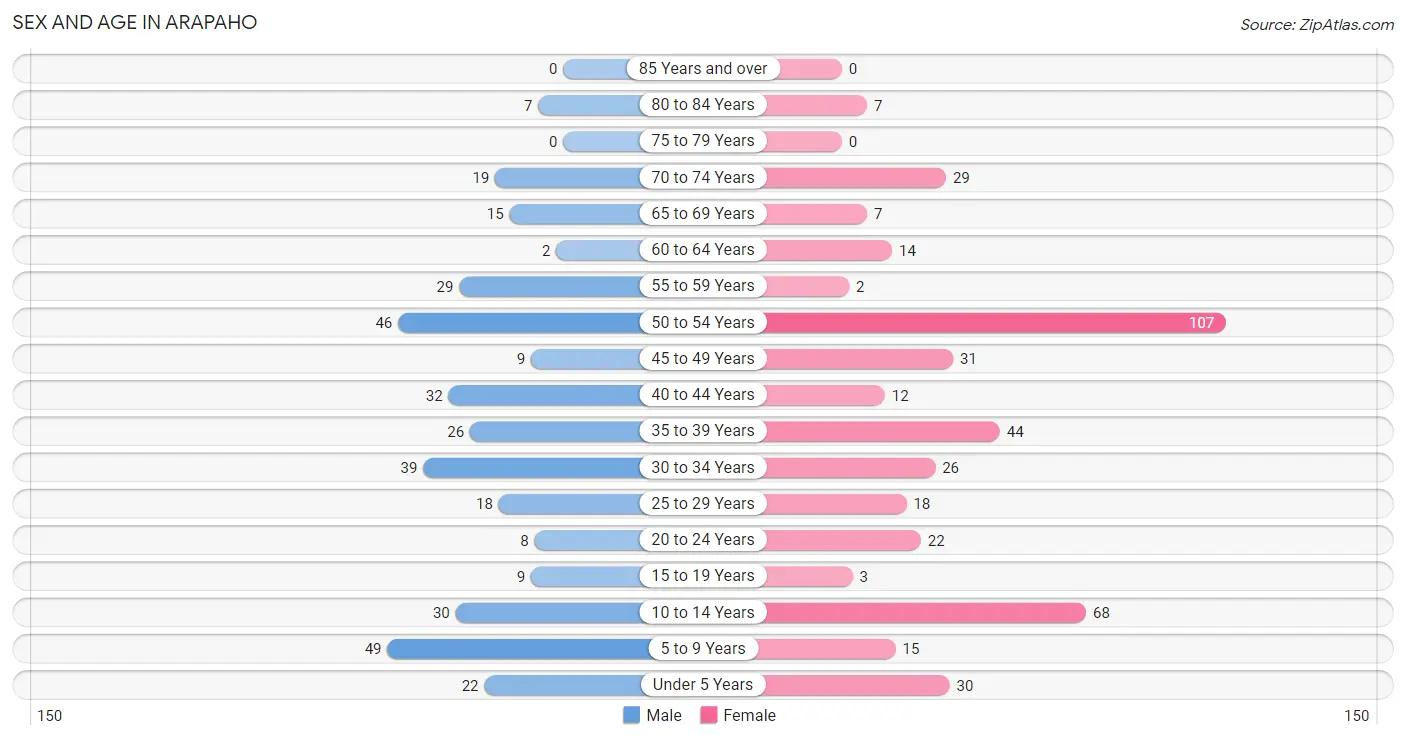
| Age Bracket | Male | Female |
| Under 5 Years | 22 (6.1%) | 30 (6.9%) |
| 5 to 9 Years | 49 (13.6%) | 15 (3.5%) |
| 10 to 14 Years | 30 (8.3%) | 68 (15.6%) |
| 15 to 19 Years | 9 (2.5%) | 3 (0.7%) |
| 20 to 24 Years | 8 (2.2%) | 22 (5.1%) |
| 25 to 29 Years | 18 (5.0%) | 18 (4.1%) |
| 30 to 34 Years | 39 (10.8%) | 26 (6.0%) |
| 35 to 39 Years | 26 (7.2%) | 44 (10.1%) |
| 40 to 44 Years | 32 (8.9%) | 12 (2.8%) |
| 45 to 49 Years | 9 (2.5%) | 31 (7.1%) |
| 50 to 54 Years | 46 (12.8%) | 107 (24.6%) |
| 55 to 59 Years | 29 (8.1%) | 2 (0.5%) |
| 60 to 64 Years | 2 (0.6%) | 14 (3.2%) |
| 65 to 69 Years | 15 (4.2%) | 7 (1.6%) |
| 70 to 74 Years | 19 (5.3%) | 29 (6.7%) |
| 75 to 79 Years | 0 (0.0%) | 0 (0.0%) |
| 80 to 84 Years | 7 (1.9%) | 7 (1.6%) |
| 85 Years and over | 0 (0.0%) | 0 (0.0%) |
| Total | 360 (100.0%) | 435 (100.0%) |
Families and Households in Arapaho
Median Family Size in Arapaho
The median family size in Arapaho is 3.75 persons per family, with married-couple families (140 | 80.0%) accounting for the largest median family size of 4.06 persons per family. On the other hand, single male/father families (18 | 10.3%) represent the smallest median family size with 2.33 persons per family.
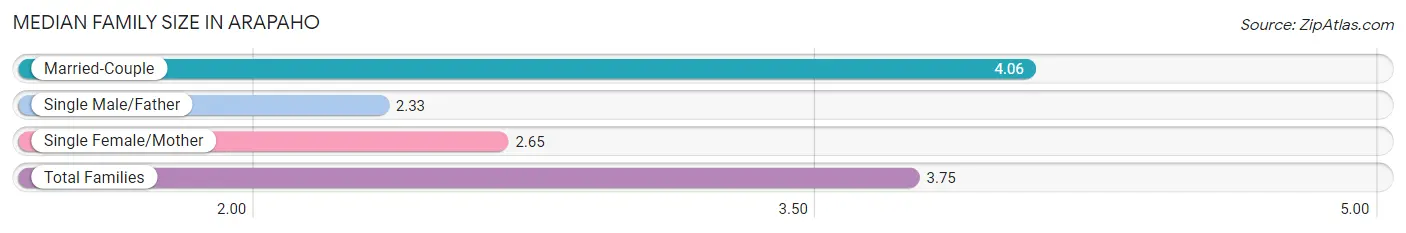
| Family Type | # Families | Family Size |
| Married-Couple | 140 (80.0%) | 4.06 |
| Single Male/Father | 18 (10.3%) | 2.33 |
| Single Female/Mother | 17 (9.7%) | 2.65 |
| Total Families | 175 (100.0%) | 3.75 |
Median Household Size in Arapaho
The median household size in Arapaho is 3.24 persons per household, with married-couple households (140 | 62.2%) accounting for the largest median household size of 4.06 persons per household. non-family households (50 | 22.2%) represent the smallest median household size with 1.46 persons per household.
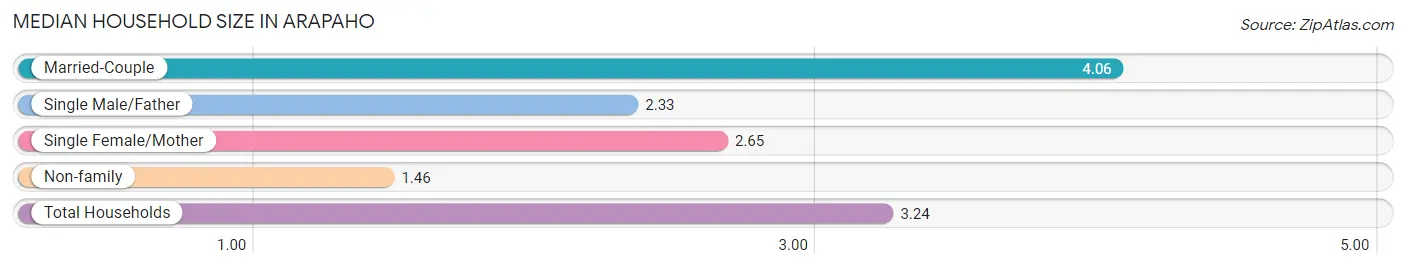
| Household Type | # Households | Household Size |
| Married-Couple | 140 (62.2%) | 4.06 |
| Single Male/Father | 18 (8.0%) | 2.33 |
| Single Female/Mother | 17 (7.6%) | 2.65 |
| Non-family | 50 (22.2%) | 1.46 |
| Total Households | 225 (100.0%) | 3.24 |
Household Size by Marriage Status in Arapaho
Out of a total of 225 households in Arapaho, 175 (77.8%) are family households, while 50 (22.2%) are nonfamily households. The most numerous type of family households are 2-person households, comprising 58, and the most common type of nonfamily households are 1-person households, comprising 34.
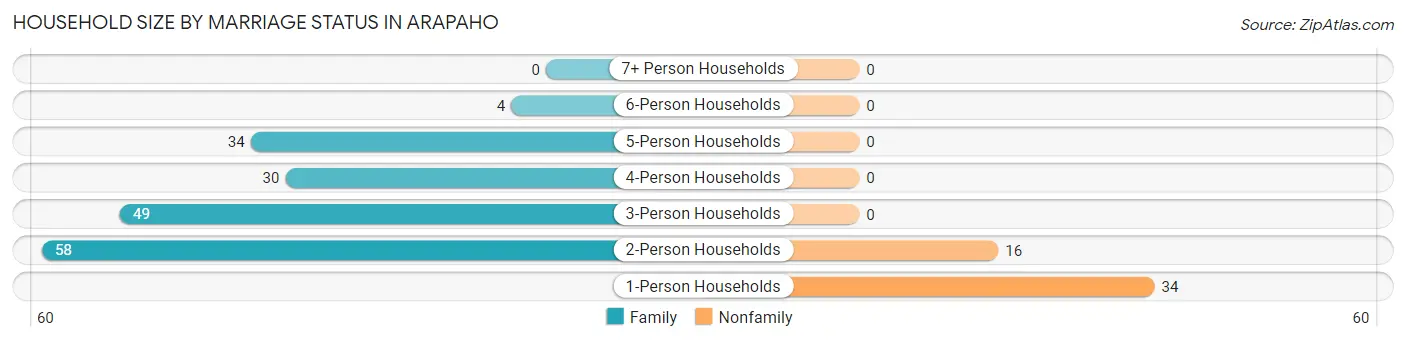
| Household Size | Family Households | Nonfamily Households |
| 1-Person Households | - | 34 (15.1%) |
| 2-Person Households | 58 (25.8%) | 16 (7.1%) |
| 3-Person Households | 49 (21.8%) | 0 (0.0%) |
| 4-Person Households | 30 (13.3%) | 0 (0.0%) |
| 5-Person Households | 34 (15.1%) | 0 (0.0%) |
| 6-Person Households | 4 (1.8%) | 0 (0.0%) |
| 7+ Person Households | 0 (0.0%) | 0 (0.0%) |
| Total | 175 (77.8%) | 50 (22.2%) |
Female Fertility in Arapaho
Fertility by Age in Arapaho
Average fertility rate in Arapaho is 104.0 births per 1,000 women. Women in the age bracket of 20 to 34 years have the highest fertility rate with 273.0 births per 1,000 women. Women in the age bracket of 20 to 34 years acount for 90.0% of all women with births.
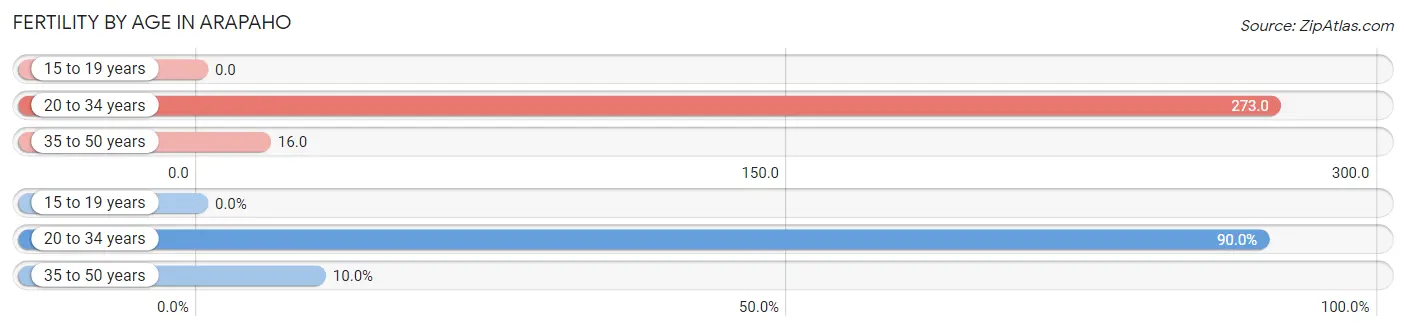
| Age Bracket | Women with Births | Births / 1,000 Women |
| 15 to 19 years | 0 (0.0%) | 0.0 |
| 20 to 34 years | 18 (90.0%) | 273.0 |
| 35 to 50 years | 2 (10.0%) | 16.0 |
| Total | 20 (100.0%) | 104.0 |
Fertility by Age by Marriage Status in Arapaho
10.0% of women with births (20) in Arapaho are married. The highest percentage of unmarried women with births falls into 20 to 34 years age bracket with 100.0% of them unmarried at the time of birth, while the lowest percentage of unmarried women with births belong to 35 to 50 years age bracket with 0.0% of them unmarried.
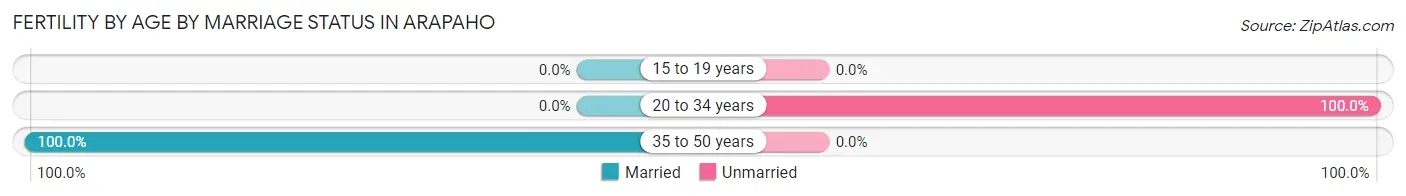
| Age Bracket | Married | Unmarried |
| 15 to 19 years | 0 (0.0%) | 0 (0.0%) |
| 20 to 34 years | 0 (0.0%) | 18 (100.0%) |
| 35 to 50 years | 2 (100.0%) | 0 (0.0%) |
| Total | 2 (10.0%) | 18 (90.0%) |
Fertility by Education in Arapaho
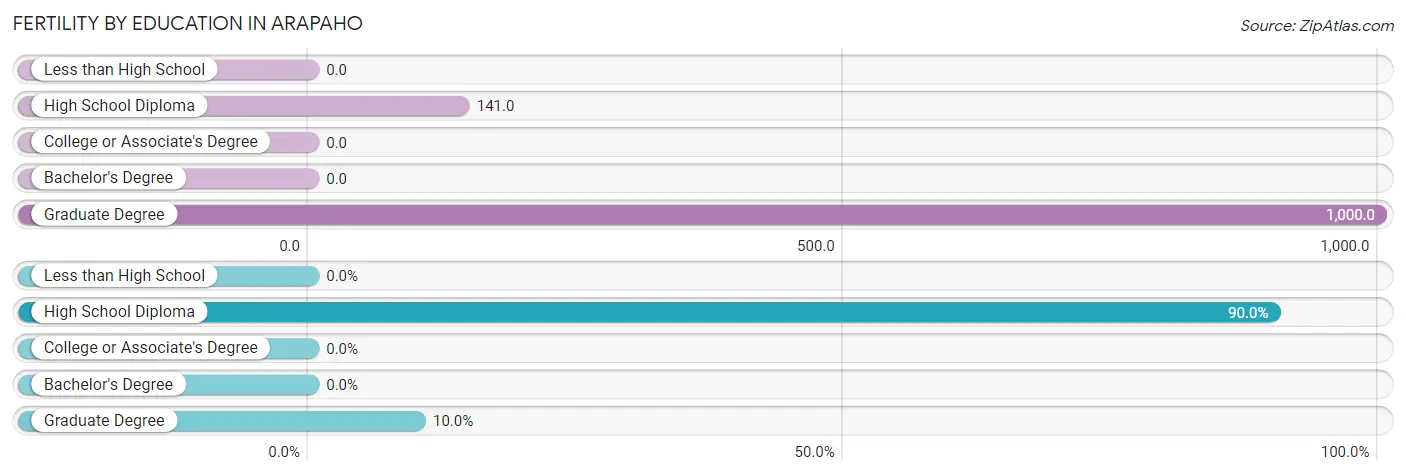
| Educational Attainment | Women with Births | Births / 1,000 Women |
| Less than High School | 0 (0.0%) | 0.0 |
| High School Diploma | 18 (90.0%) | 141.0 |
| College or Associate's Degree | 0 (0.0%) | 0.0 |
| Bachelor's Degree | 0 (0.0%) | 0.0 |
| Graduate Degree | 2 (10.0%) | 1,000.0 |
| Total | 20 (100.0%) | 104.0 |
Fertility by Education by Marriage Status in Arapaho
90.0% of women with births in Arapaho are unmarried. Women with the educational attainment of graduate degree are most likely to be married with 100.0% of them married at childbirth, while women with the educational attainment of high school diploma are least likely to be married with 100.0% of them unmarried at childbirth.
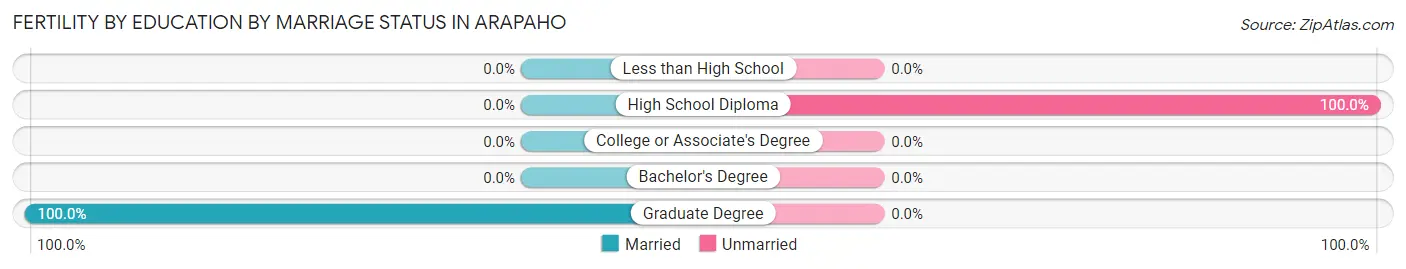
| Educational Attainment | Married | Unmarried |
| Less than High School | 0 (0.0%) | 0 (0.0%) |
| High School Diploma | 0 (0.0%) | 18 (100.0%) |
| College or Associate's Degree | 0 (0.0%) | 0 (0.0%) |
| Bachelor's Degree | 0 (0.0%) | 0 (0.0%) |
| Graduate Degree | 2 (100.0%) | 0 (0.0%) |
| Total | 2 (10.0%) | 18 (90.0%) |
Employment Characteristics in Arapaho
Employment by Class of Employer in Arapaho
Among the 247 employed individuals in Arapaho, private company employees (171 | 69.2%), self-employed (not incorporated) (37 | 15.0%), and not-for-profit organizations (13 | 5.3%) make up the most common classes of employment.
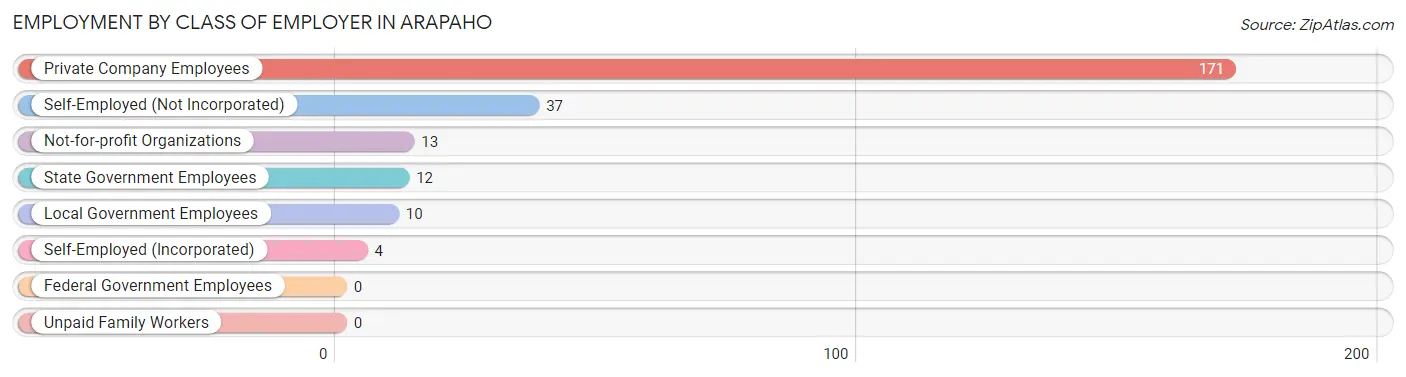
| Employer Class | # Employees | % Employees |
| Private Company Employees | 171 | 69.2% |
| Self-Employed (Incorporated) | 4 | 1.6% |
| Self-Employed (Not Incorporated) | 37 | 15.0% |
| Not-for-profit Organizations | 13 | 5.3% |
| Local Government Employees | 10 | 4.1% |
| State Government Employees | 12 | 4.9% |
| Federal Government Employees | 0 | 0.0% |
| Unpaid Family Workers | 0 | 0.0% |
| Total | 247 | 100.0% |
Employment Status by Age in Arapaho
According to the labor force statistics for Arapaho, out of the total population over 16 years of age (576), 44.4% or 256 individuals are in the labor force, with 3.5% or 9 of them unemployed. The age group with the highest labor force participation rate is 20 to 24 years, with 86.7% or 26 individuals in the labor force. Within the labor force, the 45 to 54 years age range has the highest percentage of unemployed individuals, with 11.1% or 9 of them being unemployed.
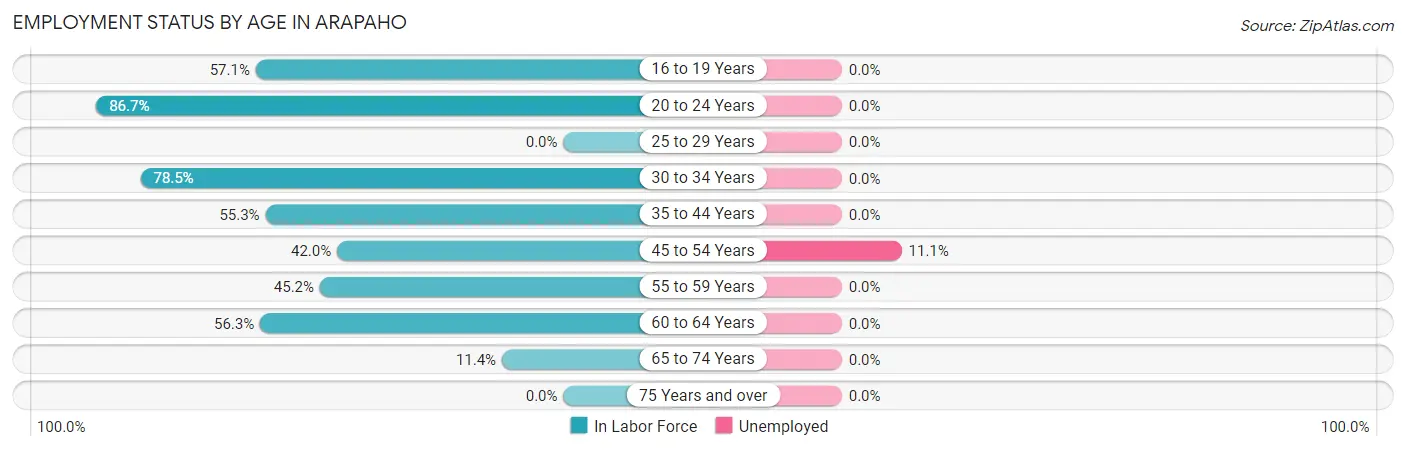
| Age Bracket | In Labor Force | Unemployed |
| 16 to 19 Years | 4 (57.1%) | 0 (0.0%) |
| 20 to 24 Years | 26 (86.7%) | 0 (0.0%) |
| 25 to 29 Years | 0 (0.0%) | 0 (0.0%) |
| 30 to 34 Years | 51 (78.5%) | 0 (0.0%) |
| 35 to 44 Years | 63 (55.3%) | 0 (0.0%) |
| 45 to 54 Years | 81 (42.0%) | 9 (11.1%) |
| 55 to 59 Years | 14 (45.2%) | 0 (0.0%) |
| 60 to 64 Years | 9 (56.3%) | 0 (0.0%) |
| 65 to 74 Years | 8 (11.4%) | 0 (0.0%) |
| 75 Years and over | 0 (0.0%) | 0 (0.0%) |
| Total | 256 (44.4%) | 9 (3.5%) |
Employment Status by Educational Attainment in Arapaho
According to labor force statistics for Arapaho, 47.9% of individuals (218) out of the total population between 25 and 64 years of age (455) are in the labor force, with 4.1% or 9 of them being unemployed. The group with the highest labor force participation rate are those with the educational attainment of bachelor's degree or higher, with 100.0% or 27 individuals in the labor force. Within the labor force, individuals with high school diploma education have the highest percentage of unemployment, with 6.6% or 9 of them being unemployed.
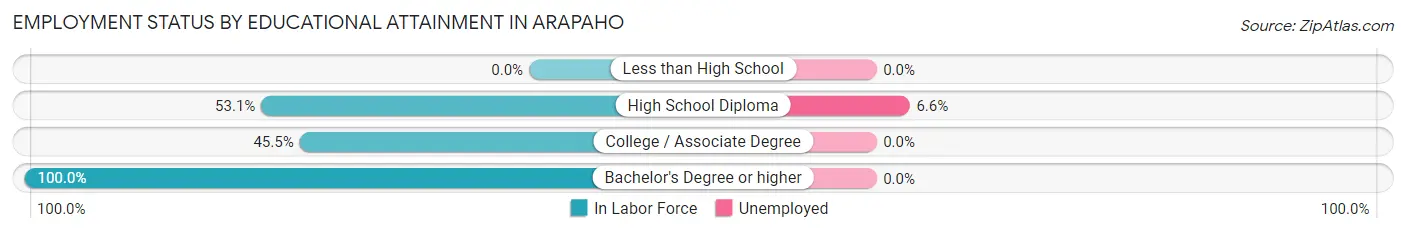
| Educational Attainment | In Labor Force | Unemployed |
| Less than High School | 0 (0.0%) | 0 (0.0%) |
| High School Diploma | 136 (53.1%) | 17 (6.6%) |
| College / Associate Degree | 55 (45.5%) | 0 (0.0%) |
| Bachelor's Degree or higher | 27 (100.0%) | 0 (0.0%) |
| Total | 218 (47.9%) | 19 (4.1%) |
Employment Occupations by Sex in Arapaho
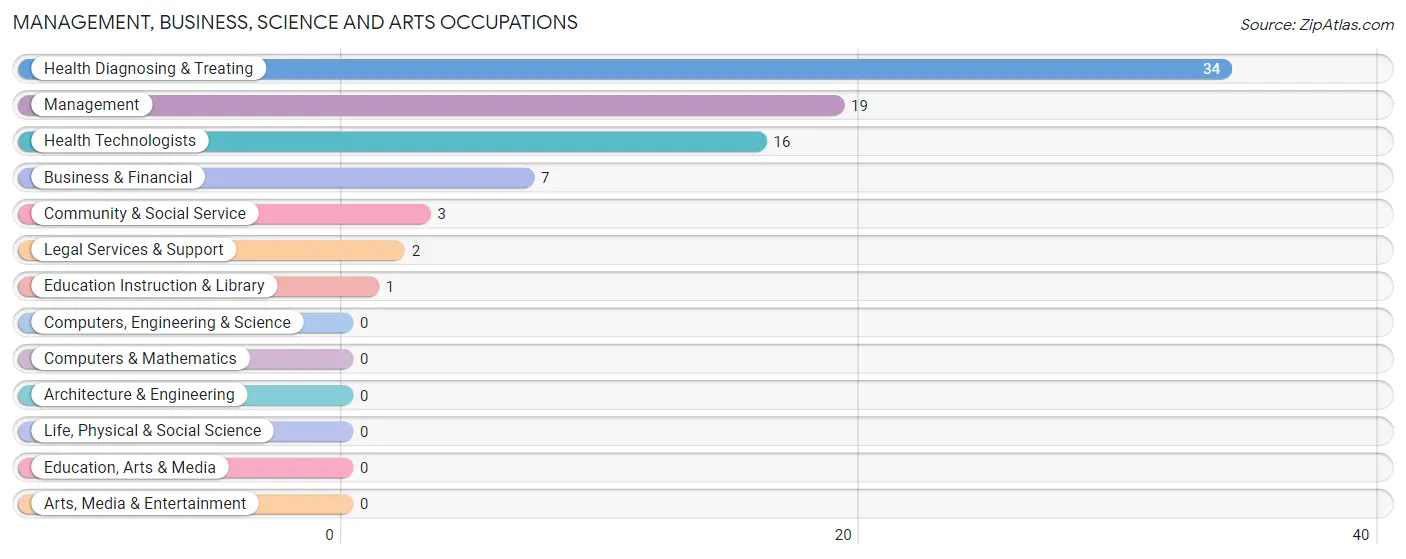
Management, Business, Science and Arts Occupations
The most common Management, Business, Science and Arts occupations in Arapaho are Health Diagnosing & Treating (34 | 13.8%), Management (19 | 7.7%), Health Technologists (16 | 6.5%), Business & Financial (7 | 2.8%), and Community & Social Service (3 | 1.2%).
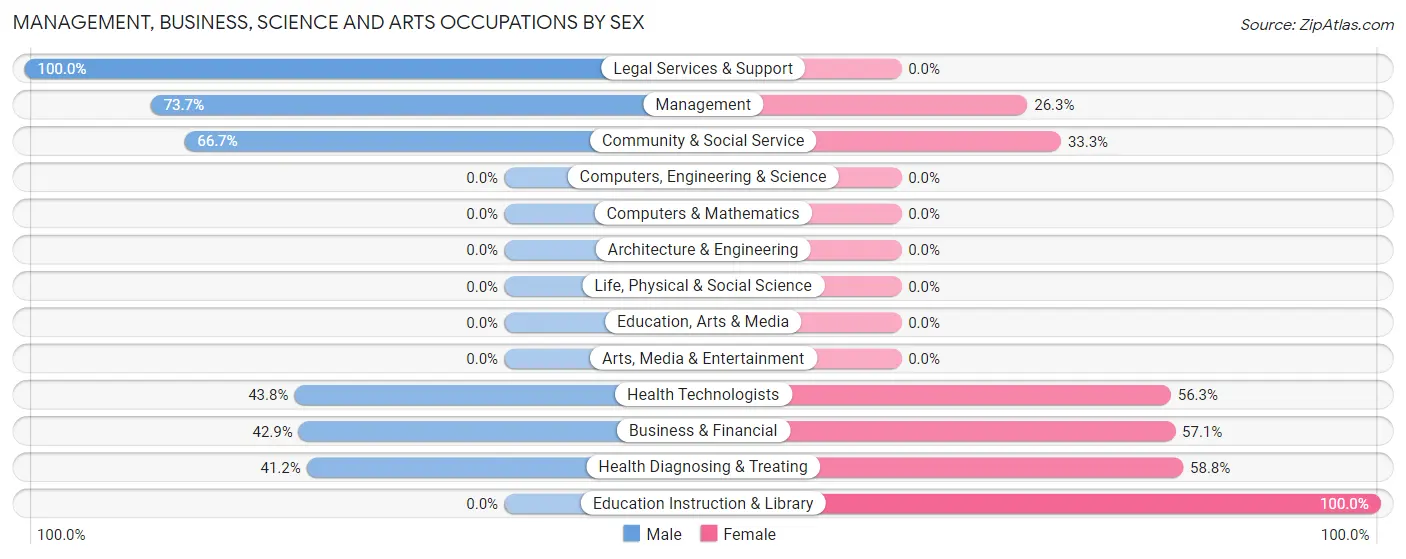
Management, Business, Science and Arts Occupations by Sex
Within the Management, Business, Science and Arts occupations in Arapaho, the most male-oriented occupations are Legal Services & Support (100.0%), Management (73.7%), and Community & Social Service (66.7%), while the most female-oriented occupations are Education Instruction & Library (100.0%), Health Diagnosing & Treating (58.8%), and Business & Financial (57.1%).
| Occupation | Male | Female |
| Management | 14 (73.7%) | 5 (26.3%) |
| Business & Financial | 3 (42.9%) | 4 (57.1%) |
| Computers, Engineering & Science | 0 (0.0%) | 0 (0.0%) |
| Computers & Mathematics | 0 (0.0%) | 0 (0.0%) |
| Architecture & Engineering | 0 (0.0%) | 0 (0.0%) |
| Life, Physical & Social Science | 0 (0.0%) | 0 (0.0%) |
| Community & Social Service | 2 (66.7%) | 1 (33.3%) |
| Education, Arts & Media | 0 (0.0%) | 0 (0.0%) |
| Legal Services & Support | 2 (100.0%) | 0 (0.0%) |
| Education Instruction & Library | 0 (0.0%) | 1 (100.0%) |
| Arts, Media & Entertainment | 0 (0.0%) | 0 (0.0%) |
| Health Diagnosing & Treating | 14 (41.2%) | 20 (58.8%) |
| Health Technologists | 7 (43.8%) | 9 (56.2%) |
| Total (Category) | 33 (52.4%) | 30 (47.6%) |
| Total (Overall) | 104 (42.1%) | 143 (57.9%) |
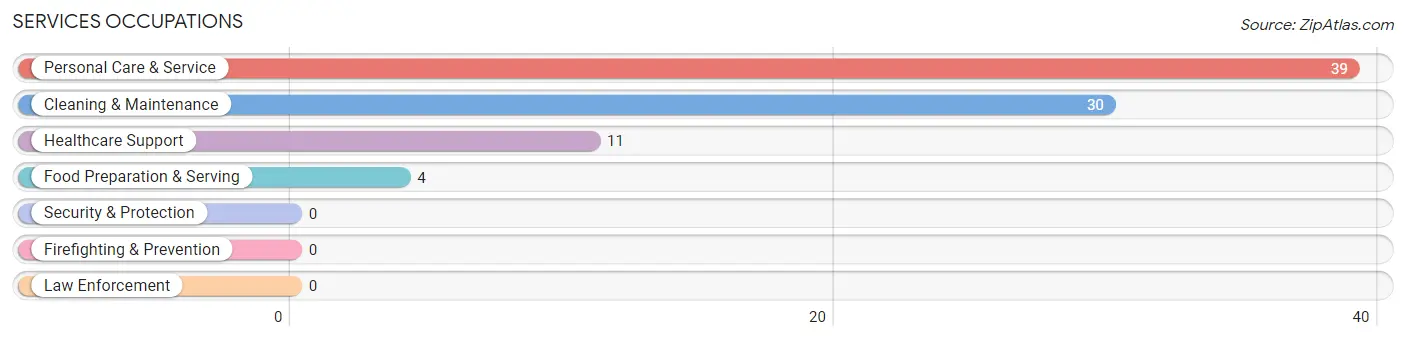
Services Occupations
The most common Services occupations in Arapaho are Personal Care & Service (39 | 15.8%), Cleaning & Maintenance (30 | 12.1%), Healthcare Support (11 | 4.4%), and Food Preparation & Serving (4 | 1.6%).
Services Occupations by Sex
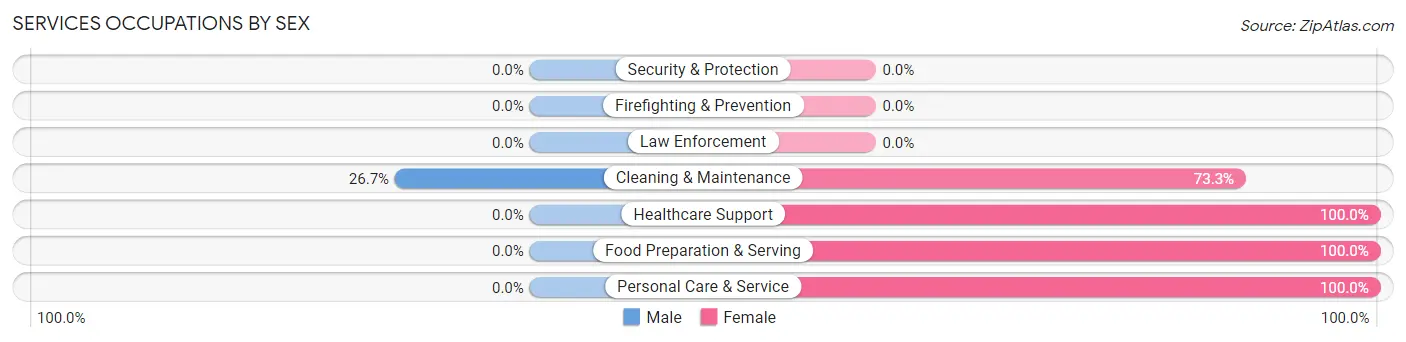
| Occupation | Male | Female |
| Healthcare Support | 0 (0.0%) | 11 (100.0%) |
| Security & Protection | 0 (0.0%) | 0 (0.0%) |
| Firefighting & Prevention | 0 (0.0%) | 0 (0.0%) |
| Law Enforcement | 0 (0.0%) | 0 (0.0%) |
| Food Preparation & Serving | 0 (0.0%) | 4 (100.0%) |
| Cleaning & Maintenance | 8 (26.7%) | 22 (73.3%) |
| Personal Care & Service | 0 (0.0%) | 39 (100.0%) |
| Total (Category) | 8 (9.5%) | 76 (90.5%) |
| Total (Overall) | 104 (42.1%) | 143 (57.9%) |
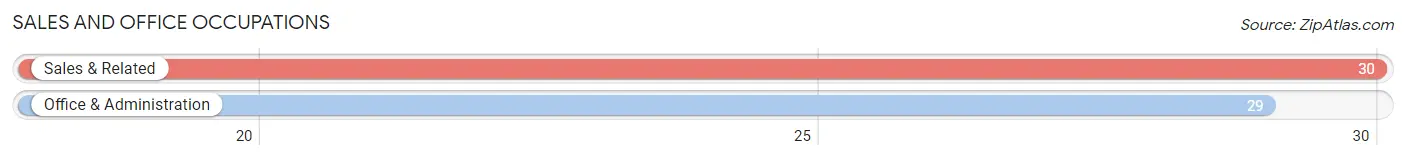
Sales and Office Occupations
The most common Sales and Office occupations in Arapaho are Sales & Related (30 | 12.1%), and Office & Administration (29 | 11.7%).
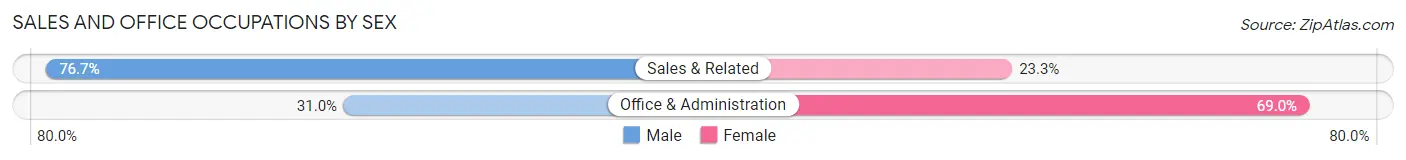
Sales and Office Occupations by Sex
| Occupation | Male | Female |
| Sales & Related | 23 (76.7%) | 7 (23.3%) |
| Office & Administration | 9 (31.0%) | 20 (69.0%) |
| Total (Category) | 32 (54.2%) | 27 (45.8%) |
| Total (Overall) | 104 (42.1%) | 143 (57.9%) |
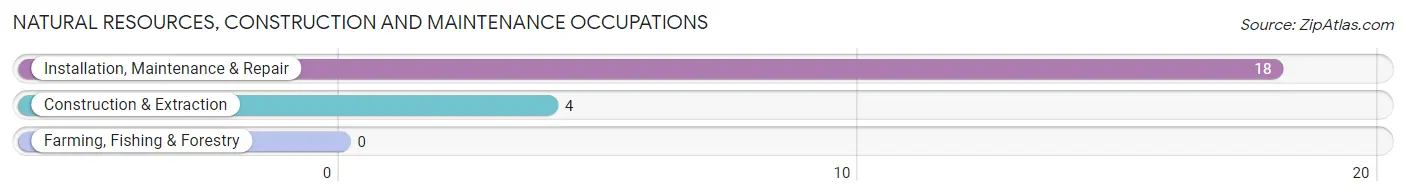
Natural Resources, Construction and Maintenance Occupations
The most common Natural Resources, Construction and Maintenance occupations in Arapaho are Installation, Maintenance & Repair (18 | 7.3%), and Construction & Extraction (4 | 1.6%).
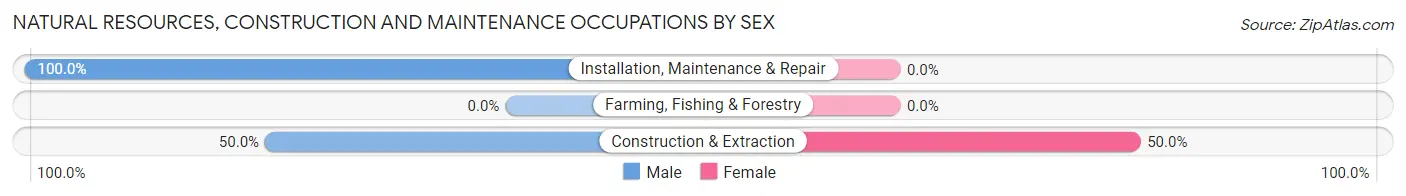
Natural Resources, Construction and Maintenance Occupations by Sex
| Occupation | Male | Female |
| Farming, Fishing & Forestry | 0 (0.0%) | 0 (0.0%) |
| Construction & Extraction | 2 (50.0%) | 2 (50.0%) |
| Installation, Maintenance & Repair | 18 (100.0%) | 0 (0.0%) |
| Total (Category) | 20 (90.9%) | 2 (9.1%) |
| Total (Overall) | 104 (42.1%) | 143 (57.9%) |
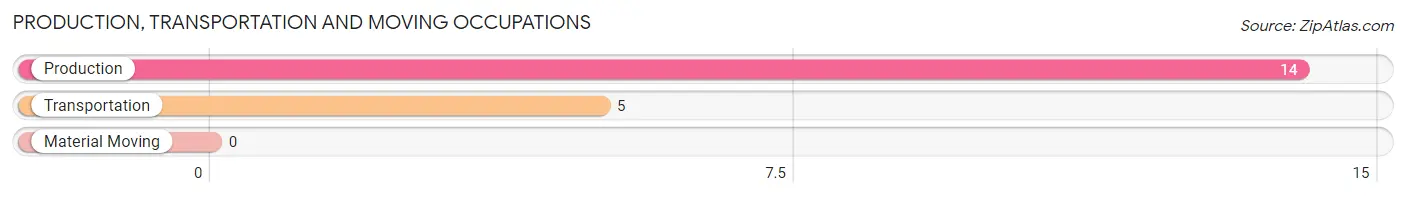
Production, Transportation and Moving Occupations
The most common Production, Transportation and Moving occupations in Arapaho are Production (14 | 5.7%), and Transportation (5 | 2.0%).
Production, Transportation and Moving Occupations by Sex
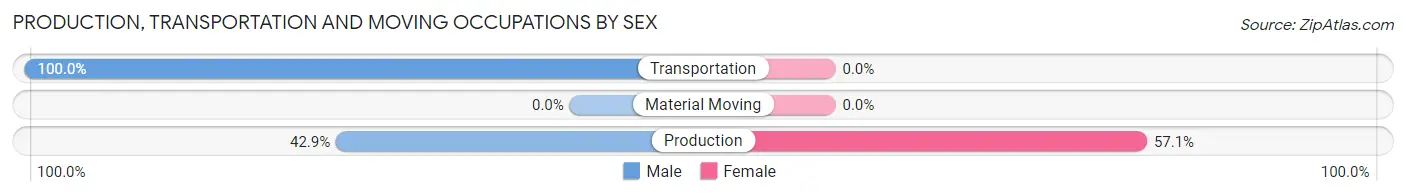
| Occupation | Male | Female |
| Production | 6 (42.9%) | 8 (57.1%) |
| Transportation | 5 (100.0%) | 0 (0.0%) |
| Material Moving | 0 (0.0%) | 0 (0.0%) |
| Total (Category) | 11 (57.9%) | 8 (42.1%) |
| Total (Overall) | 104 (42.1%) | 143 (57.9%) |
Employment Industries by Sex in Arapaho
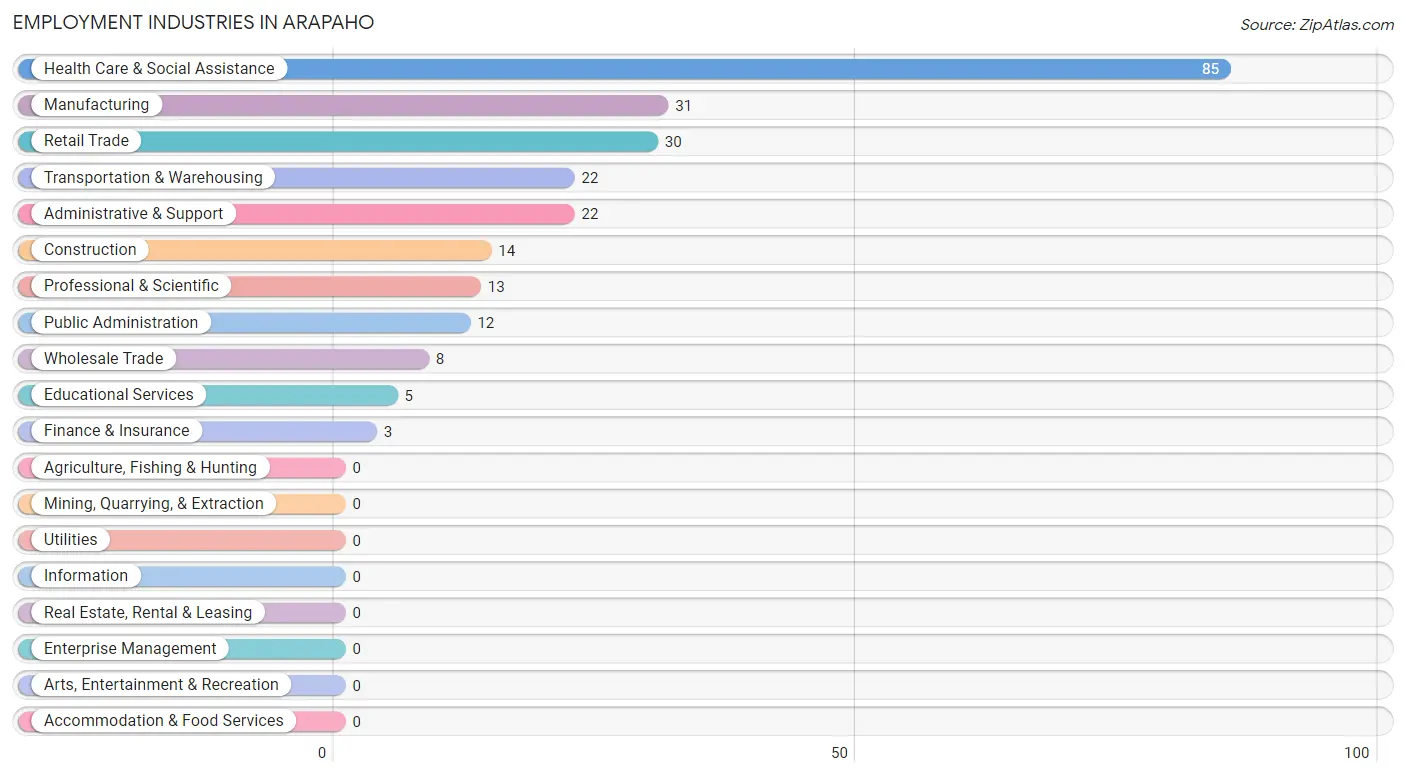
Employment Industries in Arapaho
The major employment industries in Arapaho include Health Care & Social Assistance (85 | 34.4%), Manufacturing (31 | 12.6%), Retail Trade (30 | 12.1%), Transportation & Warehousing (22 | 8.9%), and Administrative & Support (22 | 8.9%).
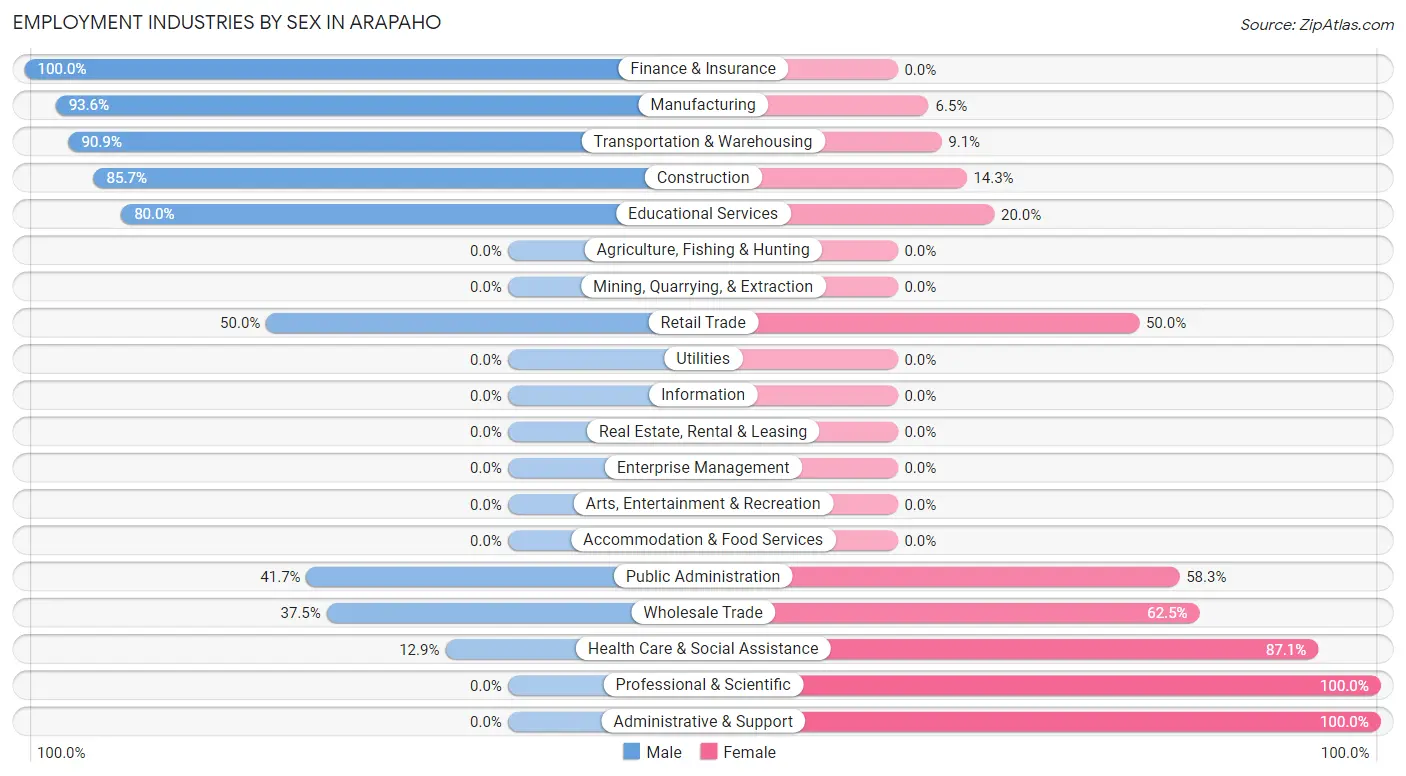
Employment Industries by Sex in Arapaho
The Arapaho industries that see more men than women are Finance & Insurance (100.0%), Manufacturing (93.5%), and Transportation & Warehousing (90.9%), whereas the industries that tend to have a higher number of women are Professional & Scientific (100.0%), Administrative & Support (100.0%), and Health Care & Social Assistance (87.1%).
| Industry | Male | Female |
| Agriculture, Fishing & Hunting | 0 (0.0%) | 0 (0.0%) |
| Mining, Quarrying, & Extraction | 0 (0.0%) | 0 (0.0%) |
| Construction | 12 (85.7%) | 2 (14.3%) |
| Manufacturing | 29 (93.5%) | 2 (6.5%) |
| Wholesale Trade | 3 (37.5%) | 5 (62.5%) |
| Retail Trade | 15 (50.0%) | 15 (50.0%) |
| Transportation & Warehousing | 20 (90.9%) | 2 (9.1%) |
| Utilities | 0 (0.0%) | 0 (0.0%) |
| Information | 0 (0.0%) | 0 (0.0%) |
| Finance & Insurance | 3 (100.0%) | 0 (0.0%) |
| Real Estate, Rental & Leasing | 0 (0.0%) | 0 (0.0%) |
| Professional & Scientific | 0 (0.0%) | 13 (100.0%) |
| Enterprise Management | 0 (0.0%) | 0 (0.0%) |
| Administrative & Support | 0 (0.0%) | 22 (100.0%) |
| Educational Services | 4 (80.0%) | 1 (20.0%) |
| Health Care & Social Assistance | 11 (12.9%) | 74 (87.1%) |
| Arts, Entertainment & Recreation | 0 (0.0%) | 0 (0.0%) |
| Accommodation & Food Services | 0 (0.0%) | 0 (0.0%) |
| Public Administration | 5 (41.7%) | 7 (58.3%) |
| Total | 104 (42.1%) | 143 (57.9%) |
Education in Arapaho
School Enrollment in Arapaho
The most common levels of schooling among the 123 students in Arapaho are elementary school (58 | 47.1%), nursery / preschool (20 | 16.3%), and kindergarten (15 | 12.2%).
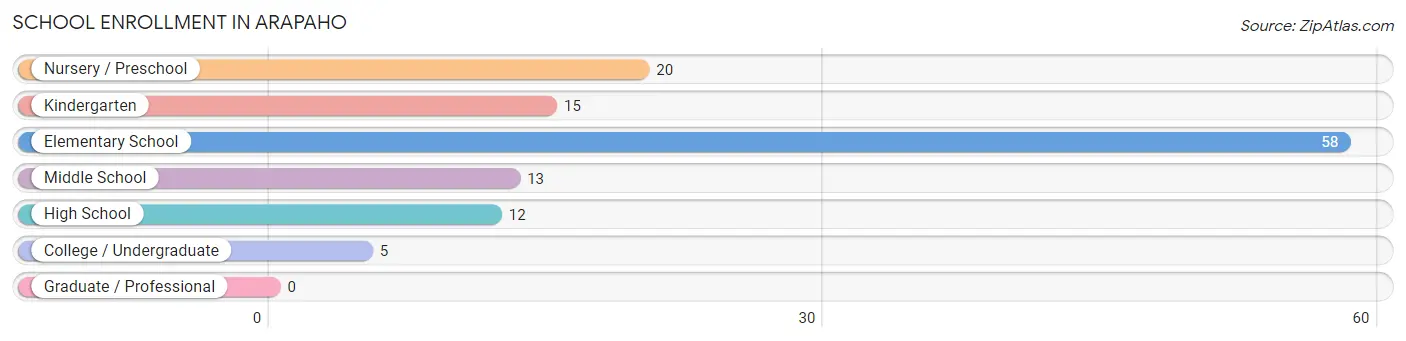
| School Level | # Students | % Students |
| Nursery / Preschool | 20 | 16.3% |
| Kindergarten | 15 | 12.2% |
| Elementary School | 58 | 47.1% |
| Middle School | 13 | 10.6% |
| High School | 12 | 9.8% |
| College / Undergraduate | 5 | 4.1% |
| Graduate / Professional | 0 | 0.0% |
| Total | 123 | 100.0% |
School Enrollment by Age by Funding Source in Arapaho
Out of a total of 123 students who are enrolled in schools in Arapaho, 2 (1.6%) attend a private institution, while the remaining 121 (98.4%) are enrolled in public schools. The age group of 15 to 17 year olds has the highest likelihood of being enrolled in private schools, with 2 (40.0% in the age bracket) enrolled. Conversely, the age group of 3 to 4 year olds has the lowest likelihood of being enrolled in a private school, with 12 (100.0% in the age bracket) attending a public institution.
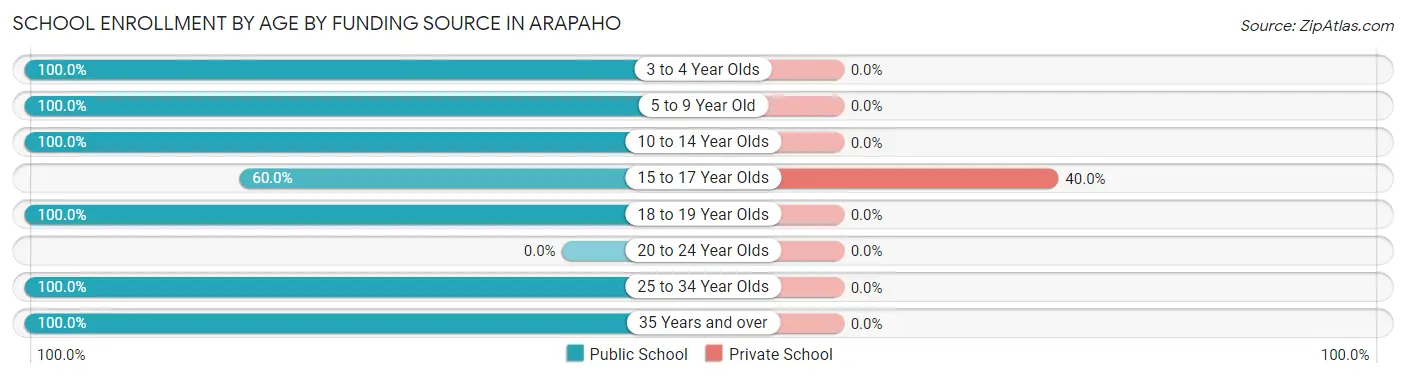
| Age Bracket | Public School | Private School |
| 3 to 4 Year Olds | 12 (100.0%) | 0 (0.0%) |
| 5 to 9 Year Old | 61 (100.0%) | 0 (0.0%) |
| 10 to 14 Year Olds | 36 (100.0%) | 0 (0.0%) |
| 15 to 17 Year Olds | 3 (60.0%) | 2 (40.0%) |
| 18 to 19 Year Olds | 4 (100.0%) | 0 (0.0%) |
| 20 to 24 Year Olds | 0 (0.0%) | 0 (0.0%) |
| 25 to 34 Year Olds | 3 (100.0%) | 0 (0.0%) |
| 35 Years and over | 2 (100.0%) | 0 (0.0%) |
| Total | 121 (98.4%) | 2 (1.6%) |
Educational Attainment by Field of Study in Arapaho
Science & technology (9 | 29.0%), psychology (8 | 25.8%), business (8 | 25.8%), arts & humanities (4 | 12.9%), and social sciences (2 | 6.5%) are the most common fields of study among 31 individuals in Arapaho who have obtained a bachelor's degree or higher.
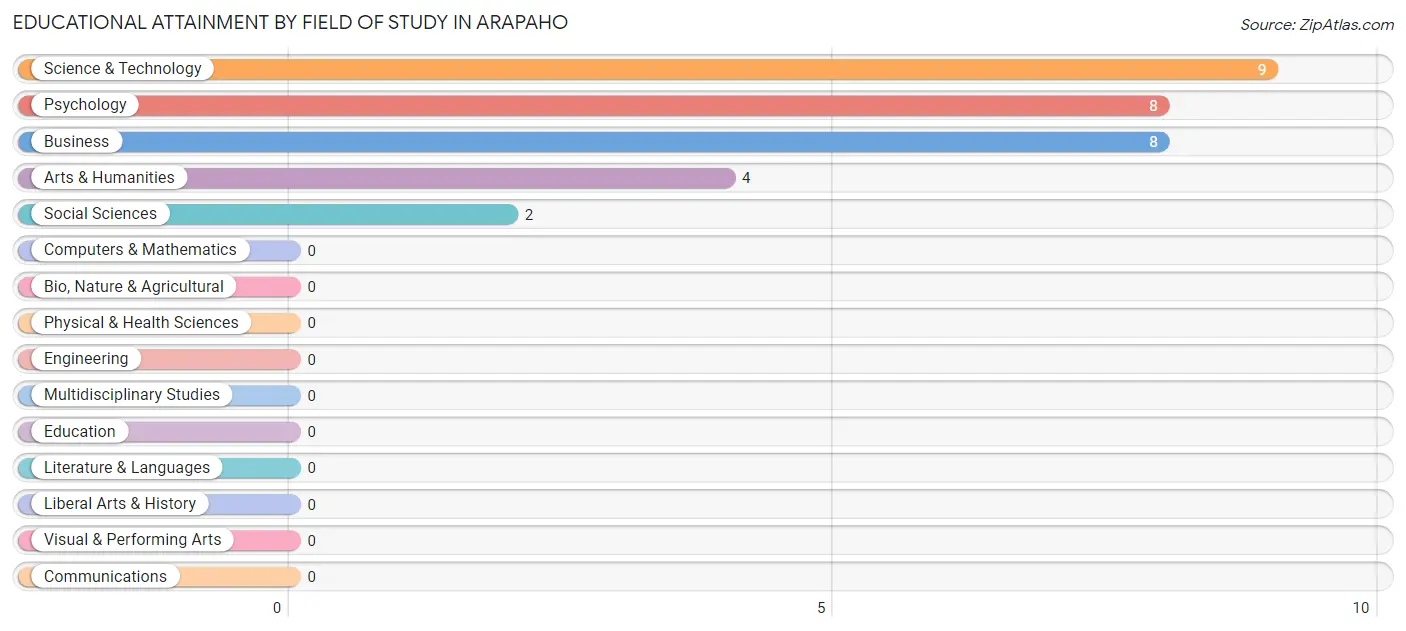
| Field of Study | # Graduates | % Graduates |
| Computers & Mathematics | 0 | 0.0% |
| Bio, Nature & Agricultural | 0 | 0.0% |
| Physical & Health Sciences | 0 | 0.0% |
| Psychology | 8 | 25.8% |
| Social Sciences | 2 | 6.5% |
| Engineering | 0 | 0.0% |
| Multidisciplinary Studies | 0 | 0.0% |
| Science & Technology | 9 | 29.0% |
| Business | 8 | 25.8% |
| Education | 0 | 0.0% |
| Literature & Languages | 0 | 0.0% |
| Liberal Arts & History | 0 | 0.0% |
| Visual & Performing Arts | 0 | 0.0% |
| Communications | 0 | 0.0% |
| Arts & Humanities | 4 | 12.9% |
| Total | 31 | 100.0% |
Transportation & Commute in Arapaho
Vehicle Availability by Sex in Arapaho
The most prevalent vehicle ownership categories in Arapaho are males with 2 vehicles (44, accounting for 42.3%) and females with 2 vehicles (33, making up 30.8%).
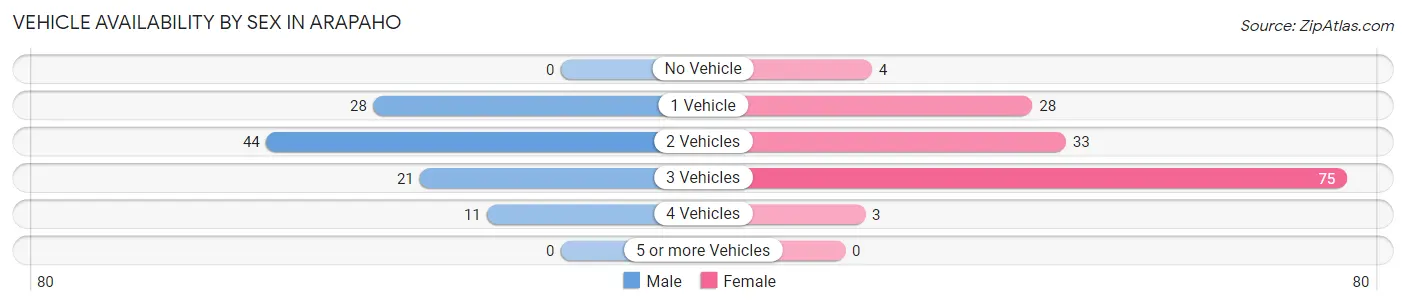
| Vehicles Available | Male | Female |
| No Vehicle | 0 (0.0%) | 4 (2.8%) |
| 1 Vehicle | 28 (26.9%) | 28 (19.6%) |
| 2 Vehicles | 44 (42.3%) | 33 (23.1%) |
| 3 Vehicles | 21 (20.2%) | 75 (52.4%) |
| 4 Vehicles | 11 (10.6%) | 3 (2.1%) |
| 5 or more Vehicles | 0 (0.0%) | 0 (0.0%) |
| Total | 104 (100.0%) | 143 (100.0%) |
Commute Time in Arapaho
The most frequently occuring commute durations in Arapaho are 5 to 9 minutes (82 commuters, 39.4%), 10 to 14 minutes (41 commuters, 19.7%), and 60 to 89 minutes (18 commuters, 8.6%).
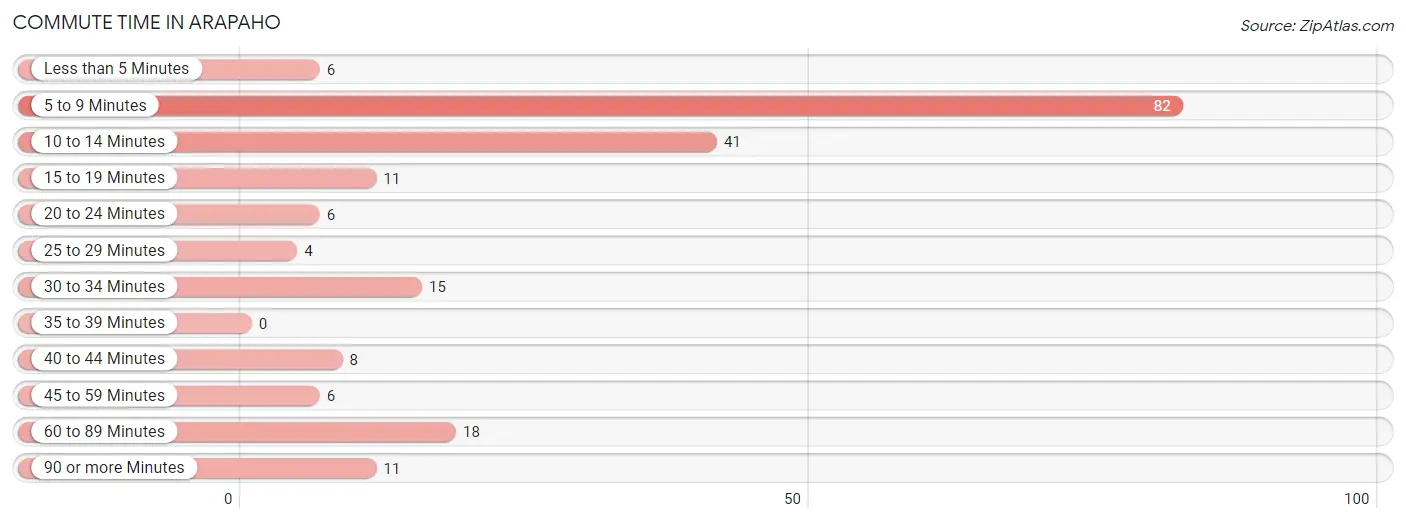
| Commute Time | # Commuters | % Commuters |
| Less than 5 Minutes | 6 | 2.9% |
| 5 to 9 Minutes | 82 | 39.4% |
| 10 to 14 Minutes | 41 | 19.7% |
| 15 to 19 Minutes | 11 | 5.3% |
| 20 to 24 Minutes | 6 | 2.9% |
| 25 to 29 Minutes | 4 | 1.9% |
| 30 to 34 Minutes | 15 | 7.2% |
| 35 to 39 Minutes | 0 | 0.0% |
| 40 to 44 Minutes | 8 | 3.8% |
| 45 to 59 Minutes | 6 | 2.9% |
| 60 to 89 Minutes | 18 | 8.6% |
| 90 or more Minutes | 11 | 5.3% |
Commute Time by Sex in Arapaho
The most common commute times in Arapaho are 5 to 9 minutes (29 commuters, 27.9%) for males and 5 to 9 minutes (53 commuters, 51.0%) for females.
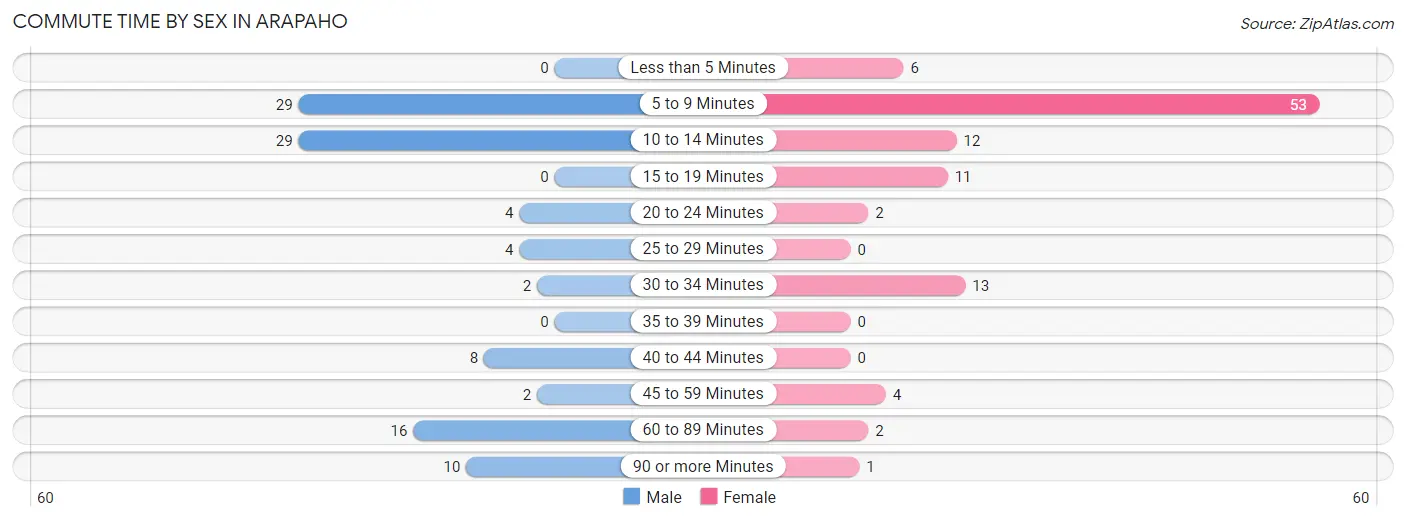
| Commute Time | Male | Female |
| Less than 5 Minutes | 0 (0.0%) | 6 (5.8%) |
| 5 to 9 Minutes | 29 (27.9%) | 53 (51.0%) |
| 10 to 14 Minutes | 29 (27.9%) | 12 (11.5%) |
| 15 to 19 Minutes | 0 (0.0%) | 11 (10.6%) |
| 20 to 24 Minutes | 4 (3.8%) | 2 (1.9%) |
| 25 to 29 Minutes | 4 (3.8%) | 0 (0.0%) |
| 30 to 34 Minutes | 2 (1.9%) | 13 (12.5%) |
| 35 to 39 Minutes | 0 (0.0%) | 0 (0.0%) |
| 40 to 44 Minutes | 8 (7.7%) | 0 (0.0%) |
| 45 to 59 Minutes | 2 (1.9%) | 4 (3.8%) |
| 60 to 89 Minutes | 16 (15.4%) | 2 (1.9%) |
| 90 or more Minutes | 10 (9.6%) | 1 (1.0%) |
Time of Departure to Work by Sex in Arapaho
The most frequent times of departure to work in Arapaho are 7:30 AM to 7:59 AM (18, 17.3%) for males and 9:00 AM to 9:59 AM (24, 23.1%) for females.
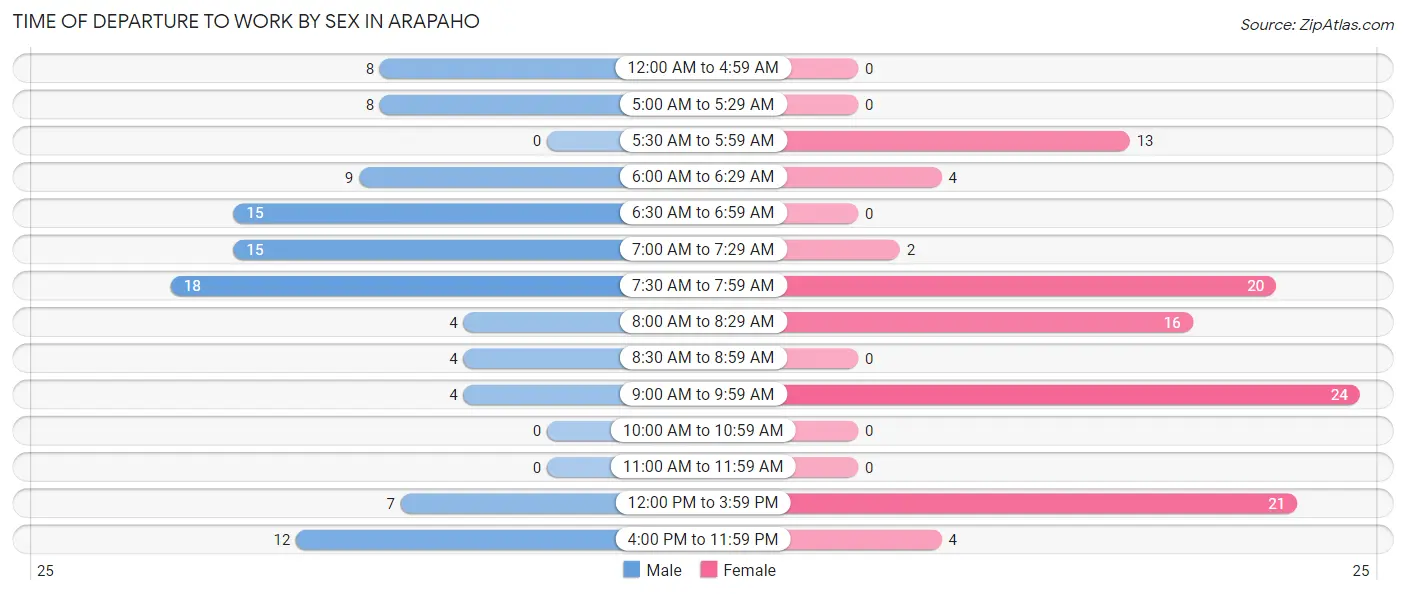
| Time of Departure | Male | Female |
| 12:00 AM to 4:59 AM | 8 (7.7%) | 0 (0.0%) |
| 5:00 AM to 5:29 AM | 8 (7.7%) | 0 (0.0%) |
| 5:30 AM to 5:59 AM | 0 (0.0%) | 13 (12.5%) |
| 6:00 AM to 6:29 AM | 9 (8.6%) | 4 (3.8%) |
| 6:30 AM to 6:59 AM | 15 (14.4%) | 0 (0.0%) |
| 7:00 AM to 7:29 AM | 15 (14.4%) | 2 (1.9%) |
| 7:30 AM to 7:59 AM | 18 (17.3%) | 20 (19.2%) |
| 8:00 AM to 8:29 AM | 4 (3.8%) | 16 (15.4%) |
| 8:30 AM to 8:59 AM | 4 (3.8%) | 0 (0.0%) |
| 9:00 AM to 9:59 AM | 4 (3.8%) | 24 (23.1%) |
| 10:00 AM to 10:59 AM | 0 (0.0%) | 0 (0.0%) |
| 11:00 AM to 11:59 AM | 0 (0.0%) | 0 (0.0%) |
| 12:00 PM to 3:59 PM | 7 (6.7%) | 21 (20.2%) |
| 4:00 PM to 11:59 PM | 12 (11.5%) | 4 (3.8%) |
| Total | 104 (100.0%) | 104 (100.0%) |
Housing Occupancy in Arapaho
Occupancy by Ownership in Arapaho
Of the total 225 dwellings in Arapaho, owner-occupied units account for 164 (72.9%), while renter-occupied units make up 61 (27.1%).
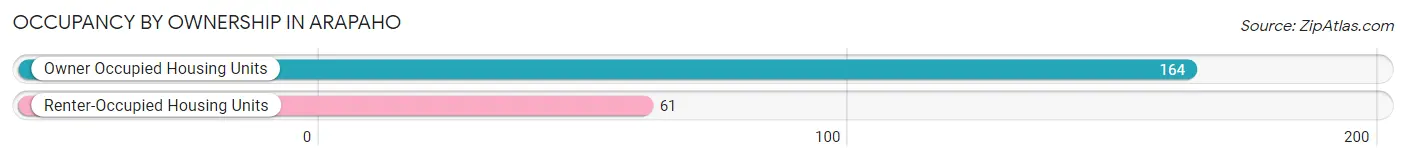
| Occupancy | # Housing Units | % Housing Units |
| Owner Occupied Housing Units | 164 | 72.9% |
| Renter-Occupied Housing Units | 61 | 27.1% |
| Total Occupied Housing Units | 225 | 100.0% |
Occupancy by Household Size in Arapaho
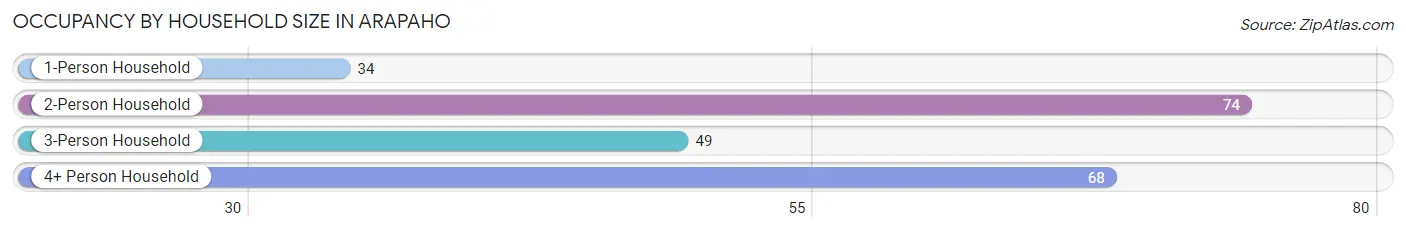
| Household Size | # Housing Units | % Housing Units |
| 1-Person Household | 34 | 15.1% |
| 2-Person Household | 74 | 32.9% |
| 3-Person Household | 49 | 21.8% |
| 4+ Person Household | 68 | 30.2% |
| Total Housing Units | 225 | 100.0% |
Occupancy by Ownership by Household Size in Arapaho
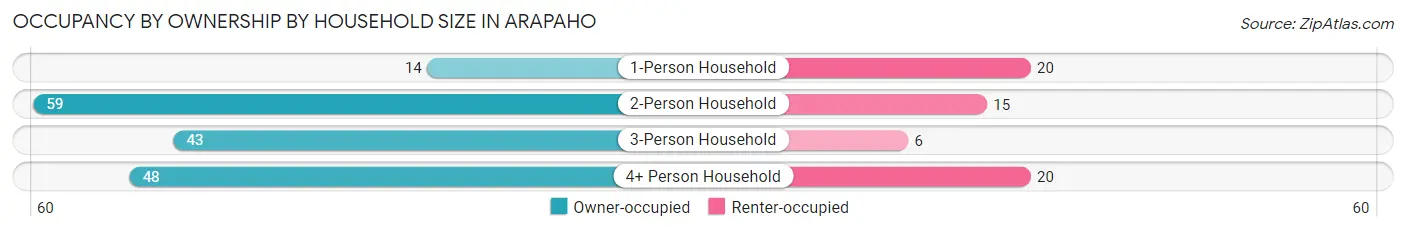
| Household Size | Owner-occupied | Renter-occupied |
| 1-Person Household | 14 (41.2%) | 20 (58.8%) |
| 2-Person Household | 59 (79.7%) | 15 (20.3%) |
| 3-Person Household | 43 (87.8%) | 6 (12.2%) |
| 4+ Person Household | 48 (70.6%) | 20 (29.4%) |
| Total Housing Units | 164 (72.9%) | 61 (27.1%) |
Occupancy by Educational Attainment in Arapaho
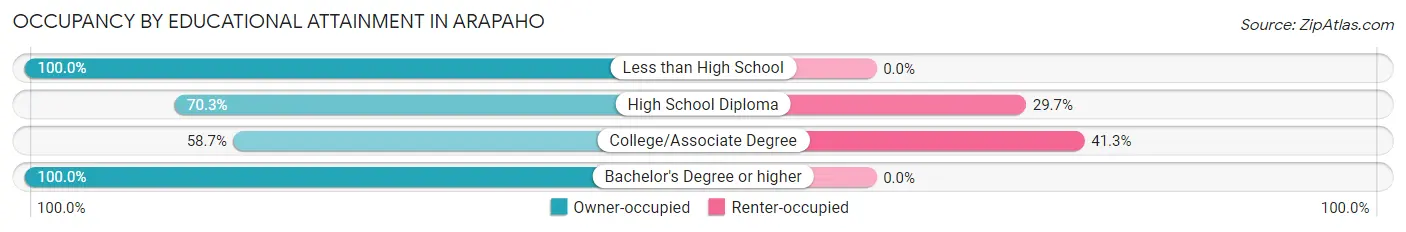
| Household Size | Owner-occupied | Renter-occupied |
| Less than High School | 23 (100.0%) | 0 (0.0%) |
| High School Diploma | 83 (70.3%) | 35 (29.7%) |
| College/Associate Degree | 37 (58.7%) | 26 (41.3%) |
| Bachelor's Degree or higher | 21 (100.0%) | 0 (0.0%) |
Occupancy by Age of Householder in Arapaho
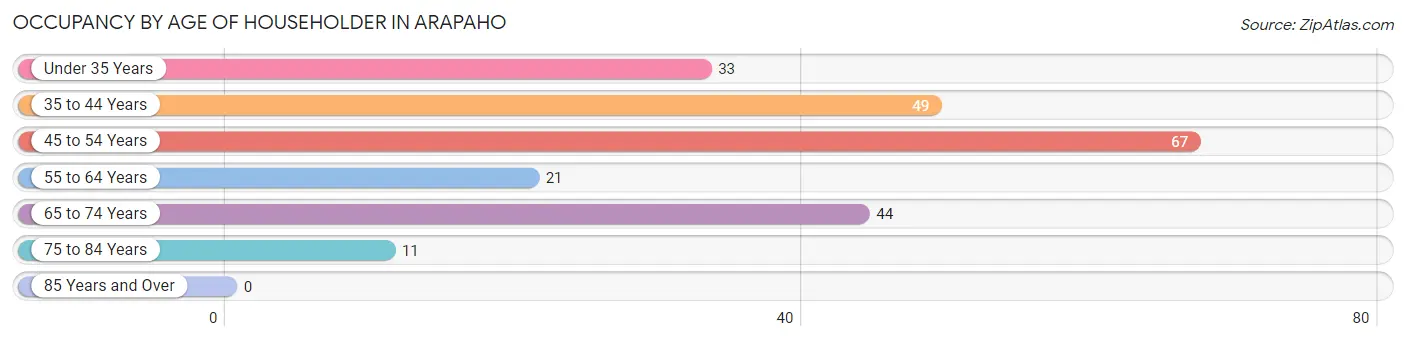
| Age Bracket | # Households | % Households |
| Under 35 Years | 33 | 14.7% |
| 35 to 44 Years | 49 | 21.8% |
| 45 to 54 Years | 67 | 29.8% |
| 55 to 64 Years | 21 | 9.3% |
| 65 to 74 Years | 44 | 19.6% |
| 75 to 84 Years | 11 | 4.9% |
| 85 Years and Over | 0 | 0.0% |
| Total | 225 | 100.0% |
Housing Finances in Arapaho
Median Income by Occupancy in Arapaho
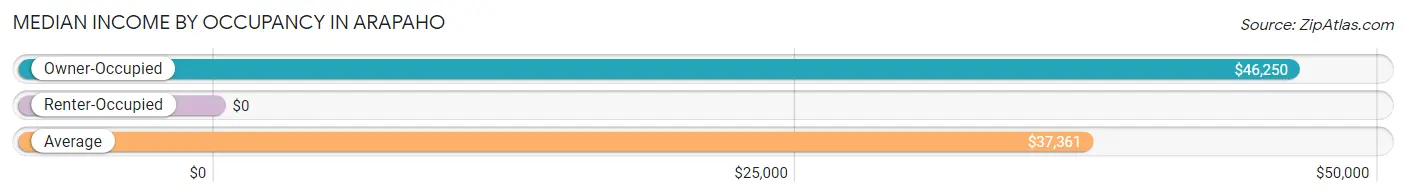
| Occupancy Type | # Households | Median Income |
| Owner-Occupied | 164 (72.9%) | $46,250 |
| Renter-Occupied | 61 (27.1%) | $0 |
| Average | 225 (100.0%) | $37,361 |
Occupancy by Householder Income Bracket in Arapaho
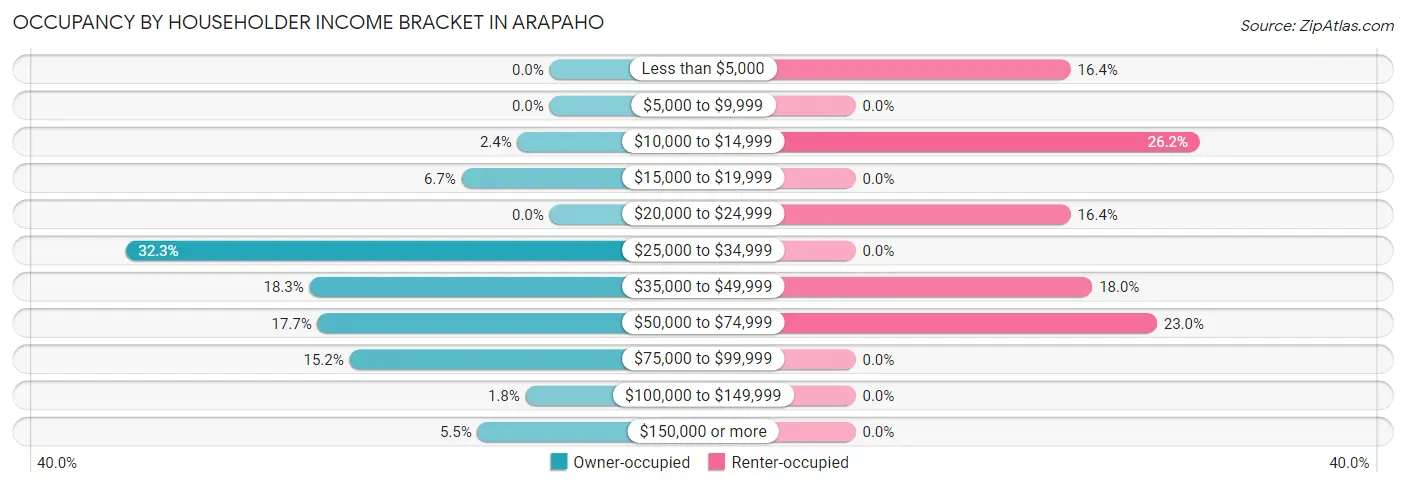
| Income Bracket | Owner-occupied | Renter-occupied |
| Less than $5,000 | 0 (0.0%) | 10 (16.4%) |
| $5,000 to $9,999 | 0 (0.0%) | 0 (0.0%) |
| $10,000 to $14,999 | 4 (2.4%) | 16 (26.2%) |
| $15,000 to $19,999 | 11 (6.7%) | 0 (0.0%) |
| $20,000 to $24,999 | 0 (0.0%) | 10 (16.4%) |
| $25,000 to $34,999 | 53 (32.3%) | 0 (0.0%) |
| $35,000 to $49,999 | 30 (18.3%) | 11 (18.0%) |
| $50,000 to $74,999 | 29 (17.7%) | 14 (23.0%) |
| $75,000 to $99,999 | 25 (15.2%) | 0 (0.0%) |
| $100,000 to $149,999 | 3 (1.8%) | 0 (0.0%) |
| $150,000 or more | 9 (5.5%) | 0 (0.0%) |
| Total | 164 (100.0%) | 61 (100.0%) |
Monthly Housing Cost Tiers in Arapaho
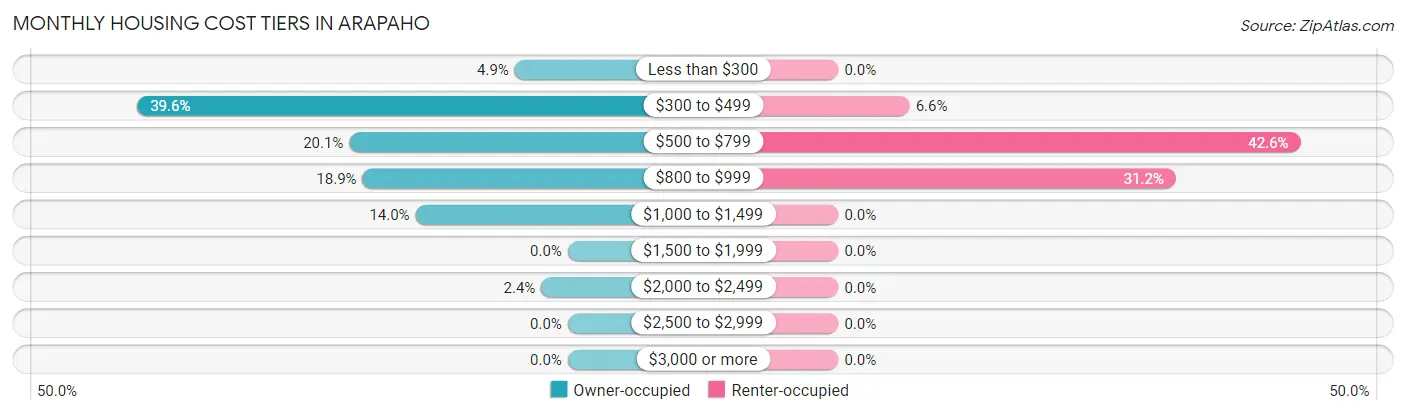
| Monthly Cost | Owner-occupied | Renter-occupied |
| Less than $300 | 8 (4.9%) | 0 (0.0%) |
| $300 to $499 | 65 (39.6%) | 4 (6.6%) |
| $500 to $799 | 33 (20.1%) | 26 (42.6%) |
| $800 to $999 | 31 (18.9%) | 19 (31.1%) |
| $1,000 to $1,499 | 23 (14.0%) | 0 (0.0%) |
| $1,500 to $1,999 | 0 (0.0%) | 0 (0.0%) |
| $2,000 to $2,499 | 4 (2.4%) | 0 (0.0%) |
| $2,500 to $2,999 | 0 (0.0%) | 0 (0.0%) |
| $3,000 or more | 0 (0.0%) | 0 (0.0%) |
| Total | 164 (100.0%) | 61 (100.0%) |
Physical Housing Characteristics in Arapaho
Housing Structures in Arapaho
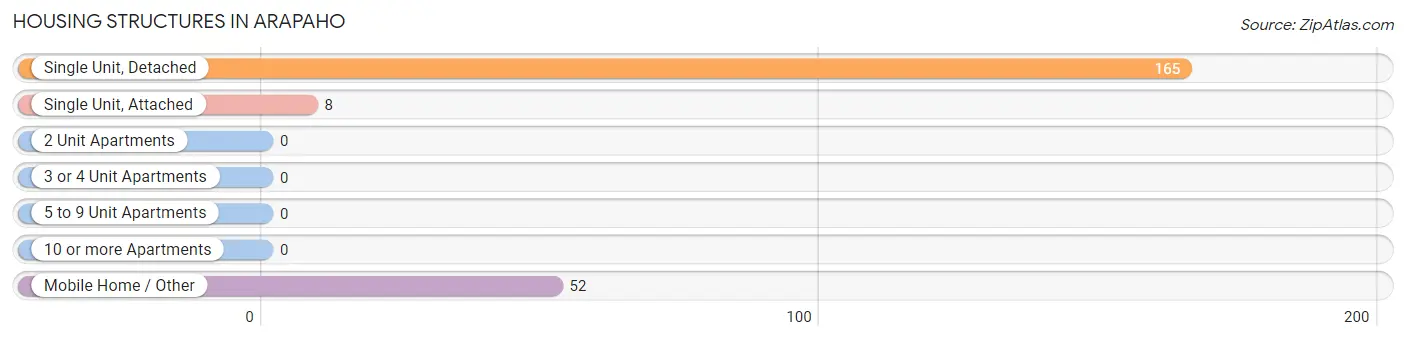
| Structure Type | # Housing Units | % Housing Units |
| Single Unit, Detached | 165 | 73.3% |
| Single Unit, Attached | 8 | 3.6% |
| 2 Unit Apartments | 0 | 0.0% |
| 3 or 4 Unit Apartments | 0 | 0.0% |
| 5 to 9 Unit Apartments | 0 | 0.0% |
| 10 or more Apartments | 0 | 0.0% |
| Mobile Home / Other | 52 | 23.1% |
| Total | 225 | 100.0% |
Housing Structures by Occupancy in Arapaho
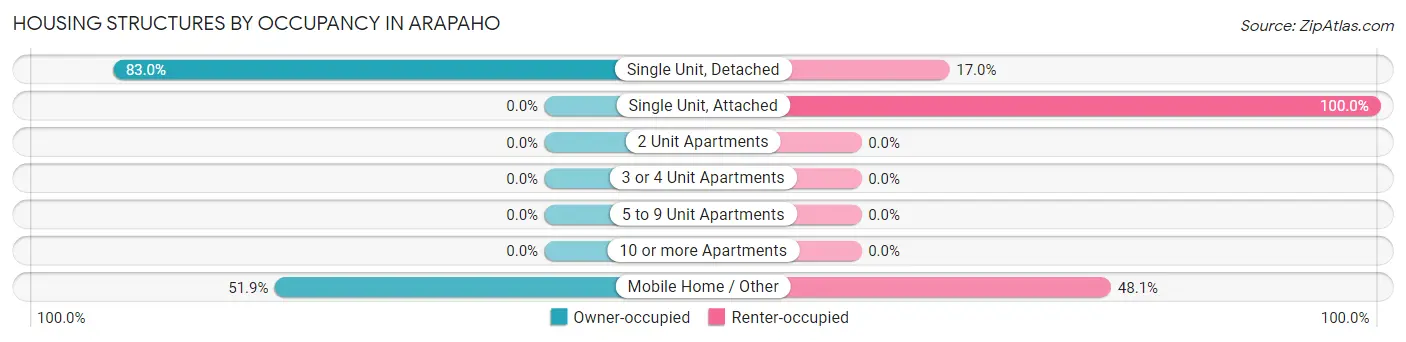
| Structure Type | Owner-occupied | Renter-occupied |
| Single Unit, Detached | 137 (83.0%) | 28 (17.0%) |
| Single Unit, Attached | 0 (0.0%) | 8 (100.0%) |
| 2 Unit Apartments | 0 (0.0%) | 0 (0.0%) |
| 3 or 4 Unit Apartments | 0 (0.0%) | 0 (0.0%) |
| 5 to 9 Unit Apartments | 0 (0.0%) | 0 (0.0%) |
| 10 or more Apartments | 0 (0.0%) | 0 (0.0%) |
| Mobile Home / Other | 27 (51.9%) | 25 (48.1%) |
| Total | 164 (72.9%) | 61 (27.1%) |
Housing Structures by Number of Rooms in Arapaho
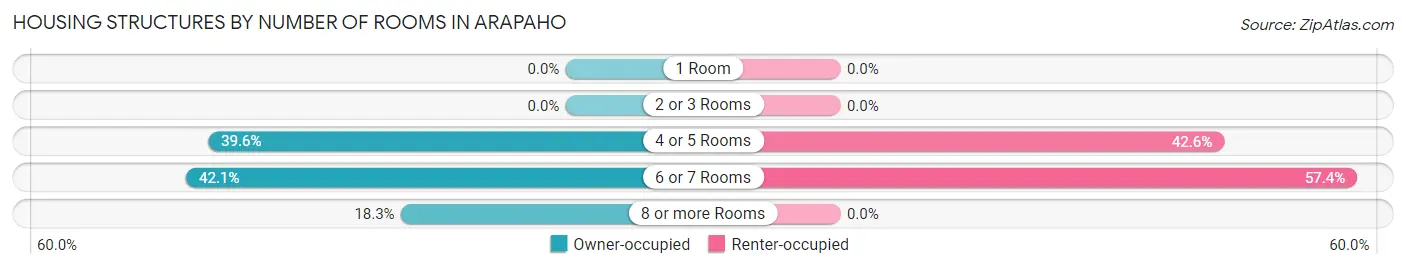
| Number of Rooms | Owner-occupied | Renter-occupied |
| 1 Room | 0 (0.0%) | 0 (0.0%) |
| 2 or 3 Rooms | 0 (0.0%) | 0 (0.0%) |
| 4 or 5 Rooms | 65 (39.6%) | 26 (42.6%) |
| 6 or 7 Rooms | 69 (42.1%) | 35 (57.4%) |
| 8 or more Rooms | 30 (18.3%) | 0 (0.0%) |
| Total | 164 (100.0%) | 61 (100.0%) |
Housing Structure by Heating Type in Arapaho
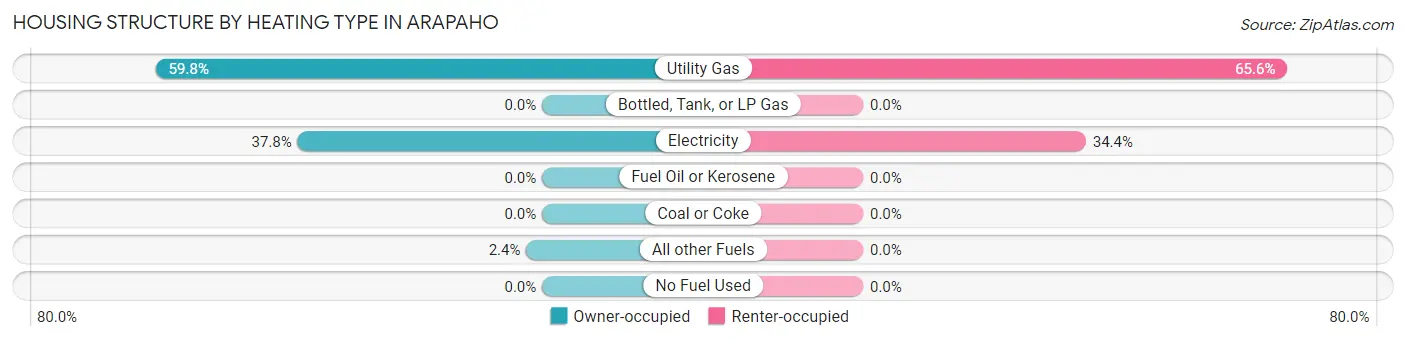
| Heating Type | Owner-occupied | Renter-occupied |
| Utility Gas | 98 (59.8%) | 40 (65.6%) |
| Bottled, Tank, or LP Gas | 0 (0.0%) | 0 (0.0%) |
| Electricity | 62 (37.8%) | 21 (34.4%) |
| Fuel Oil or Kerosene | 0 (0.0%) | 0 (0.0%) |
| Coal or Coke | 0 (0.0%) | 0 (0.0%) |
| All other Fuels | 4 (2.4%) | 0 (0.0%) |
| No Fuel Used | 0 (0.0%) | 0 (0.0%) |
| Total | 164 (100.0%) | 61 (100.0%) |
Household Vehicle Usage in Arapaho
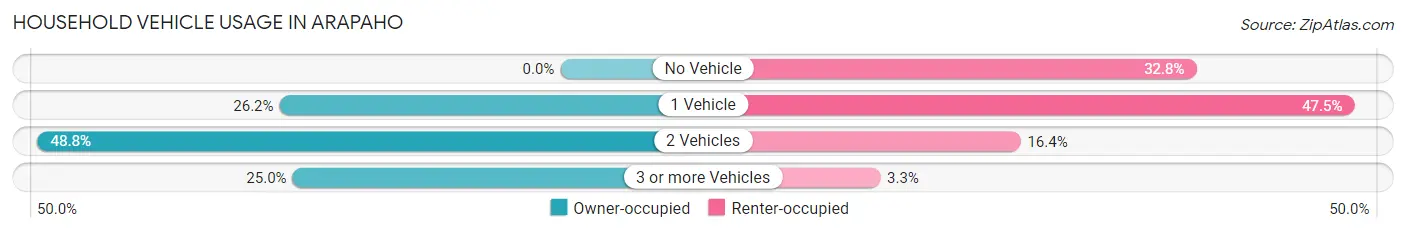
| Vehicles per Household | Owner-occupied | Renter-occupied |
| No Vehicle | 0 (0.0%) | 20 (32.8%) |
| 1 Vehicle | 43 (26.2%) | 29 (47.5%) |
| 2 Vehicles | 80 (48.8%) | 10 (16.4%) |
| 3 or more Vehicles | 41 (25.0%) | 2 (3.3%) |
| Total | 164 (100.0%) | 61 (100.0%) |
Real Estate & Mortgages in Arapaho
Real Estate and Mortgage Overview in Arapaho
| Characteristic | Without Mortgage | With Mortgage |
| Housing Units | 81 | 83 |
| Median Property Value | $130,500 | $85,000 |
| Median Household Income | $33,512 | $6 |
| Monthly Housing Costs | $402 | $0 |
| Real Estate Taxes | $385 | $0 |
Property Value by Mortgage Status in Arapaho
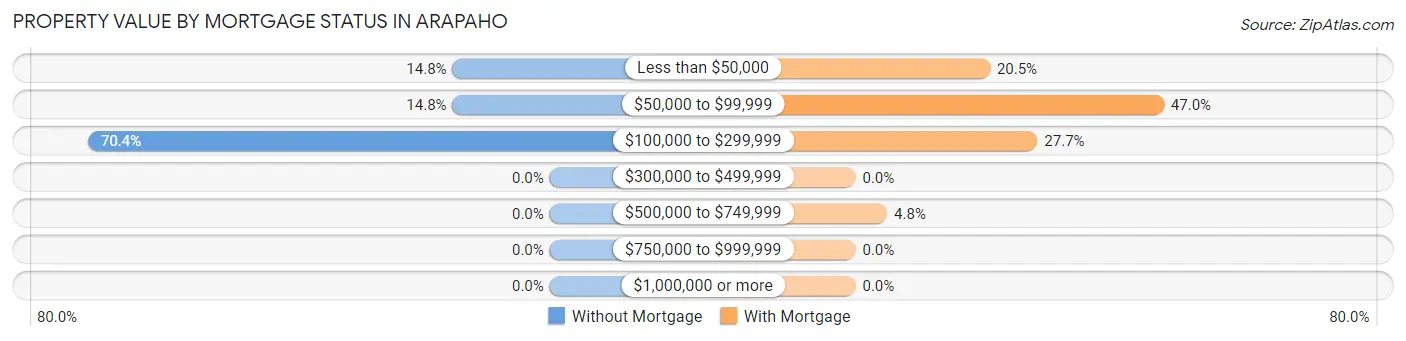
| Property Value | Without Mortgage | With Mortgage |
| Less than $50,000 | 12 (14.8%) | 17 (20.5%) |
| $50,000 to $99,999 | 12 (14.8%) | 39 (47.0%) |
| $100,000 to $299,999 | 57 (70.4%) | 23 (27.7%) |
| $300,000 to $499,999 | 0 (0.0%) | 0 (0.0%) |
| $500,000 to $749,999 | 0 (0.0%) | 4 (4.8%) |
| $750,000 to $999,999 | 0 (0.0%) | 0 (0.0%) |
| $1,000,000 or more | 0 (0.0%) | 0 (0.0%) |
| Total | 81 (100.0%) | 83 (100.0%) |
Household Income by Mortgage Status in Arapaho
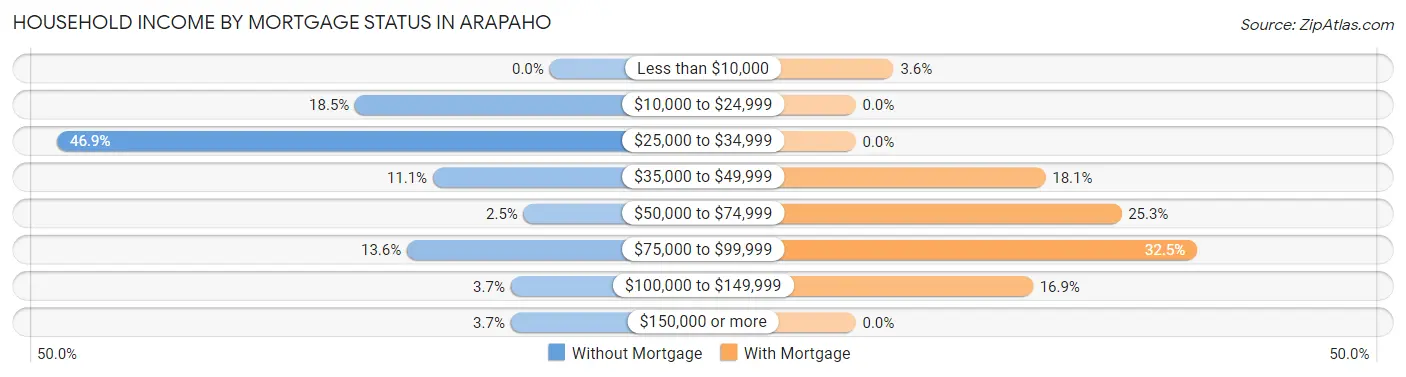
| Household Income | Without Mortgage | With Mortgage |
| Less than $10,000 | 0 (0.0%) | 3 (3.6%) |
| $10,000 to $24,999 | 15 (18.5%) | 0 (0.0%) |
| $25,000 to $34,999 | 38 (46.9%) | 0 (0.0%) |
| $35,000 to $49,999 | 9 (11.1%) | 15 (18.1%) |
| $50,000 to $74,999 | 2 (2.5%) | 21 (25.3%) |
| $75,000 to $99,999 | 11 (13.6%) | 27 (32.5%) |
| $100,000 to $149,999 | 3 (3.7%) | 14 (16.9%) |
| $150,000 or more | 3 (3.7%) | 0 (0.0%) |
| Total | 81 (100.0%) | 83 (100.0%) |
Property Value to Household Income Ratio in Arapaho
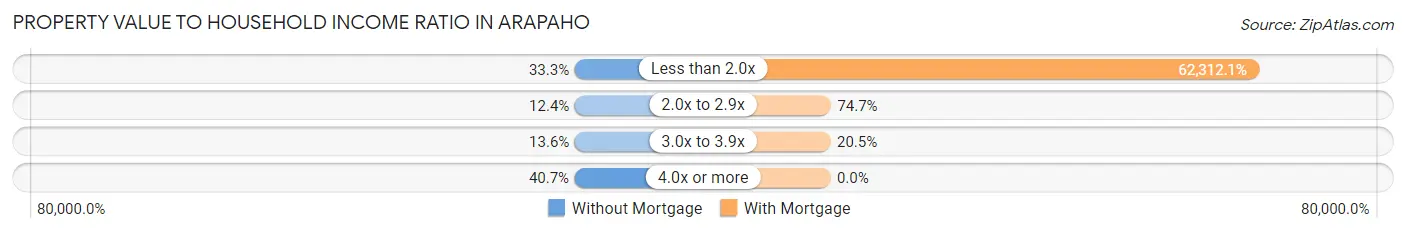
| Value-to-Income Ratio | Without Mortgage | With Mortgage |
| Less than 2.0x | 27 (33.3%) | 51,719 (62,312.0%) |
| 2.0x to 2.9x | 10 (12.3%) | 62 (74.7%) |
| 3.0x to 3.9x | 11 (13.6%) | 17 (20.5%) |
| 4.0x or more | 33 (40.7%) | 0 (0.0%) |
| Total | 81 (100.0%) | 83 (100.0%) |
Real Estate Taxes by Mortgage Status in Arapaho
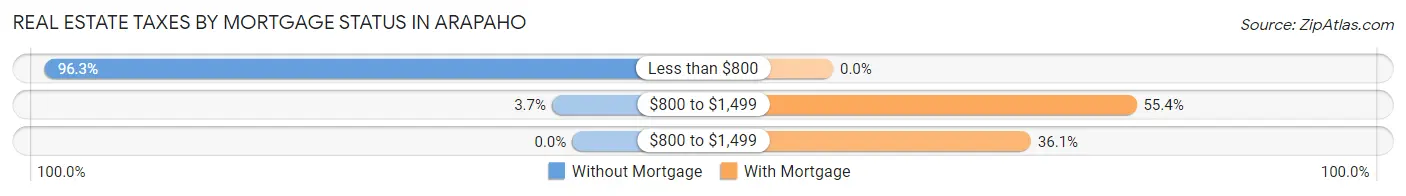
| Property Taxes | Without Mortgage | With Mortgage |
| Less than $800 | 78 (96.3%) | 0 (0.0%) |
| $800 to $1,499 | 3 (3.7%) | 46 (55.4%) |
| $800 to $1,499 | 0 (0.0%) | 30 (36.1%) |
| Total | 81 (100.0%) | 83 (100.0%) |
Health & Disability in Arapaho
Health Insurance Coverage by Age in Arapaho
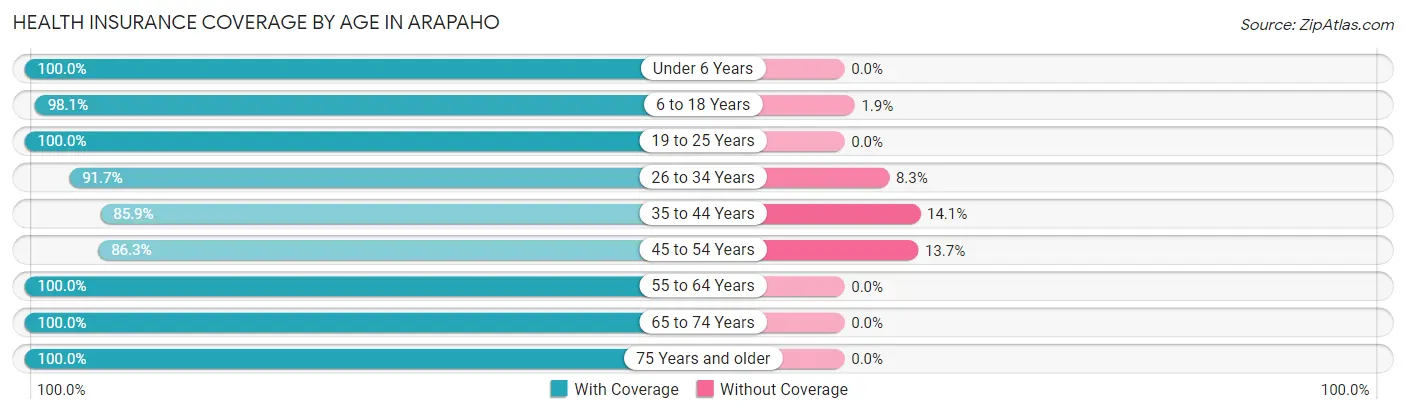
| Age Bracket | With Coverage | Without Coverage |
| Under 6 Years | 64 (100.0%) | 0 (0.0%) |
| 6 to 18 Years | 155 (98.1%) | 3 (1.9%) |
| 19 to 25 Years | 30 (100.0%) | 0 (0.0%) |
| 26 to 34 Years | 66 (91.7%) | 6 (8.3%) |
| 35 to 44 Years | 79 (85.9%) | 13 (14.1%) |
| 45 to 54 Years | 157 (86.3%) | 25 (13.7%) |
| 55 to 64 Years | 47 (100.0%) | 0 (0.0%) |
| 65 to 74 Years | 70 (100.0%) | 0 (0.0%) |
| 75 Years and older | 14 (100.0%) | 0 (0.0%) |
| Total | 682 (93.5%) | 47 (6.5%) |
Health Insurance Coverage by Citizenship Status in Arapaho
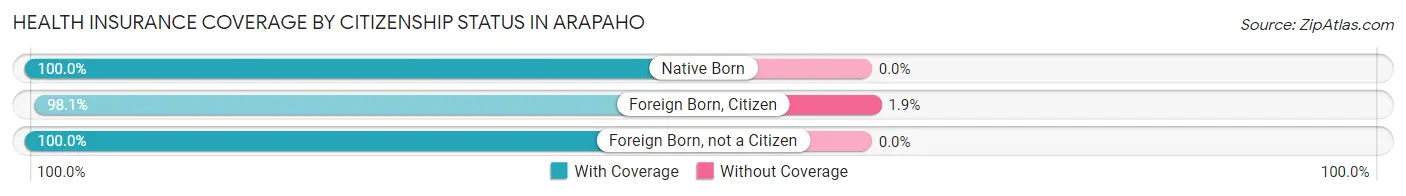
| Citizenship Status | With Coverage | Without Coverage |
| Native Born | 64 (100.0%) | 0 (0.0%) |
| Foreign Born, Citizen | 155 (98.1%) | 3 (1.9%) |
| Foreign Born, not a Citizen | 30 (100.0%) | 0 (0.0%) |
Health Insurance Coverage by Household Income in Arapaho
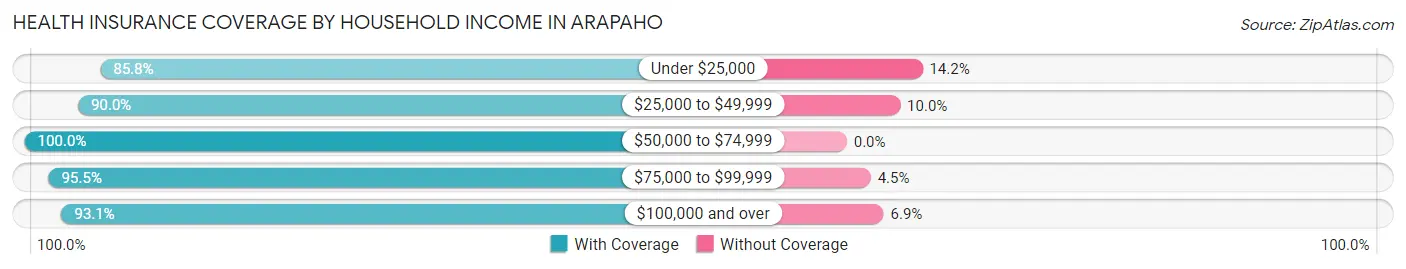
| Household Income | With Coverage | Without Coverage |
| Under $25,000 | 115 (85.8%) | 19 (14.2%) |
| $25,000 to $49,999 | 207 (90.0%) | 23 (10.0%) |
| $50,000 to $74,999 | 269 (100.0%) | 0 (0.0%) |
| $75,000 to $99,999 | 64 (95.5%) | 3 (4.5%) |
| $100,000 and over | 27 (93.1%) | 2 (6.9%) |
Public vs Private Health Insurance Coverage by Age in Arapaho
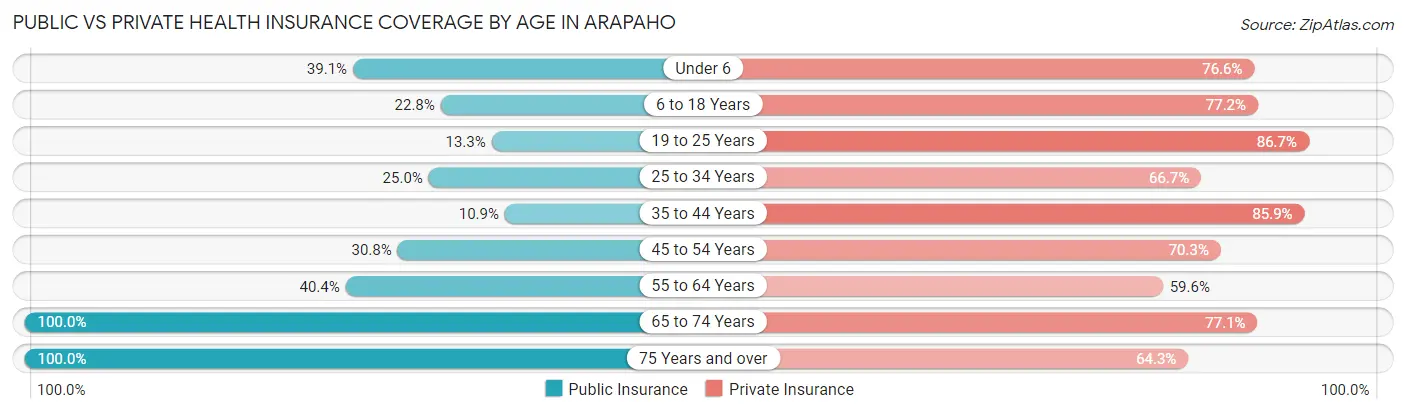
| Age Bracket | Public Insurance | Private Insurance |
| Under 6 | 25 (39.1%) | 49 (76.6%) |
| 6 to 18 Years | 36 (22.8%) | 122 (77.2%) |
| 19 to 25 Years | 4 (13.3%) | 26 (86.7%) |
| 25 to 34 Years | 18 (25.0%) | 48 (66.7%) |
| 35 to 44 Years | 10 (10.9%) | 79 (85.9%) |
| 45 to 54 Years | 56 (30.8%) | 128 (70.3%) |
| 55 to 64 Years | 19 (40.4%) | 28 (59.6%) |
| 65 to 74 Years | 70 (100.0%) | 54 (77.1%) |
| 75 Years and over | 14 (100.0%) | 9 (64.3%) |
| Total | 252 (34.6%) | 543 (74.5%) |
Disability Status by Sex by Age in Arapaho
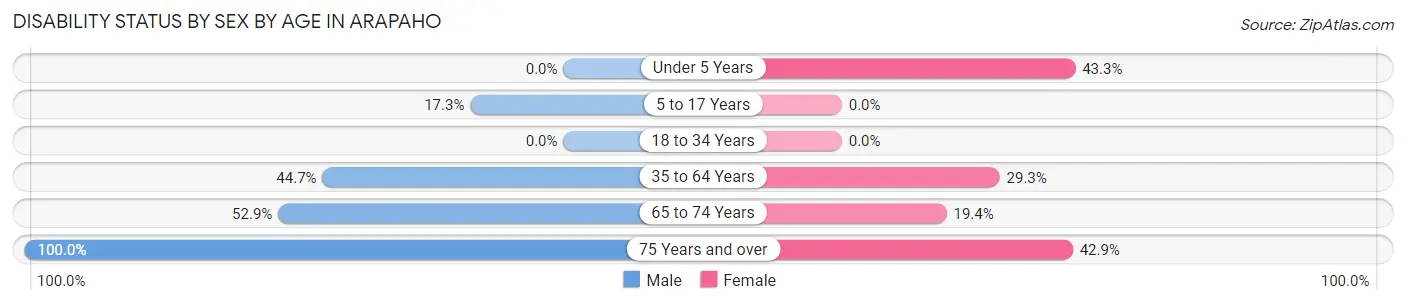
| Age Bracket | Male | Female |
| Under 5 Years | 0 (0.0%) | 13 (43.3%) |
| 5 to 17 Years | 14 (17.3%) | 0 (0.0%) |
| 18 to 34 Years | 0 (0.0%) | 0 (0.0%) |
| 35 to 64 Years | 55 (44.7%) | 58 (29.3%) |
| 65 to 74 Years | 18 (52.9%) | 7 (19.4%) |
| 75 Years and over | 7 (100.0%) | 3 (42.9%) |
Disability Class by Sex by Age in Arapaho
Disability Class: Hearing Difficulty
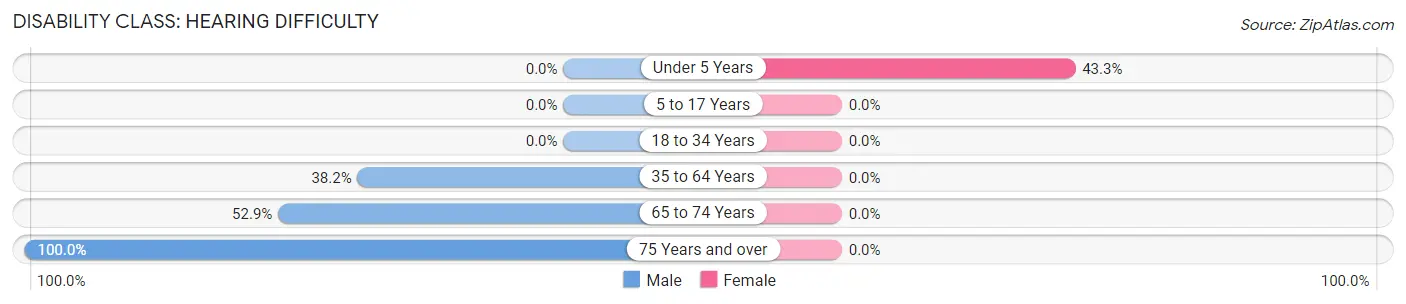
| Age Bracket | Male | Female |
| Under 5 Years | 0 (0.0%) | 13 (43.3%) |
| 5 to 17 Years | 0 (0.0%) | 0 (0.0%) |
| 18 to 34 Years | 0 (0.0%) | 0 (0.0%) |
| 35 to 64 Years | 47 (38.2%) | 0 (0.0%) |
| 65 to 74 Years | 18 (52.9%) | 0 (0.0%) |
| 75 Years and over | 7 (100.0%) | 0 (0.0%) |
Disability Class: Vision Difficulty
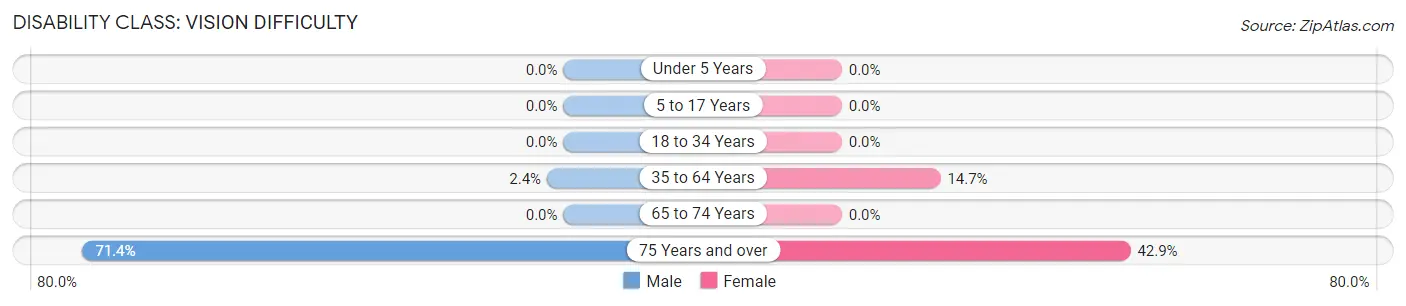
| Age Bracket | Male | Female |
| Under 5 Years | 0 (0.0%) | 0 (0.0%) |
| 5 to 17 Years | 0 (0.0%) | 0 (0.0%) |
| 18 to 34 Years | 0 (0.0%) | 0 (0.0%) |
| 35 to 64 Years | 3 (2.4%) | 29 (14.6%) |
| 65 to 74 Years | 0 (0.0%) | 0 (0.0%) |
| 75 Years and over | 5 (71.4%) | 3 (42.9%) |
Disability Class: Cognitive Difficulty
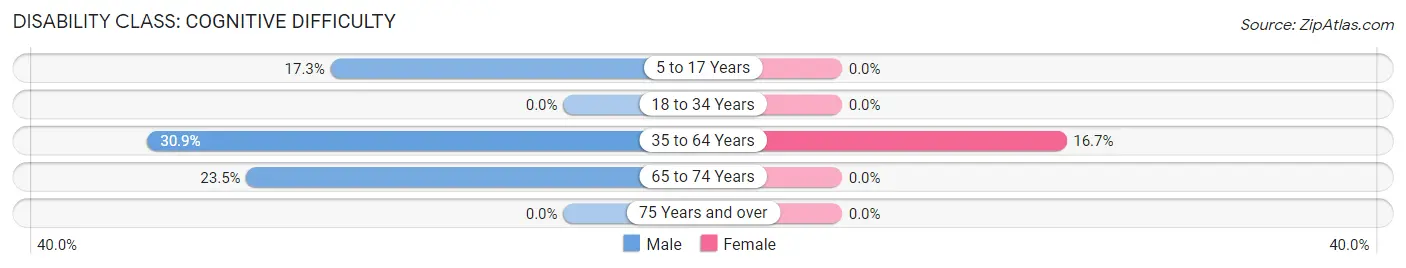
| Age Bracket | Male | Female |
| 5 to 17 Years | 14 (17.3%) | 0 (0.0%) |
| 18 to 34 Years | 0 (0.0%) | 0 (0.0%) |
| 35 to 64 Years | 38 (30.9%) | 33 (16.7%) |
| 65 to 74 Years | 8 (23.5%) | 0 (0.0%) |
| 75 Years and over | 0 (0.0%) | 0 (0.0%) |
Disability Class: Ambulatory Difficulty
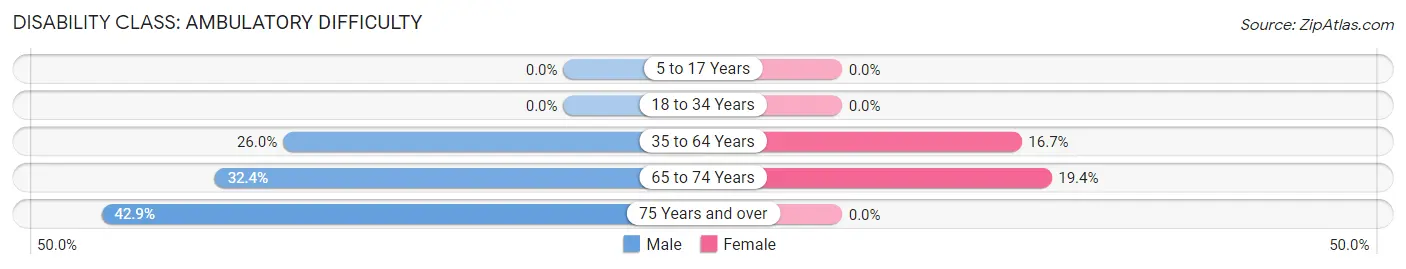
| Age Bracket | Male | Female |
| 5 to 17 Years | 0 (0.0%) | 0 (0.0%) |
| 18 to 34 Years | 0 (0.0%) | 0 (0.0%) |
| 35 to 64 Years | 32 (26.0%) | 33 (16.7%) |
| 65 to 74 Years | 11 (32.4%) | 7 (19.4%) |
| 75 Years and over | 3 (42.9%) | 0 (0.0%) |
Disability Class: Self-Care Difficulty
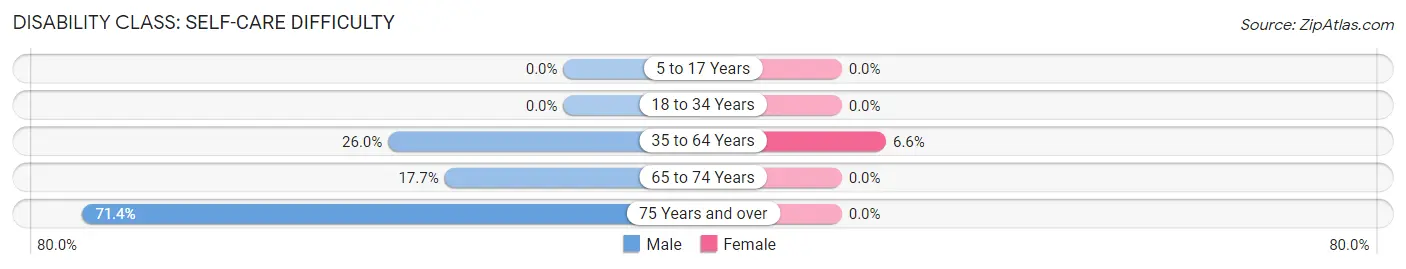
| Age Bracket | Male | Female |
| 5 to 17 Years | 0 (0.0%) | 0 (0.0%) |
| 18 to 34 Years | 0 (0.0%) | 0 (0.0%) |
| 35 to 64 Years | 32 (26.0%) | 13 (6.6%) |
| 65 to 74 Years | 6 (17.6%) | 0 (0.0%) |
| 75 Years and over | 5 (71.4%) | 0 (0.0%) |
Technology Access in Arapaho
Computing Device Access in Arapaho
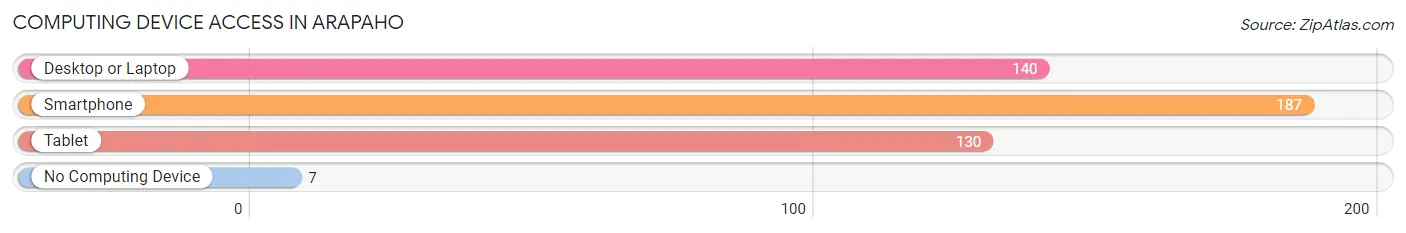
| Device Type | # Households | % Households |
| Desktop or Laptop | 140 | 62.2% |
| Smartphone | 187 | 83.1% |
| Tablet | 130 | 57.8% |
| No Computing Device | 7 | 3.1% |
| Total | 225 | 100.0% |
Internet Access in Arapaho
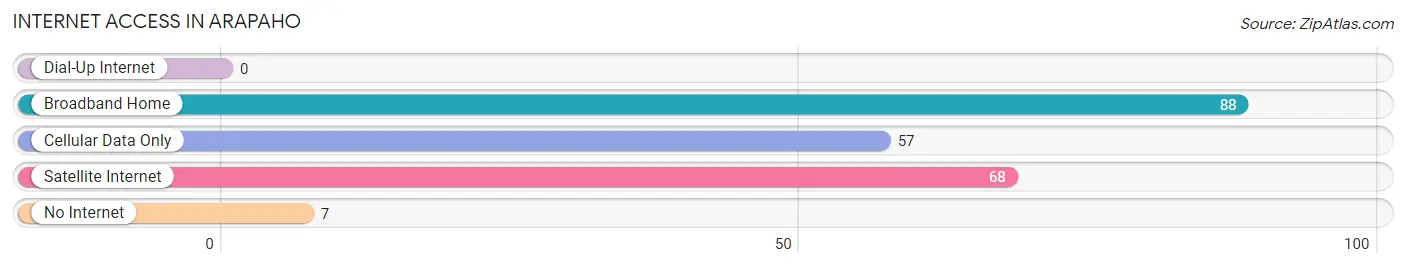
| Internet Type | # Households | % Households |
| Dial-Up Internet | 0 | 0.0% |
| Broadband Home | 88 | 39.1% |
| Cellular Data Only | 57 | 25.3% |
| Satellite Internet | 68 | 30.2% |
| No Internet | 7 | 3.1% |
| Total | 225 | 100.0% |
Arapaho Summary
Arapaho is a small town located in Custer County, Oklahoma. It is situated in the western part of the state, approximately 20 miles east of Clinton and 40 miles west of Weatherford. The town was founded in 1901 and was named after the Arapaho Native American tribe. As of the 2010 census, the population of Arapaho was 545.
Geography
Arapaho is located at 35°45'25"N 98°45'45"W (35.7569, -98.7625). It is situated in the western part of Oklahoma, approximately 20 miles east of Clinton and 40 miles west of Weatherford. The town is located in the Red Bed Plains region of Oklahoma, which is characterized by flat terrain and red-colored soil. The elevation of Arapaho is 1,092 feet above sea level.
The town is located in the Central Great Plains ecoregion, which is characterized by grasslands and prairies. The climate of Arapaho is classified as humid subtropical, with hot summers and mild winters. The average annual temperature is 61°F, and the average annual precipitation is 33 inches.
Economy
The economy of Arapaho is largely based on agriculture. The town is home to several farms and ranches, which produce a variety of crops, including wheat, corn, soybeans, and cotton. The town is also home to several small businesses, including a grocery store, a hardware store, and a restaurant.
Demographics
As of the 2010 census, the population of Arapaho was 545. The racial makeup of the town was 95.2% White, 0.2% African American, 0.7% Native American, 0.2% Asian, 0.2% from other races, and 3.7% from two or more races. Hispanic or Latino of any race were 1.3% of the population.
The median household income in Arapaho was $35,625, and the median family income was $41,250. The per capita income for the town was $17,845. About 11.2% of families and 14.2% of the population were below the poverty line, including 18.2% of those under age 18 and 8.3% of those age 65 or over.
History
Arapaho was founded in 1901 and was named after the Arapaho Native American tribe. The town was originally a stop on the Choctaw, Oklahoma and Gulf Railroad. The railroad was built in 1901 and ran from Oklahoma City to Clinton.
In the early 1900s, Arapaho was a thriving agricultural community. The town was home to several farms and ranches, which produced a variety of crops, including wheat, corn, soybeans, and cotton. The town also had several businesses, including a grocery store, a hardware store, and a restaurant.
In the 1950s, the town began to decline as the railroad was abandoned and the population began to move away. The population of Arapaho has remained relatively stable since then, and the town has maintained its small-town charm.
Common Questions
What is Per Capita Income in Arapaho?
Per Capita income in Arapaho is $15,253.
What is the Median Family Income in Arapaho?
Median Family Income in Arapaho is $47,981.
What is the Median Household income in Arapaho?
Median Household Income in Arapaho is $37,361.
What is Income or Wage Gap in Arapaho?
Income or Wage Gap in Arapaho is 43.8%.
Women in Arapaho earn 56.2 cents for every dollar earned by a man.
What is Family Income Deficit in Arapaho?
Family Income Deficit in Arapaho is $8,688.
Families that are below poverty line in Arapaho earn $8,688 less on average than the poverty threshold level.
What is Inequality or Gini Index in Arapaho?
Inequality or Gini Index in Arapaho is 0.38.
What is the Total Population of Arapaho?
Total Population of Arapaho is 795.
What is the Total Male Population of Arapaho?
Total Male Population of Arapaho is 360.
What is the Total Female Population of Arapaho?
Total Female Population of Arapaho is 435.
What is the Ratio of Males per 100 Females in Arapaho?
There are 82.76 Males per 100 Females in Arapaho.
What is the Ratio of Females per 100 Males in Arapaho?
There are 120.83 Females per 100 Males in Arapaho.
What is the Median Population Age in Arapaho?
Median Population Age in Arapaho is 38.1 Years.
What is the Average Family Size in Arapaho
Average Family Size in Arapaho is 3.8 People.
What is the Average Household Size in Arapaho
Average Household Size in Arapaho is 3.2 People.
How Large is the Labor Force in Arapaho?
There are 256 People in the Labor Forcein in Arapaho.
What is the Percentage of People in the Labor Force in Arapaho?
44.4% of People are in the Labor Force in Arapaho.
What is the Unemployment Rate in Arapaho?
Unemployment Rate in Arapaho is 3.5%.