Springer, OK Map & Demographics
Springer Map
Springer Overview
$24,853
PER CAPITA INCOME
$71,875
AVG FAMILY INCOME
$51,630
AVG HOUSEHOLD INCOME
56.1%
WAGE / INCOME GAP [ % ]
43.9¢/ $1
WAGE / INCOME GAP [ $ ]
$13,830
FAMILY INCOME DEFICIT
0.39
INEQUALITY / GINI INDEX
756
TOTAL POPULATION
382
MALE POPULATION
374
FEMALE POPULATION
102.14
MALES / 100 FEMALES
97.91
FEMALES / 100 MALES
30.3
MEDIAN AGE
3.6
AVG FAMILY SIZE
2.8
AVG HOUSEHOLD SIZE
292
LABOR FORCE [ PEOPLE ]
56.6%
PERCENT IN LABOR FORCE
1.7%
UNEMPLOYMENT RATE
Springer Zip Codes
Springer Area Codes
Income in Springer
Income Overview in Springer
Per Capita Income in Springer is $24,853, while median incomes of families and households are $71,875 and $51,630 respectively.
| Characteristic | Number | Measure |
| Per Capita Income | 756 | $24,853 |
| Median Family Income | 175 | $71,875 |
| Mean Family Income | 175 | $76,409 |
| Median Household Income | 268 | $51,630 |
| Mean Household Income | 268 | $66,858 |
| Income Deficit | 175 | $13,830 |
| Wage / Income Gap (%) | 756 | 56.11% |
| Wage / Income Gap ($) | 756 | 43.89¢ per $1 |
| Gini / Inequality Index | 756 | 0.39 |
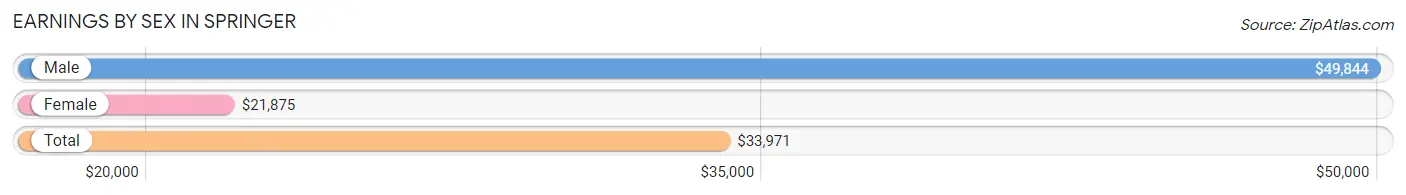
Earnings by Sex in Springer
Average Earnings in Springer are $33,971, $49,844 for men and $21,875 for women, a difference of 56.1%.
| Sex | Number | Average Earnings |
| Male | 169 (53.5%) | $49,844 |
| Female | 147 (46.5%) | $21,875 |
| Total | 316 (100.0%) | $33,971 |
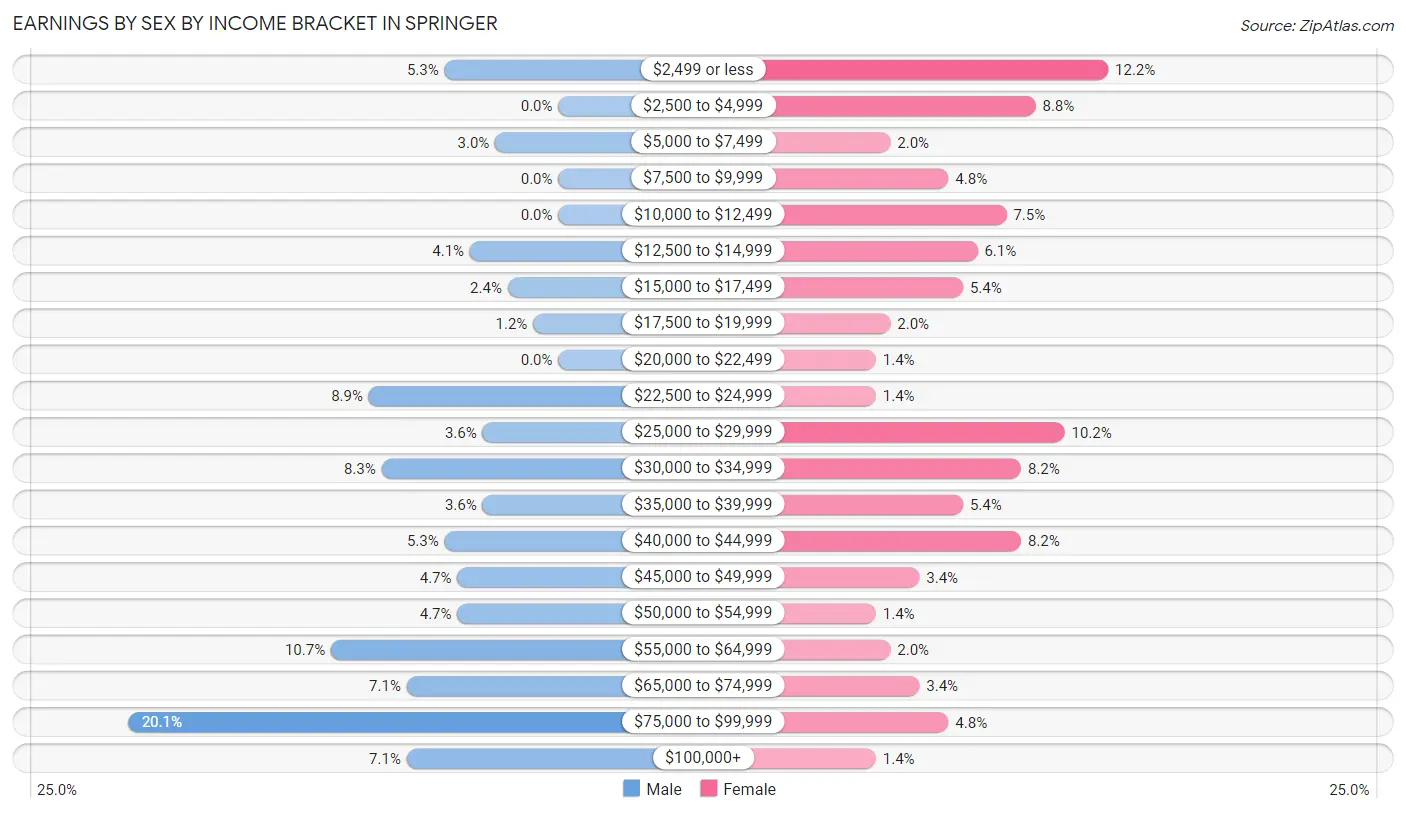
Earnings by Sex by Income Bracket in Springer
The most common earnings brackets in Springer are $75,000 to $99,999 for men (34 | 20.1%) and $2,499 or less for women (18 | 12.2%).
| Income | Male | Female |
| $2,499 or less | 9 (5.3%) | 18 (12.2%) |
| $2,500 to $4,999 | 0 (0.0%) | 13 (8.8%) |
| $5,000 to $7,499 | 5 (3.0%) | 3 (2.0%) |
| $7,500 to $9,999 | 0 (0.0%) | 7 (4.8%) |
| $10,000 to $12,499 | 0 (0.0%) | 11 (7.5%) |
| $12,500 to $14,999 | 7 (4.1%) | 9 (6.1%) |
| $15,000 to $17,499 | 4 (2.4%) | 8 (5.4%) |
| $17,500 to $19,999 | 2 (1.2%) | 3 (2.0%) |
| $20,000 to $22,499 | 0 (0.0%) | 2 (1.4%) |
| $22,500 to $24,999 | 15 (8.9%) | 2 (1.4%) |
| $25,000 to $29,999 | 6 (3.5%) | 15 (10.2%) |
| $30,000 to $34,999 | 14 (8.3%) | 12 (8.2%) |
| $35,000 to $39,999 | 6 (3.5%) | 8 (5.4%) |
| $40,000 to $44,999 | 9 (5.3%) | 12 (8.2%) |
| $45,000 to $49,999 | 8 (4.7%) | 5 (3.4%) |
| $50,000 to $54,999 | 8 (4.7%) | 2 (1.4%) |
| $55,000 to $64,999 | 18 (10.6%) | 3 (2.0%) |
| $65,000 to $74,999 | 12 (7.1%) | 5 (3.4%) |
| $75,000 to $99,999 | 34 (20.1%) | 7 (4.8%) |
| $100,000+ | 12 (7.1%) | 2 (1.4%) |
| Total | 169 (100.0%) | 147 (100.0%) |
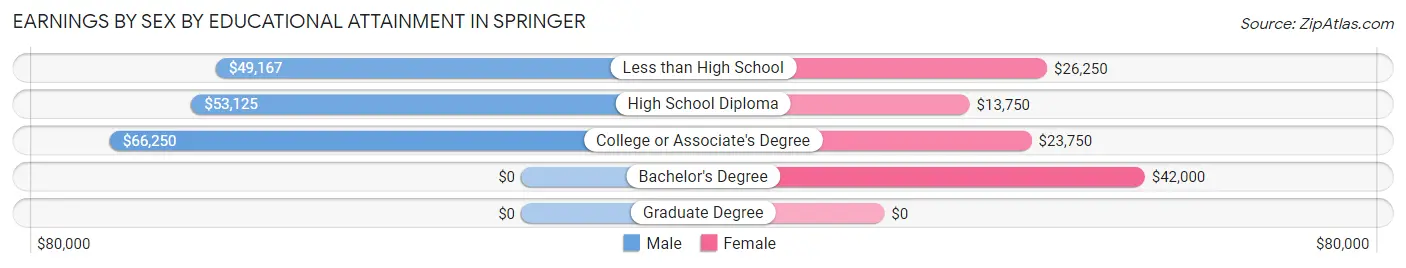
Earnings by Sex by Educational Attainment in Springer
Average earnings in Springer are $55,417 for men and $26,250 for women, a difference of 52.6%. Men with an educational attainment of college or associate's degree enjoy the highest average annual earnings of $66,250, while those with less than high school education earn the least with $49,167. Women with an educational attainment of bachelor's degree earn the most with the average annual earnings of $42,000, while those with high school diploma education have the smallest earnings of $13,750.
| Educational Attainment | Male Income | Female Income |
| Less than High School | $49,167 | $26,250 |
| High School Diploma | $53,125 | $13,750 |
| College or Associate's Degree | $66,250 | $23,750 |
| Bachelor's Degree | - | - |
| Graduate Degree | - | - |
| Total | $55,417 | $26,250 |
Family Income in Springer
Family Income Brackets in Springer
According to the Springer family income data, there are 32 families falling into the $35,000 to $49,999 income range, which is the most common income bracket and makes up 18.3% of all families. Conversely, the $10,000 to $14,999 income bracket is the least frequent group with only 9 families (5.1%) belonging to this category.
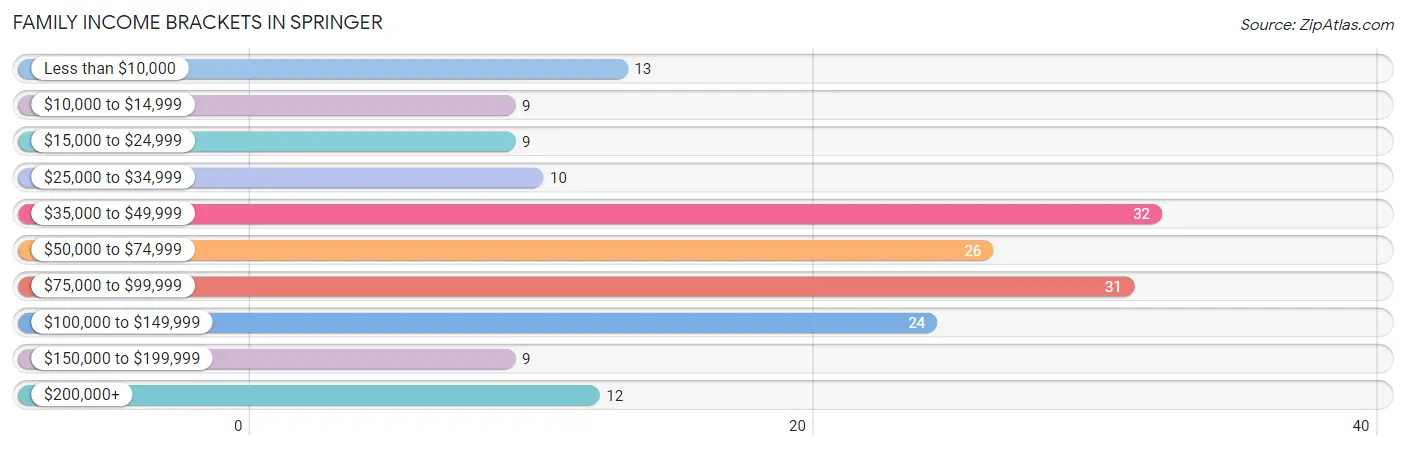
| Income Bracket | # Families | % Families |
| Less than $10,000 | 13 | 7.4% |
| $10,000 to $14,999 | 9 | 5.1% |
| $15,000 to $24,999 | 9 | 5.1% |
| $25,000 to $34,999 | 10 | 5.7% |
| $35,000 to $49,999 | 32 | 18.3% |
| $50,000 to $74,999 | 26 | 14.9% |
| $75,000 to $99,999 | 31 | 17.7% |
| $100,000 to $149,999 | 24 | 13.7% |
| $150,000 to $199,999 | 9 | 5.1% |
| $200,000+ | 12 | 6.9% |
Family Income by Famaliy Size in Springer
6-person families (9 | 5.1%) account for the highest median family income in Springer with $151,875 per family, while 3-person families (36 | 20.6%) have the highest median income of $26,875 per family member.
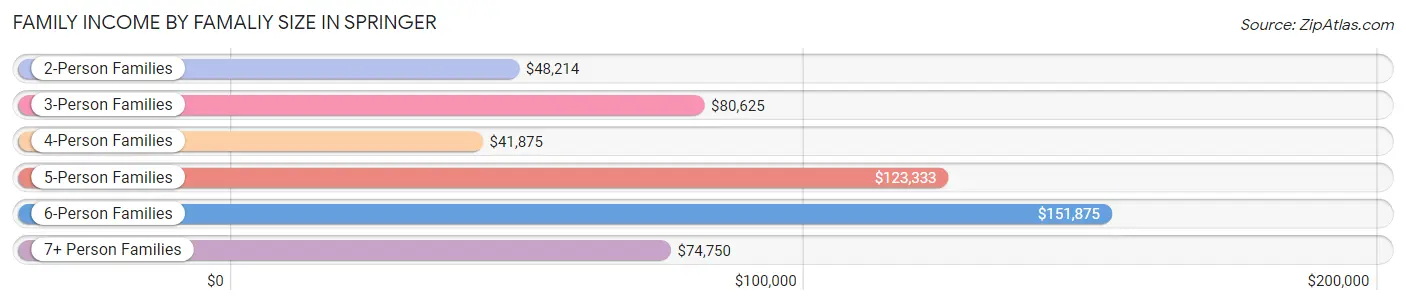
| Income Bracket | # Families | Median Income |
| 2-Person Families | 70 (40.0%) | $48,214 |
| 3-Person Families | 36 (20.6%) | $80,625 |
| 4-Person Families | 27 (15.4%) | $41,875 |
| 5-Person Families | 16 (9.1%) | $123,333 |
| 6-Person Families | 9 (5.1%) | $151,875 |
| 7+ Person Families | 17 (9.7%) | $74,750 |
| Total | 175 (100.0%) | $71,875 |
Family Income by Number of Earners in Springer
The median family income in Springer is $71,875, with families comprising 3+ earners (25) having the highest median family income of $151,250, while families with no earners (28) have the lowest median family income of $20,000, accounting for 14.3% and 16.0% of families, respectively.
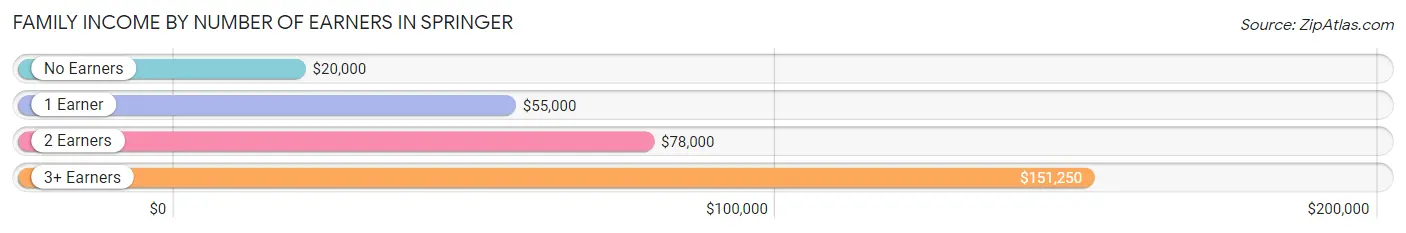
| Number of Earners | # Families | Median Income |
| No Earners | 28 (16.0%) | $20,000 |
| 1 Earner | 68 (38.9%) | $55,000 |
| 2 Earners | 54 (30.9%) | $78,000 |
| 3+ Earners | 25 (14.3%) | $151,250 |
| Total | 175 (100.0%) | $71,875 |
Household Income in Springer
Household Income Brackets in Springer
With 66 households falling in the category, the $50,000 to $74,999 income range is the most frequent in Springer, accounting for 24.6% of all households. In contrast, only 9 households (3.4%) fall into the less than $10,000 income bracket, making it the least populous group.
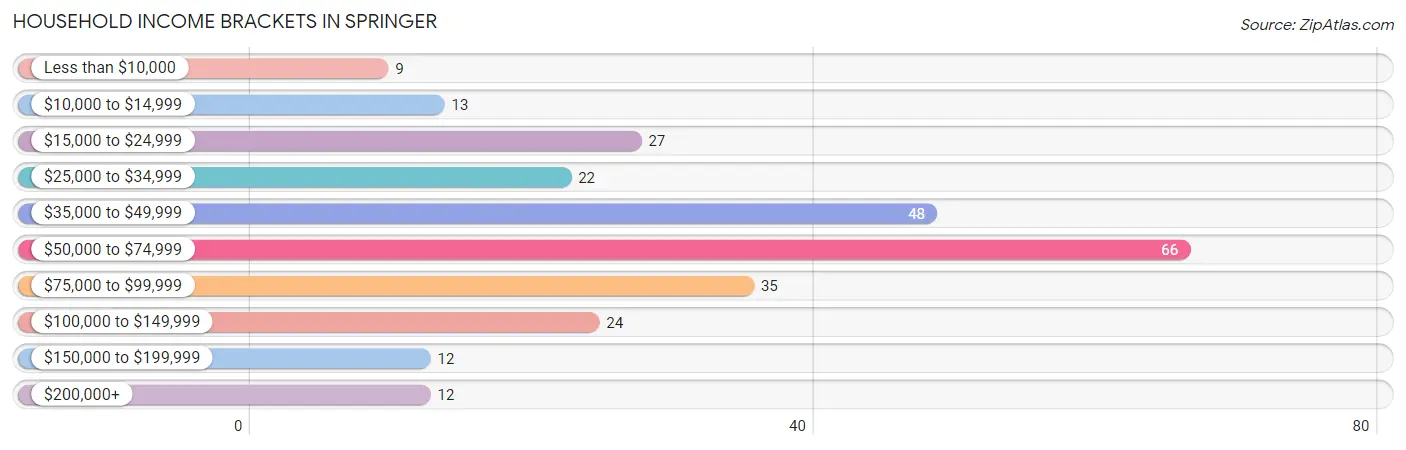
| Income Bracket | # Households | % Households |
| Less than $10,000 | 9 | 3.4% |
| $10,000 to $14,999 | 13 | 4.9% |
| $15,000 to $24,999 | 27 | 10.1% |
| $25,000 to $34,999 | 22 | 8.2% |
| $35,000 to $49,999 | 48 | 17.9% |
| $50,000 to $74,999 | 66 | 24.6% |
| $75,000 to $99,999 | 35 | 13.1% |
| $100,000 to $149,999 | 24 | 9.0% |
| $150,000 to $199,999 | 12 | 4.5% |
| $200,000+ | 12 | 4.5% |
Household Income by Householder Age in Springer
The median household income in Springer is $51,630, with the highest median household income of $66,667 found in the 25 to 44 years age bracket for the primary householder. A total of 94 households (35.1%) fall into this category. Meanwhile, the 15 to 24 years age bracket for the primary householder has the lowest median household income of $39,375, with 13 households (4.9%) in this group.
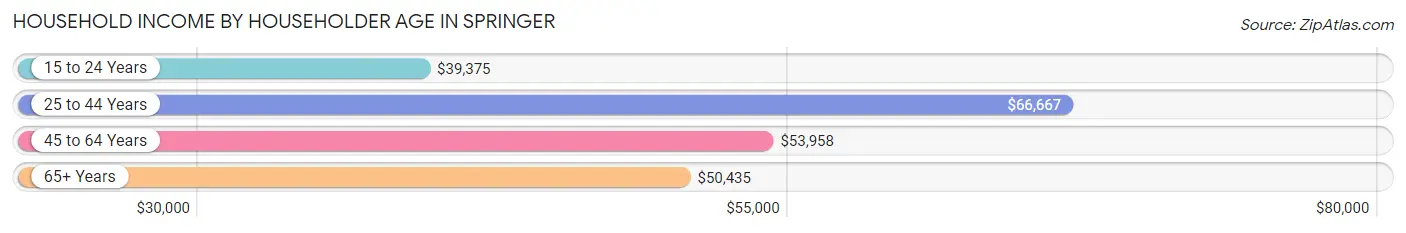
| Income Bracket | # Households | Median Income |
| 15 to 24 Years | 13 (4.9%) | $39,375 |
| 25 to 44 Years | 94 (35.1%) | $66,667 |
| 45 to 64 Years | 81 (30.2%) | $53,958 |
| 65+ Years | 80 (29.8%) | $50,435 |
| Total | 268 (100.0%) | $51,630 |
Poverty in Springer
Income Below Poverty by Sex and Age in Springer
With 10.0% poverty level for males and 17.6% for females among the residents of Springer, 5 year old males and 18 to 24 year old females are the most vulnerable to poverty, with 6 males (33.3%) and 9 females (37.5%) in their respective age groups living below the poverty level.
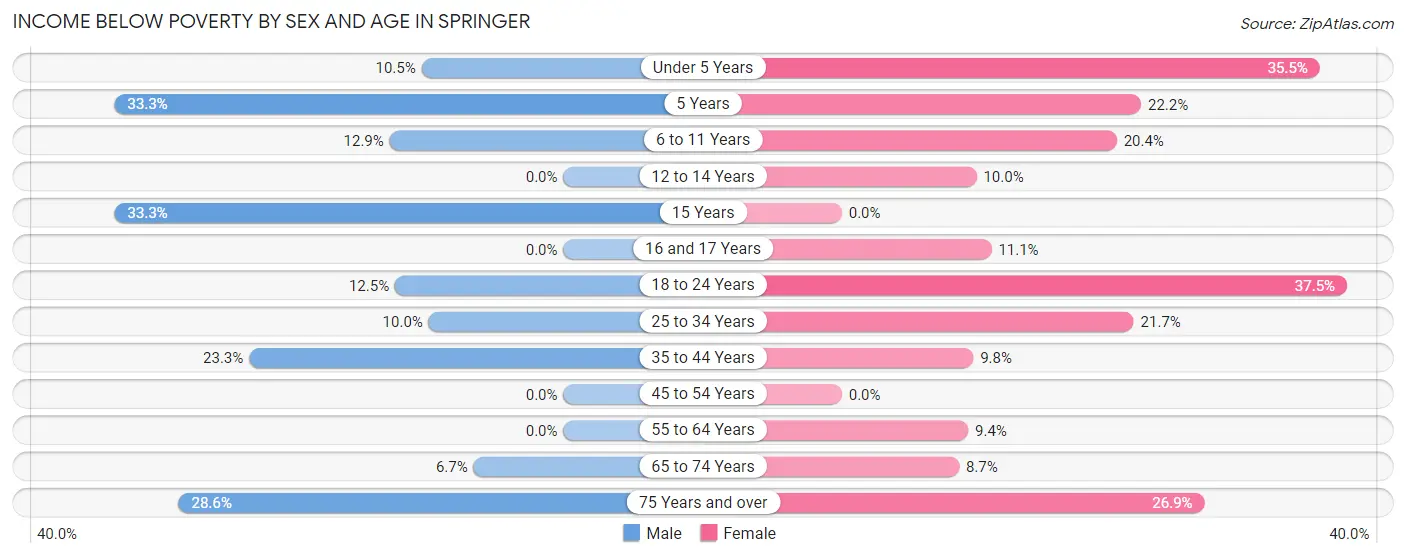
| Age Bracket | Male | Female |
| Under 5 Years | 4 (10.5%) | 11 (35.5%) |
| 5 Years | 6 (33.3%) | 2 (22.2%) |
| 6 to 11 Years | 4 (12.9%) | 10 (20.4%) |
| 12 to 14 Years | 0 (0.0%) | 2 (10.0%) |
| 15 Years | 1 (33.3%) | 0 (0.0%) |
| 16 and 17 Years | 0 (0.0%) | 2 (11.1%) |
| 18 to 24 Years | 2 (12.5%) | 9 (37.5%) |
| 25 to 34 Years | 7 (10.0%) | 13 (21.7%) |
| 35 to 44 Years | 7 (23.3%) | 4 (9.8%) |
| 45 to 54 Years | 0 (0.0%) | 0 (0.0%) |
| 55 to 64 Years | 0 (0.0%) | 3 (9.4%) |
| 65 to 74 Years | 3 (6.7%) | 2 (8.7%) |
| 75 Years and over | 4 (28.6%) | 7 (26.9%) |
| Total | 38 (10.0%) | 65 (17.6%) |
Income Above Poverty by Sex and Age in Springer
According to the poverty statistics in Springer, males aged 12 to 14 years and females aged 15 years are the age groups that are most secure financially, with 100.0% of males and 100.0% of females in these age groups living above the poverty line.
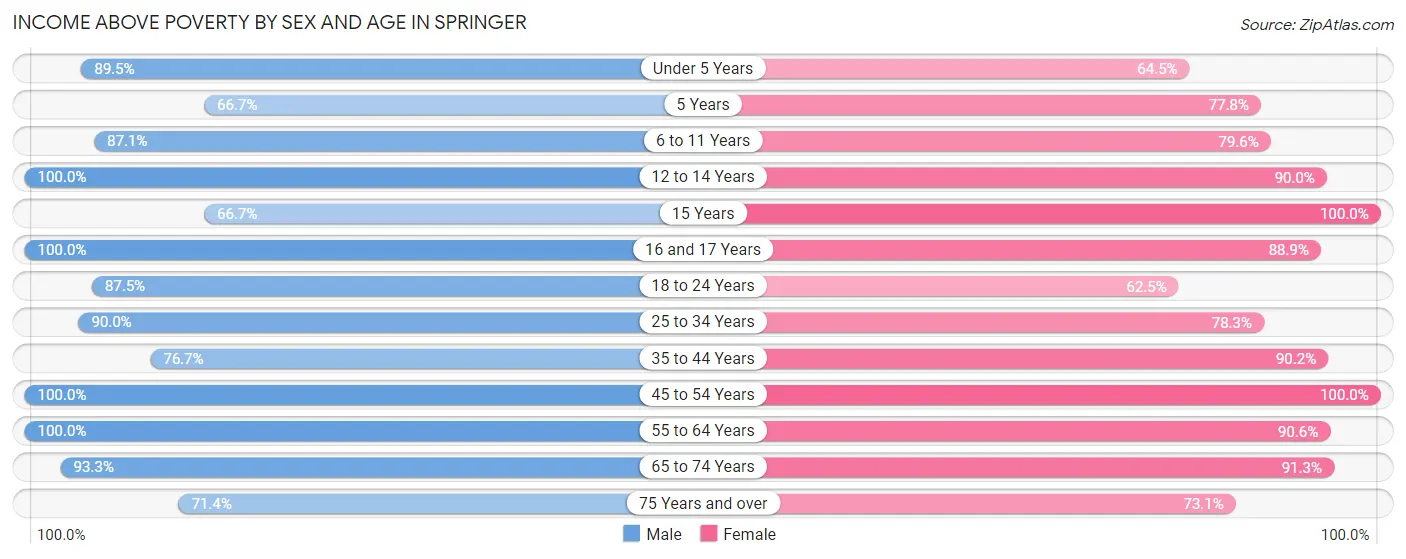
| Age Bracket | Male | Female |
| Under 5 Years | 34 (89.5%) | 20 (64.5%) |
| 5 Years | 12 (66.7%) | 7 (77.8%) |
| 6 to 11 Years | 27 (87.1%) | 39 (79.6%) |
| 12 to 14 Years | 30 (100.0%) | 18 (90.0%) |
| 15 Years | 2 (66.7%) | 7 (100.0%) |
| 16 and 17 Years | 12 (100.0%) | 16 (88.9%) |
| 18 to 24 Years | 14 (87.5%) | 15 (62.5%) |
| 25 to 34 Years | 63 (90.0%) | 47 (78.3%) |
| 35 to 44 Years | 23 (76.7%) | 37 (90.2%) |
| 45 to 54 Years | 41 (100.0%) | 30 (100.0%) |
| 55 to 64 Years | 34 (100.0%) | 29 (90.6%) |
| 65 to 74 Years | 42 (93.3%) | 21 (91.3%) |
| 75 Years and over | 10 (71.4%) | 19 (73.1%) |
| Total | 344 (90.0%) | 305 (82.4%) |
Income Below Poverty Among Married-Couple Families in Springer
The poverty statistics for married-couple families in Springer show that 9.9% or 14 of the total 141 families live below the poverty line. Families with 1 or 2 children have the highest poverty rate of 18.8%, comprising of 9 families. On the other hand, families with 3 or 4 children have the lowest poverty rate of 0.0%, which includes 0 families.
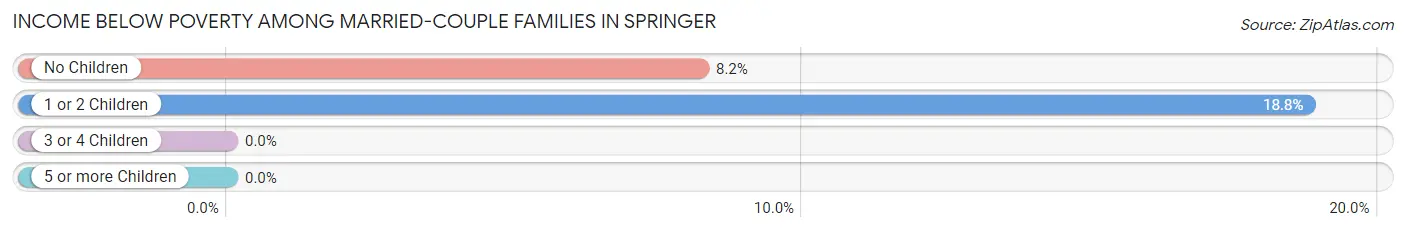
| Children | Above Poverty | Below Poverty |
| No Children | 56 (91.8%) | 5 (8.2%) |
| 1 or 2 Children | 39 (81.2%) | 9 (18.8%) |
| 3 or 4 Children | 20 (100.0%) | 0 (0.0%) |
| 5 or more Children | 12 (100.0%) | 0 (0.0%) |
| Total | 127 (90.1%) | 14 (9.9%) |
Income Below Poverty Among Single-Parent Households in Springer
According to the poverty data in Springer, 31.6% or 6 single-father households and 46.7% or 7 single-mother households are living below the poverty line. Among single-father households, those with 5 or more children have the highest poverty rate, with 2 households (100.0%) experiencing poverty. Likewise, among single-mother households, those with 3 or 4 children have the highest poverty rate, with 5 households (71.4%) falling below the poverty line.
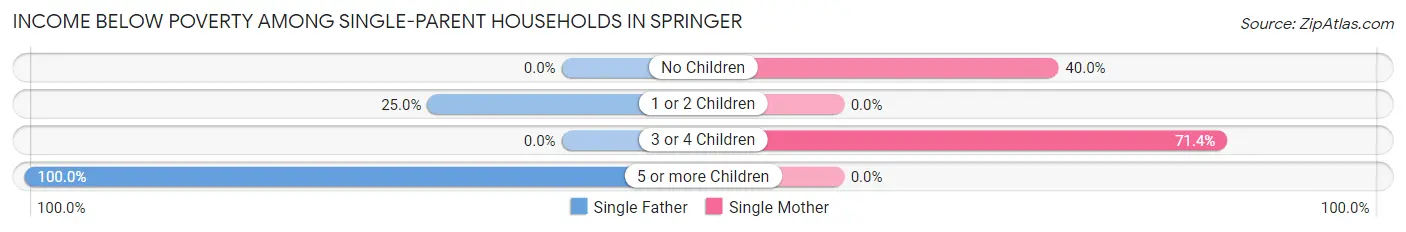
| Children | Single Father | Single Mother |
| No Children | 0 (0.0%) | 2 (40.0%) |
| 1 or 2 Children | 4 (25.0%) | 0 (0.0%) |
| 3 or 4 Children | 0 (0.0%) | 5 (71.4%) |
| 5 or more Children | 2 (100.0%) | 0 (0.0%) |
| Total | 6 (31.6%) | 7 (46.7%) |
Income Below Poverty Among Married-Couple vs Single-Parent Households in Springer
The poverty data for Springer shows that 14 of the married-couple family households (9.9%) and 13 of the single-parent households (38.2%) are living below the poverty level. Within the married-couple family households, those with 1 or 2 children have the highest poverty rate, with 9 households (18.8%) falling below the poverty line. Among the single-parent households, those with 5 or more children have the highest poverty rate, with 2 household (100.0%) living below poverty.
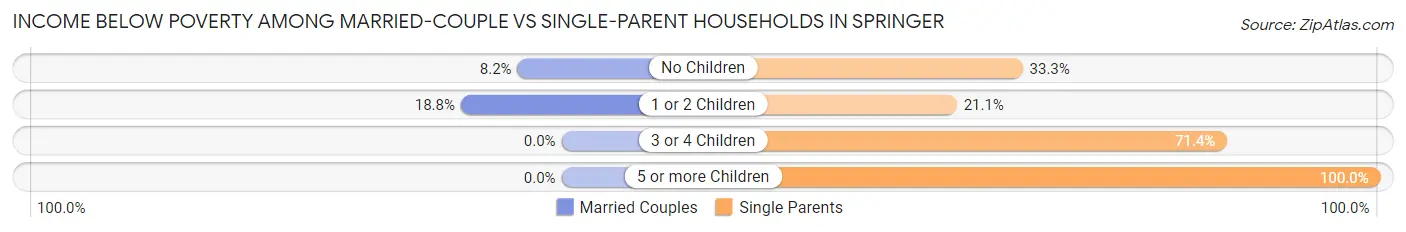
| Children | Married-Couple Families | Single-Parent Households |
| No Children | 5 (8.2%) | 2 (33.3%) |
| 1 or 2 Children | 9 (18.8%) | 4 (21.0%) |
| 3 or 4 Children | 0 (0.0%) | 5 (71.4%) |
| 5 or more Children | 0 (0.0%) | 2 (100.0%) |
| Total | 14 (9.9%) | 13 (38.2%) |
Race in Springer
The most populous races in Springer are White / Caucasian (486 | 64.3%), Two or more Races (146 | 19.3%), and Native / Alaskan (88 | 11.6%).
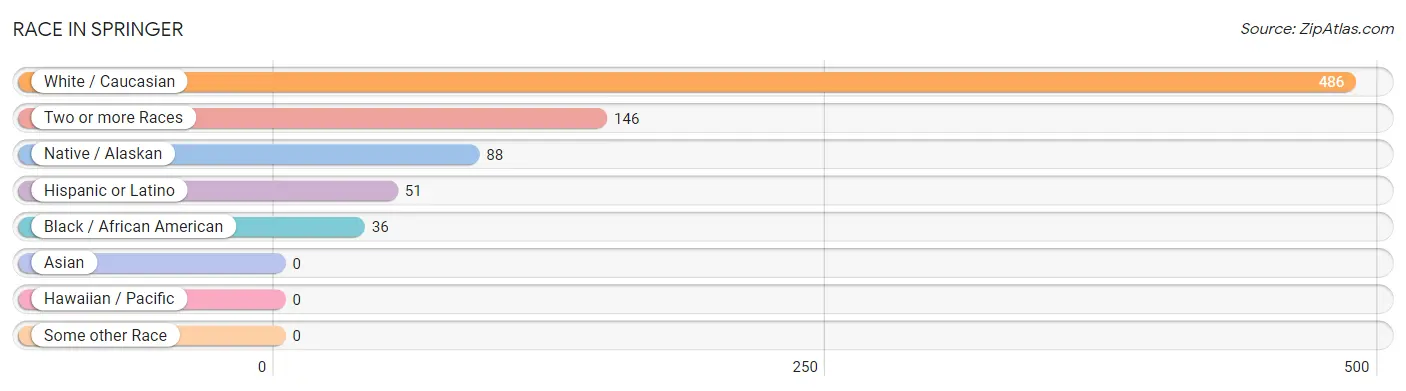
| Race | # Population | % Population |
| Asian | 0 | 0.0% |
| Black / African American | 36 | 4.8% |
| Hawaiian / Pacific | 0 | 0.0% |
| Hispanic or Latino | 51 | 6.8% |
| Native / Alaskan | 88 | 11.6% |
| White / Caucasian | 486 | 64.3% |
| Two or more Races | 146 | 19.3% |
| Some other Race | 0 | 0.0% |
| Total | 756 | 100.0% |
Ancestry in Springer
The most populous ancestries reported in Springer are Chickasaw (100 | 13.2%), Irish (96 | 12.7%), English (94 | 12.4%), German (59 | 7.8%), and Choctaw (50 | 6.6%), together accounting for 52.8% of all Springer residents.
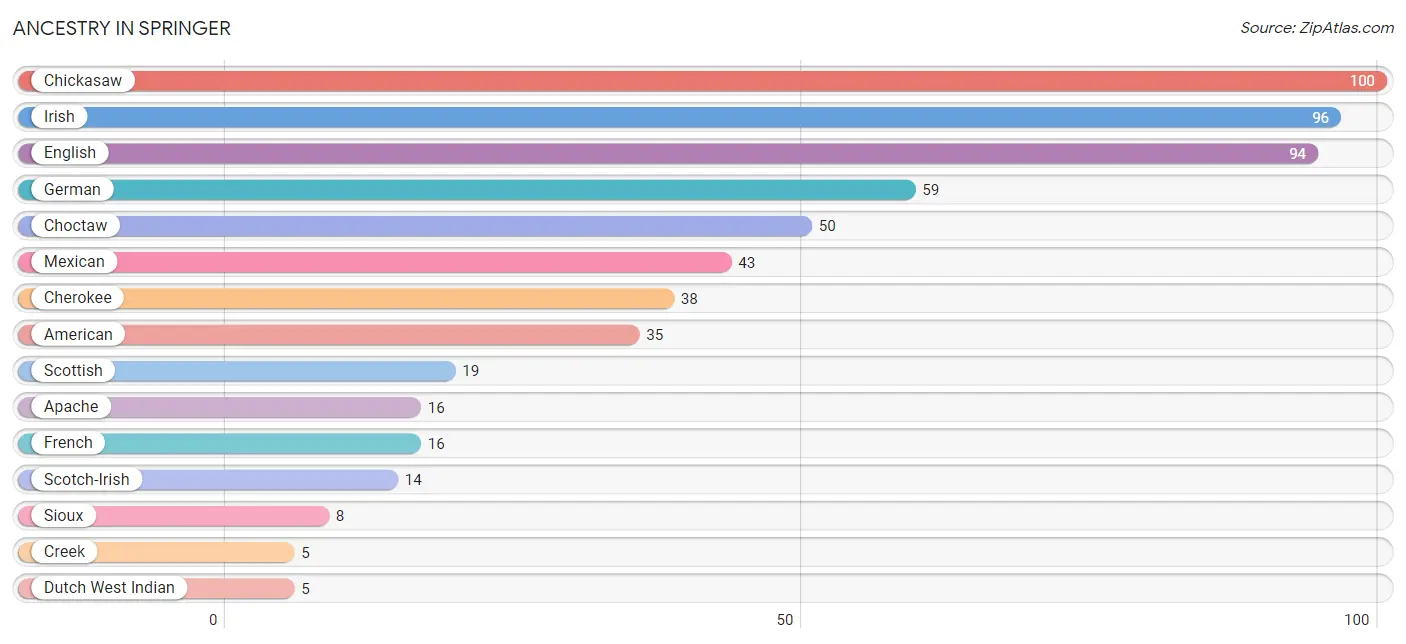
| Ancestry | # Population | % Population |
| American | 35 | 4.6% |
| Apache | 16 | 2.1% |
| Armenian | 4 | 0.5% |
| British | 1 | 0.1% |
| Cherokee | 38 | 5.0% |
| Chickasaw | 100 | 13.2% |
| Choctaw | 50 | 6.6% |
| Creek | 5 | 0.7% |
| Czech | 3 | 0.4% |
| Delaware | 2 | 0.3% |
| Dutch | 3 | 0.4% |
| Dutch West Indian | 5 | 0.7% |
| English | 94 | 12.4% |
| European | 2 | 0.3% |
| Finnish | 1 | 0.1% |
| French | 16 | 2.1% |
| German | 59 | 7.8% |
| German Russian | 3 | 0.4% |
| Irish | 96 | 12.7% |
| Italian | 1 | 0.1% |
| Mexican | 43 | 5.7% |
| Northern European | 1 | 0.1% |
| Norwegian | 3 | 0.4% |
| Scotch-Irish | 14 | 1.8% |
| Scottish | 19 | 2.5% |
| Sioux | 8 | 1.1% |
| Welsh | 3 | 0.4% | View All 27 Rows |
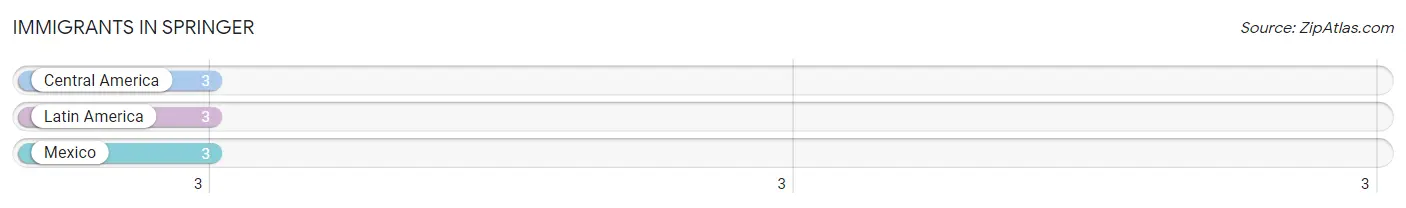
Immigrants in Springer
The most numerous immigrant groups reported in Springer came from Central America (3 | 0.4%), Latin America (3 | 0.4%), and Mexico (3 | 0.4%), together accounting for 1.2% of all Springer residents.
| Immigration Origin | # Population | % Population |
| Central America | 3 | 0.4% |
| Latin America | 3 | 0.4% |
| Mexico | 3 | 0.4% | View All 3 Rows |
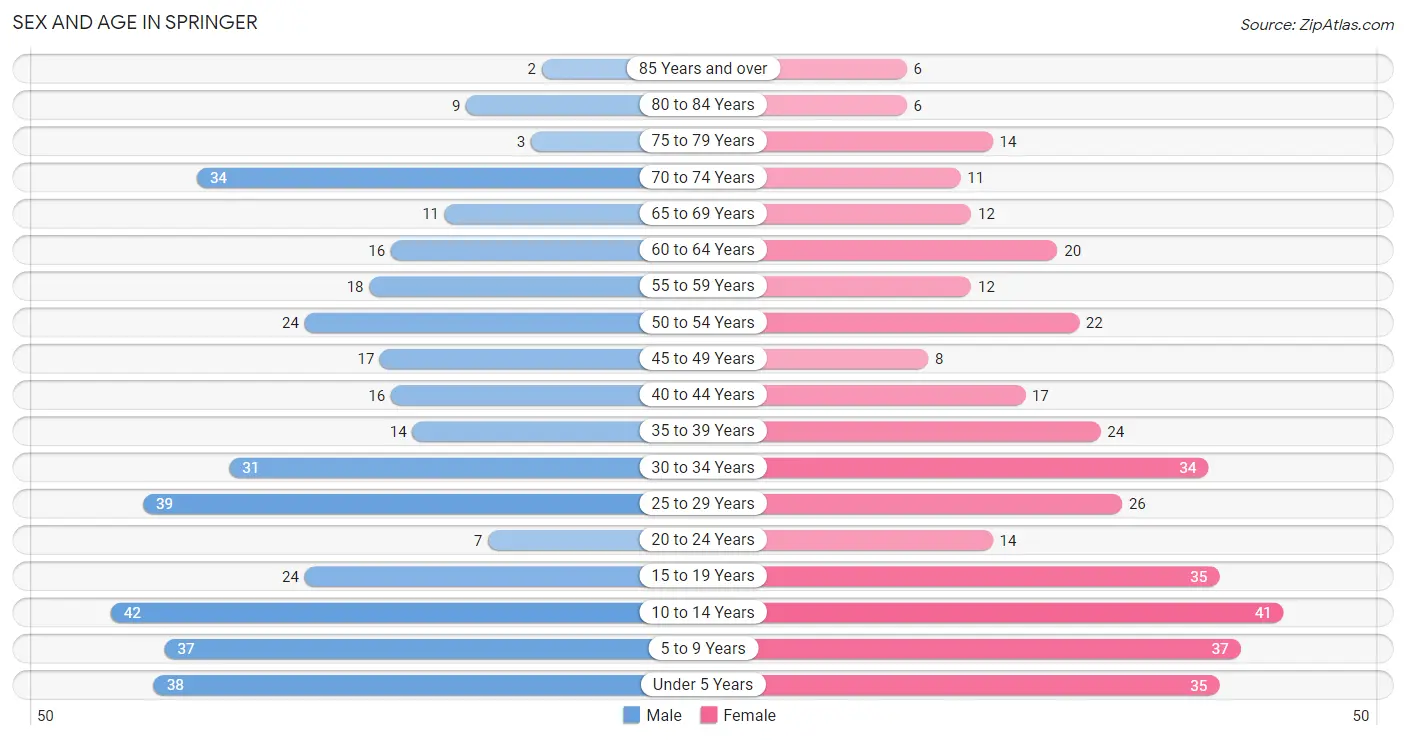
Sex and Age in Springer
Sex and Age in Springer
The most populous age groups in Springer are 10 to 14 Years (42 | 11.0%) for men and 10 to 14 Years (41 | 11.0%) for women.
| Age Bracket | Male | Female |
| Under 5 Years | 38 (10.0%) | 35 (9.4%) |
| 5 to 9 Years | 37 (9.7%) | 37 (9.9%) |
| 10 to 14 Years | 42 (11.0%) | 41 (11.0%) |
| 15 to 19 Years | 24 (6.3%) | 35 (9.4%) |
| 20 to 24 Years | 7 (1.8%) | 14 (3.7%) |
| 25 to 29 Years | 39 (10.2%) | 26 (7.0%) |
| 30 to 34 Years | 31 (8.1%) | 34 (9.1%) |
| 35 to 39 Years | 14 (3.7%) | 24 (6.4%) |
| 40 to 44 Years | 16 (4.2%) | 17 (4.5%) |
| 45 to 49 Years | 17 (4.4%) | 8 (2.1%) |
| 50 to 54 Years | 24 (6.3%) | 22 (5.9%) |
| 55 to 59 Years | 18 (4.7%) | 12 (3.2%) |
| 60 to 64 Years | 16 (4.2%) | 20 (5.3%) |
| 65 to 69 Years | 11 (2.9%) | 12 (3.2%) |
| 70 to 74 Years | 34 (8.9%) | 11 (2.9%) |
| 75 to 79 Years | 3 (0.8%) | 14 (3.7%) |
| 80 to 84 Years | 9 (2.4%) | 6 (1.6%) |
| 85 Years and over | 2 (0.5%) | 6 (1.6%) |
| Total | 382 (100.0%) | 374 (100.0%) |
Families and Households in Springer
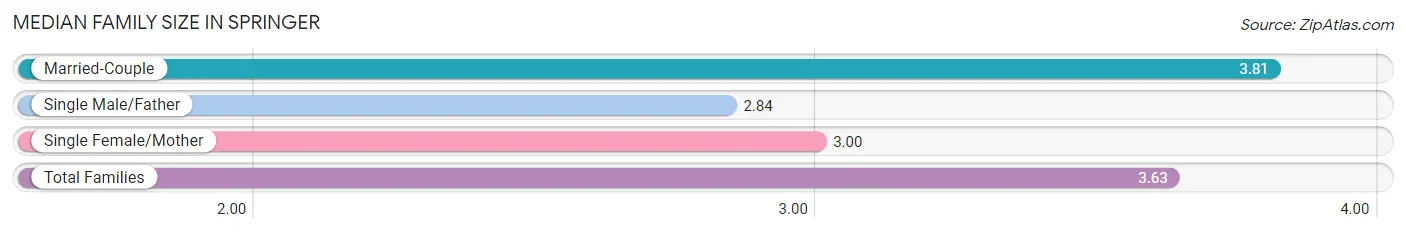
Median Family Size in Springer
The median family size in Springer is 3.63 persons per family, with married-couple families (141 | 80.6%) accounting for the largest median family size of 3.81 persons per family. On the other hand, single male/father families (19 | 10.9%) represent the smallest median family size with 2.84 persons per family.
| Family Type | # Families | Family Size |
| Married-Couple | 141 (80.6%) | 3.81 |
| Single Male/Father | 19 (10.9%) | 2.84 |
| Single Female/Mother | 15 (8.6%) | 3.00 |
| Total Families | 175 (100.0%) | 3.63 |
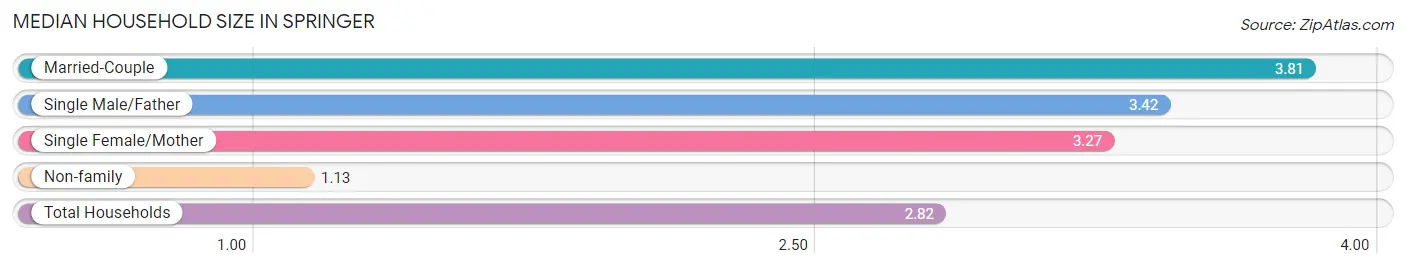
Median Household Size in Springer
The median household size in Springer is 2.82 persons per household, with married-couple households (141 | 52.6%) accounting for the largest median household size of 3.81 persons per household. non-family households (93 | 34.7%) represent the smallest median household size with 1.13 persons per household.
| Household Type | # Households | Household Size |
| Married-Couple | 141 (52.6%) | 3.81 |
| Single Male/Father | 19 (7.1%) | 3.42 |
| Single Female/Mother | 15 (5.6%) | 3.27 |
| Non-family | 93 (34.7%) | 1.13 |
| Total Households | 268 (100.0%) | 2.82 |
Household Size by Marriage Status in Springer
Out of a total of 268 households in Springer, 175 (65.3%) are family households, while 93 (34.7%) are nonfamily households. The most numerous type of family households are 2-person households, comprising 63, and the most common type of nonfamily households are 1-person households, comprising 83.
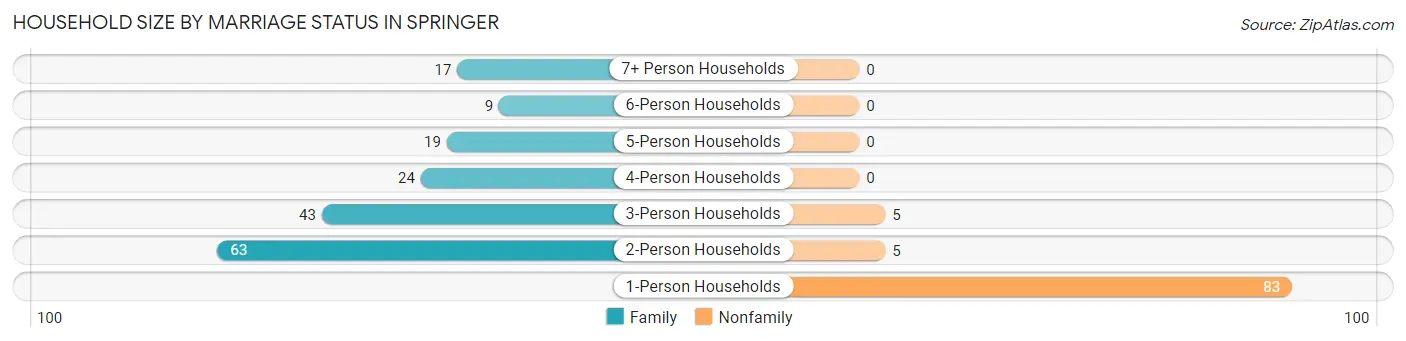
| Household Size | Family Households | Nonfamily Households |
| 1-Person Households | - | 83 (31.0%) |
| 2-Person Households | 63 (23.5%) | 5 (1.9%) |
| 3-Person Households | 43 (16.0%) | 5 (1.9%) |
| 4-Person Households | 24 (9.0%) | 0 (0.0%) |
| 5-Person Households | 19 (7.1%) | 0 (0.0%) |
| 6-Person Households | 9 (3.4%) | 0 (0.0%) |
| 7+ Person Households | 17 (6.3%) | 0 (0.0%) |
| Total | 175 (65.3%) | 93 (34.7%) |
Female Fertility in Springer
Fertility by Age in Springer
Average fertility rate in Springer is 114.0 births per 1,000 women. Women in the age bracket of 20 to 34 years have the highest fertility rate with 203.0 births per 1,000 women. Women in the age bracket of 20 to 34 years acount for 83.3% of all women with births.
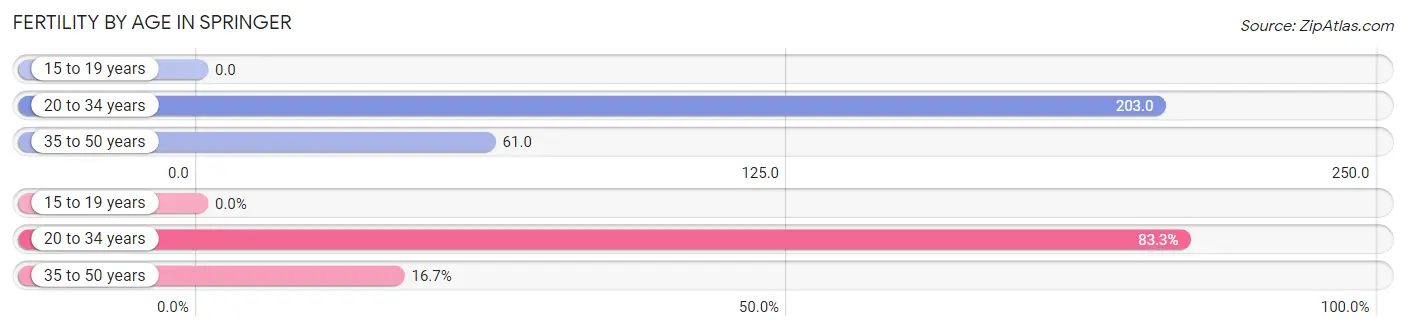
| Age Bracket | Women with Births | Births / 1,000 Women |
| 15 to 19 years | 0 (0.0%) | 0.0 |
| 20 to 34 years | 15 (83.3%) | 203.0 |
| 35 to 50 years | 3 (16.7%) | 61.0 |
| Total | 18 (100.0%) | 114.0 |
Fertility by Age by Marriage Status in Springer
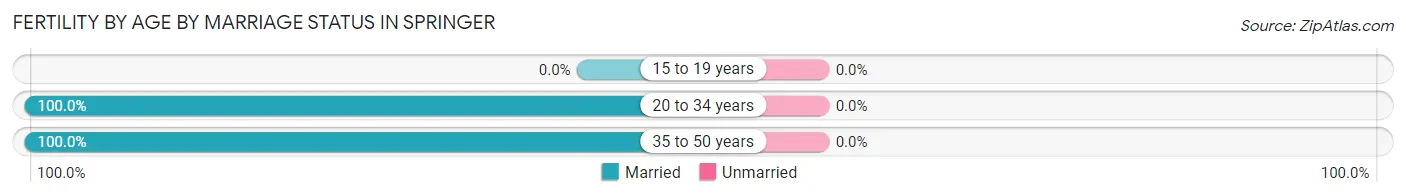
| Age Bracket | Married | Unmarried |
| 15 to 19 years | 0 (0.0%) | 0 (0.0%) |
| 20 to 34 years | 15 (100.0%) | 0 (0.0%) |
| 35 to 50 years | 3 (100.0%) | 0 (0.0%) |
| Total | 18 (100.0%) | 0 (0.0%) |
Fertility by Education in Springer
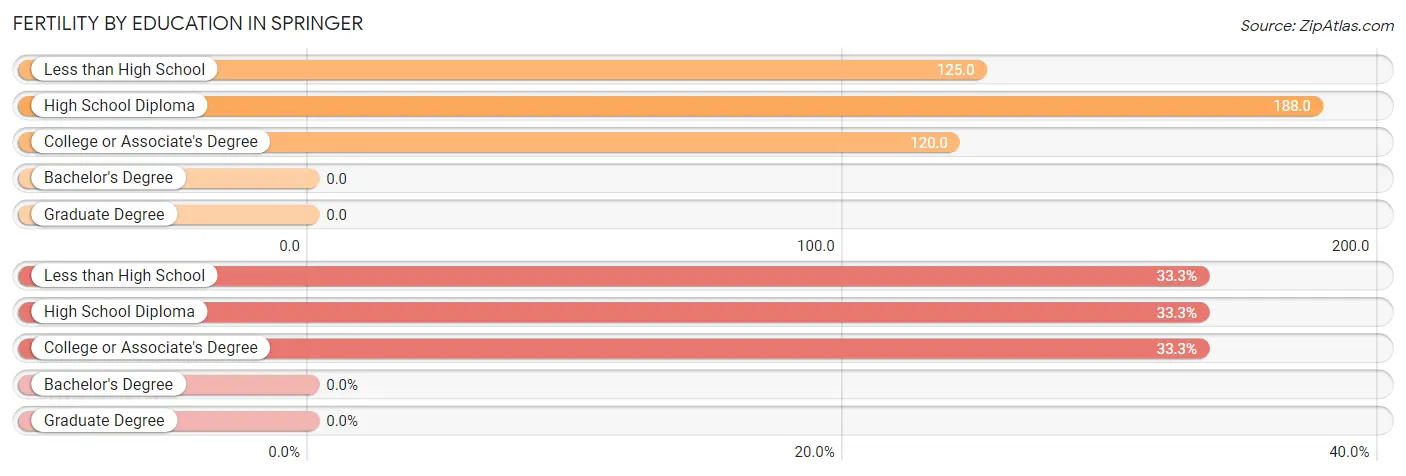
| Educational Attainment | Women with Births | Births / 1,000 Women |
| Less than High School | 6 (33.3%) | 125.0 |
| High School Diploma | 6 (33.3%) | 188.0 |
| College or Associate's Degree | 6 (33.3%) | 120.0 |
| Bachelor's Degree | 0 (0.0%) | 0.0 |
| Graduate Degree | 0 (0.0%) | 0.0 |
| Total | 18 (100.0%) | 114.0 |
Fertility by Education by Marriage Status in Springer
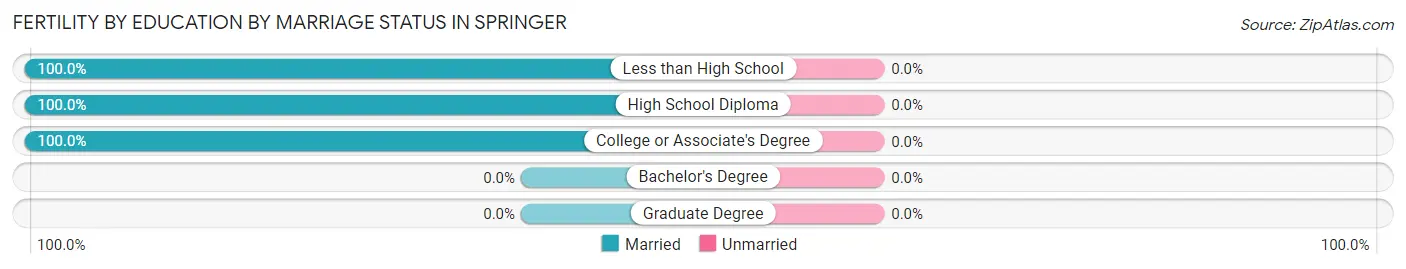
| Educational Attainment | Married | Unmarried |
| Less than High School | 6 (100.0%) | 0 (0.0%) |
| High School Diploma | 6 (100.0%) | 0 (0.0%) |
| College or Associate's Degree | 6 (100.0%) | 0 (0.0%) |
| Bachelor's Degree | 0 (0.0%) | 0 (0.0%) |
| Graduate Degree | 0 (0.0%) | 0 (0.0%) |
| Total | 18 (100.0%) | 0 (0.0%) |
Employment Characteristics in Springer
Employment by Class of Employer in Springer
Among the 279 employed individuals in Springer, private company employees (201 | 72.0%), local government employees (28 | 10.0%), and state government employees (17 | 6.1%) make up the most common classes of employment.
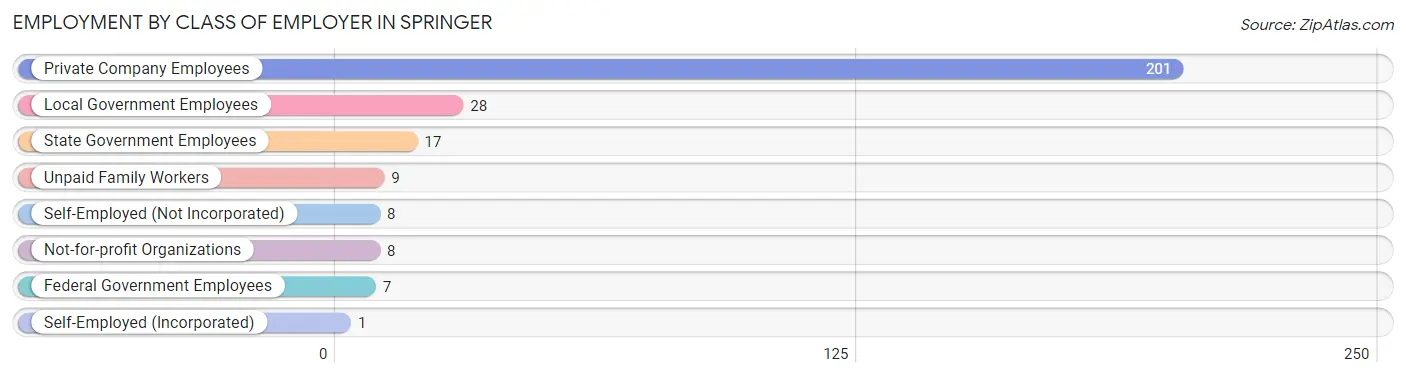
| Employer Class | # Employees | % Employees |
| Private Company Employees | 201 | 72.0% |
| Self-Employed (Incorporated) | 1 | 0.4% |
| Self-Employed (Not Incorporated) | 8 | 2.9% |
| Not-for-profit Organizations | 8 | 2.9% |
| Local Government Employees | 28 | 10.0% |
| State Government Employees | 17 | 6.1% |
| Federal Government Employees | 7 | 2.5% |
| Unpaid Family Workers | 9 | 3.2% |
| Total | 279 | 100.0% |
Employment Status by Age in Springer
According to the labor force statistics for Springer, out of the total population over 16 years of age (516), 56.6% or 292 individuals are in the labor force, with 1.7% or 5 of them unemployed. The age group with the highest labor force participation rate is 30 to 34 years, with 90.8% or 59 individuals in the labor force. Within the labor force, the 35 to 44 years age range has the highest percentage of unemployed individuals, with 5.9% or 3 of them being unemployed.
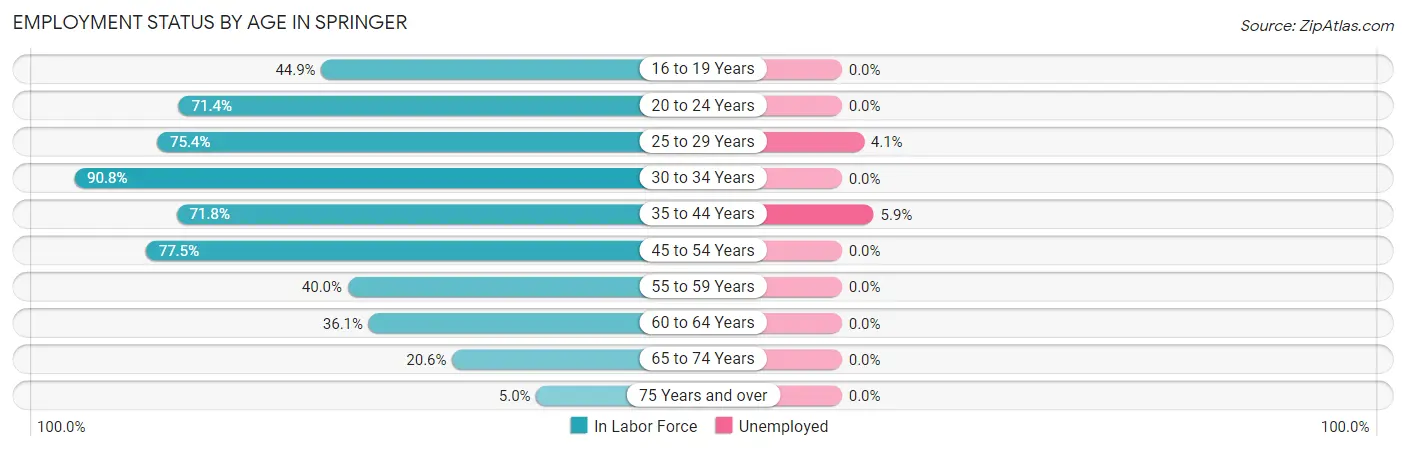
| Age Bracket | In Labor Force | Unemployed |
| 16 to 19 Years | 22 (44.9%) | 0 (0.0%) |
| 20 to 24 Years | 15 (71.4%) | 0 (0.0%) |
| 25 to 29 Years | 49 (75.4%) | 2 (4.1%) |
| 30 to 34 Years | 59 (90.8%) | 0 (0.0%) |
| 35 to 44 Years | 51 (71.8%) | 3 (5.9%) |
| 45 to 54 Years | 55 (77.5%) | 0 (0.0%) |
| 55 to 59 Years | 12 (40.0%) | 0 (0.0%) |
| 60 to 64 Years | 13 (36.1%) | 0 (0.0%) |
| 65 to 74 Years | 14 (20.6%) | 0 (0.0%) |
| 75 Years and over | 2 (5.0%) | 0 (0.0%) |
| Total | 292 (56.6%) | 5 (1.7%) |
Employment Status by Educational Attainment in Springer
According to labor force statistics for Springer, 70.7% of individuals (239) out of the total population between 25 and 64 years of age (338) are in the labor force, with 2.1% or 5 of them being unemployed. The group with the highest labor force participation rate are those with the educational attainment of less than high school, with 79.7% or 51 individuals in the labor force. Within the labor force, individuals with less than high school education have the highest percentage of unemployment, with 3.9% or 2 of them being unemployed.
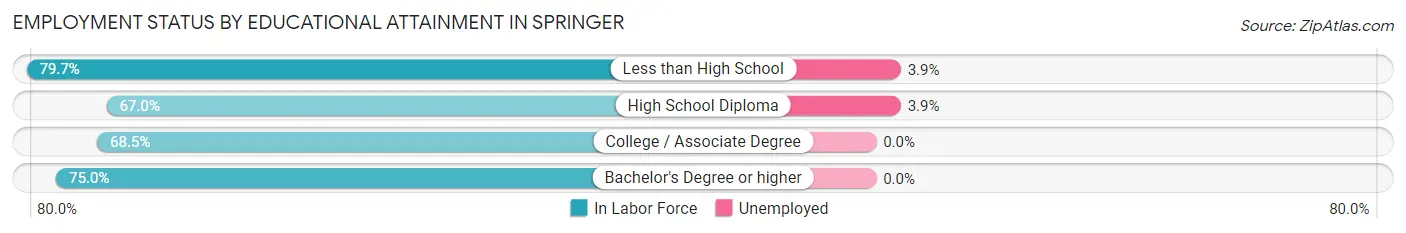
| Educational Attainment | In Labor Force | Unemployed |
| Less than High School | 51 (79.7%) | 2 (3.9%) |
| High School Diploma | 77 (67.0%) | 4 (3.9%) |
| College / Associate Degree | 87 (68.5%) | 0 (0.0%) |
| Bachelor's Degree or higher | 24 (75.0%) | 0 (0.0%) |
| Total | 239 (70.7%) | 7 (2.1%) |
Employment Occupations by Sex in Springer
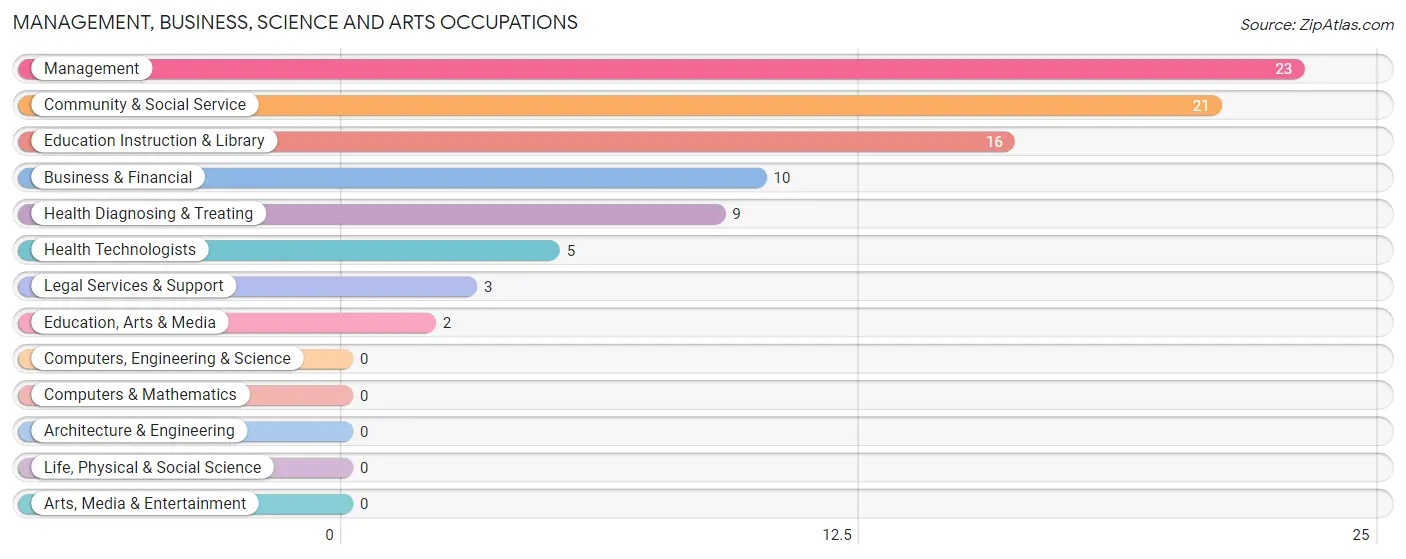
Management, Business, Science and Arts Occupations
The most common Management, Business, Science and Arts occupations in Springer are Management (23 | 8.0%), Community & Social Service (21 | 7.3%), Education Instruction & Library (16 | 5.6%), Business & Financial (10 | 3.5%), and Health Diagnosing & Treating (9 | 3.1%).
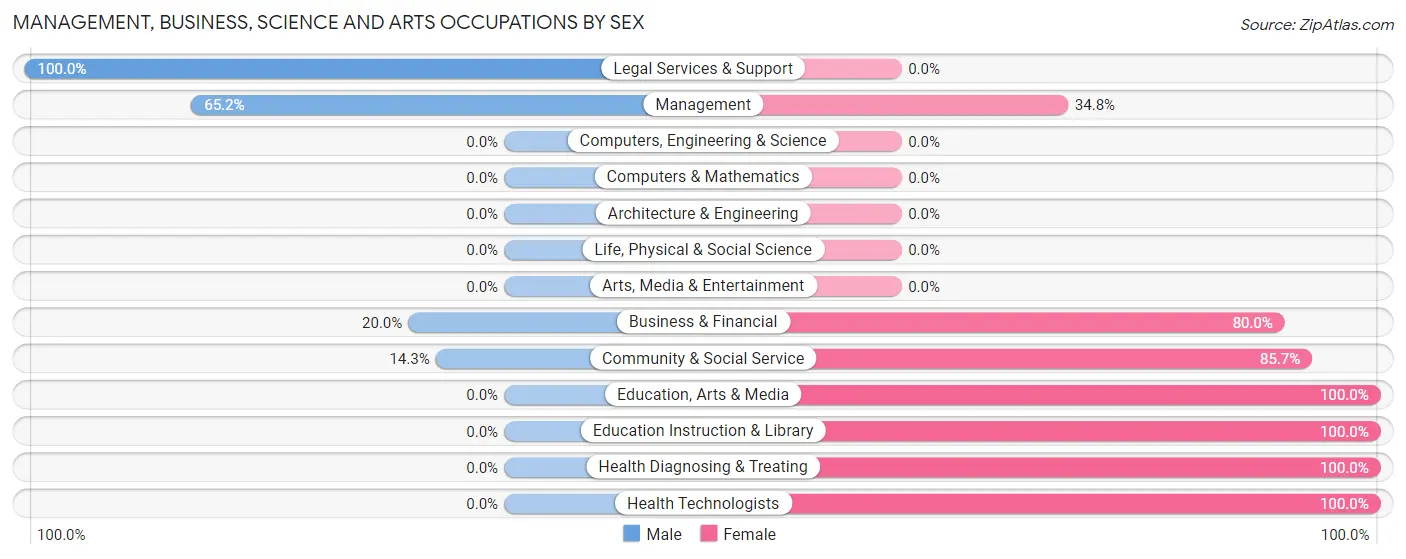
Management, Business, Science and Arts Occupations by Sex
Within the Management, Business, Science and Arts occupations in Springer, the most male-oriented occupations are Legal Services & Support (100.0%), Management (65.2%), and Business & Financial (20.0%), while the most female-oriented occupations are Education, Arts & Media (100.0%), Education Instruction & Library (100.0%), and Health Diagnosing & Treating (100.0%).
| Occupation | Male | Female |
| Management | 15 (65.2%) | 8 (34.8%) |
| Business & Financial | 2 (20.0%) | 8 (80.0%) |
| Computers, Engineering & Science | 0 (0.0%) | 0 (0.0%) |
| Computers & Mathematics | 0 (0.0%) | 0 (0.0%) |
| Architecture & Engineering | 0 (0.0%) | 0 (0.0%) |
| Life, Physical & Social Science | 0 (0.0%) | 0 (0.0%) |
| Community & Social Service | 3 (14.3%) | 18 (85.7%) |
| Education, Arts & Media | 0 (0.0%) | 2 (100.0%) |
| Legal Services & Support | 3 (100.0%) | 0 (0.0%) |
| Education Instruction & Library | 0 (0.0%) | 16 (100.0%) |
| Arts, Media & Entertainment | 0 (0.0%) | 0 (0.0%) |
| Health Diagnosing & Treating | 0 (0.0%) | 9 (100.0%) |
| Health Technologists | 0 (0.0%) | 5 (100.0%) |
| Total (Category) | 20 (31.8%) | 43 (68.2%) |
| Total (Overall) | 156 (54.4%) | 131 (45.6%) |
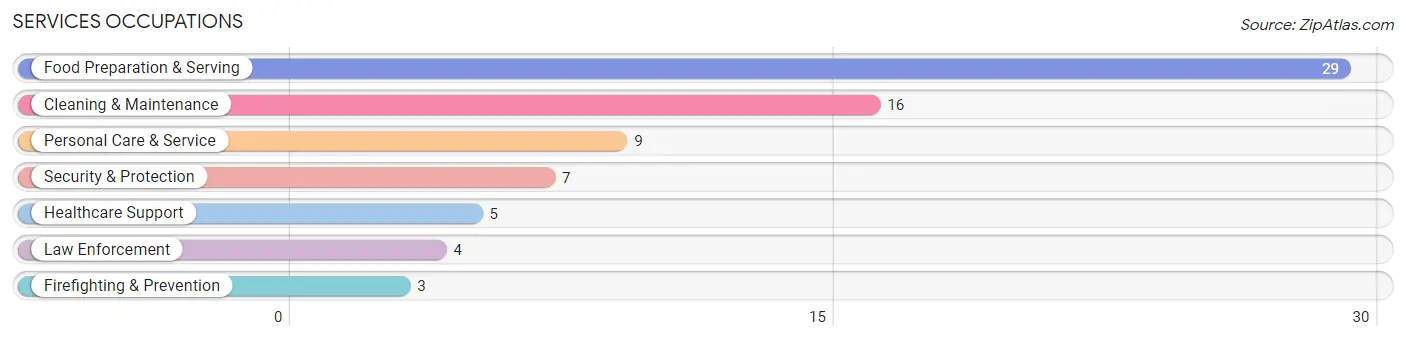
Services Occupations
The most common Services occupations in Springer are Food Preparation & Serving (29 | 10.1%), Cleaning & Maintenance (16 | 5.6%), Personal Care & Service (9 | 3.1%), Security & Protection (7 | 2.4%), and Healthcare Support (5 | 1.7%).
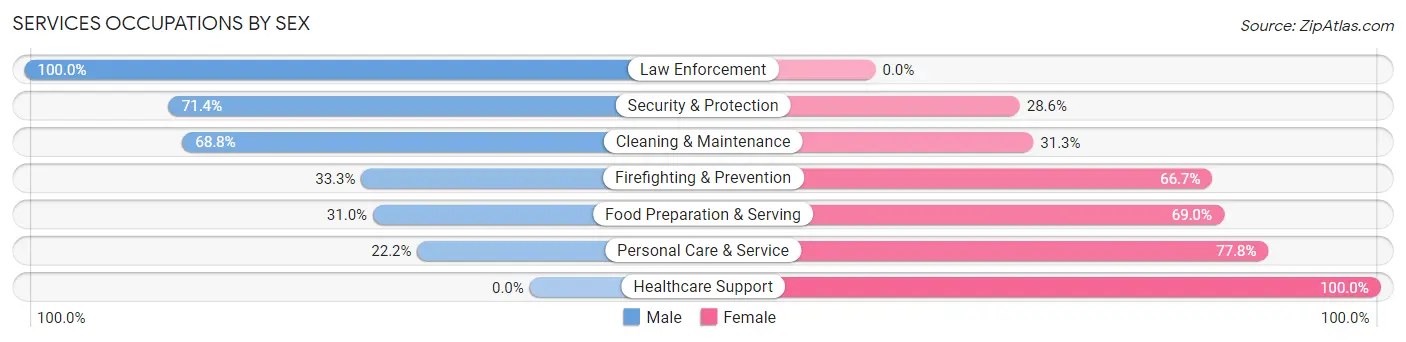
Services Occupations by Sex
Within the Services occupations in Springer, the most male-oriented occupations are Law Enforcement (100.0%), Security & Protection (71.4%), and Cleaning & Maintenance (68.8%), while the most female-oriented occupations are Healthcare Support (100.0%), Personal Care & Service (77.8%), and Food Preparation & Serving (69.0%).
| Occupation | Male | Female |
| Healthcare Support | 0 (0.0%) | 5 (100.0%) |
| Security & Protection | 5 (71.4%) | 2 (28.6%) |
| Firefighting & Prevention | 1 (33.3%) | 2 (66.7%) |
| Law Enforcement | 4 (100.0%) | 0 (0.0%) |
| Food Preparation & Serving | 9 (31.0%) | 20 (69.0%) |
| Cleaning & Maintenance | 11 (68.8%) | 5 (31.2%) |
| Personal Care & Service | 2 (22.2%) | 7 (77.8%) |
| Total (Category) | 27 (40.9%) | 39 (59.1%) |
| Total (Overall) | 156 (54.4%) | 131 (45.6%) |
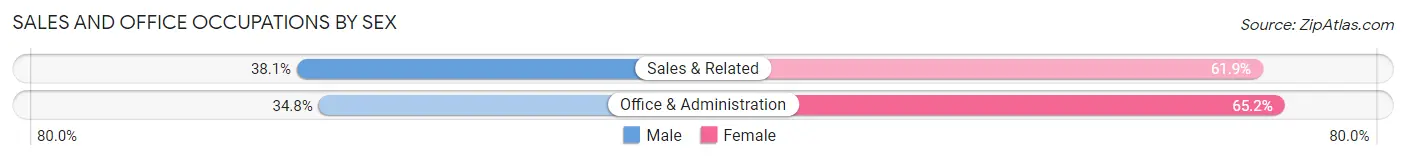
Sales and Office Occupations
The most common Sales and Office occupations in Springer are Office & Administration (23 | 8.0%), and Sales & Related (21 | 7.3%).
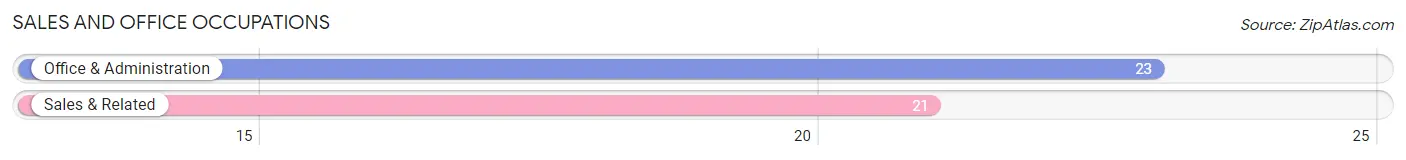
Sales and Office Occupations by Sex
| Occupation | Male | Female |
| Sales & Related | 8 (38.1%) | 13 (61.9%) |
| Office & Administration | 8 (34.8%) | 15 (65.2%) |
| Total (Category) | 16 (36.4%) | 28 (63.6%) |
| Total (Overall) | 156 (54.4%) | 131 (45.6%) |
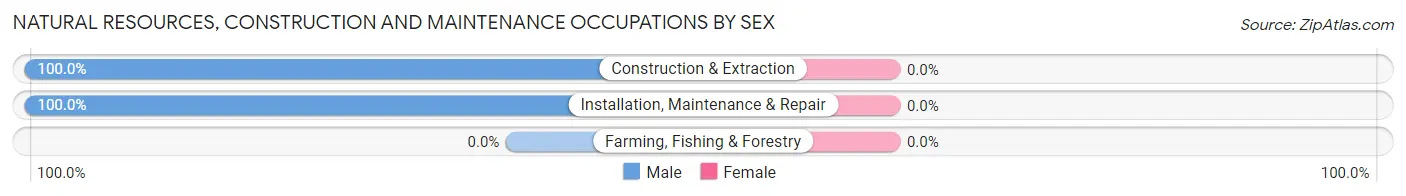
Natural Resources, Construction and Maintenance Occupations
The most common Natural Resources, Construction and Maintenance occupations in Springer are Construction & Extraction (17 | 5.9%), and Installation, Maintenance & Repair (17 | 5.9%).
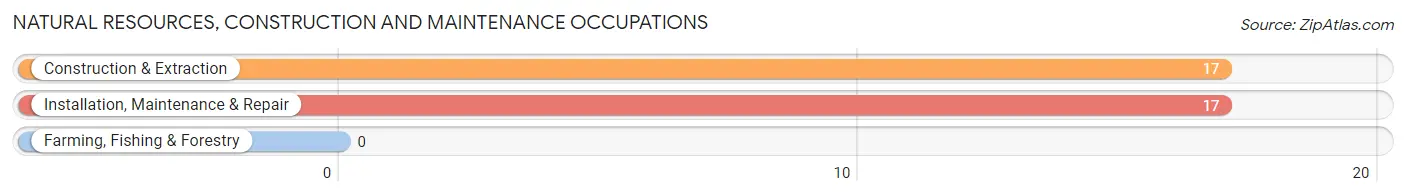
Natural Resources, Construction and Maintenance Occupations by Sex
| Occupation | Male | Female |
| Farming, Fishing & Forestry | 0 (0.0%) | 0 (0.0%) |
| Construction & Extraction | 17 (100.0%) | 0 (0.0%) |
| Installation, Maintenance & Repair | 17 (100.0%) | 0 (0.0%) |
| Total (Category) | 34 (100.0%) | 0 (0.0%) |
| Total (Overall) | 156 (54.4%) | 131 (45.6%) |
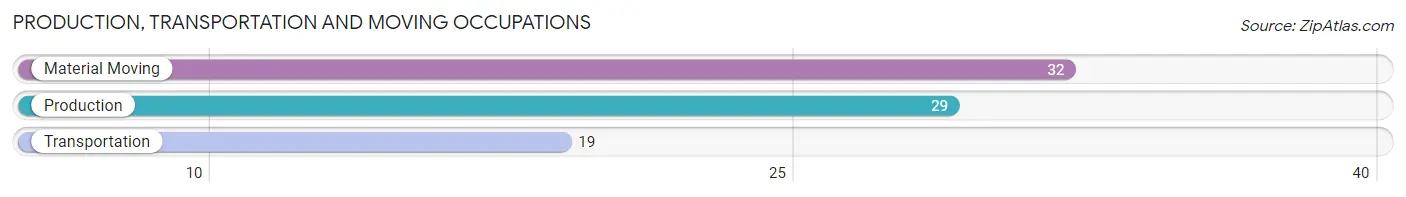
Production, Transportation and Moving Occupations
The most common Production, Transportation and Moving occupations in Springer are Material Moving (32 | 11.2%), Production (29 | 10.1%), and Transportation (19 | 6.6%).
Production, Transportation and Moving Occupations by Sex
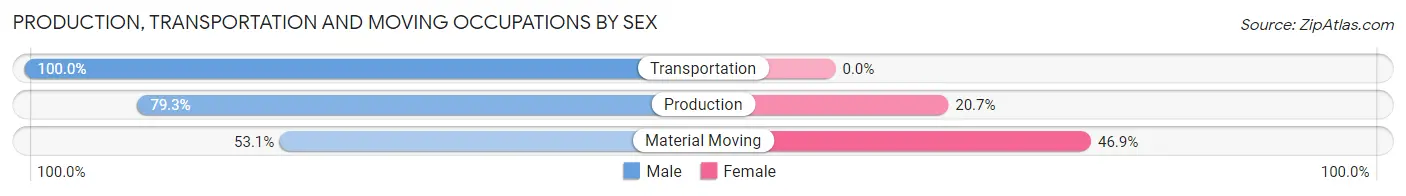
| Occupation | Male | Female |
| Production | 23 (79.3%) | 6 (20.7%) |
| Transportation | 19 (100.0%) | 0 (0.0%) |
| Material Moving | 17 (53.1%) | 15 (46.9%) |
| Total (Category) | 59 (73.8%) | 21 (26.3%) |
| Total (Overall) | 156 (54.4%) | 131 (45.6%) |
Employment Industries by Sex in Springer
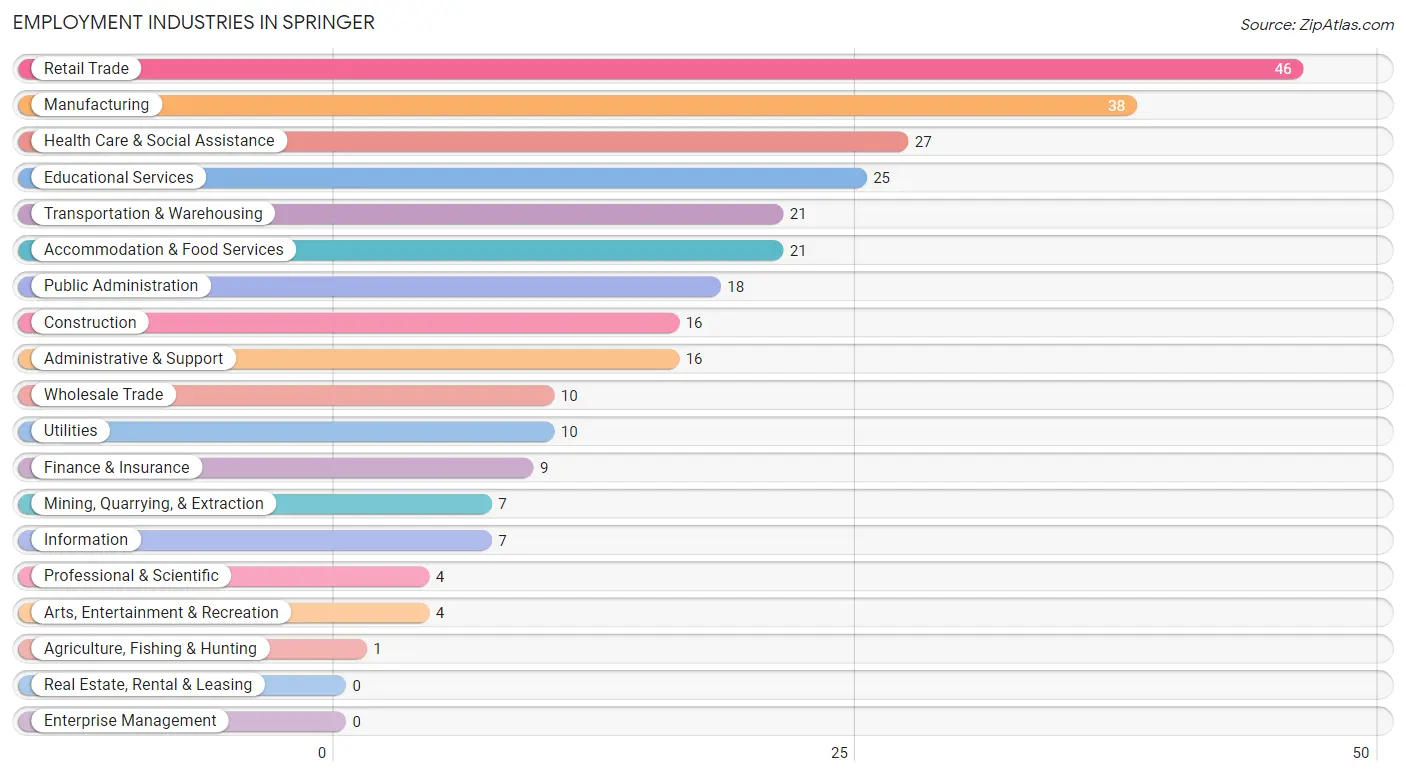
Employment Industries in Springer
The major employment industries in Springer include Retail Trade (46 | 16.0%), Manufacturing (38 | 13.2%), Health Care & Social Assistance (27 | 9.4%), Educational Services (25 | 8.7%), and Transportation & Warehousing (21 | 7.3%).
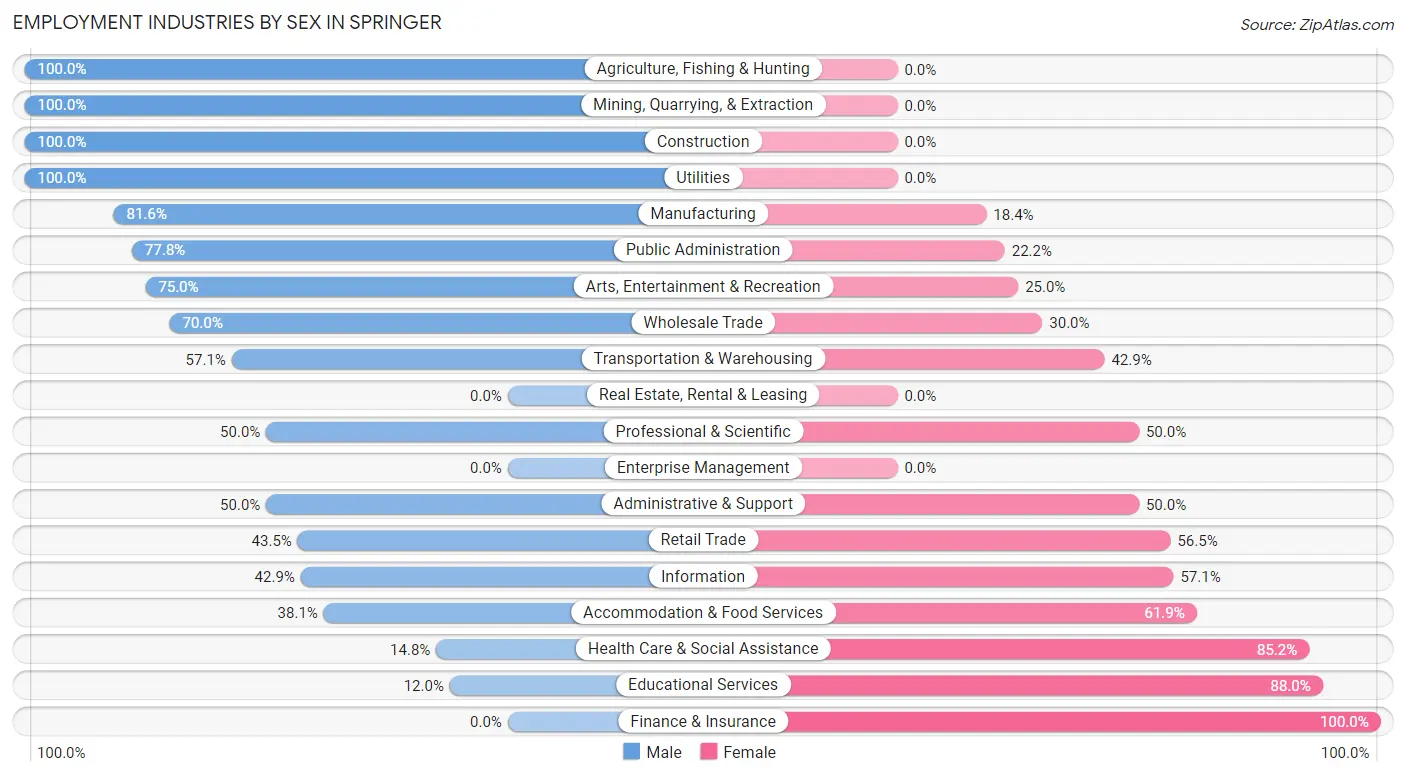
Employment Industries by Sex in Springer
The Springer industries that see more men than women are Agriculture, Fishing & Hunting (100.0%), Mining, Quarrying, & Extraction (100.0%), and Construction (100.0%), whereas the industries that tend to have a higher number of women are Finance & Insurance (100.0%), Educational Services (88.0%), and Health Care & Social Assistance (85.2%).
| Industry | Male | Female |
| Agriculture, Fishing & Hunting | 1 (100.0%) | 0 (0.0%) |
| Mining, Quarrying, & Extraction | 7 (100.0%) | 0 (0.0%) |
| Construction | 16 (100.0%) | 0 (0.0%) |
| Manufacturing | 31 (81.6%) | 7 (18.4%) |
| Wholesale Trade | 7 (70.0%) | 3 (30.0%) |
| Retail Trade | 20 (43.5%) | 26 (56.5%) |
| Transportation & Warehousing | 12 (57.1%) | 9 (42.9%) |
| Utilities | 10 (100.0%) | 0 (0.0%) |
| Information | 3 (42.9%) | 4 (57.1%) |
| Finance & Insurance | 0 (0.0%) | 9 (100.0%) |
| Real Estate, Rental & Leasing | 0 (0.0%) | 0 (0.0%) |
| Professional & Scientific | 2 (50.0%) | 2 (50.0%) |
| Enterprise Management | 0 (0.0%) | 0 (0.0%) |
| Administrative & Support | 8 (50.0%) | 8 (50.0%) |
| Educational Services | 3 (12.0%) | 22 (88.0%) |
| Health Care & Social Assistance | 4 (14.8%) | 23 (85.2%) |
| Arts, Entertainment & Recreation | 3 (75.0%) | 1 (25.0%) |
| Accommodation & Food Services | 8 (38.1%) | 13 (61.9%) |
| Public Administration | 14 (77.8%) | 4 (22.2%) |
| Total | 156 (54.4%) | 131 (45.6%) |
Education in Springer
School Enrollment in Springer
The most common levels of schooling among the 212 students in Springer are middle school (57 | 26.9%), elementary school (51 | 24.1%), and high school (39 | 18.4%).
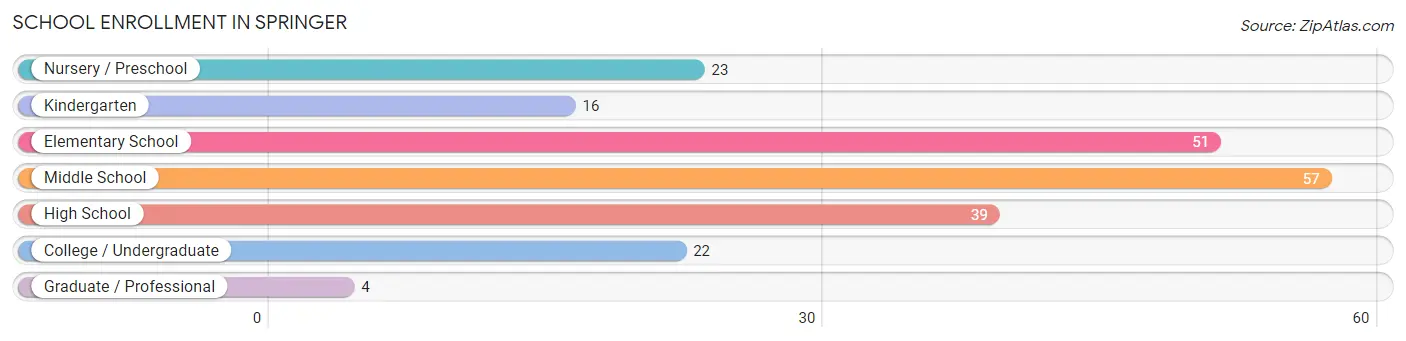
| School Level | # Students | % Students |
| Nursery / Preschool | 23 | 10.8% |
| Kindergarten | 16 | 7.5% |
| Elementary School | 51 | 24.1% |
| Middle School | 57 | 26.9% |
| High School | 39 | 18.4% |
| College / Undergraduate | 22 | 10.4% |
| Graduate / Professional | 4 | 1.9% |
| Total | 212 | 100.0% |
School Enrollment by Age by Funding Source in Springer
Out of a total of 212 students who are enrolled in schools in Springer, 13 (6.1%) attend a private institution, while the remaining 199 (93.9%) are enrolled in public schools. The age group of 15 to 17 year olds has the highest likelihood of being enrolled in private schools, with 8 (27.6% in the age bracket) enrolled. Conversely, the age group of 5 to 9 year old has the lowest likelihood of being enrolled in a private school, with 71 (100.0% in the age bracket) attending a public institution.
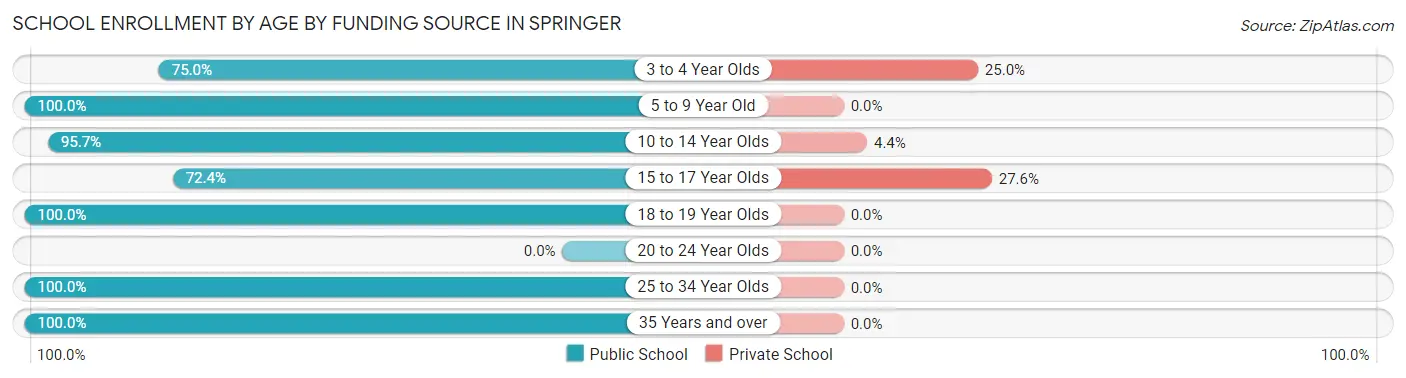
| Age Bracket | Public School | Private School |
| 3 to 4 Year Olds | 6 (75.0%) | 2 (25.0%) |
| 5 to 9 Year Old | 71 (100.0%) | 0 (0.0%) |
| 10 to 14 Year Olds | 66 (95.7%) | 3 (4.3%) |
| 15 to 17 Year Olds | 21 (72.4%) | 8 (27.6%) |
| 18 to 19 Year Olds | 11 (100.0%) | 0 (0.0%) |
| 20 to 24 Year Olds | 0 (0.0%) | 0 (0.0%) |
| 25 to 34 Year Olds | 20 (100.0%) | 0 (0.0%) |
| 35 Years and over | 4 (100.0%) | 0 (0.0%) |
| Total | 199 (93.9%) | 13 (6.1%) |
Educational Attainment by Field of Study in Springer
Education (32 | 45.1%), business (12 | 16.9%), psychology (11 | 15.5%), bio, nature & agricultural (4 | 5.6%), and physical & health sciences (4 | 5.6%) are the most common fields of study among 71 individuals in Springer who have obtained a bachelor's degree or higher.
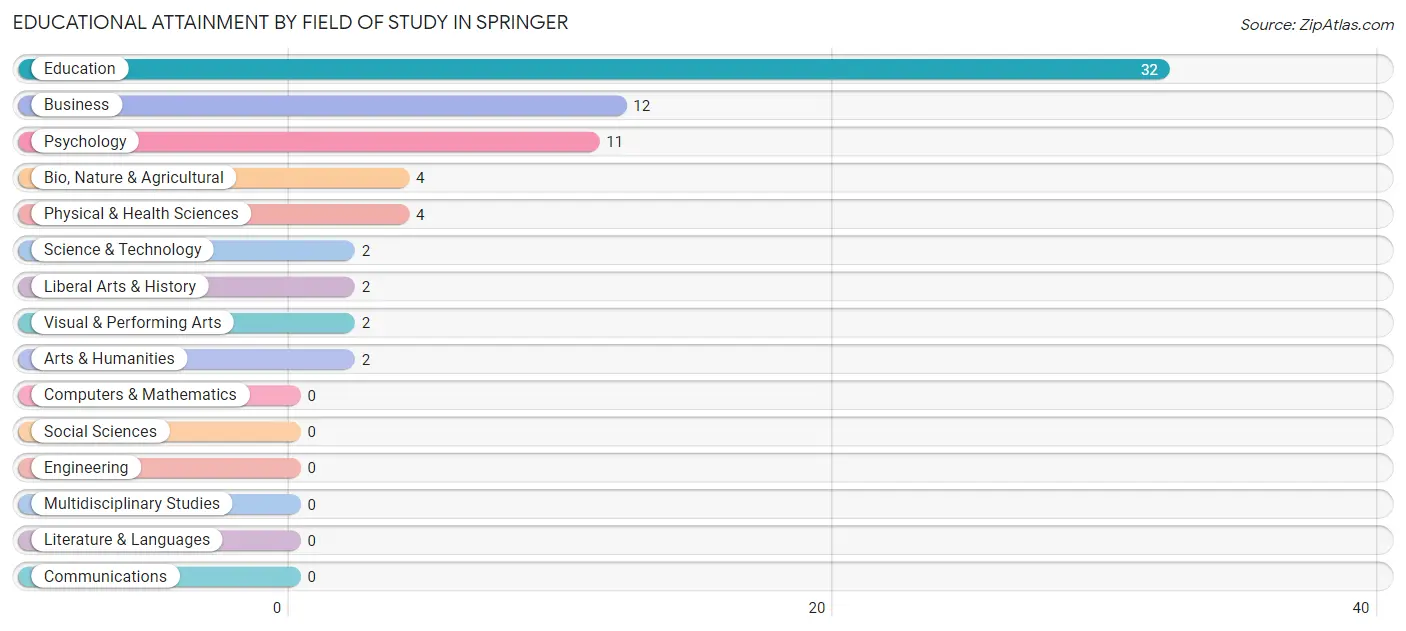
| Field of Study | # Graduates | % Graduates |
| Computers & Mathematics | 0 | 0.0% |
| Bio, Nature & Agricultural | 4 | 5.6% |
| Physical & Health Sciences | 4 | 5.6% |
| Psychology | 11 | 15.5% |
| Social Sciences | 0 | 0.0% |
| Engineering | 0 | 0.0% |
| Multidisciplinary Studies | 0 | 0.0% |
| Science & Technology | 2 | 2.8% |
| Business | 12 | 16.9% |
| Education | 32 | 45.1% |
| Literature & Languages | 0 | 0.0% |
| Liberal Arts & History | 2 | 2.8% |
| Visual & Performing Arts | 2 | 2.8% |
| Communications | 0 | 0.0% |
| Arts & Humanities | 2 | 2.8% |
| Total | 71 | 100.0% |
Transportation & Commute in Springer
Vehicle Availability by Sex in Springer
The most prevalent vehicle ownership categories in Springer are males with 2 vehicles (69, accounting for 45.1%) and females with 2 vehicles (62, making up 54.8%).
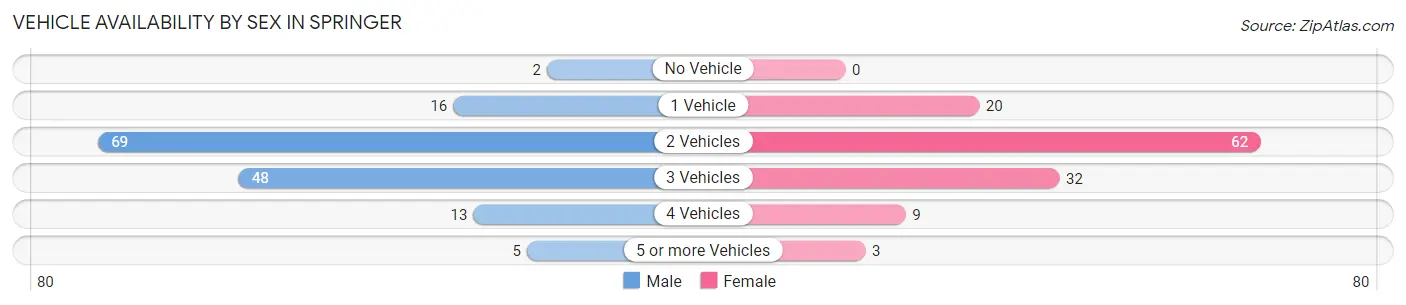
| Vehicles Available | Male | Female |
| No Vehicle | 2 (1.3%) | 0 (0.0%) |
| 1 Vehicle | 16 (10.5%) | 20 (15.9%) |
| 2 Vehicles | 69 (45.1%) | 62 (49.2%) |
| 3 Vehicles | 48 (31.4%) | 32 (25.4%) |
| 4 Vehicles | 13 (8.5%) | 9 (7.1%) |
| 5 or more Vehicles | 5 (3.3%) | 3 (2.4%) |
| Total | 153 (100.0%) | 126 (100.0%) |
Commute Time in Springer
The most frequently occuring commute durations in Springer are 15 to 19 minutes (113 commuters, 40.5%), 10 to 14 minutes (43 commuters, 15.4%), and 30 to 34 minutes (24 commuters, 8.6%).
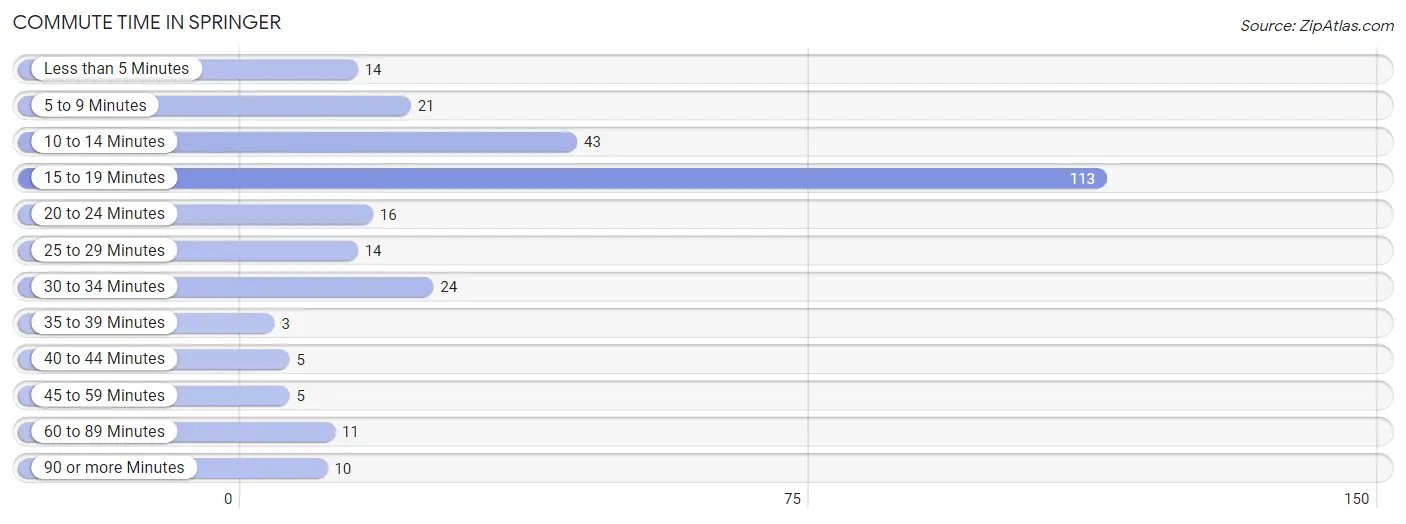
| Commute Time | # Commuters | % Commuters |
| Less than 5 Minutes | 14 | 5.0% |
| 5 to 9 Minutes | 21 | 7.5% |
| 10 to 14 Minutes | 43 | 15.4% |
| 15 to 19 Minutes | 113 | 40.5% |
| 20 to 24 Minutes | 16 | 5.7% |
| 25 to 29 Minutes | 14 | 5.0% |
| 30 to 34 Minutes | 24 | 8.6% |
| 35 to 39 Minutes | 3 | 1.1% |
| 40 to 44 Minutes | 5 | 1.8% |
| 45 to 59 Minutes | 5 | 1.8% |
| 60 to 89 Minutes | 11 | 3.9% |
| 90 or more Minutes | 10 | 3.6% |
Commute Time by Sex in Springer
The most common commute times in Springer are 15 to 19 minutes (60 commuters, 39.2%) for males and 15 to 19 minutes (53 commuters, 42.1%) for females.
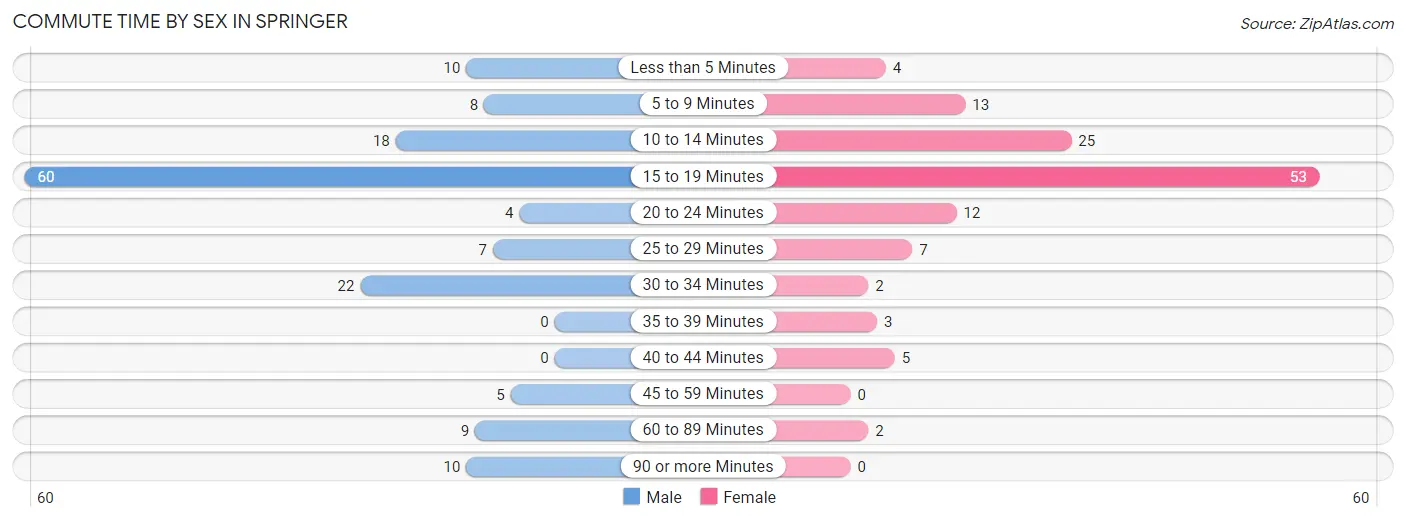
| Commute Time | Male | Female |
| Less than 5 Minutes | 10 (6.5%) | 4 (3.2%) |
| 5 to 9 Minutes | 8 (5.2%) | 13 (10.3%) |
| 10 to 14 Minutes | 18 (11.8%) | 25 (19.8%) |
| 15 to 19 Minutes | 60 (39.2%) | 53 (42.1%) |
| 20 to 24 Minutes | 4 (2.6%) | 12 (9.5%) |
| 25 to 29 Minutes | 7 (4.6%) | 7 (5.6%) |
| 30 to 34 Minutes | 22 (14.4%) | 2 (1.6%) |
| 35 to 39 Minutes | 0 (0.0%) | 3 (2.4%) |
| 40 to 44 Minutes | 0 (0.0%) | 5 (4.0%) |
| 45 to 59 Minutes | 5 (3.3%) | 0 (0.0%) |
| 60 to 89 Minutes | 9 (5.9%) | 2 (1.6%) |
| 90 or more Minutes | 10 (6.5%) | 0 (0.0%) |
Time of Departure to Work by Sex in Springer
The most frequent times of departure to work in Springer are 5:30 AM to 5:59 AM (23, 15.0%) for males and 7:00 AM to 7:29 AM (26, 20.6%) for females.
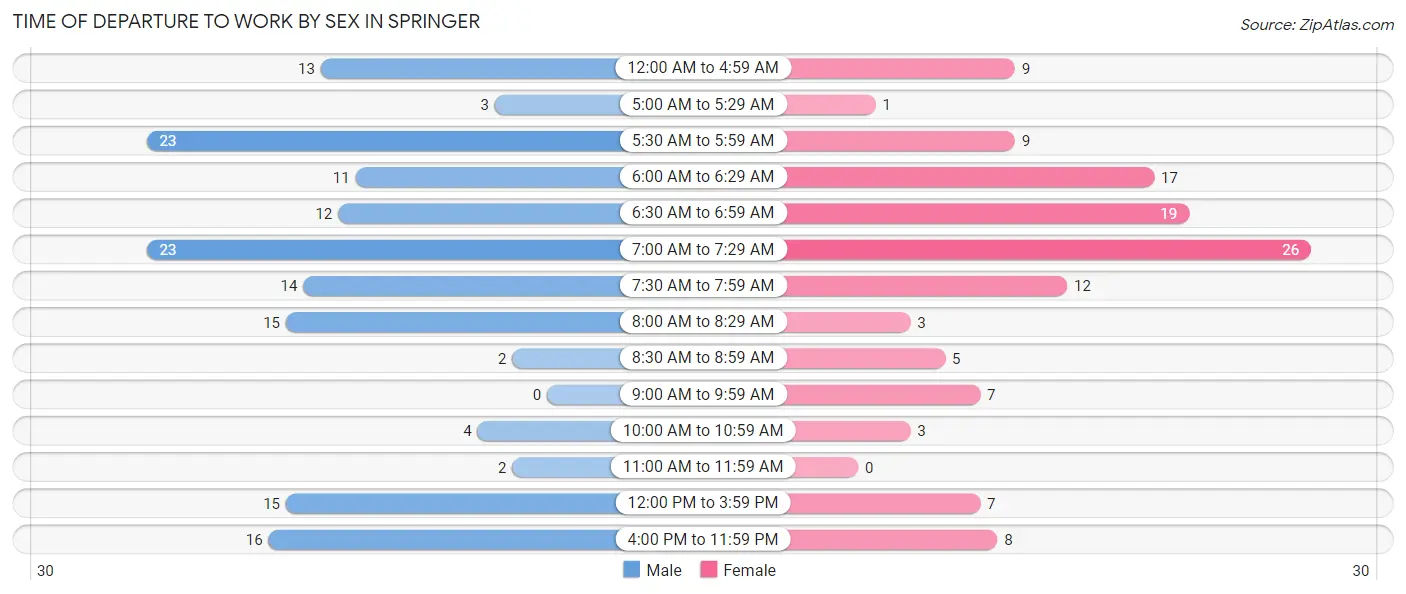
| Time of Departure | Male | Female |
| 12:00 AM to 4:59 AM | 13 (8.5%) | 9 (7.1%) |
| 5:00 AM to 5:29 AM | 3 (2.0%) | 1 (0.8%) |
| 5:30 AM to 5:59 AM | 23 (15.0%) | 9 (7.1%) |
| 6:00 AM to 6:29 AM | 11 (7.2%) | 17 (13.5%) |
| 6:30 AM to 6:59 AM | 12 (7.8%) | 19 (15.1%) |
| 7:00 AM to 7:29 AM | 23 (15.0%) | 26 (20.6%) |
| 7:30 AM to 7:59 AM | 14 (9.1%) | 12 (9.5%) |
| 8:00 AM to 8:29 AM | 15 (9.8%) | 3 (2.4%) |
| 8:30 AM to 8:59 AM | 2 (1.3%) | 5 (4.0%) |
| 9:00 AM to 9:59 AM | 0 (0.0%) | 7 (5.6%) |
| 10:00 AM to 10:59 AM | 4 (2.6%) | 3 (2.4%) |
| 11:00 AM to 11:59 AM | 2 (1.3%) | 0 (0.0%) |
| 12:00 PM to 3:59 PM | 15 (9.8%) | 7 (5.6%) |
| 4:00 PM to 11:59 PM | 16 (10.5%) | 8 (6.4%) |
| Total | 153 (100.0%) | 126 (100.0%) |
Housing Occupancy in Springer
Occupancy by Ownership in Springer
Of the total 268 dwellings in Springer, owner-occupied units account for 181 (67.5%), while renter-occupied units make up 87 (32.5%).
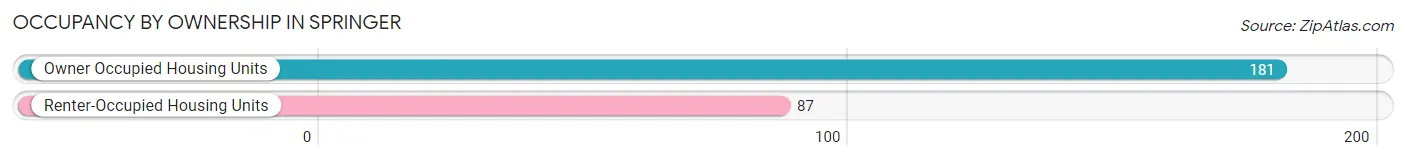
| Occupancy | # Housing Units | % Housing Units |
| Owner Occupied Housing Units | 181 | 67.5% |
| Renter-Occupied Housing Units | 87 | 32.5% |
| Total Occupied Housing Units | 268 | 100.0% |
Occupancy by Household Size in Springer
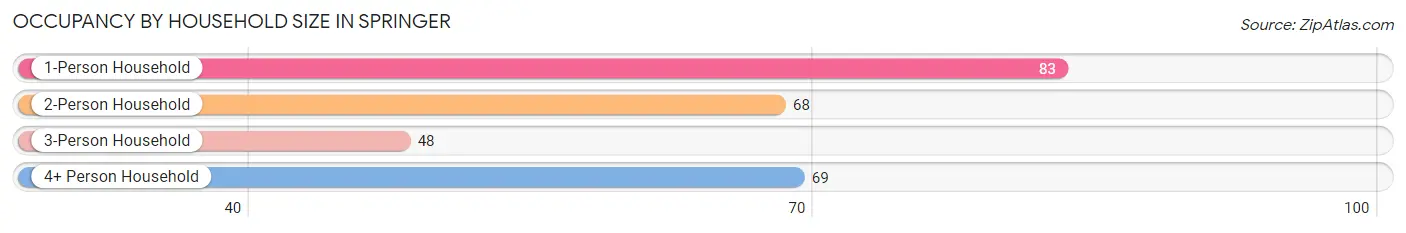
| Household Size | # Housing Units | % Housing Units |
| 1-Person Household | 83 | 31.0% |
| 2-Person Household | 68 | 25.4% |
| 3-Person Household | 48 | 17.9% |
| 4+ Person Household | 69 | 25.8% |
| Total Housing Units | 268 | 100.0% |
Occupancy by Ownership by Household Size in Springer
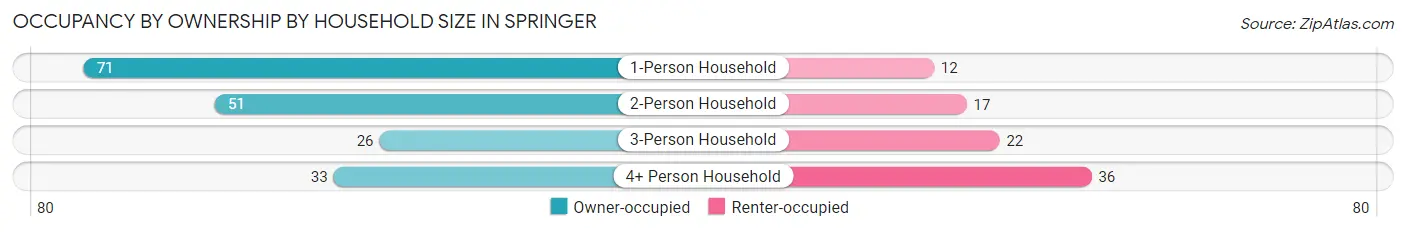
| Household Size | Owner-occupied | Renter-occupied |
| 1-Person Household | 71 (85.5%) | 12 (14.5%) |
| 2-Person Household | 51 (75.0%) | 17 (25.0%) |
| 3-Person Household | 26 (54.2%) | 22 (45.8%) |
| 4+ Person Household | 33 (47.8%) | 36 (52.2%) |
| Total Housing Units | 181 (67.5%) | 87 (32.5%) |
Occupancy by Educational Attainment in Springer
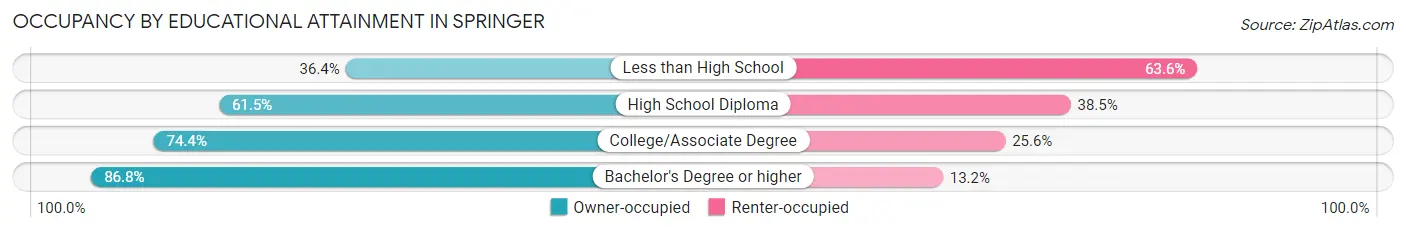
| Household Size | Owner-occupied | Renter-occupied |
| Less than High School | 12 (36.4%) | 21 (63.6%) |
| High School Diploma | 59 (61.5%) | 37 (38.5%) |
| College/Associate Degree | 64 (74.4%) | 22 (25.6%) |
| Bachelor's Degree or higher | 46 (86.8%) | 7 (13.2%) |
Occupancy by Age of Householder in Springer
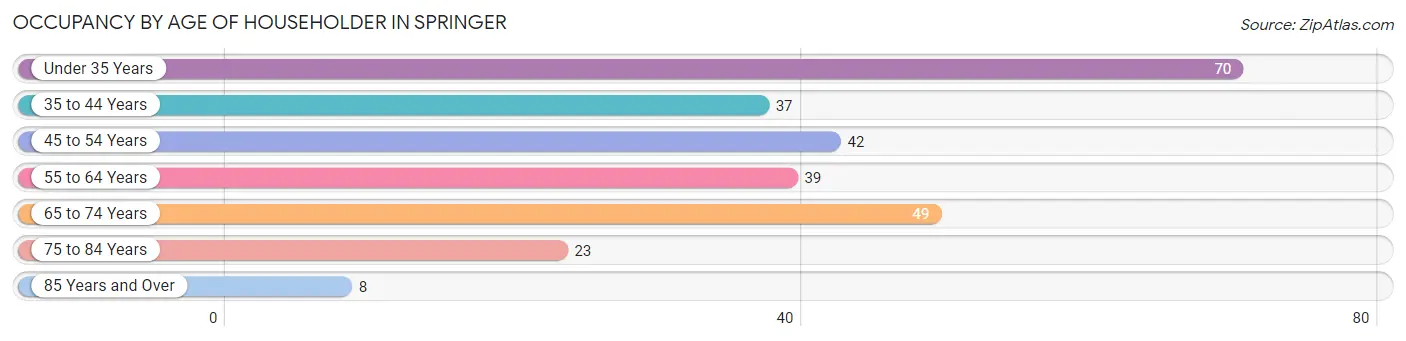
| Age Bracket | # Households | % Households |
| Under 35 Years | 70 | 26.1% |
| 35 to 44 Years | 37 | 13.8% |
| 45 to 54 Years | 42 | 15.7% |
| 55 to 64 Years | 39 | 14.5% |
| 65 to 74 Years | 49 | 18.3% |
| 75 to 84 Years | 23 | 8.6% |
| 85 Years and Over | 8 | 3.0% |
| Total | 268 | 100.0% |
Housing Finances in Springer
Median Income by Occupancy in Springer
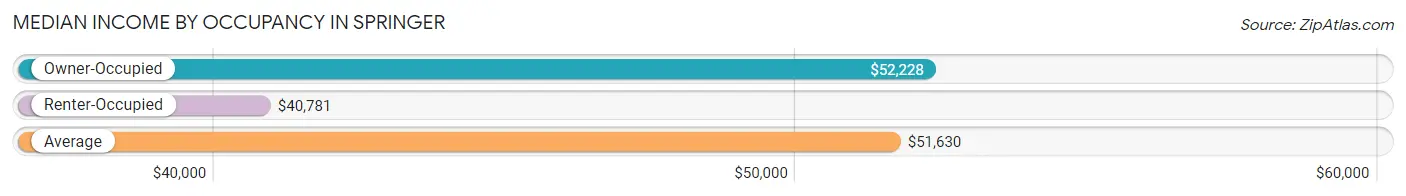
| Occupancy Type | # Households | Median Income |
| Owner-Occupied | 181 (67.5%) | $52,228 |
| Renter-Occupied | 87 (32.5%) | $40,781 |
| Average | 268 (100.0%) | $51,630 |
Occupancy by Householder Income Bracket in Springer
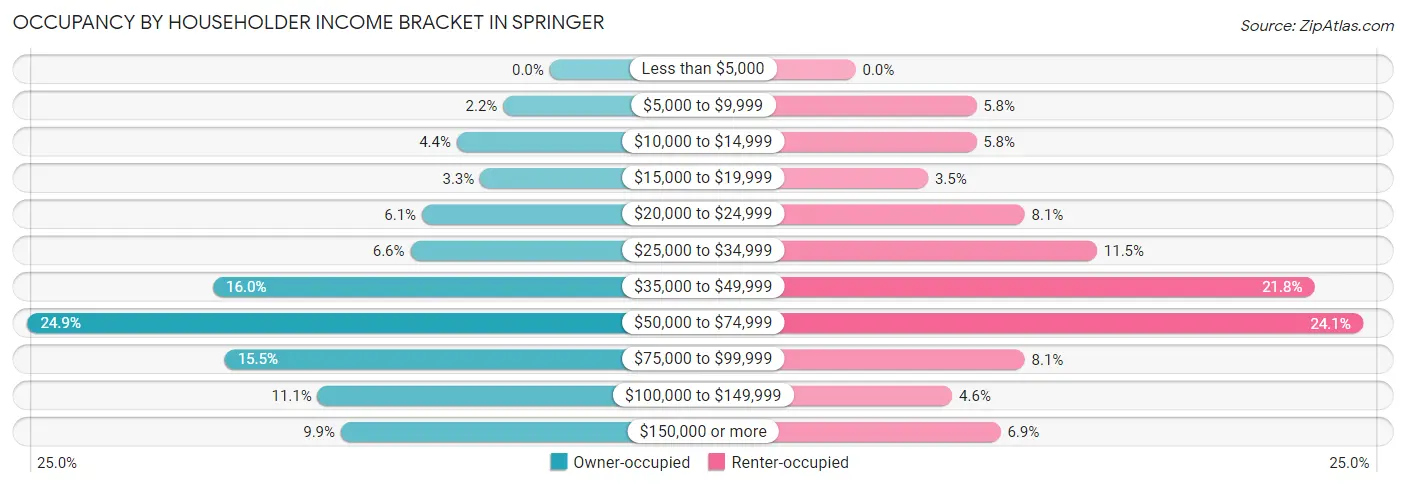
| Income Bracket | Owner-occupied | Renter-occupied |
| Less than $5,000 | 0 (0.0%) | 0 (0.0%) |
| $5,000 to $9,999 | 4 (2.2%) | 5 (5.8%) |
| $10,000 to $14,999 | 8 (4.4%) | 5 (5.8%) |
| $15,000 to $19,999 | 6 (3.3%) | 3 (3.5%) |
| $20,000 to $24,999 | 11 (6.1%) | 7 (8.1%) |
| $25,000 to $34,999 | 12 (6.6%) | 10 (11.5%) |
| $35,000 to $49,999 | 29 (16.0%) | 19 (21.8%) |
| $50,000 to $74,999 | 45 (24.9%) | 21 (24.1%) |
| $75,000 to $99,999 | 28 (15.5%) | 7 (8.1%) |
| $100,000 to $149,999 | 20 (11.1%) | 4 (4.6%) |
| $150,000 or more | 18 (9.9%) | 6 (6.9%) |
| Total | 181 (100.0%) | 87 (100.0%) |
Monthly Housing Cost Tiers in Springer
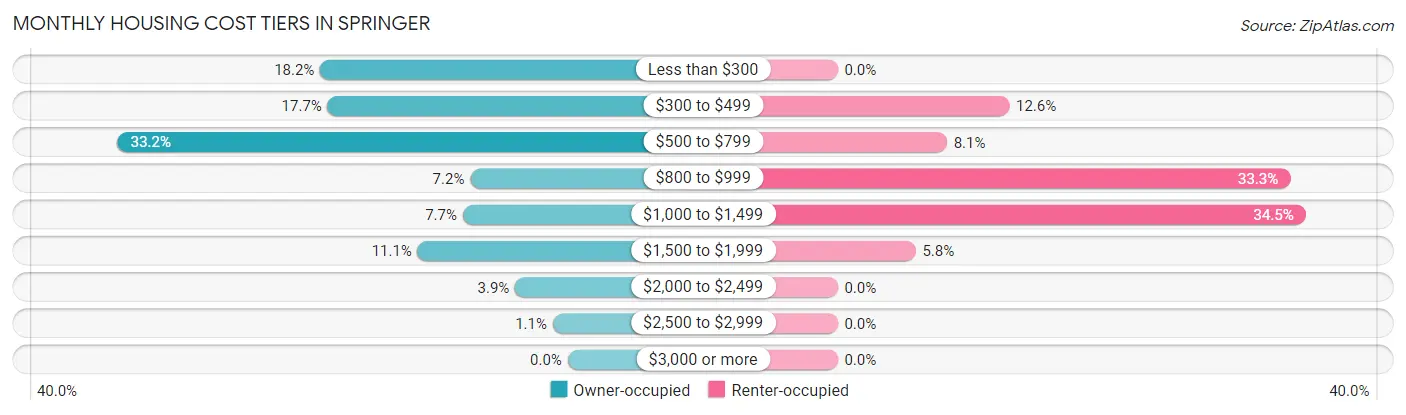
| Monthly Cost | Owner-occupied | Renter-occupied |
| Less than $300 | 33 (18.2%) | 0 (0.0%) |
| $300 to $499 | 32 (17.7%) | 11 (12.6%) |
| $500 to $799 | 60 (33.2%) | 7 (8.1%) |
| $800 to $999 | 13 (7.2%) | 29 (33.3%) |
| $1,000 to $1,499 | 14 (7.7%) | 30 (34.5%) |
| $1,500 to $1,999 | 20 (11.1%) | 5 (5.8%) |
| $2,000 to $2,499 | 7 (3.9%) | 0 (0.0%) |
| $2,500 to $2,999 | 2 (1.1%) | 0 (0.0%) |
| $3,000 or more | 0 (0.0%) | 0 (0.0%) |
| Total | 181 (100.0%) | 87 (100.0%) |
Physical Housing Characteristics in Springer
Housing Structures in Springer
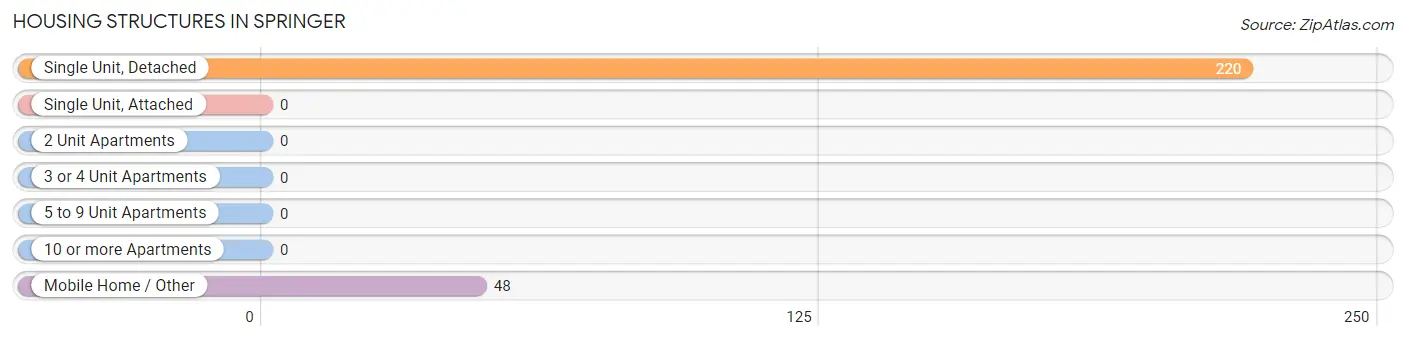
| Structure Type | # Housing Units | % Housing Units |
| Single Unit, Detached | 220 | 82.1% |
| Single Unit, Attached | 0 | 0.0% |
| 2 Unit Apartments | 0 | 0.0% |
| 3 or 4 Unit Apartments | 0 | 0.0% |
| 5 to 9 Unit Apartments | 0 | 0.0% |
| 10 or more Apartments | 0 | 0.0% |
| Mobile Home / Other | 48 | 17.9% |
| Total | 268 | 100.0% |
Housing Structures by Occupancy in Springer
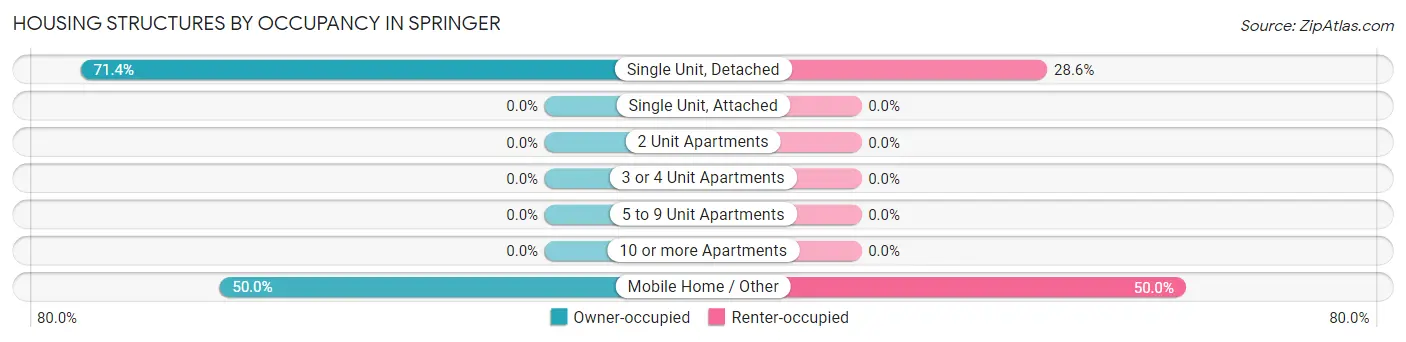
| Structure Type | Owner-occupied | Renter-occupied |
| Single Unit, Detached | 157 (71.4%) | 63 (28.6%) |
| Single Unit, Attached | 0 (0.0%) | 0 (0.0%) |
| 2 Unit Apartments | 0 (0.0%) | 0 (0.0%) |
| 3 or 4 Unit Apartments | 0 (0.0%) | 0 (0.0%) |
| 5 to 9 Unit Apartments | 0 (0.0%) | 0 (0.0%) |
| 10 or more Apartments | 0 (0.0%) | 0 (0.0%) |
| Mobile Home / Other | 24 (50.0%) | 24 (50.0%) |
| Total | 181 (67.5%) | 87 (32.5%) |
Housing Structures by Number of Rooms in Springer
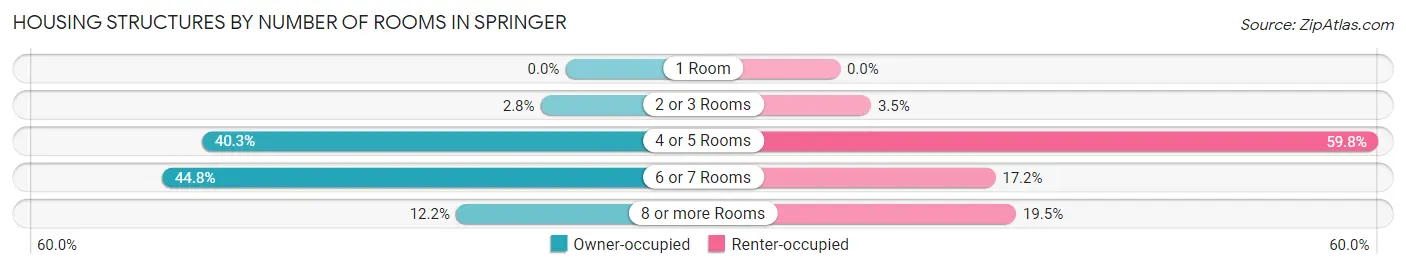
| Number of Rooms | Owner-occupied | Renter-occupied |
| 1 Room | 0 (0.0%) | 0 (0.0%) |
| 2 or 3 Rooms | 5 (2.8%) | 3 (3.5%) |
| 4 or 5 Rooms | 73 (40.3%) | 52 (59.8%) |
| 6 or 7 Rooms | 81 (44.8%) | 15 (17.2%) |
| 8 or more Rooms | 22 (12.1%) | 17 (19.5%) |
| Total | 181 (100.0%) | 87 (100.0%) |
Housing Structure by Heating Type in Springer
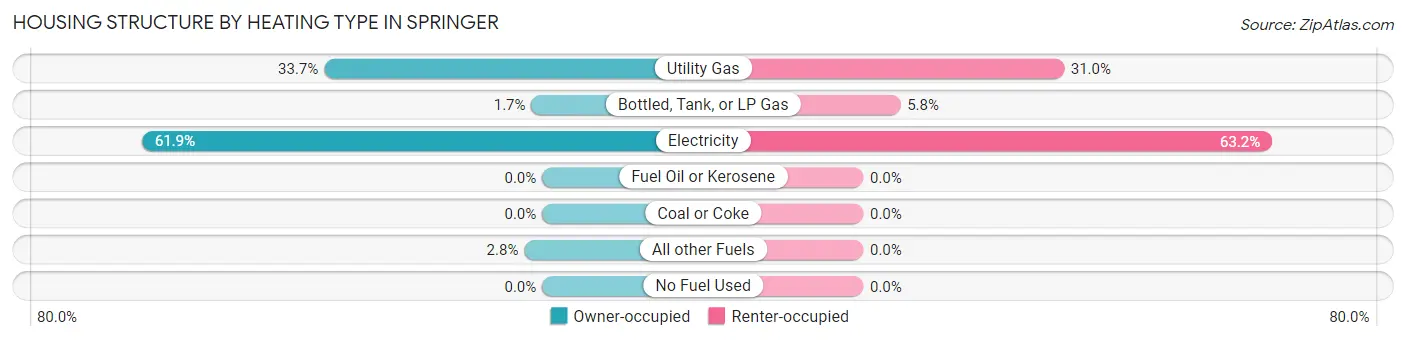
| Heating Type | Owner-occupied | Renter-occupied |
| Utility Gas | 61 (33.7%) | 27 (31.0%) |
| Bottled, Tank, or LP Gas | 3 (1.7%) | 5 (5.8%) |
| Electricity | 112 (61.9%) | 55 (63.2%) |
| Fuel Oil or Kerosene | 0 (0.0%) | 0 (0.0%) |
| Coal or Coke | 0 (0.0%) | 0 (0.0%) |
| All other Fuels | 5 (2.8%) | 0 (0.0%) |
| No Fuel Used | 0 (0.0%) | 0 (0.0%) |
| Total | 181 (100.0%) | 87 (100.0%) |
Household Vehicle Usage in Springer
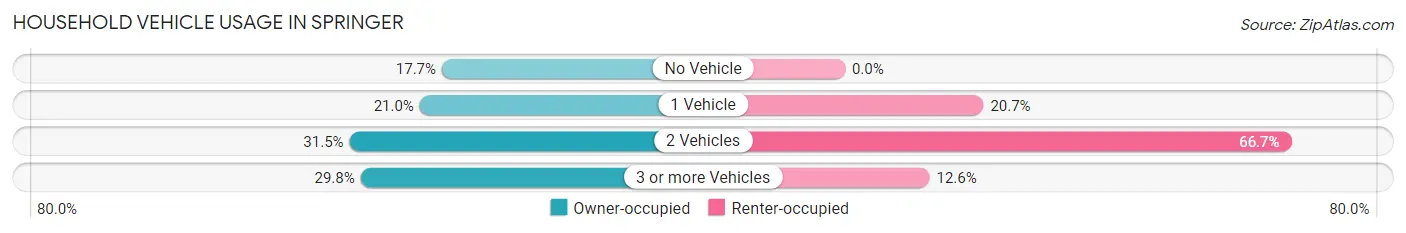
| Vehicles per Household | Owner-occupied | Renter-occupied |
| No Vehicle | 32 (17.7%) | 0 (0.0%) |
| 1 Vehicle | 38 (21.0%) | 18 (20.7%) |
| 2 Vehicles | 57 (31.5%) | 58 (66.7%) |
| 3 or more Vehicles | 54 (29.8%) | 11 (12.6%) |
| Total | 181 (100.0%) | 87 (100.0%) |
Real Estate & Mortgages in Springer
Real Estate and Mortgage Overview in Springer
| Characteristic | Without Mortgage | With Mortgage |
| Housing Units | 84 | 97 |
| Median Property Value | $85,500 | $118,800 |
| Median Household Income | $48,654 | $6 |
| Monthly Housing Costs | $346 | $0 |
| Real Estate Taxes | $473 | $13 |
Property Value by Mortgage Status in Springer
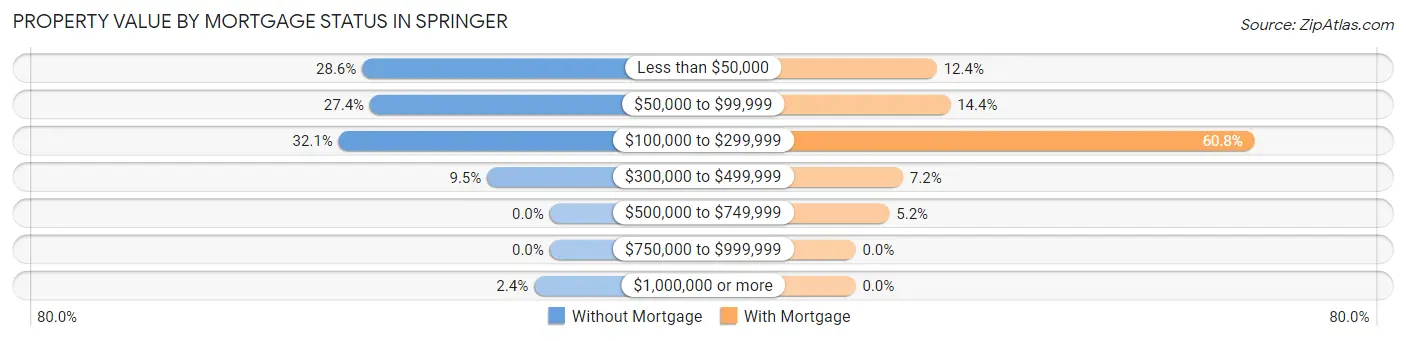
| Property Value | Without Mortgage | With Mortgage |
| Less than $50,000 | 24 (28.6%) | 12 (12.4%) |
| $50,000 to $99,999 | 23 (27.4%) | 14 (14.4%) |
| $100,000 to $299,999 | 27 (32.1%) | 59 (60.8%) |
| $300,000 to $499,999 | 8 (9.5%) | 7 (7.2%) |
| $500,000 to $749,999 | 0 (0.0%) | 5 (5.1%) |
| $750,000 to $999,999 | 0 (0.0%) | 0 (0.0%) |
| $1,000,000 or more | 2 (2.4%) | 0 (0.0%) |
| Total | 84 (100.0%) | 97 (100.0%) |
Household Income by Mortgage Status in Springer
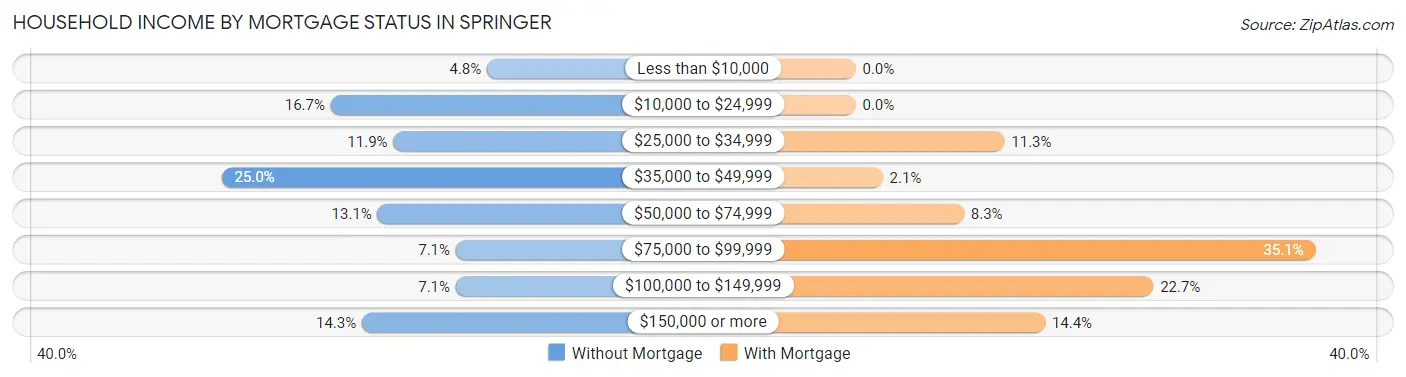
| Household Income | Without Mortgage | With Mortgage |
| Less than $10,000 | 4 (4.8%) | 0 (0.0%) |
| $10,000 to $24,999 | 14 (16.7%) | 0 (0.0%) |
| $25,000 to $34,999 | 10 (11.9%) | 11 (11.3%) |
| $35,000 to $49,999 | 21 (25.0%) | 2 (2.1%) |
| $50,000 to $74,999 | 11 (13.1%) | 8 (8.3%) |
| $75,000 to $99,999 | 6 (7.1%) | 34 (35.0%) |
| $100,000 to $149,999 | 6 (7.1%) | 22 (22.7%) |
| $150,000 or more | 12 (14.3%) | 14 (14.4%) |
| Total | 84 (100.0%) | 97 (100.0%) |
Property Value to Household Income Ratio in Springer
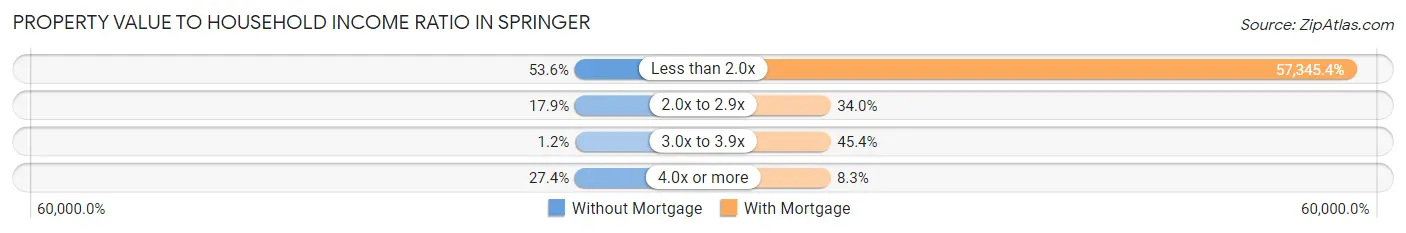
| Value-to-Income Ratio | Without Mortgage | With Mortgage |
| Less than 2.0x | 45 (53.6%) | 55,625 (57,345.4%) |
| 2.0x to 2.9x | 15 (17.9%) | 33 (34.0%) |
| 3.0x to 3.9x | 1 (1.2%) | 44 (45.4%) |
| 4.0x or more | 23 (27.4%) | 8 (8.3%) |
| Total | 84 (100.0%) | 97 (100.0%) |
Real Estate Taxes by Mortgage Status in Springer
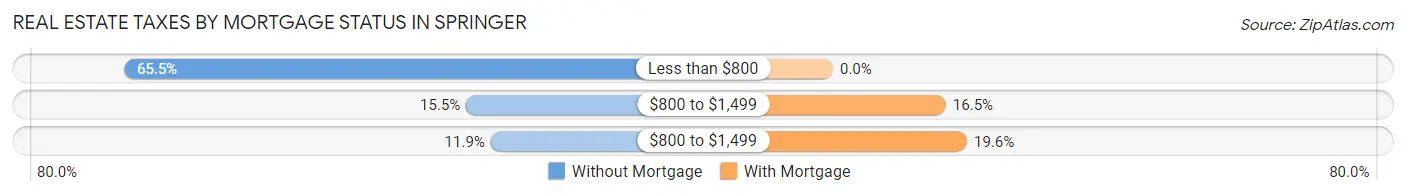
| Property Taxes | Without Mortgage | With Mortgage |
| Less than $800 | 55 (65.5%) | 0 (0.0%) |
| $800 to $1,499 | 13 (15.5%) | 16 (16.5%) |
| $800 to $1,499 | 10 (11.9%) | 19 (19.6%) |
| Total | 84 (100.0%) | 97 (100.0%) |
Health & Disability in Springer
Health Insurance Coverage by Age in Springer
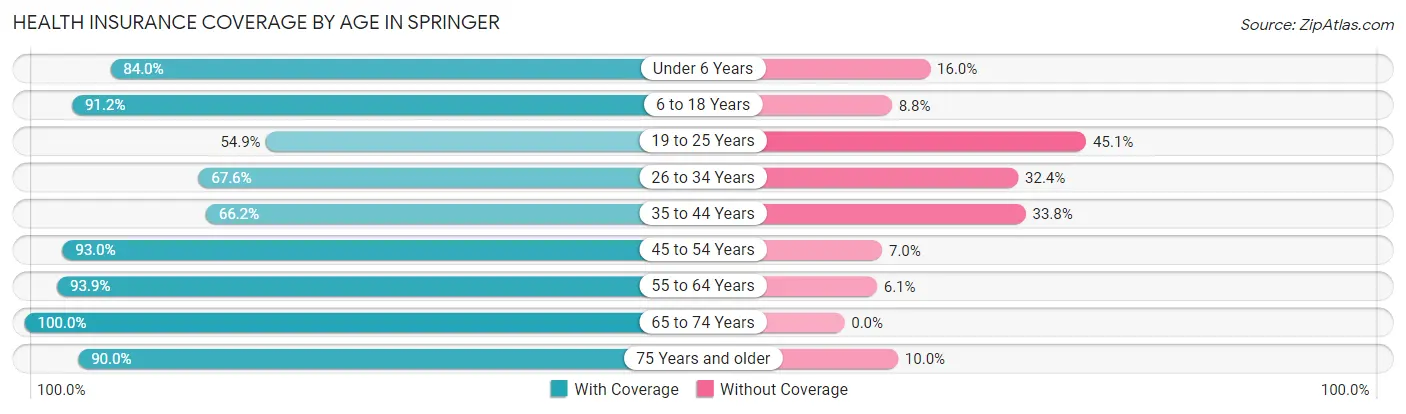
| Age Bracket | With Coverage | Without Coverage |
| Under 6 Years | 84 (84.0%) | 16 (16.0%) |
| 6 to 18 Years | 165 (91.2%) | 16 (8.8%) |
| 19 to 25 Years | 28 (54.9%) | 23 (45.1%) |
| 26 to 34 Years | 73 (67.6%) | 35 (32.4%) |
| 35 to 44 Years | 47 (66.2%) | 24 (33.8%) |
| 45 to 54 Years | 66 (93.0%) | 5 (7.0%) |
| 55 to 64 Years | 62 (93.9%) | 4 (6.1%) |
| 65 to 74 Years | 68 (100.0%) | 0 (0.0%) |
| 75 Years and older | 36 (90.0%) | 4 (10.0%) |
| Total | 629 (83.2%) | 127 (16.8%) |
Health Insurance Coverage by Citizenship Status in Springer
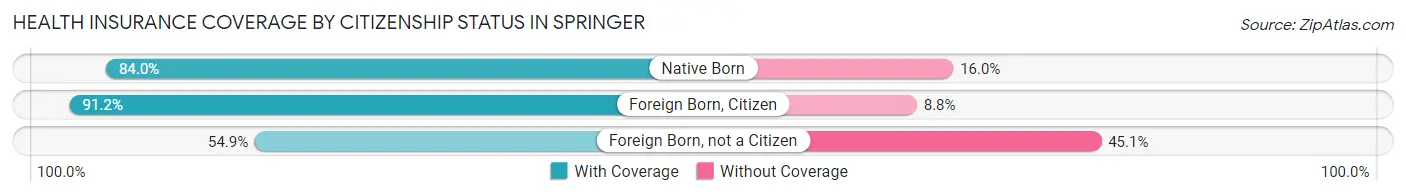
| Citizenship Status | With Coverage | Without Coverage |
| Native Born | 84 (84.0%) | 16 (16.0%) |
| Foreign Born, Citizen | 165 (91.2%) | 16 (8.8%) |
| Foreign Born, not a Citizen | 28 (54.9%) | 23 (45.1%) |
Health Insurance Coverage by Household Income in Springer
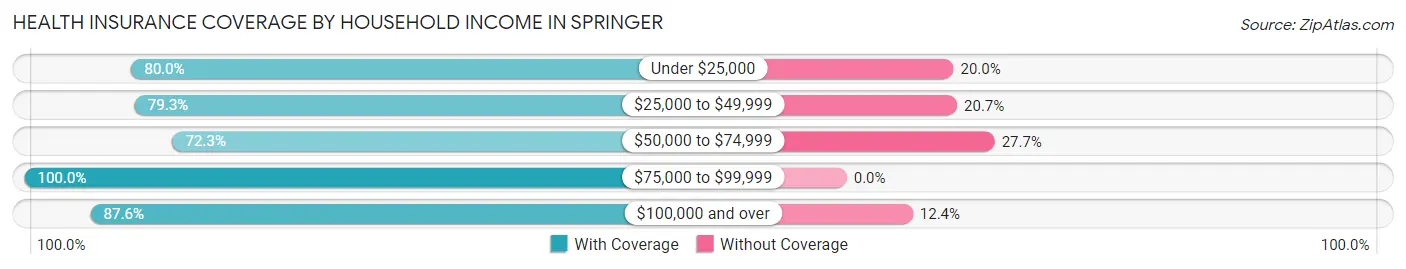
| Household Income | With Coverage | Without Coverage |
| Under $25,000 | 76 (80.0%) | 19 (20.0%) |
| $25,000 to $49,999 | 142 (79.3%) | 37 (20.7%) |
| $50,000 to $74,999 | 120 (72.3%) | 46 (27.7%) |
| $75,000 to $99,999 | 114 (100.0%) | 0 (0.0%) |
| $100,000 and over | 177 (87.6%) | 25 (12.4%) |
Public vs Private Health Insurance Coverage by Age in Springer
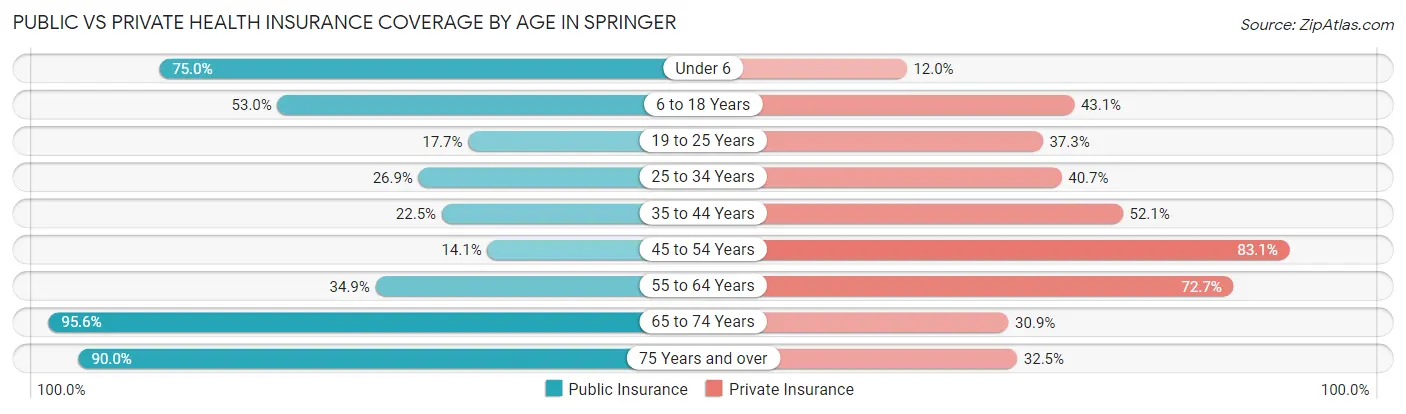
| Age Bracket | Public Insurance | Private Insurance |
| Under 6 | 75 (75.0%) | 12 (12.0%) |
| 6 to 18 Years | 96 (53.0%) | 78 (43.1%) |
| 19 to 25 Years | 9 (17.6%) | 19 (37.2%) |
| 25 to 34 Years | 29 (26.9%) | 44 (40.7%) |
| 35 to 44 Years | 16 (22.5%) | 37 (52.1%) |
| 45 to 54 Years | 10 (14.1%) | 59 (83.1%) |
| 55 to 64 Years | 23 (34.8%) | 48 (72.7%) |
| 65 to 74 Years | 65 (95.6%) | 21 (30.9%) |
| 75 Years and over | 36 (90.0%) | 13 (32.5%) |
| Total | 359 (47.5%) | 331 (43.8%) |
Disability Status by Sex by Age in Springer
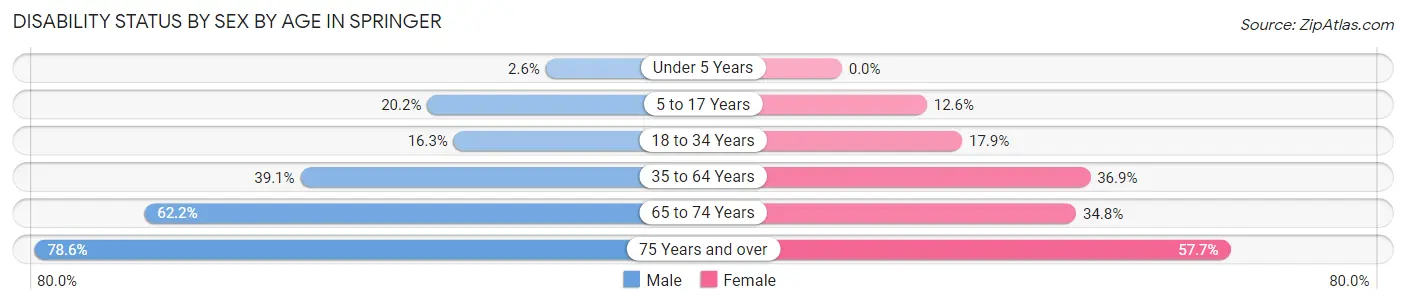
| Age Bracket | Male | Female |
| Under 5 Years | 1 (2.6%) | 0 (0.0%) |
| 5 to 17 Years | 19 (20.2%) | 13 (12.6%) |
| 18 to 34 Years | 14 (16.3%) | 15 (17.9%) |
| 35 to 64 Years | 41 (39.1%) | 38 (36.9%) |
| 65 to 74 Years | 28 (62.2%) | 8 (34.8%) |
| 75 Years and over | 11 (78.6%) | 15 (57.7%) |
Disability Class by Sex by Age in Springer
Disability Class: Hearing Difficulty
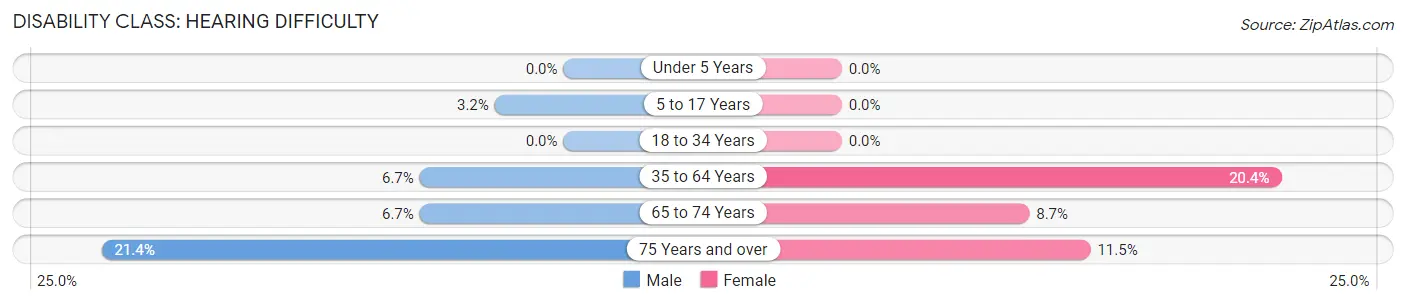
| Age Bracket | Male | Female |
| Under 5 Years | 0 (0.0%) | 0 (0.0%) |
| 5 to 17 Years | 3 (3.2%) | 0 (0.0%) |
| 18 to 34 Years | 0 (0.0%) | 0 (0.0%) |
| 35 to 64 Years | 7 (6.7%) | 21 (20.4%) |
| 65 to 74 Years | 3 (6.7%) | 2 (8.7%) |
| 75 Years and over | 3 (21.4%) | 3 (11.5%) |
Disability Class: Vision Difficulty
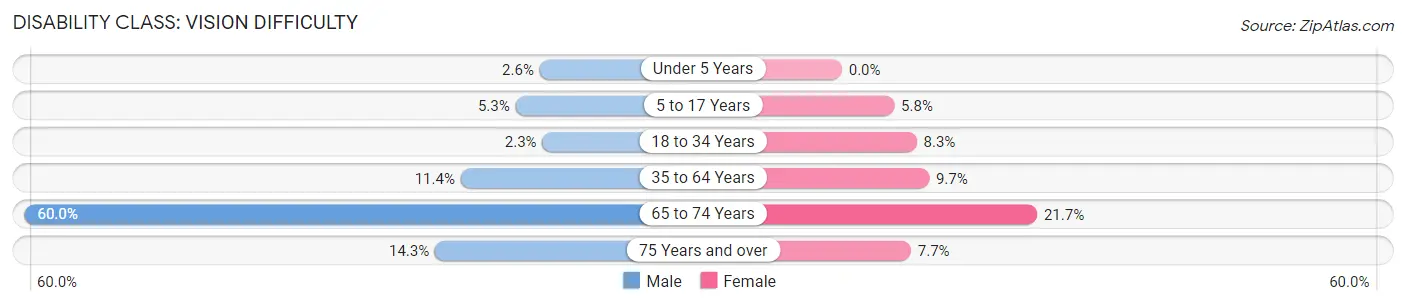
| Age Bracket | Male | Female |
| Under 5 Years | 1 (2.6%) | 0 (0.0%) |
| 5 to 17 Years | 5 (5.3%) | 6 (5.8%) |
| 18 to 34 Years | 2 (2.3%) | 7 (8.3%) |
| 35 to 64 Years | 12 (11.4%) | 10 (9.7%) |
| 65 to 74 Years | 27 (60.0%) | 5 (21.7%) |
| 75 Years and over | 2 (14.3%) | 2 (7.7%) |
Disability Class: Cognitive Difficulty
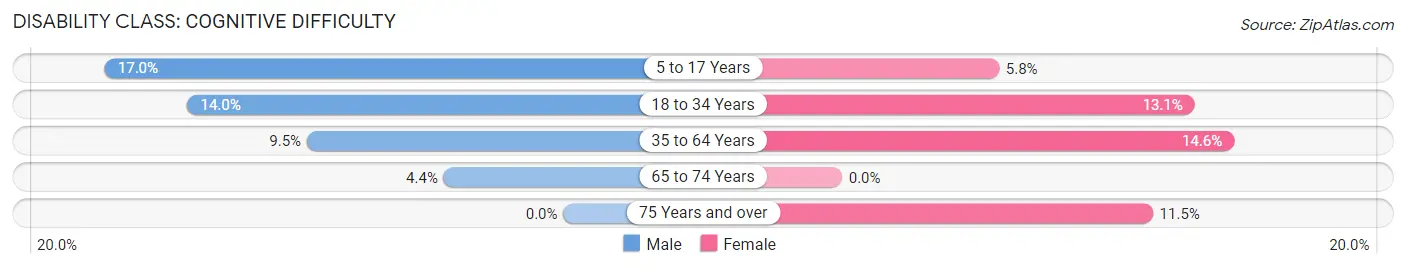
| Age Bracket | Male | Female |
| 5 to 17 Years | 16 (17.0%) | 6 (5.8%) |
| 18 to 34 Years | 12 (14.0%) | 11 (13.1%) |
| 35 to 64 Years | 10 (9.5%) | 15 (14.6%) |
| 65 to 74 Years | 2 (4.4%) | 0 (0.0%) |
| 75 Years and over | 0 (0.0%) | 3 (11.5%) |
Disability Class: Ambulatory Difficulty
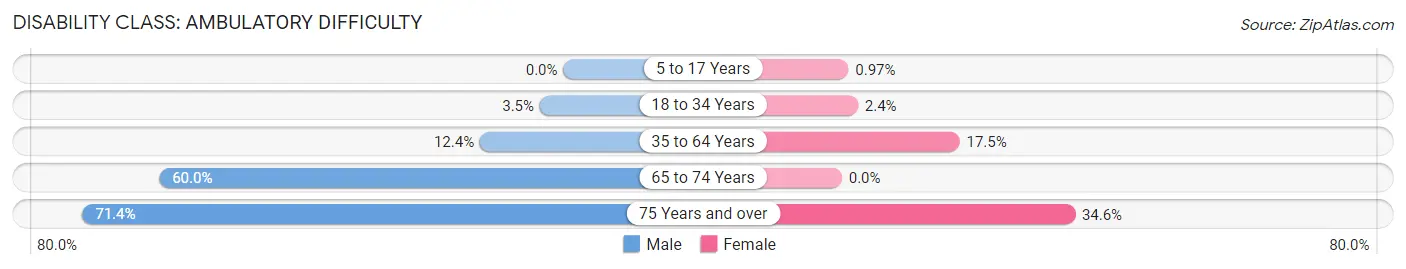
| Age Bracket | Male | Female |
| 5 to 17 Years | 0 (0.0%) | 1 (1.0%) |
| 18 to 34 Years | 3 (3.5%) | 2 (2.4%) |
| 35 to 64 Years | 13 (12.4%) | 18 (17.5%) |
| 65 to 74 Years | 27 (60.0%) | 0 (0.0%) |
| 75 Years and over | 10 (71.4%) | 9 (34.6%) |
Disability Class: Self-Care Difficulty
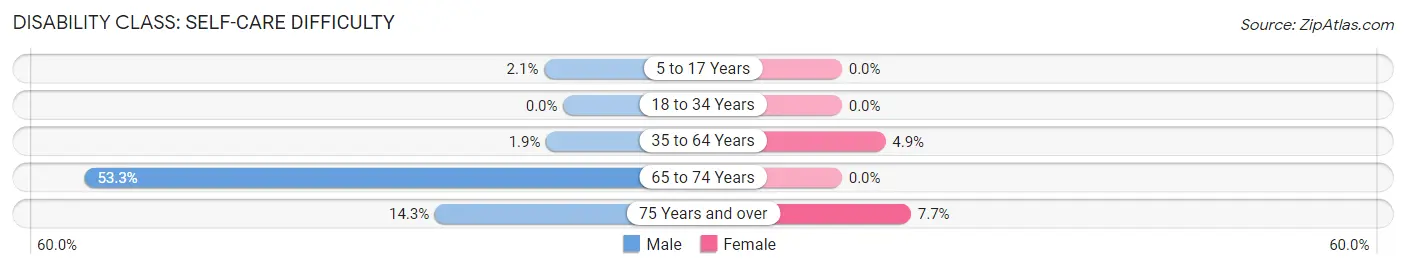
| Age Bracket | Male | Female |
| 5 to 17 Years | 2 (2.1%) | 0 (0.0%) |
| 18 to 34 Years | 0 (0.0%) | 0 (0.0%) |
| 35 to 64 Years | 2 (1.9%) | 5 (4.9%) |
| 65 to 74 Years | 24 (53.3%) | 0 (0.0%) |
| 75 Years and over | 2 (14.3%) | 2 (7.7%) |
Technology Access in Springer
Computing Device Access in Springer
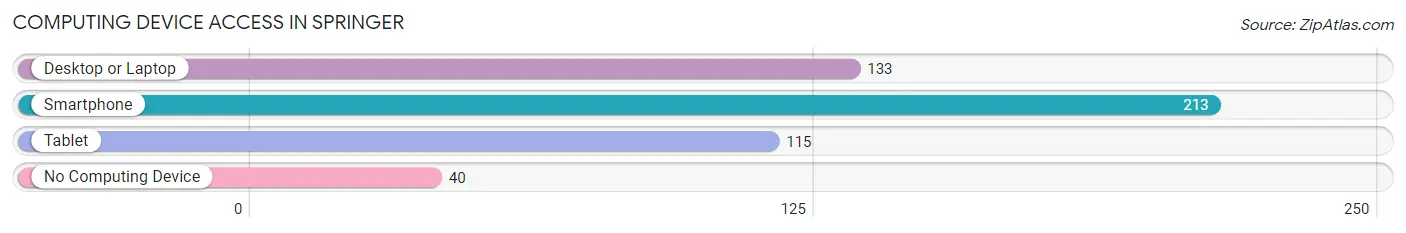
| Device Type | # Households | % Households |
| Desktop or Laptop | 133 | 49.6% |
| Smartphone | 213 | 79.5% |
| Tablet | 115 | 42.9% |
| No Computing Device | 40 | 14.9% |
| Total | 268 | 100.0% |
Internet Access in Springer
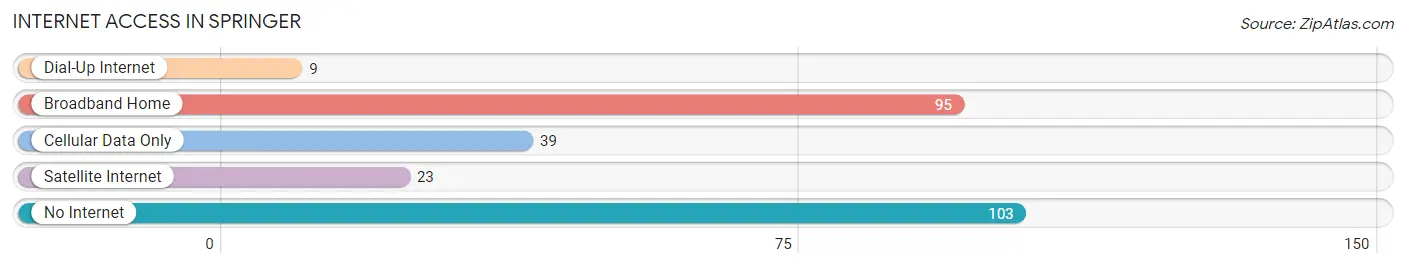
| Internet Type | # Households | % Households |
| Dial-Up Internet | 9 | 3.4% |
| Broadband Home | 95 | 35.4% |
| Cellular Data Only | 39 | 14.5% |
| Satellite Internet | 23 | 8.6% |
| No Internet | 103 | 38.4% |
| Total | 268 | 100.0% |
Springer Summary
Springer is a small town located in the southwestern corner of Oklahoma, in the foothills of the Wichita Mountains. It is situated in the county of Comanche, and is part of the Lawton Metropolitan Statistical Area. The town has a population of approximately 1,000 people, and is known for its rural charm and friendly atmosphere.
History
Springer was founded in 1891 by a group of settlers from Texas. The town was named after a local rancher, John Springer, who owned a large amount of land in the area. The town was originally a farming community, and the main crops grown were cotton, corn, and wheat. In the early 1900s, the town began to grow and develop, and by the 1920s, it had become a thriving community.
In the 1930s, the Great Depression hit the town hard, and many of the businesses and farms in the area closed down. However, the town was able to survive, and by the 1940s, it had begun to recover. During World War II, the town was home to a large military base, and many of the soldiers stationed there stayed in the area after the war.
In the 1950s, the town began to grow again, and many new businesses opened up. The town also became a popular tourist destination, as it was close to the Wichita Mountains Wildlife Refuge. In the 1960s, the town was incorporated, and it has continued to grow and develop ever since.
Geography
Springer is located in the southwestern corner of Oklahoma, in the foothills of the Wichita Mountains. The town is situated in the county of Comanche, and is part of the Lawton Metropolitan Statistical Area. The town is located at an elevation of 1,000 feet, and has a total area of 1.2 square miles.
The town is located in a semi-arid climate, with hot summers and mild winters. The average temperature in the summer is around 90 degrees Fahrenheit, and the average temperature in the winter is around 40 degrees Fahrenheit. The town receives an average of 25 inches of precipitation per year, and the average snowfall is around 5 inches.
Economy
Springer’s economy is largely based on agriculture and tourism. The town is home to several farms, which produce a variety of crops, including cotton, corn, and wheat. The town is also home to several tourist attractions, including the Wichita Mountains Wildlife Refuge, which attracts visitors from all over the country.
The town is also home to several small businesses, including restaurants, shops, and other services. The town is also home to a few manufacturing companies, which produce a variety of products, including furniture and clothing.
Demographics
As of the 2010 census, the population of Springer was 1,000 people. The town is predominantly white, with a small Hispanic population. The median household income in the town is around $35,000, and the median home value is around $90,000. The town has a low unemployment rate, and the poverty rate is around 10%.
Common Questions
What is Per Capita Income in Springer?
Per Capita income in Springer is $24,853.
What is the Median Family Income in Springer?
Median Family Income in Springer is $71,875.
What is the Median Household income in Springer?
Median Household Income in Springer is $51,630.
What is Income or Wage Gap in Springer?
Income or Wage Gap in Springer is 56.1%.
Women in Springer earn 43.9 cents for every dollar earned by a man.
What is Family Income Deficit in Springer?
Family Income Deficit in Springer is $13,830.
Families that are below poverty line in Springer earn $13,830 less on average than the poverty threshold level.
What is Inequality or Gini Index in Springer?
Inequality or Gini Index in Springer is 0.39.
What is the Total Population of Springer?
Total Population of Springer is 756.
What is the Total Male Population of Springer?
Total Male Population of Springer is 382.
What is the Total Female Population of Springer?
Total Female Population of Springer is 374.
What is the Ratio of Males per 100 Females in Springer?
There are 102.14 Males per 100 Females in Springer.
What is the Ratio of Females per 100 Males in Springer?
There are 97.91 Females per 100 Males in Springer.
What is the Median Population Age in Springer?
Median Population Age in Springer is 30.3 Years.
What is the Average Family Size in Springer
Average Family Size in Springer is 3.6 People.
What is the Average Household Size in Springer
Average Household Size in Springer is 2.8 People.
How Large is the Labor Force in Springer?
There are 292 People in the Labor Forcein in Springer.
What is the Percentage of People in the Labor Force in Springer?
56.6% of People are in the Labor Force in Springer.
What is the Unemployment Rate in Springer?
Unemployment Rate in Springer is 1.7%.