Zip Codes with the Highest Percentage of Hispanic or Latino Population in Oklahoma City, OK
RELATED REPORTS & OPTIONS
Hispanic or Latino
Oklahoma City
Compare Zip Codes
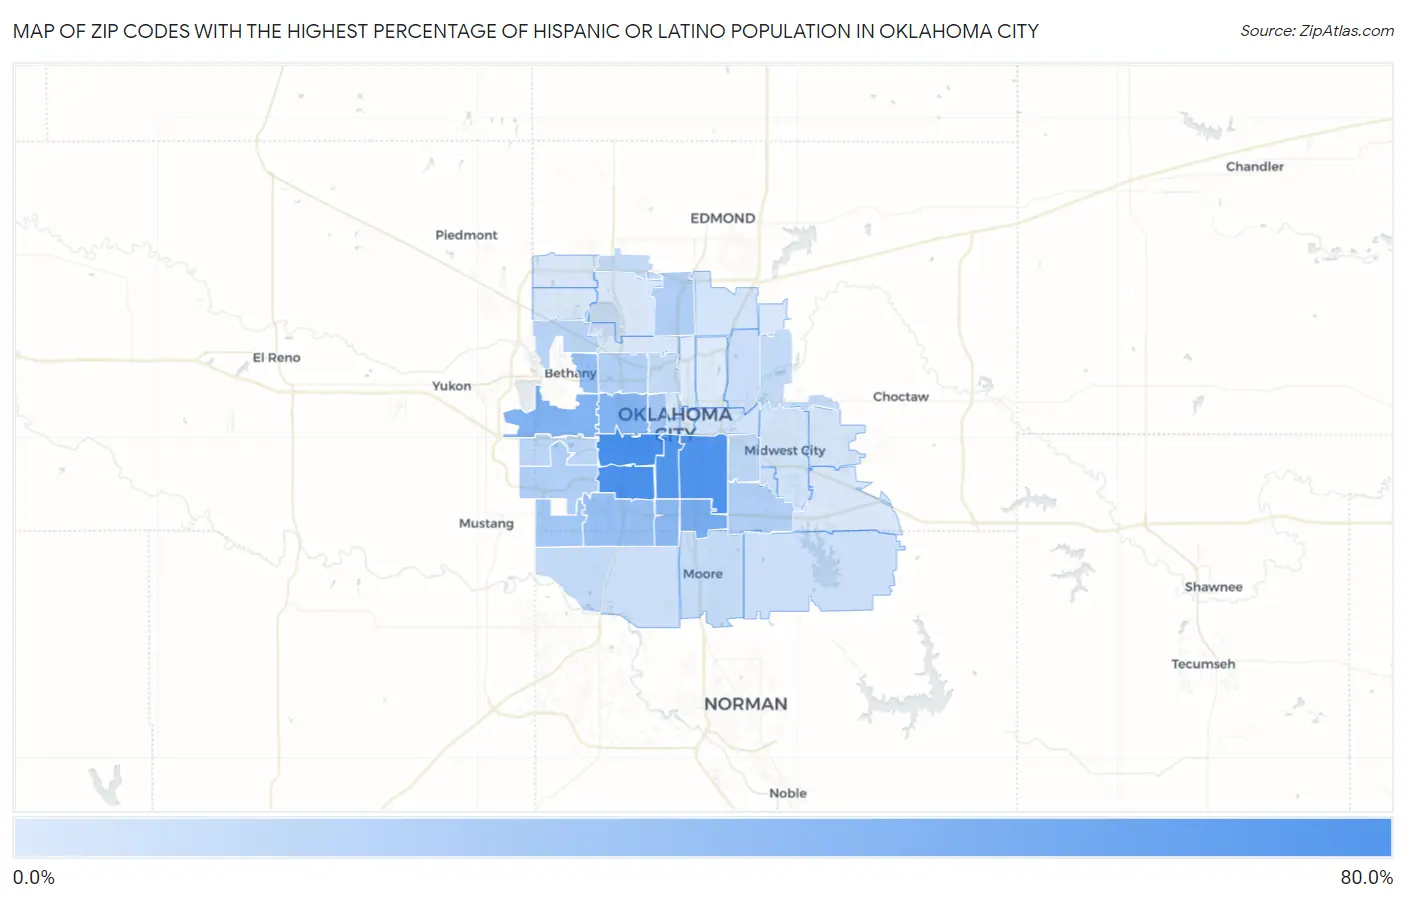
Map of Zip Codes with the Highest Percentage of Hispanic or Latino Population in Oklahoma City
4.1%
62.8%
Zip Codes with the Highest Percentage of Hispanic or Latino Population in Oklahoma City, OK
| Zip Code | Hispanic or Latino | vs State | vs National | |
| 1. | 73108 | 62.8% | 11.6%(+51.2)#3 | 18.7%(+44.1)#1,007 |
| 2. | 73119 | 60.6% | 11.6%(+49.0)#4 | 18.7%(+41.9)#1,083 |
| 3. | 73129 | 58.7% | 11.6%(+47.1)#5 | 18.7%(+40.0)#1,158 |
| 4. | 73109 | 57.2% | 11.6%(+45.6)#7 | 18.7%(+38.5)#1,212 |
| 5. | 73149 | 40.9% | 11.6%(+29.4)#14 | 18.7%(+22.3)#2,098 |
| 6. | 73127 | 36.6% | 11.6%(+25.1)#18 | 18.7%(+18.0)#2,415 |
| 7. | 73107 | 36.0% | 11.6%(+24.5)#20 | 18.7%(+17.4)#2,464 |
| 8. | 73139 | 32.6% | 11.6%(+21.0)#27 | 18.7%(+13.9)#2,818 |
| 9. | 73122 | 28.3% | 11.6%(+16.7)#37 | 18.7%(+9.62)#3,309 |
| 10. | 73159 | 28.0% | 11.6%(+16.5)#39 | 18.7%(+9.36)#3,348 |
| 11. | 73106 | 24.1% | 11.6%(+12.5)#52 | 18.7%(+5.43)#3,961 |
| 12. | 73169 | 24.1% | 11.6%(+12.5)#53 | 18.7%(+5.42)#3,962 |
| 13. | 73114 | 18.6% | 11.6%(+7.07)#71 | 18.7%(-0.034)#5,169 |
| 14. | 73179 | 18.5% | 11.6%(+6.95)#72 | 18.7%(-0.145)#5,194 |
| 15. | 73135 | 18.4% | 11.6%(+6.83)#73 | 18.7%(-0.269)#5,238 |
| 16. | 73112 | 18.2% | 11.6%(+6.65)#75 | 18.7%(-0.453)#5,284 |
| 17. | 73132 | 15.6% | 11.6%(+4.09)#87 | 18.7%(-3.01)#6,101 |
| 18. | 73128 | 15.0% | 11.6%(+3.44)#95 | 18.7%(-3.66)#6,378 |
| 19. | 73115 | 14.0% | 11.6%(+2.41)#105 | 18.7%(-4.68)#6,802 |
| 20. | 73118 | 12.7% | 11.6%(+1.15)#115 | 18.7%(-5.95)#7,399 |
| 21. | 73141 | 12.3% | 11.6%(+0.785)#123 | 18.7%(-6.31)#7,576 |
| 22. | 73134 | 12.1% | 11.6%(+0.536)#127 | 18.7%(-6.56)#7,703 |
| 23. | 73173 | 12.0% | 11.6%(+0.402)#129 | 18.7%(-6.70)#7,778 |
| 24. | 73160 | 11.5% | 11.6%(-0.039)#135 | 18.7%(-7.14)#8,020 |
| 25. | 73102 | 10.4% | 11.6%(-1.15)#149 | 18.7%(-8.25)#8,622 |
| 26. | 73121 | 9.9% | 11.6%(-1.67)#161 | 18.7%(-8.77)#9,002 |
| 27. | 73165 | 9.5% | 11.6%(-2.03)#172 | 18.7%(-9.13)#9,260 |
| 28. | 73170 | 9.5% | 11.6%(-2.06)#174 | 18.7%(-9.16)#9,291 |
| 29. | 73145 | 9.4% | 11.6%(-2.17)#181 | 18.7%(-9.27)#9,376 |
| 30. | 73117 | 8.1% | 11.6%(-3.47)#215 | 18.7%(-10.6)#10,490 |
| 31. | 73110 | 7.3% | 11.6%(-4.29)#243 | 18.7%(-11.4)#11,318 |
| 32. | 73131 | 7.2% | 11.6%(-4.36)#246 | 18.7%(-11.5)#11,389 |
| 33. | 73130 | 6.5% | 11.6%(-5.01)#272 | 18.7%(-12.1)#12,138 |
| 34. | 73103 | 6.5% | 11.6%(-5.06)#274 | 18.7%(-12.2)#12,188 |
| 35. | 73142 | 5.9% | 11.6%(-5.66)#306 | 18.7%(-12.8)#12,949 |
| 36. | 73150 | 5.9% | 11.6%(-5.69)#308 | 18.7%(-12.8)#12,986 |
| 37. | 73116 | 5.5% | 11.6%(-6.08)#323 | 18.7%(-13.2)#13,531 |
| 38. | 73120 | 5.4% | 11.6%(-6.20)#327 | 18.7%(-13.3)#13,730 |
| 39. | 73162 | 5.1% | 11.6%(-6.45)#337 | 18.7%(-13.5)#14,101 |
| 40. | 73104 | 4.9% | 11.6%(-6.60)#348 | 18.7%(-13.7)#14,356 |
| 41. | 73151 | 4.9% | 11.6%(-6.68)#357 | 18.7%(-13.8)#14,515 |
| 42. | 73105 | 4.5% | 11.6%(-7.06)#387 | 18.7%(-14.2)#15,158 |
| 43. | 73111 | 4.1% | 11.6%(-7.41)#411 | 18.7%(-14.5)#15,847 |
1
Common Questions
What are the Top 10 Zip Codes with the Highest Percentage of Hispanic or Latino Population in Oklahoma City, OK?
Top 10 Zip Codes with the Highest Percentage of Hispanic or Latino Population in Oklahoma City, OK are:
What zip code has the Highest Percentage of Hispanic or Latino Population in Oklahoma City, OK?
73108 has the Highest Percentage of Hispanic or Latino Population in Oklahoma City, OK with 62.8%.
What is the Percentage of Hispanic or Latino Population in Oklahoma City, OK?
Percentage of Hispanic or Latino Population in Oklahoma City is 20.1%.
What is the Percentage of Hispanic or Latino Population in Oklahoma?
Percentage of Hispanic or Latino Population in Oklahoma is 11.6%.
What is the Percentage of Hispanic or Latino Population in the United States?
Percentage of Hispanic or Latino Population in the United States is 18.7%.