Del City, OK Map & Demographics
Del City Map
Del City Overview
$25,757
PER CAPITA INCOME
$56,968
AVG FAMILY INCOME
$48,200
AVG HOUSEHOLD INCOME
33.1%
WAGE / INCOME GAP [ % ]
66.9¢/ $1
WAGE / INCOME GAP [ $ ]
$15,479
FAMILY INCOME DEFICIT
0.41
INEQUALITY / GINI INDEX
21,682
TOTAL POPULATION
10,469
MALE POPULATION
11,213
FEMALE POPULATION
93.36
MALES / 100 FEMALES
107.11
FEMALES / 100 MALES
34.6
MEDIAN AGE
3.2
AVG FAMILY SIZE
2.5
AVG HOUSEHOLD SIZE
10,253
LABOR FORCE [ PEOPLE ]
61.9%
PERCENT IN LABOR FORCE
6.2%
UNEMPLOYMENT RATE
Del City Area Codes
Income in Del City
Income Overview in Del City
Per Capita Income in Del City is $25,757, while median incomes of families and households are $56,968 and $48,200 respectively.
| Characteristic | Number | Measure |
| Per Capita Income | 21,682 | $25,757 |
| Median Family Income | 5,149 | $56,968 |
| Mean Family Income | 5,149 | $67,358 |
| Median Household Income | 8,772 | $48,200 |
| Mean Household Income | 8,772 | $61,301 |
| Income Deficit | 5,149 | $15,479 |
| Wage / Income Gap (%) | 21,682 | 33.08% |
| Wage / Income Gap ($) | 21,682 | 66.92¢ per $1 |
| Gini / Inequality Index | 21,682 | 0.41 |
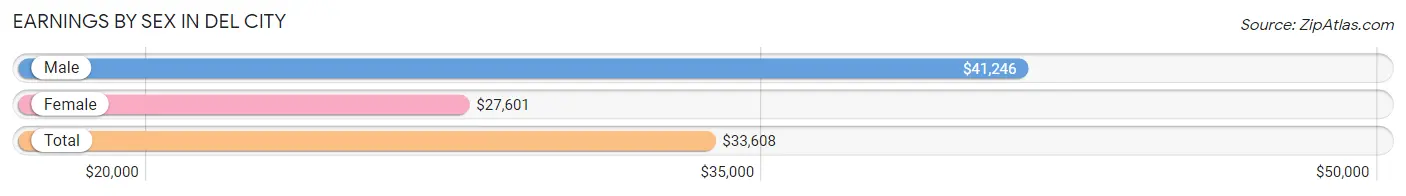
Earnings by Sex in Del City
Average Earnings in Del City are $33,608, $41,246 for men and $27,601 for women, a difference of 33.1%.
| Sex | Number | Average Earnings |
| Male | 5,615 (53.3%) | $41,246 |
| Female | 4,916 (46.7%) | $27,601 |
| Total | 10,531 (100.0%) | $33,608 |
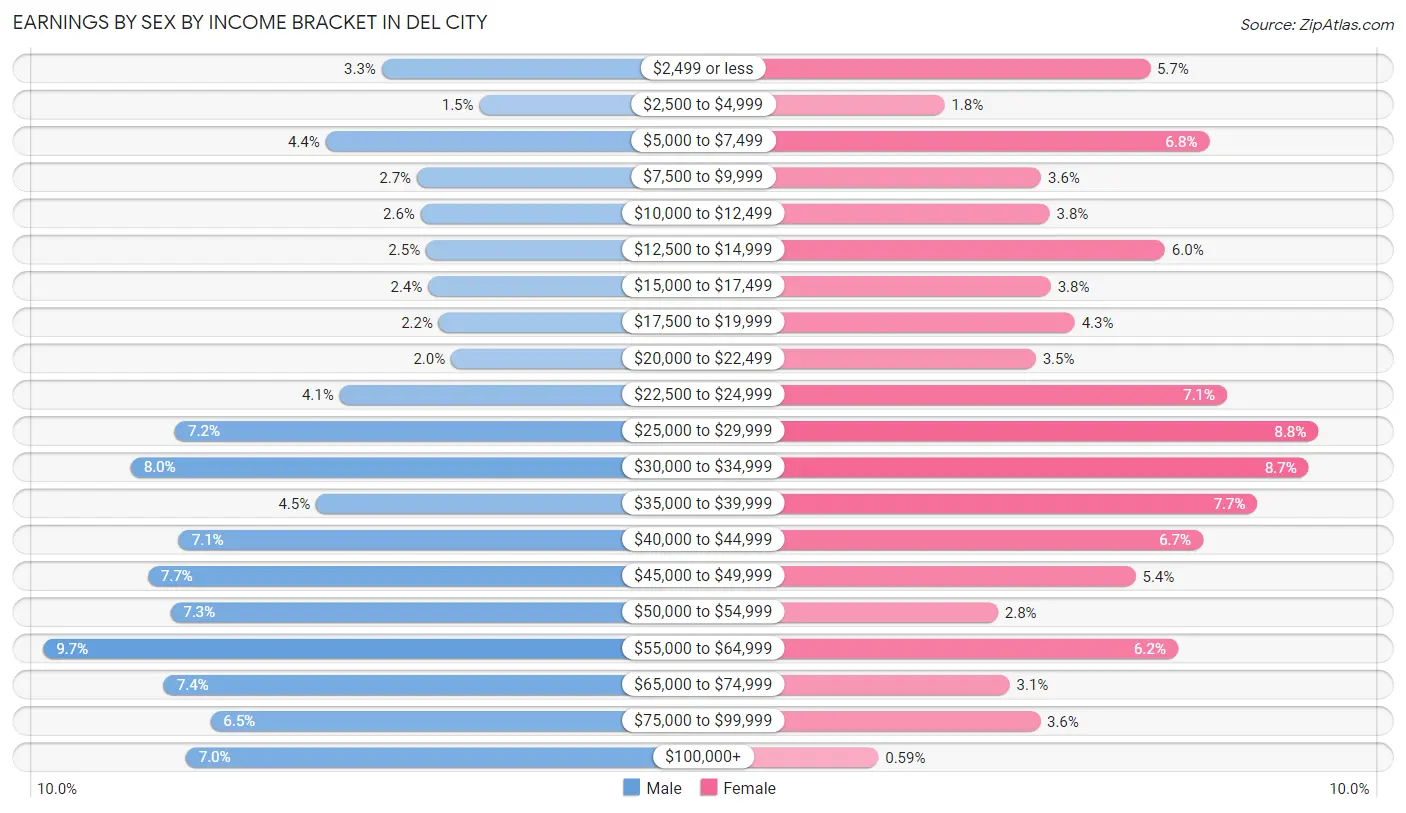
Earnings by Sex by Income Bracket in Del City
The most common earnings brackets in Del City are $55,000 to $64,999 for men (542 | 9.7%) and $25,000 to $29,999 for women (434 | 8.8%).
| Income | Male | Female |
| $2,499 or less | 186 (3.3%) | 279 (5.7%) |
| $2,500 to $4,999 | 83 (1.5%) | 90 (1.8%) |
| $5,000 to $7,499 | 245 (4.4%) | 334 (6.8%) |
| $7,500 to $9,999 | 149 (2.6%) | 179 (3.6%) |
| $10,000 to $12,499 | 145 (2.6%) | 187 (3.8%) |
| $12,500 to $14,999 | 139 (2.5%) | 293 (6.0%) |
| $15,000 to $17,499 | 137 (2.4%) | 188 (3.8%) |
| $17,500 to $19,999 | 126 (2.2%) | 210 (4.3%) |
| $20,000 to $22,499 | 113 (2.0%) | 174 (3.5%) |
| $22,500 to $24,999 | 230 (4.1%) | 350 (7.1%) |
| $25,000 to $29,999 | 403 (7.2%) | 434 (8.8%) |
| $30,000 to $34,999 | 450 (8.0%) | 425 (8.6%) |
| $35,000 to $39,999 | 255 (4.5%) | 378 (7.7%) |
| $40,000 to $44,999 | 399 (7.1%) | 328 (6.7%) |
| $45,000 to $49,999 | 432 (7.7%) | 266 (5.4%) |
| $50,000 to $54,999 | 408 (7.3%) | 139 (2.8%) |
| $55,000 to $64,999 | 542 (9.7%) | 305 (6.2%) |
| $65,000 to $74,999 | 415 (7.4%) | 150 (3.0%) |
| $75,000 to $99,999 | 366 (6.5%) | 178 (3.6%) |
| $100,000+ | 392 (7.0%) | 29 (0.6%) |
| Total | 5,615 (100.0%) | 4,916 (100.0%) |
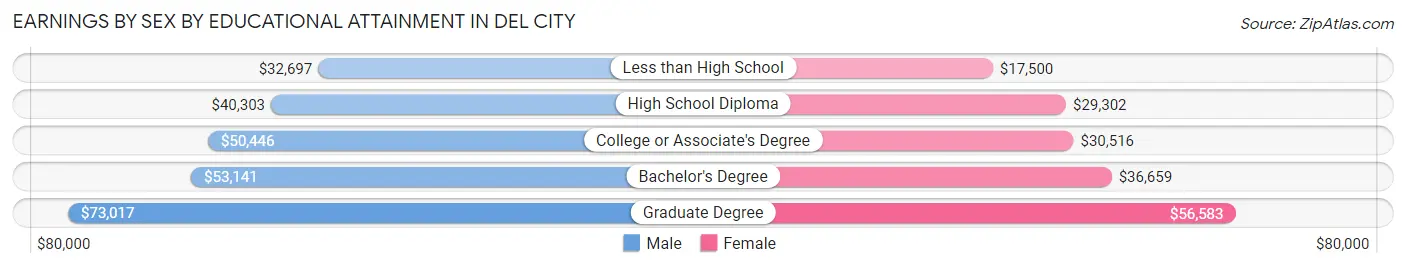
Earnings by Sex by Educational Attainment in Del City
Average earnings in Del City are $46,436 for men and $29,765 for women, a difference of 35.9%. Men with an educational attainment of graduate degree enjoy the highest average annual earnings of $73,017, while those with less than high school education earn the least with $32,697. Women with an educational attainment of graduate degree earn the most with the average annual earnings of $56,583, while those with less than high school education have the smallest earnings of $17,500.
| Educational Attainment | Male Income | Female Income |
| Less than High School | $32,697 | $17,500 |
| High School Diploma | $40,303 | $29,302 |
| College or Associate's Degree | $50,446 | $30,516 |
| Bachelor's Degree | $53,141 | $36,659 |
| Graduate Degree | $73,017 | $56,583 |
| Total | $46,436 | $29,765 |
Family Income in Del City
Family Income Brackets in Del City
According to the Del City family income data, there are 1,071 families falling into the $50,000 to $74,999 income range, which is the most common income bracket and makes up 20.8% of all families. Conversely, the $200,000+ income bracket is the least frequent group with only 77 families (1.5%) belonging to this category.
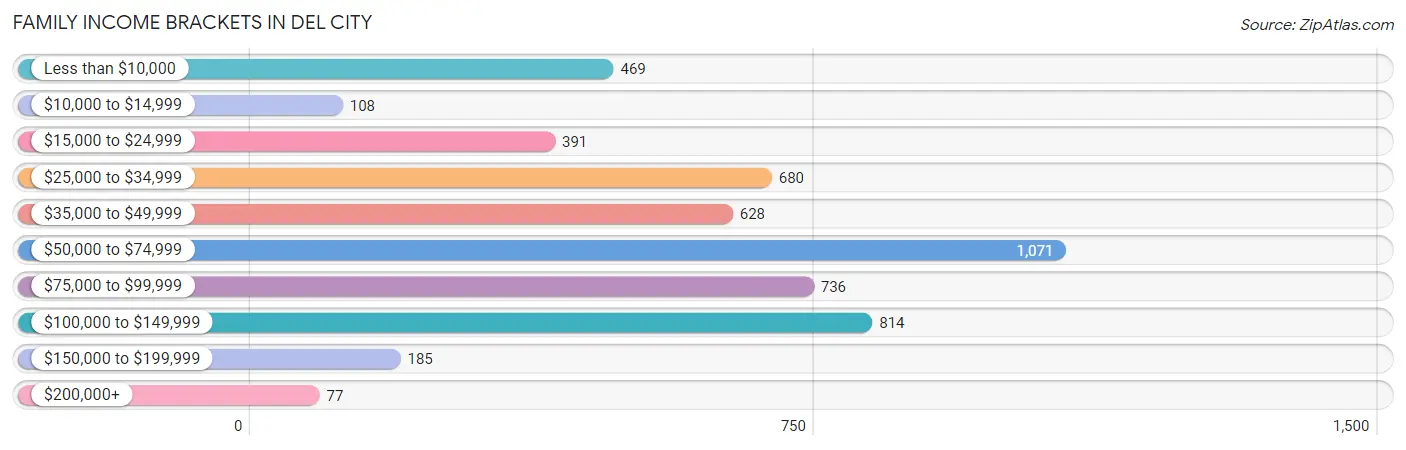
| Income Bracket | # Families | % Families |
| Less than $10,000 | 469 | 9.1% |
| $10,000 to $14,999 | 108 | 2.1% |
| $15,000 to $24,999 | 391 | 7.6% |
| $25,000 to $34,999 | 680 | 13.2% |
| $35,000 to $49,999 | 628 | 12.2% |
| $50,000 to $74,999 | 1,071 | 20.8% |
| $75,000 to $99,999 | 736 | 14.3% |
| $100,000 to $149,999 | 814 | 15.8% |
| $150,000 to $199,999 | 185 | 3.6% |
| $200,000+ | 77 | 1.5% |
Family Income by Famaliy Size in Del City
6-person families (152 | 2.9%) account for the highest median family income in Del City with $79,545 per family, while 2-person families (2,258 | 43.9%) have the highest median income of $24,722 per family member.
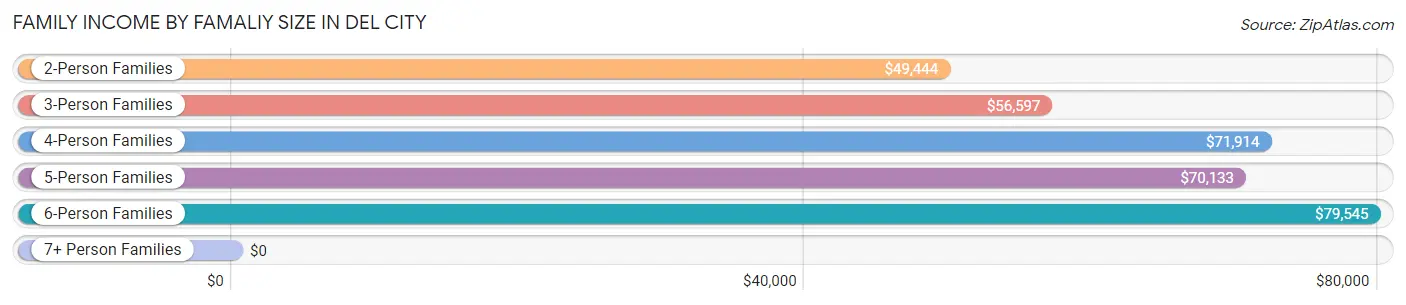
| Income Bracket | # Families | Median Income |
| 2-Person Families | 2,258 (43.9%) | $49,444 |
| 3-Person Families | 1,351 (26.2%) | $56,597 |
| 4-Person Families | 851 (16.5%) | $71,914 |
| 5-Person Families | 389 (7.5%) | $70,133 |
| 6-Person Families | 152 (2.9%) | $79,545 |
| 7+ Person Families | 148 (2.9%) | $0 |
| Total | 5,149 (100.0%) | $56,968 |
Family Income by Number of Earners in Del City
The median family income in Del City is $56,968, with families comprising 3+ earners (421) having the highest median family income of $101,339, while families with no earners (1,017) have the lowest median family income of $33,671, accounting for 8.2% and 19.8% of families, respectively.
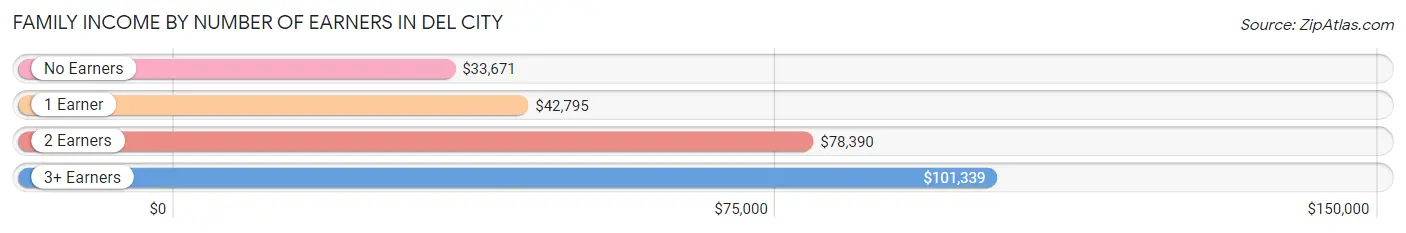
| Number of Earners | # Families | Median Income |
| No Earners | 1,017 (19.8%) | $33,671 |
| 1 Earner | 2,035 (39.5%) | $42,795 |
| 2 Earners | 1,676 (32.6%) | $78,390 |
| 3+ Earners | 421 (8.2%) | $101,339 |
| Total | 5,149 (100.0%) | $56,968 |
Household Income in Del City
Household Income Brackets in Del City
With 1,632 households falling in the category, the $50,000 to $74,999 income range is the most frequent in Del City, accounting for 18.6% of all households. In contrast, only 96 households (1.1%) fall into the $200,000+ income bracket, making it the least populous group.
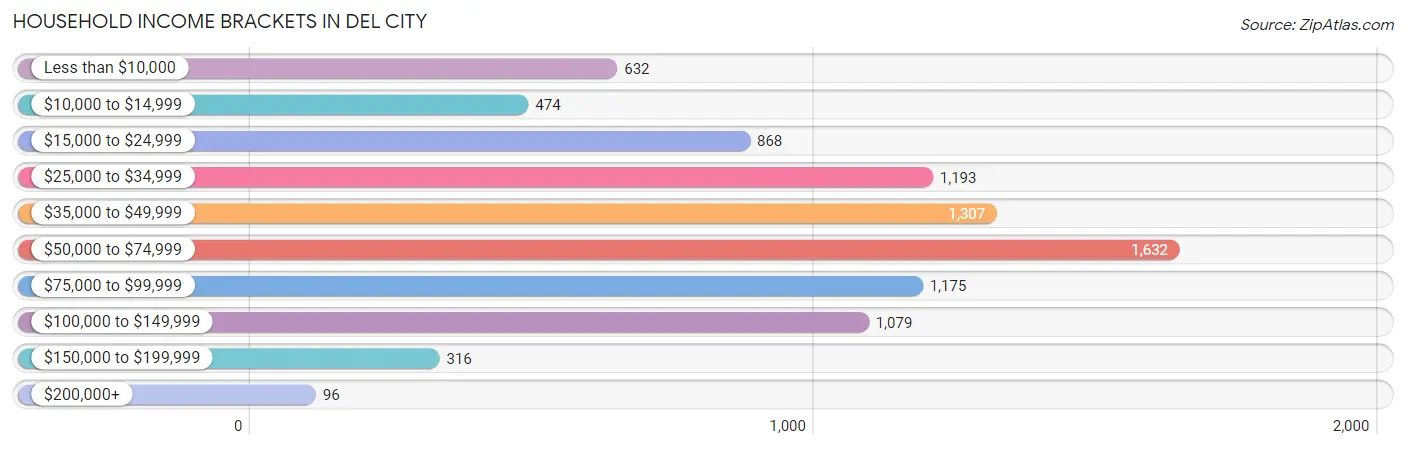
| Income Bracket | # Households | % Households |
| Less than $10,000 | 632 | 7.2% |
| $10,000 to $14,999 | 474 | 5.4% |
| $15,000 to $24,999 | 868 | 9.9% |
| $25,000 to $34,999 | 1,193 | 13.6% |
| $35,000 to $49,999 | 1,307 | 14.9% |
| $50,000 to $74,999 | 1,632 | 18.6% |
| $75,000 to $99,999 | 1,175 | 13.4% |
| $100,000 to $149,999 | 1,079 | 12.3% |
| $150,000 to $199,999 | 316 | 3.6% |
| $200,000+ | 96 | 1.1% |
Household Income by Householder Age in Del City
The median household income in Del City is $48,200, with the highest median household income of $61,508 found in the 45 to 64 years age bracket for the primary householder. A total of 2,540 households (29.0%) fall into this category. Meanwhile, the 65+ years age bracket for the primary householder has the lowest median household income of $38,929, with 2,336 households (26.6%) in this group.
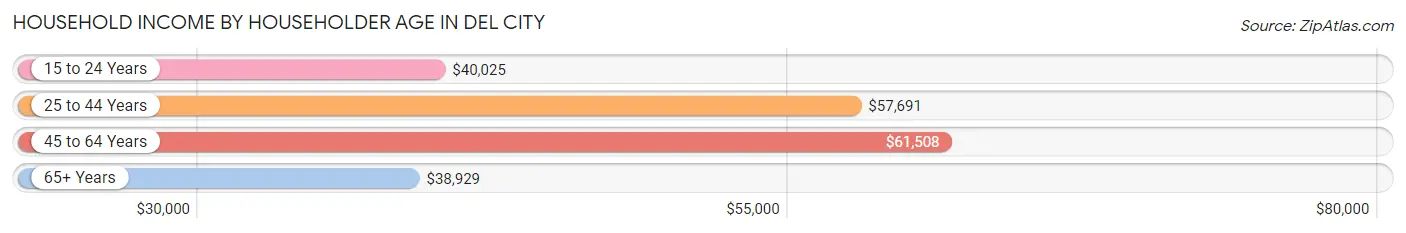
| Income Bracket | # Households | Median Income |
| 15 to 24 Years | 523 (6.0%) | $40,025 |
| 25 to 44 Years | 3,373 (38.5%) | $57,691 |
| 45 to 64 Years | 2,540 (29.0%) | $61,508 |
| 65+ Years | 2,336 (26.6%) | $38,929 |
| Total | 8,772 (100.0%) | $48,200 |
Poverty in Del City
Income Below Poverty by Sex and Age in Del City
With 15.8% poverty level for males and 25.1% for females among the residents of Del City, under 5 year old males and under 5 year old females are the most vulnerable to poverty, with 350 males (44.9%) and 557 females (48.4%) in their respective age groups living below the poverty level.
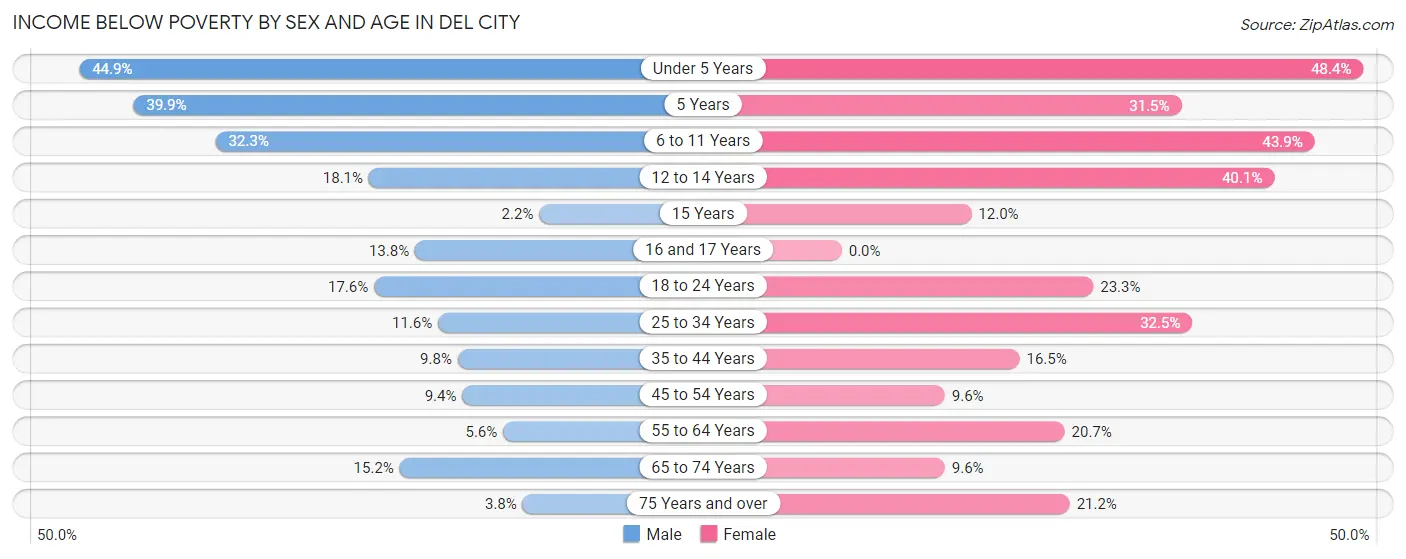
| Age Bracket | Male | Female |
| Under 5 Years | 350 (44.9%) | 557 (48.4%) |
| 5 Years | 85 (39.9%) | 69 (31.5%) |
| 6 to 11 Years | 285 (32.3%) | 297 (43.9%) |
| 12 to 14 Years | 61 (18.0%) | 189 (40.1%) |
| 15 Years | 3 (2.2%) | 16 (12.0%) |
| 16 and 17 Years | 38 (13.8%) | 0 (0.0%) |
| 18 to 24 Years | 152 (17.6%) | 229 (23.3%) |
| 25 to 34 Years | 195 (11.6%) | 586 (32.5%) |
| 35 to 44 Years | 145 (9.8%) | 216 (16.5%) |
| 45 to 54 Years | 90 (9.4%) | 117 (9.6%) |
| 55 to 64 Years | 65 (5.6%) | 260 (20.7%) |
| 65 to 74 Years | 146 (15.2%) | 86 (9.6%) |
| 75 Years and over | 24 (3.8%) | 166 (21.1%) |
| Total | 1,639 (15.8%) | 2,788 (25.1%) |
Income Above Poverty by Sex and Age in Del City
According to the poverty statistics in Del City, males aged 15 years and females aged 16 and 17 years are the age groups that are most secure financially, with 97.8% of males and 100.0% of females in these age groups living above the poverty line.
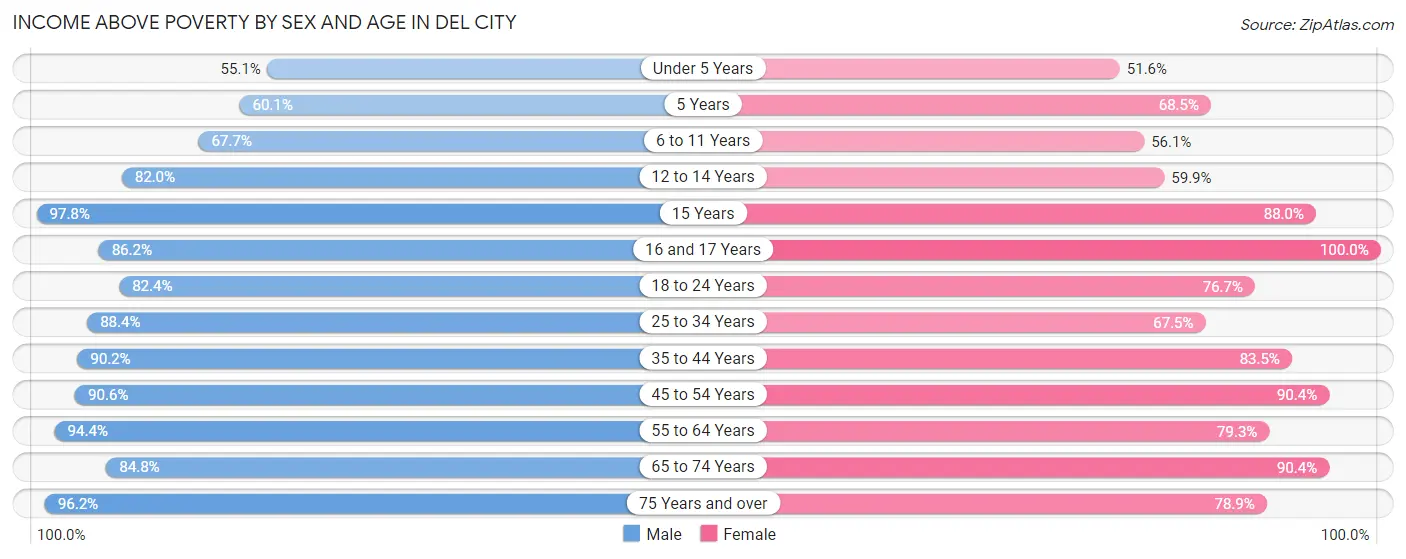
| Age Bracket | Male | Female |
| Under 5 Years | 429 (55.1%) | 594 (51.6%) |
| 5 Years | 128 (60.1%) | 150 (68.5%) |
| 6 to 11 Years | 598 (67.7%) | 380 (56.1%) |
| 12 to 14 Years | 277 (82.0%) | 282 (59.9%) |
| 15 Years | 131 (97.8%) | 117 (88.0%) |
| 16 and 17 Years | 238 (86.2%) | 199 (100.0%) |
| 18 to 24 Years | 713 (82.4%) | 752 (76.7%) |
| 25 to 34 Years | 1,482 (88.4%) | 1,216 (67.5%) |
| 35 to 44 Years | 1,334 (90.2%) | 1,093 (83.5%) |
| 45 to 54 Years | 870 (90.6%) | 1,107 (90.4%) |
| 55 to 64 Years | 1,097 (94.4%) | 997 (79.3%) |
| 65 to 74 Years | 815 (84.8%) | 814 (90.4%) |
| 75 Years and over | 611 (96.2%) | 619 (78.8%) |
| Total | 8,723 (84.2%) | 8,320 (74.9%) |
Income Below Poverty Among Married-Couple Families in Del City
The poverty statistics for married-couple families in Del City show that 6.4% or 200 of the total 3,128 families live below the poverty line. Families with 3 or 4 children have the highest poverty rate of 21.2%, comprising of 83 families. On the other hand, families with 1 or 2 children have the lowest poverty rate of 3.9%, which includes 43 families.
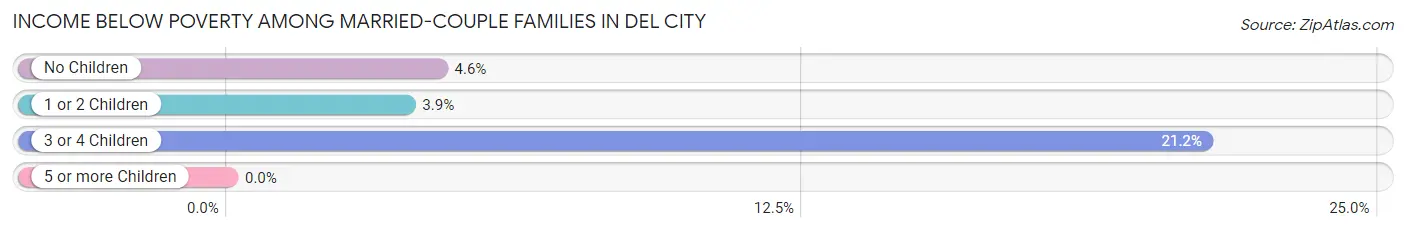
| Children | Above Poverty | Below Poverty |
| No Children | 1,549 (95.4%) | 74 (4.6%) |
| 1 or 2 Children | 1,071 (96.1%) | 43 (3.9%) |
| 3 or 4 Children | 308 (78.8%) | 83 (21.2%) |
| 5 or more Children | 0 (0.0%) | 0 (0.0%) |
| Total | 2,928 (93.6%) | 200 (6.4%) |
Income Below Poverty Among Single-Parent Households in Del City
According to the poverty data in Del City, 11.9% or 60 single-father households and 40.7% or 617 single-mother households are living below the poverty line. Among single-father households, those with 3 or 4 children have the highest poverty rate, with 34 households (87.2%) experiencing poverty. Likewise, among single-mother households, those with 5 or more children have the highest poverty rate, with 93 households (90.3%) falling below the poverty line.
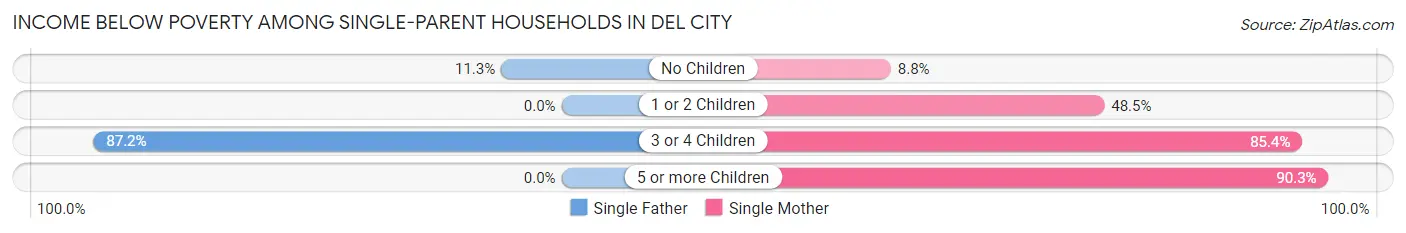
| Children | Single Father | Single Mother |
| No Children | 26 (11.3%) | 51 (8.8%) |
| 1 or 2 Children | 0 (0.0%) | 315 (48.5%) |
| 3 or 4 Children | 34 (87.2%) | 158 (85.4%) |
| 5 or more Children | 0 (0.0%) | 93 (90.3%) |
| Total | 60 (11.9%) | 617 (40.7%) |
Income Below Poverty Among Married-Couple vs Single-Parent Households in Del City
The poverty data for Del City shows that 200 of the married-couple family households (6.4%) and 677 of the single-parent households (33.5%) are living below the poverty level. Within the married-couple family households, those with 3 or 4 children have the highest poverty rate, with 83 households (21.2%) falling below the poverty line. Among the single-parent households, those with 5 or more children have the highest poverty rate, with 93 household (90.3%) living below poverty.
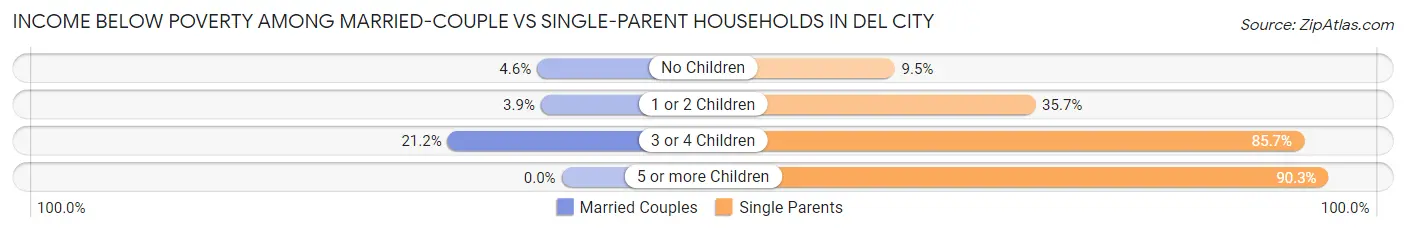
| Children | Married-Couple Families | Single-Parent Households |
| No Children | 74 (4.6%) | 77 (9.5%) |
| 1 or 2 Children | 43 (3.9%) | 315 (35.7%) |
| 3 or 4 Children | 83 (21.2%) | 192 (85.7%) |
| 5 or more Children | 0 (0.0%) | 93 (90.3%) |
| Total | 200 (6.4%) | 677 (33.5%) |
Race in Del City
The most populous races in Del City are White / Caucasian (11,679 | 53.9%), Black / African American (4,786 | 22.1%), and Two or more Races (3,127 | 14.4%).
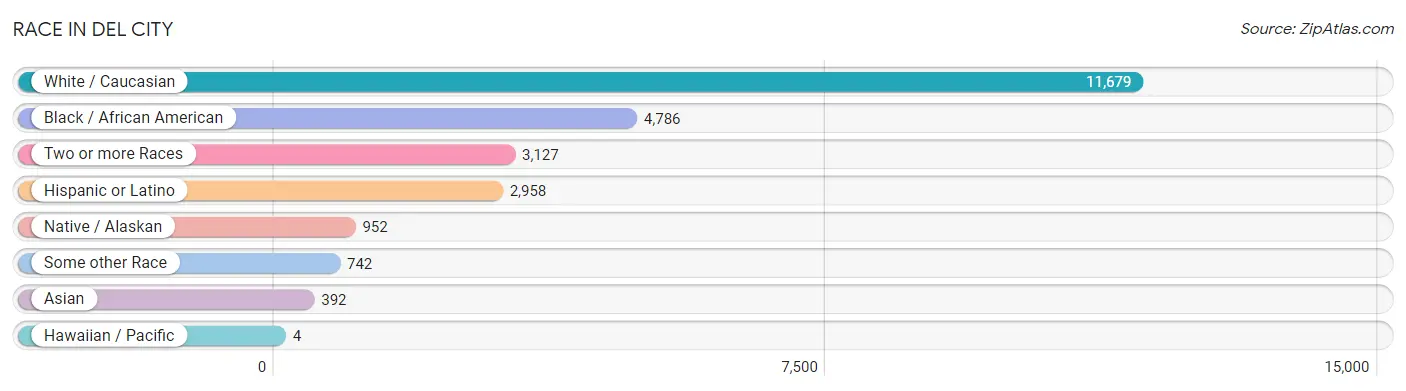
| Race | # Population | % Population |
| Asian | 392 | 1.8% |
| Black / African American | 4,786 | 22.1% |
| Hawaiian / Pacific | 4 | 0.0% |
| Hispanic or Latino | 2,958 | 13.6% |
| Native / Alaskan | 952 | 4.4% |
| White / Caucasian | 11,679 | 53.9% |
| Two or more Races | 3,127 | 14.4% |
| Some other Race | 742 | 3.4% |
| Total | 21,682 | 100.0% |
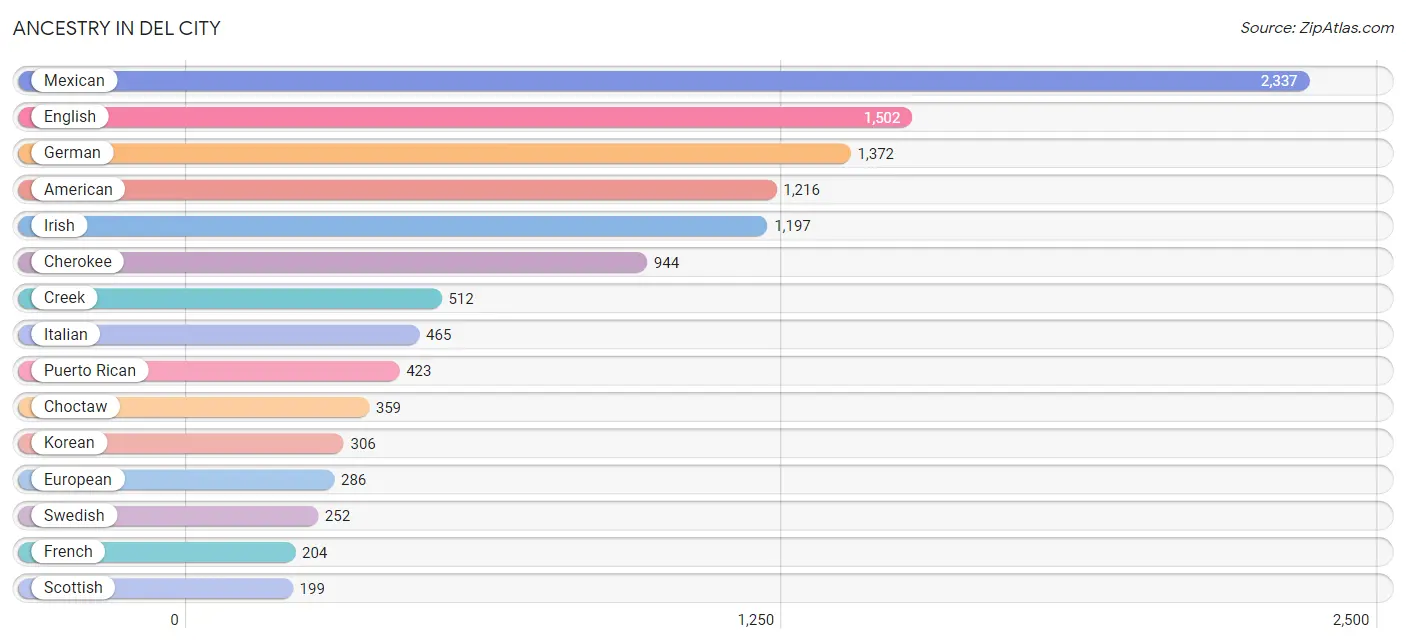
Ancestry in Del City
The most populous ancestries reported in Del City are Mexican (2,337 | 10.8%), English (1,502 | 6.9%), German (1,372 | 6.3%), American (1,216 | 5.6%), and Irish (1,197 | 5.5%), together accounting for 35.2% of all Del City residents.
| Ancestry | # Population | % Population |
| African | 156 | 0.7% |
| American | 1,216 | 5.6% |
| Apache | 66 | 0.3% |
| Arab | 62 | 0.3% |
| Austrian | 16 | 0.1% |
| Belgian | 5 | 0.0% |
| Bhutanese | 59 | 0.3% |
| British | 91 | 0.4% |
| Burmese | 44 | 0.2% |
| Cambodian | 15 | 0.1% |
| Canadian | 28 | 0.1% |
| Central American | 22 | 0.1% |
| Central American Indian | 13 | 0.1% |
| Cherokee | 944 | 4.3% |
| Cheyenne | 1 | 0.0% |
| Chickasaw | 171 | 0.8% |
| Choctaw | 359 | 1.7% |
| Colombian | 55 | 0.3% |
| Comanche | 81 | 0.4% |
| Creek | 512 | 2.4% |
| Cuban | 29 | 0.1% |
| Czech | 49 | 0.2% |
| Czechoslovakian | 12 | 0.1% |
| Danish | 17 | 0.1% |
| Delaware | 10 | 0.1% |
| Dutch | 92 | 0.4% |
| Dutch West Indian | 16 | 0.1% |
| Eastern European | 16 | 0.1% |
| English | 1,502 | 6.9% |
| European | 286 | 1.3% |
| Finnish | 9 | 0.0% |
| French | 204 | 0.9% |
| French American Indian | 25 | 0.1% |
| French Canadian | 47 | 0.2% |
| German | 1,372 | 6.3% |
| German Russian | 9 | 0.0% |
| Greek | 33 | 0.2% |
| Guamanian / Chamorro | 11 | 0.1% |
| Guatemalan | 10 | 0.1% |
| Honduran | 6 | 0.0% |
| Hopi | 6 | 0.0% |
| Indian (Asian) | 41 | 0.2% |
| Iranian | 22 | 0.1% |
| Irish | 1,197 | 5.5% |
| Italian | 465 | 2.1% |
| Japanese | 124 | 0.6% |
| Kiowa | 31 | 0.1% |
| Korean | 306 | 1.4% |
| Laotian | 25 | 0.1% |
| Lebanese | 40 | 0.2% |
| Malaysian | 3 | 0.0% |
| Mexican | 2,337 | 10.8% |
| Mexican American Indian | 44 | 0.2% |
| Moroccan | 47 | 0.2% |
| Native Hawaiian | 8 | 0.0% |
| Navajo | 5 | 0.0% |
| Nigerian | 9 | 0.0% |
| Northern European | 29 | 0.1% |
| Norwegian | 46 | 0.2% |
| Pakistani | 29 | 0.1% |
| Peruvian | 25 | 0.1% |
| Polish | 34 | 0.2% |
| Puerto Rican | 423 | 1.9% |
| Romanian | 6 | 0.0% |
| Russian | 7 | 0.0% |
| Salvadoran | 6 | 0.0% |
| Scandinavian | 41 | 0.2% |
| Scotch-Irish | 96 | 0.4% |
| Scottish | 199 | 0.9% |
| Seminole | 114 | 0.5% |
| Sioux | 42 | 0.2% |
| Slovak | 9 | 0.0% |
| South African | 9 | 0.0% |
| South American | 94 | 0.4% |
| Spaniard | 20 | 0.1% |
| Sri Lankan | 40 | 0.2% |
| Subsaharan African | 174 | 0.8% |
| Swedish | 252 | 1.2% |
| Swiss | 53 | 0.2% |
| Thai | 18 | 0.1% |
| Welsh | 86 | 0.4% | View All 81 Rows |
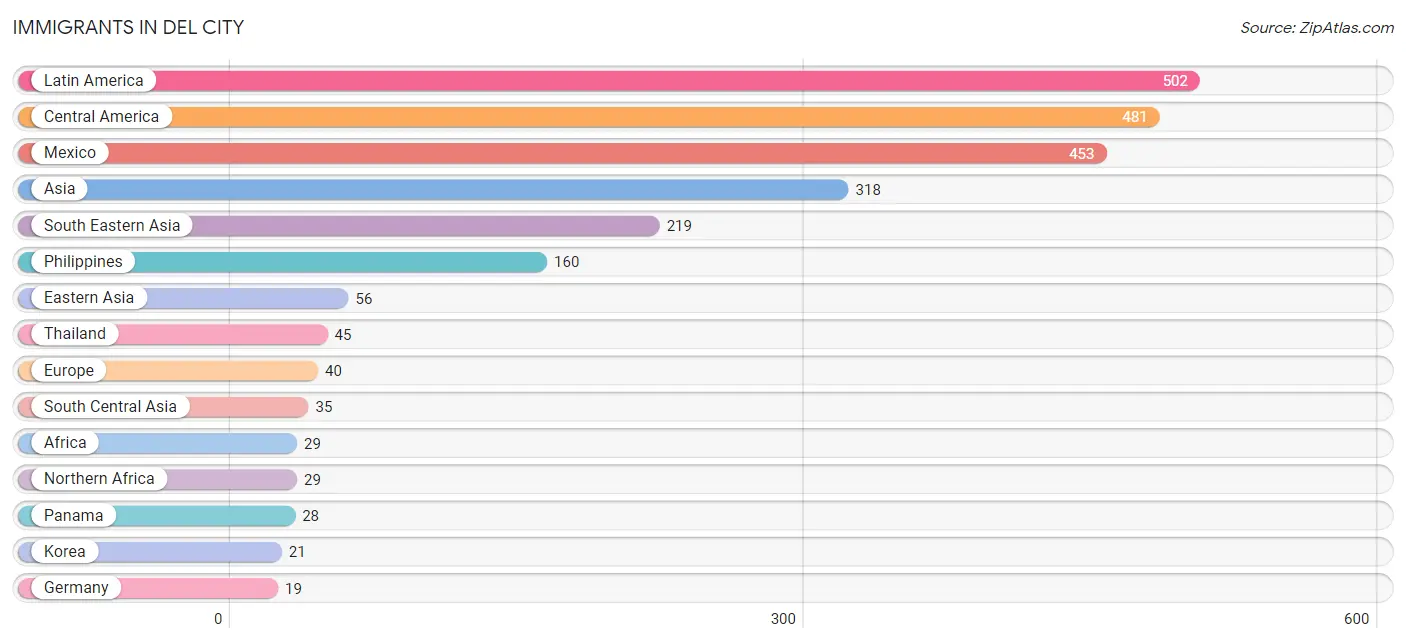
Immigrants in Del City
The most numerous immigrant groups reported in Del City came from Latin America (502 | 2.3%), Central America (481 | 2.2%), Mexico (453 | 2.1%), Asia (318 | 1.5%), and South Eastern Asia (219 | 1.0%), together accounting for 9.1% of all Del City residents.
| Immigration Origin | # Population | % Population |
| Africa | 29 | 0.1% |
| Asia | 318 | 1.5% |
| Caribbean | 4 | 0.0% |
| Central America | 481 | 2.2% |
| China | 12 | 0.1% |
| Colombia | 17 | 0.1% |
| Cuba | 4 | 0.0% |
| Eastern Asia | 56 | 0.3% |
| Europe | 40 | 0.2% |
| Germany | 19 | 0.1% |
| India | 7 | 0.0% |
| Iran | 17 | 0.1% |
| Iraq | 8 | 0.0% |
| Italy | 14 | 0.1% |
| Japan | 8 | 0.0% |
| Korea | 21 | 0.1% |
| Latin America | 502 | 2.3% |
| Mexico | 453 | 2.1% |
| Morocco | 10 | 0.1% |
| Northern Africa | 29 | 0.1% |
| Northern Europe | 7 | 0.0% |
| Pakistan | 11 | 0.1% |
| Panama | 28 | 0.1% |
| Philippines | 160 | 0.7% |
| South America | 17 | 0.1% |
| South Central Asia | 35 | 0.2% |
| South Eastern Asia | 219 | 1.0% |
| Southern Europe | 14 | 0.1% |
| Sudan | 19 | 0.1% |
| Thailand | 45 | 0.2% |
| Vietnam | 14 | 0.1% |
| Western Asia | 8 | 0.0% |
| Western Europe | 19 | 0.1% | View All 33 Rows |
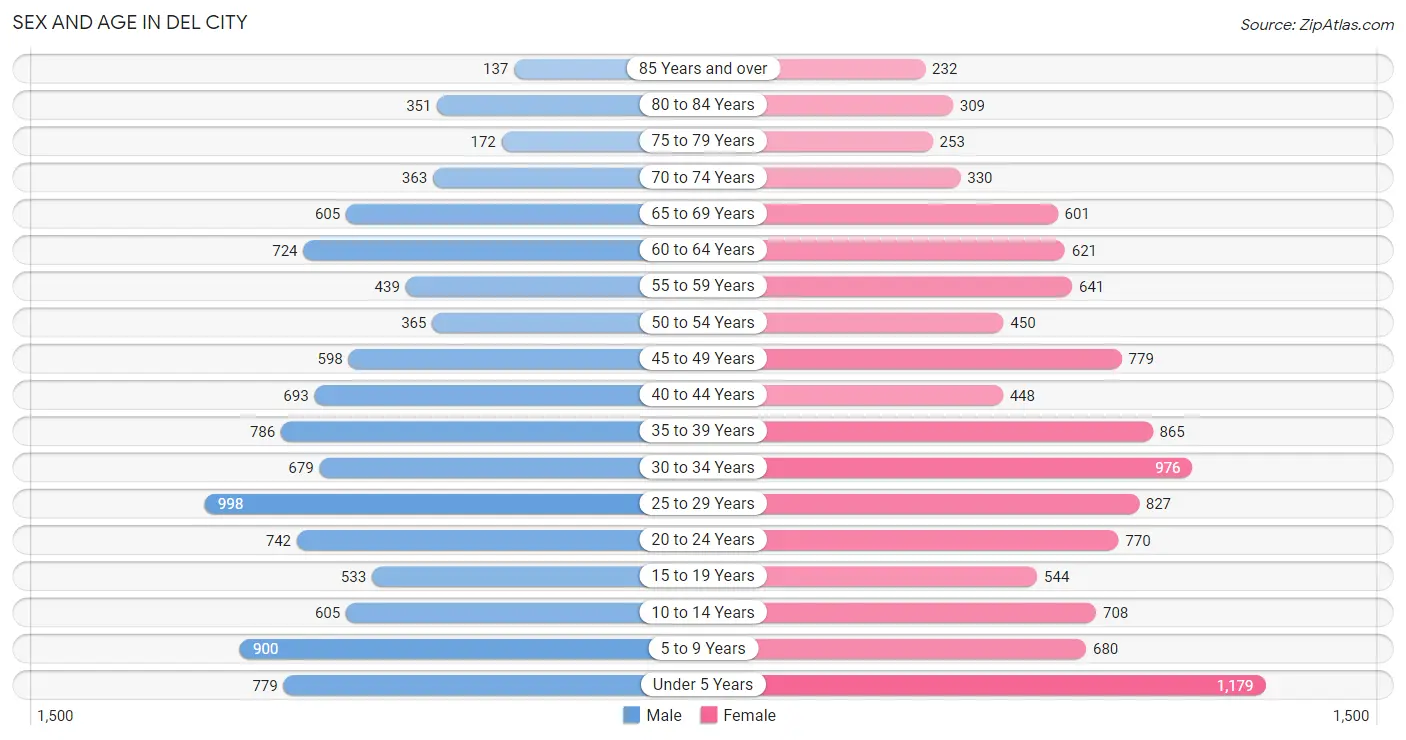
Sex and Age in Del City
Sex and Age in Del City
The most populous age groups in Del City are 25 to 29 Years (998 | 9.5%) for men and Under 5 Years (1,179 | 10.5%) for women.
| Age Bracket | Male | Female |
| Under 5 Years | 779 (7.4%) | 1,179 (10.5%) |
| 5 to 9 Years | 900 (8.6%) | 680 (6.1%) |
| 10 to 14 Years | 605 (5.8%) | 708 (6.3%) |
| 15 to 19 Years | 533 (5.1%) | 544 (4.9%) |
| 20 to 24 Years | 742 (7.1%) | 770 (6.9%) |
| 25 to 29 Years | 998 (9.5%) | 827 (7.4%) |
| 30 to 34 Years | 679 (6.5%) | 976 (8.7%) |
| 35 to 39 Years | 786 (7.5%) | 865 (7.7%) |
| 40 to 44 Years | 693 (6.6%) | 448 (4.0%) |
| 45 to 49 Years | 598 (5.7%) | 779 (7.0%) |
| 50 to 54 Years | 365 (3.5%) | 450 (4.0%) |
| 55 to 59 Years | 439 (4.2%) | 641 (5.7%) |
| 60 to 64 Years | 724 (6.9%) | 621 (5.5%) |
| 65 to 69 Years | 605 (5.8%) | 601 (5.4%) |
| 70 to 74 Years | 363 (3.5%) | 330 (2.9%) |
| 75 to 79 Years | 172 (1.6%) | 253 (2.3%) |
| 80 to 84 Years | 351 (3.4%) | 309 (2.8%) |
| 85 Years and over | 137 (1.3%) | 232 (2.1%) |
| Total | 10,469 (100.0%) | 11,213 (100.0%) |
Families and Households in Del City
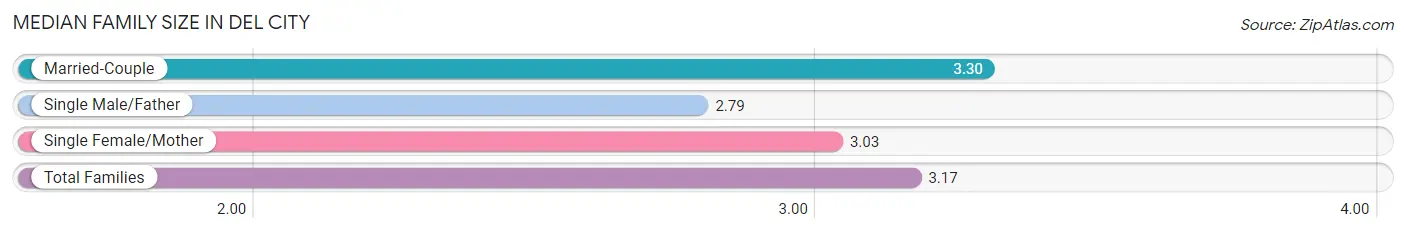
Median Family Size in Del City
The median family size in Del City is 3.17 persons per family, with married-couple families (3,128 | 60.8%) accounting for the largest median family size of 3.3 persons per family. On the other hand, single male/father families (504 | 9.8%) represent the smallest median family size with 2.79 persons per family.
| Family Type | # Families | Family Size |
| Married-Couple | 3,128 (60.8%) | 3.30 |
| Single Male/Father | 504 (9.8%) | 2.79 |
| Single Female/Mother | 1,517 (29.5%) | 3.03 |
| Total Families | 5,149 (100.0%) | 3.17 |
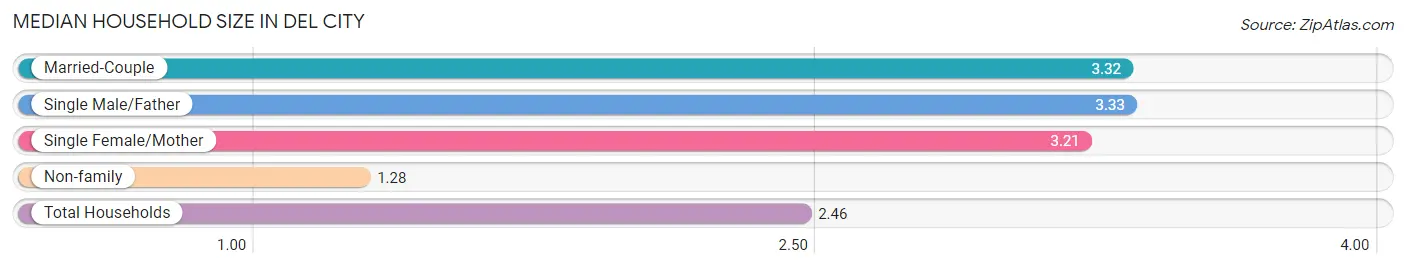
Median Household Size in Del City
The median household size in Del City is 2.46 persons per household, with single male/father households (504 | 5.8%) accounting for the largest median household size of 3.33 persons per household. non-family households (3,623 | 41.3%) represent the smallest median household size with 1.28 persons per household.
| Household Type | # Households | Household Size |
| Married-Couple | 3,128 (35.7%) | 3.32 |
| Single Male/Father | 504 (5.8%) | 3.33 |
| Single Female/Mother | 1,517 (17.3%) | 3.21 |
| Non-family | 3,623 (41.3%) | 1.28 |
| Total Households | 8,772 (100.0%) | 2.46 |
Household Size by Marriage Status in Del City
Out of a total of 8,772 households in Del City, 5,149 (58.7%) are family households, while 3,623 (41.3%) are nonfamily households. The most numerous type of family households are 2-person households, comprising 2,001, and the most common type of nonfamily households are 1-person households, comprising 2,892.
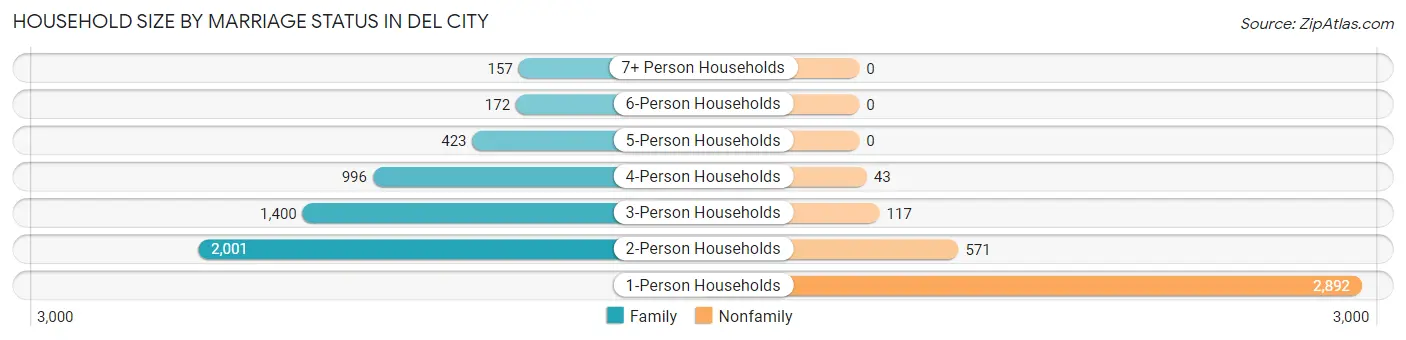
| Household Size | Family Households | Nonfamily Households |
| 1-Person Households | - | 2,892 (33.0%) |
| 2-Person Households | 2,001 (22.8%) | 571 (6.5%) |
| 3-Person Households | 1,400 (16.0%) | 117 (1.3%) |
| 4-Person Households | 996 (11.4%) | 43 (0.5%) |
| 5-Person Households | 423 (4.8%) | 0 (0.0%) |
| 6-Person Households | 172 (2.0%) | 0 (0.0%) |
| 7+ Person Households | 157 (1.8%) | 0 (0.0%) |
| Total | 5,149 (58.7%) | 3,623 (41.3%) |
Female Fertility in Del City
Fertility by Age in Del City
Average fertility rate in Del City is 120.0 births per 1,000 women. Women in the age bracket of 20 to 34 years have the highest fertility rate with 216.0 births per 1,000 women. Women in the age bracket of 20 to 34 years acount for 86.7% of all women with births.
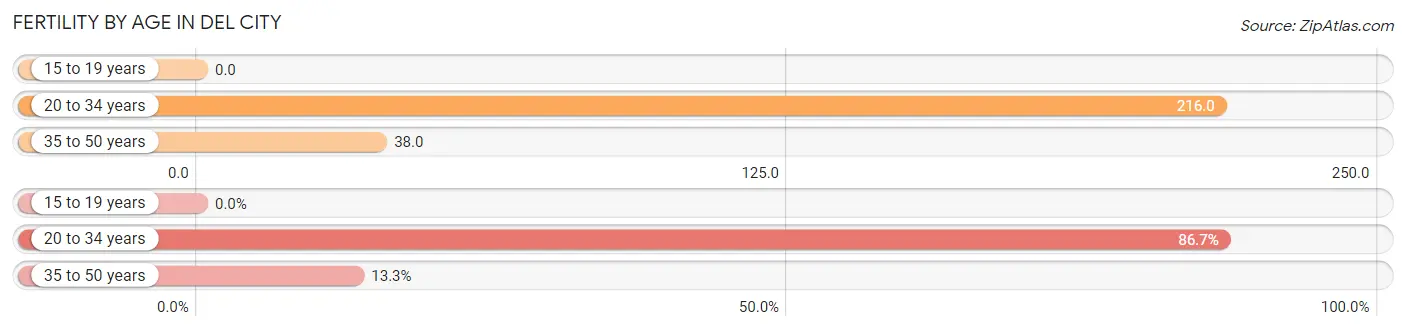
| Age Bracket | Women with Births | Births / 1,000 Women |
| 15 to 19 years | 0 (0.0%) | 0.0 |
| 20 to 34 years | 556 (86.7%) | 216.0 |
| 35 to 50 years | 85 (13.3%) | 38.0 |
| Total | 641 (100.0%) | 120.0 |
Fertility by Age by Marriage Status in Del City
53.5% of women with births (641) in Del City are married. The highest percentage of unmarried women with births falls into 20 to 34 years age bracket with 49.8% of them unmarried at the time of birth, while the lowest percentage of unmarried women with births belong to 35 to 50 years age bracket with 24.7% of them unmarried.
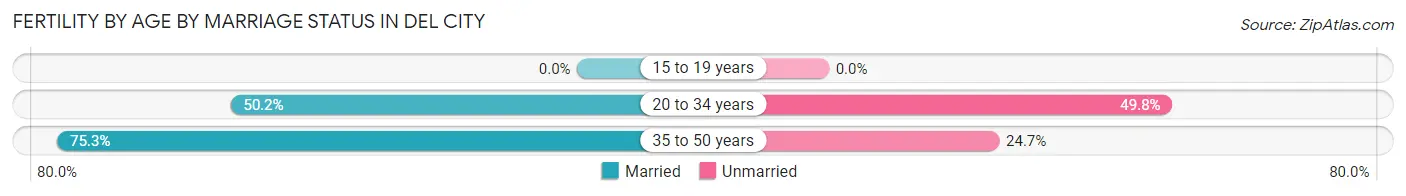
| Age Bracket | Married | Unmarried |
| 15 to 19 years | 0 (0.0%) | 0 (0.0%) |
| 20 to 34 years | 279 (50.2%) | 277 (49.8%) |
| 35 to 50 years | 64 (75.3%) | 21 (24.7%) |
| Total | 343 (53.5%) | 298 (46.5%) |
Fertility by Education in Del City
Average fertility rate in Del City is 120.0 births per 1,000 women. Women with the education attainment of graduate degree have the highest fertility rate of 203.0 births per 1,000 women, while women with the education attainment of less than high school have the lowest fertility at 1.0 births per 1,000 women. Women with the education attainment of college or associate's degree represent 45.1% of all women with births.
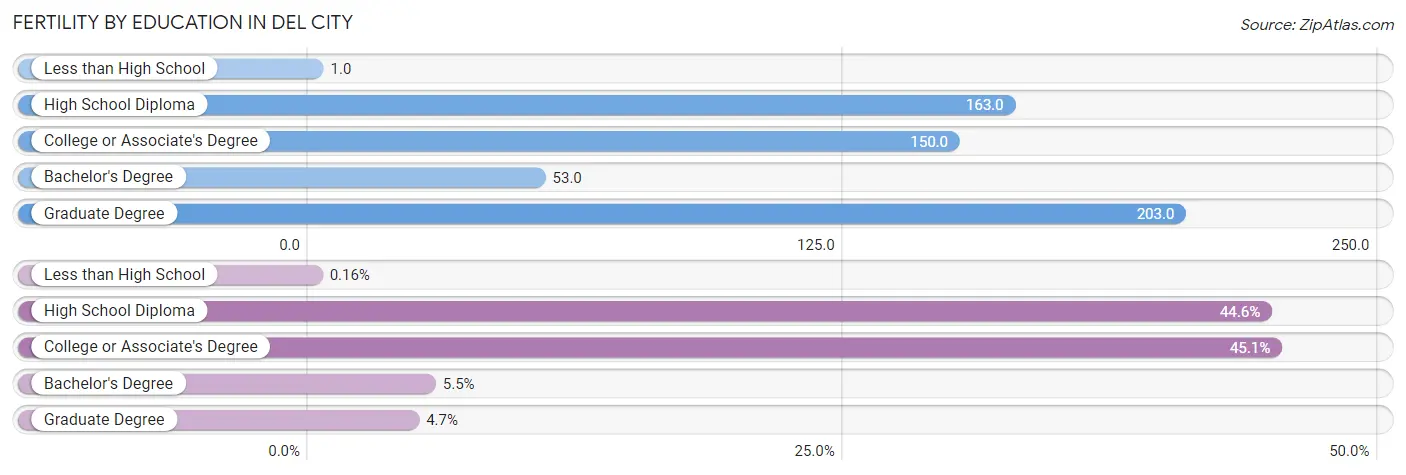
| Educational Attainment | Women with Births | Births / 1,000 Women |
| Less than High School | 1 (0.2%) | 1.0 |
| High School Diploma | 286 (44.6%) | 163.0 |
| College or Associate's Degree | 289 (45.1%) | 150.0 |
| Bachelor's Degree | 35 (5.5%) | 53.0 |
| Graduate Degree | 30 (4.7%) | 203.0 |
| Total | 641 (100.0%) | 120.0 |
Fertility by Education by Marriage Status in Del City
46.5% of women with births in Del City are unmarried. Women with the educational attainment of bachelor's degree are most likely to be married with 100.0% of them married at childbirth, while women with the educational attainment of less than high school are least likely to be married with 100.0% of them unmarried at childbirth.
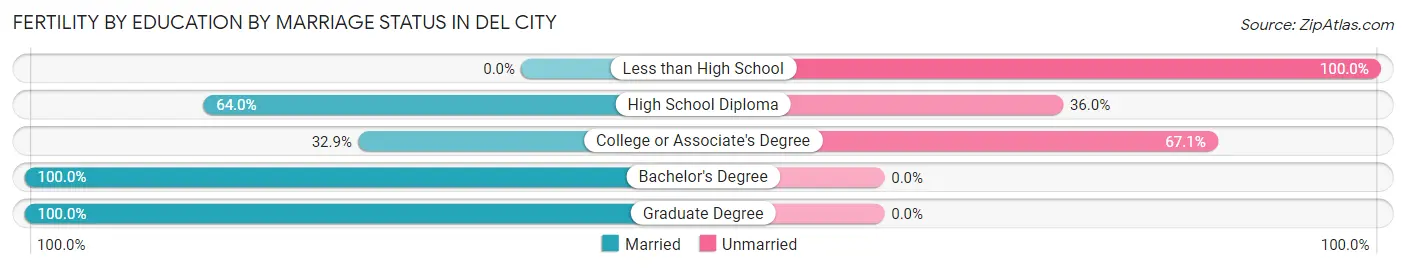
| Educational Attainment | Married | Unmarried |
| Less than High School | 0 (0.0%) | 1 (100.0%) |
| High School Diploma | 183 (64.0%) | 103 (36.0%) |
| College or Associate's Degree | 95 (32.9%) | 194 (67.1%) |
| Bachelor's Degree | 35 (100.0%) | 0 (0.0%) |
| Graduate Degree | 30 (100.0%) | 0 (0.0%) |
| Total | 343 (53.5%) | 298 (46.5%) |
Employment Characteristics in Del City
Employment by Class of Employer in Del City
Among the 9,412 employed individuals in Del City, private company employees (6,151 | 65.3%), federal government employees (950 | 10.1%), and not-for-profit organizations (589 | 6.3%) make up the most common classes of employment.
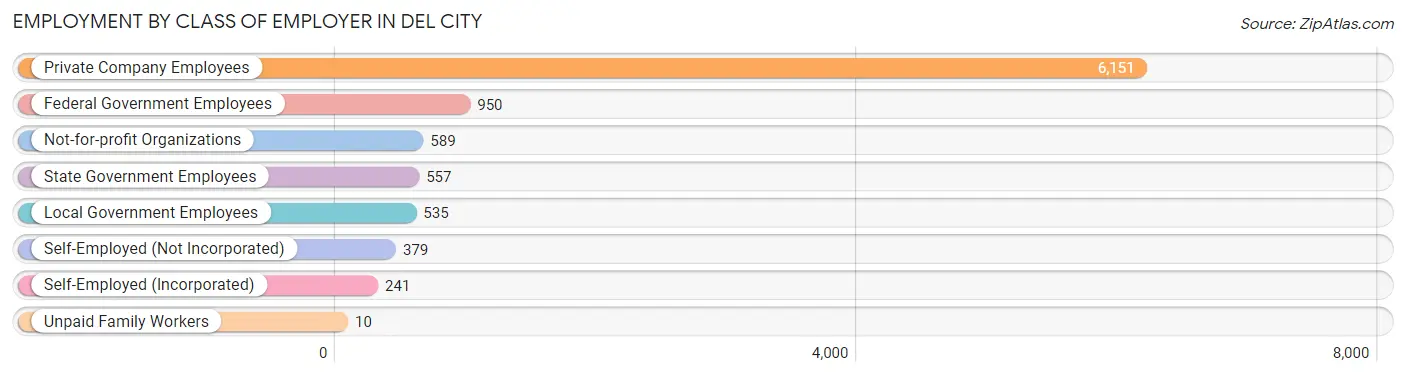
| Employer Class | # Employees | % Employees |
| Private Company Employees | 6,151 | 65.3% |
| Self-Employed (Incorporated) | 241 | 2.6% |
| Self-Employed (Not Incorporated) | 379 | 4.0% |
| Not-for-profit Organizations | 589 | 6.3% |
| Local Government Employees | 535 | 5.7% |
| State Government Employees | 557 | 5.9% |
| Federal Government Employees | 950 | 10.1% |
| Unpaid Family Workers | 10 | 0.1% |
| Total | 9,412 | 100.0% |
Employment Status by Age in Del City
According to the labor force statistics for Del City, out of the total population over 16 years of age (16,564), 61.9% or 10,253 individuals are in the labor force, with 6.2% or 636 of them unemployed. The age group with the highest labor force participation rate is 35 to 44 years, with 87.5% or 2,443 individuals in the labor force. Within the labor force, the 25 to 29 years age range has the highest percentage of unemployed individuals, with 11.4% or 160 of them being unemployed.
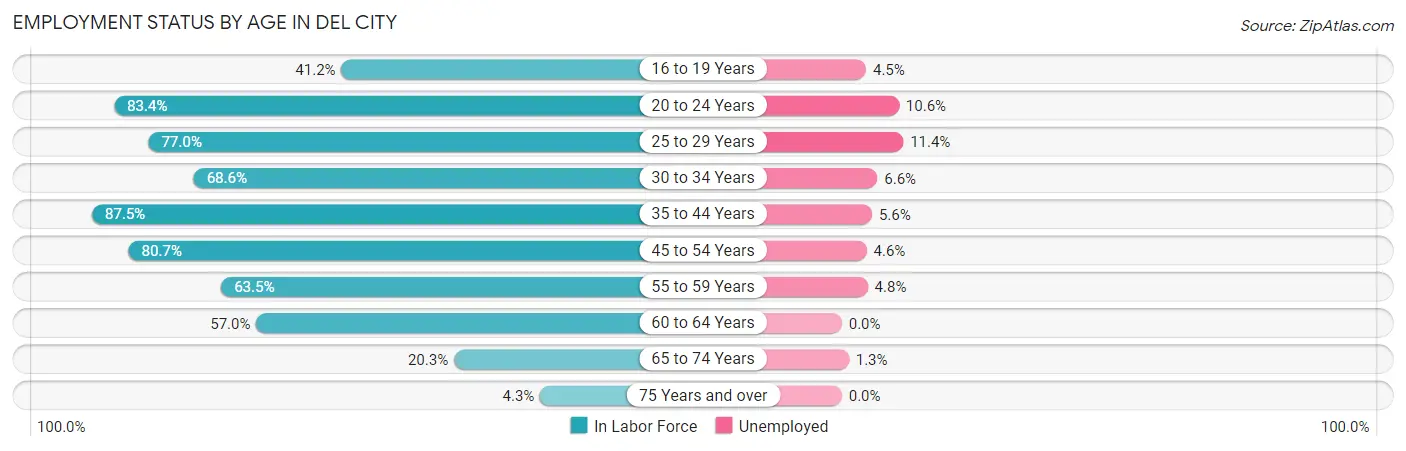
| Age Bracket | In Labor Force | Unemployed |
| 16 to 19 Years | 334 (41.2%) | 15 (4.5%) |
| 20 to 24 Years | 1,261 (83.4%) | 134 (10.6%) |
| 25 to 29 Years | 1,405 (77.0%) | 160 (11.4%) |
| 30 to 34 Years | 1,135 (68.6%) | 75 (6.6%) |
| 35 to 44 Years | 2,443 (87.5%) | 137 (5.6%) |
| 45 to 54 Years | 1,769 (80.7%) | 81 (4.6%) |
| 55 to 59 Years | 686 (63.5%) | 33 (4.8%) |
| 60 to 64 Years | 767 (57.0%) | 0 (0.0%) |
| 65 to 74 Years | 385 (20.3%) | 5 (1.3%) |
| 75 Years and over | 63 (4.3%) | 0 (0.0%) |
| Total | 10,253 (61.9%) | 636 (6.2%) |
Employment Status by Educational Attainment in Del City
According to labor force statistics for Del City, 75.4% of individuals (8,210) out of the total population between 25 and 64 years of age (10,889) are in the labor force, with 5.9% or 484 of them being unemployed. The group with the highest labor force participation rate are those with the educational attainment of bachelor's degree or higher, with 86.4% or 1,450 individuals in the labor force. Within the labor force, individuals with less than high school education have the highest percentage of unemployment, with 8.6% or 60 of them being unemployed.
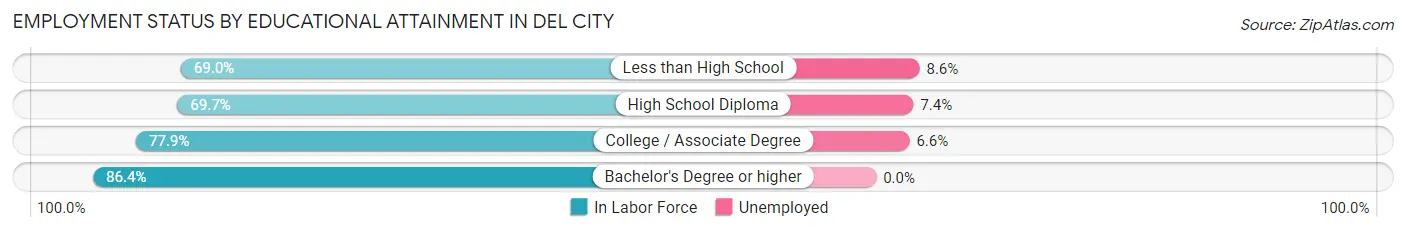
| Educational Attainment | In Labor Force | Unemployed |
| Less than High School | 697 (69.0%) | 87 (8.6%) |
| High School Diploma | 2,782 (69.7%) | 295 (7.4%) |
| College / Associate Degree | 3,279 (77.9%) | 278 (6.6%) |
| Bachelor's Degree or higher | 1,450 (86.4%) | 0 (0.0%) |
| Total | 8,210 (75.4%) | 642 (5.9%) |
Employment Occupations by Sex in Del City
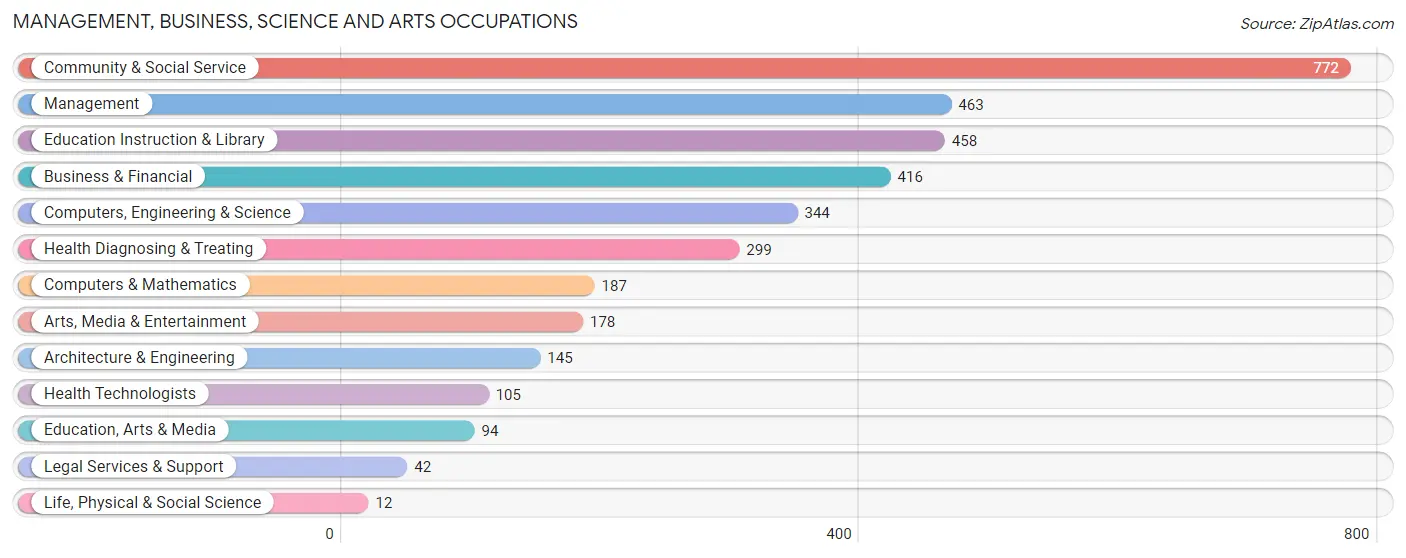
Management, Business, Science and Arts Occupations
The most common Management, Business, Science and Arts occupations in Del City are Community & Social Service (772 | 8.2%), Management (463 | 4.9%), Education Instruction & Library (458 | 4.9%), Business & Financial (416 | 4.4%), and Computers, Engineering & Science (344 | 3.7%).
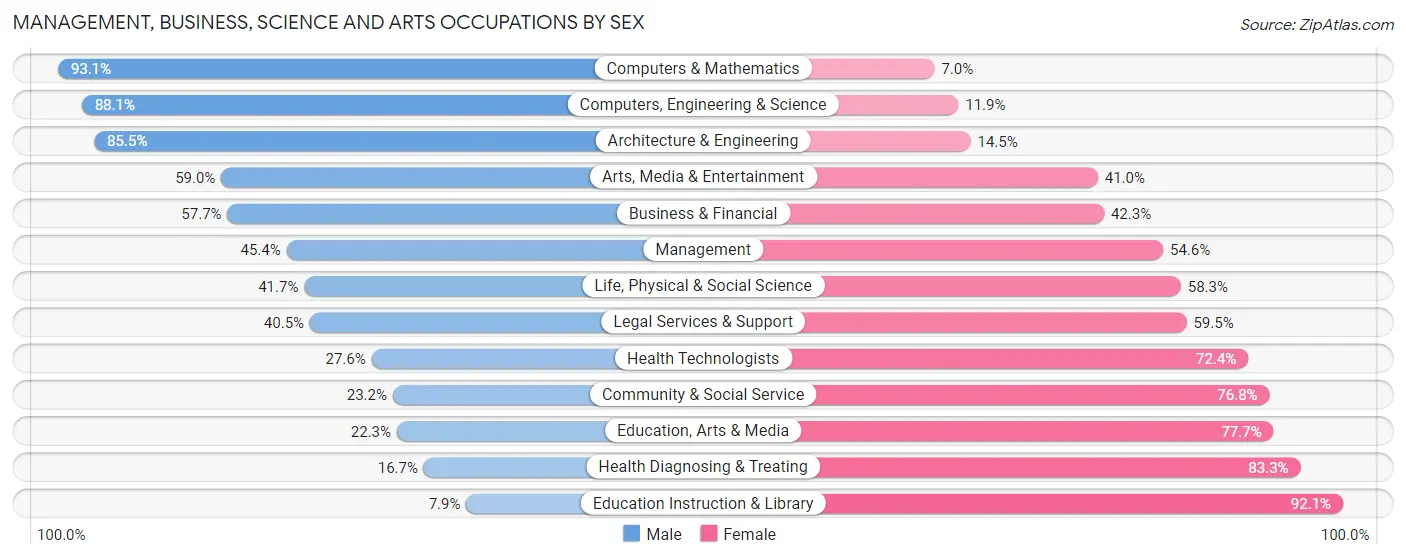
Management, Business, Science and Arts Occupations by Sex
Within the Management, Business, Science and Arts occupations in Del City, the most male-oriented occupations are Computers & Mathematics (93.0%), Computers, Engineering & Science (88.1%), and Architecture & Engineering (85.5%), while the most female-oriented occupations are Education Instruction & Library (92.1%), Health Diagnosing & Treating (83.3%), and Education, Arts & Media (77.7%).
| Occupation | Male | Female |
| Management | 210 (45.4%) | 253 (54.6%) |
| Business & Financial | 240 (57.7%) | 176 (42.3%) |
| Computers, Engineering & Science | 303 (88.1%) | 41 (11.9%) |
| Computers & Mathematics | 174 (93.0%) | 13 (7.0%) |
| Architecture & Engineering | 124 (85.5%) | 21 (14.5%) |
| Life, Physical & Social Science | 5 (41.7%) | 7 (58.3%) |
| Community & Social Service | 179 (23.2%) | 593 (76.8%) |
| Education, Arts & Media | 21 (22.3%) | 73 (77.7%) |
| Legal Services & Support | 17 (40.5%) | 25 (59.5%) |
| Education Instruction & Library | 36 (7.9%) | 422 (92.1%) |
| Arts, Media & Entertainment | 105 (59.0%) | 73 (41.0%) |
| Health Diagnosing & Treating | 50 (16.7%) | 249 (83.3%) |
| Health Technologists | 29 (27.6%) | 76 (72.4%) |
| Total (Category) | 982 (42.8%) | 1,312 (57.2%) |
| Total (Overall) | 4,992 (53.2%) | 4,387 (46.8%) |
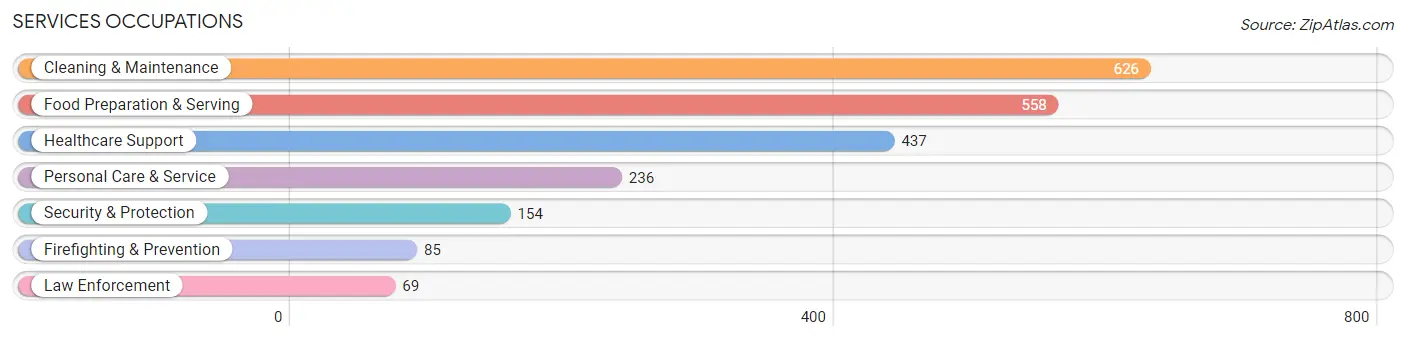
Services Occupations
The most common Services occupations in Del City are Cleaning & Maintenance (626 | 6.7%), Food Preparation & Serving (558 | 5.9%), Healthcare Support (437 | 4.7%), Personal Care & Service (236 | 2.5%), and Security & Protection (154 | 1.6%).
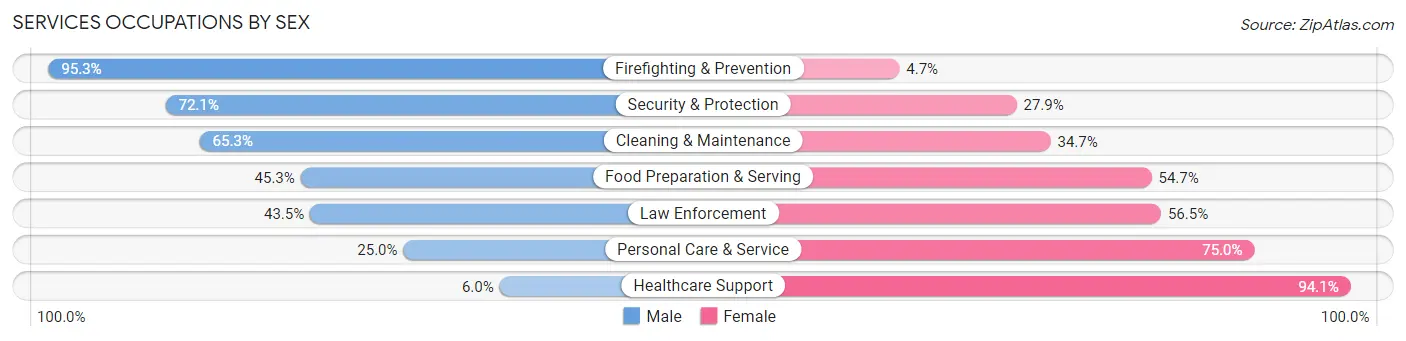
Services Occupations by Sex
Within the Services occupations in Del City, the most male-oriented occupations are Firefighting & Prevention (95.3%), Security & Protection (72.1%), and Cleaning & Maintenance (65.3%), while the most female-oriented occupations are Healthcare Support (94.1%), Personal Care & Service (75.0%), and Law Enforcement (56.5%).
| Occupation | Male | Female |
| Healthcare Support | 26 (5.9%) | 411 (94.1%) |
| Security & Protection | 111 (72.1%) | 43 (27.9%) |
| Firefighting & Prevention | 81 (95.3%) | 4 (4.7%) |
| Law Enforcement | 30 (43.5%) | 39 (56.5%) |
| Food Preparation & Serving | 253 (45.3%) | 305 (54.7%) |
| Cleaning & Maintenance | 409 (65.3%) | 217 (34.7%) |
| Personal Care & Service | 59 (25.0%) | 177 (75.0%) |
| Total (Category) | 858 (42.7%) | 1,153 (57.3%) |
| Total (Overall) | 4,992 (53.2%) | 4,387 (46.8%) |
Sales and Office Occupations
The most common Sales and Office occupations in Del City are Sales & Related (1,181 | 12.6%), and Office & Administration (1,108 | 11.8%).

Sales and Office Occupations by Sex

| Occupation | Male | Female |
| Sales & Related | 397 (33.6%) | 784 (66.4%) |
| Office & Administration | 386 (34.8%) | 722 (65.2%) |
| Total (Category) | 783 (34.2%) | 1,506 (65.8%) |
| Total (Overall) | 4,992 (53.2%) | 4,387 (46.8%) |
Natural Resources, Construction and Maintenance Occupations
The most common Natural Resources, Construction and Maintenance occupations in Del City are Installation, Maintenance & Repair (547 | 5.8%), Construction & Extraction (466 | 5.0%), and Farming, Fishing & Forestry (28 | 0.3%).
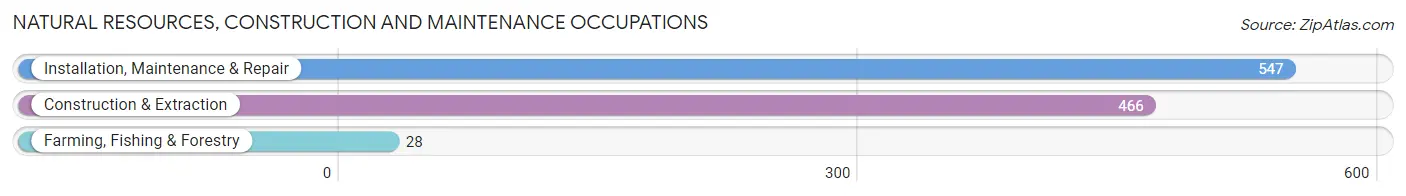
Natural Resources, Construction and Maintenance Occupations by Sex

| Occupation | Male | Female |
| Farming, Fishing & Forestry | 28 (100.0%) | 0 (0.0%) |
| Construction & Extraction | 435 (93.3%) | 31 (6.7%) |
| Installation, Maintenance & Repair | 500 (91.4%) | 47 (8.6%) |
| Total (Category) | 963 (92.5%) | 78 (7.5%) |
| Total (Overall) | 4,992 (53.2%) | 4,387 (46.8%) |
Production, Transportation and Moving Occupations
The most common Production, Transportation and Moving occupations in Del City are Production (629 | 6.7%), Material Moving (567 | 6.0%), and Transportation (548 | 5.8%).
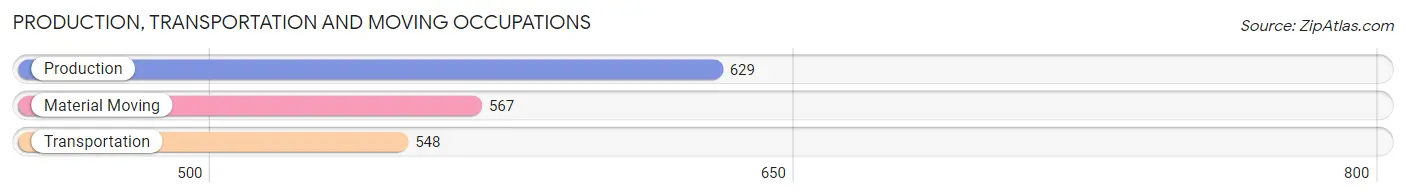
Production, Transportation and Moving Occupations by Sex
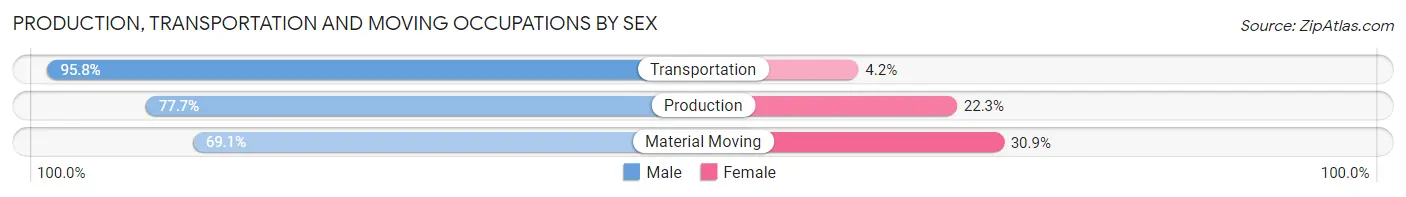
| Occupation | Male | Female |
| Production | 489 (77.7%) | 140 (22.3%) |
| Transportation | 525 (95.8%) | 23 (4.2%) |
| Material Moving | 392 (69.1%) | 175 (30.9%) |
| Total (Category) | 1,406 (80.6%) | 338 (19.4%) |
| Total (Overall) | 4,992 (53.2%) | 4,387 (46.8%) |
Employment Industries by Sex in Del City
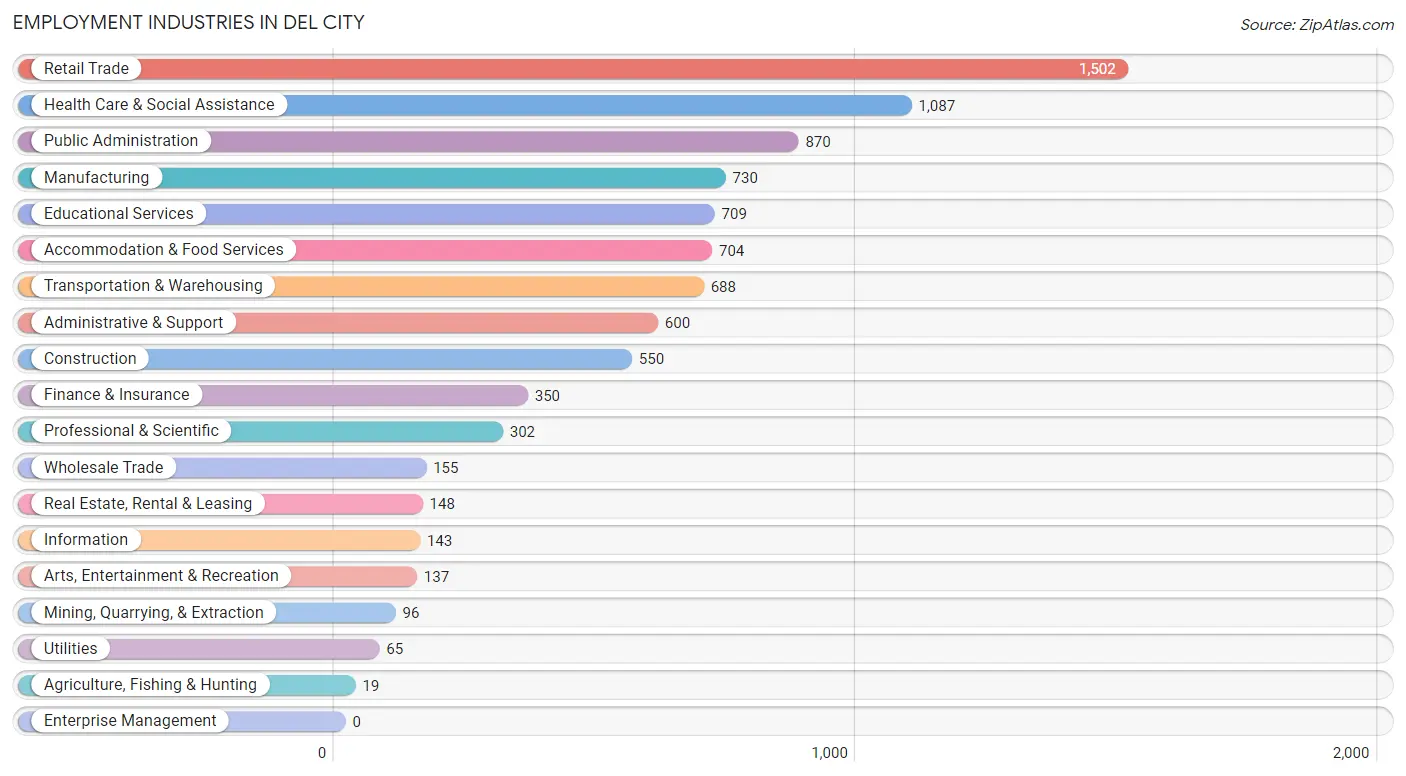
Employment Industries in Del City
The major employment industries in Del City include Retail Trade (1,502 | 16.0%), Health Care & Social Assistance (1,087 | 11.6%), Public Administration (870 | 9.3%), Manufacturing (730 | 7.8%), and Educational Services (709 | 7.6%).
Employment Industries by Sex in Del City
The Del City industries that see more men than women are Construction (94.2%), Utilities (86.2%), and Mining, Quarrying, & Extraction (85.4%), whereas the industries that tend to have a higher number of women are Real Estate, Rental & Leasing (87.2%), Health Care & Social Assistance (82.6%), and Finance & Insurance (68.6%).
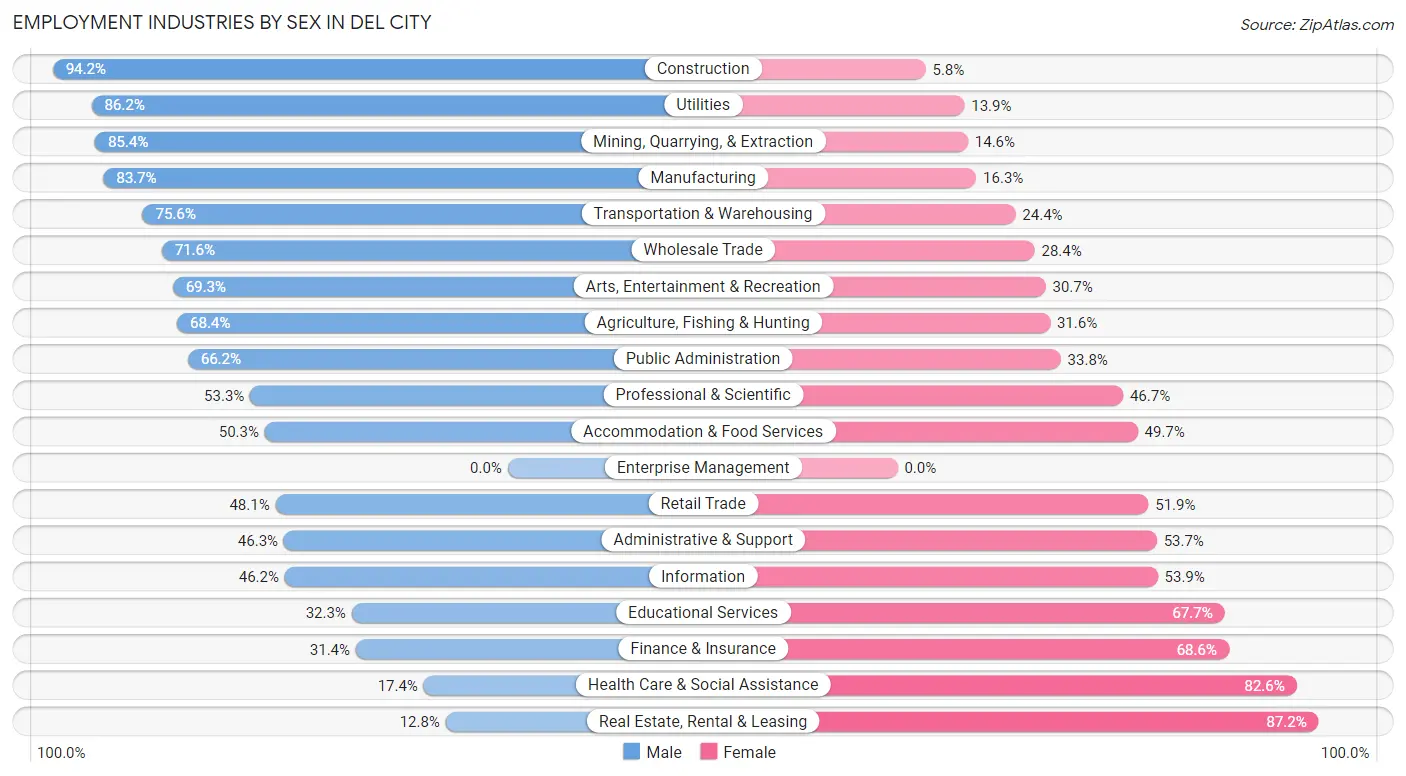
| Industry | Male | Female |
| Agriculture, Fishing & Hunting | 13 (68.4%) | 6 (31.6%) |
| Mining, Quarrying, & Extraction | 82 (85.4%) | 14 (14.6%) |
| Construction | 518 (94.2%) | 32 (5.8%) |
| Manufacturing | 611 (83.7%) | 119 (16.3%) |
| Wholesale Trade | 111 (71.6%) | 44 (28.4%) |
| Retail Trade | 722 (48.1%) | 780 (51.9%) |
| Transportation & Warehousing | 520 (75.6%) | 168 (24.4%) |
| Utilities | 56 (86.2%) | 9 (13.9%) |
| Information | 66 (46.2%) | 77 (53.8%) |
| Finance & Insurance | 110 (31.4%) | 240 (68.6%) |
| Real Estate, Rental & Leasing | 19 (12.8%) | 129 (87.2%) |
| Professional & Scientific | 161 (53.3%) | 141 (46.7%) |
| Enterprise Management | 0 (0.0%) | 0 (0.0%) |
| Administrative & Support | 278 (46.3%) | 322 (53.7%) |
| Educational Services | 229 (32.3%) | 480 (67.7%) |
| Health Care & Social Assistance | 189 (17.4%) | 898 (82.6%) |
| Arts, Entertainment & Recreation | 95 (69.3%) | 42 (30.7%) |
| Accommodation & Food Services | 354 (50.3%) | 350 (49.7%) |
| Public Administration | 576 (66.2%) | 294 (33.8%) |
| Total | 4,992 (53.2%) | 4,387 (46.8%) |
Education in Del City
School Enrollment in Del City
The most common levels of schooling among the 4,595 students in Del City are elementary school (1,155 | 25.1%), middle school (998 | 21.7%), and high school (865 | 18.8%).
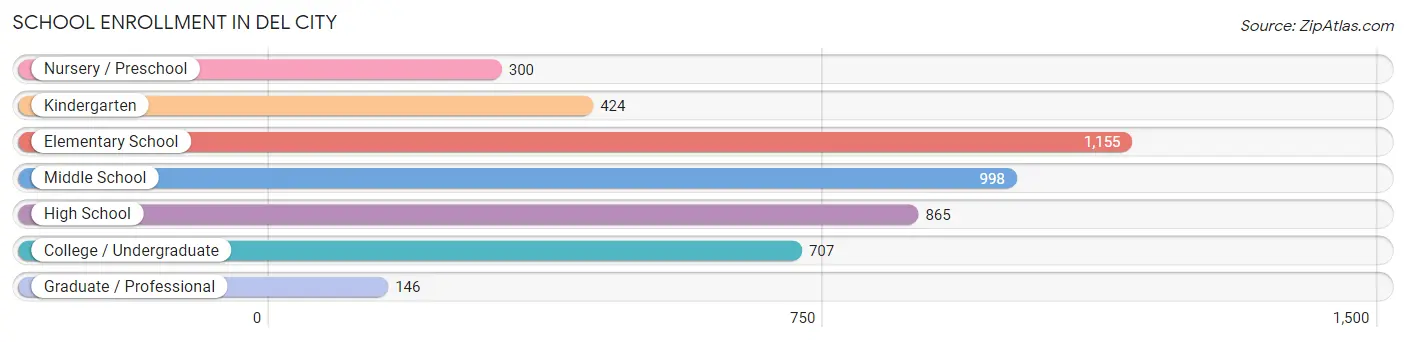
| School Level | # Students | % Students |
| Nursery / Preschool | 300 | 6.5% |
| Kindergarten | 424 | 9.2% |
| Elementary School | 1,155 | 25.1% |
| Middle School | 998 | 21.7% |
| High School | 865 | 18.8% |
| College / Undergraduate | 707 | 15.4% |
| Graduate / Professional | 146 | 3.2% |
| Total | 4,595 | 100.0% |
School Enrollment by Age by Funding Source in Del City
Out of a total of 4,595 students who are enrolled in schools in Del City, 726 (15.8%) attend a private institution, while the remaining 3,869 (84.2%) are enrolled in public schools. The age group of 35 years and over has the highest likelihood of being enrolled in private schools, with 112 (65.9% in the age bracket) enrolled. Conversely, the age group of 3 to 4 year olds has the lowest likelihood of being enrolled in a private school, with 177 (98.3% in the age bracket) attending a public institution.
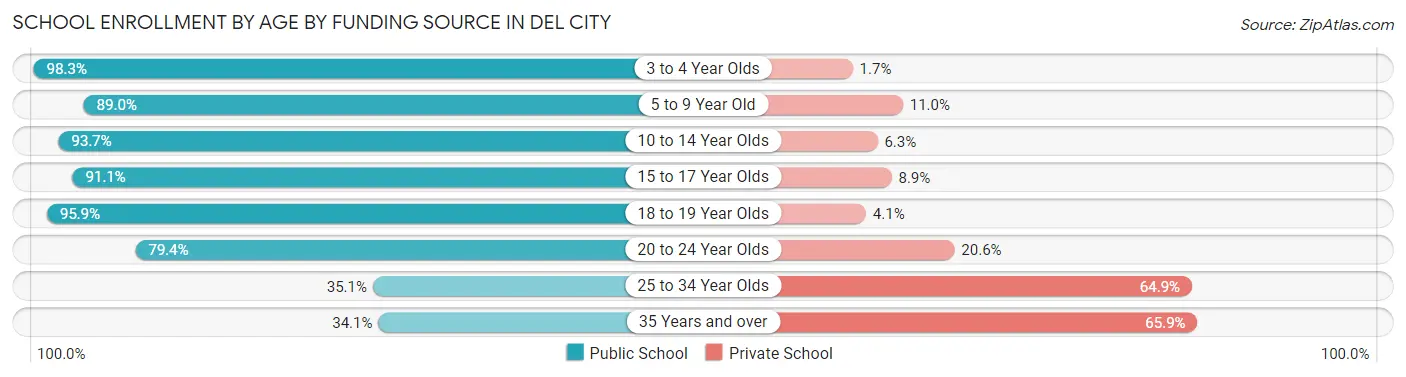
| Age Bracket | Public School | Private School |
| 3 to 4 Year Olds | 177 (98.3%) | 3 (1.7%) |
| 5 to 9 Year Old | 1,342 (89.0%) | 166 (11.0%) |
| 10 to 14 Year Olds | 1,204 (93.7%) | 81 (6.3%) |
| 15 to 17 Year Olds | 613 (91.1%) | 60 (8.9%) |
| 18 to 19 Year Olds | 162 (95.9%) | 7 (4.1%) |
| 20 to 24 Year Olds | 177 (79.4%) | 46 (20.6%) |
| 25 to 34 Year Olds | 136 (35.1%) | 251 (64.9%) |
| 35 Years and over | 58 (34.1%) | 112 (65.9%) |
| Total | 3,869 (84.2%) | 726 (15.8%) |
Educational Attainment by Field of Study in Del City
Business (486 | 21.3%), education (369 | 16.2%), arts & humanities (232 | 10.2%), visual & performing arts (193 | 8.5%), and social sciences (154 | 6.8%) are the most common fields of study among 2,283 individuals in Del City who have obtained a bachelor's degree or higher.
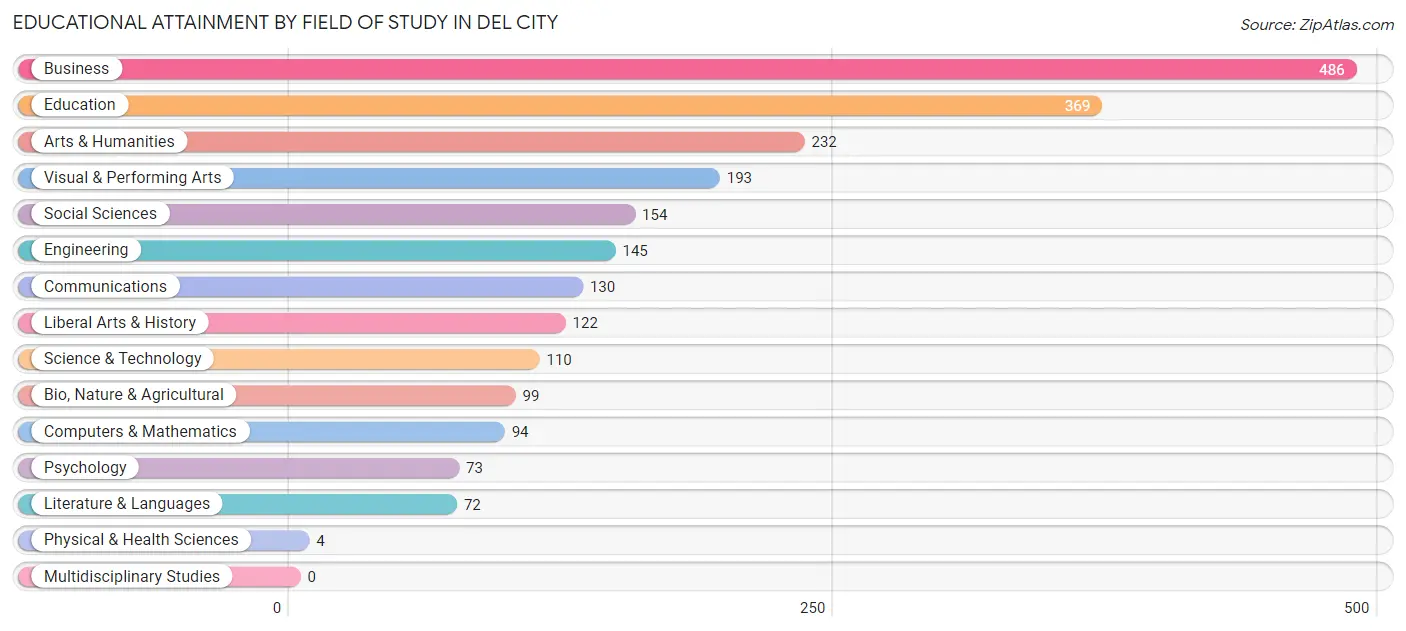
| Field of Study | # Graduates | % Graduates |
| Computers & Mathematics | 94 | 4.1% |
| Bio, Nature & Agricultural | 99 | 4.3% |
| Physical & Health Sciences | 4 | 0.2% |
| Psychology | 73 | 3.2% |
| Social Sciences | 154 | 6.8% |
| Engineering | 145 | 6.4% |
| Multidisciplinary Studies | 0 | 0.0% |
| Science & Technology | 110 | 4.8% |
| Business | 486 | 21.3% |
| Education | 369 | 16.2% |
| Literature & Languages | 72 | 3.2% |
| Liberal Arts & History | 122 | 5.3% |
| Visual & Performing Arts | 193 | 8.5% |
| Communications | 130 | 5.7% |
| Arts & Humanities | 232 | 10.2% |
| Total | 2,283 | 100.0% |
Transportation & Commute in Del City
Vehicle Availability by Sex in Del City
The most prevalent vehicle ownership categories in Del City are males with 2 vehicles (2,166, accounting for 41.8%) and females with 2 vehicles (1,340, making up 51.3%).
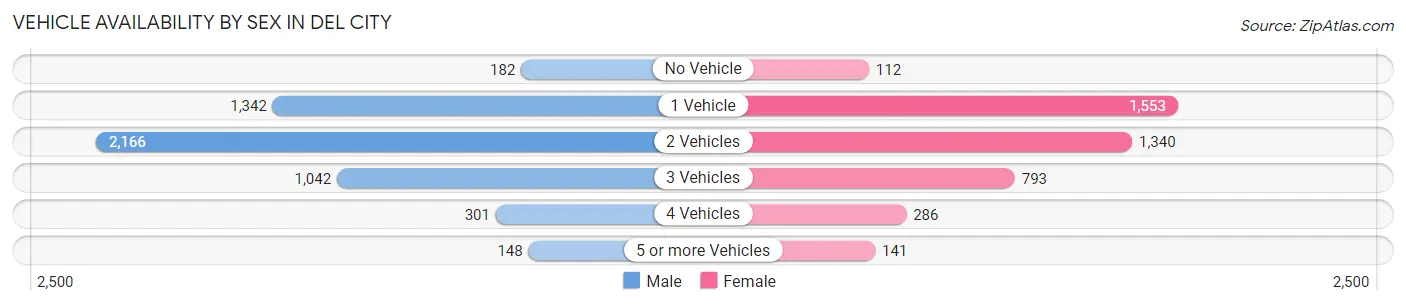
| Vehicles Available | Male | Female |
| No Vehicle | 182 (3.5%) | 112 (2.6%) |
| 1 Vehicle | 1,342 (25.9%) | 1,553 (36.8%) |
| 2 Vehicles | 2,166 (41.8%) | 1,340 (31.7%) |
| 3 Vehicles | 1,042 (20.1%) | 793 (18.8%) |
| 4 Vehicles | 301 (5.8%) | 286 (6.8%) |
| 5 or more Vehicles | 148 (2.9%) | 141 (3.3%) |
| Total | 5,181 (100.0%) | 4,225 (100.0%) |
Commute Time in Del City
The most frequently occuring commute durations in Del City are 15 to 19 minutes (1,865 commuters, 21.0%), 20 to 24 minutes (1,729 commuters, 19.5%), and 10 to 14 minutes (1,402 commuters, 15.8%).
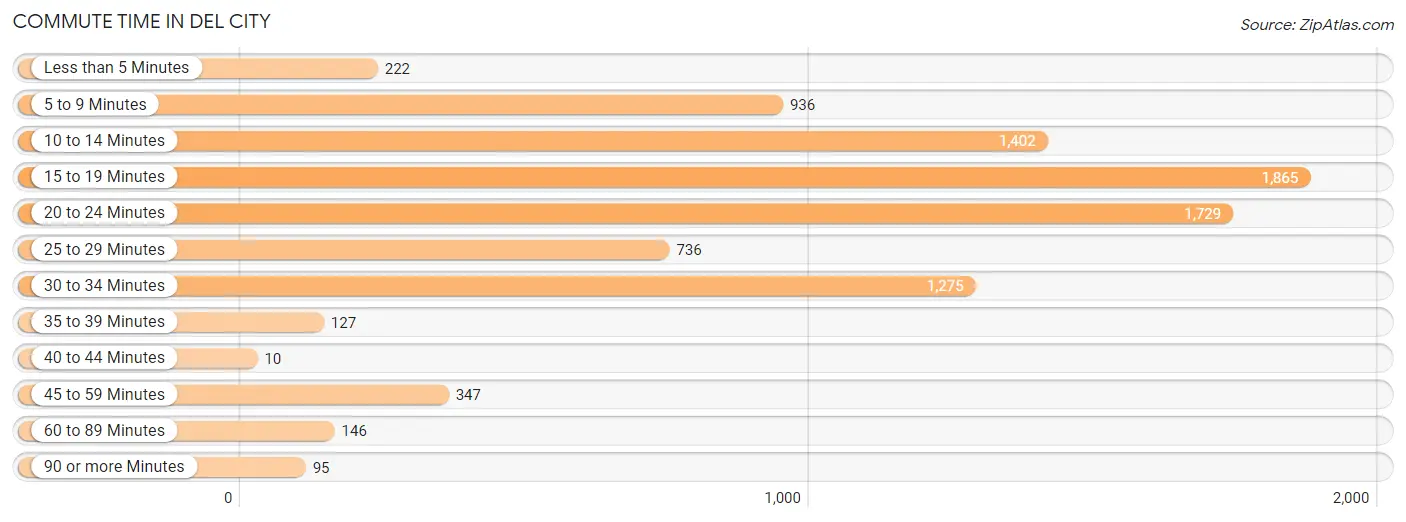
| Commute Time | # Commuters | % Commuters |
| Less than 5 Minutes | 222 | 2.5% |
| 5 to 9 Minutes | 936 | 10.5% |
| 10 to 14 Minutes | 1,402 | 15.8% |
| 15 to 19 Minutes | 1,865 | 21.0% |
| 20 to 24 Minutes | 1,729 | 19.5% |
| 25 to 29 Minutes | 736 | 8.3% |
| 30 to 34 Minutes | 1,275 | 14.3% |
| 35 to 39 Minutes | 127 | 1.4% |
| 40 to 44 Minutes | 10 | 0.1% |
| 45 to 59 Minutes | 347 | 3.9% |
| 60 to 89 Minutes | 146 | 1.6% |
| 90 or more Minutes | 95 | 1.1% |
Commute Time by Sex in Del City
The most common commute times in Del City are 20 to 24 minutes (1,099 commuters, 22.5%) for males and 15 to 19 minutes (930 commuters, 23.2%) for females.
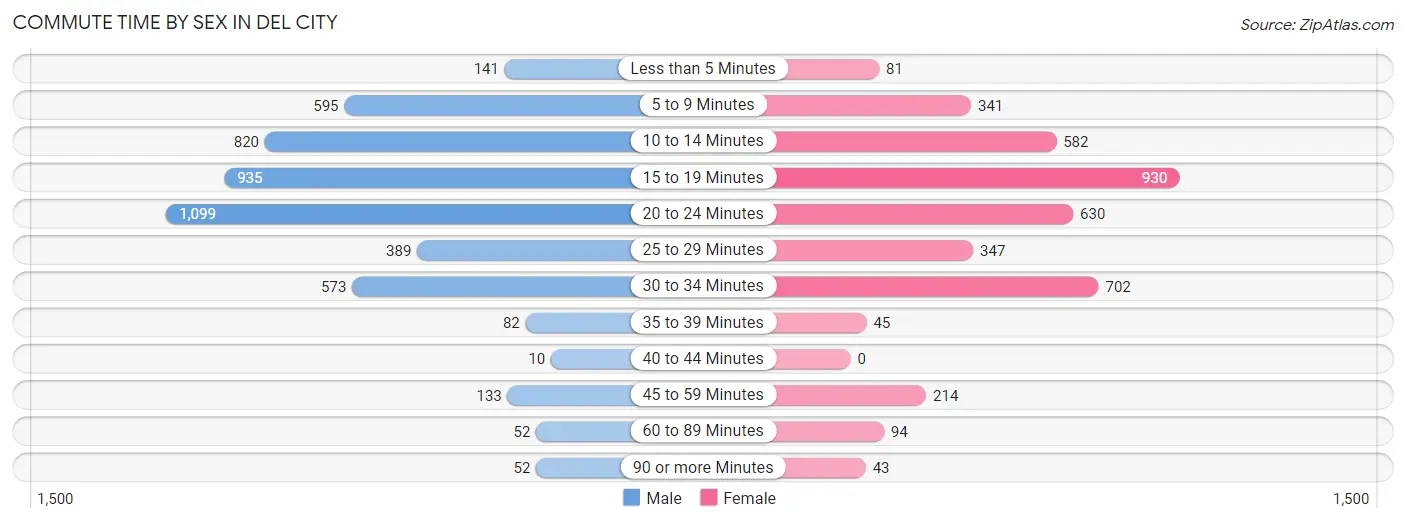
| Commute Time | Male | Female |
| Less than 5 Minutes | 141 (2.9%) | 81 (2.0%) |
| 5 to 9 Minutes | 595 (12.2%) | 341 (8.5%) |
| 10 to 14 Minutes | 820 (16.8%) | 582 (14.5%) |
| 15 to 19 Minutes | 935 (19.2%) | 930 (23.2%) |
| 20 to 24 Minutes | 1,099 (22.5%) | 630 (15.7%) |
| 25 to 29 Minutes | 389 (8.0%) | 347 (8.7%) |
| 30 to 34 Minutes | 573 (11.7%) | 702 (17.5%) |
| 35 to 39 Minutes | 82 (1.7%) | 45 (1.1%) |
| 40 to 44 Minutes | 10 (0.2%) | 0 (0.0%) |
| 45 to 59 Minutes | 133 (2.7%) | 214 (5.3%) |
| 60 to 89 Minutes | 52 (1.1%) | 94 (2.3%) |
| 90 or more Minutes | 52 (1.1%) | 43 (1.1%) |
Time of Departure to Work by Sex in Del City
The most frequent times of departure to work in Del City are 7:30 AM to 7:59 AM (632, 13.0%) for males and 7:00 AM to 7:29 AM (775, 19.3%) for females.
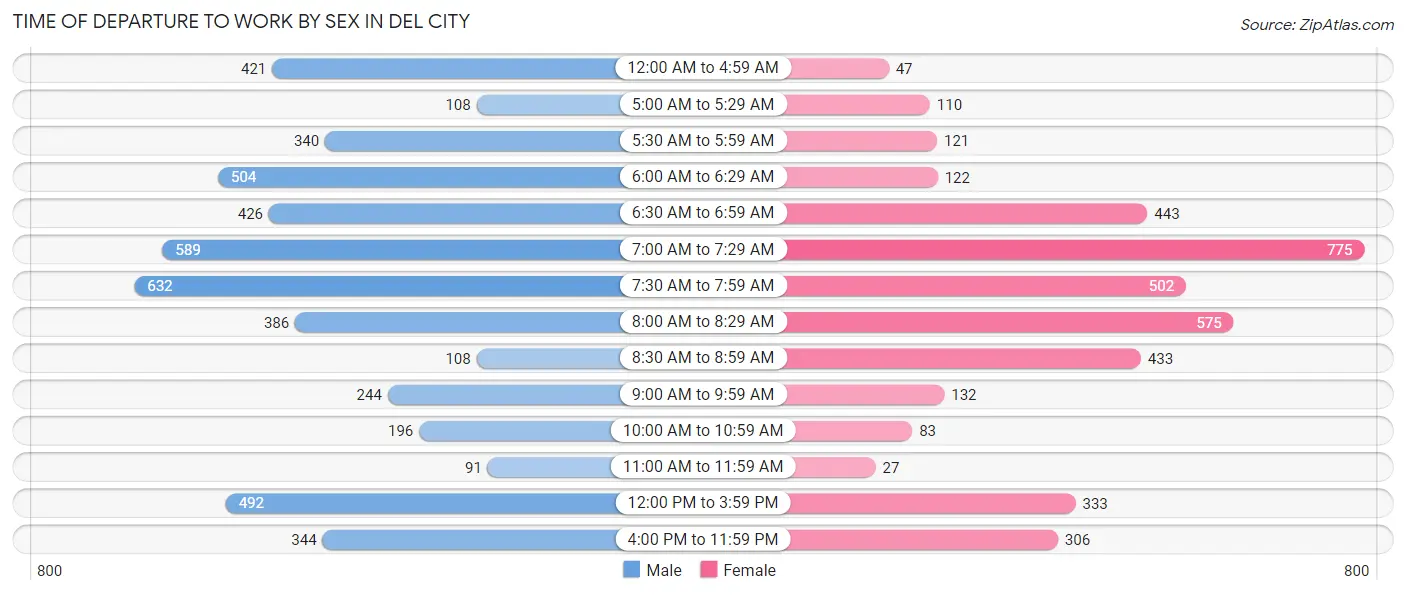
| Time of Departure | Male | Female |
| 12:00 AM to 4:59 AM | 421 (8.6%) | 47 (1.2%) |
| 5:00 AM to 5:29 AM | 108 (2.2%) | 110 (2.7%) |
| 5:30 AM to 5:59 AM | 340 (7.0%) | 121 (3.0%) |
| 6:00 AM to 6:29 AM | 504 (10.3%) | 122 (3.0%) |
| 6:30 AM to 6:59 AM | 426 (8.7%) | 443 (11.1%) |
| 7:00 AM to 7:29 AM | 589 (12.1%) | 775 (19.3%) |
| 7:30 AM to 7:59 AM | 632 (13.0%) | 502 (12.5%) |
| 8:00 AM to 8:29 AM | 386 (7.9%) | 575 (14.3%) |
| 8:30 AM to 8:59 AM | 108 (2.2%) | 433 (10.8%) |
| 9:00 AM to 9:59 AM | 244 (5.0%) | 132 (3.3%) |
| 10:00 AM to 10:59 AM | 196 (4.0%) | 83 (2.1%) |
| 11:00 AM to 11:59 AM | 91 (1.9%) | 27 (0.7%) |
| 12:00 PM to 3:59 PM | 492 (10.1%) | 333 (8.3%) |
| 4:00 PM to 11:59 PM | 344 (7.0%) | 306 (7.6%) |
| Total | 4,881 (100.0%) | 4,009 (100.0%) |
Housing Occupancy in Del City
Occupancy by Ownership in Del City
Of the total 8,772 dwellings in Del City, owner-occupied units account for 4,995 (56.9%), while renter-occupied units make up 3,777 (43.1%).
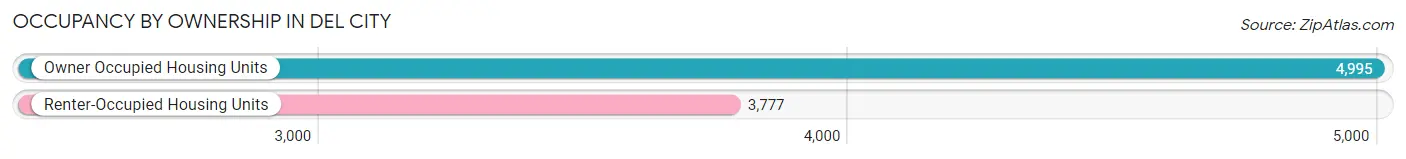
| Occupancy | # Housing Units | % Housing Units |
| Owner Occupied Housing Units | 4,995 | 56.9% |
| Renter-Occupied Housing Units | 3,777 | 43.1% |
| Total Occupied Housing Units | 8,772 | 100.0% |
Occupancy by Household Size in Del City
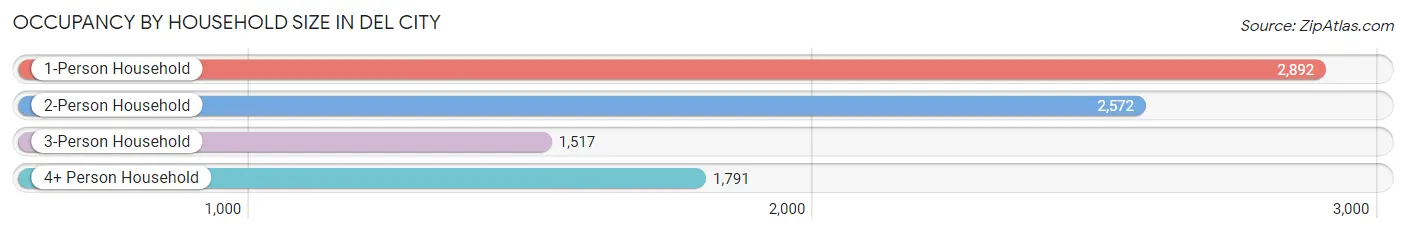
| Household Size | # Housing Units | % Housing Units |
| 1-Person Household | 2,892 | 33.0% |
| 2-Person Household | 2,572 | 29.3% |
| 3-Person Household | 1,517 | 17.3% |
| 4+ Person Household | 1,791 | 20.4% |
| Total Housing Units | 8,772 | 100.0% |
Occupancy by Ownership by Household Size in Del City
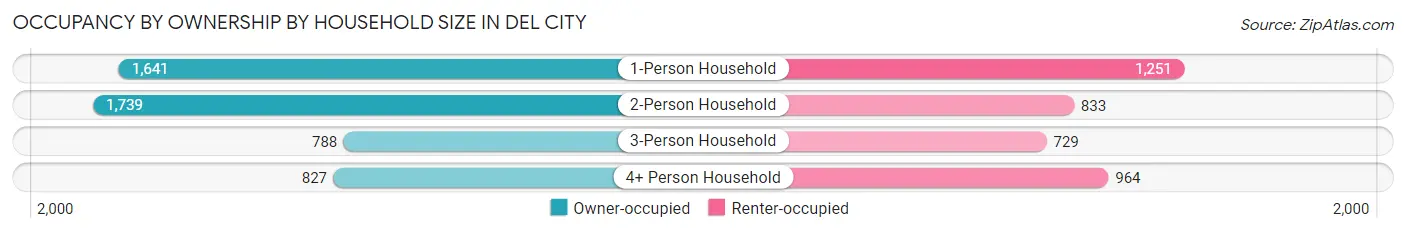
| Household Size | Owner-occupied | Renter-occupied |
| 1-Person Household | 1,641 (56.7%) | 1,251 (43.3%) |
| 2-Person Household | 1,739 (67.6%) | 833 (32.4%) |
| 3-Person Household | 788 (51.9%) | 729 (48.1%) |
| 4+ Person Household | 827 (46.2%) | 964 (53.8%) |
| Total Housing Units | 4,995 (56.9%) | 3,777 (43.1%) |
Occupancy by Educational Attainment in Del City
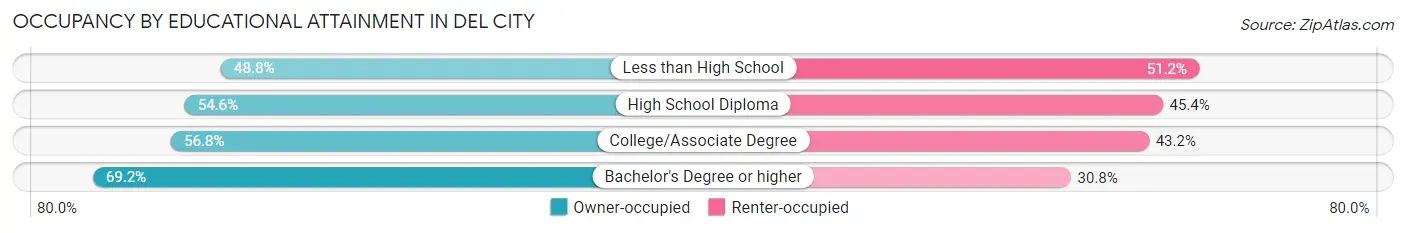
| Household Size | Owner-occupied | Renter-occupied |
| Less than High School | 414 (48.8%) | 434 (51.2%) |
| High School Diploma | 1,777 (54.6%) | 1,479 (45.4%) |
| College/Associate Degree | 1,945 (56.8%) | 1,481 (43.2%) |
| Bachelor's Degree or higher | 859 (69.2%) | 383 (30.8%) |
Occupancy by Age of Householder in Del City
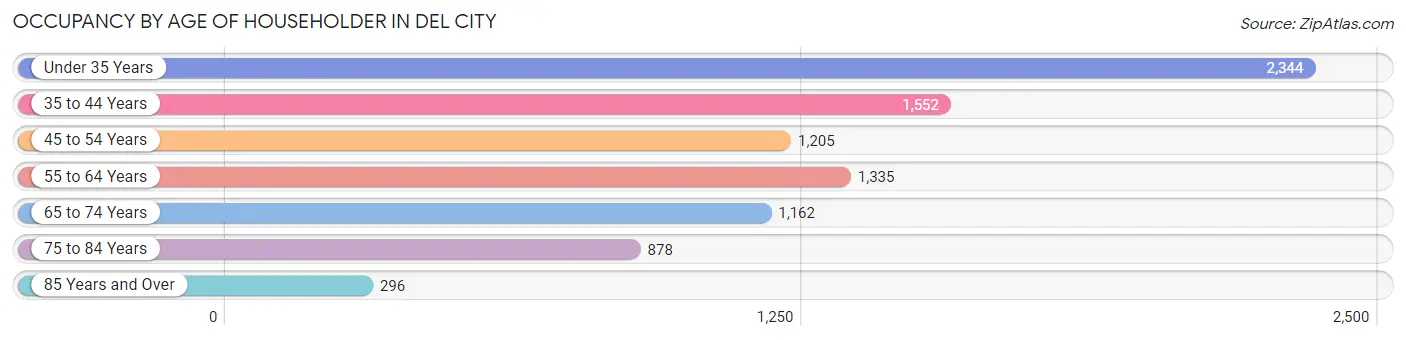
| Age Bracket | # Households | % Households |
| Under 35 Years | 2,344 | 26.7% |
| 35 to 44 Years | 1,552 | 17.7% |
| 45 to 54 Years | 1,205 | 13.7% |
| 55 to 64 Years | 1,335 | 15.2% |
| 65 to 74 Years | 1,162 | 13.3% |
| 75 to 84 Years | 878 | 10.0% |
| 85 Years and Over | 296 | 3.4% |
| Total | 8,772 | 100.0% |
Housing Finances in Del City
Median Income by Occupancy in Del City
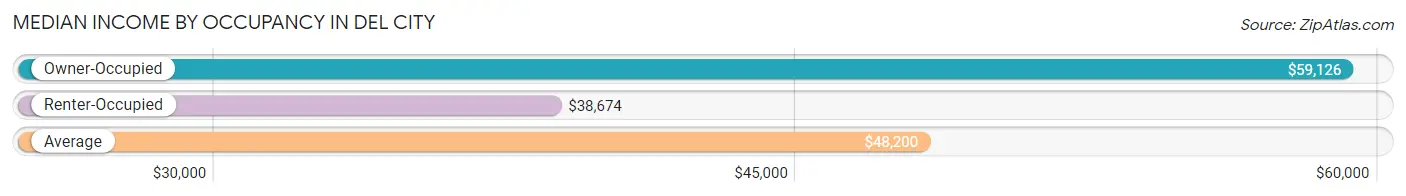
| Occupancy Type | # Households | Median Income |
| Owner-Occupied | 4,995 (56.9%) | $59,126 |
| Renter-Occupied | 3,777 (43.1%) | $38,674 |
| Average | 8,772 (100.0%) | $48,200 |
Occupancy by Householder Income Bracket in Del City
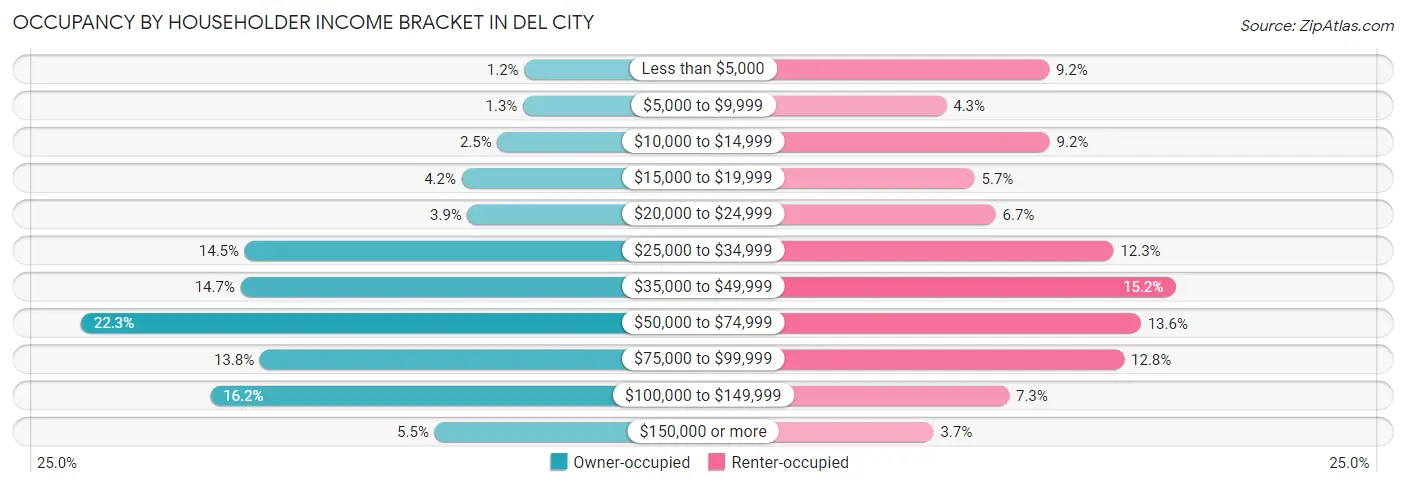
| Income Bracket | Owner-occupied | Renter-occupied |
| Less than $5,000 | 60 (1.2%) | 348 (9.2%) |
| $5,000 to $9,999 | 63 (1.3%) | 163 (4.3%) |
| $10,000 to $14,999 | 124 (2.5%) | 349 (9.2%) |
| $15,000 to $19,999 | 209 (4.2%) | 214 (5.7%) |
| $20,000 to $24,999 | 195 (3.9%) | 252 (6.7%) |
| $25,000 to $34,999 | 725 (14.5%) | 464 (12.3%) |
| $35,000 to $49,999 | 735 (14.7%) | 575 (15.2%) |
| $50,000 to $74,999 | 1,115 (22.3%) | 513 (13.6%) |
| $75,000 to $99,999 | 689 (13.8%) | 483 (12.8%) |
| $100,000 to $149,999 | 807 (16.2%) | 276 (7.3%) |
| $150,000 or more | 273 (5.5%) | 140 (3.7%) |
| Total | 4,995 (100.0%) | 3,777 (100.0%) |
Monthly Housing Cost Tiers in Del City
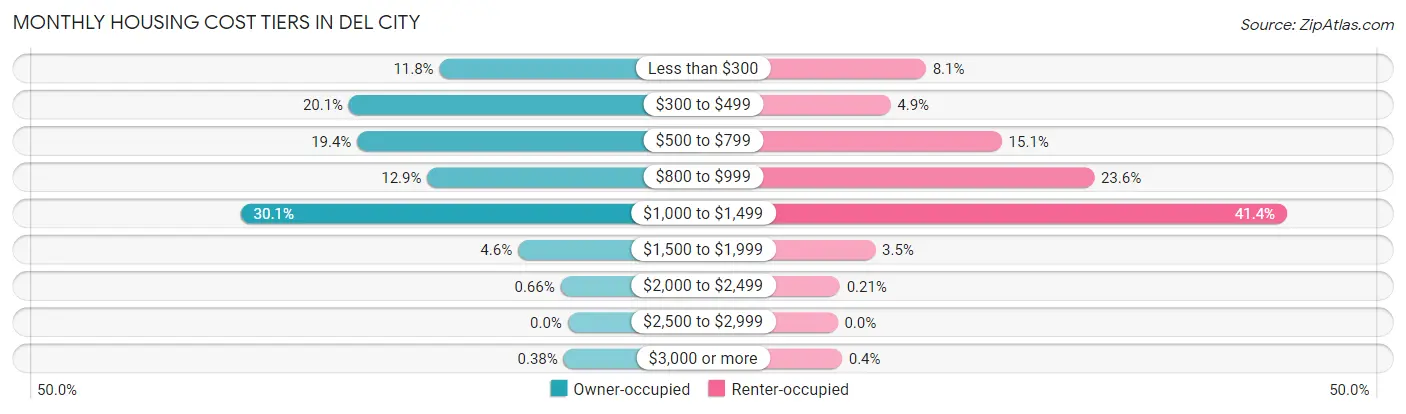
| Monthly Cost | Owner-occupied | Renter-occupied |
| Less than $300 | 590 (11.8%) | 307 (8.1%) |
| $300 to $499 | 1,006 (20.1%) | 184 (4.9%) |
| $500 to $799 | 968 (19.4%) | 571 (15.1%) |
| $800 to $999 | 646 (12.9%) | 892 (23.6%) |
| $1,000 to $1,499 | 1,504 (30.1%) | 1,563 (41.4%) |
| $1,500 to $1,999 | 229 (4.6%) | 131 (3.5%) |
| $2,000 to $2,499 | 33 (0.7%) | 8 (0.2%) |
| $2,500 to $2,999 | 0 (0.0%) | 0 (0.0%) |
| $3,000 or more | 19 (0.4%) | 15 (0.4%) |
| Total | 4,995 (100.0%) | 3,777 (100.0%) |
Physical Housing Characteristics in Del City
Housing Structures in Del City
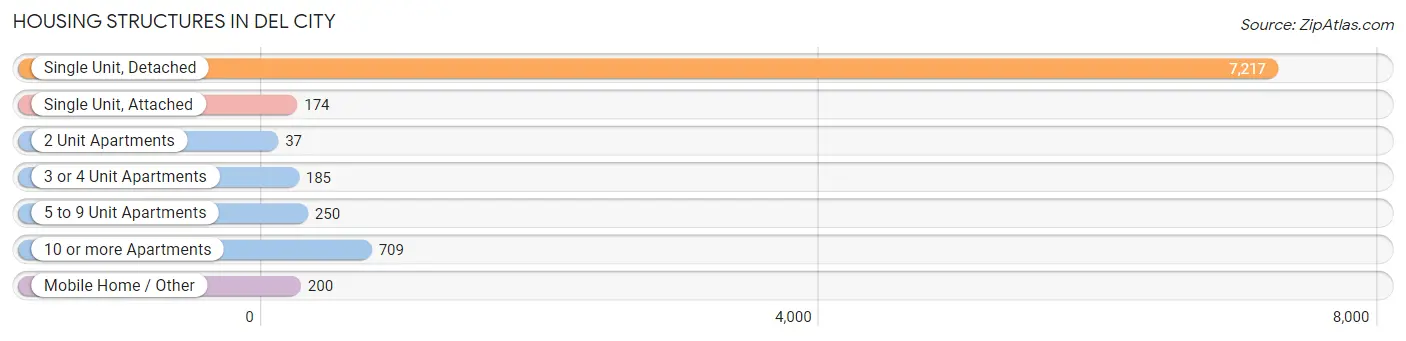
| Structure Type | # Housing Units | % Housing Units |
| Single Unit, Detached | 7,217 | 82.3% |
| Single Unit, Attached | 174 | 2.0% |
| 2 Unit Apartments | 37 | 0.4% |
| 3 or 4 Unit Apartments | 185 | 2.1% |
| 5 to 9 Unit Apartments | 250 | 2.9% |
| 10 or more Apartments | 709 | 8.1% |
| Mobile Home / Other | 200 | 2.3% |
| Total | 8,772 | 100.0% |
Housing Structures by Occupancy in Del City
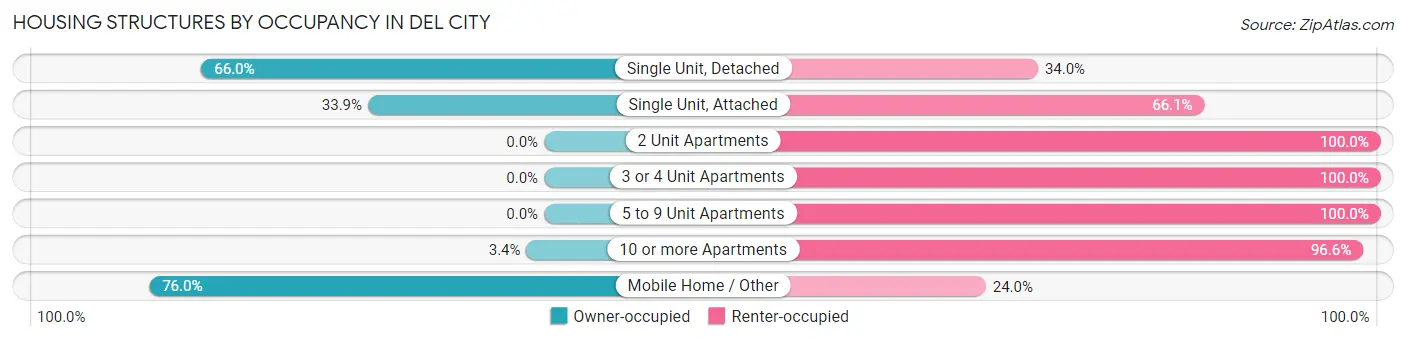
| Structure Type | Owner-occupied | Renter-occupied |
| Single Unit, Detached | 4,760 (66.0%) | 2,457 (34.0%) |
| Single Unit, Attached | 59 (33.9%) | 115 (66.1%) |
| 2 Unit Apartments | 0 (0.0%) | 37 (100.0%) |
| 3 or 4 Unit Apartments | 0 (0.0%) | 185 (100.0%) |
| 5 to 9 Unit Apartments | 0 (0.0%) | 250 (100.0%) |
| 10 or more Apartments | 24 (3.4%) | 685 (96.6%) |
| Mobile Home / Other | 152 (76.0%) | 48 (24.0%) |
| Total | 4,995 (56.9%) | 3,777 (43.1%) |
Housing Structures by Number of Rooms in Del City
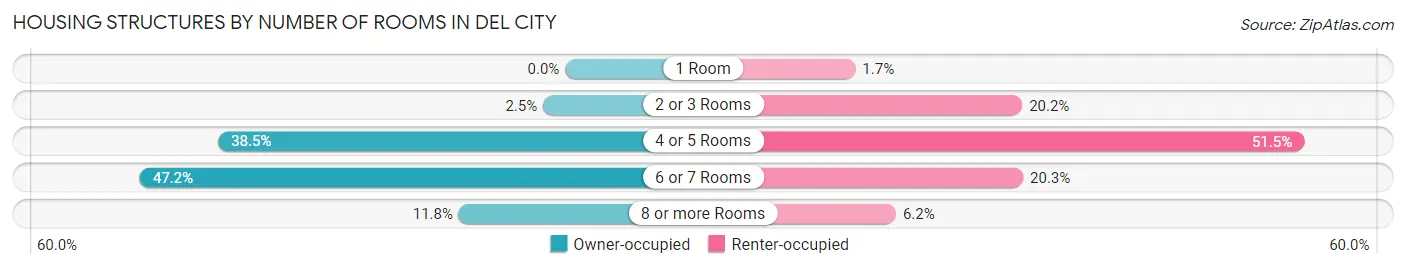
| Number of Rooms | Owner-occupied | Renter-occupied |
| 1 Room | 0 (0.0%) | 65 (1.7%) |
| 2 or 3 Rooms | 123 (2.5%) | 764 (20.2%) |
| 4 or 5 Rooms | 1,924 (38.5%) | 1,945 (51.5%) |
| 6 or 7 Rooms | 2,358 (47.2%) | 768 (20.3%) |
| 8 or more Rooms | 590 (11.8%) | 235 (6.2%) |
| Total | 4,995 (100.0%) | 3,777 (100.0%) |
Housing Structure by Heating Type in Del City
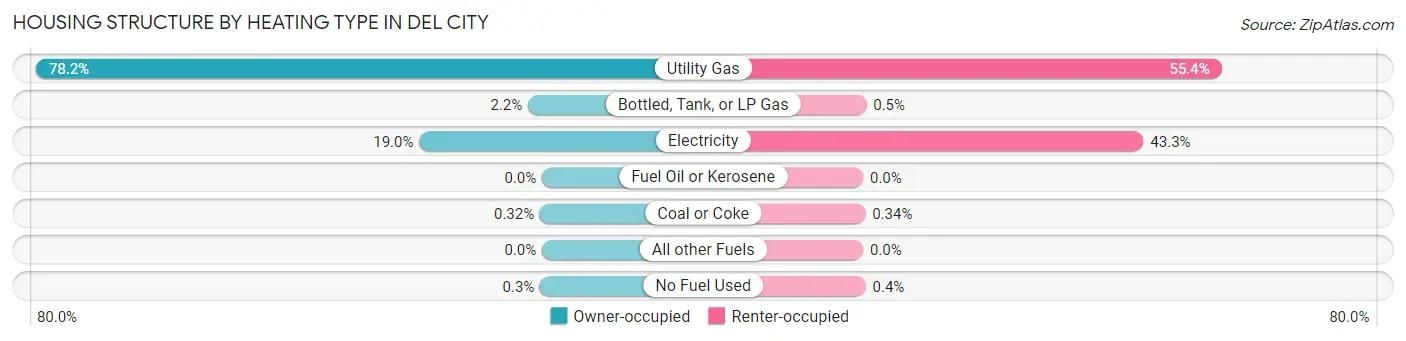
| Heating Type | Owner-occupied | Renter-occupied |
| Utility Gas | 3,908 (78.2%) | 2,093 (55.4%) |
| Bottled, Tank, or LP Gas | 108 (2.2%) | 19 (0.5%) |
| Electricity | 948 (19.0%) | 1,637 (43.3%) |
| Fuel Oil or Kerosene | 0 (0.0%) | 0 (0.0%) |
| Coal or Coke | 16 (0.3%) | 13 (0.3%) |
| All other Fuels | 0 (0.0%) | 0 (0.0%) |
| No Fuel Used | 15 (0.3%) | 15 (0.4%) |
| Total | 4,995 (100.0%) | 3,777 (100.0%) |
Household Vehicle Usage in Del City
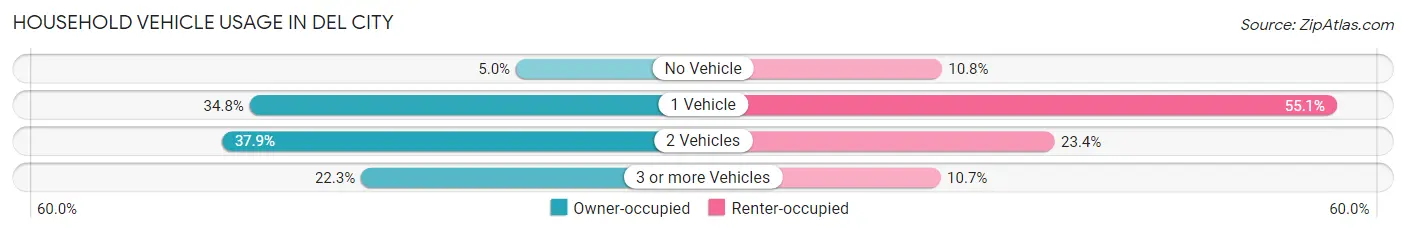
| Vehicles per Household | Owner-occupied | Renter-occupied |
| No Vehicle | 248 (5.0%) | 408 (10.8%) |
| 1 Vehicle | 1,738 (34.8%) | 2,081 (55.1%) |
| 2 Vehicles | 1,894 (37.9%) | 885 (23.4%) |
| 3 or more Vehicles | 1,115 (22.3%) | 403 (10.7%) |
| Total | 4,995 (100.0%) | 3,777 (100.0%) |
Real Estate & Mortgages in Del City
Real Estate and Mortgage Overview in Del City
| Characteristic | Without Mortgage | With Mortgage |
| Housing Units | 2,195 | 2,800 |
| Median Property Value | $98,500 | $108,600 |
| Median Household Income | $41,555 | $171 |
| Monthly Housing Costs | $421 | $14 |
| Real Estate Taxes | $903 | $284 |
Property Value by Mortgage Status in Del City
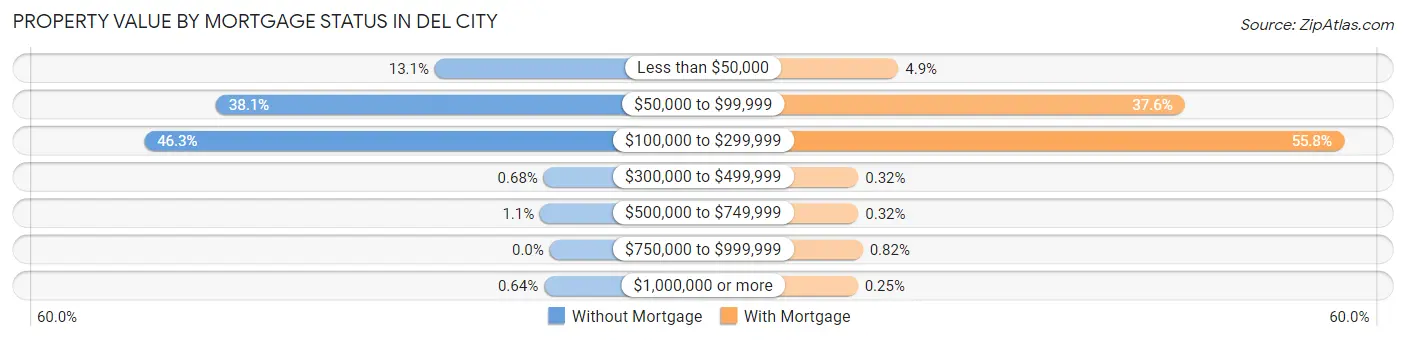
| Property Value | Without Mortgage | With Mortgage |
| Less than $50,000 | 288 (13.1%) | 137 (4.9%) |
| $50,000 to $99,999 | 837 (38.1%) | 1,053 (37.6%) |
| $100,000 to $299,999 | 1,017 (46.3%) | 1,562 (55.8%) |
| $300,000 to $499,999 | 15 (0.7%) | 9 (0.3%) |
| $500,000 to $749,999 | 24 (1.1%) | 9 (0.3%) |
| $750,000 to $999,999 | 0 (0.0%) | 23 (0.8%) |
| $1,000,000 or more | 14 (0.6%) | 7 (0.3%) |
| Total | 2,195 (100.0%) | 2,800 (100.0%) |
Household Income by Mortgage Status in Del City
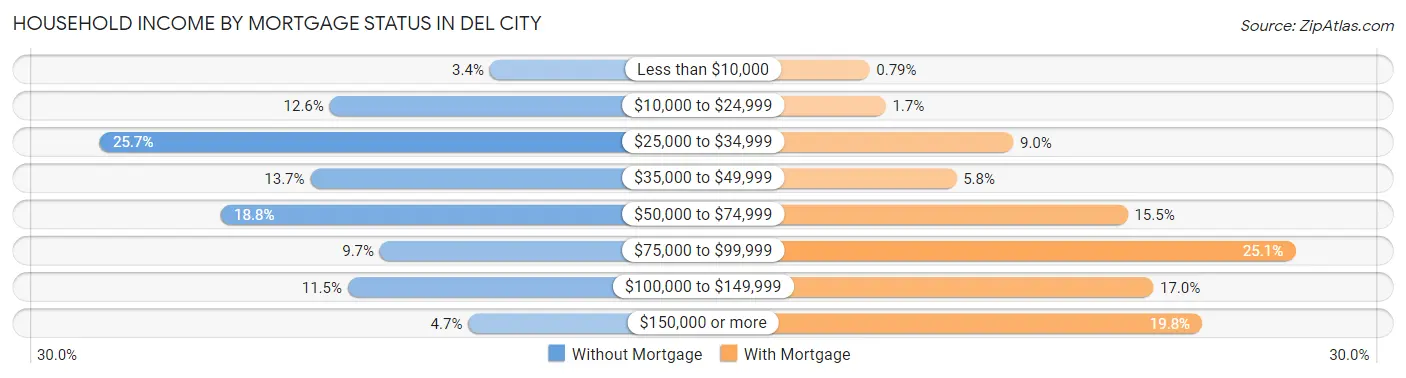
| Household Income | Without Mortgage | With Mortgage |
| Less than $10,000 | 75 (3.4%) | 22 (0.8%) |
| $10,000 to $24,999 | 276 (12.6%) | 48 (1.7%) |
| $25,000 to $34,999 | 564 (25.7%) | 252 (9.0%) |
| $35,000 to $49,999 | 300 (13.7%) | 161 (5.8%) |
| $50,000 to $74,999 | 412 (18.8%) | 435 (15.5%) |
| $75,000 to $99,999 | 213 (9.7%) | 703 (25.1%) |
| $100,000 to $149,999 | 253 (11.5%) | 476 (17.0%) |
| $150,000 or more | 102 (4.6%) | 554 (19.8%) |
| Total | 2,195 (100.0%) | 2,800 (100.0%) |
Property Value to Household Income Ratio in Del City
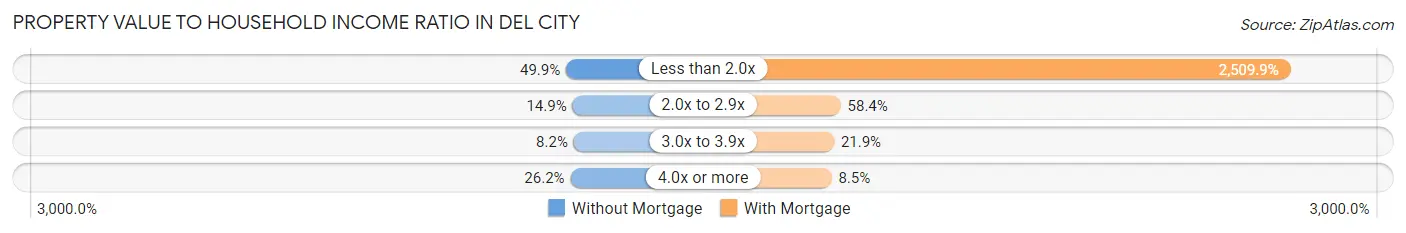
| Value-to-Income Ratio | Without Mortgage | With Mortgage |
| Less than 2.0x | 1,096 (49.9%) | 70,278 (2,509.9%) |
| 2.0x to 2.9x | 328 (14.9%) | 1,634 (58.4%) |
| 3.0x to 3.9x | 179 (8.2%) | 613 (21.9%) |
| 4.0x or more | 576 (26.2%) | 239 (8.5%) |
| Total | 2,195 (100.0%) | 2,800 (100.0%) |
Real Estate Taxes by Mortgage Status in Del City

| Property Taxes | Without Mortgage | With Mortgage |
| Less than $800 | 854 (38.9%) | 0 (0.0%) |
| $800 to $1,499 | 749 (34.1%) | 473 (16.9%) |
| $800 to $1,499 | 491 (22.4%) | 1,289 (46.0%) |
| Total | 2,195 (100.0%) | 2,800 (100.0%) |
Health & Disability in Del City
Health Insurance Coverage by Age in Del City
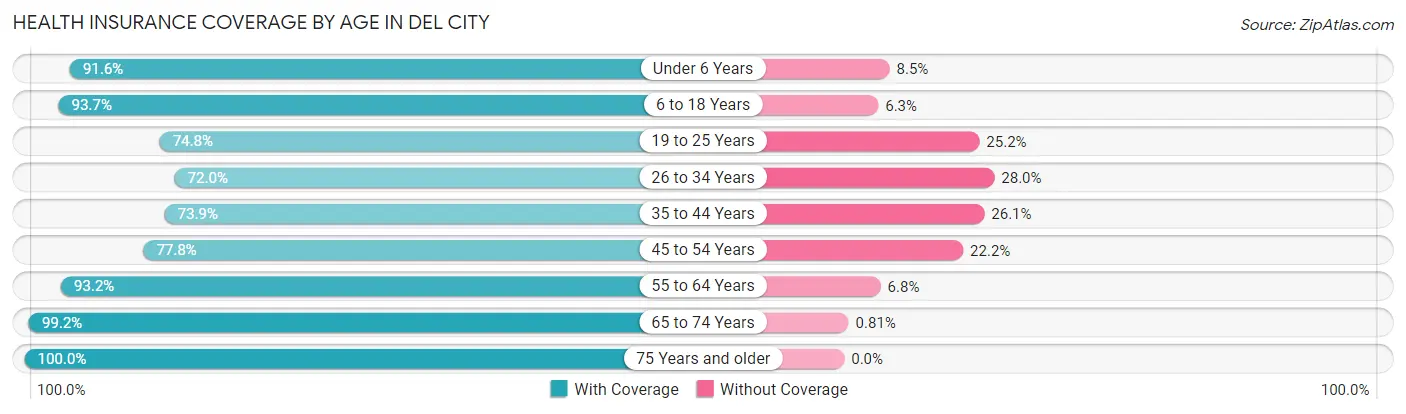
| Age Bracket | With Coverage | Without Coverage |
| Under 6 Years | 2,188 (91.5%) | 202 (8.5%) |
| 6 to 18 Years | 3,147 (93.7%) | 213 (6.3%) |
| 19 to 25 Years | 1,511 (74.8%) | 509 (25.2%) |
| 26 to 34 Years | 2,153 (72.0%) | 837 (28.0%) |
| 35 to 44 Years | 2,025 (73.9%) | 716 (26.1%) |
| 45 to 54 Years | 1,664 (77.8%) | 474 (22.2%) |
| 55 to 64 Years | 2,255 (93.2%) | 164 (6.8%) |
| 65 to 74 Years | 1,846 (99.2%) | 15 (0.8%) |
| 75 Years and older | 1,420 (100.0%) | 0 (0.0%) |
| Total | 18,209 (85.3%) | 3,130 (14.7%) |
Health Insurance Coverage by Citizenship Status in Del City

| Citizenship Status | With Coverage | Without Coverage |
| Native Born | 2,188 (91.5%) | 202 (8.5%) |
| Foreign Born, Citizen | 3,147 (93.7%) | 213 (6.3%) |
| Foreign Born, not a Citizen | 1,511 (74.8%) | 509 (25.2%) |
Health Insurance Coverage by Household Income in Del City
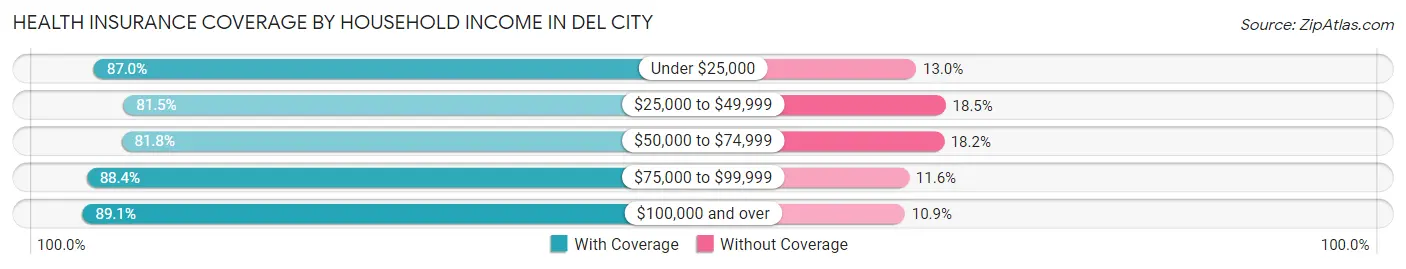
| Household Income | With Coverage | Without Coverage |
| Under $25,000 | 3,392 (87.0%) | 506 (13.0%) |
| $25,000 to $49,999 | 4,156 (81.5%) | 944 (18.5%) |
| $50,000 to $74,999 | 3,460 (81.8%) | 768 (18.2%) |
| $75,000 to $99,999 | 3,187 (88.4%) | 420 (11.6%) |
| $100,000 and over | 4,000 (89.1%) | 488 (10.9%) |
Public vs Private Health Insurance Coverage by Age in Del City
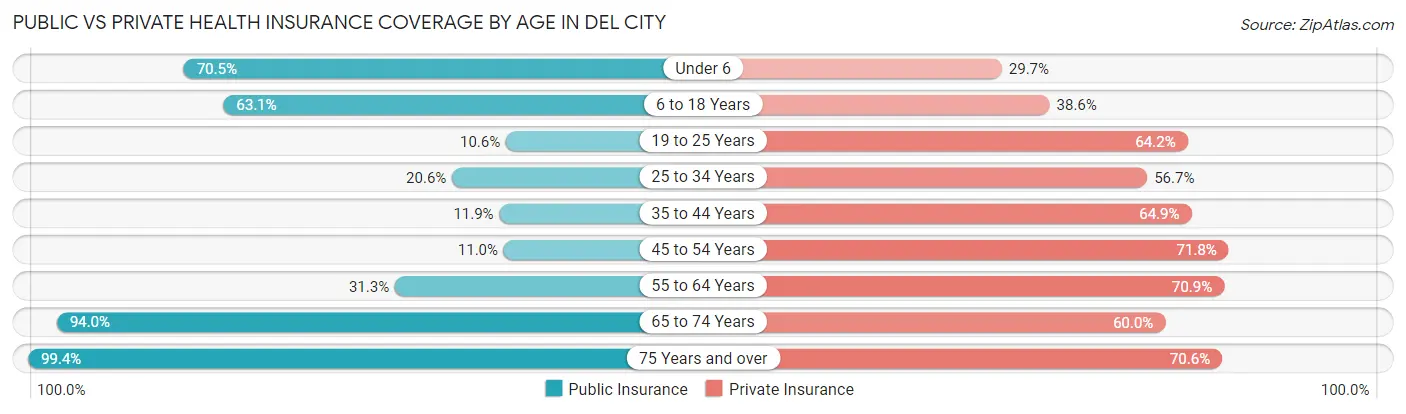
| Age Bracket | Public Insurance | Private Insurance |
| Under 6 | 1,684 (70.5%) | 710 (29.7%) |
| 6 to 18 Years | 2,120 (63.1%) | 1,296 (38.6%) |
| 19 to 25 Years | 215 (10.6%) | 1,296 (64.2%) |
| 25 to 34 Years | 617 (20.6%) | 1,695 (56.7%) |
| 35 to 44 Years | 325 (11.9%) | 1,778 (64.9%) |
| 45 to 54 Years | 236 (11.0%) | 1,535 (71.8%) |
| 55 to 64 Years | 756 (31.2%) | 1,716 (70.9%) |
| 65 to 74 Years | 1,750 (94.0%) | 1,117 (60.0%) |
| 75 Years and over | 1,411 (99.4%) | 1,002 (70.6%) |
| Total | 9,114 (42.7%) | 12,145 (56.9%) |
Disability Status by Sex by Age in Del City
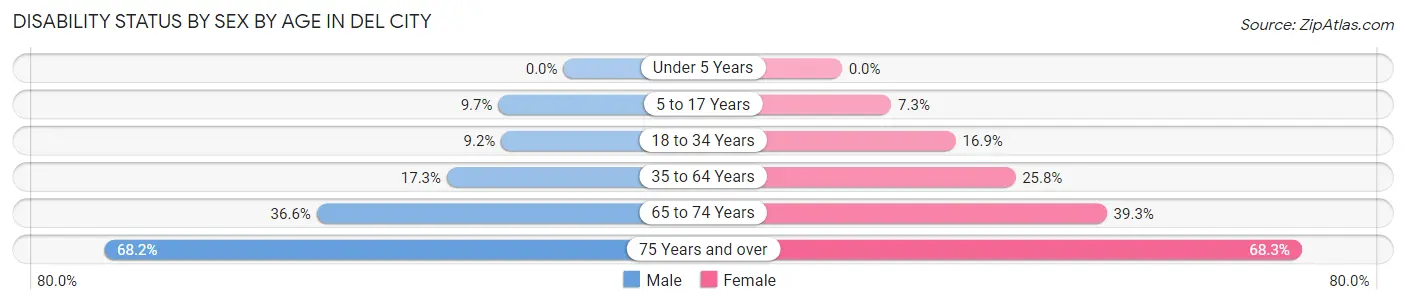
| Age Bracket | Male | Female |
| Under 5 Years | 0 (0.0%) | 0 (0.0%) |
| 5 to 17 Years | 185 (9.7%) | 126 (7.3%) |
| 18 to 34 Years | 221 (9.2%) | 469 (16.9%) |
| 35 to 64 Years | 607 (17.3%) | 976 (25.8%) |
| 65 to 74 Years | 352 (36.6%) | 354 (39.3%) |
| 75 Years and over | 433 (68.2%) | 536 (68.3%) |
Disability Class by Sex by Age in Del City
Disability Class: Hearing Difficulty
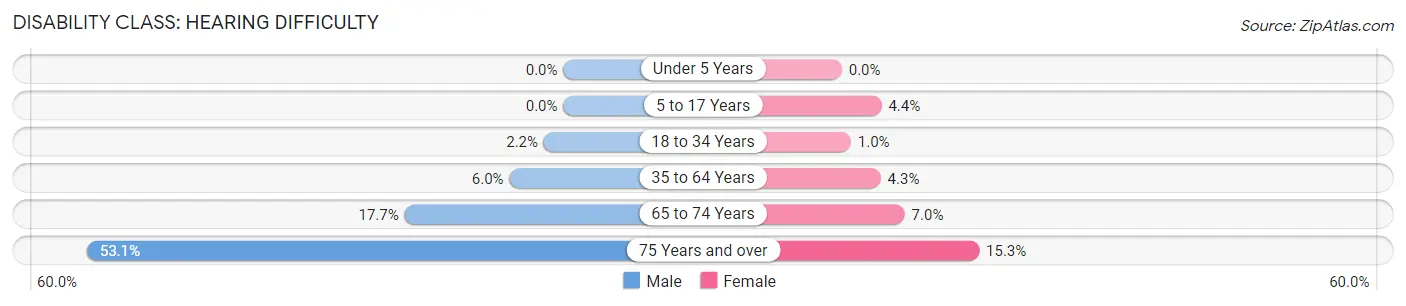
| Age Bracket | Male | Female |
| Under 5 Years | 0 (0.0%) | 0 (0.0%) |
| 5 to 17 Years | 0 (0.0%) | 76 (4.4%) |
| 18 to 34 Years | 52 (2.2%) | 28 (1.0%) |
| 35 to 64 Years | 211 (6.0%) | 164 (4.3%) |
| 65 to 74 Years | 170 (17.7%) | 63 (7.0%) |
| 75 Years and over | 337 (53.1%) | 120 (15.3%) |
Disability Class: Vision Difficulty
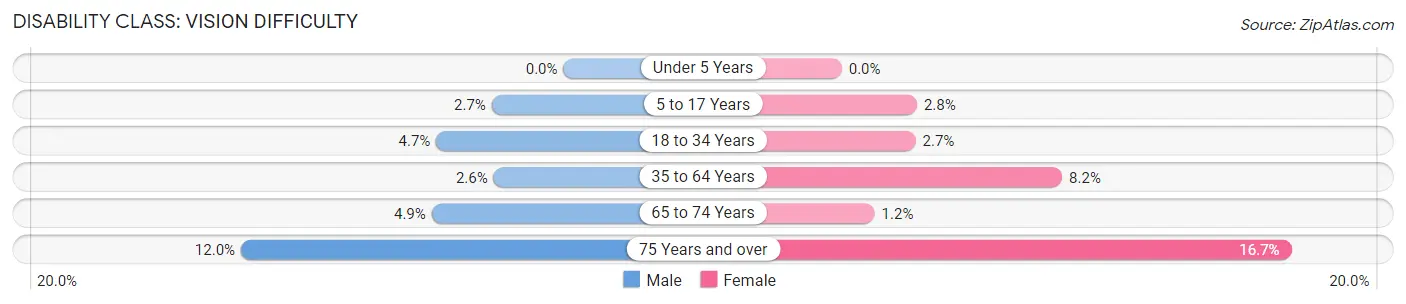
| Age Bracket | Male | Female |
| Under 5 Years | 0 (0.0%) | 0 (0.0%) |
| 5 to 17 Years | 51 (2.7%) | 48 (2.8%) |
| 18 to 34 Years | 113 (4.7%) | 76 (2.7%) |
| 35 to 64 Years | 91 (2.6%) | 310 (8.2%) |
| 65 to 74 Years | 47 (4.9%) | 11 (1.2%) |
| 75 Years and over | 76 (12.0%) | 131 (16.7%) |
Disability Class: Cognitive Difficulty
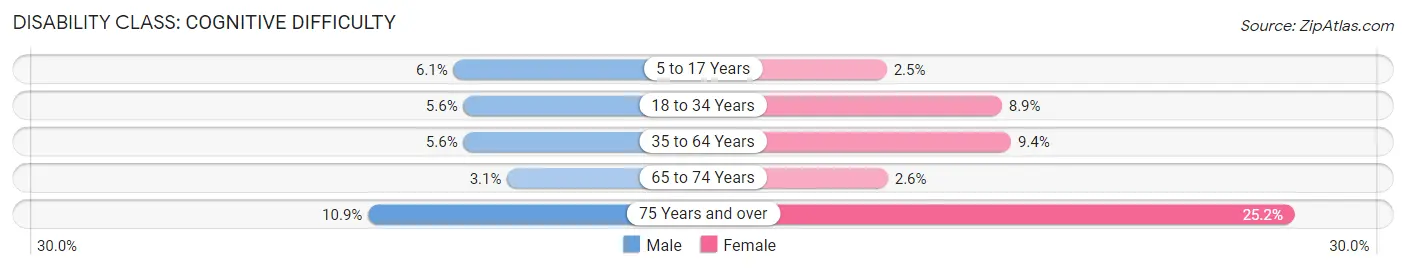
| Age Bracket | Male | Female |
| 5 to 17 Years | 117 (6.1%) | 43 (2.5%) |
| 18 to 34 Years | 133 (5.6%) | 247 (8.9%) |
| 35 to 64 Years | 195 (5.6%) | 357 (9.4%) |
| 65 to 74 Years | 30 (3.1%) | 23 (2.6%) |
| 75 Years and over | 69 (10.9%) | 198 (25.2%) |
Disability Class: Ambulatory Difficulty
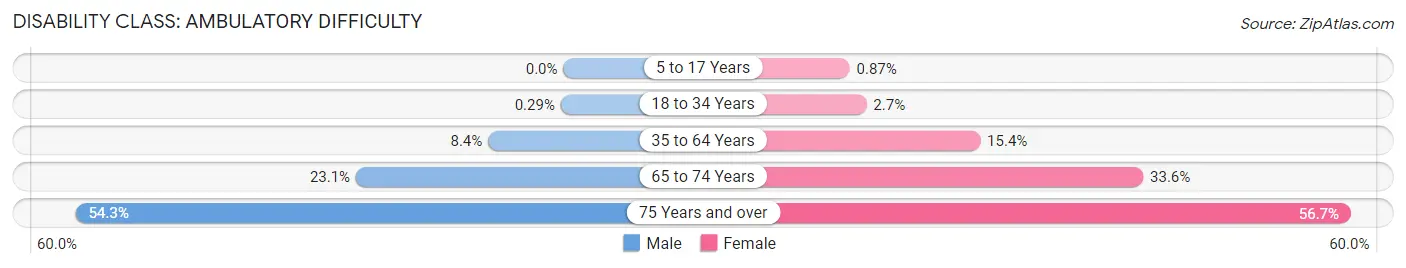
| Age Bracket | Male | Female |
| 5 to 17 Years | 0 (0.0%) | 15 (0.9%) |
| 18 to 34 Years | 7 (0.3%) | 76 (2.7%) |
| 35 to 64 Years | 294 (8.4%) | 584 (15.4%) |
| 65 to 74 Years | 222 (23.1%) | 302 (33.6%) |
| 75 Years and over | 345 (54.3%) | 445 (56.7%) |
Disability Class: Self-Care Difficulty
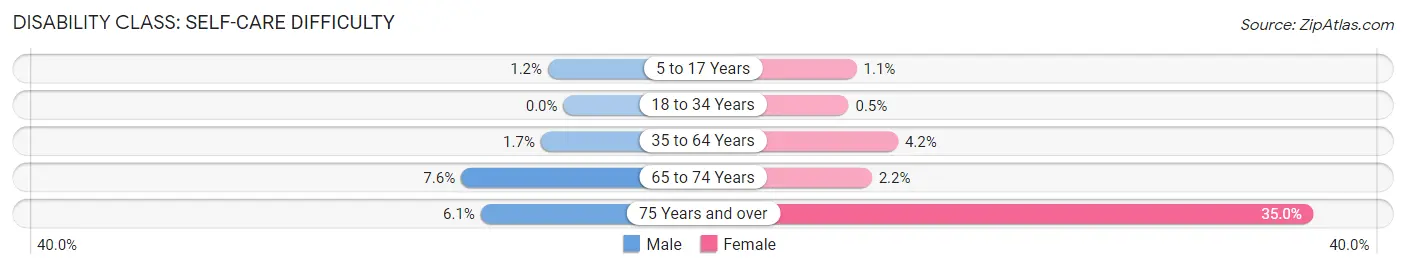
| Age Bracket | Male | Female |
| 5 to 17 Years | 22 (1.1%) | 19 (1.1%) |
| 18 to 34 Years | 0 (0.0%) | 14 (0.5%) |
| 35 to 64 Years | 59 (1.7%) | 158 (4.2%) |
| 65 to 74 Years | 73 (7.6%) | 20 (2.2%) |
| 75 Years and over | 39 (6.1%) | 275 (35.0%) |
Technology Access in Del City
Computing Device Access in Del City
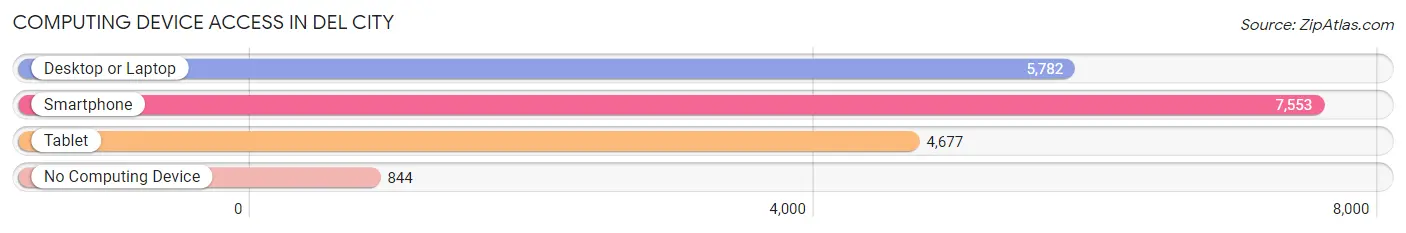
| Device Type | # Households | % Households |
| Desktop or Laptop | 5,782 | 65.9% |
| Smartphone | 7,553 | 86.1% |
| Tablet | 4,677 | 53.3% |
| No Computing Device | 844 | 9.6% |
| Total | 8,772 | 100.0% |
Internet Access in Del City
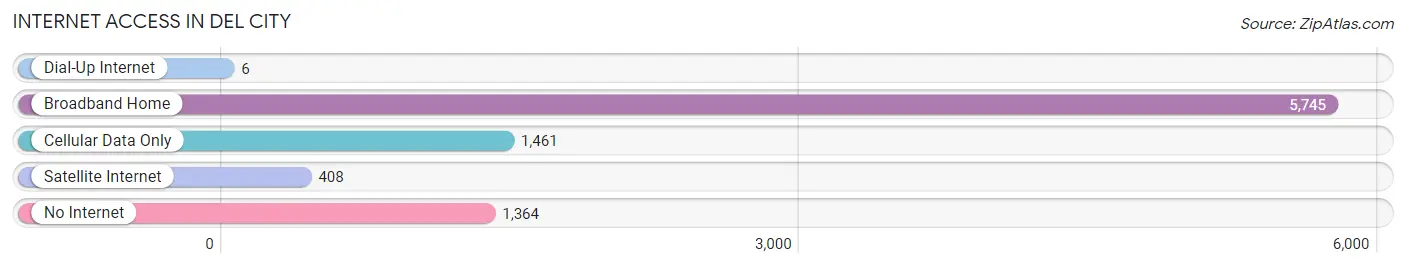
| Internet Type | # Households | % Households |
| Dial-Up Internet | 6 | 0.1% |
| Broadband Home | 5,745 | 65.5% |
| Cellular Data Only | 1,461 | 16.7% |
| Satellite Internet | 408 | 4.6% |
| No Internet | 1,364 | 15.5% |
| Total | 8,772 | 100.0% |
Del City Summary
Del City is a city located in Oklahoma County, Oklahoma, United States, and a part of the Oklahoma City metropolitan area. The population was 21,332 at the 2010 census. Del City is located near two major interstate highways, Interstate 40 and Interstate 35.
History
Del City was founded in 1948 by the Del City Development Company, which was owned by the Del family. The Del family had been in the area since the early 1900s, when they moved to Oklahoma from Arkansas. The Del family owned a large amount of land in the area, and they decided to develop it into a city. The city was named after the Del family, and the first post office was established in 1949.
The city grew rapidly in the 1950s and 1960s, and by the 1970s it had become a major suburb of Oklahoma City. The city was incorporated in 1959, and the first mayor was elected in 1960.
Geography
Del City is located in Oklahoma County, Oklahoma, and is a part of the Oklahoma City metropolitan area. The city is located near two major interstate highways, Interstate 40 and Interstate 35. The city is located in the central part of the state, and is about 15 miles east of downtown Oklahoma City.
The city has a total area of 8.3 square miles, of which 8.2 square miles is land and 0.1 square miles is water. The city is located in the Cross Timbers region of Oklahoma, and is part of the Sandstone Hills region.
Economy
Del City has a diverse economy, with a variety of businesses and industries. The city is home to several large employers, including Tinker Air Force Base, the University of Oklahoma Health Sciences Center, and the Oklahoma City VA Medical Center. The city also has a number of smaller businesses, including retail stores, restaurants, and professional services.
The city is also home to several major shopping centers, including Del City Shopping Center, Del City Plaza, and Del City Town Center. The city also has a number of parks and recreational facilities, including Del City Park, Del City Lake, and Del City Golf Course.
Demographics
As of the 2010 census, there were 21,332 people, 8,093 households, and 5,541 families residing in the city. The population density was 2,569.2 people per square mile. The racial makeup of the city was 68.2% White, 15.2% African American, 5.3% Native American, 2.2% Asian, 0.1% Pacific Islander, 4.2% from other races, and 4.9% from two or more races. Hispanic or Latino of any race were 11.2% of the population.
The median income for a household in the city was $41,945, and the median income for a family was $50,945. The per capita income for the city was $20,945. About 11.2% of families and 14.2% of the population were below the poverty line, including 19.2% of those under age 18 and 8.2% of those age 65 or over.
Common Questions
What is Per Capita Income in Del City?
Per Capita income in Del City is $25,757.
What is the Median Family Income in Del City?
Median Family Income in Del City is $56,968.
What is the Median Household income in Del City?
Median Household Income in Del City is $48,200.
What is Income or Wage Gap in Del City?
Income or Wage Gap in Del City is 33.1%.
Women in Del City earn 66.9 cents for every dollar earned by a man.
What is Family Income Deficit in Del City?
Family Income Deficit in Del City is $15,479.
Families that are below poverty line in Del City earn $15,479 less on average than the poverty threshold level.
What is Inequality or Gini Index in Del City?
Inequality or Gini Index in Del City is 0.41.
What is the Total Population of Del City?
Total Population of Del City is 21,682.
What is the Total Male Population of Del City?
Total Male Population of Del City is 10,469.
What is the Total Female Population of Del City?
Total Female Population of Del City is 11,213.
What is the Ratio of Males per 100 Females in Del City?
There are 93.36 Males per 100 Females in Del City.
What is the Ratio of Females per 100 Males in Del City?
There are 107.11 Females per 100 Males in Del City.
What is the Median Population Age in Del City?
Median Population Age in Del City is 34.6 Years.
What is the Average Family Size in Del City
Average Family Size in Del City is 3.2 People.
What is the Average Household Size in Del City
Average Household Size in Del City is 2.5 People.
How Large is the Labor Force in Del City?
There are 10,253 People in the Labor Forcein in Del City.
What is the Percentage of People in the Labor Force in Del City?
61.9% of People are in the Labor Force in Del City.
What is the Unemployment Rate in Del City?
Unemployment Rate in Del City is 6.2%.