Sapulpa, OK Map & Demographics
Sapulpa Map
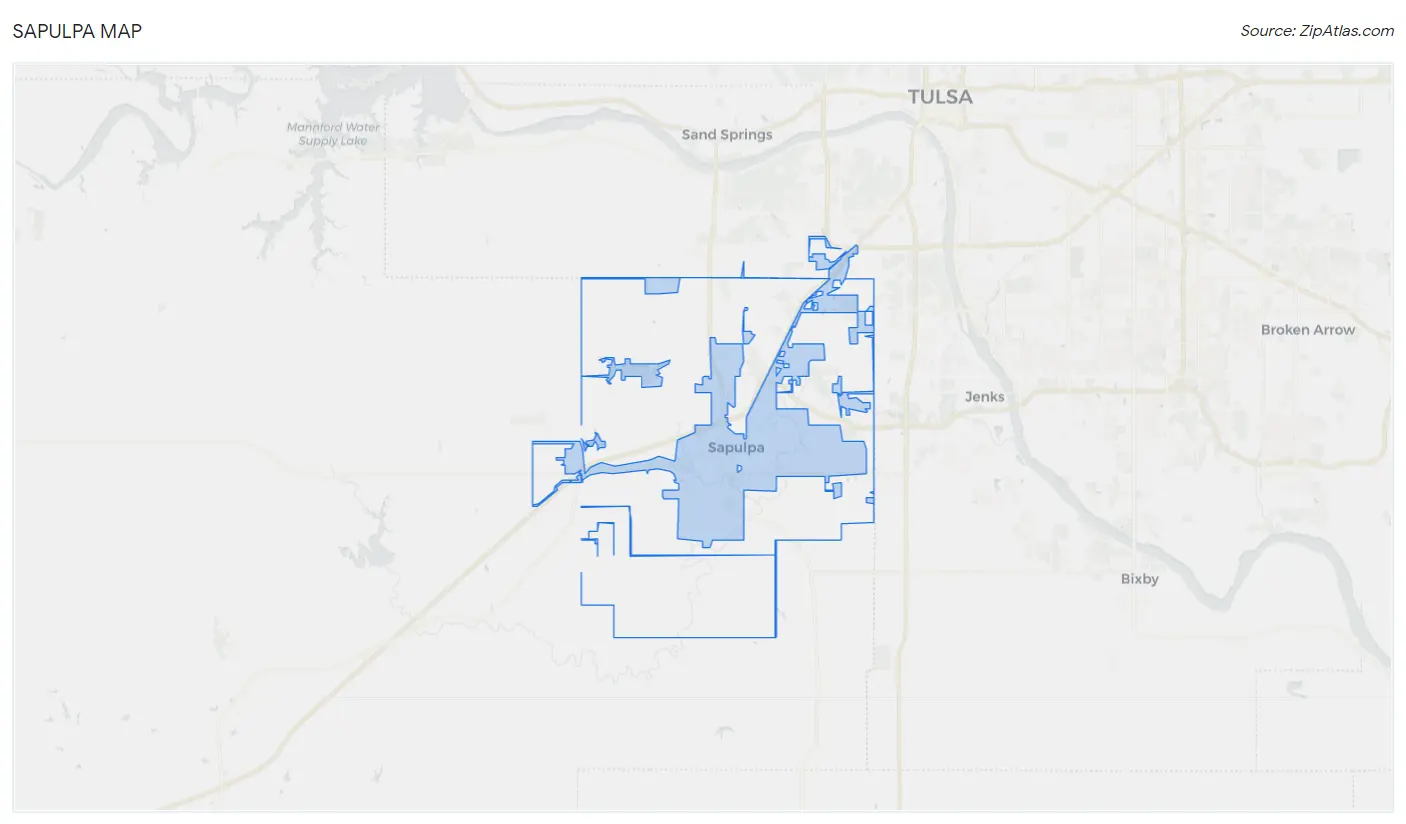
Sapulpa Overview
$31,330
PER CAPITA INCOME
$76,528
AVG FAMILY INCOME
$62,168
AVG HOUSEHOLD INCOME
26.8%
WAGE / INCOME GAP [ % ]
73.2¢/ $1
WAGE / INCOME GAP [ $ ]
$12,045
FAMILY INCOME DEFICIT
0.41
INEQUALITY / GINI INDEX
22,030
TOTAL POPULATION
10,763
MALE POPULATION
11,267
FEMALE POPULATION
95.53
MALES / 100 FEMALES
104.68
FEMALES / 100 MALES
40.1
MEDIAN AGE
3.0
AVG FAMILY SIZE
2.5
AVG HOUSEHOLD SIZE
10,372
LABOR FORCE [ PEOPLE ]
58.6%
PERCENT IN LABOR FORCE
3.3%
UNEMPLOYMENT RATE
Sapulpa Zip Codes
Sapulpa Area Codes
Income in Sapulpa
Income Overview in Sapulpa
Per Capita Income in Sapulpa is $31,330, while median incomes of families and households are $76,528 and $62,168 respectively.
| Characteristic | Number | Measure |
| Per Capita Income | 22,030 | $31,330 |
| Median Family Income | 5,844 | $76,528 |
| Mean Family Income | 5,844 | $90,321 |
| Median Household Income | 8,697 | $62,168 |
| Mean Household Income | 8,697 | $76,332 |
| Income Deficit | 5,844 | $12,045 |
| Wage / Income Gap (%) | 22,030 | 26.84% |
| Wage / Income Gap ($) | 22,030 | 73.16¢ per $1 |
| Gini / Inequality Index | 22,030 | 0.41 |
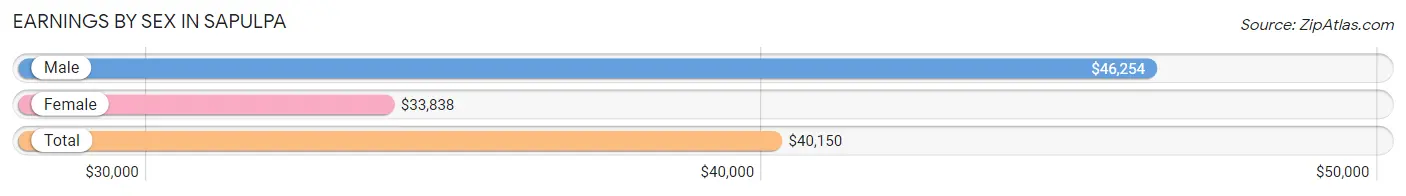
Earnings by Sex in Sapulpa
Average Earnings in Sapulpa are $40,150, $46,254 for men and $33,838 for women, a difference of 26.8%.
| Sex | Number | Average Earnings |
| Male | 6,034 (55.4%) | $46,254 |
| Female | 4,864 (44.6%) | $33,838 |
| Total | 10,898 (100.0%) | $40,150 |
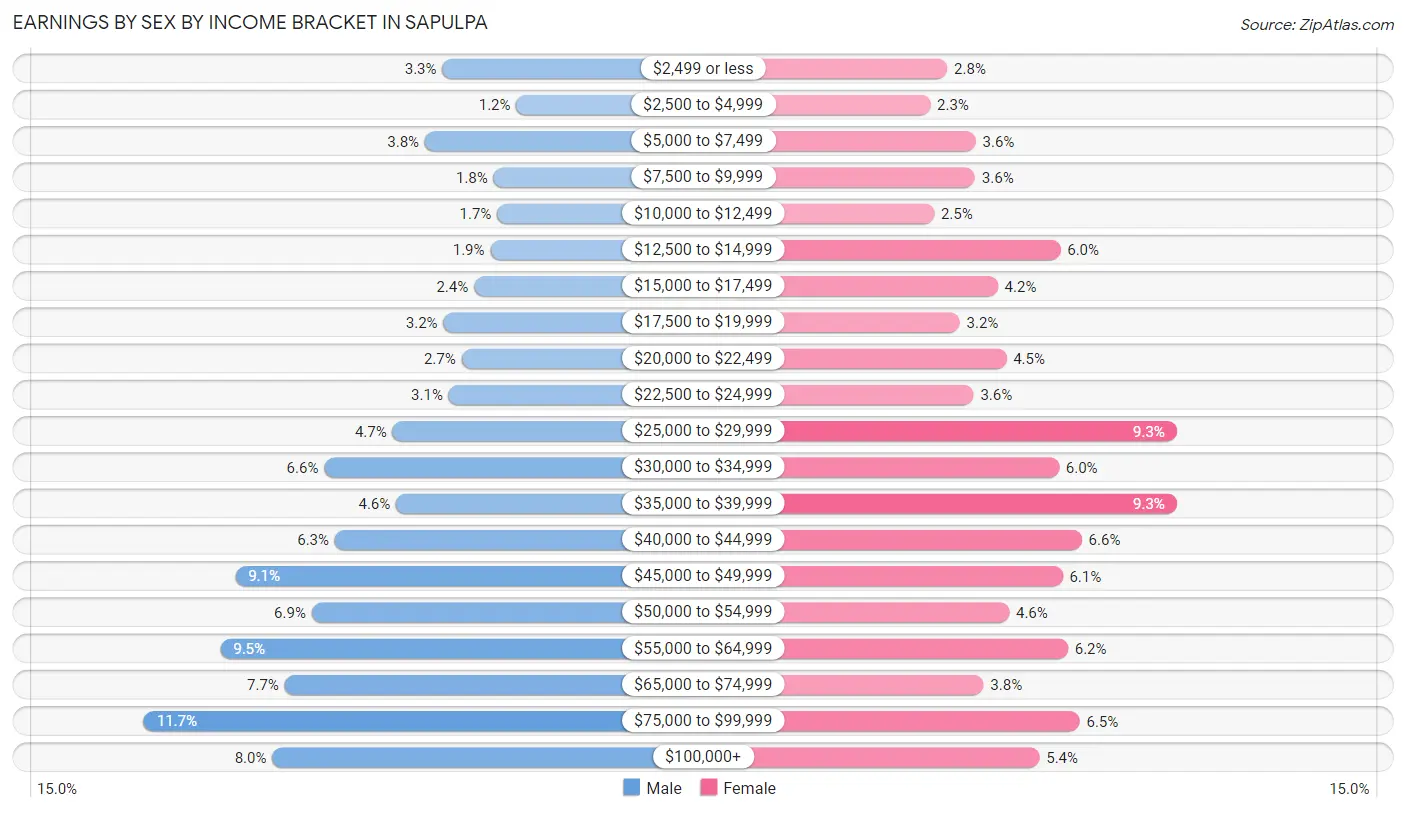
Earnings by Sex by Income Bracket in Sapulpa
The most common earnings brackets in Sapulpa are $75,000 to $99,999 for men (703 | 11.7%) and $25,000 to $29,999 for women (451 | 9.3%).
| Income | Male | Female |
| $2,499 or less | 197 (3.3%) | 137 (2.8%) |
| $2,500 to $4,999 | 71 (1.2%) | 114 (2.3%) |
| $5,000 to $7,499 | 226 (3.7%) | 176 (3.6%) |
| $7,500 to $9,999 | 110 (1.8%) | 175 (3.6%) |
| $10,000 to $12,499 | 104 (1.7%) | 119 (2.5%) |
| $12,500 to $14,999 | 115 (1.9%) | 292 (6.0%) |
| $15,000 to $17,499 | 143 (2.4%) | 206 (4.2%) |
| $17,500 to $19,999 | 195 (3.2%) | 154 (3.2%) |
| $20,000 to $22,499 | 164 (2.7%) | 218 (4.5%) |
| $22,500 to $24,999 | 186 (3.1%) | 173 (3.6%) |
| $25,000 to $29,999 | 281 (4.7%) | 451 (9.3%) |
| $30,000 to $34,999 | 397 (6.6%) | 290 (6.0%) |
| $35,000 to $39,999 | 275 (4.6%) | 451 (9.3%) |
| $40,000 to $44,999 | 379 (6.3%) | 321 (6.6%) |
| $45,000 to $49,999 | 548 (9.1%) | 295 (6.1%) |
| $50,000 to $54,999 | 418 (6.9%) | 222 (4.6%) |
| $55,000 to $64,999 | 573 (9.5%) | 302 (6.2%) |
| $65,000 to $74,999 | 464 (7.7%) | 187 (3.8%) |
| $75,000 to $99,999 | 703 (11.7%) | 318 (6.5%) |
| $100,000+ | 485 (8.0%) | 263 (5.4%) |
| Total | 6,034 (100.0%) | 4,864 (100.0%) |
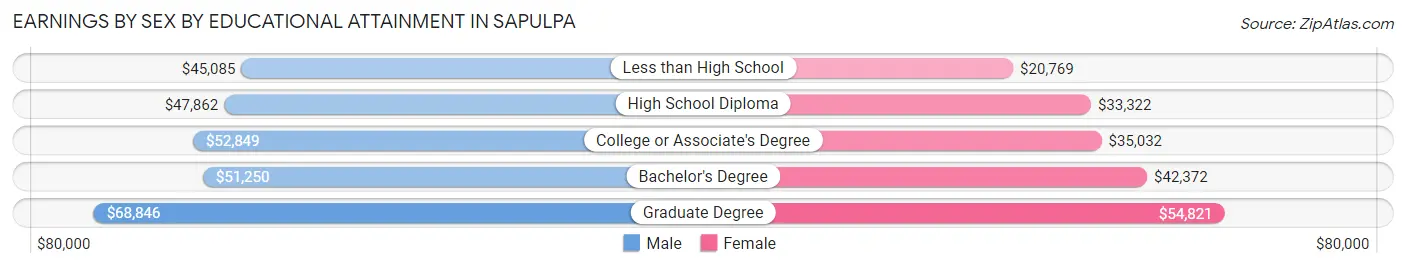
Earnings by Sex by Educational Attainment in Sapulpa
Average earnings in Sapulpa are $49,912 for men and $36,571 for women, a difference of 26.7%. Men with an educational attainment of graduate degree enjoy the highest average annual earnings of $68,846, while those with less than high school education earn the least with $45,085. Women with an educational attainment of graduate degree earn the most with the average annual earnings of $54,821, while those with less than high school education have the smallest earnings of $20,769.
| Educational Attainment | Male Income | Female Income |
| Less than High School | $45,085 | $20,769 |
| High School Diploma | $47,862 | $33,322 |
| College or Associate's Degree | $52,849 | $35,032 |
| Bachelor's Degree | $51,250 | $42,372 |
| Graduate Degree | $68,846 | $54,821 |
| Total | $49,912 | $36,571 |
Family Income in Sapulpa
Family Income Brackets in Sapulpa
According to the Sapulpa family income data, there are 1,438 families falling into the $100,000 to $149,999 income range, which is the most common income bracket and makes up 24.6% of all families. Conversely, the $10,000 to $14,999 income bracket is the least frequent group with only 82 families (1.4%) belonging to this category.
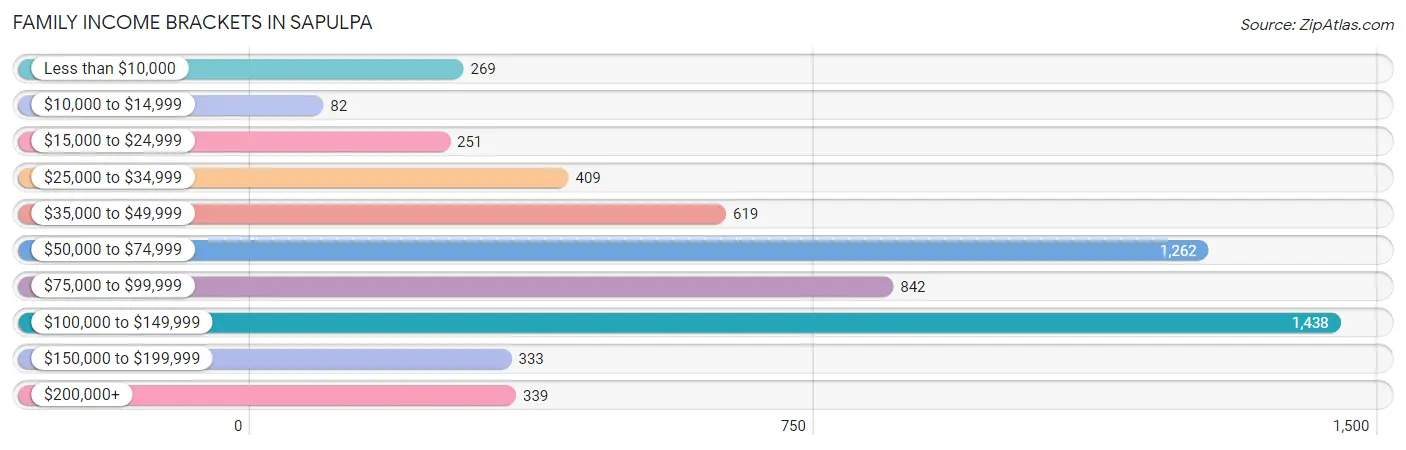
| Income Bracket | # Families | % Families |
| Less than $10,000 | 269 | 4.6% |
| $10,000 to $14,999 | 82 | 1.4% |
| $15,000 to $24,999 | 251 | 4.3% |
| $25,000 to $34,999 | 409 | 7.0% |
| $35,000 to $49,999 | 619 | 10.6% |
| $50,000 to $74,999 | 1,262 | 21.6% |
| $75,000 to $99,999 | 842 | 14.4% |
| $100,000 to $149,999 | 1,438 | 24.6% |
| $150,000 to $199,999 | 333 | 5.7% |
| $200,000+ | 339 | 5.8% |
Family Income by Famaliy Size in Sapulpa
6-person families (232 | 4.0%) account for the highest median family income in Sapulpa with $135,264 per family, while 2-person families (2,509 | 42.9%) have the highest median income of $32,519 per family member.
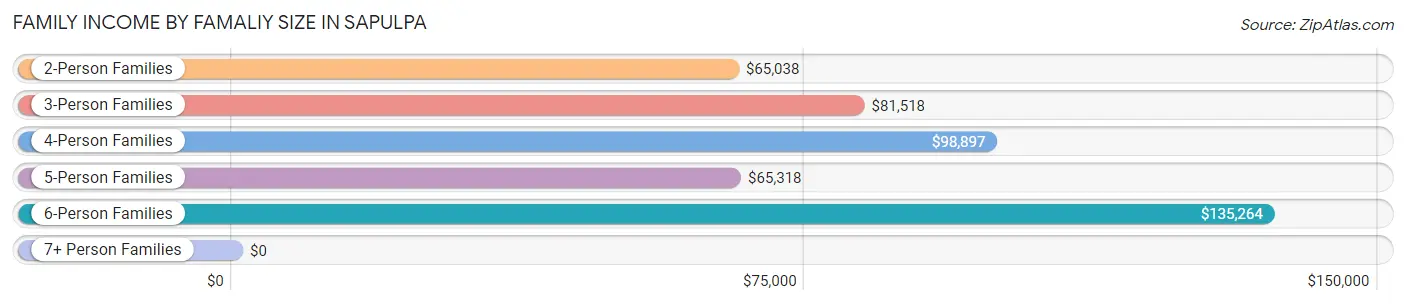
| Income Bracket | # Families | Median Income |
| 2-Person Families | 2,509 (42.9%) | $65,038 |
| 3-Person Families | 1,648 (28.2%) | $81,518 |
| 4-Person Families | 877 (15.0%) | $98,897 |
| 5-Person Families | 530 (9.1%) | $65,318 |
| 6-Person Families | 232 (4.0%) | $135,264 |
| 7+ Person Families | 48 (0.8%) | $0 |
| Total | 5,844 (100.0%) | $76,528 |
Family Income by Number of Earners in Sapulpa
The median family income in Sapulpa is $76,528, with families comprising 3+ earners (547) having the highest median family income of $113,877, while families with no earners (1,232) have the lowest median family income of $48,088, accounting for 9.4% and 21.1% of families, respectively.
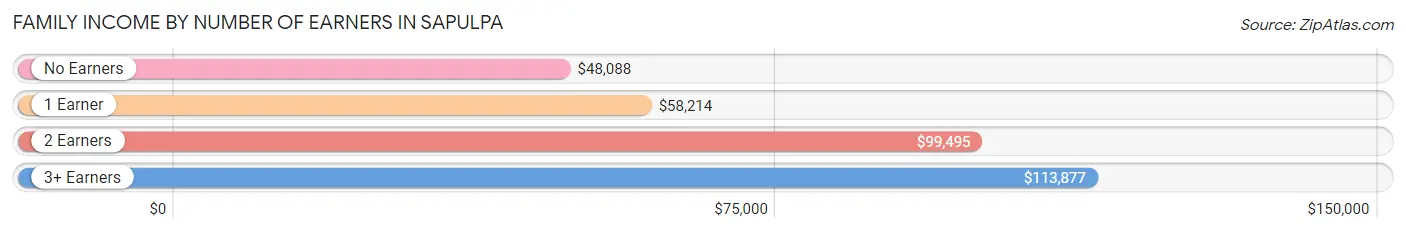
| Number of Earners | # Families | Median Income |
| No Earners | 1,232 (21.1%) | $48,088 |
| 1 Earner | 1,836 (31.4%) | $58,214 |
| 2 Earners | 2,229 (38.1%) | $99,495 |
| 3+ Earners | 547 (9.4%) | $113,877 |
| Total | 5,844 (100.0%) | $76,528 |
Household Income in Sapulpa
Household Income Brackets in Sapulpa
With 1,818 households falling in the category, the $50,000 to $74,999 income range is the most frequent in Sapulpa, accounting for 20.9% of all households. In contrast, only 209 households (2.4%) fall into the $10,000 to $14,999 income bracket, making it the least populous group.
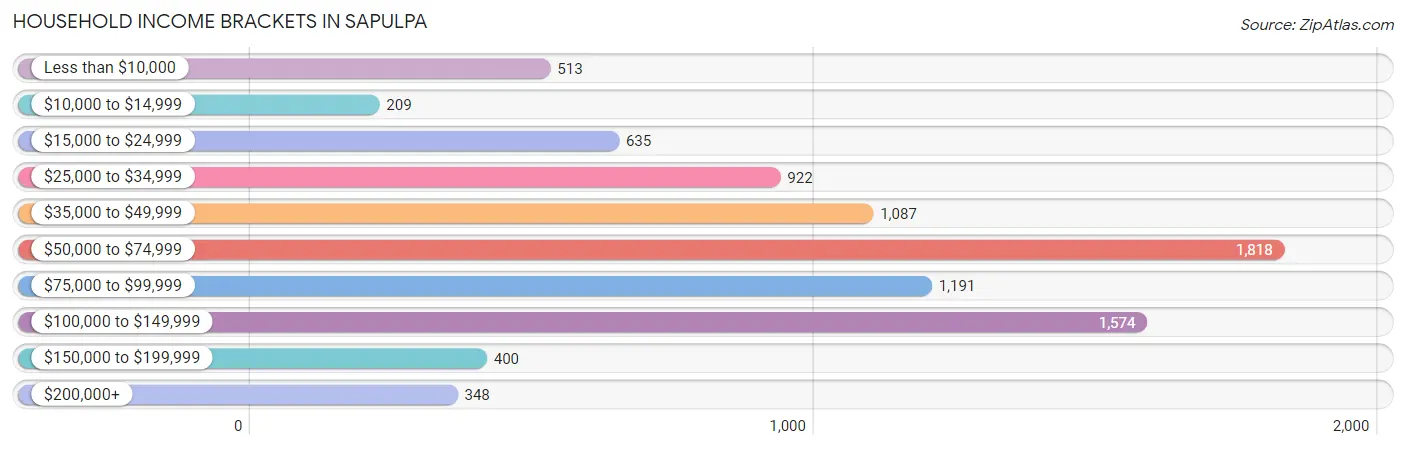
| Income Bracket | # Households | % Households |
| Less than $10,000 | 513 | 5.9% |
| $10,000 to $14,999 | 209 | 2.4% |
| $15,000 to $24,999 | 635 | 7.3% |
| $25,000 to $34,999 | 922 | 10.6% |
| $35,000 to $49,999 | 1,087 | 12.5% |
| $50,000 to $74,999 | 1,818 | 20.9% |
| $75,000 to $99,999 | 1,191 | 13.7% |
| $100,000 to $149,999 | 1,574 | 18.1% |
| $150,000 to $199,999 | 400 | 4.6% |
| $200,000+ | 348 | 4.0% |
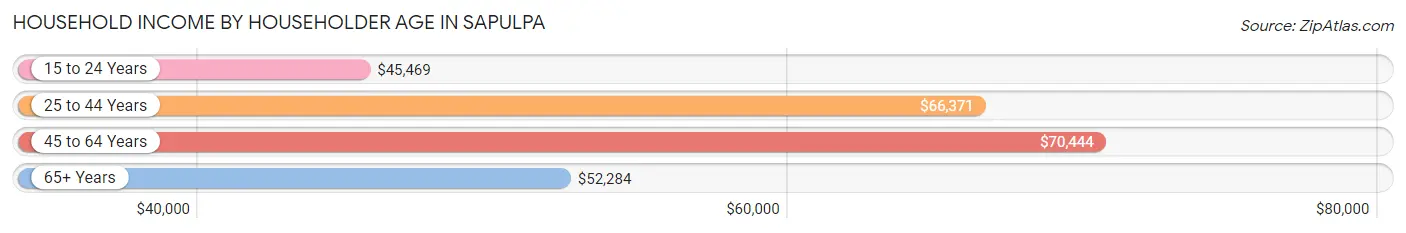
Household Income by Householder Age in Sapulpa
The median household income in Sapulpa is $62,168, with the highest median household income of $70,444 found in the 45 to 64 years age bracket for the primary householder. A total of 2,938 households (33.8%) fall into this category. Meanwhile, the 15 to 24 years age bracket for the primary householder has the lowest median household income of $45,469, with 468 households (5.4%) in this group.
| Income Bracket | # Households | Median Income |
| 15 to 24 Years | 468 (5.4%) | $45,469 |
| 25 to 44 Years | 2,542 (29.2%) | $66,371 |
| 45 to 64 Years | 2,938 (33.8%) | $70,444 |
| 65+ Years | 2,749 (31.6%) | $52,284 |
| Total | 8,697 (100.0%) | $62,168 |
Poverty in Sapulpa
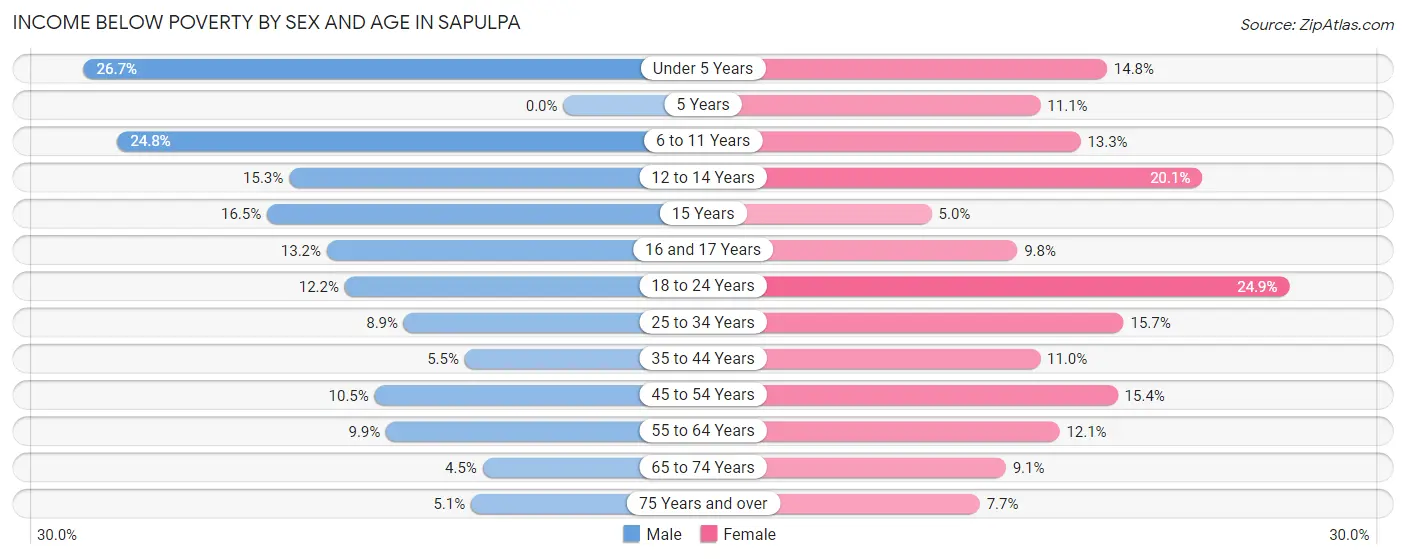
Income Below Poverty by Sex and Age in Sapulpa
With 11.2% poverty level for males and 13.3% for females among the residents of Sapulpa, under 5 year old males and 18 to 24 year old females are the most vulnerable to poverty, with 176 males (26.7%) and 231 females (24.9%) in their respective age groups living below the poverty level.
| Age Bracket | Male | Female |
| Under 5 Years | 176 (26.7%) | 89 (14.8%) |
| 5 Years | 0 (0.0%) | 25 (11.1%) |
| 6 to 11 Years | 213 (24.8%) | 101 (13.3%) |
| 12 to 14 Years | 60 (15.3%) | 55 (20.1%) |
| 15 Years | 17 (16.5%) | 7 (5.0%) |
| 16 and 17 Years | 42 (13.2%) | 26 (9.8%) |
| 18 to 24 Years | 128 (12.2%) | 231 (24.9%) |
| 25 to 34 Years | 125 (8.9%) | 209 (15.7%) |
| 35 to 44 Years | 81 (5.5%) | 145 (11.0%) |
| 45 to 54 Years | 120 (10.5%) | 190 (15.4%) |
| 55 to 64 Years | 137 (9.9%) | 168 (12.1%) |
| 65 to 74 Years | 48 (4.5%) | 140 (9.1%) |
| 75 Years and over | 31 (5.1%) | 75 (7.7%) |
| Total | 1,178 (11.2%) | 1,461 (13.3%) |
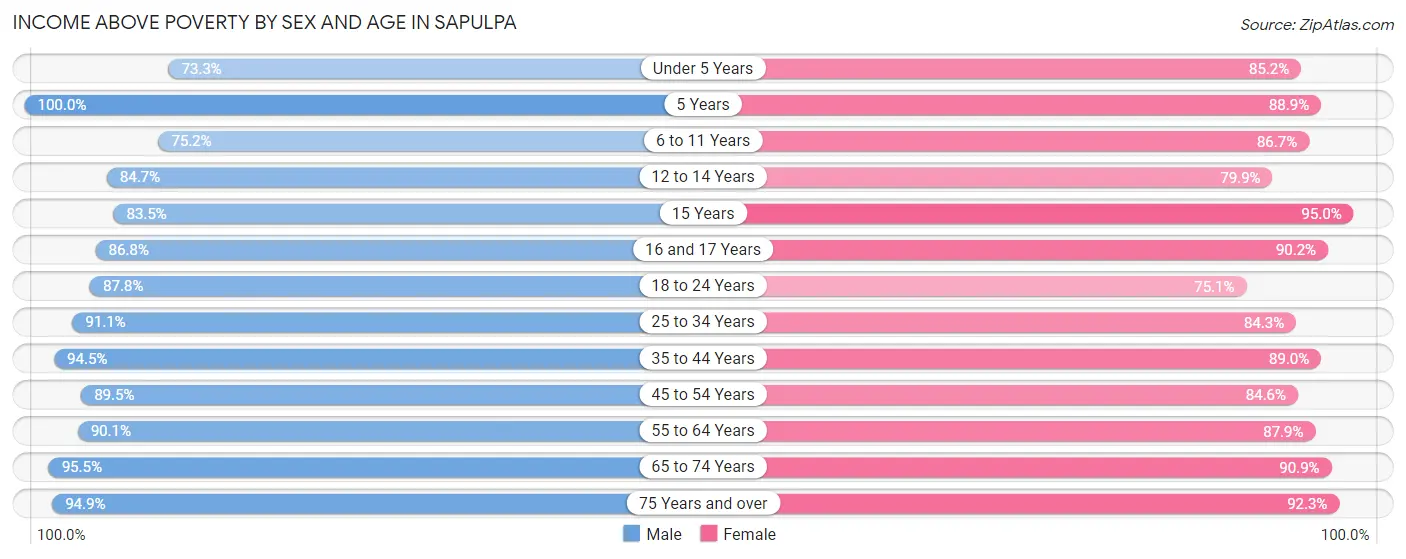
Income Above Poverty by Sex and Age in Sapulpa
According to the poverty statistics in Sapulpa, males aged 5 years and females aged 15 years are the age groups that are most secure financially, with 100.0% of males and 95.0% of females in these age groups living above the poverty line.
| Age Bracket | Male | Female |
| Under 5 Years | 483 (73.3%) | 514 (85.2%) |
| 5 Years | 101 (100.0%) | 201 (88.9%) |
| 6 to 11 Years | 645 (75.2%) | 659 (86.7%) |
| 12 to 14 Years | 333 (84.7%) | 219 (79.9%) |
| 15 Years | 86 (83.5%) | 133 (95.0%) |
| 16 and 17 Years | 277 (86.8%) | 240 (90.2%) |
| 18 to 24 Years | 924 (87.8%) | 696 (75.1%) |
| 25 to 34 Years | 1,282 (91.1%) | 1,123 (84.3%) |
| 35 to 44 Years | 1,395 (94.5%) | 1,169 (89.0%) |
| 45 to 54 Years | 1,022 (89.5%) | 1,047 (84.6%) |
| 55 to 64 Years | 1,251 (90.1%) | 1,218 (87.9%) |
| 65 to 74 Years | 1,020 (95.5%) | 1,393 (90.9%) |
| 75 Years and over | 572 (94.9%) | 901 (92.3%) |
| Total | 9,391 (88.8%) | 9,513 (86.7%) |
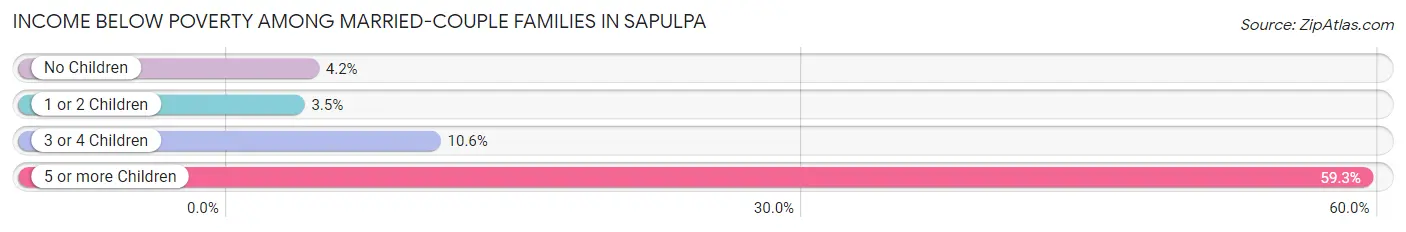
Income Below Poverty Among Married-Couple Families in Sapulpa
The poverty statistics for married-couple families in Sapulpa show that 4.9% or 201 of the total 4,118 families live below the poverty line. Families with 5 or more children have the highest poverty rate of 59.3%, comprising of 16 families. On the other hand, families with 1 or 2 children have the lowest poverty rate of 3.5%, which includes 48 families.
| Children | Above Poverty | Below Poverty |
| No Children | 2,248 (95.8%) | 99 (4.2%) |
| 1 or 2 Children | 1,337 (96.5%) | 48 (3.5%) |
| 3 or 4 Children | 321 (89.4%) | 38 (10.6%) |
| 5 or more Children | 11 (40.7%) | 16 (59.3%) |
| Total | 3,917 (95.1%) | 201 (4.9%) |
Income Below Poverty Among Single-Parent Households in Sapulpa
According to the poverty data in Sapulpa, 12.5% or 69 single-father households and 28.8% or 338 single-mother households are living below the poverty line. Among single-father households, those with 3 or 4 children have the highest poverty rate, with 8 households (28.6%) experiencing poverty. Likewise, among single-mother households, those with 3 or 4 children have the highest poverty rate, with 60 households (50.4%) falling below the poverty line.
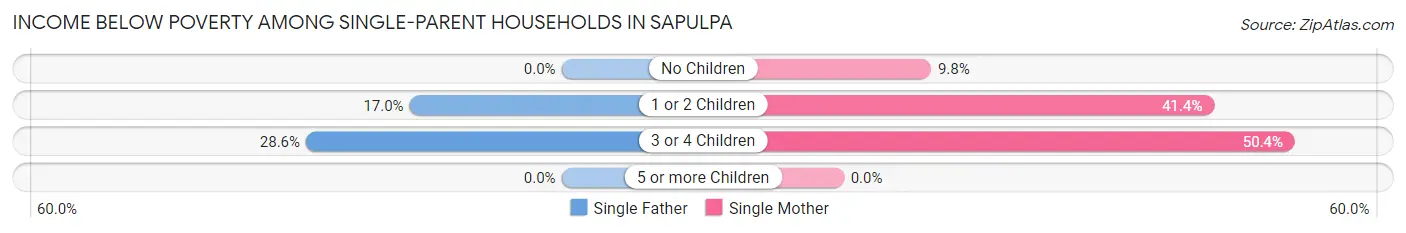
| Children | Single Father | Single Mother |
| No Children | 0 (0.0%) | 49 (9.8%) |
| 1 or 2 Children | 61 (17.0%) | 229 (41.4%) |
| 3 or 4 Children | 8 (28.6%) | 60 (50.4%) |
| 5 or more Children | 0 (0.0%) | 0 (0.0%) |
| Total | 69 (12.5%) | 338 (28.8%) |
Income Below Poverty Among Married-Couple vs Single-Parent Households in Sapulpa
The poverty data for Sapulpa shows that 201 of the married-couple family households (4.9%) and 407 of the single-parent households (23.6%) are living below the poverty level. Within the married-couple family households, those with 5 or more children have the highest poverty rate, with 16 households (59.3%) falling below the poverty line. Among the single-parent households, those with 3 or 4 children have the highest poverty rate, with 68 household (46.3%) living below poverty.
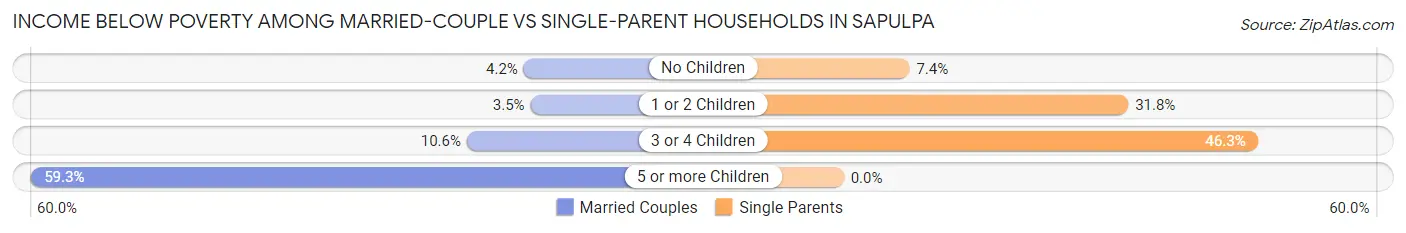
| Children | Married-Couple Families | Single-Parent Households |
| No Children | 99 (4.2%) | 49 (7.3%) |
| 1 or 2 Children | 48 (3.5%) | 290 (31.8%) |
| 3 or 4 Children | 38 (10.6%) | 68 (46.3%) |
| 5 or more Children | 16 (59.3%) | 0 (0.0%) |
| Total | 201 (4.9%) | 407 (23.6%) |
Race in Sapulpa
The most populous races in Sapulpa are White / Caucasian (16,587 | 75.3%), Native / Alaskan (2,522 | 11.5%), and Two or more Races (1,693 | 7.7%).
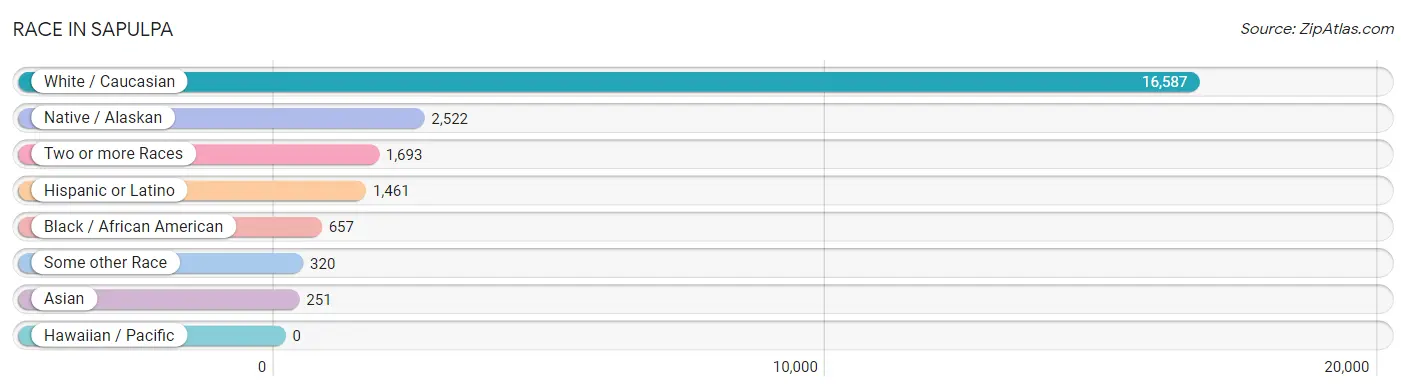
| Race | # Population | % Population |
| Asian | 251 | 1.1% |
| Black / African American | 657 | 3.0% |
| Hawaiian / Pacific | 0 | 0.0% |
| Hispanic or Latino | 1,461 | 6.6% |
| Native / Alaskan | 2,522 | 11.5% |
| White / Caucasian | 16,587 | 75.3% |
| Two or more Races | 1,693 | 7.7% |
| Some other Race | 320 | 1.5% |
| Total | 22,030 | 100.0% |
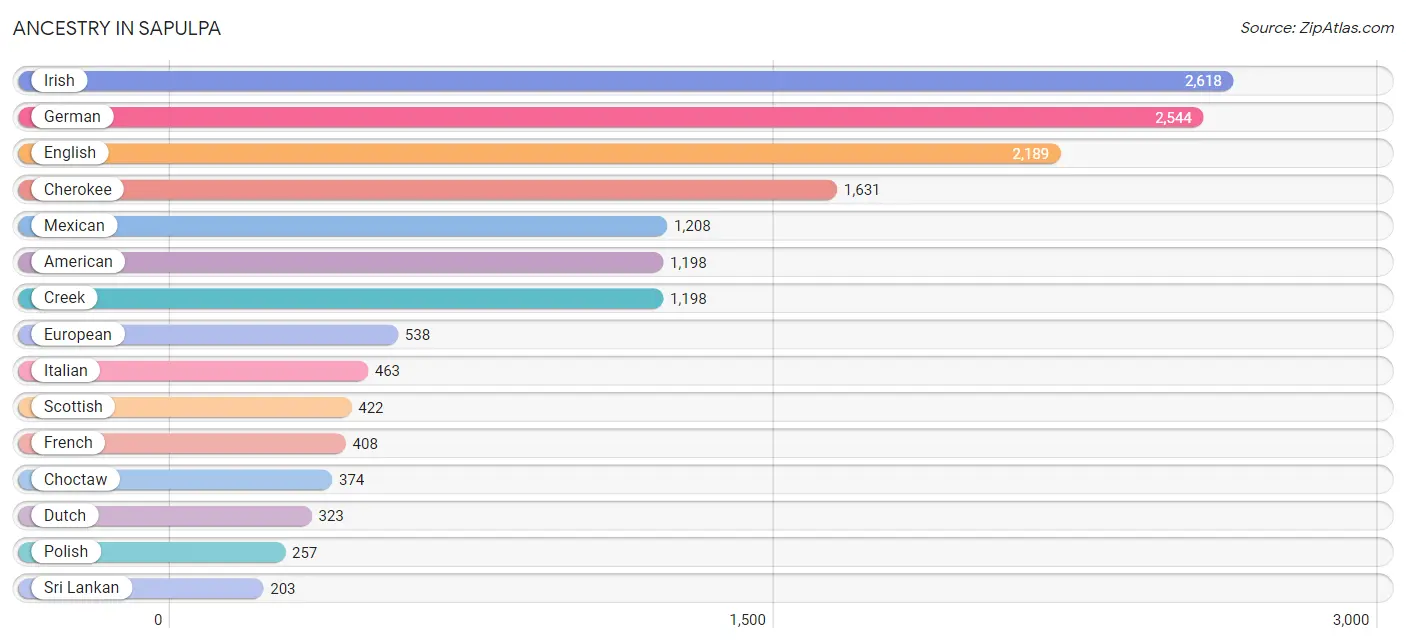
Ancestry in Sapulpa
The most populous ancestries reported in Sapulpa are Irish (2,618 | 11.9%), German (2,544 | 11.6%), English (2,189 | 9.9%), Cherokee (1,631 | 7.4%), and Mexican (1,208 | 5.5%), together accounting for 46.3% of all Sapulpa residents.
| Ancestry | # Population | % Population |
| African | 146 | 0.7% |
| American | 1,198 | 5.4% |
| Apache | 40 | 0.2% |
| Arab | 56 | 0.3% |
| Austrian | 80 | 0.4% |
| Basque | 27 | 0.1% |
| Bhutanese | 18 | 0.1% |
| Blackfeet | 27 | 0.1% |
| British | 76 | 0.3% |
| Burmese | 17 | 0.1% |
| Canadian | 25 | 0.1% |
| Central American | 91 | 0.4% |
| Central American Indian | 9 | 0.0% |
| Cherokee | 1,631 | 7.4% |
| Chickasaw | 33 | 0.2% |
| Choctaw | 374 | 1.7% |
| Creek | 1,198 | 5.4% |
| Czech | 23 | 0.1% |
| Danish | 18 | 0.1% |
| Delaware | 18 | 0.1% |
| Dutch | 323 | 1.5% |
| Dutch West Indian | 58 | 0.3% |
| Eastern European | 25 | 0.1% |
| Egyptian | 9 | 0.0% |
| English | 2,189 | 9.9% |
| European | 538 | 2.4% |
| Finnish | 108 | 0.5% |
| French | 408 | 1.8% |
| French Canadian | 29 | 0.1% |
| German | 2,544 | 11.6% |
| Greek | 18 | 0.1% |
| Guatemalan | 69 | 0.3% |
| Honduran | 22 | 0.1% |
| Hungarian | 21 | 0.1% |
| Iranian | 18 | 0.1% |
| Irish | 2,618 | 11.9% |
| Iroquois | 11 | 0.1% |
| Italian | 463 | 2.1% |
| Kiowa | 16 | 0.1% |
| Korean | 88 | 0.4% |
| Lebanese | 47 | 0.2% |
| Lithuanian | 5 | 0.0% |
| Menominee | 3 | 0.0% |
| Mexican | 1,208 | 5.5% |
| Mexican American Indian | 6 | 0.0% |
| Nigerian | 16 | 0.1% |
| Norwegian | 77 | 0.4% |
| Osage | 40 | 0.2% |
| Pakistani | 11 | 0.1% |
| Peruvian | 10 | 0.1% |
| Polish | 257 | 1.2% |
| Portuguese | 9 | 0.0% |
| Potawatomi | 21 | 0.1% |
| Pueblo | 27 | 0.1% |
| Russian | 11 | 0.1% |
| Scandinavian | 38 | 0.2% |
| Scotch-Irish | 109 | 0.5% |
| Scottish | 422 | 1.9% |
| Seminole | 41 | 0.2% |
| South American | 25 | 0.1% |
| Spaniard | 64 | 0.3% |
| Spanish | 55 | 0.3% |
| Sri Lankan | 203 | 0.9% |
| Subsaharan African | 162 | 0.7% |
| Swedish | 119 | 0.5% |
| Swiss | 43 | 0.2% |
| Thai | 47 | 0.2% |
| Tlingit-Haida | 50 | 0.2% |
| Ukrainian | 20 | 0.1% |
| Ute | 11 | 0.1% |
| Venezuelan | 15 | 0.1% |
| Welsh | 87 | 0.4% | View All 72 Rows |
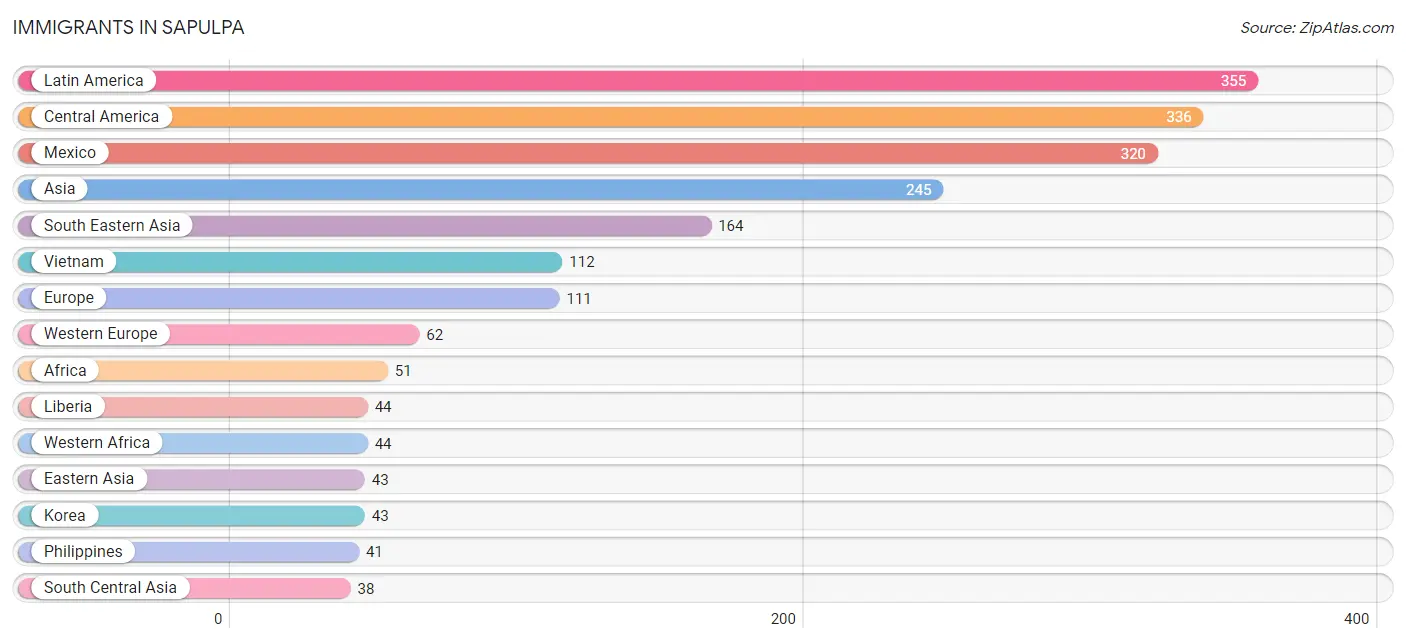
Immigrants in Sapulpa
The most numerous immigrant groups reported in Sapulpa came from Latin America (355 | 1.6%), Central America (336 | 1.5%), Mexico (320 | 1.5%), Asia (245 | 1.1%), and South Eastern Asia (164 | 0.7%), together accounting for 6.4% of all Sapulpa residents.
| Immigration Origin | # Population | % Population |
| Africa | 51 | 0.2% |
| Asia | 245 | 1.1% |
| Austria | 37 | 0.2% |
| Belize | 11 | 0.1% |
| Central America | 336 | 1.5% |
| Eastern Asia | 43 | 0.2% |
| Eastern Europe | 19 | 0.1% |
| England | 6 | 0.0% |
| Europe | 111 | 0.5% |
| Germany | 25 | 0.1% |
| Guatemala | 5 | 0.0% |
| India | 33 | 0.2% |
| Iran | 5 | 0.0% |
| Korea | 43 | 0.2% |
| Latin America | 355 | 1.6% |
| Latvia | 9 | 0.0% |
| Liberia | 44 | 0.2% |
| Mexico | 320 | 1.5% |
| Northern Europe | 11 | 0.1% |
| Peru | 15 | 0.1% |
| Philippines | 41 | 0.2% |
| South America | 19 | 0.1% |
| South Central Asia | 38 | 0.2% |
| South Eastern Asia | 164 | 0.7% |
| Southern Europe | 19 | 0.1% |
| Spain | 19 | 0.1% |
| Thailand | 11 | 0.1% |
| Venezuela | 4 | 0.0% |
| Vietnam | 112 | 0.5% |
| Western Africa | 44 | 0.2% |
| Western Europe | 62 | 0.3% | View All 31 Rows |
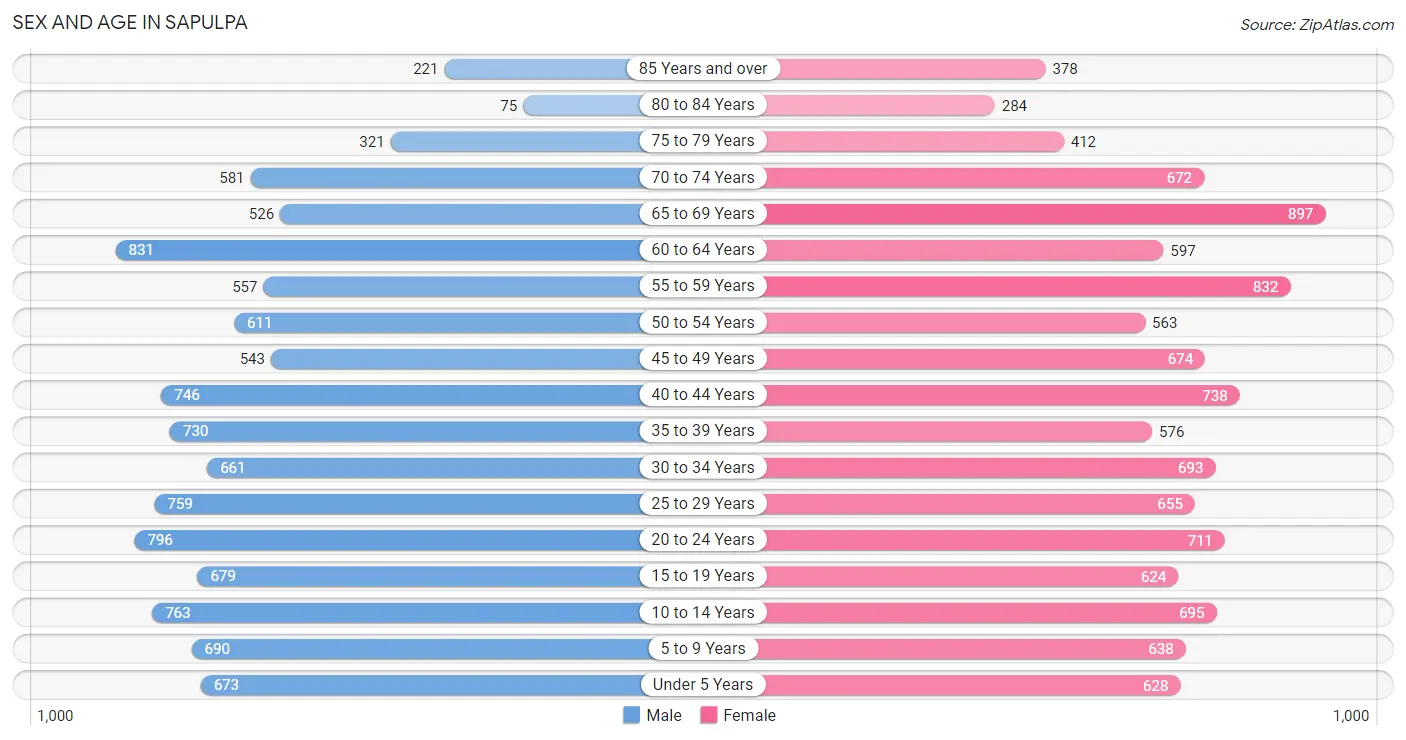
Sex and Age in Sapulpa
Sex and Age in Sapulpa
The most populous age groups in Sapulpa are 60 to 64 Years (831 | 7.7%) for men and 65 to 69 Years (897 | 8.0%) for women.
| Age Bracket | Male | Female |
| Under 5 Years | 673 (6.2%) | 628 (5.6%) |
| 5 to 9 Years | 690 (6.4%) | 638 (5.7%) |
| 10 to 14 Years | 763 (7.1%) | 695 (6.2%) |
| 15 to 19 Years | 679 (6.3%) | 624 (5.5%) |
| 20 to 24 Years | 796 (7.4%) | 711 (6.3%) |
| 25 to 29 Years | 759 (7.0%) | 655 (5.8%) |
| 30 to 34 Years | 661 (6.1%) | 693 (6.1%) |
| 35 to 39 Years | 730 (6.8%) | 576 (5.1%) |
| 40 to 44 Years | 746 (6.9%) | 738 (6.6%) |
| 45 to 49 Years | 543 (5.1%) | 674 (6.0%) |
| 50 to 54 Years | 611 (5.7%) | 563 (5.0%) |
| 55 to 59 Years | 557 (5.2%) | 832 (7.4%) |
| 60 to 64 Years | 831 (7.7%) | 597 (5.3%) |
| 65 to 69 Years | 526 (4.9%) | 897 (8.0%) |
| 70 to 74 Years | 581 (5.4%) | 672 (6.0%) |
| 75 to 79 Years | 321 (3.0%) | 412 (3.7%) |
| 80 to 84 Years | 75 (0.7%) | 284 (2.5%) |
| 85 Years and over | 221 (2.1%) | 378 (3.4%) |
| Total | 10,763 (100.0%) | 11,267 (100.0%) |
Families and Households in Sapulpa
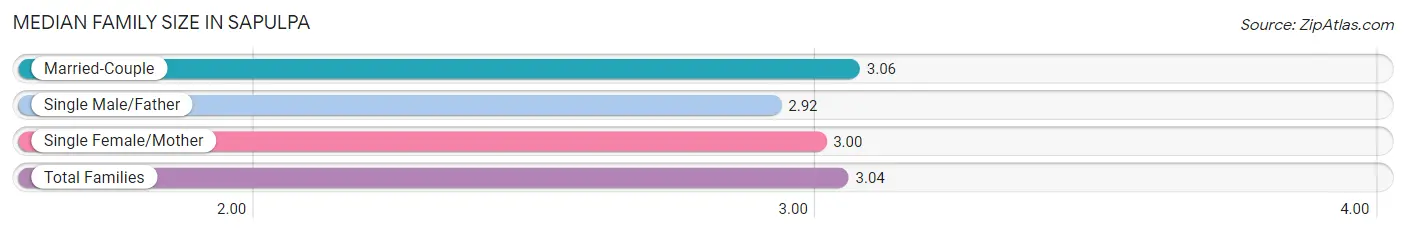
Median Family Size in Sapulpa
The median family size in Sapulpa is 3.04 persons per family, with married-couple families (4,118 | 70.5%) accounting for the largest median family size of 3.06 persons per family. On the other hand, single male/father families (552 | 9.5%) represent the smallest median family size with 2.92 persons per family.
| Family Type | # Families | Family Size |
| Married-Couple | 4,118 (70.5%) | 3.06 |
| Single Male/Father | 552 (9.5%) | 2.92 |
| Single Female/Mother | 1,174 (20.1%) | 3.00 |
| Total Families | 5,844 (100.0%) | 3.04 |
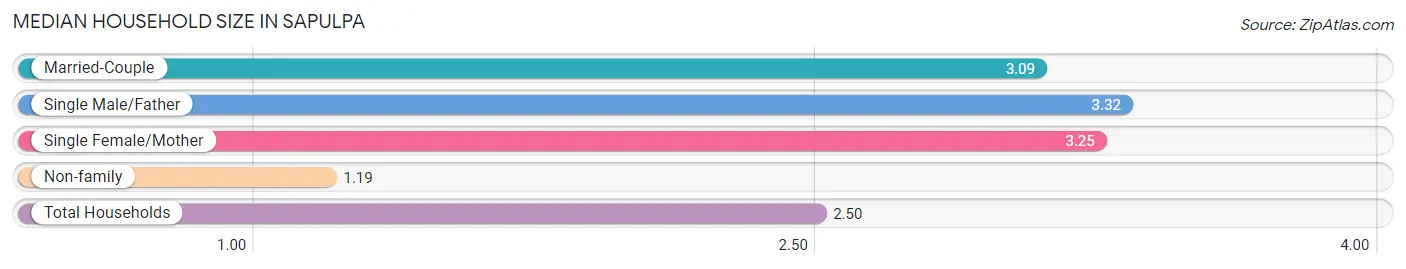
Median Household Size in Sapulpa
The median household size in Sapulpa is 2.50 persons per household, with single male/father households (552 | 6.4%) accounting for the largest median household size of 3.32 persons per household. non-family households (2,853 | 32.8%) represent the smallest median household size with 1.19 persons per household.
| Household Type | # Households | Household Size |
| Married-Couple | 4,118 (47.3%) | 3.09 |
| Single Male/Father | 552 (6.4%) | 3.32 |
| Single Female/Mother | 1,174 (13.5%) | 3.25 |
| Non-family | 2,853 (32.8%) | 1.19 |
| Total Households | 8,697 (100.0%) | 2.50 |
Household Size by Marriage Status in Sapulpa
Out of a total of 8,697 households in Sapulpa, 5,844 (67.2%) are family households, while 2,853 (32.8%) are nonfamily households. The most numerous type of family households are 2-person households, comprising 2,379, and the most common type of nonfamily households are 1-person households, comprising 2,434.
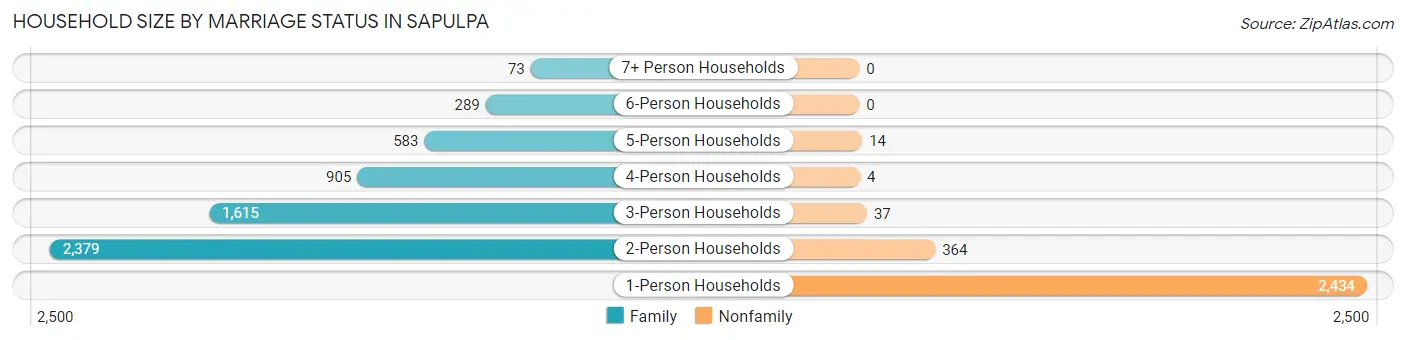
| Household Size | Family Households | Nonfamily Households |
| 1-Person Households | - | 2,434 (28.0%) |
| 2-Person Households | 2,379 (27.4%) | 364 (4.2%) |
| 3-Person Households | 1,615 (18.6%) | 37 (0.4%) |
| 4-Person Households | 905 (10.4%) | 4 (0.1%) |
| 5-Person Households | 583 (6.7%) | 14 (0.2%) |
| 6-Person Households | 289 (3.3%) | 0 (0.0%) |
| 7+ Person Households | 73 (0.8%) | 0 (0.0%) |
| Total | 5,844 (67.2%) | 2,853 (32.8%) |
Female Fertility in Sapulpa
Fertility by Age in Sapulpa
Average fertility rate in Sapulpa is 64.0 births per 1,000 women. Women in the age bracket of 20 to 34 years have the highest fertility rate with 140.0 births per 1,000 women. Women in the age bracket of 20 to 34 years acount for 94.7% of all women with births.
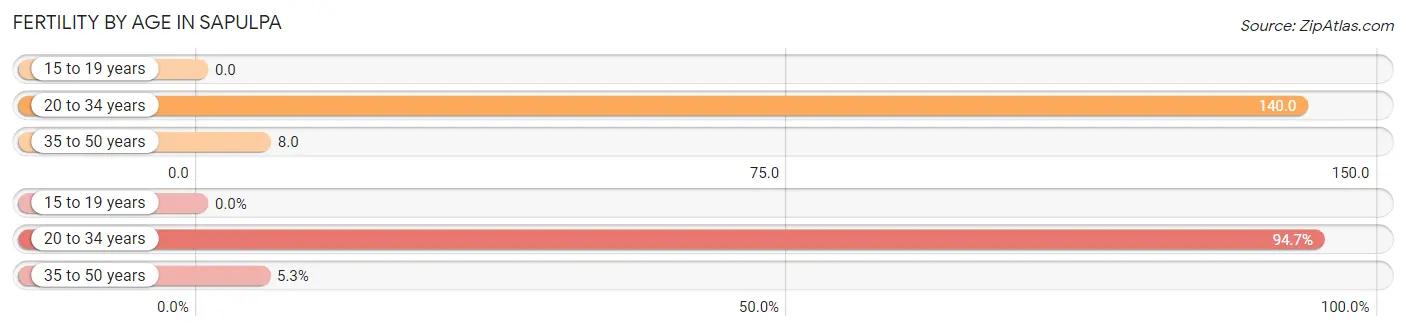
| Age Bracket | Women with Births | Births / 1,000 Women |
| 15 to 19 years | 0 (0.0%) | 0.0 |
| 20 to 34 years | 288 (94.7%) | 140.0 |
| 35 to 50 years | 16 (5.3%) | 8.0 |
| Total | 304 (100.0%) | 64.0 |
Fertility by Age by Marriage Status in Sapulpa
41.4% of women with births (304) in Sapulpa are married. The highest percentage of unmarried women with births falls into 20 to 34 years age bracket with 59.7% of them unmarried at the time of birth, while the lowest percentage of unmarried women with births belong to 35 to 50 years age bracket with 37.5% of them unmarried.
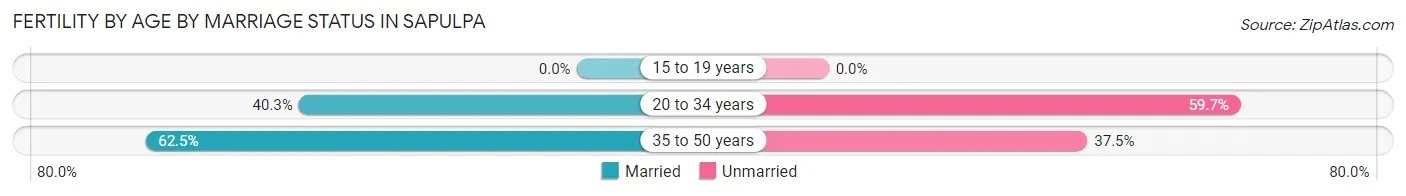
| Age Bracket | Married | Unmarried |
| 15 to 19 years | 0 (0.0%) | 0 (0.0%) |
| 20 to 34 years | 116 (40.3%) | 172 (59.7%) |
| 35 to 50 years | 10 (62.5%) | 6 (37.5%) |
| Total | 126 (41.4%) | 178 (58.6%) |
Fertility by Education in Sapulpa
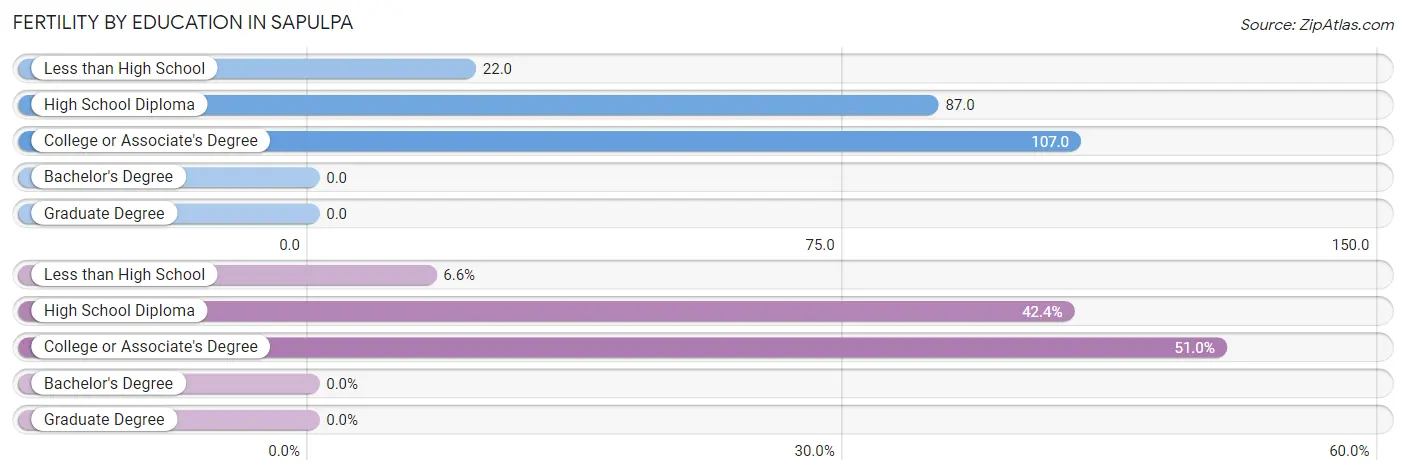
| Educational Attainment | Women with Births | Births / 1,000 Women |
| Less than High School | 20 (6.6%) | 22.0 |
| High School Diploma | 129 (42.4%) | 87.0 |
| College or Associate's Degree | 155 (51.0%) | 107.0 |
| Bachelor's Degree | 0 (0.0%) | 0.0 |
| Graduate Degree | 0 (0.0%) | 0.0 |
| Total | 304 (100.0%) | 64.0 |
Fertility by Education by Marriage Status in Sapulpa
58.6% of women with births in Sapulpa are unmarried. Women with the educational attainment of less than high school are most likely to be married with 100.0% of them married at childbirth, while women with the educational attainment of college or associate's degree are least likely to be married with 67.1% of them unmarried at childbirth.
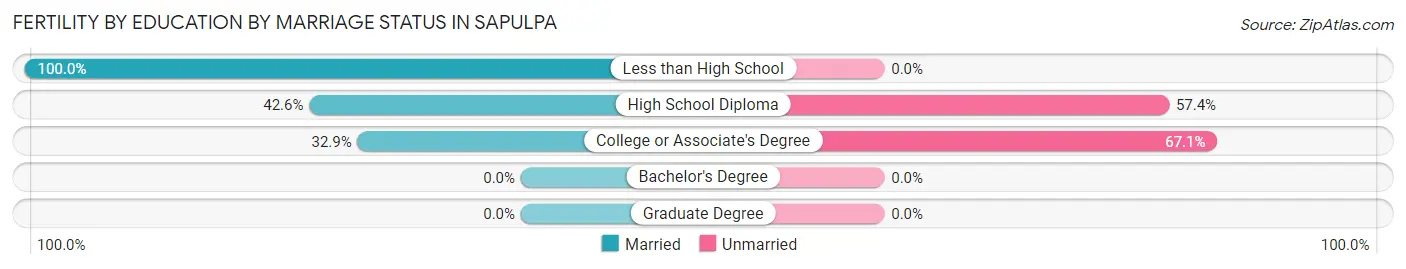
| Educational Attainment | Married | Unmarried |
| Less than High School | 20 (100.0%) | 0 (0.0%) |
| High School Diploma | 55 (42.6%) | 74 (57.4%) |
| College or Associate's Degree | 51 (32.9%) | 104 (67.1%) |
| Bachelor's Degree | 0 (0.0%) | 0 (0.0%) |
| Graduate Degree | 0 (0.0%) | 0 (0.0%) |
| Total | 126 (41.4%) | 178 (58.6%) |
Employment Characteristics in Sapulpa
Employment by Class of Employer in Sapulpa
Among the 9,815 employed individuals in Sapulpa, private company employees (7,427 | 75.7%), not-for-profit organizations (523 | 5.3%), and self-employed (not incorporated) (490 | 5.0%) make up the most common classes of employment.
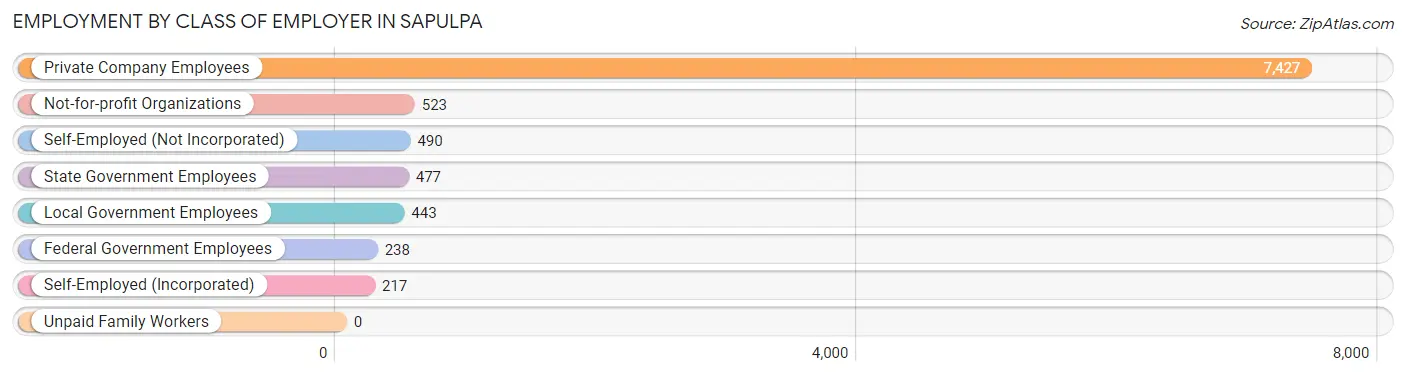
| Employer Class | # Employees | % Employees |
| Private Company Employees | 7,427 | 75.7% |
| Self-Employed (Incorporated) | 217 | 2.2% |
| Self-Employed (Not Incorporated) | 490 | 5.0% |
| Not-for-profit Organizations | 523 | 5.3% |
| Local Government Employees | 443 | 4.5% |
| State Government Employees | 477 | 4.9% |
| Federal Government Employees | 238 | 2.4% |
| Unpaid Family Workers | 0 | 0.0% |
| Total | 9,815 | 100.0% |
Employment Status by Age in Sapulpa
According to the labor force statistics for Sapulpa, out of the total population over 16 years of age (17,700), 58.6% or 10,372 individuals are in the labor force, with 3.3% or 342 of them unemployed. The age group with the highest labor force participation rate is 35 to 44 years, with 82.4% or 2,299 individuals in the labor force. Within the labor force, the 20 to 24 years age range has the highest percentage of unemployed individuals, with 9.0% or 101 of them being unemployed.
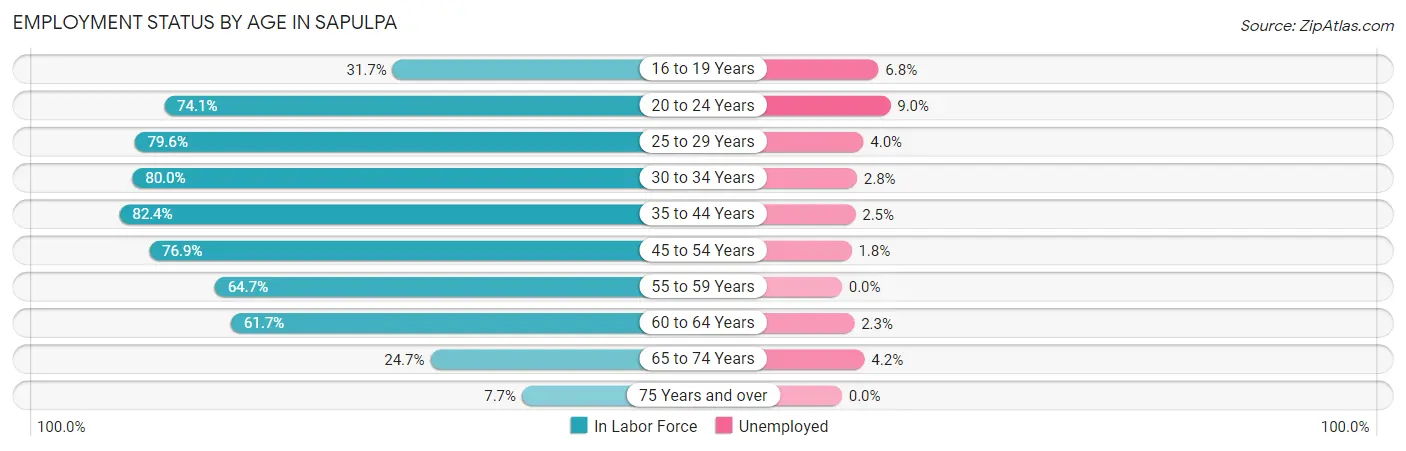
| Age Bracket | In Labor Force | Unemployed |
| 16 to 19 Years | 336 (31.7%) | 23 (6.8%) |
| 20 to 24 Years | 1,117 (74.1%) | 101 (9.0%) |
| 25 to 29 Years | 1,126 (79.6%) | 45 (4.0%) |
| 30 to 34 Years | 1,083 (80.0%) | 30 (2.8%) |
| 35 to 44 Years | 2,299 (82.4%) | 57 (2.5%) |
| 45 to 54 Years | 1,839 (76.9%) | 33 (1.8%) |
| 55 to 59 Years | 899 (64.7%) | 0 (0.0%) |
| 60 to 64 Years | 881 (61.7%) | 20 (2.3%) |
| 65 to 74 Years | 661 (24.7%) | 28 (4.2%) |
| 75 Years and over | 130 (7.7%) | 0 (0.0%) |
| Total | 10,372 (58.6%) | 342 (3.3%) |
Employment Status by Educational Attainment in Sapulpa
According to labor force statistics for Sapulpa, 75.5% of individuals (8,128) out of the total population between 25 and 64 years of age (10,766) are in the labor force, with 2.3% or 187 of them being unemployed. The group with the highest labor force participation rate are those with the educational attainment of bachelor's degree or higher, with 87.1% or 1,916 individuals in the labor force. Within the labor force, individuals with less than high school education have the highest percentage of unemployment, with 8.5% or 47 of them being unemployed.
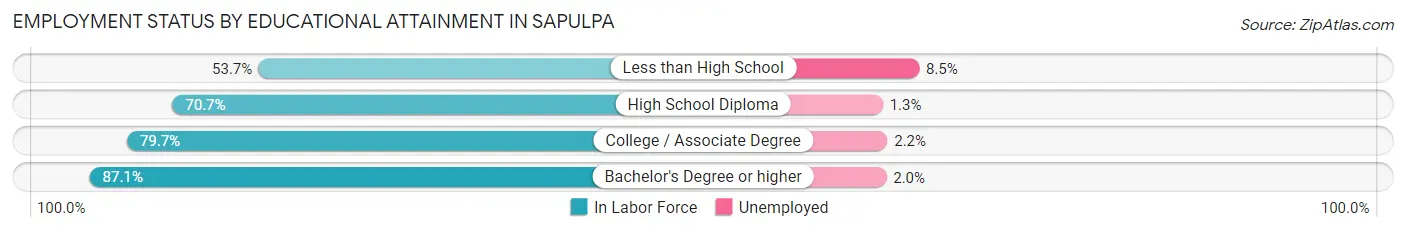
| Educational Attainment | In Labor Force | Unemployed |
| Less than High School | 556 (53.7%) | 88 (8.5%) |
| High School Diploma | 2,750 (70.7%) | 51 (1.3%) |
| College / Associate Degree | 2,903 (79.7%) | 80 (2.2%) |
| Bachelor's Degree or higher | 1,916 (87.1%) | 44 (2.0%) |
| Total | 8,128 (75.5%) | 248 (2.3%) |
Employment Occupations by Sex in Sapulpa
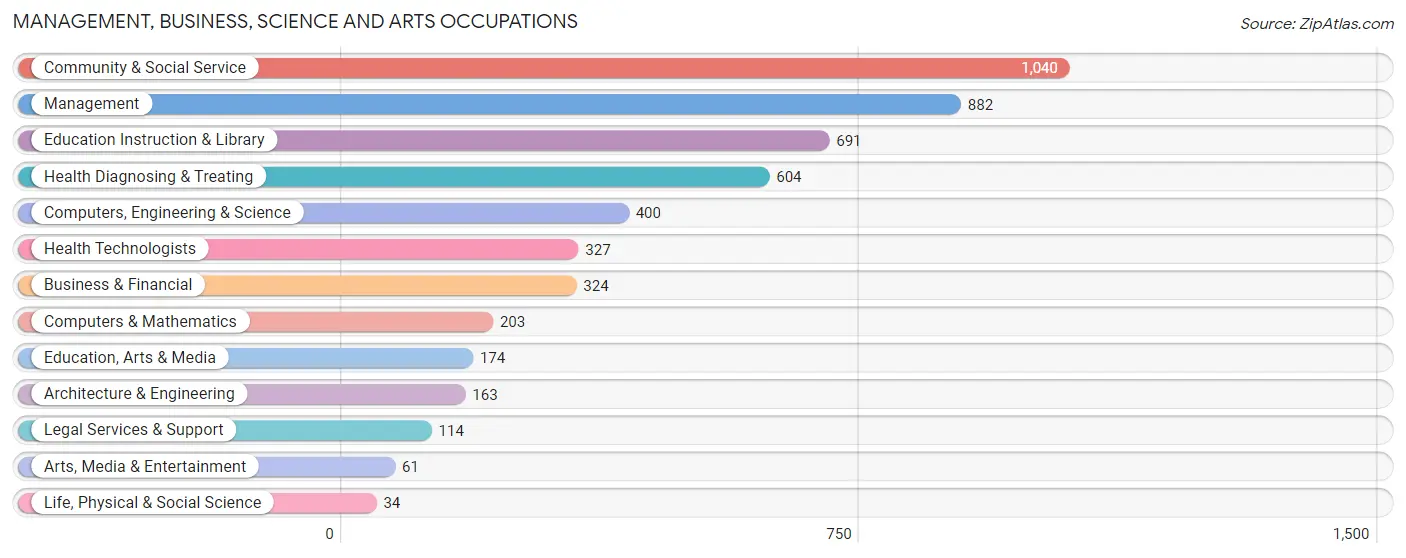
Management, Business, Science and Arts Occupations
The most common Management, Business, Science and Arts occupations in Sapulpa are Community & Social Service (1,040 | 10.4%), Management (882 | 8.8%), Education Instruction & Library (691 | 6.9%), Health Diagnosing & Treating (604 | 6.0%), and Computers, Engineering & Science (400 | 4.0%).
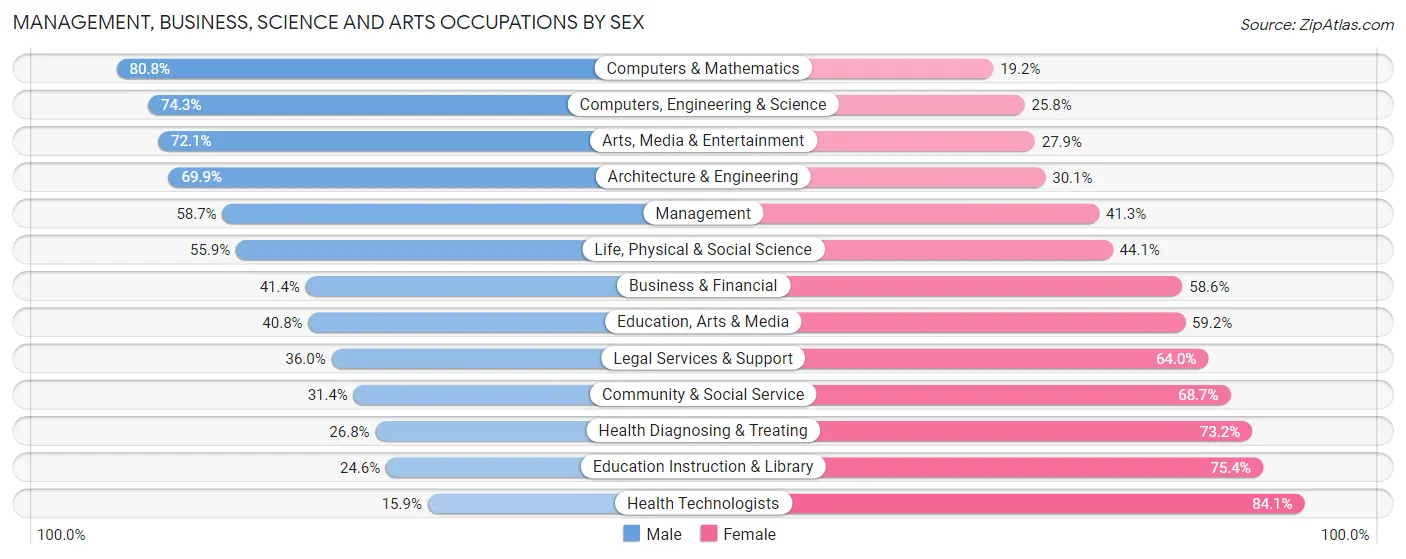
Management, Business, Science and Arts Occupations by Sex
Within the Management, Business, Science and Arts occupations in Sapulpa, the most male-oriented occupations are Computers & Mathematics (80.8%), Computers, Engineering & Science (74.3%), and Arts, Media & Entertainment (72.1%), while the most female-oriented occupations are Health Technologists (84.1%), Education Instruction & Library (75.4%), and Health Diagnosing & Treating (73.2%).
| Occupation | Male | Female |
| Management | 518 (58.7%) | 364 (41.3%) |
| Business & Financial | 134 (41.4%) | 190 (58.6%) |
| Computers, Engineering & Science | 297 (74.3%) | 103 (25.8%) |
| Computers & Mathematics | 164 (80.8%) | 39 (19.2%) |
| Architecture & Engineering | 114 (69.9%) | 49 (30.1%) |
| Life, Physical & Social Science | 19 (55.9%) | 15 (44.1%) |
| Community & Social Service | 326 (31.4%) | 714 (68.6%) |
| Education, Arts & Media | 71 (40.8%) | 103 (59.2%) |
| Legal Services & Support | 41 (36.0%) | 73 (64.0%) |
| Education Instruction & Library | 170 (24.6%) | 521 (75.4%) |
| Arts, Media & Entertainment | 44 (72.1%) | 17 (27.9%) |
| Health Diagnosing & Treating | 162 (26.8%) | 442 (73.2%) |
| Health Technologists | 52 (15.9%) | 275 (84.1%) |
| Total (Category) | 1,437 (44.2%) | 1,813 (55.8%) |
| Total (Overall) | 5,604 (56.0%) | 4,401 (44.0%) |
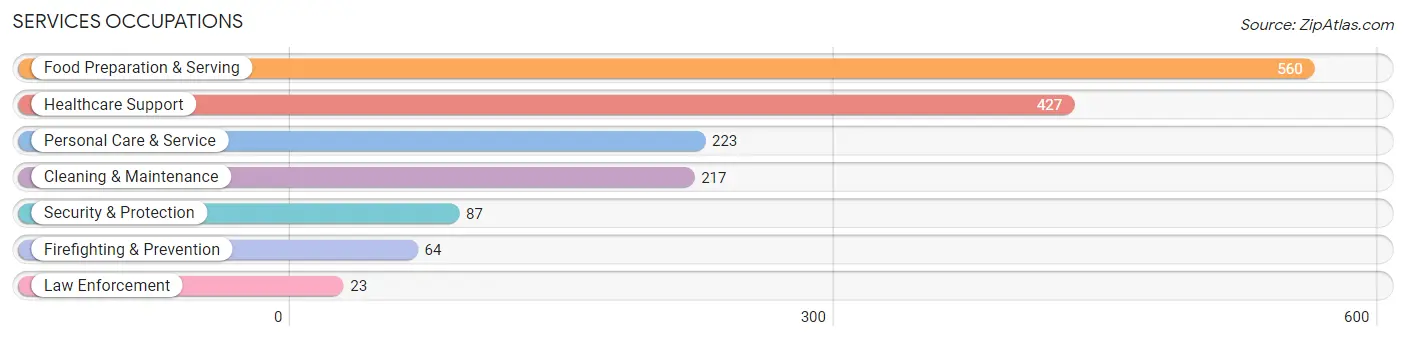
Services Occupations
The most common Services occupations in Sapulpa are Food Preparation & Serving (560 | 5.6%), Healthcare Support (427 | 4.3%), Personal Care & Service (223 | 2.2%), Cleaning & Maintenance (217 | 2.2%), and Security & Protection (87 | 0.9%).
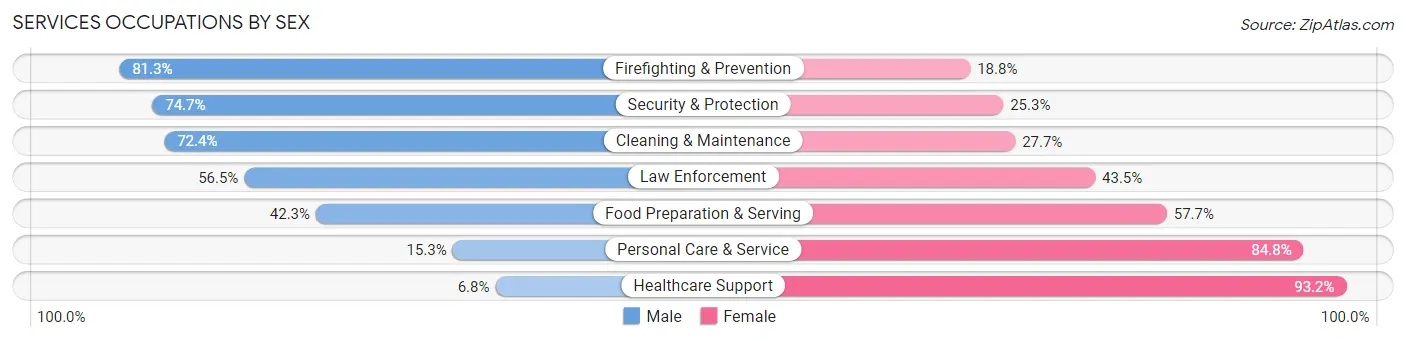
Services Occupations by Sex
Within the Services occupations in Sapulpa, the most male-oriented occupations are Firefighting & Prevention (81.2%), Security & Protection (74.7%), and Cleaning & Maintenance (72.4%), while the most female-oriented occupations are Healthcare Support (93.2%), Personal Care & Service (84.8%), and Food Preparation & Serving (57.7%).
| Occupation | Male | Female |
| Healthcare Support | 29 (6.8%) | 398 (93.2%) |
| Security & Protection | 65 (74.7%) | 22 (25.3%) |
| Firefighting & Prevention | 52 (81.2%) | 12 (18.8%) |
| Law Enforcement | 13 (56.5%) | 10 (43.5%) |
| Food Preparation & Serving | 237 (42.3%) | 323 (57.7%) |
| Cleaning & Maintenance | 157 (72.4%) | 60 (27.7%) |
| Personal Care & Service | 34 (15.2%) | 189 (84.8%) |
| Total (Category) | 522 (34.5%) | 992 (65.5%) |
| Total (Overall) | 5,604 (56.0%) | 4,401 (44.0%) |
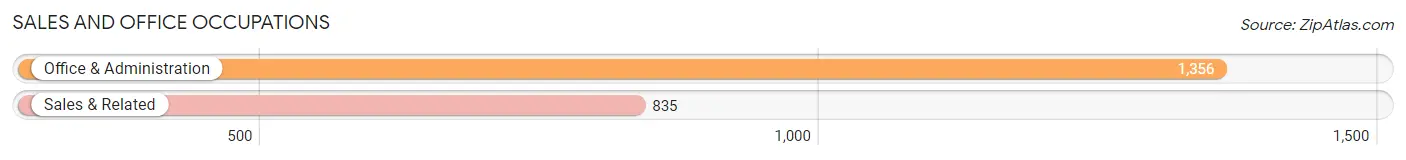
Sales and Office Occupations
The most common Sales and Office occupations in Sapulpa are Office & Administration (1,356 | 13.6%), and Sales & Related (835 | 8.4%).
Sales and Office Occupations by Sex
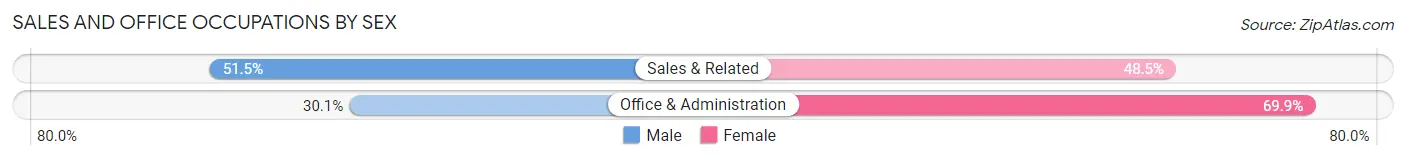
| Occupation | Male | Female |
| Sales & Related | 430 (51.5%) | 405 (48.5%) |
| Office & Administration | 408 (30.1%) | 948 (69.9%) |
| Total (Category) | 838 (38.3%) | 1,353 (61.8%) |
| Total (Overall) | 5,604 (56.0%) | 4,401 (44.0%) |
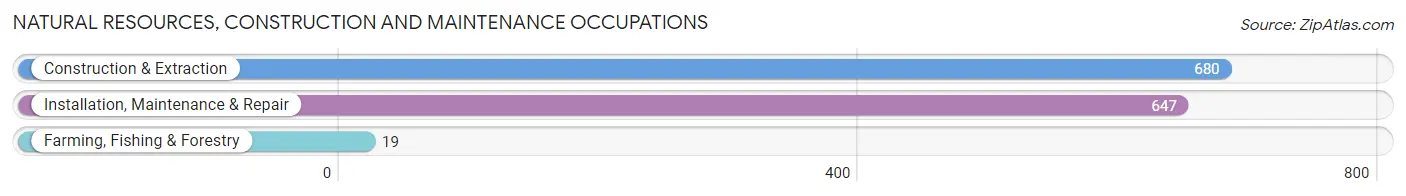
Natural Resources, Construction and Maintenance Occupations
The most common Natural Resources, Construction and Maintenance occupations in Sapulpa are Construction & Extraction (680 | 6.8%), Installation, Maintenance & Repair (647 | 6.5%), and Farming, Fishing & Forestry (19 | 0.2%).
Natural Resources, Construction and Maintenance Occupations by Sex
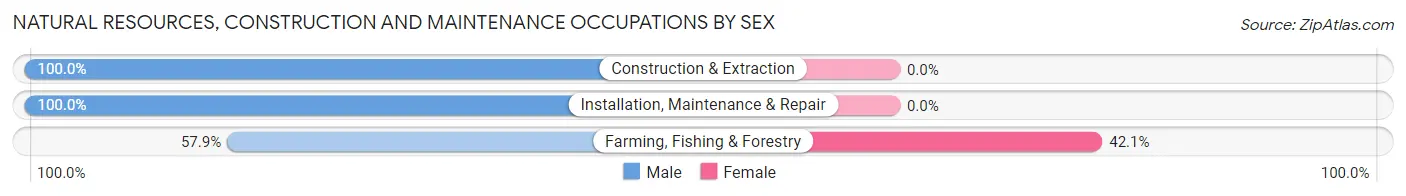
| Occupation | Male | Female |
| Farming, Fishing & Forestry | 11 (57.9%) | 8 (42.1%) |
| Construction & Extraction | 680 (100.0%) | 0 (0.0%) |
| Installation, Maintenance & Repair | 647 (100.0%) | 0 (0.0%) |
| Total (Category) | 1,338 (99.4%) | 8 (0.6%) |
| Total (Overall) | 5,604 (56.0%) | 4,401 (44.0%) |
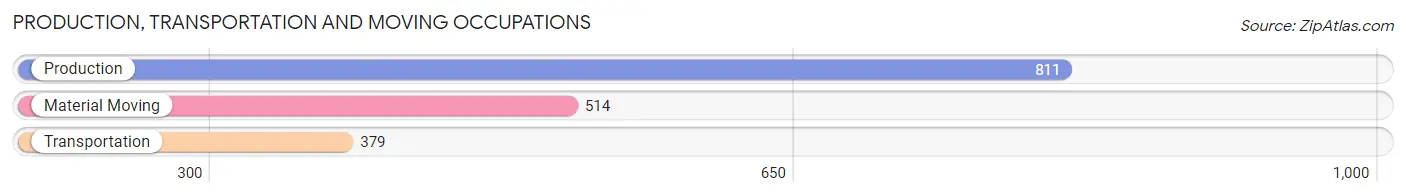
Production, Transportation and Moving Occupations
The most common Production, Transportation and Moving occupations in Sapulpa are Production (811 | 8.1%), Material Moving (514 | 5.1%), and Transportation (379 | 3.8%).
Production, Transportation and Moving Occupations by Sex
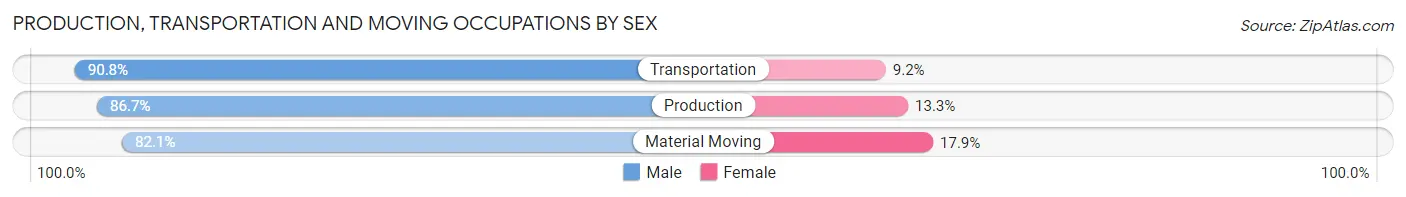
| Occupation | Male | Female |
| Production | 703 (86.7%) | 108 (13.3%) |
| Transportation | 344 (90.8%) | 35 (9.2%) |
| Material Moving | 422 (82.1%) | 92 (17.9%) |
| Total (Category) | 1,469 (86.2%) | 235 (13.8%) |
| Total (Overall) | 5,604 (56.0%) | 4,401 (44.0%) |
Employment Industries by Sex in Sapulpa
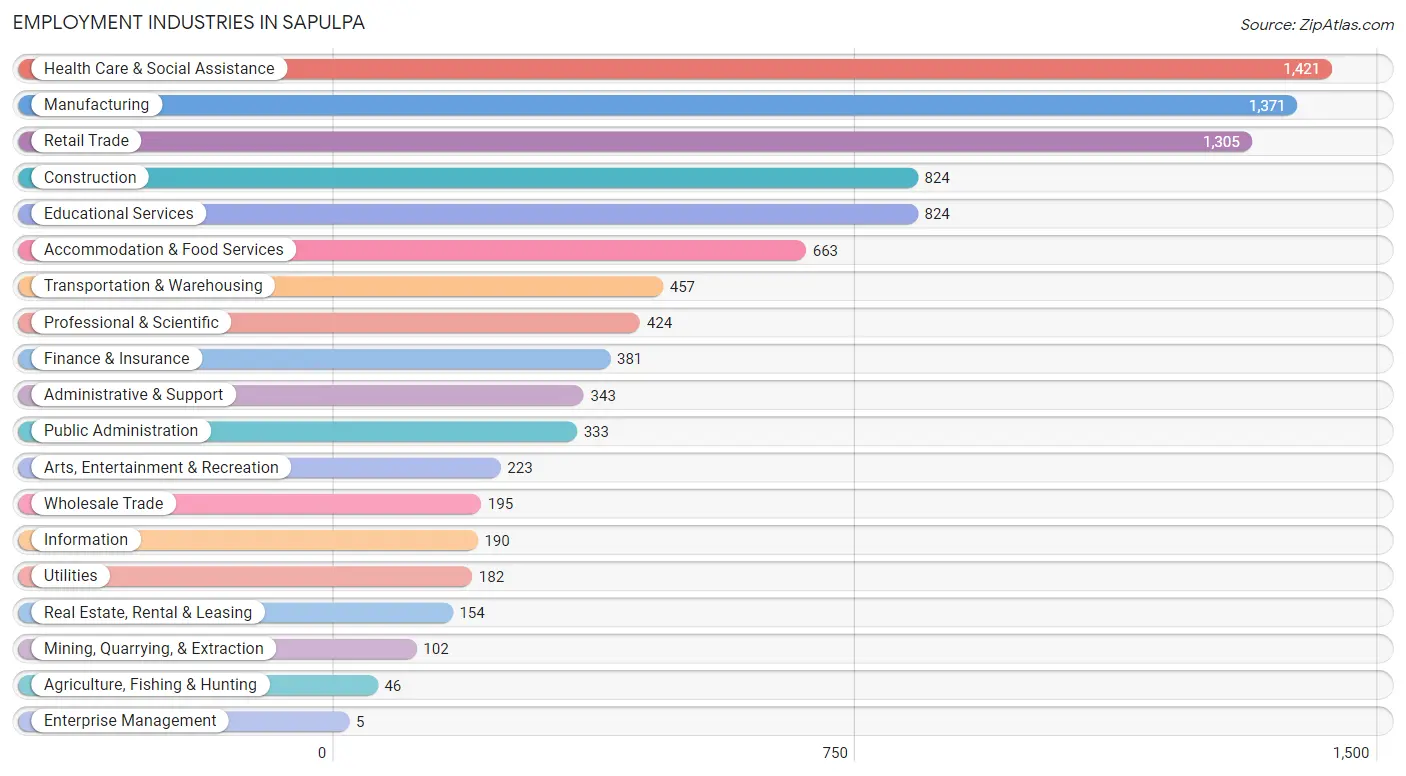
Employment Industries in Sapulpa
The major employment industries in Sapulpa include Health Care & Social Assistance (1,421 | 14.2%), Manufacturing (1,371 | 13.7%), Retail Trade (1,305 | 13.0%), Construction (824 | 8.2%), and Educational Services (824 | 8.2%).
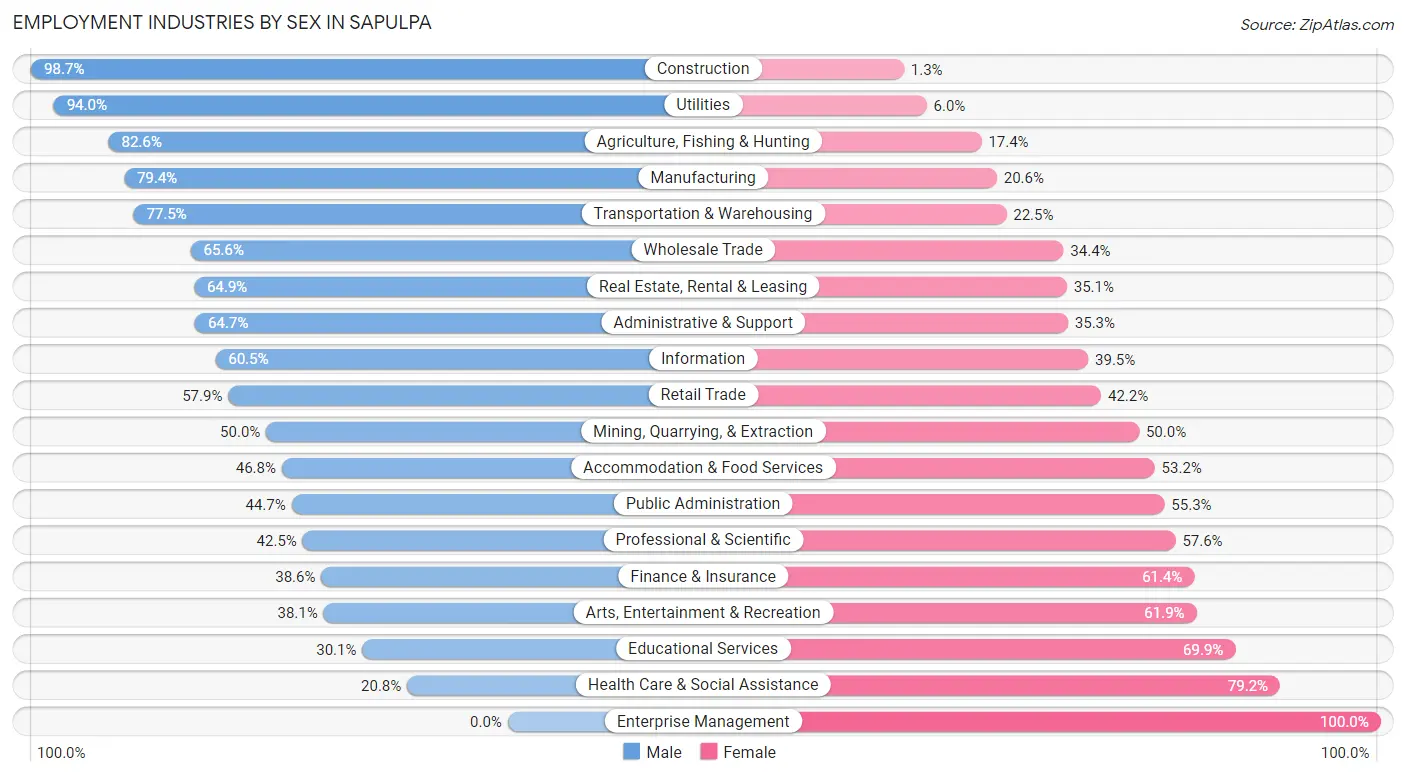
Employment Industries by Sex in Sapulpa
The Sapulpa industries that see more men than women are Construction (98.7%), Utilities (94.0%), and Agriculture, Fishing & Hunting (82.6%), whereas the industries that tend to have a higher number of women are Enterprise Management (100.0%), Health Care & Social Assistance (79.2%), and Educational Services (69.9%).
| Industry | Male | Female |
| Agriculture, Fishing & Hunting | 38 (82.6%) | 8 (17.4%) |
| Mining, Quarrying, & Extraction | 51 (50.0%) | 51 (50.0%) |
| Construction | 813 (98.7%) | 11 (1.3%) |
| Manufacturing | 1,089 (79.4%) | 282 (20.6%) |
| Wholesale Trade | 128 (65.6%) | 67 (34.4%) |
| Retail Trade | 755 (57.9%) | 550 (42.1%) |
| Transportation & Warehousing | 354 (77.5%) | 103 (22.5%) |
| Utilities | 171 (94.0%) | 11 (6.0%) |
| Information | 115 (60.5%) | 75 (39.5%) |
| Finance & Insurance | 147 (38.6%) | 234 (61.4%) |
| Real Estate, Rental & Leasing | 100 (64.9%) | 54 (35.1%) |
| Professional & Scientific | 180 (42.4%) | 244 (57.6%) |
| Enterprise Management | 0 (0.0%) | 5 (100.0%) |
| Administrative & Support | 222 (64.7%) | 121 (35.3%) |
| Educational Services | 248 (30.1%) | 576 (69.9%) |
| Health Care & Social Assistance | 296 (20.8%) | 1,125 (79.2%) |
| Arts, Entertainment & Recreation | 85 (38.1%) | 138 (61.9%) |
| Accommodation & Food Services | 310 (46.8%) | 353 (53.2%) |
| Public Administration | 149 (44.7%) | 184 (55.3%) |
| Total | 5,604 (56.0%) | 4,401 (44.0%) |
Education in Sapulpa
School Enrollment in Sapulpa
The most common levels of schooling among the 4,618 students in Sapulpa are elementary school (1,162 | 25.2%), high school (1,135 | 24.6%), and middle school (994 | 21.5%).
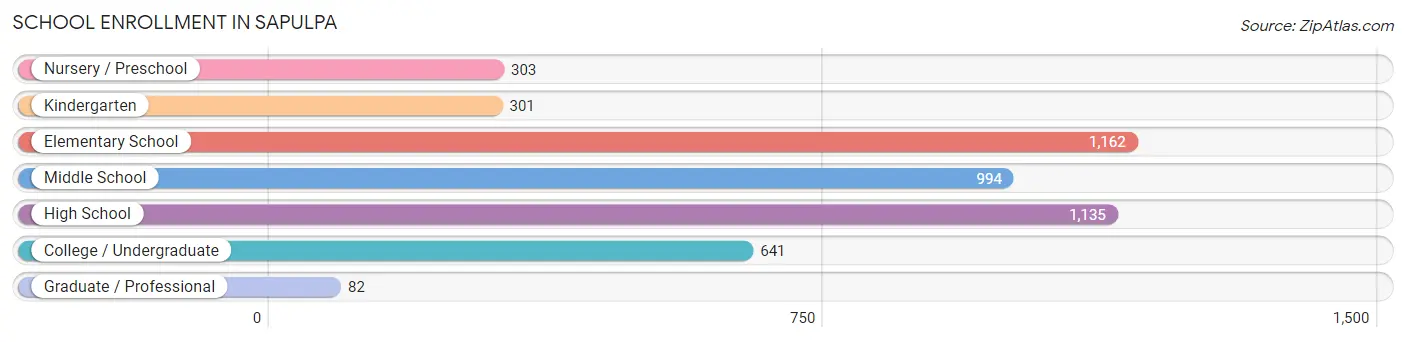
| School Level | # Students | % Students |
| Nursery / Preschool | 303 | 6.6% |
| Kindergarten | 301 | 6.5% |
| Elementary School | 1,162 | 25.2% |
| Middle School | 994 | 21.5% |
| High School | 1,135 | 24.6% |
| College / Undergraduate | 641 | 13.9% |
| Graduate / Professional | 82 | 1.8% |
| Total | 4,618 | 100.0% |
School Enrollment by Age by Funding Source in Sapulpa
Out of a total of 4,618 students who are enrolled in schools in Sapulpa, 429 (9.3%) attend a private institution, while the remaining 4,189 (90.7%) are enrolled in public schools. The age group of 20 to 24 year olds has the highest likelihood of being enrolled in private schools, with 103 (38.3% in the age bracket) enrolled. Conversely, the age group of 18 to 19 year olds has the lowest likelihood of being enrolled in a private school, with 295 (94.9% in the age bracket) attending a public institution.
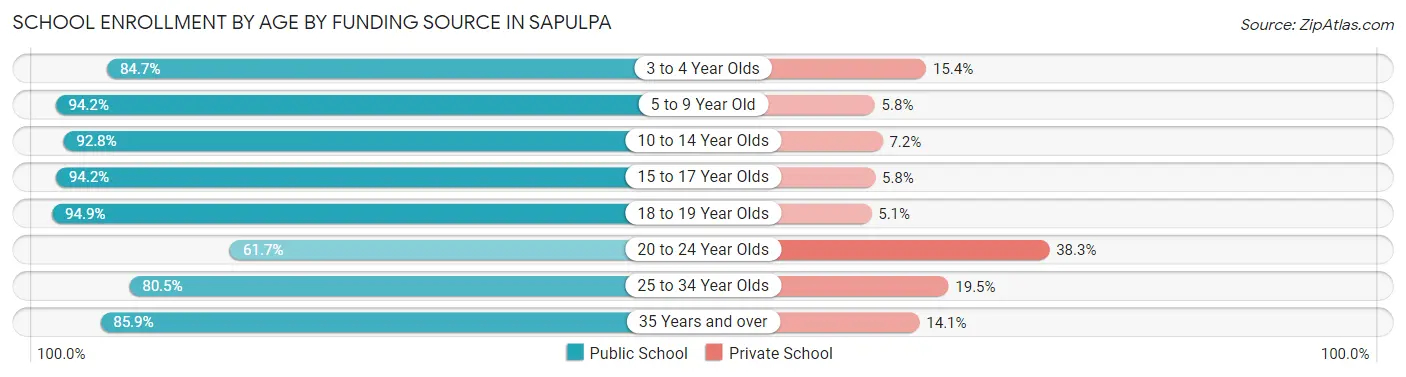
| Age Bracket | Public School | Private School |
| 3 to 4 Year Olds | 182 (84.7%) | 33 (15.3%) |
| 5 to 9 Year Old | 1,208 (94.2%) | 74 (5.8%) |
| 10 to 14 Year Olds | 1,334 (92.8%) | 104 (7.2%) |
| 15 to 17 Year Olds | 742 (94.2%) | 46 (5.8%) |
| 18 to 19 Year Olds | 295 (94.9%) | 16 (5.1%) |
| 20 to 24 Year Olds | 166 (61.7%) | 103 (38.3%) |
| 25 to 34 Year Olds | 128 (80.5%) | 31 (19.5%) |
| 35 Years and over | 134 (85.9%) | 22 (14.1%) |
| Total | 4,189 (90.7%) | 429 (9.3%) |
Educational Attainment by Field of Study in Sapulpa
Business (739 | 22.5%), education (687 | 20.9%), science & technology (473 | 14.4%), psychology (165 | 5.0%), and liberal arts & history (164 | 5.0%) are the most common fields of study among 3,286 individuals in Sapulpa who have obtained a bachelor's degree or higher.
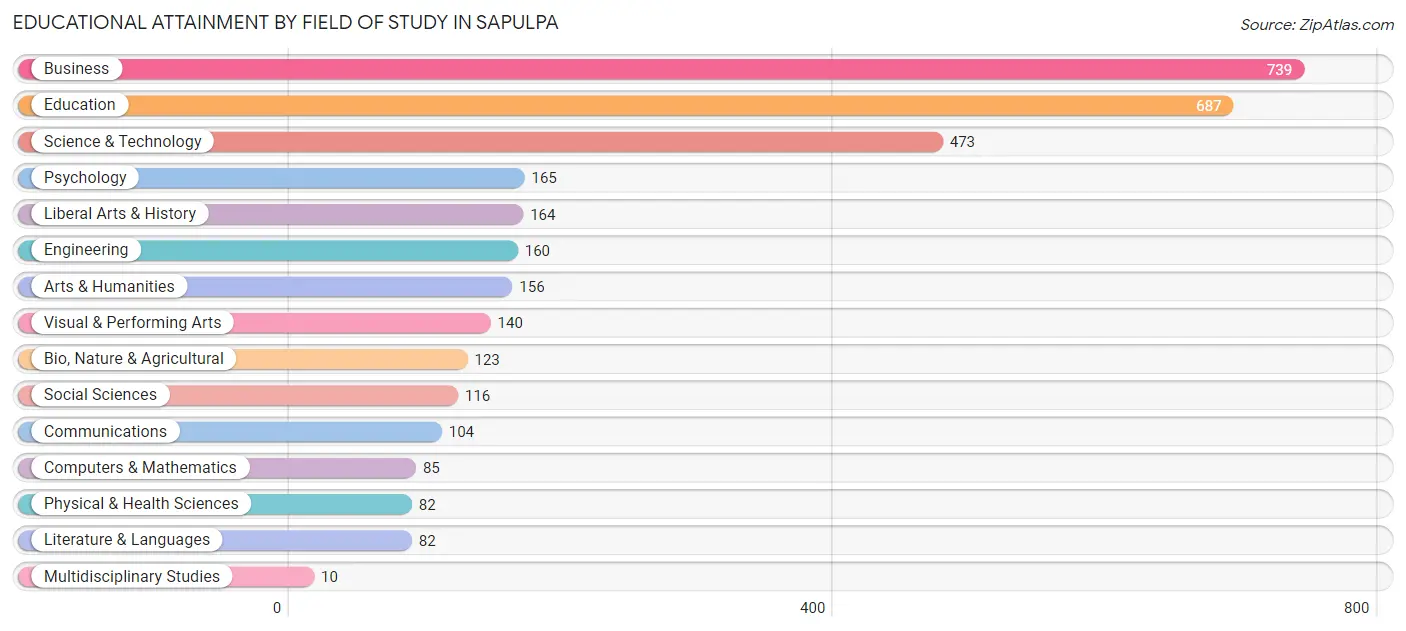
| Field of Study | # Graduates | % Graduates |
| Computers & Mathematics | 85 | 2.6% |
| Bio, Nature & Agricultural | 123 | 3.7% |
| Physical & Health Sciences | 82 | 2.5% |
| Psychology | 165 | 5.0% |
| Social Sciences | 116 | 3.5% |
| Engineering | 160 | 4.9% |
| Multidisciplinary Studies | 10 | 0.3% |
| Science & Technology | 473 | 14.4% |
| Business | 739 | 22.5% |
| Education | 687 | 20.9% |
| Literature & Languages | 82 | 2.5% |
| Liberal Arts & History | 164 | 5.0% |
| Visual & Performing Arts | 140 | 4.3% |
| Communications | 104 | 3.2% |
| Arts & Humanities | 156 | 4.8% |
| Total | 3,286 | 100.0% |
Transportation & Commute in Sapulpa
Vehicle Availability by Sex in Sapulpa
The most prevalent vehicle ownership categories in Sapulpa are males with 2 vehicles (2,643, accounting for 47.7%) and females with 2 vehicles (1,893, making up 61.9%).
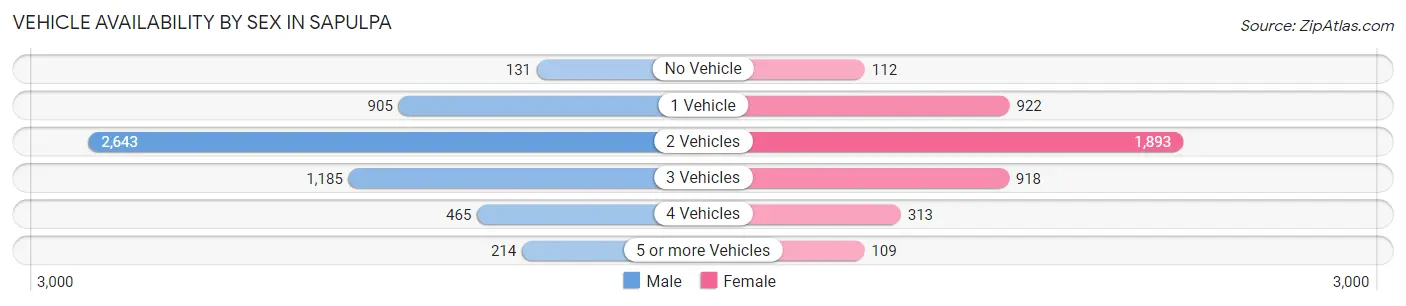
| Vehicles Available | Male | Female |
| No Vehicle | 131 (2.4%) | 112 (2.6%) |
| 1 Vehicle | 905 (16.3%) | 922 (21.6%) |
| 2 Vehicles | 2,643 (47.7%) | 1,893 (44.4%) |
| 3 Vehicles | 1,185 (21.4%) | 918 (21.5%) |
| 4 Vehicles | 465 (8.4%) | 313 (7.3%) |
| 5 or more Vehicles | 214 (3.9%) | 109 (2.5%) |
| Total | 5,543 (100.0%) | 4,267 (100.0%) |
Commute Time in Sapulpa
The most frequently occuring commute durations in Sapulpa are 30 to 34 minutes (2,305 commuters, 25.1%), 20 to 24 minutes (1,534 commuters, 16.7%), and 10 to 14 minutes (1,127 commuters, 12.3%).
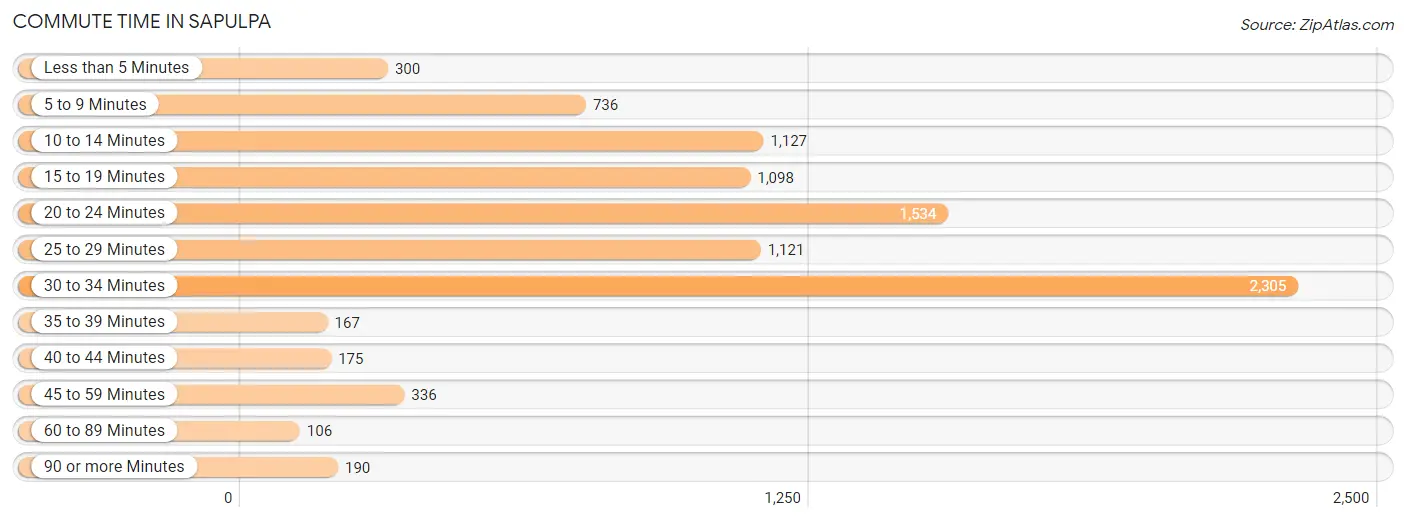
| Commute Time | # Commuters | % Commuters |
| Less than 5 Minutes | 300 | 3.3% |
| 5 to 9 Minutes | 736 | 8.0% |
| 10 to 14 Minutes | 1,127 | 12.3% |
| 15 to 19 Minutes | 1,098 | 11.9% |
| 20 to 24 Minutes | 1,534 | 16.7% |
| 25 to 29 Minutes | 1,121 | 12.2% |
| 30 to 34 Minutes | 2,305 | 25.1% |
| 35 to 39 Minutes | 167 | 1.8% |
| 40 to 44 Minutes | 175 | 1.9% |
| 45 to 59 Minutes | 336 | 3.6% |
| 60 to 89 Minutes | 106 | 1.1% |
| 90 or more Minutes | 190 | 2.1% |
Commute Time by Sex in Sapulpa
The most common commute times in Sapulpa are 30 to 34 minutes (1,338 commuters, 25.4%) for males and 30 to 34 minutes (967 commuters, 24.7%) for females.
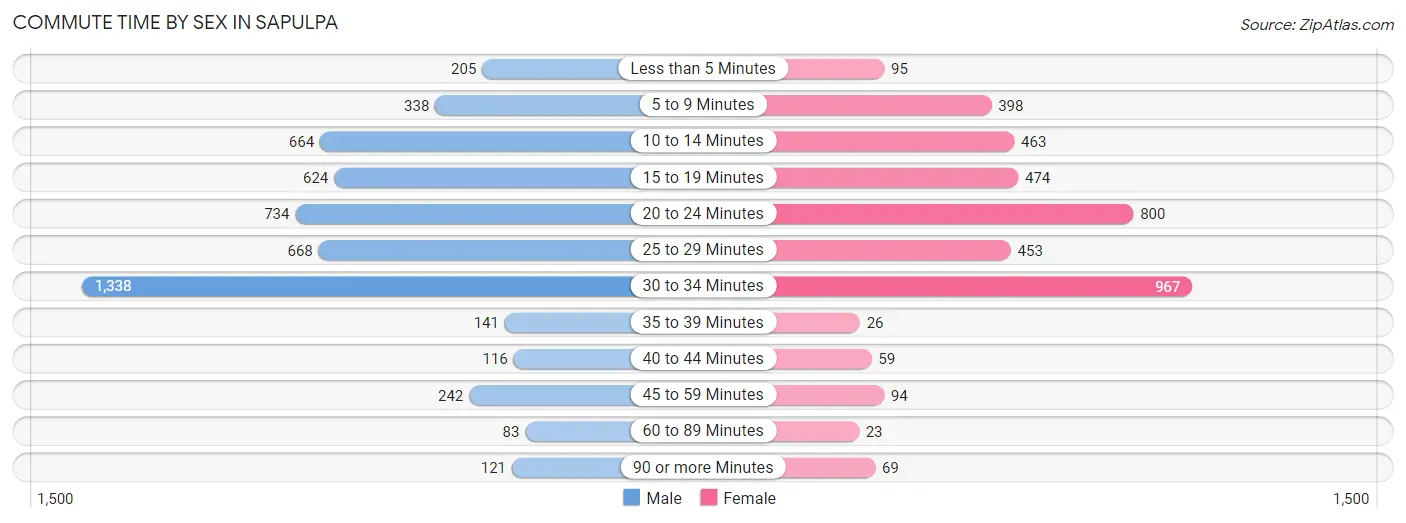
| Commute Time | Male | Female |
| Less than 5 Minutes | 205 (3.9%) | 95 (2.4%) |
| 5 to 9 Minutes | 338 (6.4%) | 398 (10.2%) |
| 10 to 14 Minutes | 664 (12.6%) | 463 (11.8%) |
| 15 to 19 Minutes | 624 (11.8%) | 474 (12.1%) |
| 20 to 24 Minutes | 734 (13.9%) | 800 (20.4%) |
| 25 to 29 Minutes | 668 (12.7%) | 453 (11.6%) |
| 30 to 34 Minutes | 1,338 (25.4%) | 967 (24.7%) |
| 35 to 39 Minutes | 141 (2.7%) | 26 (0.7%) |
| 40 to 44 Minutes | 116 (2.2%) | 59 (1.5%) |
| 45 to 59 Minutes | 242 (4.6%) | 94 (2.4%) |
| 60 to 89 Minutes | 83 (1.6%) | 23 (0.6%) |
| 90 or more Minutes | 121 (2.3%) | 69 (1.8%) |
Time of Departure to Work by Sex in Sapulpa
The most frequent times of departure to work in Sapulpa are 7:00 AM to 7:29 AM (795, 15.1%) for males and 7:00 AM to 7:29 AM (777, 19.8%) for females.
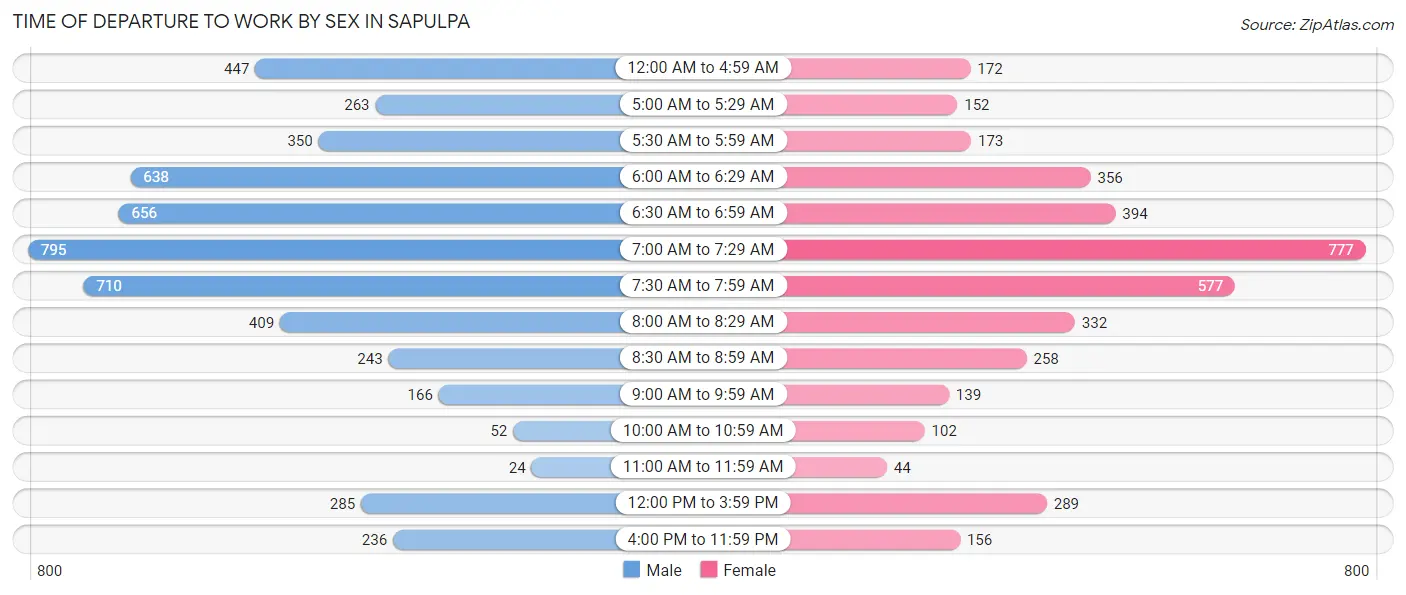
| Time of Departure | Male | Female |
| 12:00 AM to 4:59 AM | 447 (8.5%) | 172 (4.4%) |
| 5:00 AM to 5:29 AM | 263 (5.0%) | 152 (3.9%) |
| 5:30 AM to 5:59 AM | 350 (6.6%) | 173 (4.4%) |
| 6:00 AM to 6:29 AM | 638 (12.1%) | 356 (9.1%) |
| 6:30 AM to 6:59 AM | 656 (12.4%) | 394 (10.1%) |
| 7:00 AM to 7:29 AM | 795 (15.1%) | 777 (19.8%) |
| 7:30 AM to 7:59 AM | 710 (13.5%) | 577 (14.7%) |
| 8:00 AM to 8:29 AM | 409 (7.8%) | 332 (8.5%) |
| 8:30 AM to 8:59 AM | 243 (4.6%) | 258 (6.6%) |
| 9:00 AM to 9:59 AM | 166 (3.2%) | 139 (3.5%) |
| 10:00 AM to 10:59 AM | 52 (1.0%) | 102 (2.6%) |
| 11:00 AM to 11:59 AM | 24 (0.5%) | 44 (1.1%) |
| 12:00 PM to 3:59 PM | 285 (5.4%) | 289 (7.4%) |
| 4:00 PM to 11:59 PM | 236 (4.5%) | 156 (4.0%) |
| Total | 5,274 (100.0%) | 3,921 (100.0%) |
Housing Occupancy in Sapulpa
Occupancy by Ownership in Sapulpa
Of the total 8,697 dwellings in Sapulpa, owner-occupied units account for 6,039 (69.4%), while renter-occupied units make up 2,658 (30.6%).
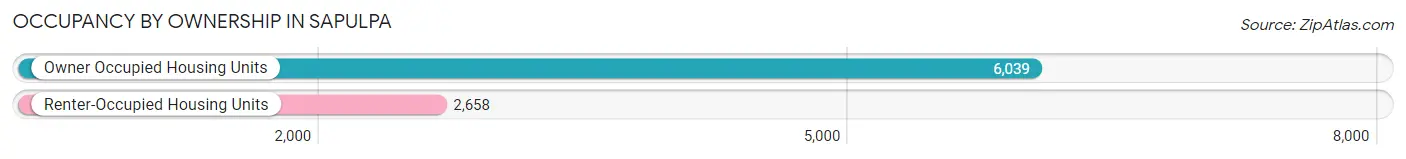
| Occupancy | # Housing Units | % Housing Units |
| Owner Occupied Housing Units | 6,039 | 69.4% |
| Renter-Occupied Housing Units | 2,658 | 30.6% |
| Total Occupied Housing Units | 8,697 | 100.0% |
Occupancy by Household Size in Sapulpa
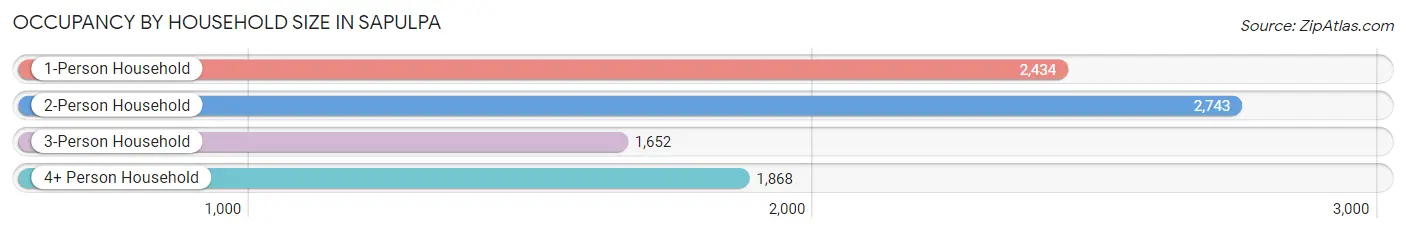
| Household Size | # Housing Units | % Housing Units |
| 1-Person Household | 2,434 | 28.0% |
| 2-Person Household | 2,743 | 31.5% |
| 3-Person Household | 1,652 | 19.0% |
| 4+ Person Household | 1,868 | 21.5% |
| Total Housing Units | 8,697 | 100.0% |
Occupancy by Ownership by Household Size in Sapulpa
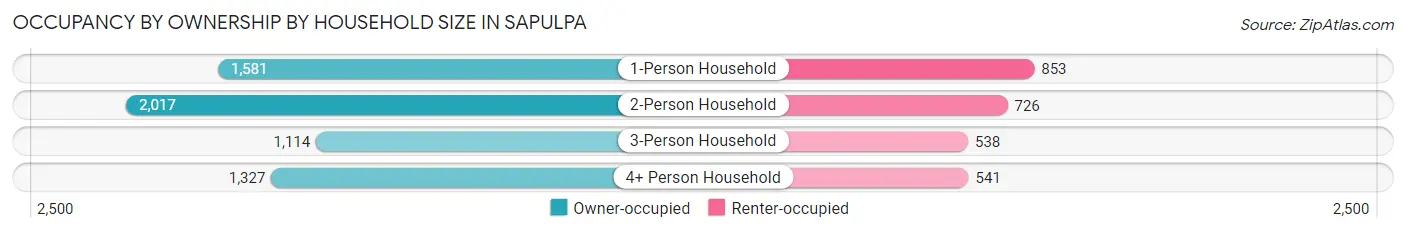
| Household Size | Owner-occupied | Renter-occupied |
| 1-Person Household | 1,581 (64.9%) | 853 (35.0%) |
| 2-Person Household | 2,017 (73.5%) | 726 (26.5%) |
| 3-Person Household | 1,114 (67.4%) | 538 (32.6%) |
| 4+ Person Household | 1,327 (71.0%) | 541 (29.0%) |
| Total Housing Units | 6,039 (69.4%) | 2,658 (30.6%) |
Occupancy by Educational Attainment in Sapulpa
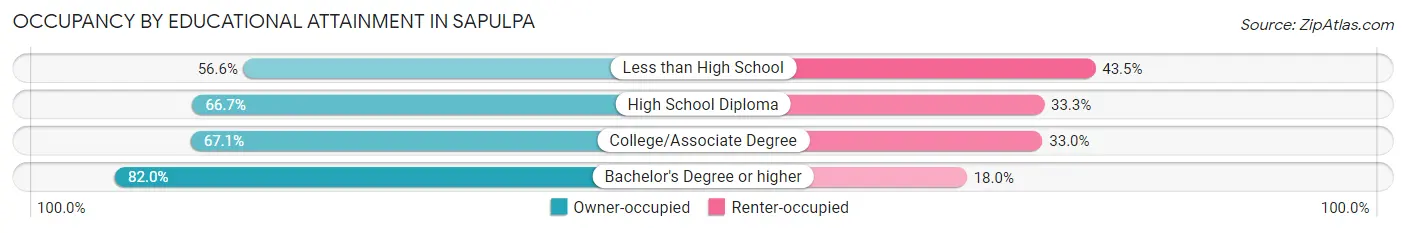
| Household Size | Owner-occupied | Renter-occupied |
| Less than High School | 380 (56.6%) | 292 (43.4%) |
| High School Diploma | 2,110 (66.7%) | 1,053 (33.3%) |
| College/Associate Degree | 1,968 (67.0%) | 967 (33.0%) |
| Bachelor's Degree or higher | 1,581 (82.0%) | 346 (18.0%) |
Occupancy by Age of Householder in Sapulpa
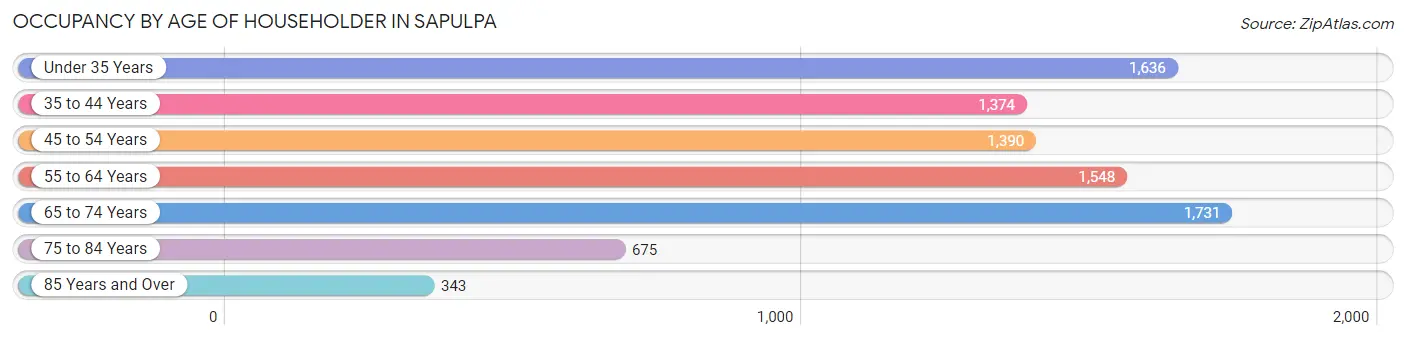
| Age Bracket | # Households | % Households |
| Under 35 Years | 1,636 | 18.8% |
| 35 to 44 Years | 1,374 | 15.8% |
| 45 to 54 Years | 1,390 | 16.0% |
| 55 to 64 Years | 1,548 | 17.8% |
| 65 to 74 Years | 1,731 | 19.9% |
| 75 to 84 Years | 675 | 7.8% |
| 85 Years and Over | 343 | 3.9% |
| Total | 8,697 | 100.0% |
Housing Finances in Sapulpa
Median Income by Occupancy in Sapulpa
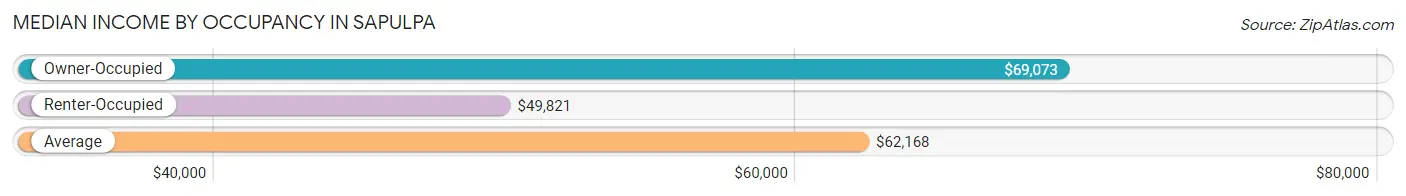
| Occupancy Type | # Households | Median Income |
| Owner-Occupied | 6,039 (69.4%) | $69,073 |
| Renter-Occupied | 2,658 (30.6%) | $49,821 |
| Average | 8,697 (100.0%) | $62,168 |
Occupancy by Householder Income Bracket in Sapulpa
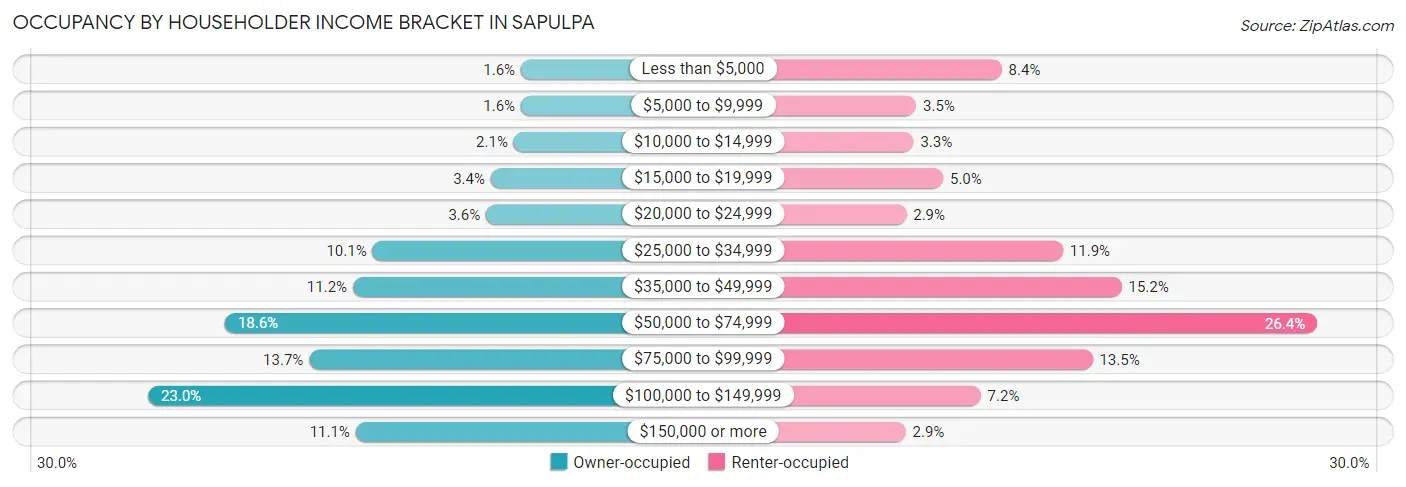
| Income Bracket | Owner-occupied | Renter-occupied |
| Less than $5,000 | 99 (1.6%) | 222 (8.4%) |
| $5,000 to $9,999 | 99 (1.6%) | 92 (3.5%) |
| $10,000 to $14,999 | 124 (2.1%) | 88 (3.3%) |
| $15,000 to $19,999 | 203 (3.4%) | 133 (5.0%) |
| $20,000 to $24,999 | 219 (3.6%) | 77 (2.9%) |
| $25,000 to $34,999 | 611 (10.1%) | 315 (11.8%) |
| $35,000 to $49,999 | 679 (11.2%) | 404 (15.2%) |
| $50,000 to $74,999 | 1,120 (18.5%) | 701 (26.4%) |
| $75,000 to $99,999 | 830 (13.7%) | 360 (13.5%) |
| $100,000 to $149,999 | 1,386 (23.0%) | 190 (7.1%) |
| $150,000 or more | 669 (11.1%) | 76 (2.9%) |
| Total | 6,039 (100.0%) | 2,658 (100.0%) |
Monthly Housing Cost Tiers in Sapulpa
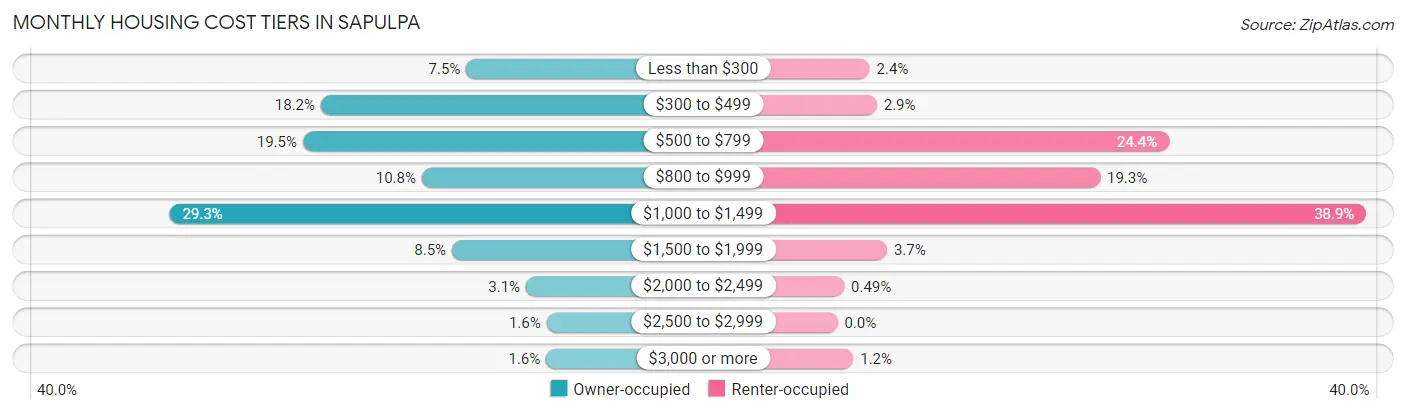
| Monthly Cost | Owner-occupied | Renter-occupied |
| Less than $300 | 452 (7.5%) | 63 (2.4%) |
| $300 to $499 | 1,098 (18.2%) | 77 (2.9%) |
| $500 to $799 | 1,178 (19.5%) | 649 (24.4%) |
| $800 to $999 | 649 (10.7%) | 514 (19.3%) |
| $1,000 to $1,499 | 1,771 (29.3%) | 1,035 (38.9%) |
| $1,500 to $1,999 | 515 (8.5%) | 97 (3.6%) |
| $2,000 to $2,499 | 186 (3.1%) | 13 (0.5%) |
| $2,500 to $2,999 | 94 (1.6%) | 0 (0.0%) |
| $3,000 or more | 96 (1.6%) | 31 (1.2%) |
| Total | 6,039 (100.0%) | 2,658 (100.0%) |
Physical Housing Characteristics in Sapulpa
Housing Structures in Sapulpa
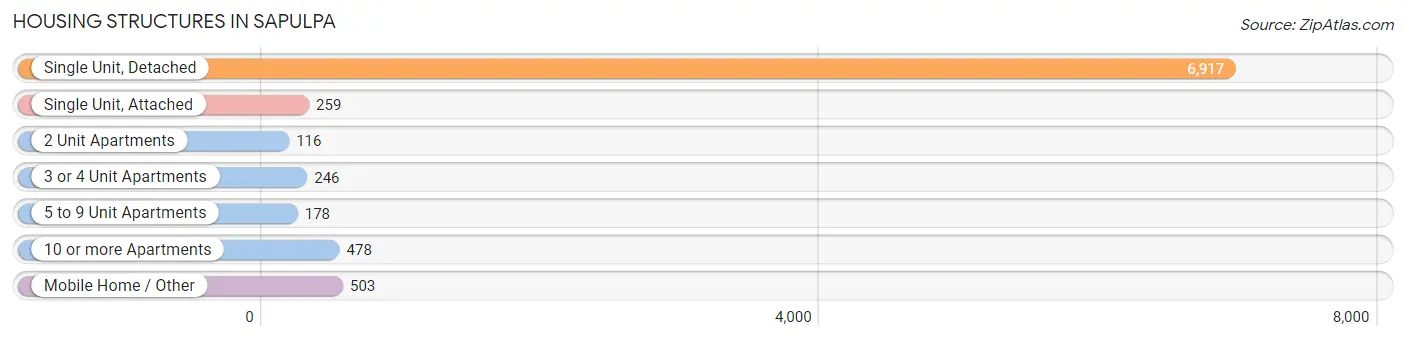
| Structure Type | # Housing Units | % Housing Units |
| Single Unit, Detached | 6,917 | 79.5% |
| Single Unit, Attached | 259 | 3.0% |
| 2 Unit Apartments | 116 | 1.3% |
| 3 or 4 Unit Apartments | 246 | 2.8% |
| 5 to 9 Unit Apartments | 178 | 2.1% |
| 10 or more Apartments | 478 | 5.5% |
| Mobile Home / Other | 503 | 5.8% |
| Total | 8,697 | 100.0% |
Housing Structures by Occupancy in Sapulpa
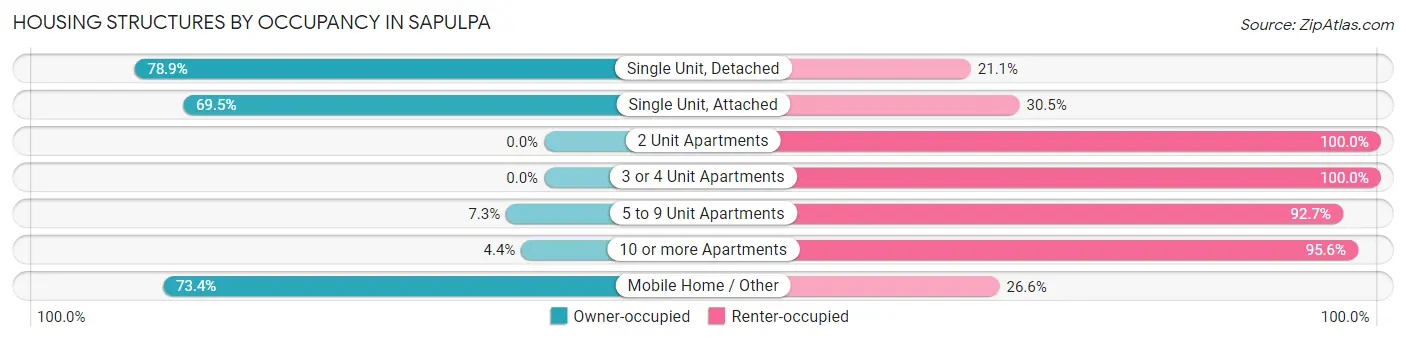
| Structure Type | Owner-occupied | Renter-occupied |
| Single Unit, Detached | 5,456 (78.9%) | 1,461 (21.1%) |
| Single Unit, Attached | 180 (69.5%) | 79 (30.5%) |
| 2 Unit Apartments | 0 (0.0%) | 116 (100.0%) |
| 3 or 4 Unit Apartments | 0 (0.0%) | 246 (100.0%) |
| 5 to 9 Unit Apartments | 13 (7.3%) | 165 (92.7%) |
| 10 or more Apartments | 21 (4.4%) | 457 (95.6%) |
| Mobile Home / Other | 369 (73.4%) | 134 (26.6%) |
| Total | 6,039 (69.4%) | 2,658 (30.6%) |
Housing Structures by Number of Rooms in Sapulpa
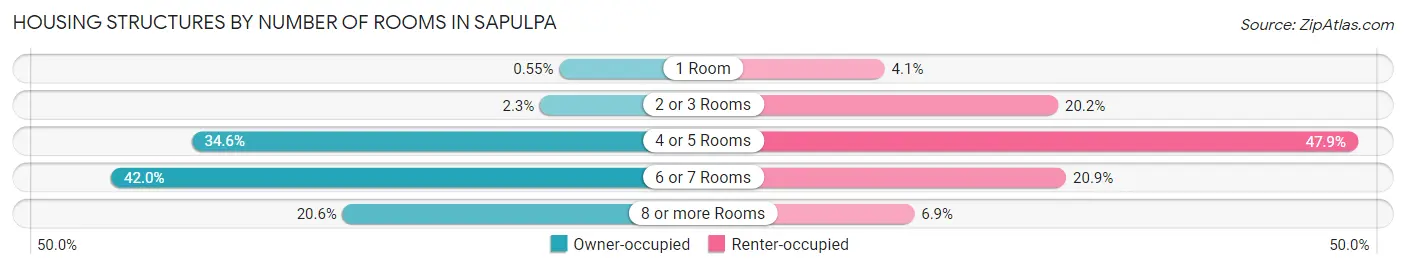
| Number of Rooms | Owner-occupied | Renter-occupied |
| 1 Room | 33 (0.5%) | 110 (4.1%) |
| 2 or 3 Rooms | 140 (2.3%) | 536 (20.2%) |
| 4 or 5 Rooms | 2,087 (34.6%) | 1,273 (47.9%) |
| 6 or 7 Rooms | 2,536 (42.0%) | 556 (20.9%) |
| 8 or more Rooms | 1,243 (20.6%) | 183 (6.9%) |
| Total | 6,039 (100.0%) | 2,658 (100.0%) |
Housing Structure by Heating Type in Sapulpa
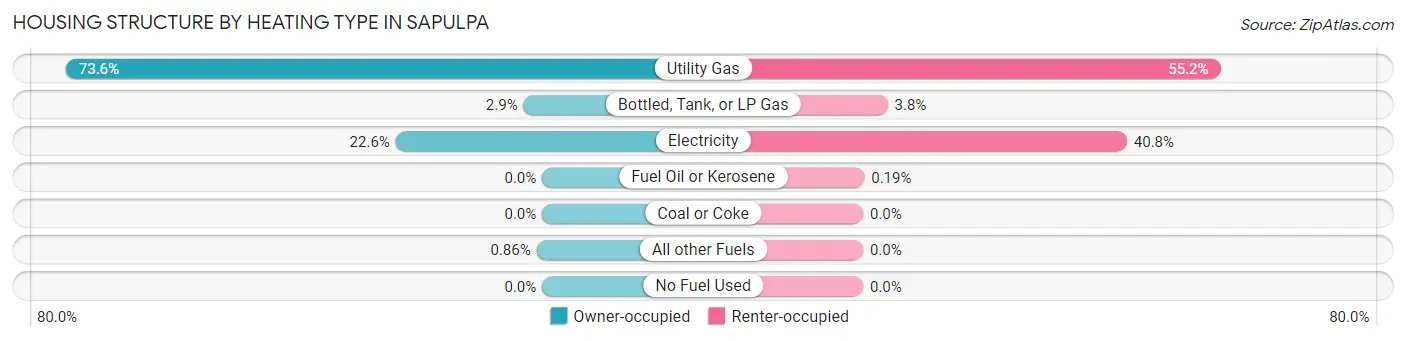
| Heating Type | Owner-occupied | Renter-occupied |
| Utility Gas | 4,446 (73.6%) | 1,468 (55.2%) |
| Bottled, Tank, or LP Gas | 174 (2.9%) | 101 (3.8%) |
| Electricity | 1,367 (22.6%) | 1,084 (40.8%) |
| Fuel Oil or Kerosene | 0 (0.0%) | 5 (0.2%) |
| Coal or Coke | 0 (0.0%) | 0 (0.0%) |
| All other Fuels | 52 (0.9%) | 0 (0.0%) |
| No Fuel Used | 0 (0.0%) | 0 (0.0%) |
| Total | 6,039 (100.0%) | 2,658 (100.0%) |
Household Vehicle Usage in Sapulpa
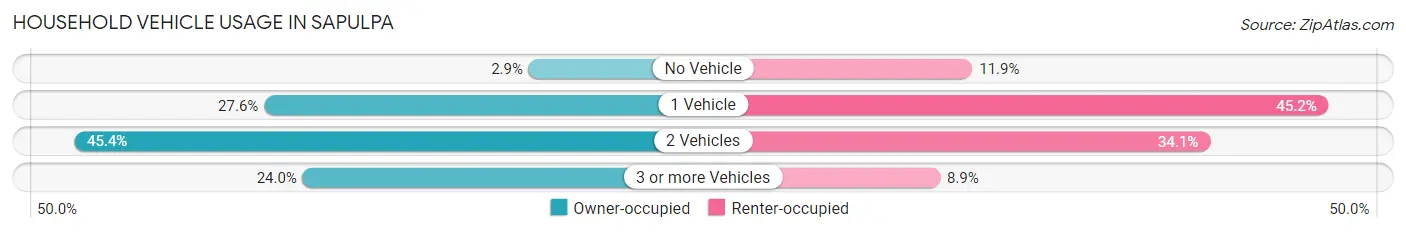
| Vehicles per Household | Owner-occupied | Renter-occupied |
| No Vehicle | 177 (2.9%) | 316 (11.9%) |
| 1 Vehicle | 1,669 (27.6%) | 1,200 (45.2%) |
| 2 Vehicles | 2,741 (45.4%) | 906 (34.1%) |
| 3 or more Vehicles | 1,452 (24.0%) | 236 (8.9%) |
| Total | 6,039 (100.0%) | 2,658 (100.0%) |
Real Estate & Mortgages in Sapulpa
Real Estate and Mortgage Overview in Sapulpa
| Characteristic | Without Mortgage | With Mortgage |
| Housing Units | 2,492 | 3,547 |
| Median Property Value | $124,200 | $157,800 |
| Median Household Income | $51,632 | $564 |
| Monthly Housing Costs | $454 | $96 |
| Real Estate Taxes | $1,041 | $213 |
Property Value by Mortgage Status in Sapulpa
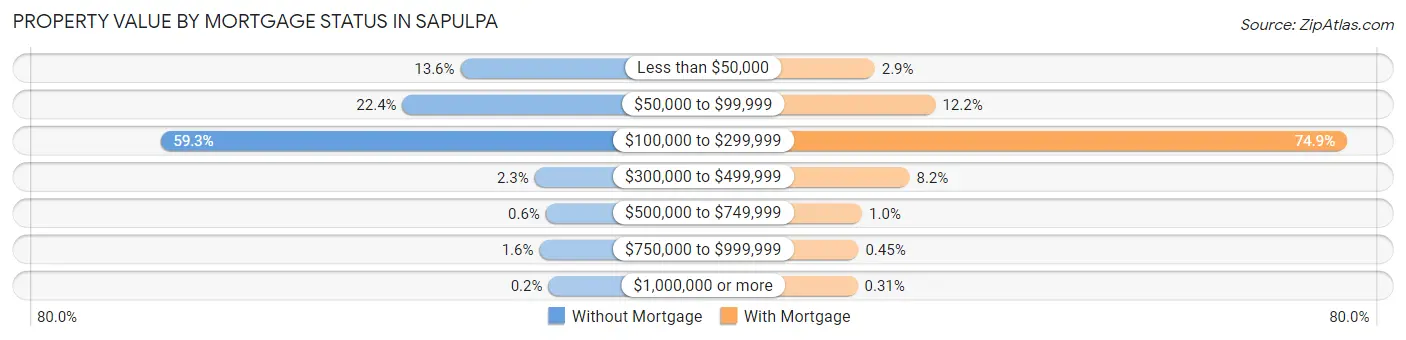
| Property Value | Without Mortgage | With Mortgage |
| Less than $50,000 | 339 (13.6%) | 104 (2.9%) |
| $50,000 to $99,999 | 559 (22.4%) | 432 (12.2%) |
| $100,000 to $299,999 | 1,478 (59.3%) | 2,656 (74.9%) |
| $300,000 to $499,999 | 57 (2.3%) | 292 (8.2%) |
| $500,000 to $749,999 | 15 (0.6%) | 36 (1.0%) |
| $750,000 to $999,999 | 39 (1.6%) | 16 (0.4%) |
| $1,000,000 or more | 5 (0.2%) | 11 (0.3%) |
| Total | 2,492 (100.0%) | 3,547 (100.0%) |
Household Income by Mortgage Status in Sapulpa
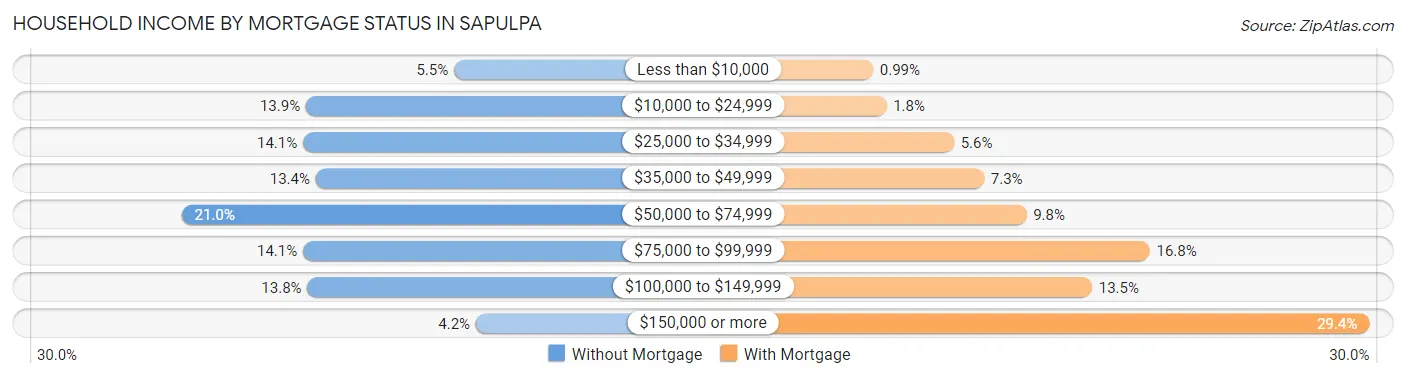
| Household Income | Without Mortgage | With Mortgage |
| Less than $10,000 | 136 (5.5%) | 35 (1.0%) |
| $10,000 to $24,999 | 347 (13.9%) | 62 (1.8%) |
| $25,000 to $34,999 | 351 (14.1%) | 199 (5.6%) |
| $35,000 to $49,999 | 333 (13.4%) | 260 (7.3%) |
| $50,000 to $74,999 | 524 (21.0%) | 346 (9.8%) |
| $75,000 to $99,999 | 351 (14.1%) | 596 (16.8%) |
| $100,000 to $149,999 | 345 (13.8%) | 479 (13.5%) |
| $150,000 or more | 105 (4.2%) | 1,041 (29.3%) |
| Total | 2,492 (100.0%) | 3,547 (100.0%) |
Property Value to Household Income Ratio in Sapulpa
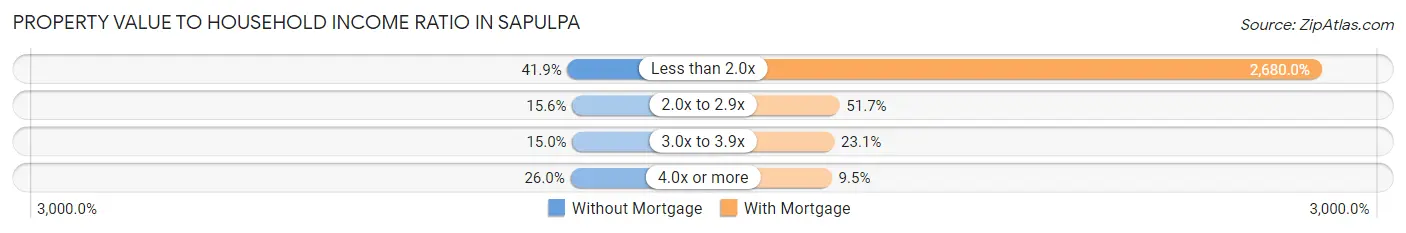
| Value-to-Income Ratio | Without Mortgage | With Mortgage |
| Less than 2.0x | 1,045 (41.9%) | 95,060 (2,680.0%) |
| 2.0x to 2.9x | 388 (15.6%) | 1,835 (51.7%) |
| 3.0x to 3.9x | 374 (15.0%) | 818 (23.1%) |
| 4.0x or more | 647 (26.0%) | 336 (9.5%) |
| Total | 2,492 (100.0%) | 3,547 (100.0%) |
Real Estate Taxes by Mortgage Status in Sapulpa
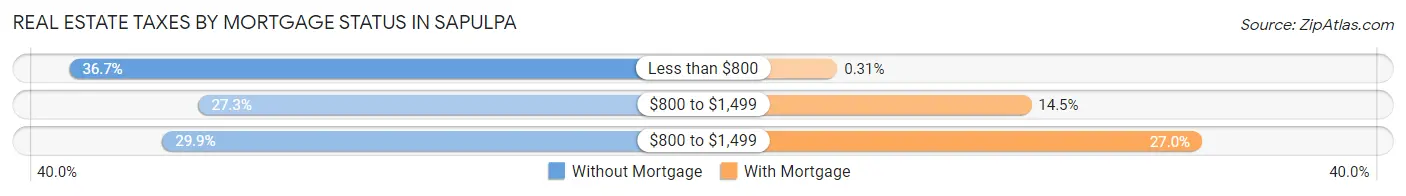
| Property Taxes | Without Mortgage | With Mortgage |
| Less than $800 | 915 (36.7%) | 11 (0.3%) |
| $800 to $1,499 | 680 (27.3%) | 514 (14.5%) |
| $800 to $1,499 | 746 (29.9%) | 956 (27.0%) |
| Total | 2,492 (100.0%) | 3,547 (100.0%) |
Health & Disability in Sapulpa
Health Insurance Coverage by Age in Sapulpa
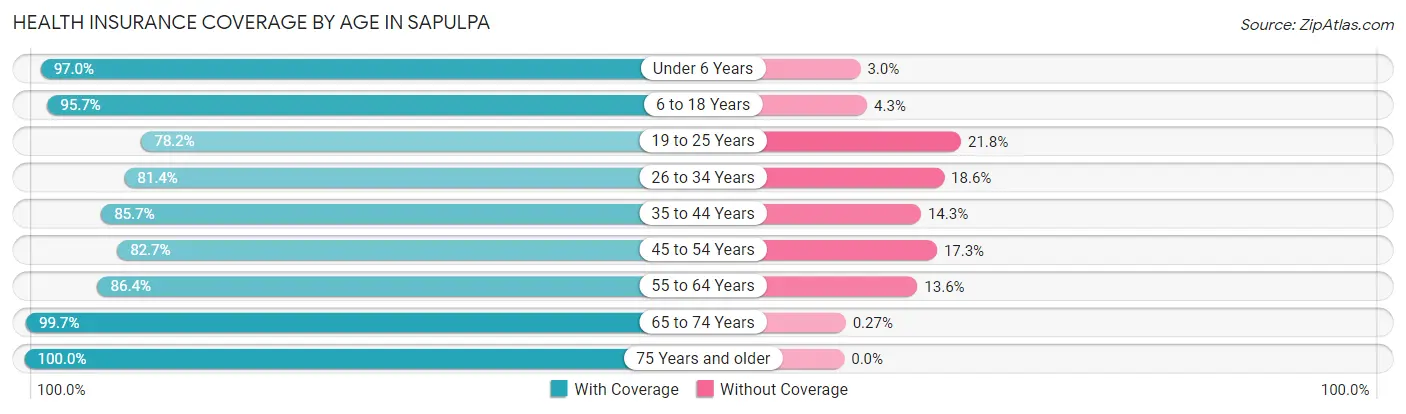
| Age Bracket | With Coverage | Without Coverage |
| Under 6 Years | 1,579 (97.0%) | 49 (3.0%) |
| 6 to 18 Years | 3,375 (95.7%) | 150 (4.3%) |
| 19 to 25 Years | 1,534 (78.2%) | 427 (21.8%) |
| 26 to 34 Years | 2,037 (81.4%) | 466 (18.6%) |
| 35 to 44 Years | 2,391 (85.7%) | 399 (14.3%) |
| 45 to 54 Years | 1,968 (82.7%) | 411 (17.3%) |
| 55 to 64 Years | 2,383 (86.4%) | 376 (13.6%) |
| 65 to 74 Years | 2,594 (99.7%) | 7 (0.3%) |
| 75 Years and older | 1,579 (100.0%) | 0 (0.0%) |
| Total | 19,440 (89.5%) | 2,285 (10.5%) |
Health Insurance Coverage by Citizenship Status in Sapulpa
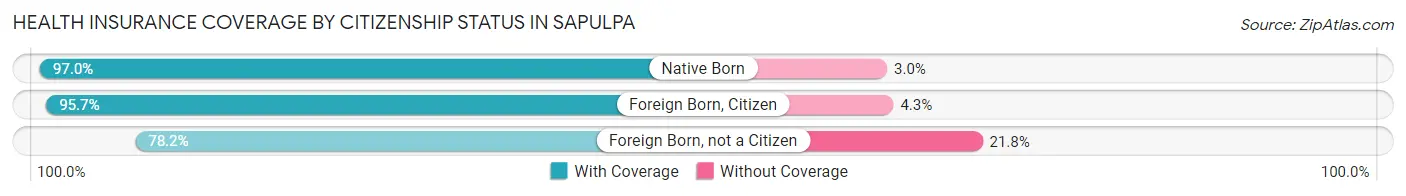
| Citizenship Status | With Coverage | Without Coverage |
| Native Born | 1,579 (97.0%) | 49 (3.0%) |
| Foreign Born, Citizen | 3,375 (95.7%) | 150 (4.3%) |
| Foreign Born, not a Citizen | 1,534 (78.2%) | 427 (21.8%) |
Health Insurance Coverage by Household Income in Sapulpa
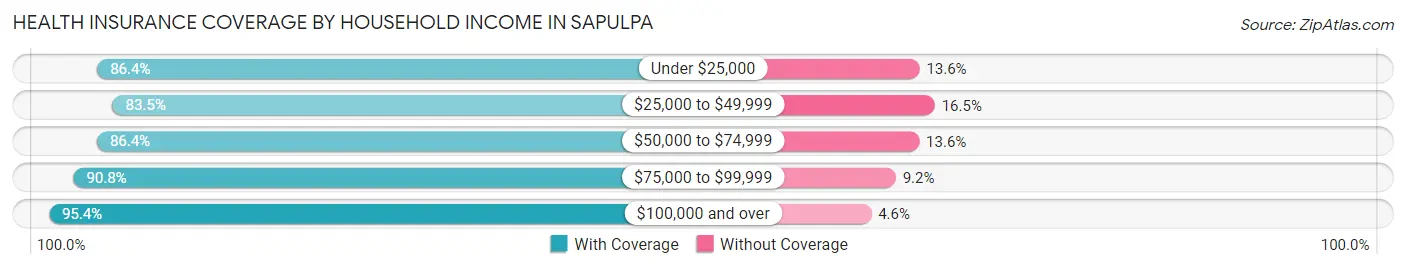
| Household Income | With Coverage | Without Coverage |
| Under $25,000 | 1,910 (86.4%) | 301 (13.6%) |
| $25,000 to $49,999 | 3,660 (83.5%) | 722 (16.5%) |
| $50,000 to $74,999 | 4,042 (86.4%) | 634 (13.6%) |
| $75,000 to $99,999 | 2,954 (90.8%) | 298 (9.2%) |
| $100,000 and over | 6,866 (95.4%) | 329 (4.6%) |
Public vs Private Health Insurance Coverage by Age in Sapulpa
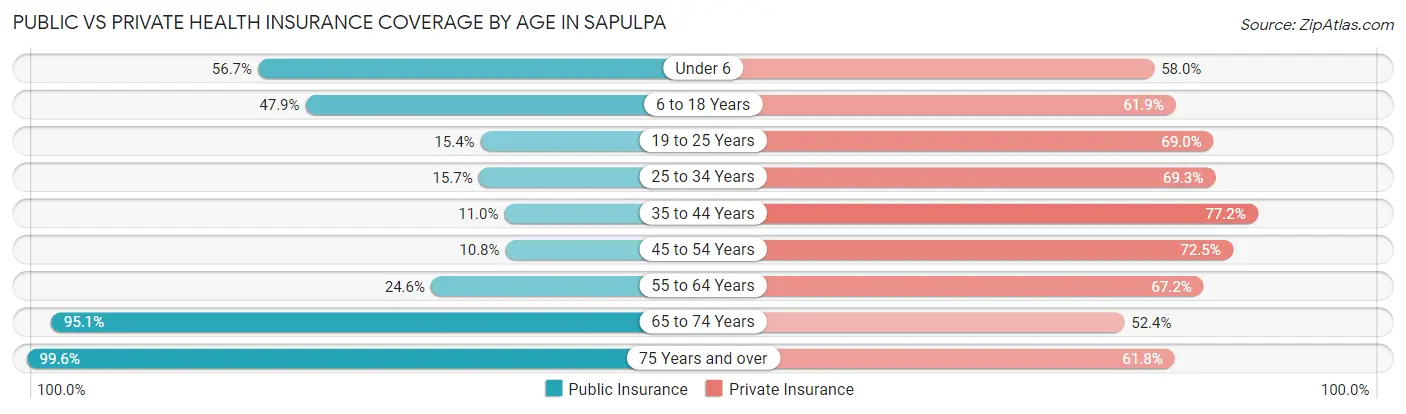
| Age Bracket | Public Insurance | Private Insurance |
| Under 6 | 923 (56.7%) | 944 (58.0%) |
| 6 to 18 Years | 1,688 (47.9%) | 2,183 (61.9%) |
| 19 to 25 Years | 302 (15.4%) | 1,353 (69.0%) |
| 25 to 34 Years | 394 (15.7%) | 1,734 (69.3%) |
| 35 to 44 Years | 306 (11.0%) | 2,153 (77.2%) |
| 45 to 54 Years | 256 (10.8%) | 1,725 (72.5%) |
| 55 to 64 Years | 679 (24.6%) | 1,853 (67.2%) |
| 65 to 74 Years | 2,474 (95.1%) | 1,364 (52.4%) |
| 75 Years and over | 1,573 (99.6%) | 975 (61.8%) |
| Total | 8,595 (39.6%) | 14,284 (65.7%) |
Disability Status by Sex by Age in Sapulpa
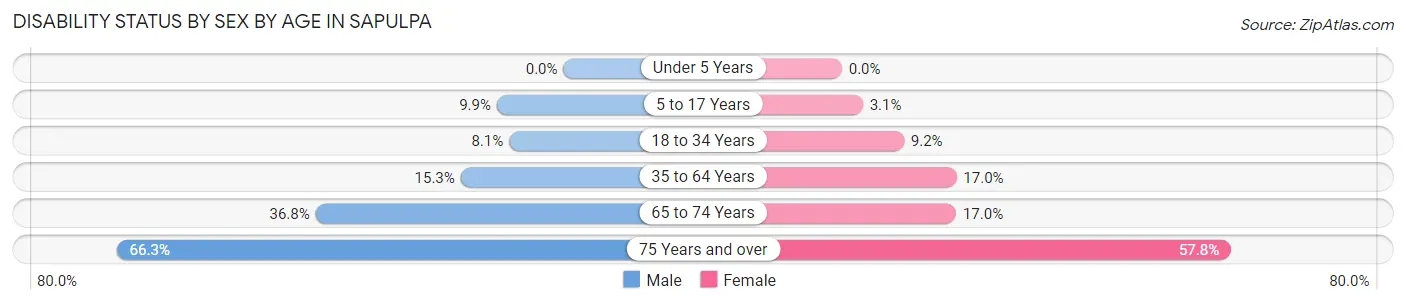
| Age Bracket | Male | Female |
| Under 5 Years | 0 (0.0%) | 0 (0.0%) |
| 5 to 17 Years | 185 (9.9%) | 54 (3.1%) |
| 18 to 34 Years | 197 (8.1%) | 208 (9.2%) |
| 35 to 64 Years | 609 (15.3%) | 670 (17.0%) |
| 65 to 74 Years | 393 (36.8%) | 260 (17.0%) |
| 75 Years and over | 400 (66.3%) | 564 (57.8%) |
Disability Class by Sex by Age in Sapulpa
Disability Class: Hearing Difficulty
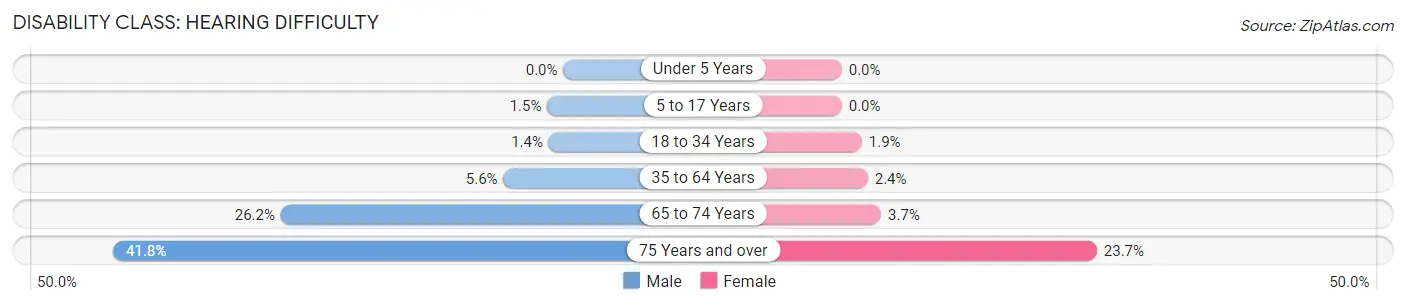
| Age Bracket | Male | Female |
| Under 5 Years | 0 (0.0%) | 0 (0.0%) |
| 5 to 17 Years | 28 (1.5%) | 0 (0.0%) |
| 18 to 34 Years | 33 (1.3%) | 42 (1.9%) |
| 35 to 64 Years | 222 (5.6%) | 95 (2.4%) |
| 65 to 74 Years | 280 (26.2%) | 56 (3.6%) |
| 75 Years and over | 252 (41.8%) | 231 (23.7%) |
Disability Class: Vision Difficulty
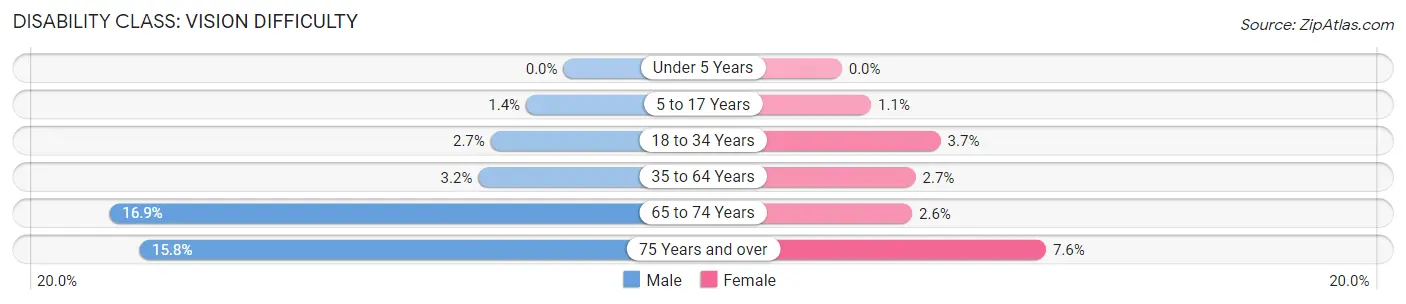
| Age Bracket | Male | Female |
| Under 5 Years | 0 (0.0%) | 0 (0.0%) |
| 5 to 17 Years | 26 (1.4%) | 19 (1.1%) |
| 18 to 34 Years | 66 (2.7%) | 83 (3.7%) |
| 35 to 64 Years | 126 (3.2%) | 108 (2.7%) |
| 65 to 74 Years | 180 (16.9%) | 40 (2.6%) |
| 75 Years and over | 95 (15.8%) | 74 (7.6%) |
Disability Class: Cognitive Difficulty
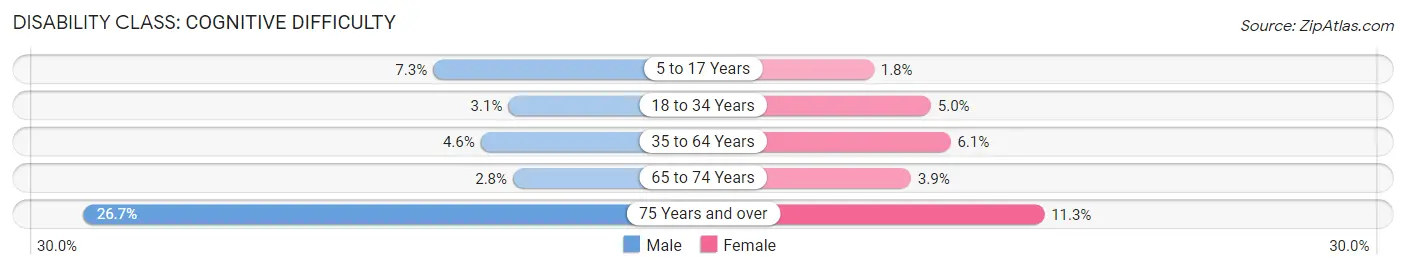
| Age Bracket | Male | Female |
| 5 to 17 Years | 136 (7.3%) | 31 (1.8%) |
| 18 to 34 Years | 75 (3.1%) | 112 (5.0%) |
| 35 to 64 Years | 184 (4.6%) | 238 (6.0%) |
| 65 to 74 Years | 30 (2.8%) | 59 (3.8%) |
| 75 Years and over | 161 (26.7%) | 110 (11.3%) |
Disability Class: Ambulatory Difficulty
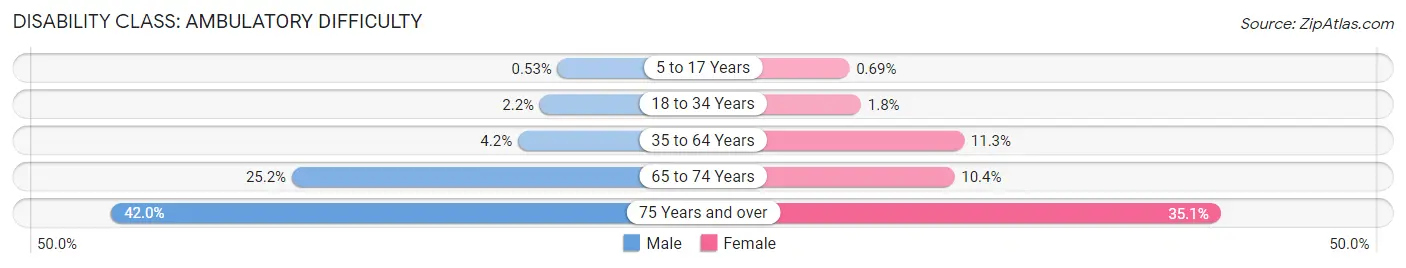
| Age Bracket | Male | Female |
| 5 to 17 Years | 10 (0.5%) | 12 (0.7%) |
| 18 to 34 Years | 53 (2.2%) | 40 (1.8%) |
| 35 to 64 Years | 168 (4.2%) | 446 (11.3%) |
| 65 to 74 Years | 269 (25.2%) | 160 (10.4%) |
| 75 Years and over | 253 (42.0%) | 343 (35.1%) |
Disability Class: Self-Care Difficulty
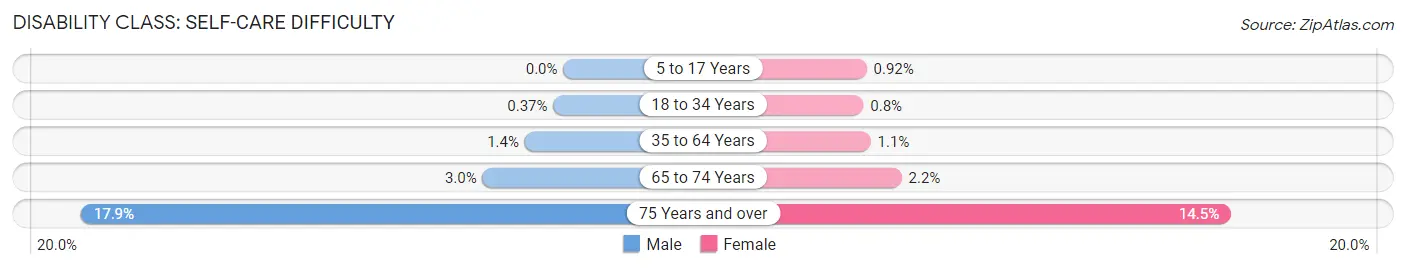
| Age Bracket | Male | Female |
| 5 to 17 Years | 0 (0.0%) | 16 (0.9%) |
| 18 to 34 Years | 9 (0.4%) | 18 (0.8%) |
| 35 to 64 Years | 57 (1.4%) | 42 (1.1%) |
| 65 to 74 Years | 32 (3.0%) | 34 (2.2%) |
| 75 Years and over | 108 (17.9%) | 141 (14.4%) |
Technology Access in Sapulpa
Computing Device Access in Sapulpa
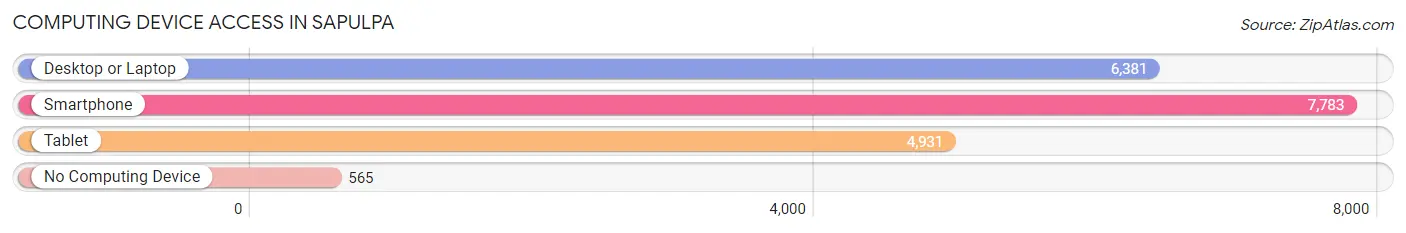
| Device Type | # Households | % Households |
| Desktop or Laptop | 6,381 | 73.4% |
| Smartphone | 7,783 | 89.5% |
| Tablet | 4,931 | 56.7% |
| No Computing Device | 565 | 6.5% |
| Total | 8,697 | 100.0% |
Internet Access in Sapulpa
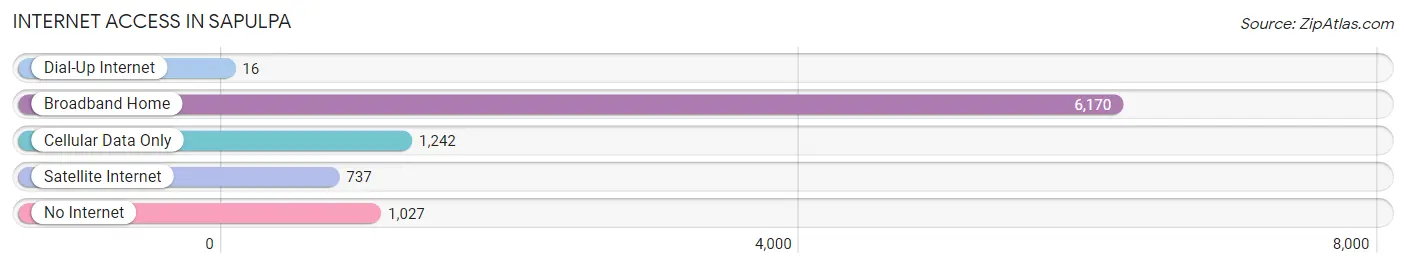
| Internet Type | # Households | % Households |
| Dial-Up Internet | 16 | 0.2% |
| Broadband Home | 6,170 | 70.9% |
| Cellular Data Only | 1,242 | 14.3% |
| Satellite Internet | 737 | 8.5% |
| No Internet | 1,027 | 11.8% |
| Total | 8,697 | 100.0% |
Sapulpa Summary
Sapulpa is a city located in Creek County, Oklahoma, United States. The population was 20,544 at the 2010 census, making it the ninth-largest city in the state. Sapulpa is the county seat of Creek County and is part of the Tulsa Metropolitan Statistical Area.
History
Sapulpa was founded in the late 1800s by the Creek Nation, who named it after the Sapulpa Creek. The Creek Nation had been forced to move to Indian Territory from their ancestral lands in Georgia and Alabama. The city was incorporated in 1898 and was named after the creek.
The city was a major stop on the St. Louis and San Francisco Railway, which ran through the city. The railroad brought many new settlers to the area, and Sapulpa quickly grew into a thriving town.
In the early 1900s, Sapulpa was a major oil-producing region. The city was home to several oil refineries, and the Sapulpa Oil Field was one of the largest in the world. The oil industry brought wealth and prosperity to the city, and Sapulpa became known as the “Oil Capital of Oklahoma.”
The city continued to grow and prosper throughout the 20th century. In the 1950s, Sapulpa was home to the world’s largest glass factory, the Libbey-Owens-Ford Glass Company. The city also had a thriving manufacturing sector, with several factories producing a variety of products.
Geography
Sapulpa is located in Creek County, Oklahoma, in the northeastern part of the state. The city is situated on the Arkansas River, about 20 miles southwest of Tulsa. Sapulpa is surrounded by several small towns and rural areas, including Kellyville, Kiefer, and Mounds.
The city has a total area of 16.2 square miles, of which 16.1 square miles is land and 0.1 square miles is water. Sapulpa has a humid subtropical climate, with hot, humid summers and mild winters.
Economy
Sapulpa’s economy is largely based on manufacturing and oil production. The city is home to several large manufacturing companies, including Libbey-Owens-Ford Glass Company, which produces glass products, and Sapulpa Refinery, which produces oil and gas.
The city also has a thriving retail sector, with several large shopping centers and malls. Sapulpa is also home to several large employers, including Sapulpa Public Schools, Sapulpa Regional Hospital, and Sapulpa Community College.
Demographics
As of the 2010 census, Sapulpa had a population of 20,544. The racial makeup of the city was 75.3% White, 11.2% African American, 0.7% Native American, 1.2% Asian, 0.1% Pacific Islander, 8.2% from other races, and 3.4% from two or more races. Hispanic or Latino of any race were 16.2% of the population.
The median income for a household in Sapulpa was $37,945, and the median income for a family was $45,945. The per capita income for the city was $20,845. About 14.2% of families and 17.3% of the population were below the poverty line, including 25.2% of those under age 18 and 8.7% of those age 65 or over.
Common Questions
What is Per Capita Income in Sapulpa?
Per Capita income in Sapulpa is $31,330.
What is the Median Family Income in Sapulpa?
Median Family Income in Sapulpa is $76,528.
What is the Median Household income in Sapulpa?
Median Household Income in Sapulpa is $62,168.
What is Income or Wage Gap in Sapulpa?
Income or Wage Gap in Sapulpa is 26.8%.
Women in Sapulpa earn 73.2 cents for every dollar earned by a man.
What is Family Income Deficit in Sapulpa?
Family Income Deficit in Sapulpa is $12,045.
Families that are below poverty line in Sapulpa earn $12,045 less on average than the poverty threshold level.
What is Inequality or Gini Index in Sapulpa?
Inequality or Gini Index in Sapulpa is 0.41.
What is the Total Population of Sapulpa?
Total Population of Sapulpa is 22,030.
What is the Total Male Population of Sapulpa?
Total Male Population of Sapulpa is 10,763.
What is the Total Female Population of Sapulpa?
Total Female Population of Sapulpa is 11,267.
What is the Ratio of Males per 100 Females in Sapulpa?
There are 95.53 Males per 100 Females in Sapulpa.
What is the Ratio of Females per 100 Males in Sapulpa?
There are 104.68 Females per 100 Males in Sapulpa.
What is the Median Population Age in Sapulpa?
Median Population Age in Sapulpa is 40.1 Years.
What is the Average Family Size in Sapulpa
Average Family Size in Sapulpa is 3.0 People.
What is the Average Household Size in Sapulpa
Average Household Size in Sapulpa is 2.5 People.
How Large is the Labor Force in Sapulpa?
There are 10,372 People in the Labor Forcein in Sapulpa.
What is the Percentage of People in the Labor Force in Sapulpa?
58.6% of People are in the Labor Force in Sapulpa.
What is the Unemployment Rate in Sapulpa?
Unemployment Rate in Sapulpa is 3.3%.