Antlers, OK Map & Demographics
Antlers Map
Antlers Overview
$18,216
PER CAPITA INCOME
$43,493
AVG FAMILY INCOME
$27,798
AVG HOUSEHOLD INCOME
39.8%
WAGE / INCOME GAP [ % ]
60.2¢/ $1
WAGE / INCOME GAP [ $ ]
0.48
INEQUALITY / GINI INDEX
2,361
TOTAL POPULATION
1,050
MALE POPULATION
1,311
FEMALE POPULATION
80.09
MALES / 100 FEMALES
124.86
FEMALES / 100 MALES
36.7
MEDIAN AGE
3.1
AVG FAMILY SIZE
2.4
AVG HOUSEHOLD SIZE
812
LABOR FORCE [ PEOPLE ]
44.5%
PERCENT IN LABOR FORCE
12.8%
UNEMPLOYMENT RATE
Antlers Zip Codes
Antlers Area Codes
Income in Antlers
Income Overview in Antlers
Per Capita Income in Antlers is $18,216, while median incomes of families and households are $43,493 and $27,798 respectively.
| Characteristic | Number | Measure |
| Per Capita Income | 2,361 | $18,216 |
| Median Family Income | 559 | $43,493 |
| Mean Family Income | 559 | $46,754 |
| Median Household Income | 955 | $27,798 |
| Mean Household Income | 955 | $40,955 |
| Income Deficit | 559 | $0 |
| Wage / Income Gap (%) | 2,361 | 39.82% |
| Wage / Income Gap ($) | 2,361 | 60.18¢ per $1 |
| Gini / Inequality Index | 2,361 | 0.48 |
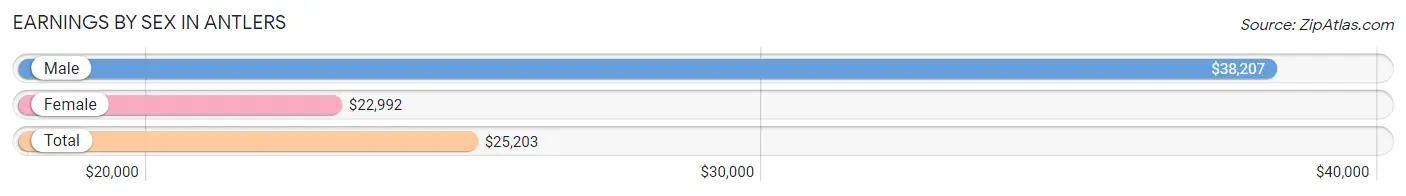
Earnings by Sex in Antlers
Average Earnings in Antlers are $25,203, $38,207 for men and $22,992 for women, a difference of 39.8%.
| Sex | Number | Average Earnings |
| Male | 455 (53.8%) | $38,207 |
| Female | 391 (46.2%) | $22,992 |
| Total | 846 (100.0%) | $25,203 |
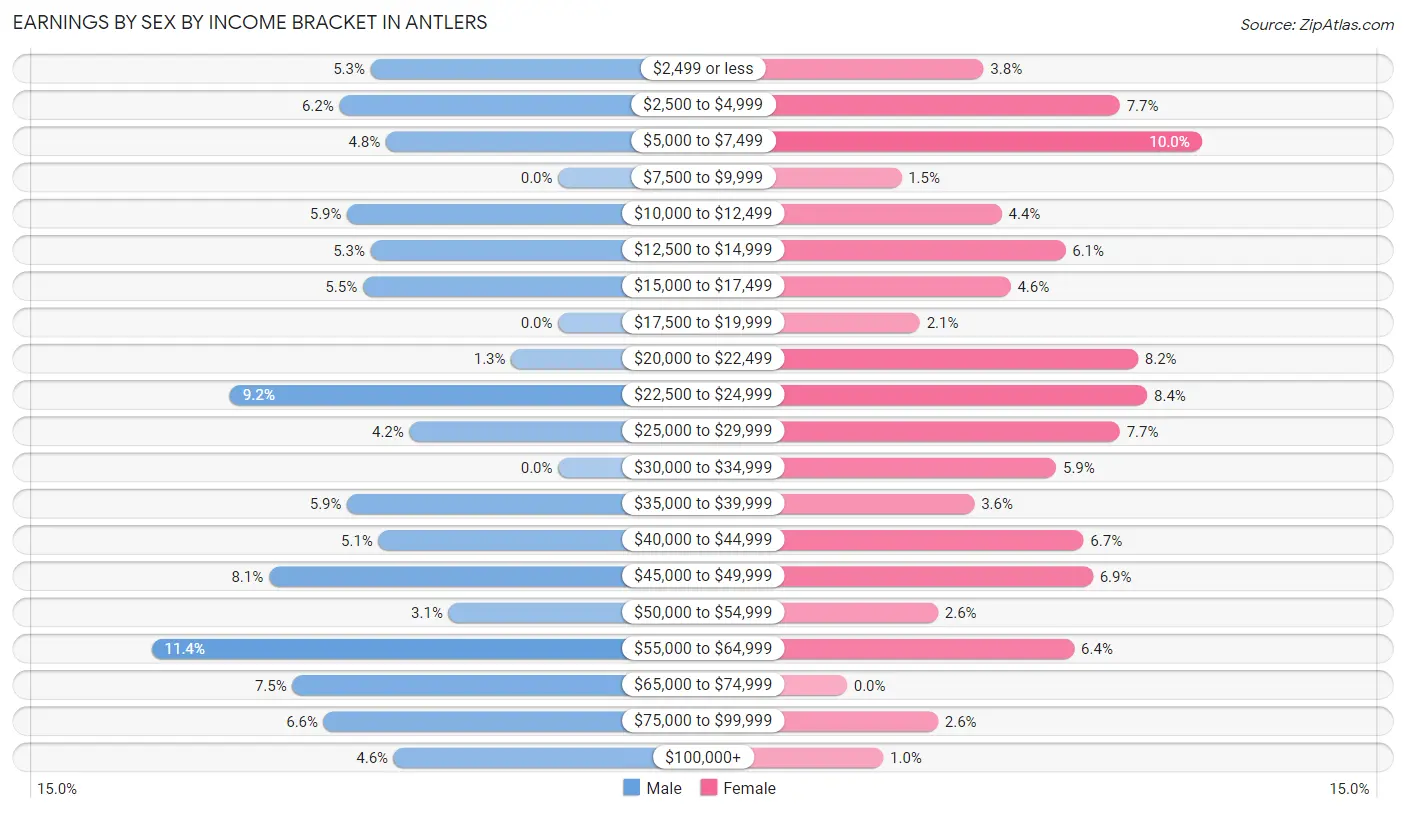
Earnings by Sex by Income Bracket in Antlers
The most common earnings brackets in Antlers are $55,000 to $64,999 for men (52 | 11.4%) and $5,000 to $7,499 for women (39 | 10.0%).
| Income | Male | Female |
| $2,499 or less | 24 (5.3%) | 15 (3.8%) |
| $2,500 to $4,999 | 28 (6.1%) | 30 (7.7%) |
| $5,000 to $7,499 | 22 (4.8%) | 39 (10.0%) |
| $7,500 to $9,999 | 0 (0.0%) | 6 (1.5%) |
| $10,000 to $12,499 | 27 (5.9%) | 17 (4.3%) |
| $12,500 to $14,999 | 24 (5.3%) | 24 (6.1%) |
| $15,000 to $17,499 | 25 (5.5%) | 18 (4.6%) |
| $17,500 to $19,999 | 0 (0.0%) | 8 (2.1%) |
| $20,000 to $22,499 | 6 (1.3%) | 32 (8.2%) |
| $22,500 to $24,999 | 42 (9.2%) | 33 (8.4%) |
| $25,000 to $29,999 | 19 (4.2%) | 30 (7.7%) |
| $30,000 to $34,999 | 0 (0.0%) | 23 (5.9%) |
| $35,000 to $39,999 | 27 (5.9%) | 14 (3.6%) |
| $40,000 to $44,999 | 23 (5.1%) | 26 (6.7%) |
| $45,000 to $49,999 | 37 (8.1%) | 27 (6.9%) |
| $50,000 to $54,999 | 14 (3.1%) | 10 (2.6%) |
| $55,000 to $64,999 | 52 (11.4%) | 25 (6.4%) |
| $65,000 to $74,999 | 34 (7.5%) | 0 (0.0%) |
| $75,000 to $99,999 | 30 (6.6%) | 10 (2.6%) |
| $100,000+ | 21 (4.6%) | 4 (1.0%) |
| Total | 455 (100.0%) | 391 (100.0%) |
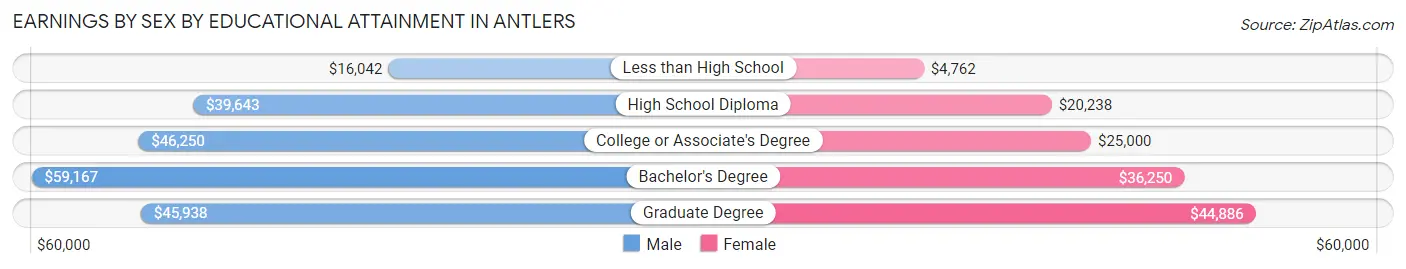
Earnings by Sex by Educational Attainment in Antlers
Average earnings in Antlers are $42,917 for men and $24,567 for women, a difference of 42.8%. Men with an educational attainment of bachelor's degree enjoy the highest average annual earnings of $59,167, while those with less than high school education earn the least with $16,042. Women with an educational attainment of graduate degree earn the most with the average annual earnings of $44,886, while those with less than high school education have the smallest earnings of $4,762.
| Educational Attainment | Male Income | Female Income |
| Less than High School | $16,042 | $4,762 |
| High School Diploma | $39,643 | $20,238 |
| College or Associate's Degree | $46,250 | $25,000 |
| Bachelor's Degree | $59,167 | $36,250 |
| Graduate Degree | $45,938 | $44,886 |
| Total | $42,917 | $24,567 |
Family Income in Antlers
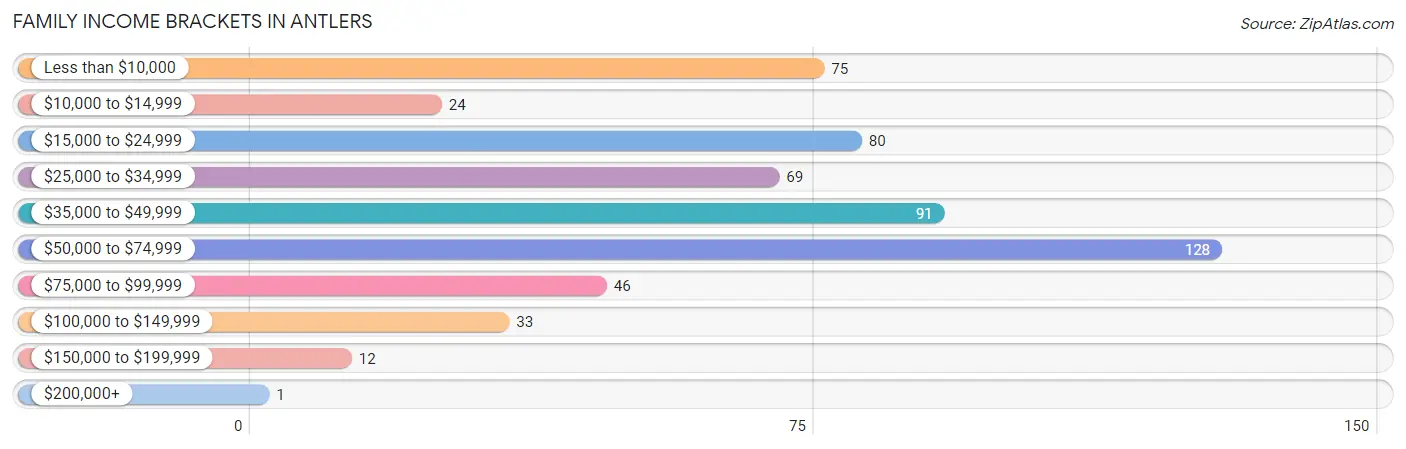
Family Income Brackets in Antlers
According to the Antlers family income data, there are 128 families falling into the $50,000 to $74,999 income range, which is the most common income bracket and makes up 22.9% of all families. Conversely, the $200,000+ income bracket is the least frequent group with only 1 families (0.2%) belonging to this category.
| Income Bracket | # Families | % Families |
| Less than $10,000 | 75 | 13.4% |
| $10,000 to $14,999 | 24 | 4.3% |
| $15,000 to $24,999 | 80 | 14.3% |
| $25,000 to $34,999 | 69 | 12.3% |
| $35,000 to $49,999 | 91 | 16.3% |
| $50,000 to $74,999 | 128 | 22.9% |
| $75,000 to $99,999 | 46 | 8.2% |
| $100,000 to $149,999 | 33 | 5.9% |
| $150,000 to $199,999 | 12 | 2.1% |
| $200,000+ | 1 | 0.2% |
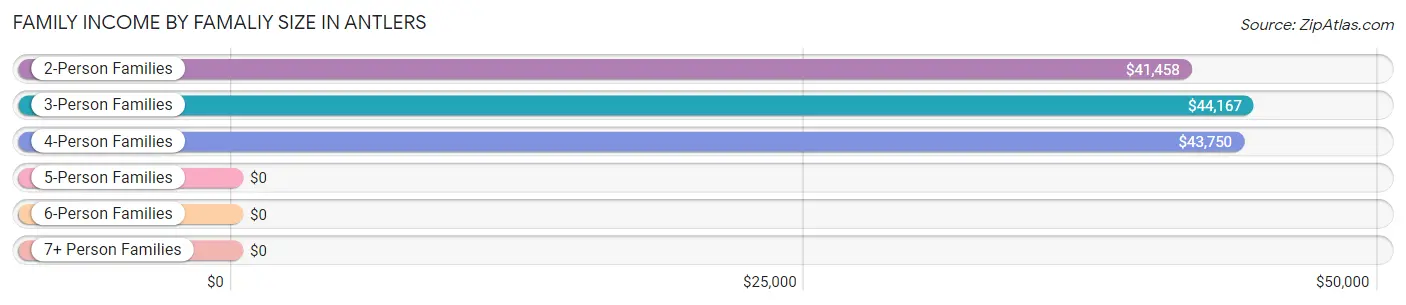
Family Income by Famaliy Size in Antlers
3-person families (146 | 26.1%) account for the highest median family income in Antlers with $44,167 per family, while 2-person families (289 | 51.7%) have the highest median income of $20,729 per family member.
| Income Bracket | # Families | Median Income |
| 2-Person Families | 289 (51.7%) | $41,458 |
| 3-Person Families | 146 (26.1%) | $44,167 |
| 4-Person Families | 97 (17.3%) | $43,750 |
| 5-Person Families | 16 (2.9%) | $0 |
| 6-Person Families | 11 (2.0%) | $0 |
| 7+ Person Families | 0 (0.0%) | $0 |
| Total | 559 (100.0%) | $43,493 |
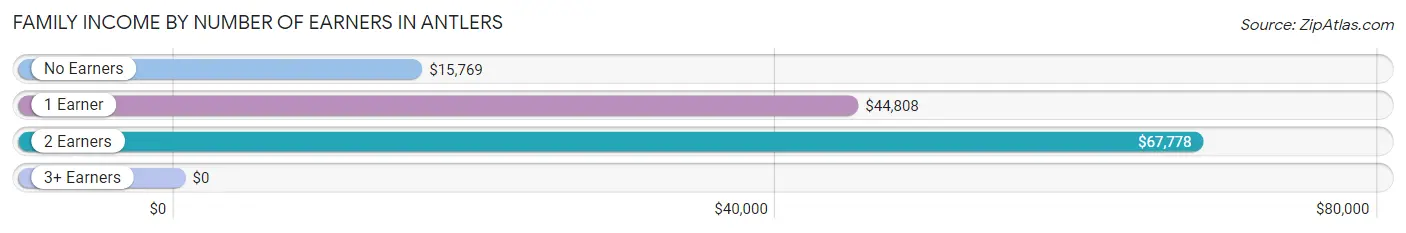
Family Income by Number of Earners in Antlers
| Number of Earners | # Families | Median Income |
| No Earners | 166 (29.7%) | $15,769 |
| 1 Earner | 216 (38.6%) | $44,808 |
| 2 Earners | 170 (30.4%) | $67,778 |
| 3+ Earners | 7 (1.3%) | $0 |
| Total | 559 (100.0%) | $43,493 |
Household Income in Antlers
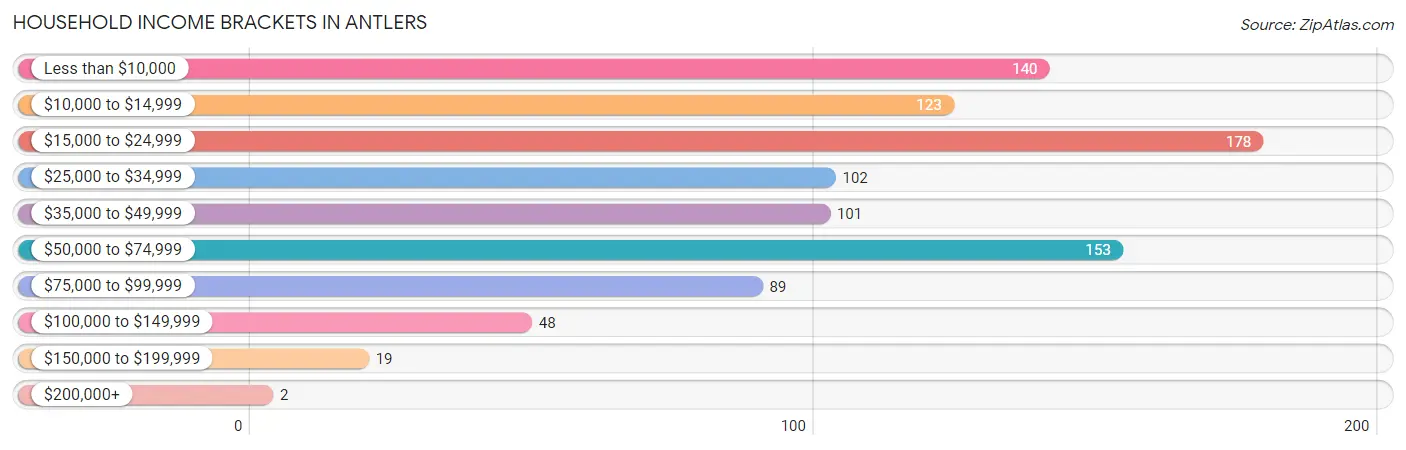
Household Income Brackets in Antlers
With 178 households falling in the category, the $15,000 to $24,999 income range is the most frequent in Antlers, accounting for 18.6% of all households. In contrast, only 2 households (0.2%) fall into the $200,000+ income bracket, making it the least populous group.
| Income Bracket | # Households | % Households |
| Less than $10,000 | 140 | 14.7% |
| $10,000 to $14,999 | 123 | 12.9% |
| $15,000 to $24,999 | 178 | 18.6% |
| $25,000 to $34,999 | 102 | 10.7% |
| $35,000 to $49,999 | 101 | 10.6% |
| $50,000 to $74,999 | 153 | 16.0% |
| $75,000 to $99,999 | 89 | 9.3% |
| $100,000 to $149,999 | 48 | 5.0% |
| $150,000 to $199,999 | 19 | 2.0% |
| $200,000+ | 2 | 0.2% |
Household Income by Householder Age in Antlers
The median household income in Antlers is $27,798, with the highest median household income of $41,125 found in the 25 to 44 years age bracket for the primary householder. A total of 281 households (29.4%) fall into this category. Meanwhile, the 65+ years age bracket for the primary householder has the lowest median household income of $20,543, with 252 households (26.4%) in this group.
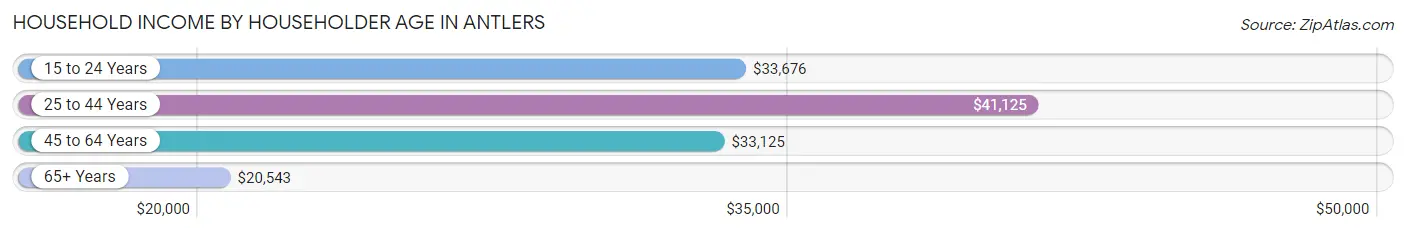
| Income Bracket | # Households | Median Income |
| 15 to 24 Years | 50 (5.2%) | $33,676 |
| 25 to 44 Years | 281 (29.4%) | $41,125 |
| 45 to 64 Years | 372 (39.0%) | $33,125 |
| 65+ Years | 252 (26.4%) | $20,543 |
| Total | 955 (100.0%) | $27,798 |
Poverty in Antlers
Income Below Poverty by Sex and Age in Antlers
With 29.2% poverty level for males and 31.9% for females among the residents of Antlers, 5 year old males and 16 and 17 year old females are the most vulnerable to poverty, with 6 males (54.5%) and 6 females (100.0%) in their respective age groups living below the poverty level.
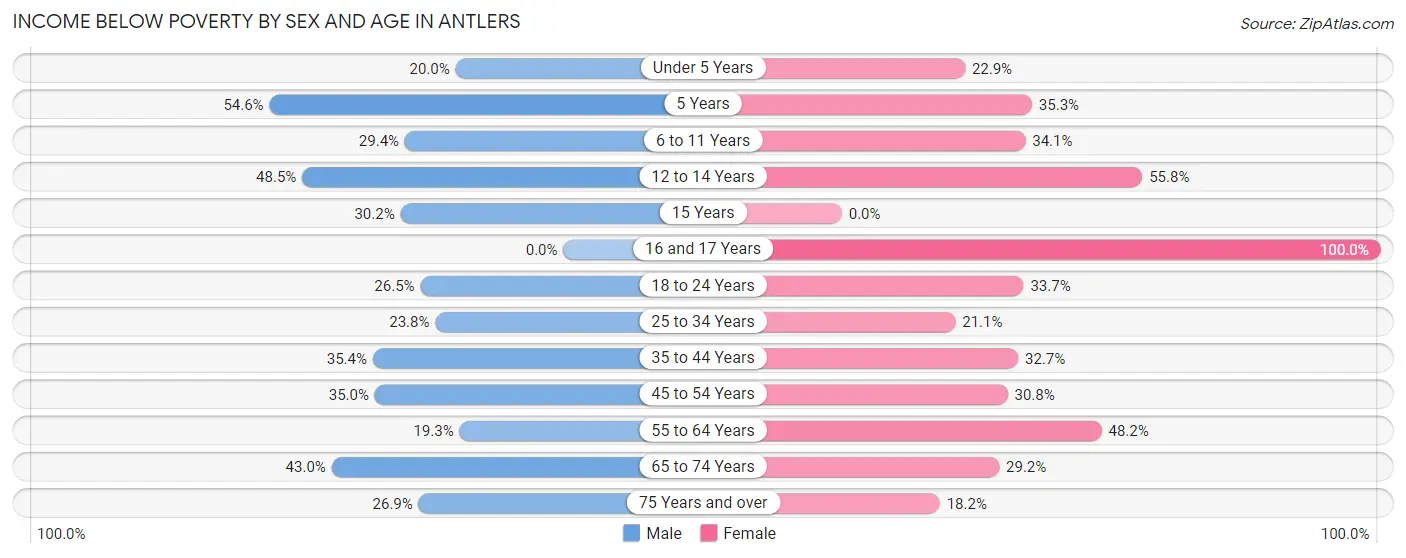
| Age Bracket | Male | Female |
| Under 5 Years | 16 (20.0%) | 24 (22.9%) |
| 5 Years | 6 (54.5%) | 6 (35.3%) |
| 6 to 11 Years | 15 (29.4%) | 47 (34.1%) |
| 12 to 14 Years | 16 (48.5%) | 29 (55.8%) |
| 15 Years | 13 (30.2%) | 0 (0.0%) |
| 16 and 17 Years | 0 (0.0%) | 6 (100.0%) |
| 18 to 24 Years | 26 (26.5%) | 29 (33.7%) |
| 25 to 34 Years | 29 (23.8%) | 51 (21.1%) |
| 35 to 44 Years | 52 (35.4%) | 35 (32.7%) |
| 45 to 54 Years | 28 (35.0%) | 36 (30.8%) |
| 55 to 64 Years | 32 (19.3%) | 81 (48.2%) |
| 65 to 74 Years | 40 (43.0%) | 40 (29.2%) |
| 75 Years and over | 18 (26.9%) | 12 (18.2%) |
| Total | 291 (29.2%) | 396 (31.9%) |
Income Above Poverty by Sex and Age in Antlers
According to the poverty statistics in Antlers, males aged 16 and 17 years and females aged 75 years and over are the age groups that are most secure financially, with 100.0% of males and 81.8% of females in these age groups living above the poverty line.
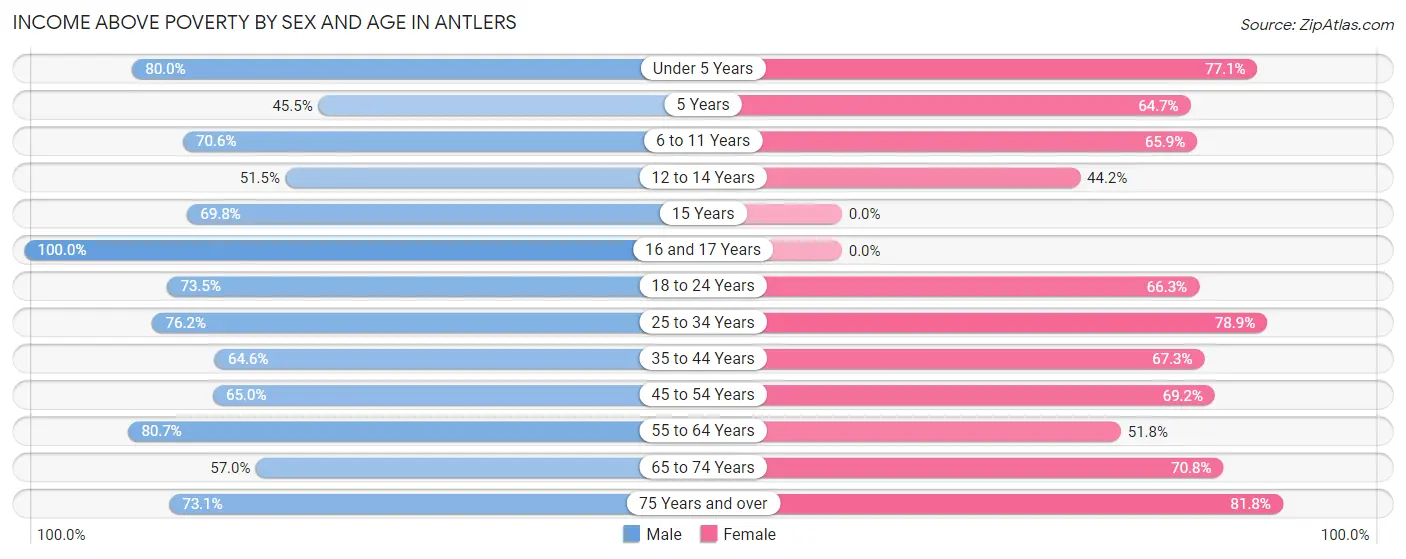
| Age Bracket | Male | Female |
| Under 5 Years | 64 (80.0%) | 81 (77.1%) |
| 5 Years | 5 (45.5%) | 11 (64.7%) |
| 6 to 11 Years | 36 (70.6%) | 91 (65.9%) |
| 12 to 14 Years | 17 (51.5%) | 23 (44.2%) |
| 15 Years | 30 (69.8%) | 0 (0.0%) |
| 16 and 17 Years | 4 (100.0%) | 0 (0.0%) |
| 18 to 24 Years | 72 (73.5%) | 57 (66.3%) |
| 25 to 34 Years | 93 (76.2%) | 191 (78.9%) |
| 35 to 44 Years | 95 (64.6%) | 72 (67.3%) |
| 45 to 54 Years | 52 (65.0%) | 81 (69.2%) |
| 55 to 64 Years | 134 (80.7%) | 87 (51.8%) |
| 65 to 74 Years | 53 (57.0%) | 97 (70.8%) |
| 75 Years and over | 49 (73.1%) | 54 (81.8%) |
| Total | 704 (70.8%) | 845 (68.1%) |
Income Below Poverty Among Married-Couple Families in Antlers
The poverty statistics for married-couple families in Antlers show that 22.3% or 81 of the total 363 families live below the poverty line. Families with no children have the highest poverty rate of 25.7%, comprising of 62 families. On the other hand, families with 3 or 4 children have the lowest poverty rate of 0.0%, which includes 0 families.
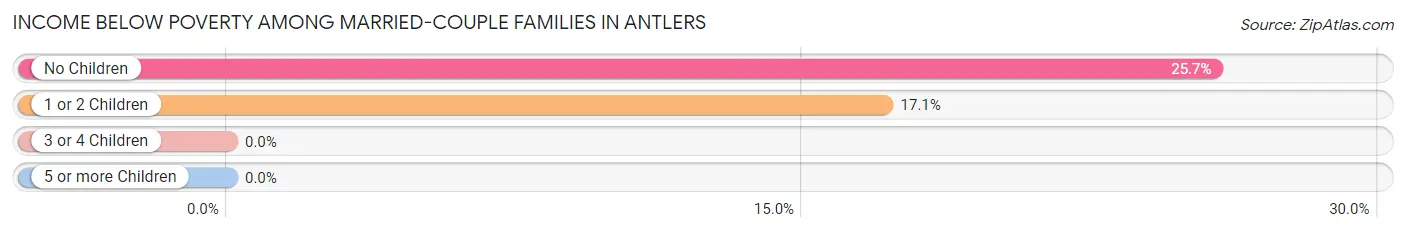
| Children | Above Poverty | Below Poverty |
| No Children | 179 (74.3%) | 62 (25.7%) |
| 1 or 2 Children | 92 (82.9%) | 19 (17.1%) |
| 3 or 4 Children | 11 (100.0%) | 0 (0.0%) |
| 5 or more Children | 0 (0.0%) | 0 (0.0%) |
| Total | 282 (77.7%) | 81 (22.3%) |
Income Below Poverty Among Single-Parent Households in Antlers
According to the poverty data in Antlers, 12.5% or 6 single-father households and 42.6% or 63 single-mother households are living below the poverty line. Among single-father households, those with 1 or 2 children have the highest poverty rate, with 6 households (25.0%) experiencing poverty. Likewise, among single-mother households, those with 3 or 4 children have the highest poverty rate, with 10 households (100.0%) falling below the poverty line.
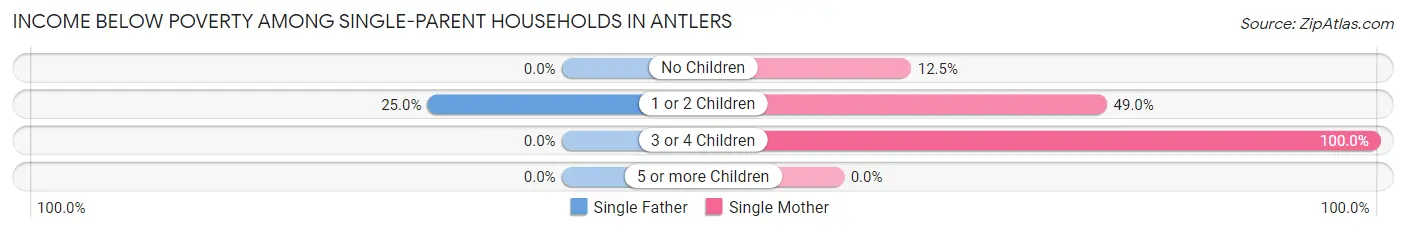
| Children | Single Father | Single Mother |
| No Children | 0 (0.0%) | 5 (12.5%) |
| 1 or 2 Children | 6 (25.0%) | 48 (49.0%) |
| 3 or 4 Children | 0 (0.0%) | 10 (100.0%) |
| 5 or more Children | 0 (0.0%) | 0 (0.0%) |
| Total | 6 (12.5%) | 63 (42.6%) |
Income Below Poverty Among Married-Couple vs Single-Parent Households in Antlers
The poverty data for Antlers shows that 81 of the married-couple family households (22.3%) and 69 of the single-parent households (35.2%) are living below the poverty level. Within the married-couple family households, those with no children have the highest poverty rate, with 62 households (25.7%) falling below the poverty line. Among the single-parent households, those with 3 or 4 children have the highest poverty rate, with 10 household (58.8%) living below poverty.
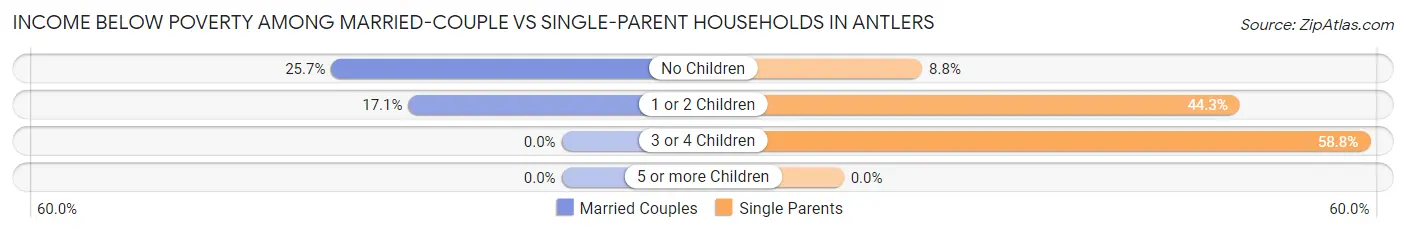
| Children | Married-Couple Families | Single-Parent Households |
| No Children | 62 (25.7%) | 5 (8.8%) |
| 1 or 2 Children | 19 (17.1%) | 54 (44.3%) |
| 3 or 4 Children | 0 (0.0%) | 10 (58.8%) |
| 5 or more Children | 0 (0.0%) | 0 (0.0%) |
| Total | 81 (22.3%) | 69 (35.2%) |
Race in Antlers
The most populous races in Antlers are White / Caucasian (1,655 | 70.1%), Two or more Races (323 | 13.7%), and Native / Alaskan (287 | 12.2%).
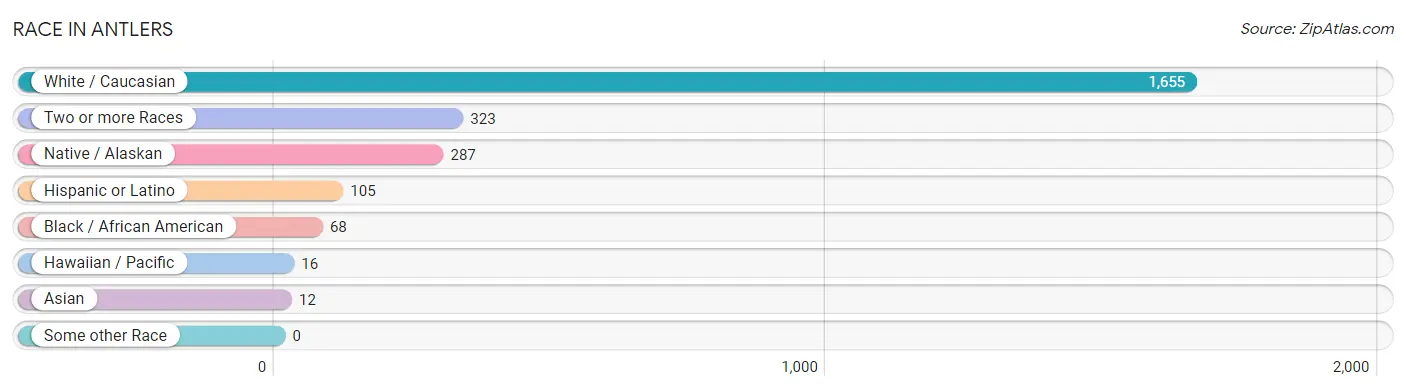
| Race | # Population | % Population |
| Asian | 12 | 0.5% |
| Black / African American | 68 | 2.9% |
| Hawaiian / Pacific | 16 | 0.7% |
| Hispanic or Latino | 105 | 4.4% |
| Native / Alaskan | 287 | 12.2% |
| White / Caucasian | 1,655 | 70.1% |
| Two or more Races | 323 | 13.7% |
| Some other Race | 0 | 0.0% |
| Total | 2,361 | 100.0% |
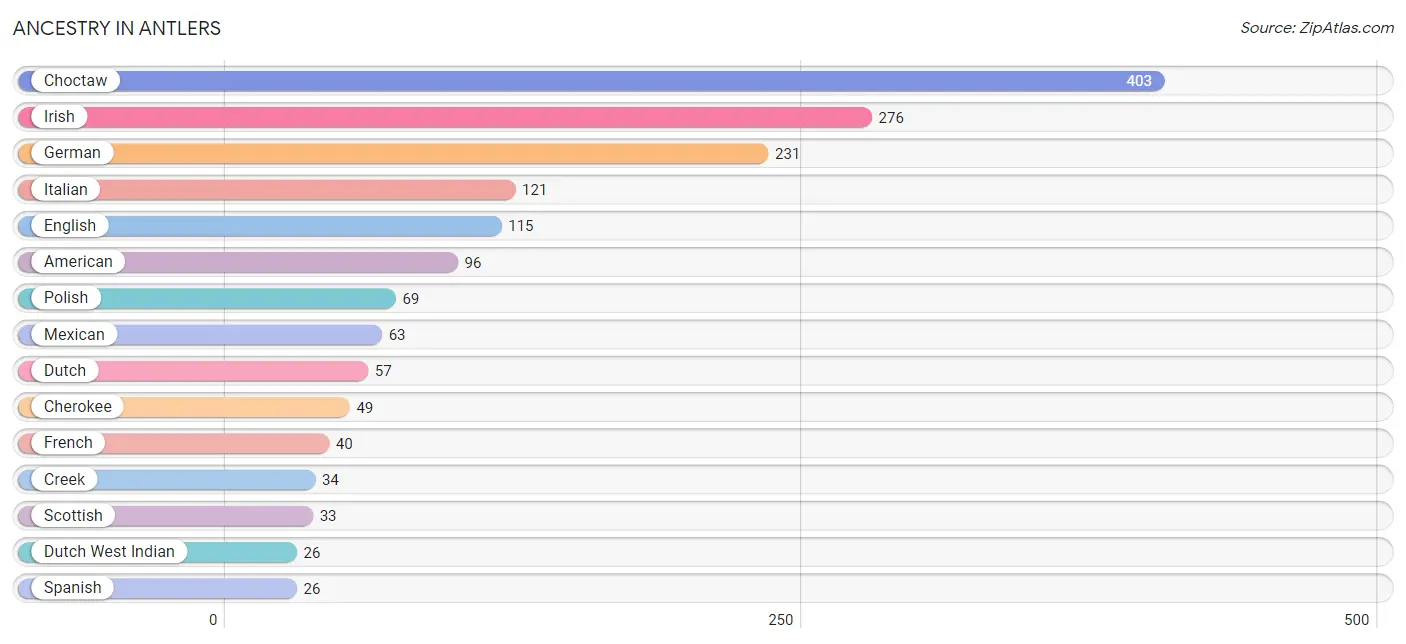
Ancestry in Antlers
The most populous ancestries reported in Antlers are Choctaw (403 | 17.1%), Irish (276 | 11.7%), German (231 | 9.8%), Italian (121 | 5.1%), and English (115 | 4.9%), together accounting for 48.5% of all Antlers residents.
| Ancestry | # Population | % Population |
| African | 6 | 0.3% |
| American | 96 | 4.1% |
| Arab | 12 | 0.5% |
| Bhutanese | 2 | 0.1% |
| British | 5 | 0.2% |
| Cherokee | 49 | 2.1% |
| Cheyenne | 3 | 0.1% |
| Chickasaw | 17 | 0.7% |
| Choctaw | 403 | 17.1% |
| Creek | 34 | 1.4% |
| Dutch | 57 | 2.4% |
| Dutch West Indian | 26 | 1.1% |
| English | 115 | 4.9% |
| European | 13 | 0.5% |
| French | 40 | 1.7% |
| French Canadian | 5 | 0.2% |
| German | 231 | 9.8% |
| Irish | 276 | 11.7% |
| Italian | 121 | 5.1% |
| Korean | 12 | 0.5% |
| Mexican | 63 | 2.7% |
| Norwegian | 5 | 0.2% |
| Polish | 69 | 2.9% |
| Puerto Rican | 16 | 0.7% |
| Russian | 17 | 0.7% |
| Scotch-Irish | 10 | 0.4% |
| Scottish | 33 | 1.4% |
| Seminole | 14 | 0.6% |
| Spanish | 26 | 1.1% |
| Subsaharan African | 6 | 0.3% |
| Swedish | 8 | 0.3% | View All 31 Rows |
Immigrants in Antlers
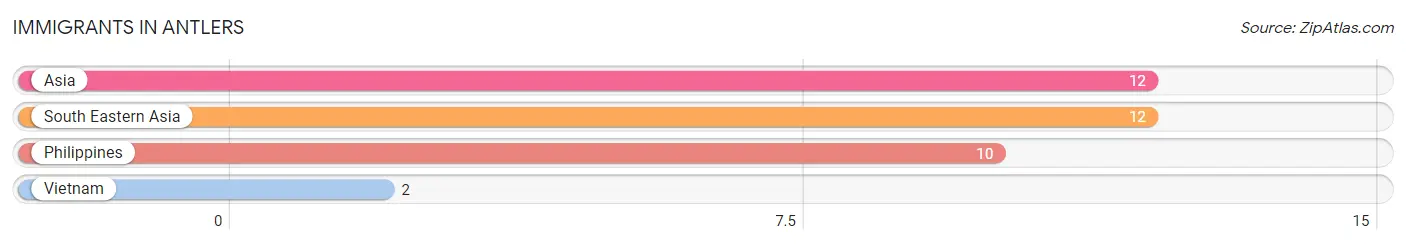
The most numerous immigrant groups reported in Antlers came from Asia (12 | 0.5%), South Eastern Asia (12 | 0.5%), Philippines (10 | 0.4%), and Vietnam (2 | 0.1%), together accounting for 1.5% of all Antlers residents.
| Immigration Origin | # Population | % Population |
| Asia | 12 | 0.5% |
| Philippines | 10 | 0.4% |
| South Eastern Asia | 12 | 0.5% |
| Vietnam | 2 | 0.1% | View All 4 Rows |
Sex and Age in Antlers
Sex and Age in Antlers
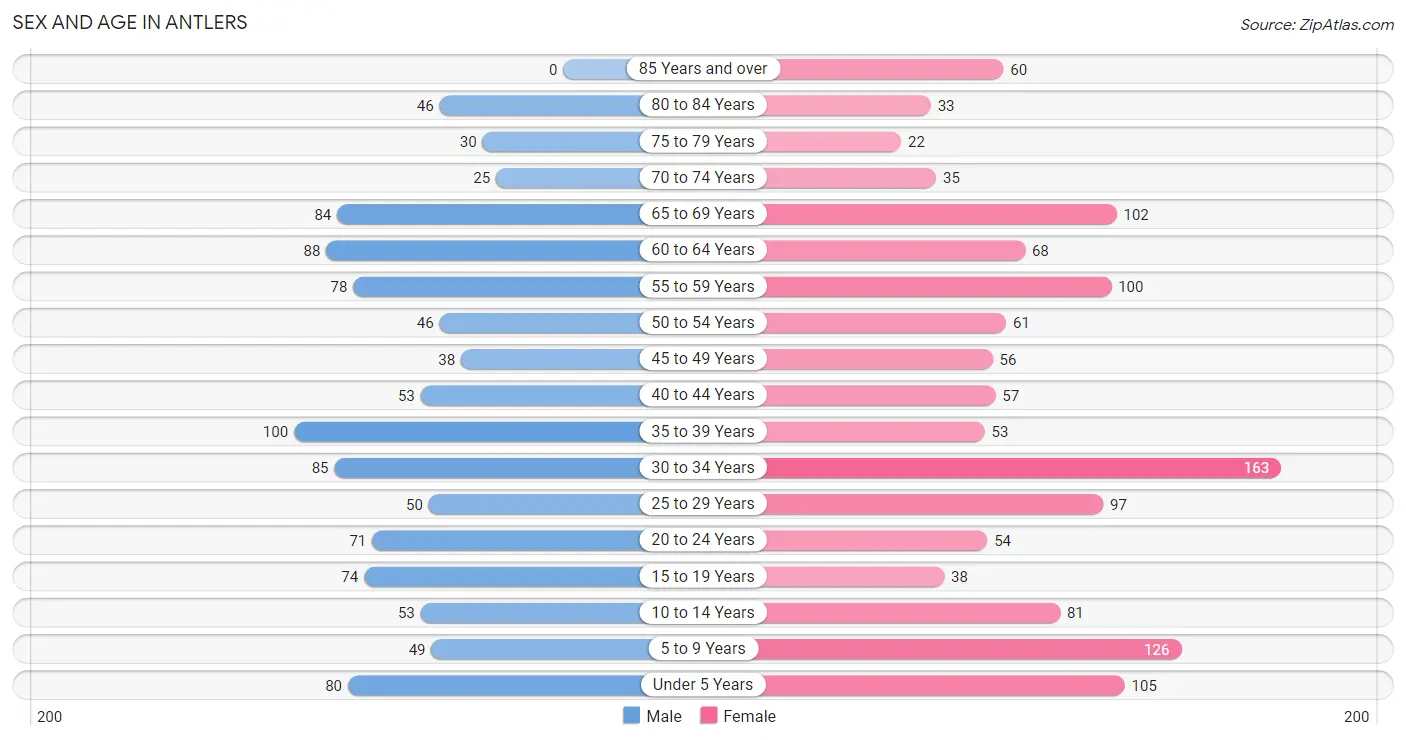
The most populous age groups in Antlers are 35 to 39 Years (100 | 9.5%) for men and 30 to 34 Years (163 | 12.4%) for women.
| Age Bracket | Male | Female |
| Under 5 Years | 80 (7.6%) | 105 (8.0%) |
| 5 to 9 Years | 49 (4.7%) | 126 (9.6%) |
| 10 to 14 Years | 53 (5.1%) | 81 (6.2%) |
| 15 to 19 Years | 74 (7.0%) | 38 (2.9%) |
| 20 to 24 Years | 71 (6.8%) | 54 (4.1%) |
| 25 to 29 Years | 50 (4.8%) | 97 (7.4%) |
| 30 to 34 Years | 85 (8.1%) | 163 (12.4%) |
| 35 to 39 Years | 100 (9.5%) | 53 (4.0%) |
| 40 to 44 Years | 53 (5.1%) | 57 (4.3%) |
| 45 to 49 Years | 38 (3.6%) | 56 (4.3%) |
| 50 to 54 Years | 46 (4.4%) | 61 (4.6%) |
| 55 to 59 Years | 78 (7.4%) | 100 (7.6%) |
| 60 to 64 Years | 88 (8.4%) | 68 (5.2%) |
| 65 to 69 Years | 84 (8.0%) | 102 (7.8%) |
| 70 to 74 Years | 25 (2.4%) | 35 (2.7%) |
| 75 to 79 Years | 30 (2.9%) | 22 (1.7%) |
| 80 to 84 Years | 46 (4.4%) | 33 (2.5%) |
| 85 Years and over | 0 (0.0%) | 60 (4.6%) |
| Total | 1,050 (100.0%) | 1,311 (100.0%) |
Families and Households in Antlers
Median Family Size in Antlers
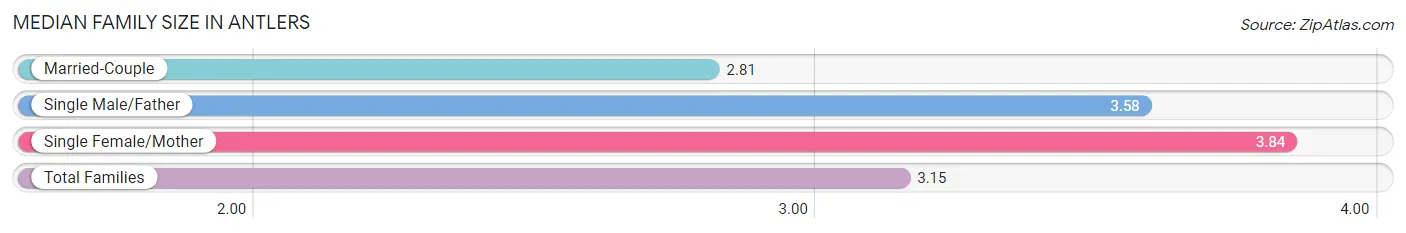
The median family size in Antlers is 3.15 persons per family, with single female/mother families (148 | 26.5%) accounting for the largest median family size of 3.84 persons per family. On the other hand, married-couple families (363 | 64.9%) represent the smallest median family size with 2.81 persons per family.
| Family Type | # Families | Family Size |
| Married-Couple | 363 (64.9%) | 2.81 |
| Single Male/Father | 48 (8.6%) | 3.58 |
| Single Female/Mother | 148 (26.5%) | 3.84 |
| Total Families | 559 (100.0%) | 3.15 |
Median Household Size in Antlers
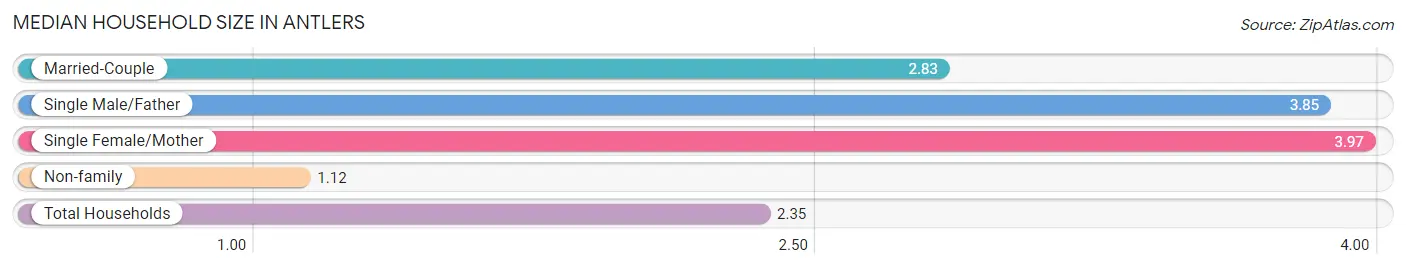
The median household size in Antlers is 2.35 persons per household, with single female/mother households (148 | 15.5%) accounting for the largest median household size of 3.97 persons per household. non-family households (396 | 41.5%) represent the smallest median household size with 1.12 persons per household.
| Household Type | # Households | Household Size |
| Married-Couple | 363 (38.0%) | 2.83 |
| Single Male/Father | 48 (5.0%) | 3.85 |
| Single Female/Mother | 148 (15.5%) | 3.97 |
| Non-family | 396 (41.5%) | 1.12 |
| Total Households | 955 (100.0%) | 2.35 |
Household Size by Marriage Status in Antlers
Out of a total of 955 households in Antlers, 559 (58.5%) are family households, while 396 (41.5%) are nonfamily households. The most numerous type of family households are 2-person households, comprising 278, and the most common type of nonfamily households are 1-person households, comprising 337.
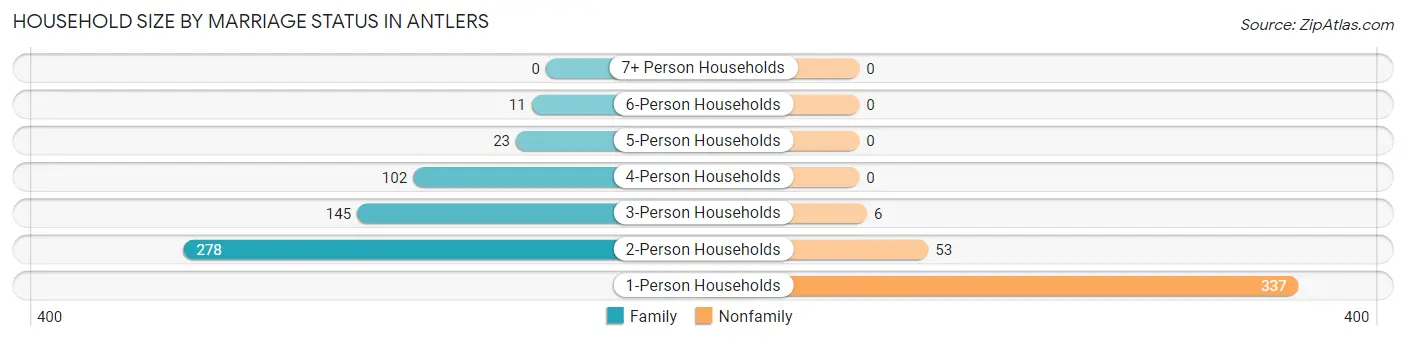
| Household Size | Family Households | Nonfamily Households |
| 1-Person Households | - | 337 (35.3%) |
| 2-Person Households | 278 (29.1%) | 53 (5.6%) |
| 3-Person Households | 145 (15.2%) | 6 (0.6%) |
| 4-Person Households | 102 (10.7%) | 0 (0.0%) |
| 5-Person Households | 23 (2.4%) | 0 (0.0%) |
| 6-Person Households | 11 (1.1%) | 0 (0.0%) |
| 7+ Person Households | 0 (0.0%) | 0 (0.0%) |
| Total | 559 (58.5%) | 396 (41.5%) |
Female Fertility in Antlers
Fertility by Age in Antlers
Average fertility rate in Antlers is 50.0 births per 1,000 women. Women in the age bracket of 20 to 34 years have the highest fertility rate with 64.0 births per 1,000 women. Women in the age bracket of 20 to 34 years acount for 76.9% of all women with births.
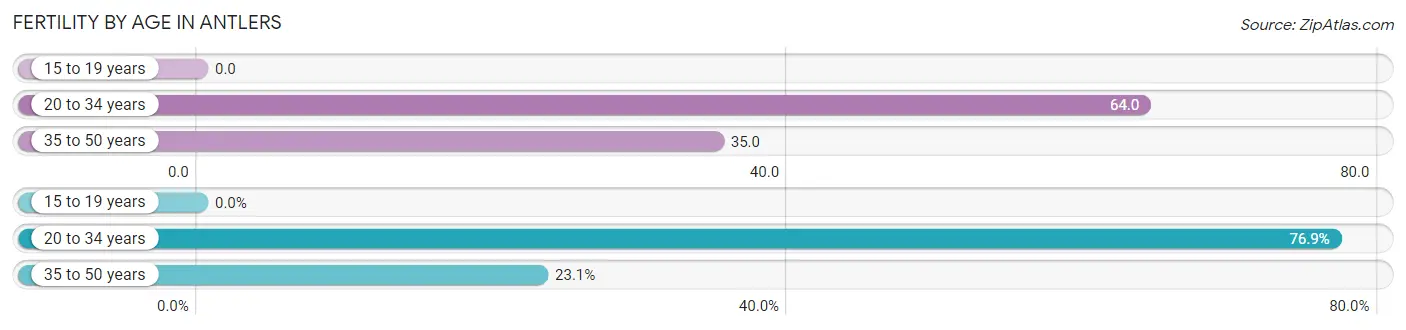
| Age Bracket | Women with Births | Births / 1,000 Women |
| 15 to 19 years | 0 (0.0%) | 0.0 |
| 20 to 34 years | 20 (76.9%) | 64.0 |
| 35 to 50 years | 6 (23.1%) | 35.0 |
| Total | 26 (100.0%) | 50.0 |
Fertility by Age by Marriage Status in Antlers
46.2% of women with births (26) in Antlers are married. The highest percentage of unmarried women with births falls into 20 to 34 years age bracket with 70.0% of them unmarried at the time of birth, while the lowest percentage of unmarried women with births belong to 35 to 50 years age bracket with 0.0% of them unmarried.
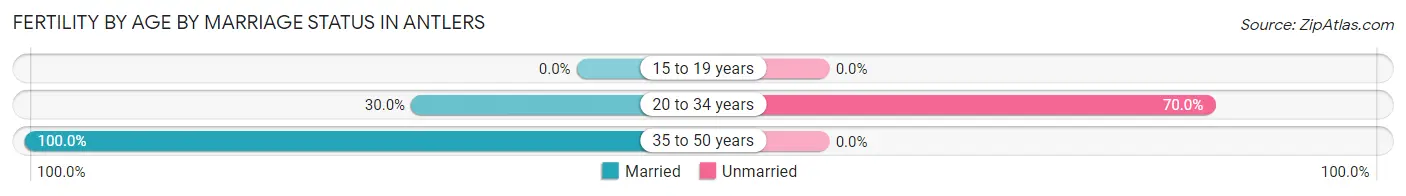
| Age Bracket | Married | Unmarried |
| 15 to 19 years | 0 (0.0%) | 0 (0.0%) |
| 20 to 34 years | 6 (30.0%) | 14 (70.0%) |
| 35 to 50 years | 6 (100.0%) | 0 (0.0%) |
| Total | 12 (46.2%) | 14 (53.8%) |
Fertility by Education in Antlers
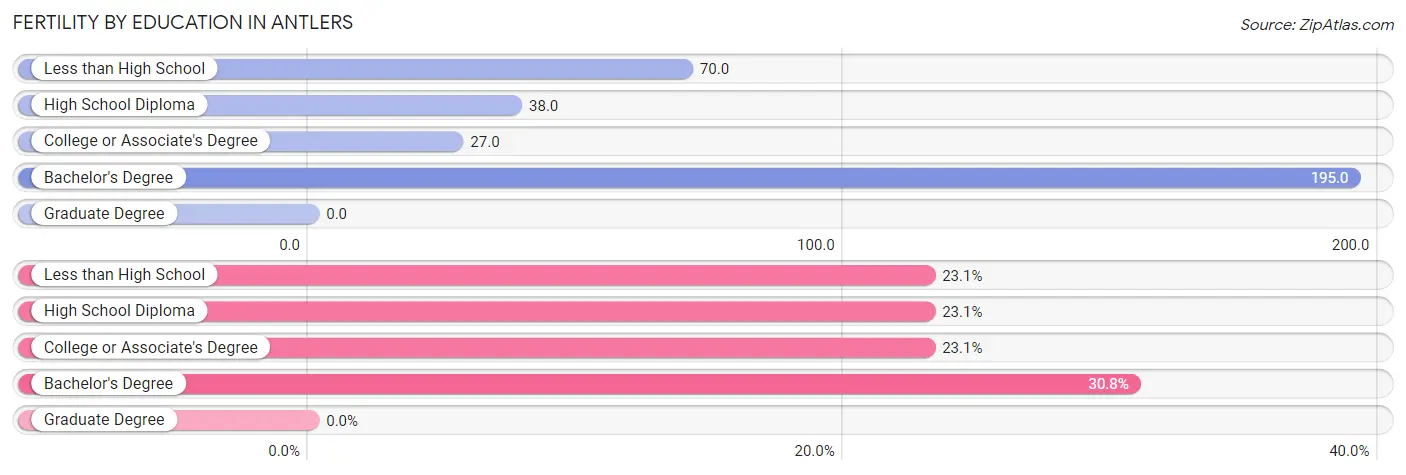
| Educational Attainment | Women with Births | Births / 1,000 Women |
| Less than High School | 6 (23.1%) | 70.0 |
| High School Diploma | 6 (23.1%) | 38.0 |
| College or Associate's Degree | 6 (23.1%) | 27.0 |
| Bachelor's Degree | 8 (30.8%) | 195.0 |
| Graduate Degree | 0 (0.0%) | 0.0 |
| Total | 26 (100.0%) | 50.0 |
Fertility by Education by Marriage Status in Antlers
53.8% of women with births in Antlers are unmarried. Women with the educational attainment of high school diploma are most likely to be married with 100.0% of them married at childbirth, while women with the educational attainment of less than high school are least likely to be married with 100.0% of them unmarried at childbirth.
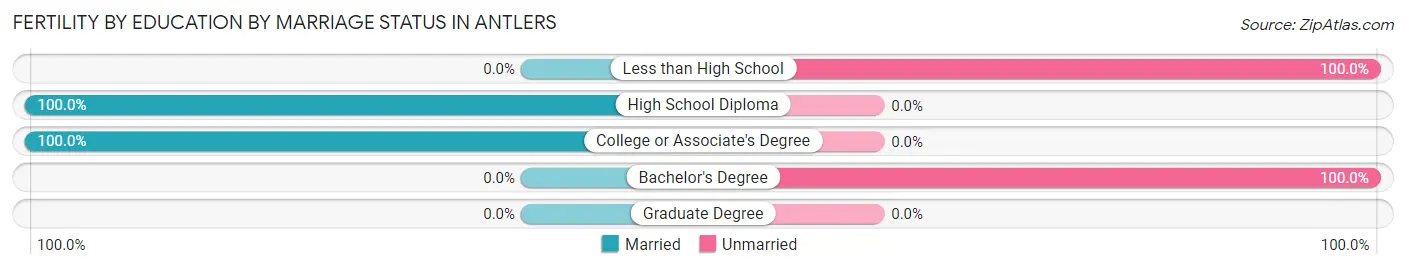
| Educational Attainment | Married | Unmarried |
| Less than High School | 0 (0.0%) | 6 (100.0%) |
| High School Diploma | 6 (100.0%) | 0 (0.0%) |
| College or Associate's Degree | 6 (100.0%) | 0 (0.0%) |
| Bachelor's Degree | 0 (0.0%) | 8 (100.0%) |
| Graduate Degree | 0 (0.0%) | 0 (0.0%) |
| Total | 12 (46.2%) | 14 (53.8%) |
Employment Characteristics in Antlers
Employment by Class of Employer in Antlers
Among the 692 employed individuals in Antlers, private company employees (448 | 64.7%), local government employees (96 | 13.9%), and self-employed (not incorporated) (46 | 6.7%) make up the most common classes of employment.
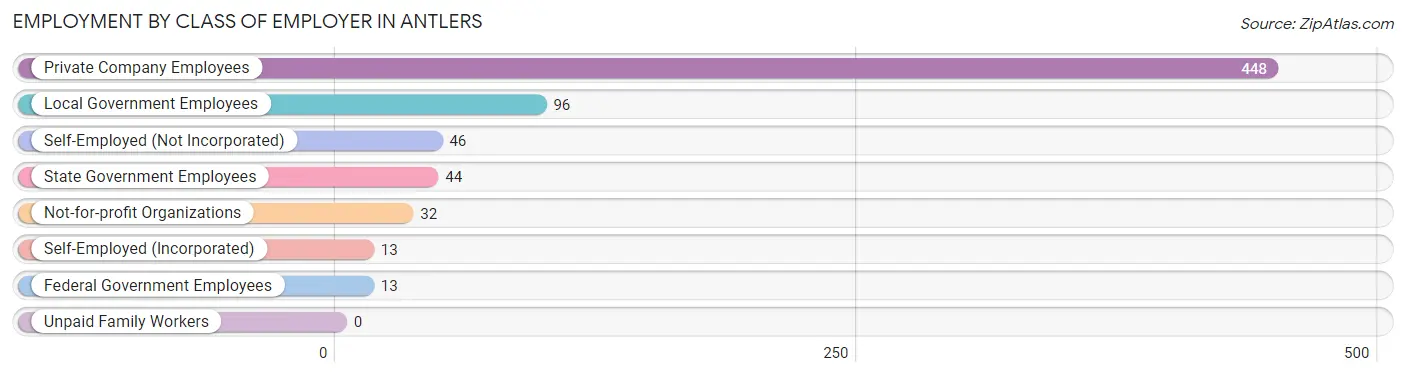
| Employer Class | # Employees | % Employees |
| Private Company Employees | 448 | 64.7% |
| Self-Employed (Incorporated) | 13 | 1.9% |
| Self-Employed (Not Incorporated) | 46 | 6.7% |
| Not-for-profit Organizations | 32 | 4.6% |
| Local Government Employees | 96 | 13.9% |
| State Government Employees | 44 | 6.4% |
| Federal Government Employees | 13 | 1.9% |
| Unpaid Family Workers | 0 | 0.0% |
| Total | 692 | 100.0% |
Employment Status by Age in Antlers
According to the labor force statistics for Antlers, out of the total population over 16 years of age (1,824), 44.5% or 812 individuals are in the labor force, with 12.8% or 104 of them unemployed. The age group with the highest labor force participation rate is 25 to 29 years, with 73.5% or 108 individuals in the labor force. Within the labor force, the 75 years and over age range has the highest percentage of unemployed individuals, with 100.0% or 1 of them being unemployed.
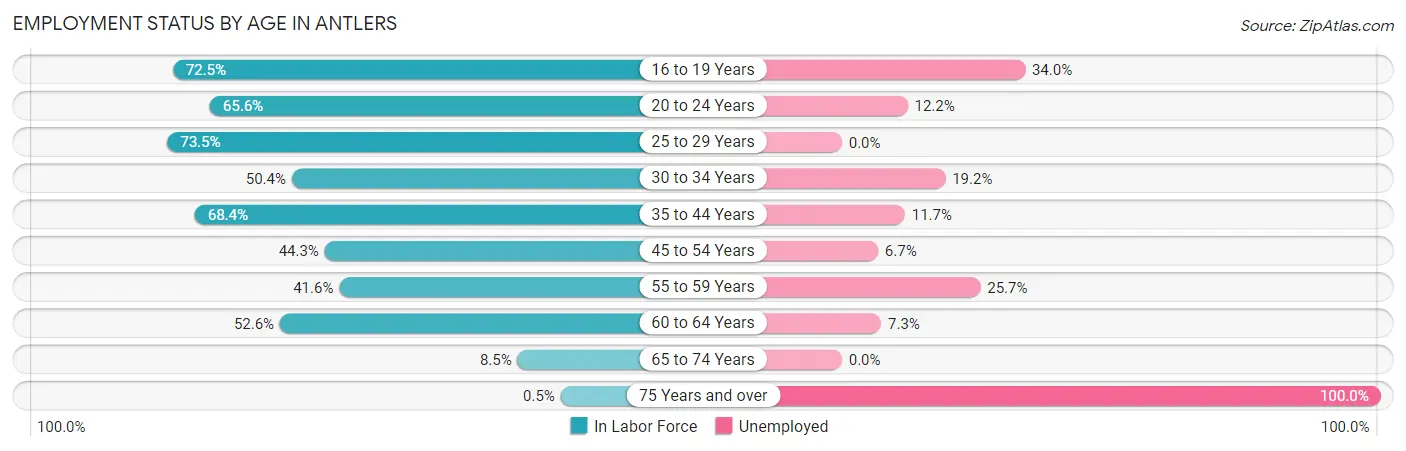
| Age Bracket | In Labor Force | Unemployed |
| 16 to 19 Years | 50 (72.5%) | 17 (34.0%) |
| 20 to 24 Years | 82 (65.6%) | 10 (12.2%) |
| 25 to 29 Years | 108 (73.5%) | 0 (0.0%) |
| 30 to 34 Years | 125 (50.4%) | 24 (19.2%) |
| 35 to 44 Years | 180 (68.4%) | 21 (11.7%) |
| 45 to 54 Years | 89 (44.3%) | 6 (6.7%) |
| 55 to 59 Years | 74 (41.6%) | 19 (25.7%) |
| 60 to 64 Years | 82 (52.6%) | 6 (7.3%) |
| 65 to 74 Years | 21 (8.5%) | 0 (0.0%) |
| 75 Years and over | 1 (0.5%) | 1 (100.0%) |
| Total | 812 (44.5%) | 104 (12.8%) |
Employment Status by Educational Attainment in Antlers
According to labor force statistics for Antlers, 55.2% of individuals (659) out of the total population between 25 and 64 years of age (1,193) are in the labor force, with 11.6% or 76 of them being unemployed. The group with the highest labor force participation rate are those with the educational attainment of bachelor's degree or higher, with 92.1% or 139 individuals in the labor force. Within the labor force, individuals with less than high school education have the highest percentage of unemployment, with 24.5% or 24 of them being unemployed.
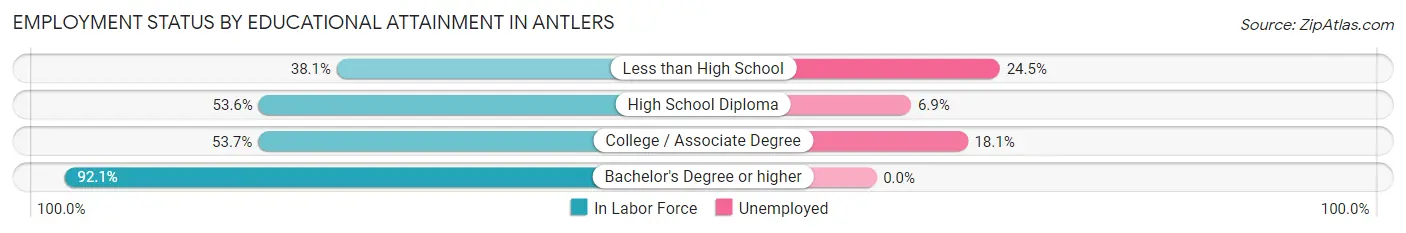
| Educational Attainment | In Labor Force | Unemployed |
| Less than High School | 98 (38.1%) | 63 (24.5%) |
| High School Diploma | 217 (53.6%) | 28 (6.9%) |
| College / Associate Degree | 204 (53.7%) | 69 (18.1%) |
| Bachelor's Degree or higher | 139 (92.1%) | 0 (0.0%) |
| Total | 659 (55.2%) | 138 (11.6%) |
Employment Occupations by Sex in Antlers
Management, Business, Science and Arts Occupations
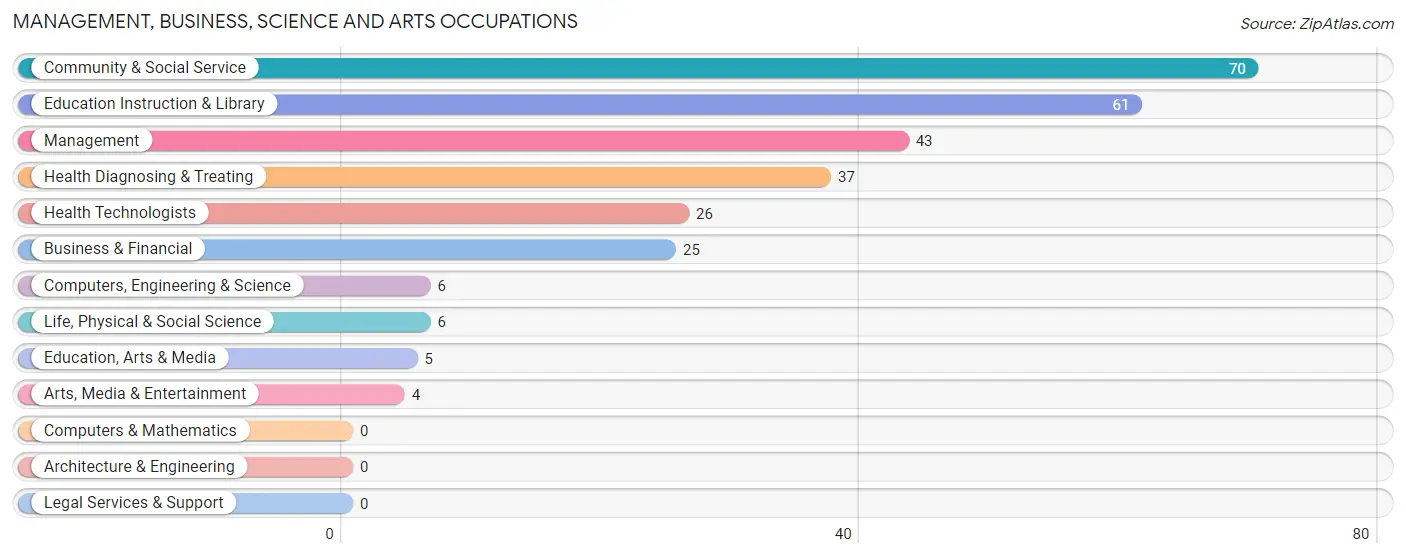
The most common Management, Business, Science and Arts occupations in Antlers are Community & Social Service (70 | 9.9%), Education Instruction & Library (61 | 8.6%), Management (43 | 6.1%), Health Diagnosing & Treating (37 | 5.2%), and Health Technologists (26 | 3.7%).
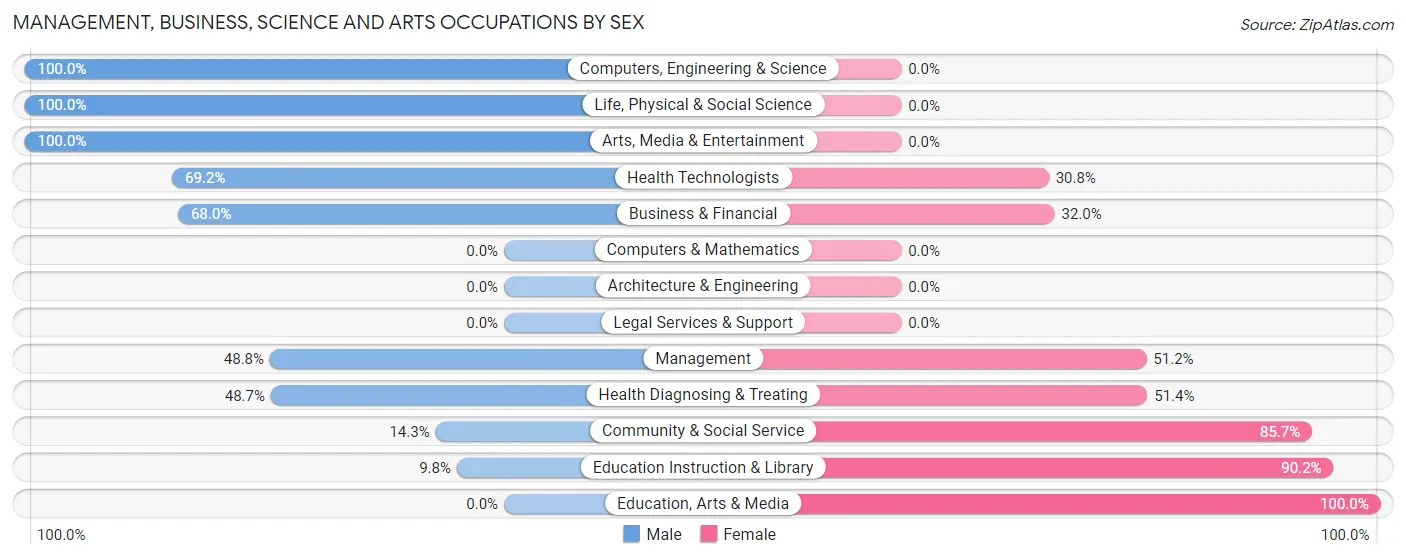
Management, Business, Science and Arts Occupations by Sex
Within the Management, Business, Science and Arts occupations in Antlers, the most male-oriented occupations are Computers, Engineering & Science (100.0%), Life, Physical & Social Science (100.0%), and Arts, Media & Entertainment (100.0%), while the most female-oriented occupations are Education, Arts & Media (100.0%), Education Instruction & Library (90.2%), and Community & Social Service (85.7%).
| Occupation | Male | Female |
| Management | 21 (48.8%) | 22 (51.2%) |
| Business & Financial | 17 (68.0%) | 8 (32.0%) |
| Computers, Engineering & Science | 6 (100.0%) | 0 (0.0%) |
| Computers & Mathematics | 0 (0.0%) | 0 (0.0%) |
| Architecture & Engineering | 0 (0.0%) | 0 (0.0%) |
| Life, Physical & Social Science | 6 (100.0%) | 0 (0.0%) |
| Community & Social Service | 10 (14.3%) | 60 (85.7%) |
| Education, Arts & Media | 0 (0.0%) | 5 (100.0%) |
| Legal Services & Support | 0 (0.0%) | 0 (0.0%) |
| Education Instruction & Library | 6 (9.8%) | 55 (90.2%) |
| Arts, Media & Entertainment | 4 (100.0%) | 0 (0.0%) |
| Health Diagnosing & Treating | 18 (48.6%) | 19 (51.3%) |
| Health Technologists | 18 (69.2%) | 8 (30.8%) |
| Total (Category) | 72 (39.8%) | 109 (60.2%) |
| Total (Overall) | 386 (54.5%) | 322 (45.5%) |
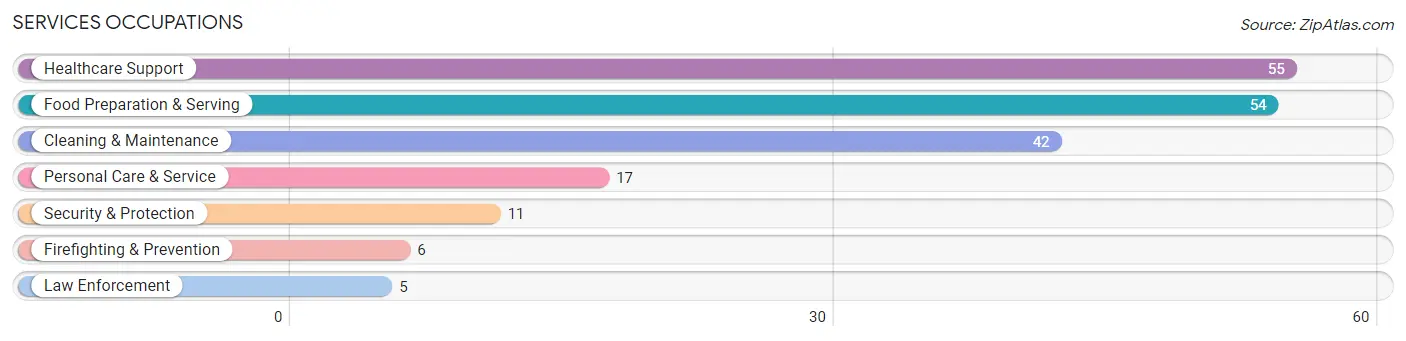
Services Occupations
The most common Services occupations in Antlers are Healthcare Support (55 | 7.8%), Food Preparation & Serving (54 | 7.6%), Cleaning & Maintenance (42 | 5.9%), Personal Care & Service (17 | 2.4%), and Security & Protection (11 | 1.5%).
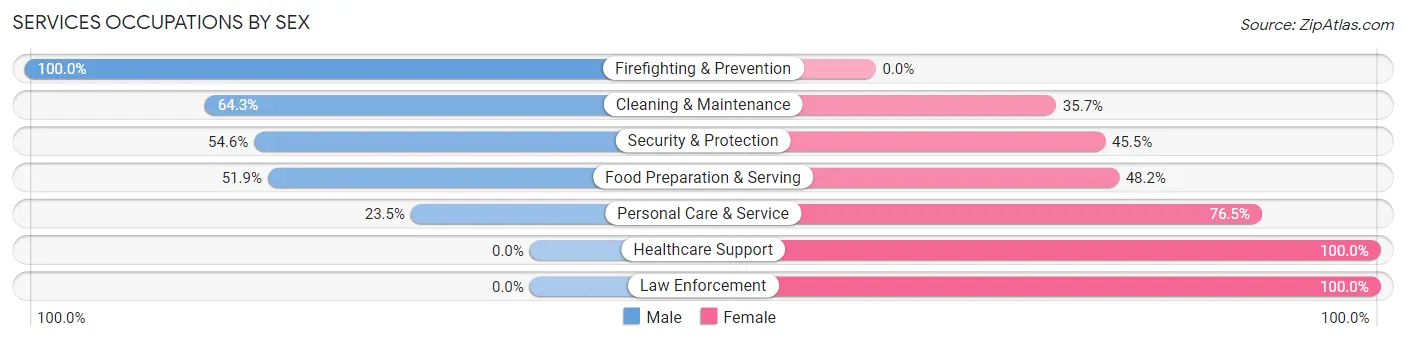
Services Occupations by Sex
Within the Services occupations in Antlers, the most male-oriented occupations are Firefighting & Prevention (100.0%), Cleaning & Maintenance (64.3%), and Security & Protection (54.5%), while the most female-oriented occupations are Healthcare Support (100.0%), Law Enforcement (100.0%), and Personal Care & Service (76.5%).
| Occupation | Male | Female |
| Healthcare Support | 0 (0.0%) | 55 (100.0%) |
| Security & Protection | 6 (54.5%) | 5 (45.5%) |
| Firefighting & Prevention | 6 (100.0%) | 0 (0.0%) |
| Law Enforcement | 0 (0.0%) | 5 (100.0%) |
| Food Preparation & Serving | 28 (51.8%) | 26 (48.1%) |
| Cleaning & Maintenance | 27 (64.3%) | 15 (35.7%) |
| Personal Care & Service | 4 (23.5%) | 13 (76.5%) |
| Total (Category) | 65 (36.3%) | 114 (63.7%) |
| Total (Overall) | 386 (54.5%) | 322 (45.5%) |
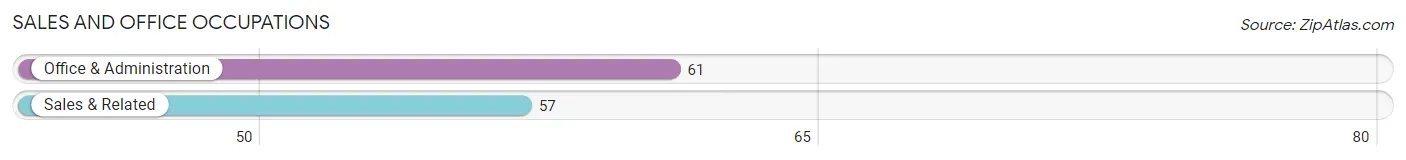
Sales and Office Occupations
The most common Sales and Office occupations in Antlers are Office & Administration (61 | 8.6%), and Sales & Related (57 | 8.1%).
Sales and Office Occupations by Sex
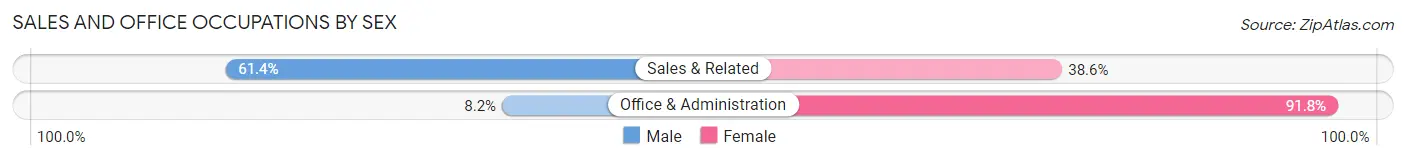
| Occupation | Male | Female |
| Sales & Related | 35 (61.4%) | 22 (38.6%) |
| Office & Administration | 5 (8.2%) | 56 (91.8%) |
| Total (Category) | 40 (33.9%) | 78 (66.1%) |
| Total (Overall) | 386 (54.5%) | 322 (45.5%) |
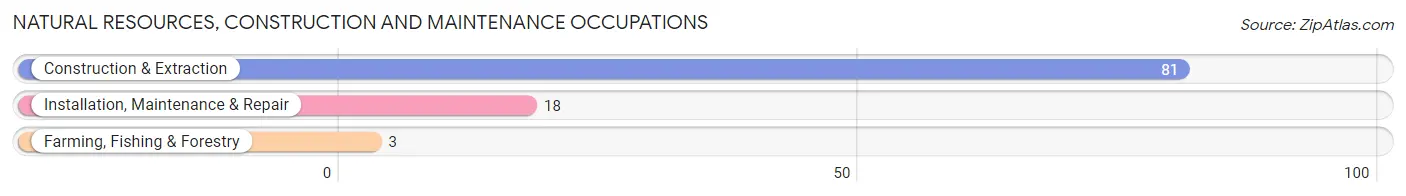
Natural Resources, Construction and Maintenance Occupations
The most common Natural Resources, Construction and Maintenance occupations in Antlers are Construction & Extraction (81 | 11.4%), Installation, Maintenance & Repair (18 | 2.5%), and Farming, Fishing & Forestry (3 | 0.4%).
Natural Resources, Construction and Maintenance Occupations by Sex
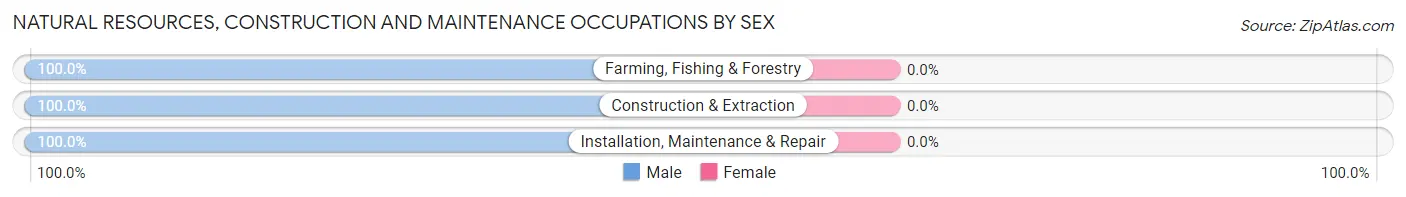
| Occupation | Male | Female |
| Farming, Fishing & Forestry | 3 (100.0%) | 0 (0.0%) |
| Construction & Extraction | 81 (100.0%) | 0 (0.0%) |
| Installation, Maintenance & Repair | 18 (100.0%) | 0 (0.0%) |
| Total (Category) | 102 (100.0%) | 0 (0.0%) |
| Total (Overall) | 386 (54.5%) | 322 (45.5%) |
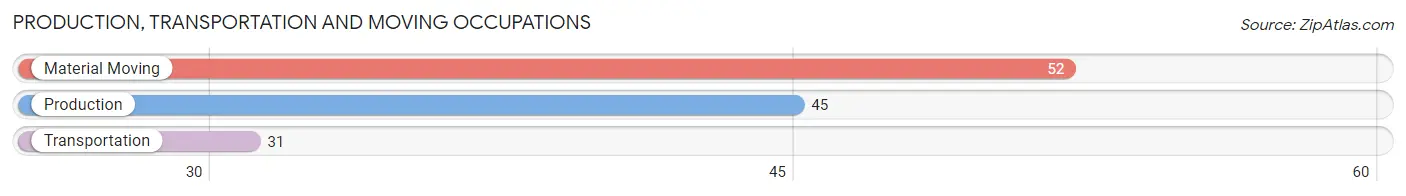
Production, Transportation and Moving Occupations
The most common Production, Transportation and Moving occupations in Antlers are Material Moving (52 | 7.3%), Production (45 | 6.4%), and Transportation (31 | 4.4%).
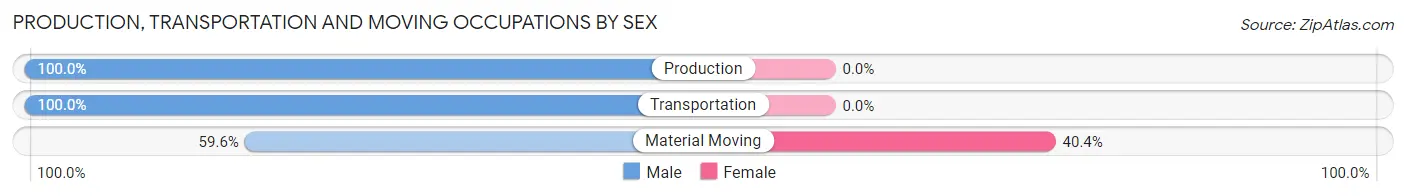
Production, Transportation and Moving Occupations by Sex
| Occupation | Male | Female |
| Production | 45 (100.0%) | 0 (0.0%) |
| Transportation | 31 (100.0%) | 0 (0.0%) |
| Material Moving | 31 (59.6%) | 21 (40.4%) |
| Total (Category) | 107 (83.6%) | 21 (16.4%) |
| Total (Overall) | 386 (54.5%) | 322 (45.5%) |
Employment Industries by Sex in Antlers
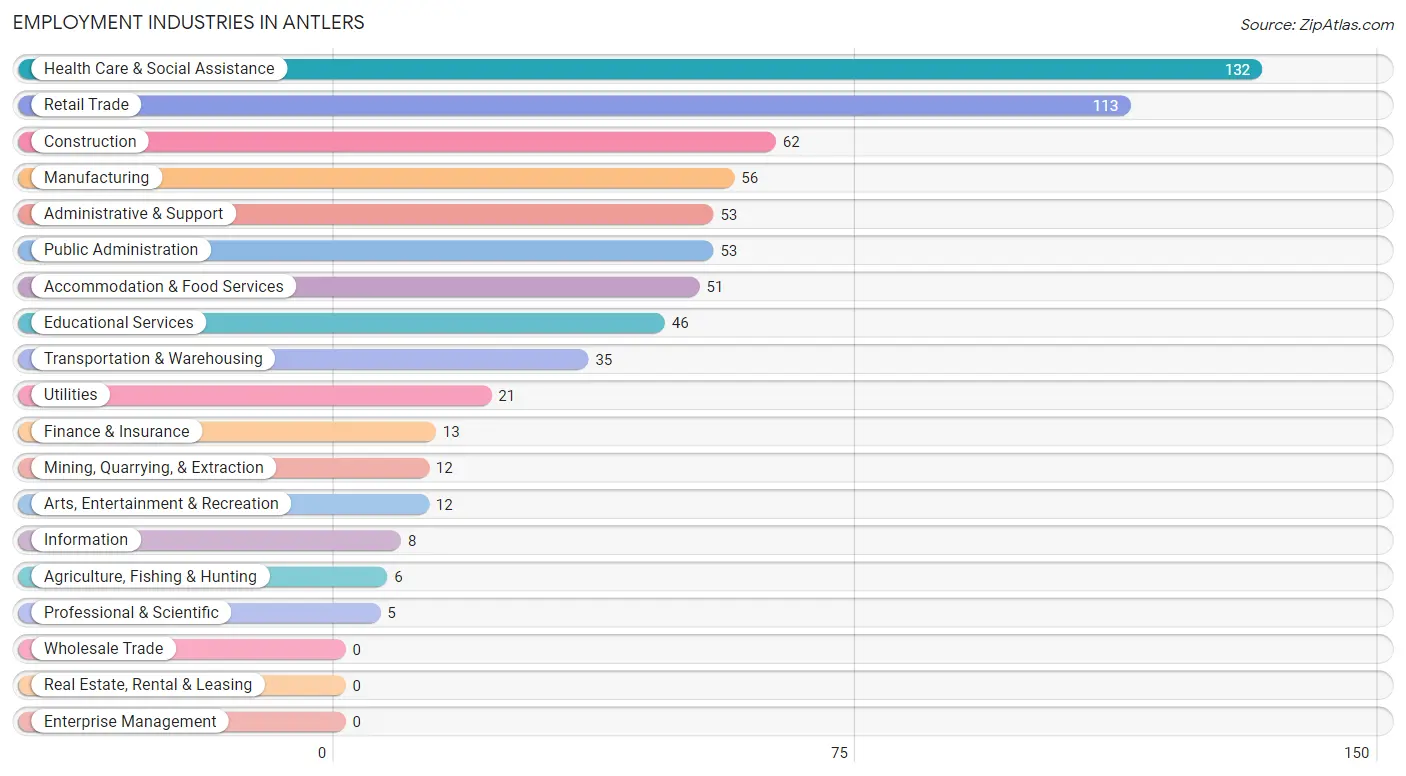
Employment Industries in Antlers
The major employment industries in Antlers include Health Care & Social Assistance (132 | 18.6%), Retail Trade (113 | 16.0%), Construction (62 | 8.8%), Manufacturing (56 | 7.9%), and Administrative & Support (53 | 7.5%).
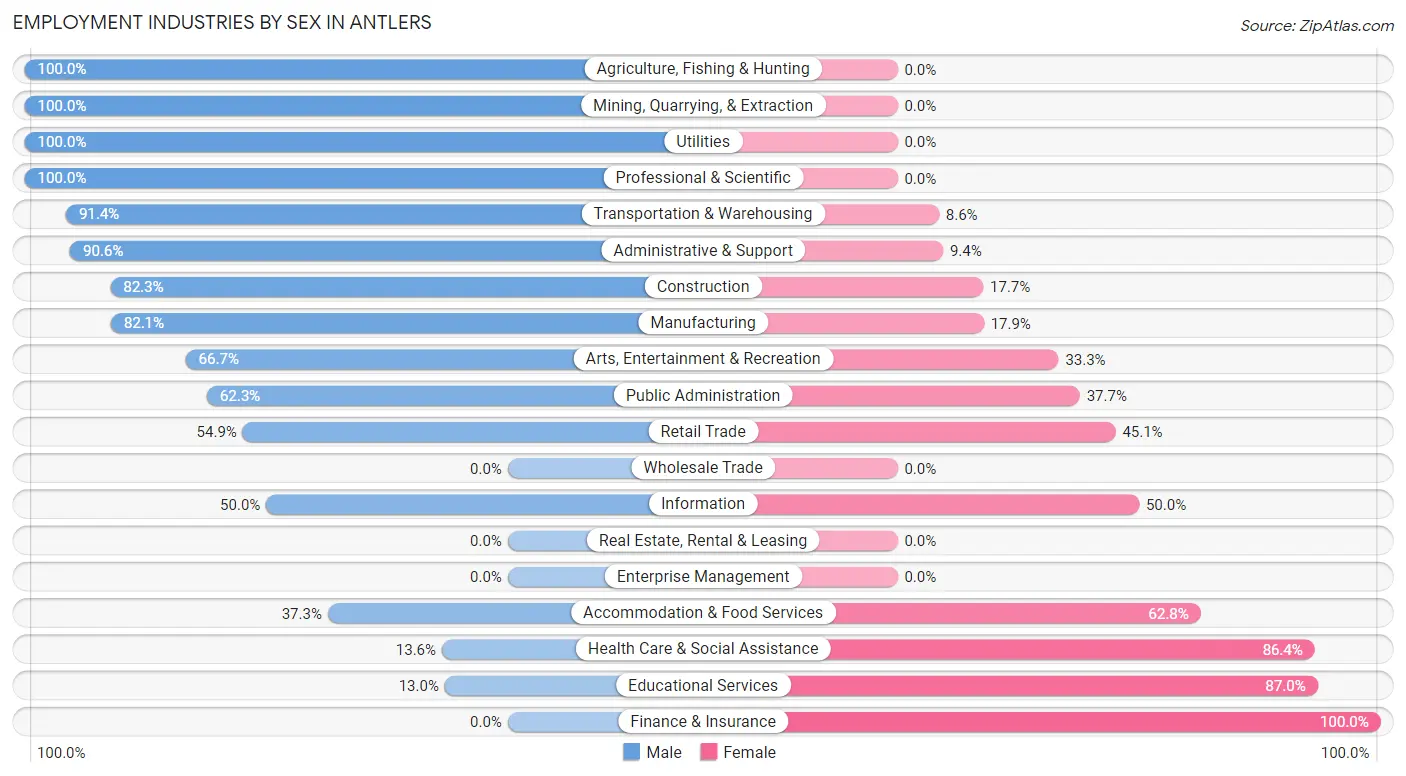
Employment Industries by Sex in Antlers
The Antlers industries that see more men than women are Agriculture, Fishing & Hunting (100.0%), Mining, Quarrying, & Extraction (100.0%), and Utilities (100.0%), whereas the industries that tend to have a higher number of women are Finance & Insurance (100.0%), Educational Services (87.0%), and Health Care & Social Assistance (86.4%).
| Industry | Male | Female |
| Agriculture, Fishing & Hunting | 6 (100.0%) | 0 (0.0%) |
| Mining, Quarrying, & Extraction | 12 (100.0%) | 0 (0.0%) |
| Construction | 51 (82.3%) | 11 (17.7%) |
| Manufacturing | 46 (82.1%) | 10 (17.9%) |
| Wholesale Trade | 0 (0.0%) | 0 (0.0%) |
| Retail Trade | 62 (54.9%) | 51 (45.1%) |
| Transportation & Warehousing | 32 (91.4%) | 3 (8.6%) |
| Utilities | 21 (100.0%) | 0 (0.0%) |
| Information | 4 (50.0%) | 4 (50.0%) |
| Finance & Insurance | 0 (0.0%) | 13 (100.0%) |
| Real Estate, Rental & Leasing | 0 (0.0%) | 0 (0.0%) |
| Professional & Scientific | 5 (100.0%) | 0 (0.0%) |
| Enterprise Management | 0 (0.0%) | 0 (0.0%) |
| Administrative & Support | 48 (90.6%) | 5 (9.4%) |
| Educational Services | 6 (13.0%) | 40 (87.0%) |
| Health Care & Social Assistance | 18 (13.6%) | 114 (86.4%) |
| Arts, Entertainment & Recreation | 8 (66.7%) | 4 (33.3%) |
| Accommodation & Food Services | 19 (37.2%) | 32 (62.7%) |
| Public Administration | 33 (62.3%) | 20 (37.7%) |
| Total | 386 (54.5%) | 322 (45.5%) |
Education in Antlers
School Enrollment in Antlers
The most common levels of schooling among the 488 students in Antlers are elementary school (155 | 31.8%), college / undergraduate (104 | 21.3%), and high school (84 | 17.2%).
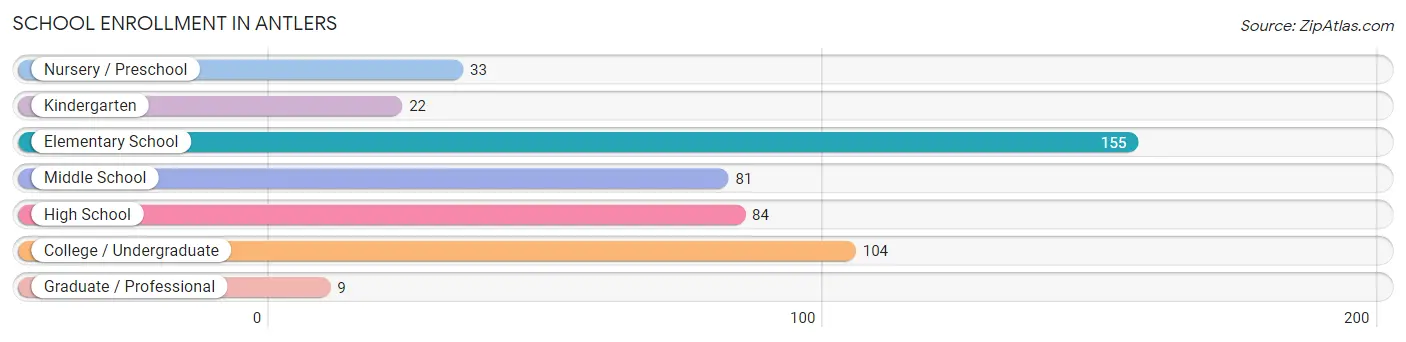
| School Level | # Students | % Students |
| Nursery / Preschool | 33 | 6.8% |
| Kindergarten | 22 | 4.5% |
| Elementary School | 155 | 31.8% |
| Middle School | 81 | 16.6% |
| High School | 84 | 17.2% |
| College / Undergraduate | 104 | 21.3% |
| Graduate / Professional | 9 | 1.8% |
| Total | 488 | 100.0% |
School Enrollment by Age by Funding Source in Antlers
Out of a total of 488 students who are enrolled in schools in Antlers, 13 (2.7%) attend a private institution, while the remaining 475 (97.3%) are enrolled in public schools. The age group of 25 to 34 year olds has the highest likelihood of being enrolled in private schools, with 7 (10.9% in the age bracket) enrolled. Conversely, the age group of 3 to 4 year olds has the lowest likelihood of being enrolled in a private school, with 17 (100.0% in the age bracket) attending a public institution.
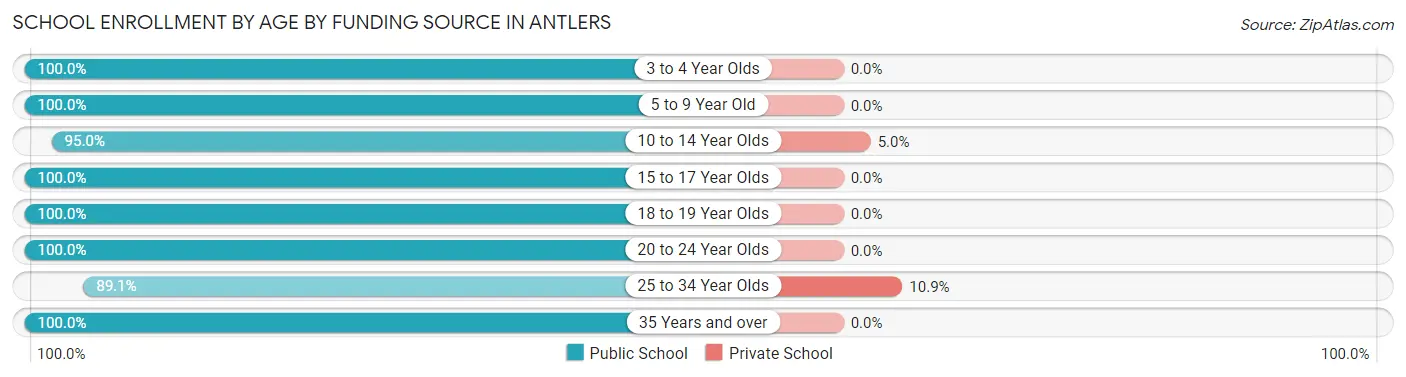
| Age Bracket | Public School | Private School |
| 3 to 4 Year Olds | 17 (100.0%) | 0 (0.0%) |
| 5 to 9 Year Old | 169 (100.0%) | 0 (0.0%) |
| 10 to 14 Year Olds | 113 (95.0%) | 6 (5.0%) |
| 15 to 17 Year Olds | 53 (100.0%) | 0 (0.0%) |
| 18 to 19 Year Olds | 46 (100.0%) | 0 (0.0%) |
| 20 to 24 Year Olds | 9 (100.0%) | 0 (0.0%) |
| 25 to 34 Year Olds | 57 (89.1%) | 7 (10.9%) |
| 35 Years and over | 11 (100.0%) | 0 (0.0%) |
| Total | 475 (97.3%) | 13 (2.7%) |
Educational Attainment by Field of Study in Antlers
Education (93 | 35.6%), business (36 | 13.8%), arts & humanities (33 | 12.6%), science & technology (24 | 9.2%), and psychology (21 | 8.1%) are the most common fields of study among 261 individuals in Antlers who have obtained a bachelor's degree or higher.
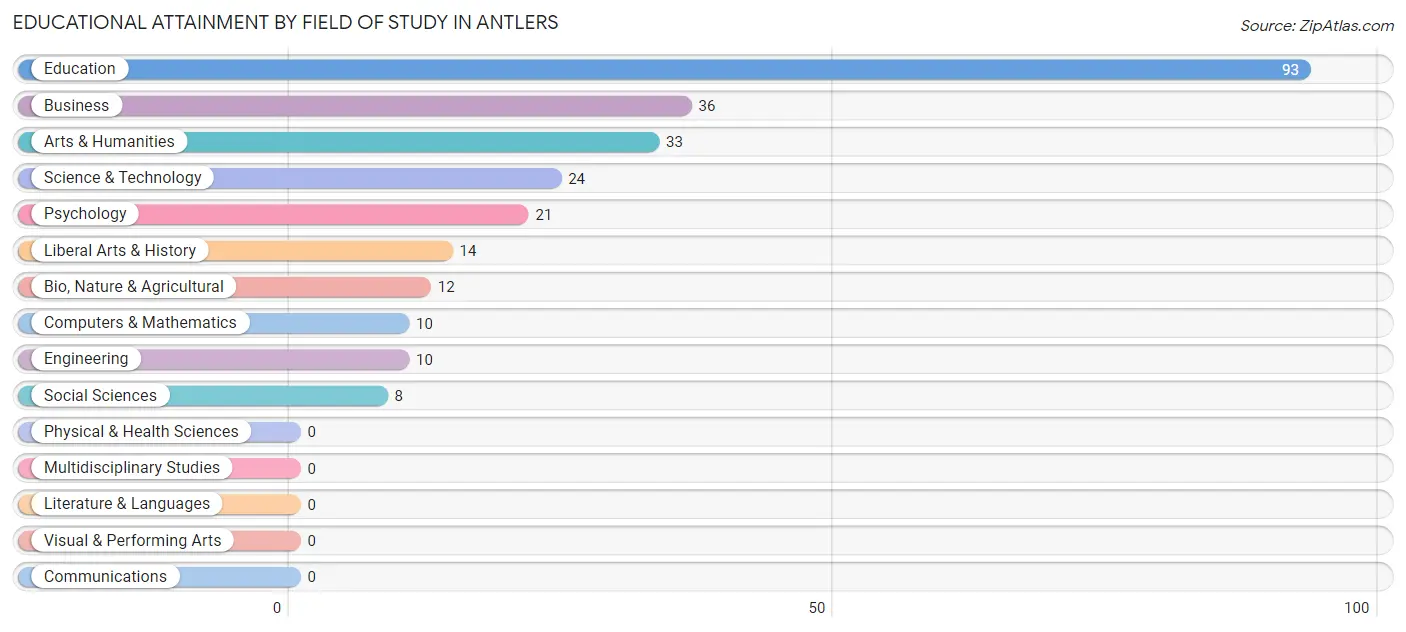
| Field of Study | # Graduates | % Graduates |
| Computers & Mathematics | 10 | 3.8% |
| Bio, Nature & Agricultural | 12 | 4.6% |
| Physical & Health Sciences | 0 | 0.0% |
| Psychology | 21 | 8.1% |
| Social Sciences | 8 | 3.1% |
| Engineering | 10 | 3.8% |
| Multidisciplinary Studies | 0 | 0.0% |
| Science & Technology | 24 | 9.2% |
| Business | 36 | 13.8% |
| Education | 93 | 35.6% |
| Literature & Languages | 0 | 0.0% |
| Liberal Arts & History | 14 | 5.4% |
| Visual & Performing Arts | 0 | 0.0% |
| Communications | 0 | 0.0% |
| Arts & Humanities | 33 | 12.6% |
| Total | 261 | 100.0% |
Transportation & Commute in Antlers
Vehicle Availability by Sex in Antlers
The most prevalent vehicle ownership categories in Antlers are males with 3 vehicles (142, accounting for 36.8%) and females with 3 vehicles (80, making up 46.4%).
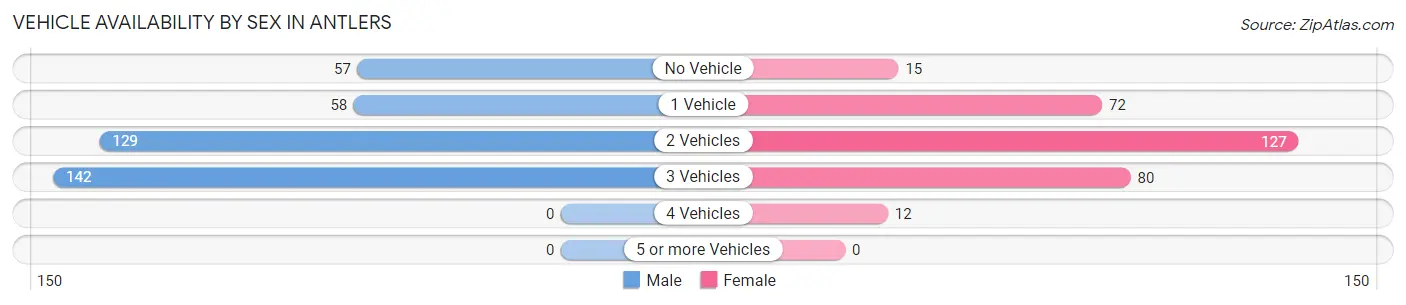
| Vehicles Available | Male | Female |
| No Vehicle | 57 (14.8%) | 15 (4.9%) |
| 1 Vehicle | 58 (15.0%) | 72 (23.5%) |
| 2 Vehicles | 129 (33.4%) | 127 (41.5%) |
| 3 Vehicles | 142 (36.8%) | 80 (26.1%) |
| 4 Vehicles | 0 (0.0%) | 12 (3.9%) |
| 5 or more Vehicles | 0 (0.0%) | 0 (0.0%) |
| Total | 386 (100.0%) | 306 (100.0%) |
Commute Time in Antlers
The most frequently occuring commute durations in Antlers are 5 to 9 minutes (161 commuters, 24.2%), less than 5 minutes (146 commuters, 21.9%), and 10 to 14 minutes (110 commuters, 16.5%).
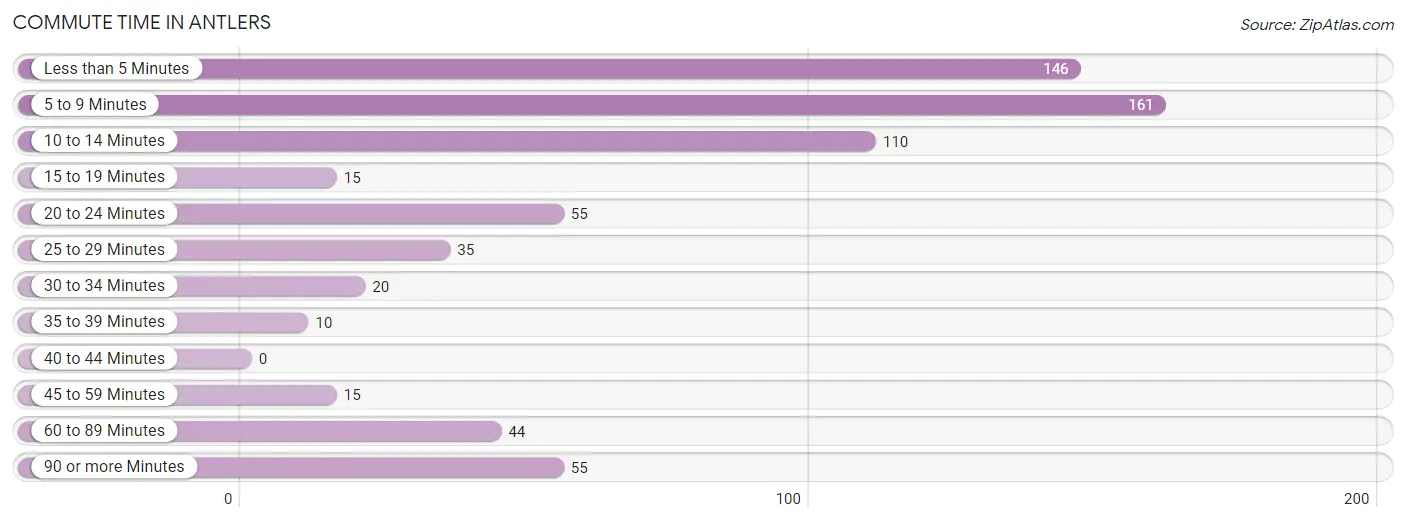
| Commute Time | # Commuters | % Commuters |
| Less than 5 Minutes | 146 | 21.9% |
| 5 to 9 Minutes | 161 | 24.2% |
| 10 to 14 Minutes | 110 | 16.5% |
| 15 to 19 Minutes | 15 | 2.2% |
| 20 to 24 Minutes | 55 | 8.3% |
| 25 to 29 Minutes | 35 | 5.3% |
| 30 to 34 Minutes | 20 | 3.0% |
| 35 to 39 Minutes | 10 | 1.5% |
| 40 to 44 Minutes | 0 | 0.0% |
| 45 to 59 Minutes | 15 | 2.2% |
| 60 to 89 Minutes | 44 | 6.6% |
| 90 or more Minutes | 55 | 8.3% |
Commute Time by Sex in Antlers
The most common commute times in Antlers are 10 to 14 minutes (73 commuters, 20.2%) for males and 5 to 9 minutes (121 commuters, 39.8%) for females.
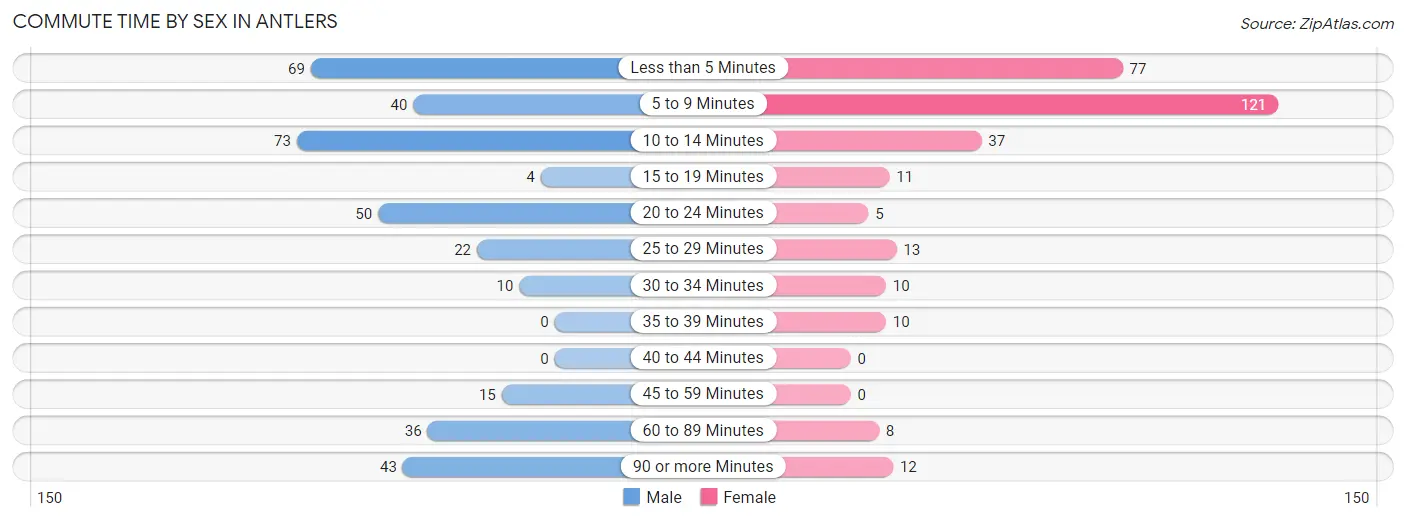
| Commute Time | Male | Female |
| Less than 5 Minutes | 69 (19.1%) | 77 (25.3%) |
| 5 to 9 Minutes | 40 (11.1%) | 121 (39.8%) |
| 10 to 14 Minutes | 73 (20.2%) | 37 (12.2%) |
| 15 to 19 Minutes | 4 (1.1%) | 11 (3.6%) |
| 20 to 24 Minutes | 50 (13.8%) | 5 (1.6%) |
| 25 to 29 Minutes | 22 (6.1%) | 13 (4.3%) |
| 30 to 34 Minutes | 10 (2.8%) | 10 (3.3%) |
| 35 to 39 Minutes | 0 (0.0%) | 10 (3.3%) |
| 40 to 44 Minutes | 0 (0.0%) | 0 (0.0%) |
| 45 to 59 Minutes | 15 (4.1%) | 0 (0.0%) |
| 60 to 89 Minutes | 36 (9.9%) | 8 (2.6%) |
| 90 or more Minutes | 43 (11.9%) | 12 (4.0%) |
Time of Departure to Work by Sex in Antlers
The most frequent times of departure to work in Antlers are 7:30 AM to 7:59 AM (45, 12.4%) for males and 7:00 AM to 7:29 AM (75, 24.7%) for females.
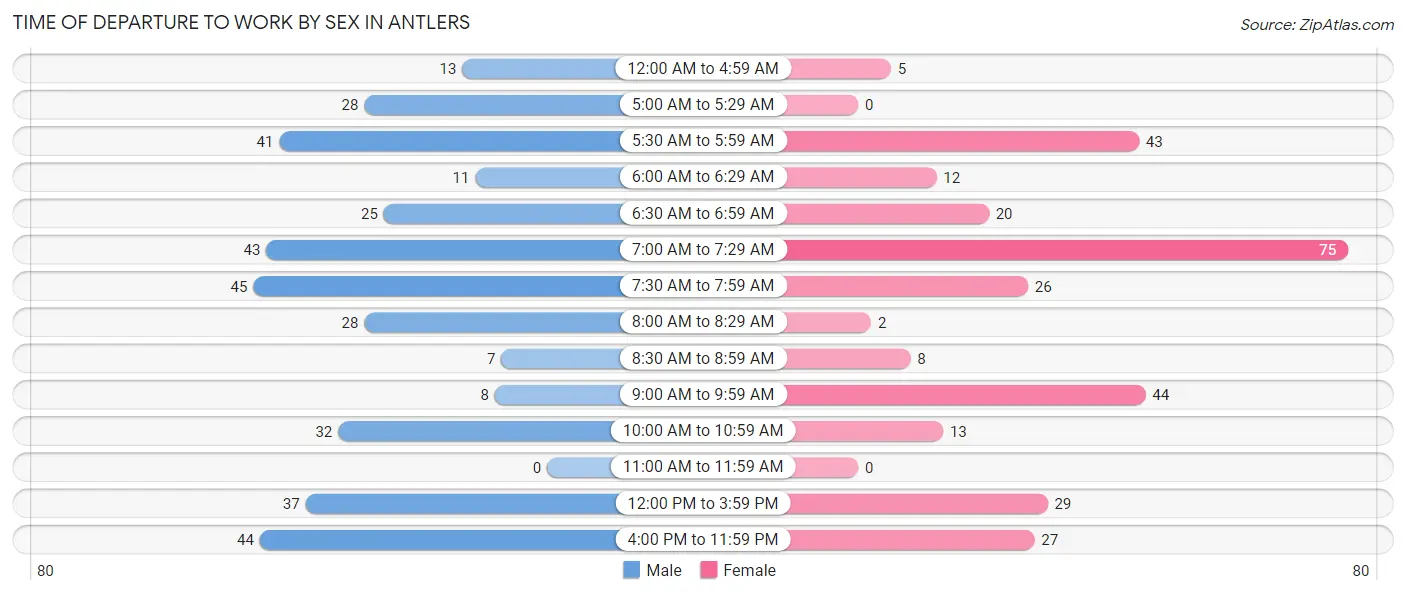
| Time of Departure | Male | Female |
| 12:00 AM to 4:59 AM | 13 (3.6%) | 5 (1.6%) |
| 5:00 AM to 5:29 AM | 28 (7.7%) | 0 (0.0%) |
| 5:30 AM to 5:59 AM | 41 (11.3%) | 43 (14.1%) |
| 6:00 AM to 6:29 AM | 11 (3.0%) | 12 (4.0%) |
| 6:30 AM to 6:59 AM | 25 (6.9%) | 20 (6.6%) |
| 7:00 AM to 7:29 AM | 43 (11.9%) | 75 (24.7%) |
| 7:30 AM to 7:59 AM | 45 (12.4%) | 26 (8.6%) |
| 8:00 AM to 8:29 AM | 28 (7.7%) | 2 (0.7%) |
| 8:30 AM to 8:59 AM | 7 (1.9%) | 8 (2.6%) |
| 9:00 AM to 9:59 AM | 8 (2.2%) | 44 (14.5%) |
| 10:00 AM to 10:59 AM | 32 (8.8%) | 13 (4.3%) |
| 11:00 AM to 11:59 AM | 0 (0.0%) | 0 (0.0%) |
| 12:00 PM to 3:59 PM | 37 (10.2%) | 29 (9.5%) |
| 4:00 PM to 11:59 PM | 44 (12.1%) | 27 (8.9%) |
| Total | 362 (100.0%) | 304 (100.0%) |
Housing Occupancy in Antlers
Occupancy by Ownership in Antlers
Of the total 955 dwellings in Antlers, owner-occupied units account for 515 (53.9%), while renter-occupied units make up 440 (46.1%).
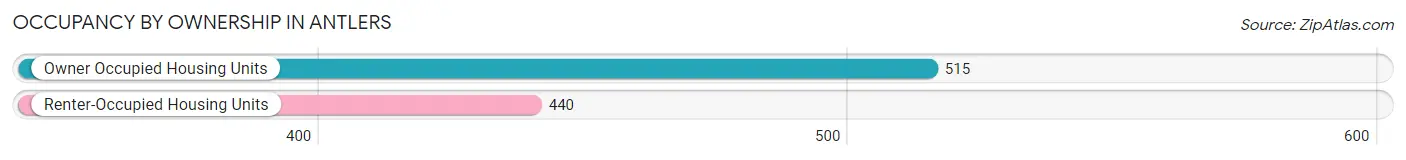
| Occupancy | # Housing Units | % Housing Units |
| Owner Occupied Housing Units | 515 | 53.9% |
| Renter-Occupied Housing Units | 440 | 46.1% |
| Total Occupied Housing Units | 955 | 100.0% |
Occupancy by Household Size in Antlers
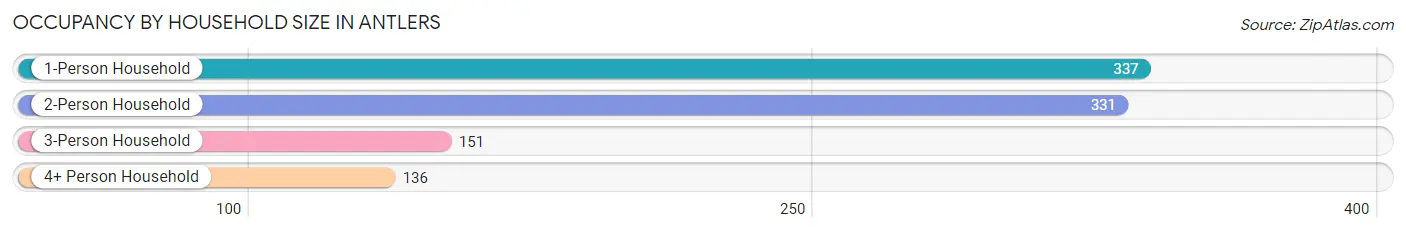
| Household Size | # Housing Units | % Housing Units |
| 1-Person Household | 337 | 35.3% |
| 2-Person Household | 331 | 34.7% |
| 3-Person Household | 151 | 15.8% |
| 4+ Person Household | 136 | 14.2% |
| Total Housing Units | 955 | 100.0% |
Occupancy by Ownership by Household Size in Antlers
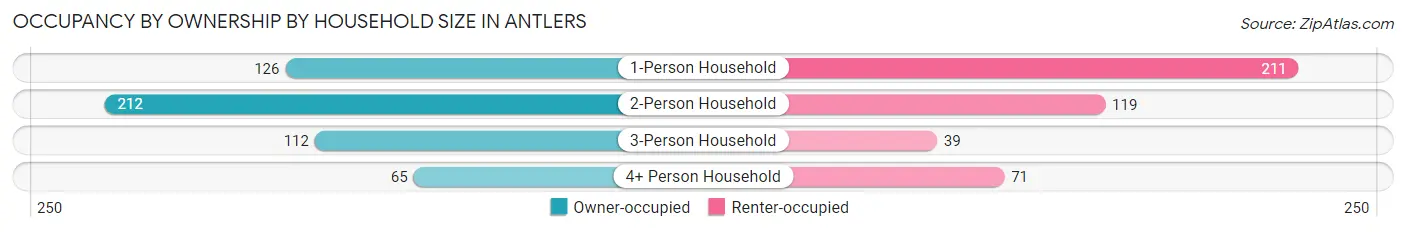
| Household Size | Owner-occupied | Renter-occupied |
| 1-Person Household | 126 (37.4%) | 211 (62.6%) |
| 2-Person Household | 212 (64.0%) | 119 (35.9%) |
| 3-Person Household | 112 (74.2%) | 39 (25.8%) |
| 4+ Person Household | 65 (47.8%) | 71 (52.2%) |
| Total Housing Units | 515 (53.9%) | 440 (46.1%) |
Occupancy by Educational Attainment in Antlers
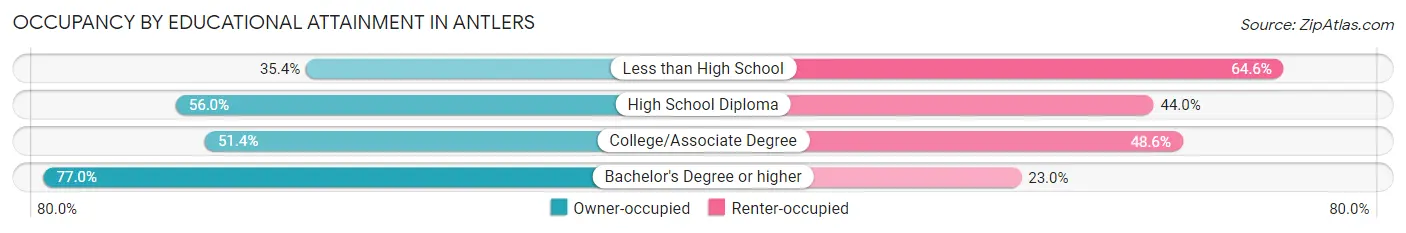
| Household Size | Owner-occupied | Renter-occupied |
| Less than High School | 58 (35.4%) | 106 (64.6%) |
| High School Diploma | 182 (56.0%) | 143 (44.0%) |
| College/Associate Degree | 168 (51.4%) | 159 (48.6%) |
| Bachelor's Degree or higher | 107 (77.0%) | 32 (23.0%) |
Occupancy by Age of Householder in Antlers
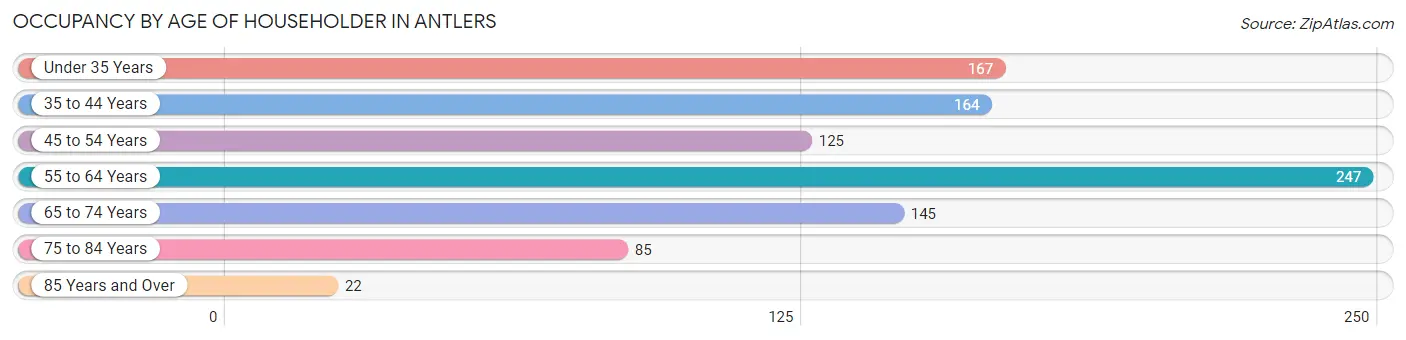
| Age Bracket | # Households | % Households |
| Under 35 Years | 167 | 17.5% |
| 35 to 44 Years | 164 | 17.2% |
| 45 to 54 Years | 125 | 13.1% |
| 55 to 64 Years | 247 | 25.9% |
| 65 to 74 Years | 145 | 15.2% |
| 75 to 84 Years | 85 | 8.9% |
| 85 Years and Over | 22 | 2.3% |
| Total | 955 | 100.0% |
Housing Finances in Antlers
Median Income by Occupancy in Antlers
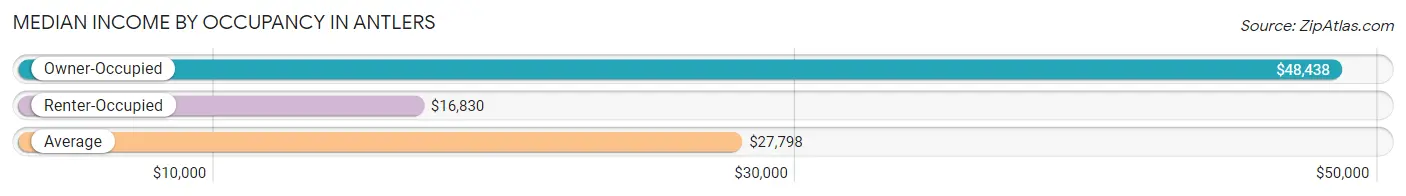
| Occupancy Type | # Households | Median Income |
| Owner-Occupied | 515 (53.9%) | $48,438 |
| Renter-Occupied | 440 (46.1%) | $16,830 |
| Average | 955 (100.0%) | $27,798 |
Occupancy by Householder Income Bracket in Antlers
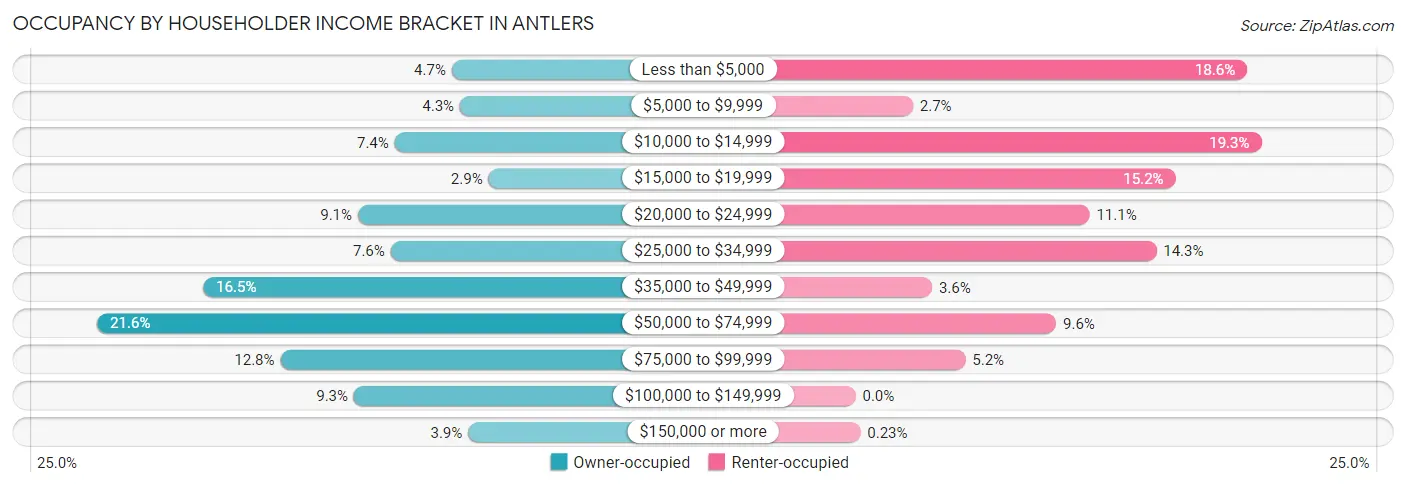
| Income Bracket | Owner-occupied | Renter-occupied |
| Less than $5,000 | 24 (4.7%) | 82 (18.6%) |
| $5,000 to $9,999 | 22 (4.3%) | 12 (2.7%) |
| $10,000 to $14,999 | 38 (7.4%) | 85 (19.3%) |
| $15,000 to $19,999 | 15 (2.9%) | 67 (15.2%) |
| $20,000 to $24,999 | 47 (9.1%) | 49 (11.1%) |
| $25,000 to $34,999 | 39 (7.6%) | 63 (14.3%) |
| $35,000 to $49,999 | 85 (16.5%) | 16 (3.6%) |
| $50,000 to $74,999 | 111 (21.5%) | 42 (9.6%) |
| $75,000 to $99,999 | 66 (12.8%) | 23 (5.2%) |
| $100,000 to $149,999 | 48 (9.3%) | 0 (0.0%) |
| $150,000 or more | 20 (3.9%) | 1 (0.2%) |
| Total | 515 (100.0%) | 440 (100.0%) |
Monthly Housing Cost Tiers in Antlers
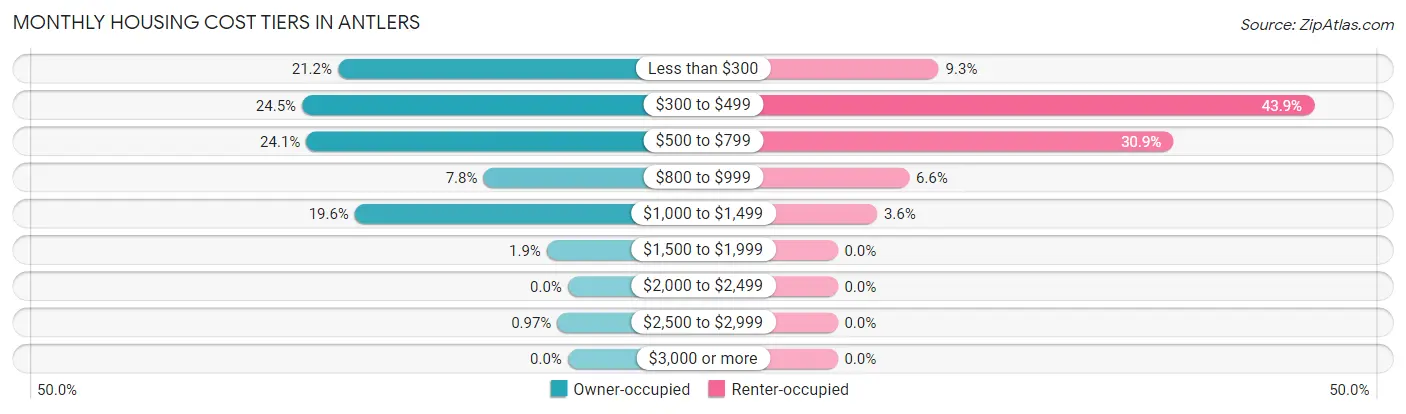
| Monthly Cost | Owner-occupied | Renter-occupied |
| Less than $300 | 109 (21.2%) | 41 (9.3%) |
| $300 to $499 | 126 (24.5%) | 193 (43.9%) |
| $500 to $799 | 124 (24.1%) | 136 (30.9%) |
| $800 to $999 | 40 (7.8%) | 29 (6.6%) |
| $1,000 to $1,499 | 101 (19.6%) | 16 (3.6%) |
| $1,500 to $1,999 | 10 (1.9%) | 0 (0.0%) |
| $2,000 to $2,499 | 0 (0.0%) | 0 (0.0%) |
| $2,500 to $2,999 | 5 (1.0%) | 0 (0.0%) |
| $3,000 or more | 0 (0.0%) | 0 (0.0%) |
| Total | 515 (100.0%) | 440 (100.0%) |
Physical Housing Characteristics in Antlers
Housing Structures in Antlers
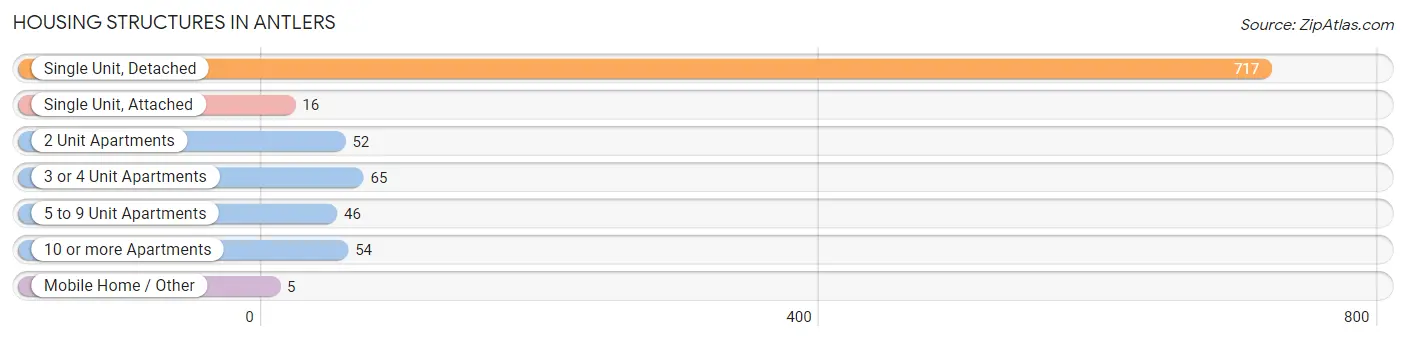
| Structure Type | # Housing Units | % Housing Units |
| Single Unit, Detached | 717 | 75.1% |
| Single Unit, Attached | 16 | 1.7% |
| 2 Unit Apartments | 52 | 5.4% |
| 3 or 4 Unit Apartments | 65 | 6.8% |
| 5 to 9 Unit Apartments | 46 | 4.8% |
| 10 or more Apartments | 54 | 5.7% |
| Mobile Home / Other | 5 | 0.5% |
| Total | 955 | 100.0% |
Housing Structures by Occupancy in Antlers
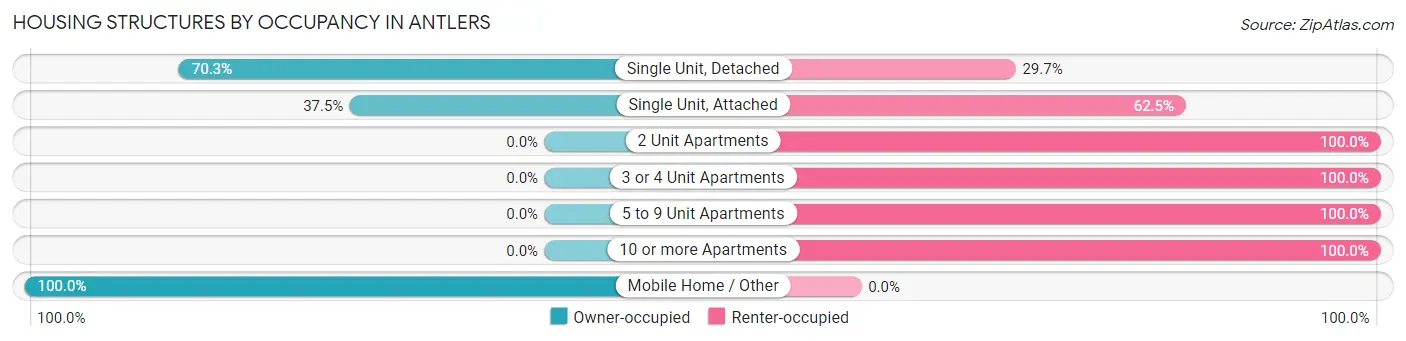
| Structure Type | Owner-occupied | Renter-occupied |
| Single Unit, Detached | 504 (70.3%) | 213 (29.7%) |
| Single Unit, Attached | 6 (37.5%) | 10 (62.5%) |
| 2 Unit Apartments | 0 (0.0%) | 52 (100.0%) |
| 3 or 4 Unit Apartments | 0 (0.0%) | 65 (100.0%) |
| 5 to 9 Unit Apartments | 0 (0.0%) | 46 (100.0%) |
| 10 or more Apartments | 0 (0.0%) | 54 (100.0%) |
| Mobile Home / Other | 5 (100.0%) | 0 (0.0%) |
| Total | 515 (53.9%) | 440 (46.1%) |
Housing Structures by Number of Rooms in Antlers
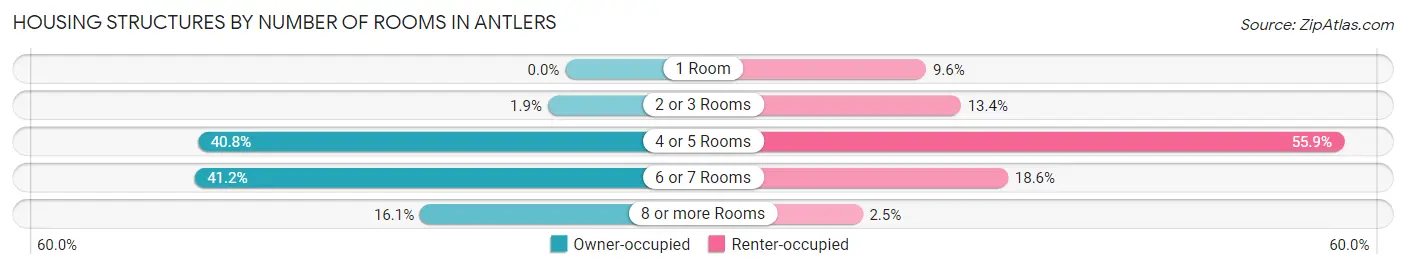
| Number of Rooms | Owner-occupied | Renter-occupied |
| 1 Room | 0 (0.0%) | 42 (9.6%) |
| 2 or 3 Rooms | 10 (1.9%) | 59 (13.4%) |
| 4 or 5 Rooms | 210 (40.8%) | 246 (55.9%) |
| 6 or 7 Rooms | 212 (41.2%) | 82 (18.6%) |
| 8 or more Rooms | 83 (16.1%) | 11 (2.5%) |
| Total | 515 (100.0%) | 440 (100.0%) |
Housing Structure by Heating Type in Antlers
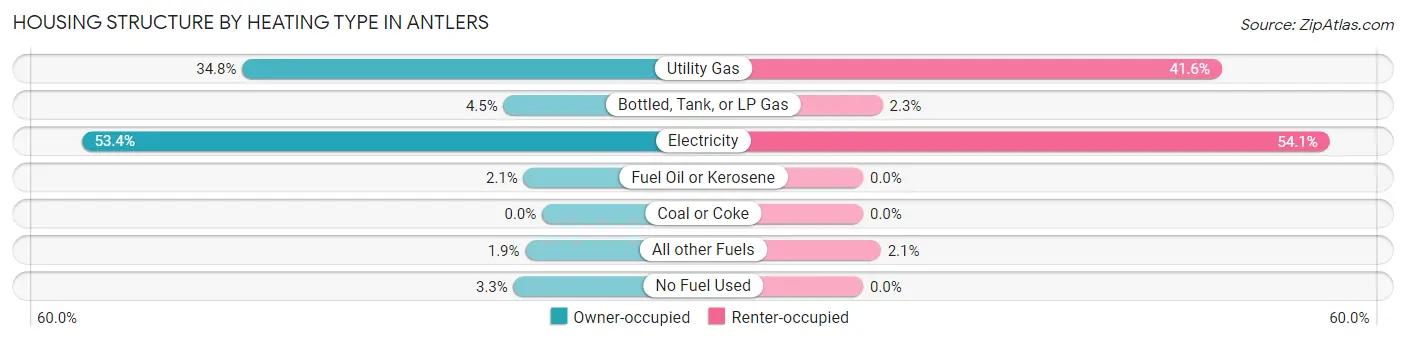
| Heating Type | Owner-occupied | Renter-occupied |
| Utility Gas | 179 (34.8%) | 183 (41.6%) |
| Bottled, Tank, or LP Gas | 23 (4.5%) | 10 (2.3%) |
| Electricity | 275 (53.4%) | 238 (54.1%) |
| Fuel Oil or Kerosene | 11 (2.1%) | 0 (0.0%) |
| Coal or Coke | 0 (0.0%) | 0 (0.0%) |
| All other Fuels | 10 (1.9%) | 9 (2.1%) |
| No Fuel Used | 17 (3.3%) | 0 (0.0%) |
| Total | 515 (100.0%) | 440 (100.0%) |
Household Vehicle Usage in Antlers
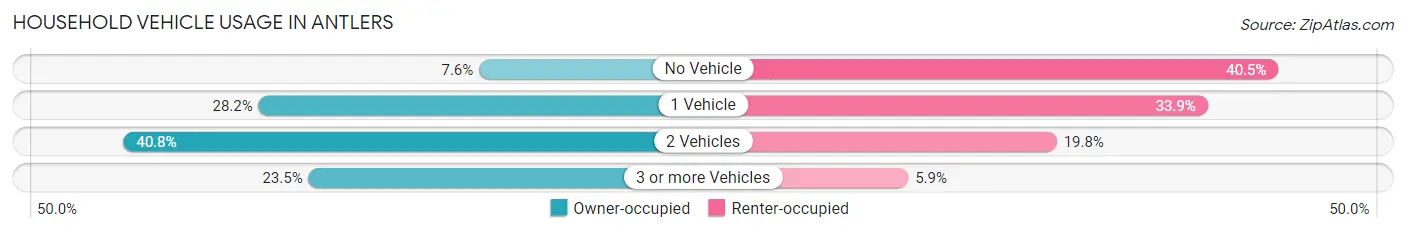
| Vehicles per Household | Owner-occupied | Renter-occupied |
| No Vehicle | 39 (7.6%) | 178 (40.5%) |
| 1 Vehicle | 145 (28.2%) | 149 (33.9%) |
| 2 Vehicles | 210 (40.8%) | 87 (19.8%) |
| 3 or more Vehicles | 121 (23.5%) | 26 (5.9%) |
| Total | 515 (100.0%) | 440 (100.0%) |
Real Estate & Mortgages in Antlers
Real Estate and Mortgage Overview in Antlers
| Characteristic | Without Mortgage | With Mortgage |
| Housing Units | 259 | 256 |
| Median Property Value | $82,800 | $90,000 |
| Median Household Income | $31,125 | $6 |
| Monthly Housing Costs | $326 | $0 |
| Real Estate Taxes | $299 | $18 |
Property Value by Mortgage Status in Antlers
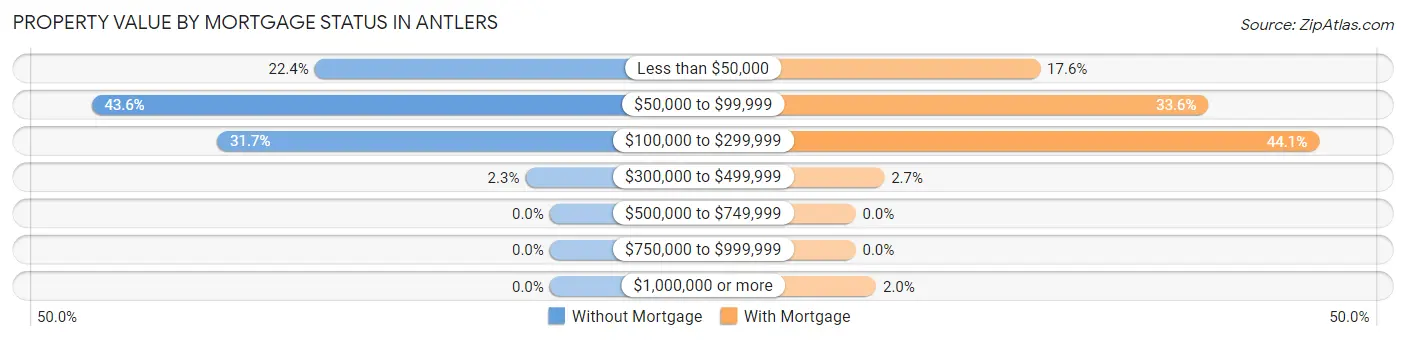
| Property Value | Without Mortgage | With Mortgage |
| Less than $50,000 | 58 (22.4%) | 45 (17.6%) |
| $50,000 to $99,999 | 113 (43.6%) | 86 (33.6%) |
| $100,000 to $299,999 | 82 (31.7%) | 113 (44.1%) |
| $300,000 to $499,999 | 6 (2.3%) | 7 (2.7%) |
| $500,000 to $749,999 | 0 (0.0%) | 0 (0.0%) |
| $750,000 to $999,999 | 0 (0.0%) | 0 (0.0%) |
| $1,000,000 or more | 0 (0.0%) | 5 (1.9%) |
| Total | 259 (100.0%) | 256 (100.0%) |
Household Income by Mortgage Status in Antlers
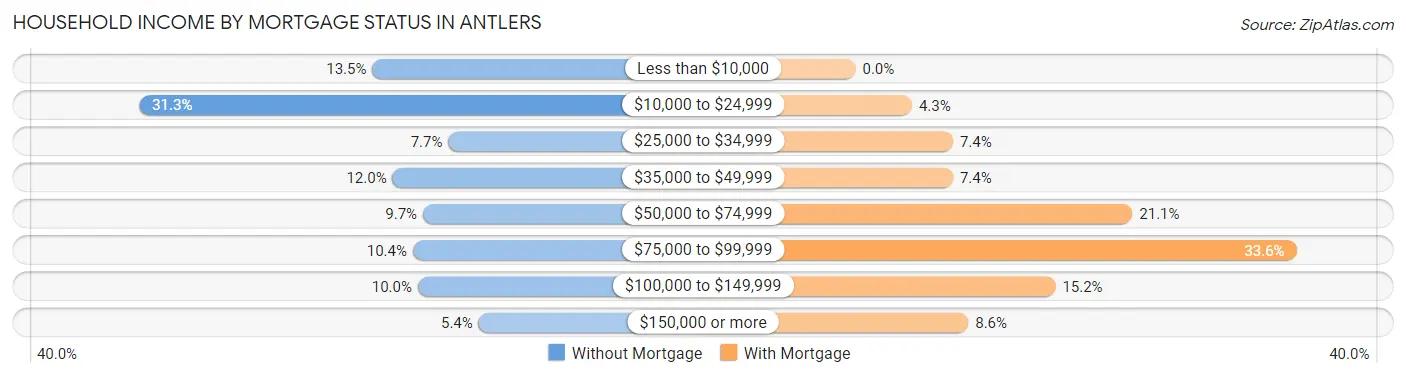
| Household Income | Without Mortgage | With Mortgage |
| Less than $10,000 | 35 (13.5%) | 0 (0.0%) |
| $10,000 to $24,999 | 81 (31.3%) | 11 (4.3%) |
| $25,000 to $34,999 | 20 (7.7%) | 19 (7.4%) |
| $35,000 to $49,999 | 31 (12.0%) | 19 (7.4%) |
| $50,000 to $74,999 | 25 (9.7%) | 54 (21.1%) |
| $75,000 to $99,999 | 27 (10.4%) | 86 (33.6%) |
| $100,000 to $149,999 | 26 (10.0%) | 39 (15.2%) |
| $150,000 or more | 14 (5.4%) | 22 (8.6%) |
| Total | 259 (100.0%) | 256 (100.0%) |
Property Value to Household Income Ratio in Antlers
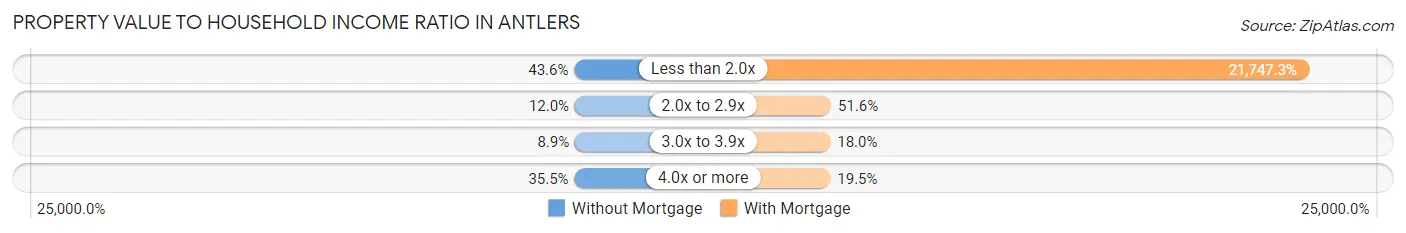
| Value-to-Income Ratio | Without Mortgage | With Mortgage |
| Less than 2.0x | 113 (43.6%) | 55,673 (21,747.3%) |
| 2.0x to 2.9x | 31 (12.0%) | 132 (51.6%) |
| 3.0x to 3.9x | 23 (8.9%) | 46 (18.0%) |
| 4.0x or more | 92 (35.5%) | 50 (19.5%) |
| Total | 259 (100.0%) | 256 (100.0%) |
Real Estate Taxes by Mortgage Status in Antlers
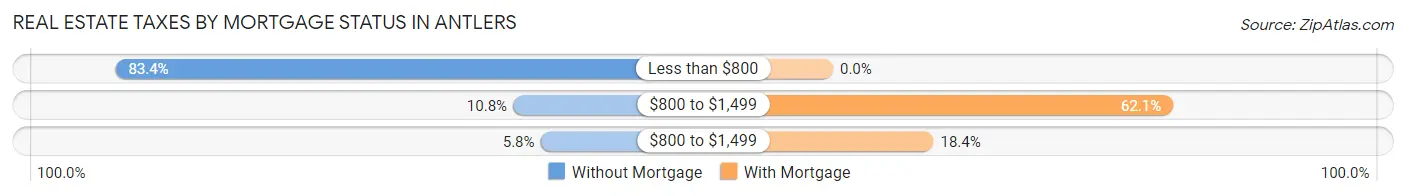
| Property Taxes | Without Mortgage | With Mortgage |
| Less than $800 | 216 (83.4%) | 0 (0.0%) |
| $800 to $1,499 | 28 (10.8%) | 159 (62.1%) |
| $800 to $1,499 | 15 (5.8%) | 47 (18.4%) |
| Total | 259 (100.0%) | 256 (100.0%) |
Health & Disability in Antlers
Health Insurance Coverage by Age in Antlers
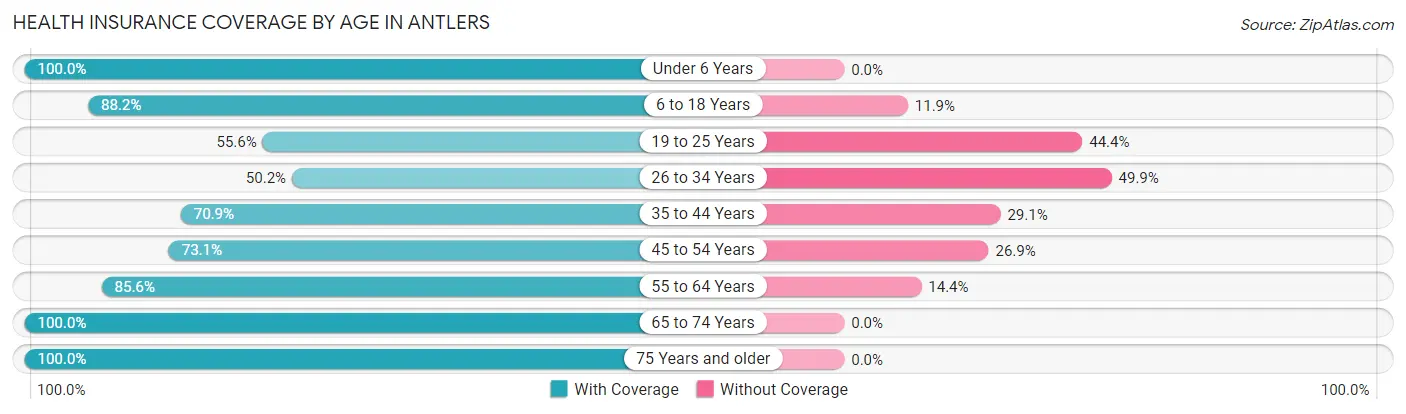
| Age Bracket | With Coverage | Without Coverage |
| Under 6 Years | 213 (100.0%) | 0 (0.0%) |
| 6 to 18 Years | 320 (88.1%) | 43 (11.8%) |
| 19 to 25 Years | 99 (55.6%) | 79 (44.4%) |
| 26 to 34 Years | 171 (50.1%) | 170 (49.8%) |
| 35 to 44 Years | 180 (70.9%) | 74 (29.1%) |
| 45 to 54 Years | 144 (73.1%) | 53 (26.9%) |
| 55 to 64 Years | 286 (85.6%) | 48 (14.4%) |
| 65 to 74 Years | 230 (100.0%) | 0 (0.0%) |
| 75 Years and older | 133 (100.0%) | 0 (0.0%) |
| Total | 1,776 (79.2%) | 467 (20.8%) |
Health Insurance Coverage by Citizenship Status in Antlers
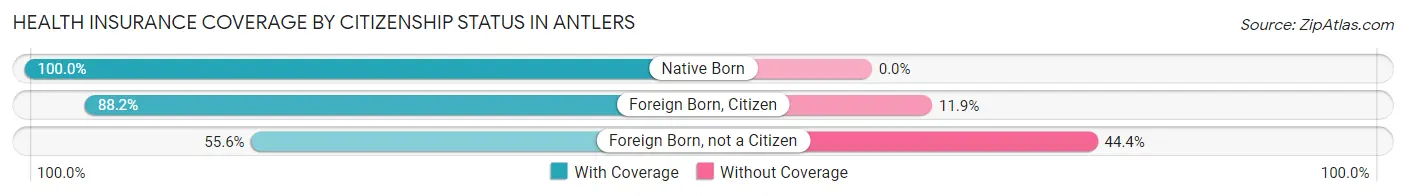
| Citizenship Status | With Coverage | Without Coverage |
| Native Born | 213 (100.0%) | 0 (0.0%) |
| Foreign Born, Citizen | 320 (88.1%) | 43 (11.8%) |
| Foreign Born, not a Citizen | 99 (55.6%) | 79 (44.4%) |
Health Insurance Coverage by Household Income in Antlers
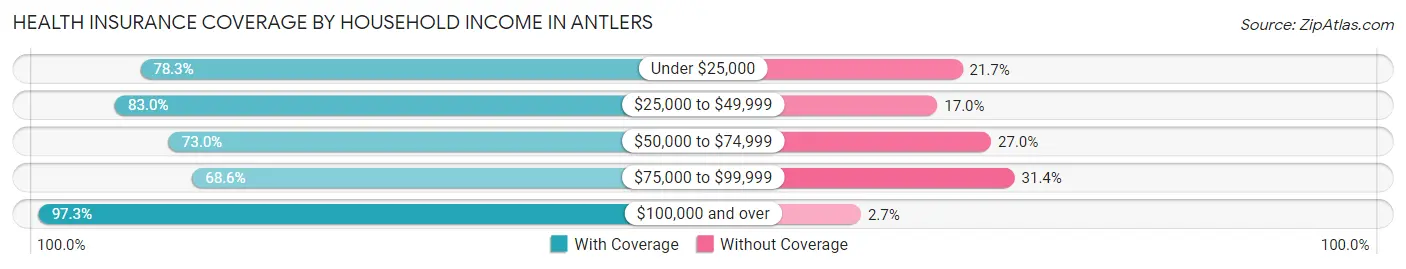
| Household Income | With Coverage | Without Coverage |
| Under $25,000 | 614 (78.3%) | 170 (21.7%) |
| $25,000 to $49,999 | 509 (83.0%) | 104 (17.0%) |
| $50,000 to $74,999 | 313 (73.0%) | 116 (27.0%) |
| $75,000 to $99,999 | 157 (68.6%) | 72 (31.4%) |
| $100,000 and over | 183 (97.3%) | 5 (2.7%) |
Public vs Private Health Insurance Coverage by Age in Antlers
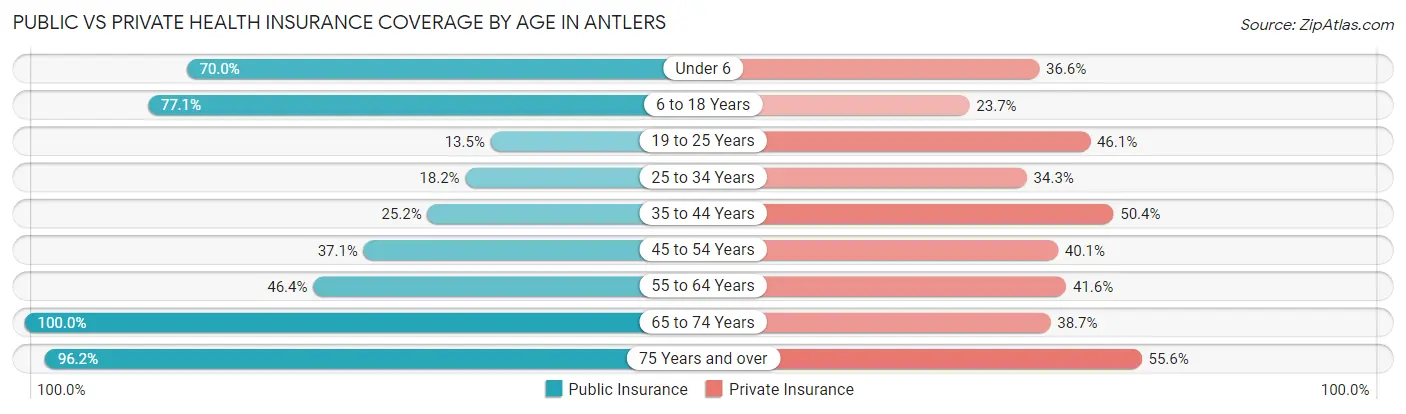
| Age Bracket | Public Insurance | Private Insurance |
| Under 6 | 149 (70.0%) | 78 (36.6%) |
| 6 to 18 Years | 280 (77.1%) | 86 (23.7%) |
| 19 to 25 Years | 24 (13.5%) | 82 (46.1%) |
| 25 to 34 Years | 62 (18.2%) | 117 (34.3%) |
| 35 to 44 Years | 64 (25.2%) | 128 (50.4%) |
| 45 to 54 Years | 73 (37.1%) | 79 (40.1%) |
| 55 to 64 Years | 155 (46.4%) | 139 (41.6%) |
| 65 to 74 Years | 230 (100.0%) | 89 (38.7%) |
| 75 Years and over | 128 (96.2%) | 74 (55.6%) |
| Total | 1,165 (51.9%) | 872 (38.9%) |
Disability Status by Sex by Age in Antlers
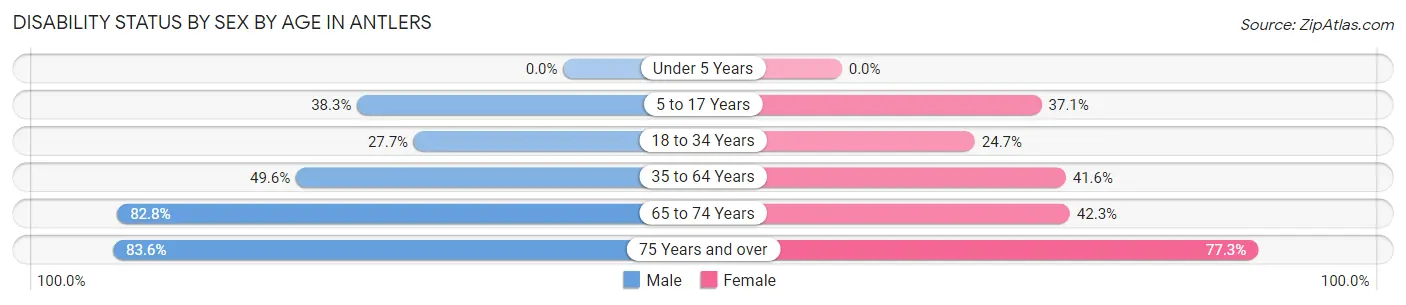
| Age Bracket | Male | Female |
| Under 5 Years | 0 (0.0%) | 0 (0.0%) |
| 5 to 17 Years | 57 (38.3%) | 79 (37.1%) |
| 18 to 34 Years | 61 (27.7%) | 81 (24.7%) |
| 35 to 64 Years | 195 (49.6%) | 163 (41.6%) |
| 65 to 74 Years | 77 (82.8%) | 58 (42.3%) |
| 75 Years and over | 56 (83.6%) | 51 (77.3%) |
Disability Class by Sex by Age in Antlers
Disability Class: Hearing Difficulty
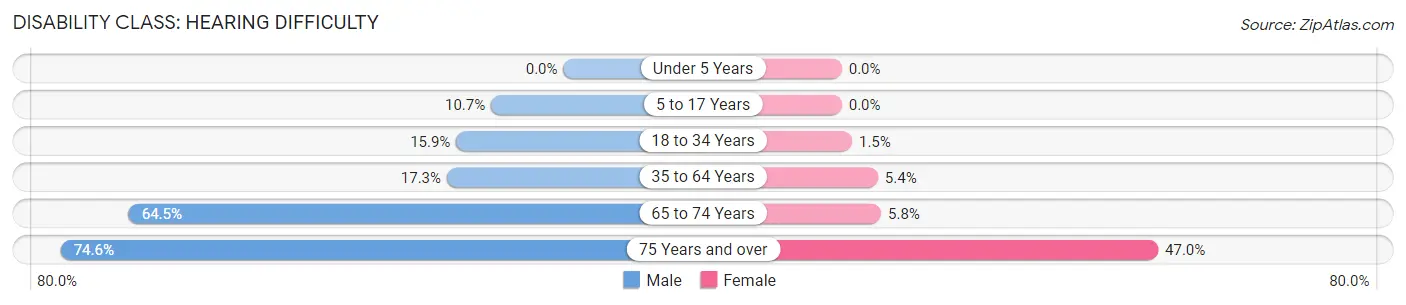
| Age Bracket | Male | Female |
| Under 5 Years | 0 (0.0%) | 0 (0.0%) |
| 5 to 17 Years | 16 (10.7%) | 0 (0.0%) |
| 18 to 34 Years | 35 (15.9%) | 5 (1.5%) |
| 35 to 64 Years | 68 (17.3%) | 21 (5.4%) |
| 65 to 74 Years | 60 (64.5%) | 8 (5.8%) |
| 75 Years and over | 50 (74.6%) | 31 (47.0%) |
Disability Class: Vision Difficulty
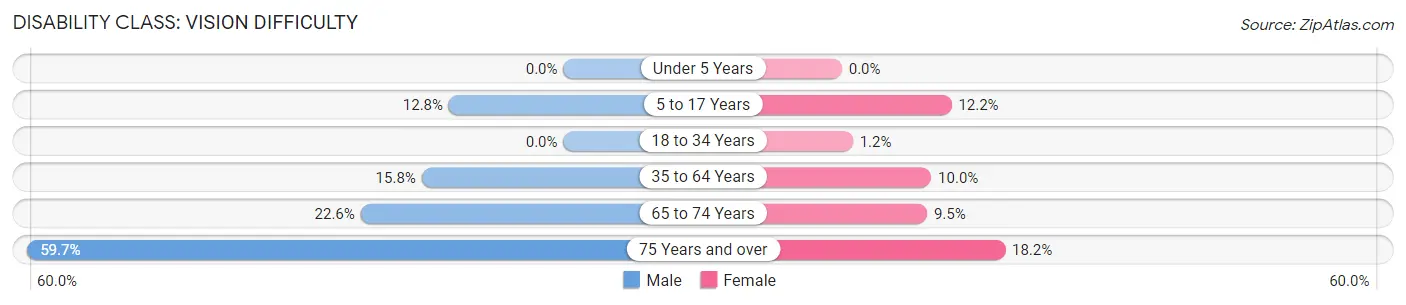
| Age Bracket | Male | Female |
| Under 5 Years | 0 (0.0%) | 0 (0.0%) |
| 5 to 17 Years | 19 (12.8%) | 26 (12.2%) |
| 18 to 34 Years | 0 (0.0%) | 4 (1.2%) |
| 35 to 64 Years | 62 (15.8%) | 39 (10.0%) |
| 65 to 74 Years | 21 (22.6%) | 13 (9.5%) |
| 75 Years and over | 40 (59.7%) | 12 (18.2%) |
Disability Class: Cognitive Difficulty
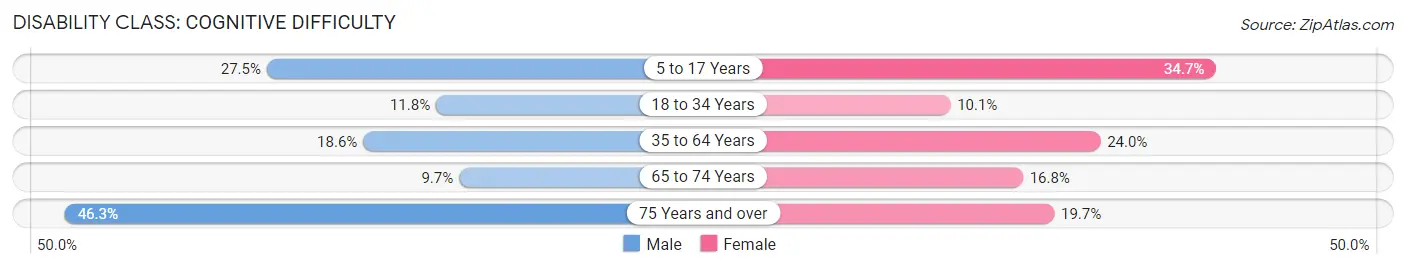
| Age Bracket | Male | Female |
| 5 to 17 Years | 41 (27.5%) | 74 (34.7%) |
| 18 to 34 Years | 26 (11.8%) | 33 (10.1%) |
| 35 to 64 Years | 73 (18.6%) | 94 (24.0%) |
| 65 to 74 Years | 9 (9.7%) | 23 (16.8%) |
| 75 Years and over | 31 (46.3%) | 13 (19.7%) |
Disability Class: Ambulatory Difficulty
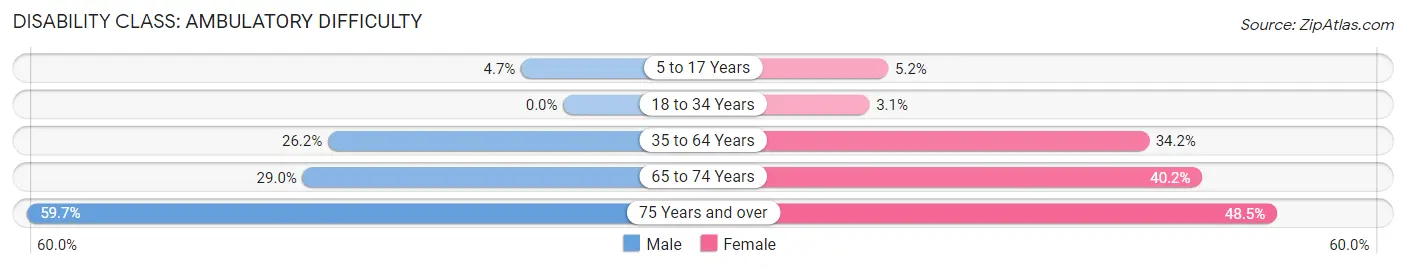
| Age Bracket | Male | Female |
| 5 to 17 Years | 7 (4.7%) | 11 (5.2%) |
| 18 to 34 Years | 0 (0.0%) | 10 (3.0%) |
| 35 to 64 Years | 103 (26.2%) | 134 (34.2%) |
| 65 to 74 Years | 27 (29.0%) | 55 (40.2%) |
| 75 Years and over | 40 (59.7%) | 32 (48.5%) |
Disability Class: Self-Care Difficulty
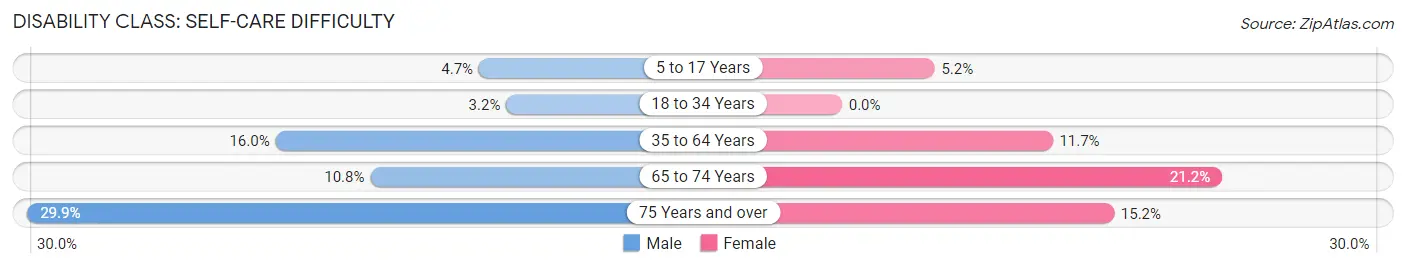
| Age Bracket | Male | Female |
| 5 to 17 Years | 7 (4.7%) | 11 (5.2%) |
| 18 to 34 Years | 7 (3.2%) | 0 (0.0%) |
| 35 to 64 Years | 63 (16.0%) | 46 (11.7%) |
| 65 to 74 Years | 10 (10.7%) | 29 (21.2%) |
| 75 Years and over | 20 (29.8%) | 10 (15.1%) |
Technology Access in Antlers
Computing Device Access in Antlers
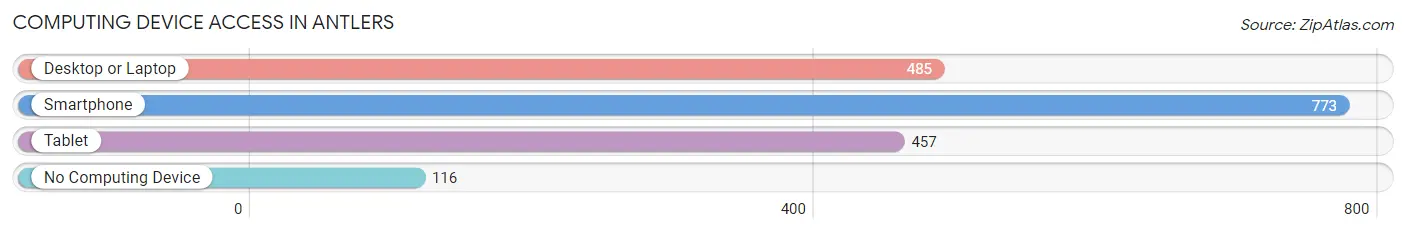
| Device Type | # Households | % Households |
| Desktop or Laptop | 485 | 50.8% |
| Smartphone | 773 | 80.9% |
| Tablet | 457 | 47.8% |
| No Computing Device | 116 | 12.1% |
| Total | 955 | 100.0% |
Internet Access in Antlers
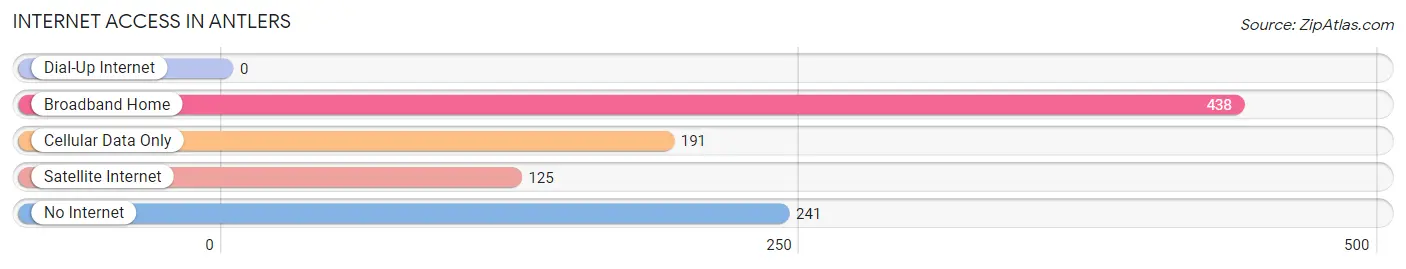
| Internet Type | # Households | % Households |
| Dial-Up Internet | 0 | 0.0% |
| Broadband Home | 438 | 45.9% |
| Cellular Data Only | 191 | 20.0% |
| Satellite Internet | 125 | 13.1% |
| No Internet | 241 | 25.2% |
| Total | 955 | 100.0% |
Antlers Summary
Antlers, Oklahoma is a small town located in Pushmataha County in the southeastern part of the state. It is situated on the banks of the Kiamichi River, and is the county seat of Pushmataha County. The town was founded in 1872 and was named after the nearby Antlers Hotel, which was built in 1872. The population of Antlers was 2,072 at the 2010 census.
Geography
Antlers is located at the intersection of U.S. Route 271 and State Highway 3, approximately 90 miles southeast of Oklahoma City. The town is situated in a valley surrounded by rolling hills and is located in the Kiamichi Mountains. The Kiamichi River runs through the town and is a popular spot for fishing and other recreational activities. The town is also located near the Ouachita National Forest, which provides a variety of outdoor activities.
Economy
The economy of Antlers is largely based on agriculture and timber. The town is home to several large timber companies, including Weyerhaeuser, Georgia-Pacific, and Potlatch. The timber industry provides jobs for many of the town’s residents. In addition, the town is home to several small businesses, including restaurants, retail stores, and service providers.
Demographics
As of the 2010 census, the population of Antlers was 2,072. The racial makeup of the town was 79.2% White, 0.2% African American, 15.3% Native American, 0.2% Asian, 0.1% Pacific Islander, 0.2% from other races, and 4.9% from two or more races. Hispanic or Latino of any race were 1.7% of the population.
The median income for a household in Antlers was $25,938, and the median income for a family was $31,250. Males had a median income of $25,625 versus $19,375 for females. The per capita income for the town was $14,845. About 17.2% of families and 20.2% of the population were below the poverty line, including 28.2% of those under age 18 and 14.3% of those age 65 or over.
Education
Antlers is served by the Antlers Public School District, which includes Antlers Elementary School, Antlers Middle School, and Antlers High School. The town is also home to the Antlers Public Library, which provides a variety of services to the community.
Conclusion
Antlers, Oklahoma is a small town located in Pushmataha County in the southeastern part of the state. It is situated on the banks of the Kiamichi River, and is the county seat of Pushmataha County. The town was founded in 1872 and was named after the nearby Antlers Hotel, which was built in 1872. The economy of Antlers is largely based on agriculture and timber, and the town is home to several small businesses. The population of Antlers was 2,072 at the 2010 census, and the town is served by the Antlers Public School District. Antlers is a great place to live and work, and offers a variety of recreational activities for its residents.
Common Questions
What is Per Capita Income in Antlers?
Per Capita income in Antlers is $18,216.
What is the Median Family Income in Antlers?
Median Family Income in Antlers is $43,493.
What is the Median Household income in Antlers?
Median Household Income in Antlers is $27,798.
What is Income or Wage Gap in Antlers?
Income or Wage Gap in Antlers is 39.8%.
Women in Antlers earn 60.2 cents for every dollar earned by a man.
What is Inequality or Gini Index in Antlers?
Inequality or Gini Index in Antlers is 0.48.
What is the Total Population of Antlers?
Total Population of Antlers is 2,361.
What is the Total Male Population of Antlers?
Total Male Population of Antlers is 1,050.
What is the Total Female Population of Antlers?
Total Female Population of Antlers is 1,311.
What is the Ratio of Males per 100 Females in Antlers?
There are 80.09 Males per 100 Females in Antlers.
What is the Ratio of Females per 100 Males in Antlers?
There are 124.86 Females per 100 Males in Antlers.
What is the Median Population Age in Antlers?
Median Population Age in Antlers is 36.7 Years.
What is the Average Family Size in Antlers
Average Family Size in Antlers is 3.1 People.
What is the Average Household Size in Antlers
Average Household Size in Antlers is 2.4 People.
How Large is the Labor Force in Antlers?
There are 812 People in the Labor Forcein in Antlers.
What is the Percentage of People in the Labor Force in Antlers?
44.5% of People are in the Labor Force in Antlers.
What is the Unemployment Rate in Antlers?
Unemployment Rate in Antlers is 12.8%.