Muskogee, OK Map & Demographics
Muskogee Map
Muskogee Overview
$25,227
PER CAPITA INCOME
$53,842
AVG FAMILY INCOME
$46,825
AVG HOUSEHOLD INCOME
24.7%
WAGE / INCOME GAP [ % ]
75.3¢/ $1
WAGE / INCOME GAP [ $ ]
$11,647
FAMILY INCOME DEFICIT
0.45
INEQUALITY / GINI INDEX
36,933
TOTAL POPULATION
18,127
MALE POPULATION
18,806
FEMALE POPULATION
96.39
MALES / 100 FEMALES
103.75
FEMALES / 100 MALES
36.0
MEDIAN AGE
3.1
AVG FAMILY SIZE
2.4
AVG HOUSEHOLD SIZE
16,056
LABOR FORCE [ PEOPLE ]
56.6%
PERCENT IN LABOR FORCE
6.5%
UNEMPLOYMENT RATE
Muskogee Area Codes
Income in Muskogee
Income Overview in Muskogee
Per Capita Income in Muskogee is $25,227, while median incomes of families and households are $53,842 and $46,825 respectively.
| Characteristic | Number | Measure |
| Per Capita Income | 36,933 | $25,227 |
| Median Family Income | 9,178 | $53,842 |
| Mean Family Income | 9,178 | $72,074 |
| Median Household Income | 14,553 | $46,825 |
| Mean Household Income | 14,553 | $62,753 |
| Income Deficit | 9,178 | $11,647 |
| Wage / Income Gap (%) | 36,933 | 24.71% |
| Wage / Income Gap ($) | 36,933 | 75.29¢ per $1 |
| Gini / Inequality Index | 36,933 | 0.45 |
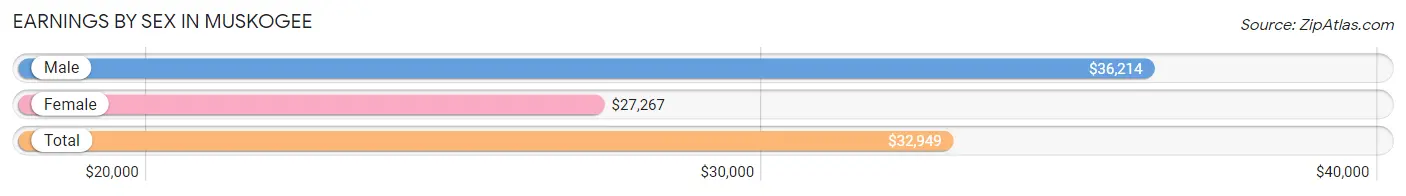
Earnings by Sex in Muskogee
Average Earnings in Muskogee are $32,949, $36,214 for men and $27,267 for women, a difference of 24.7%.
| Sex | Number | Average Earnings |
| Male | 8,758 (52.0%) | $36,214 |
| Female | 8,087 (48.0%) | $27,267 |
| Total | 16,845 (100.0%) | $32,949 |
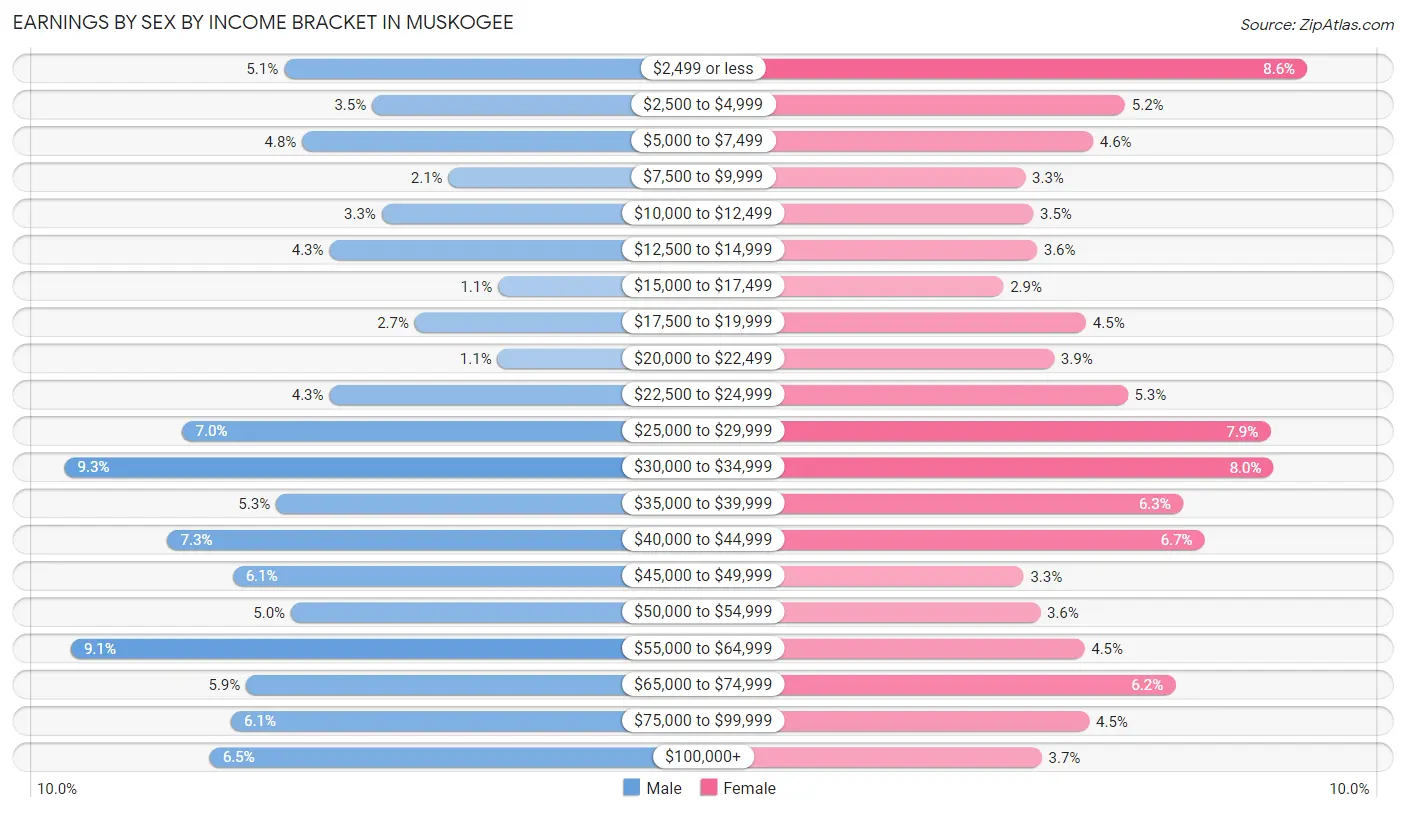
Earnings by Sex by Income Bracket in Muskogee
The most common earnings brackets in Muskogee are $30,000 to $34,999 for men (810 | 9.2%) and $2,499 or less for women (697 | 8.6%).
| Income | Male | Female |
| $2,499 or less | 450 (5.1%) | 697 (8.6%) |
| $2,500 to $4,999 | 306 (3.5%) | 421 (5.2%) |
| $5,000 to $7,499 | 420 (4.8%) | 373 (4.6%) |
| $7,500 to $9,999 | 180 (2.1%) | 270 (3.3%) |
| $10,000 to $12,499 | 290 (3.3%) | 282 (3.5%) |
| $12,500 to $14,999 | 376 (4.3%) | 288 (3.6%) |
| $15,000 to $17,499 | 99 (1.1%) | 237 (2.9%) |
| $17,500 to $19,999 | 236 (2.7%) | 362 (4.5%) |
| $20,000 to $22,499 | 100 (1.1%) | 314 (3.9%) |
| $22,500 to $24,999 | 376 (4.3%) | 425 (5.3%) |
| $25,000 to $29,999 | 617 (7.0%) | 641 (7.9%) |
| $30,000 to $34,999 | 810 (9.2%) | 646 (8.0%) |
| $35,000 to $39,999 | 463 (5.3%) | 509 (6.3%) |
| $40,000 to $44,999 | 641 (7.3%) | 542 (6.7%) |
| $45,000 to $49,999 | 534 (6.1%) | 268 (3.3%) |
| $50,000 to $54,999 | 439 (5.0%) | 293 (3.6%) |
| $55,000 to $64,999 | 800 (9.1%) | 360 (4.4%) |
| $65,000 to $74,999 | 512 (5.9%) | 497 (6.1%) |
| $75,000 to $99,999 | 537 (6.1%) | 367 (4.5%) |
| $100,000+ | 572 (6.5%) | 295 (3.6%) |
| Total | 8,758 (100.0%) | 8,087 (100.0%) |
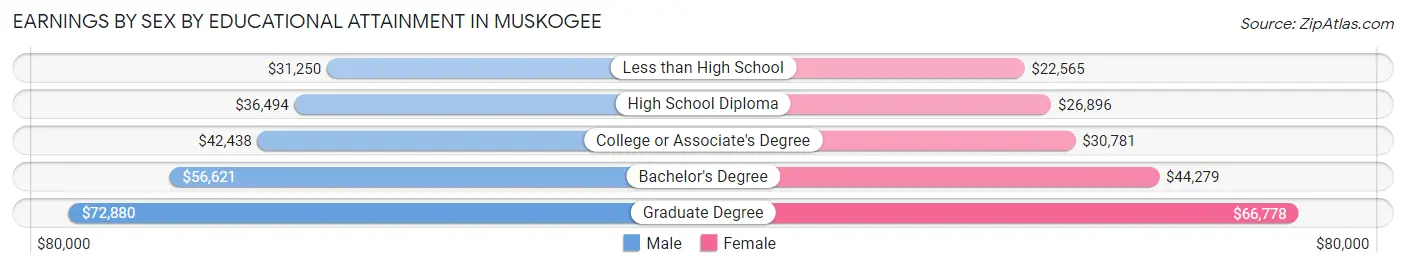
Earnings by Sex by Educational Attainment in Muskogee
Average earnings in Muskogee are $42,141 for men and $33,191 for women, a difference of 21.2%. Men with an educational attainment of graduate degree enjoy the highest average annual earnings of $72,880, while those with less than high school education earn the least with $31,250. Women with an educational attainment of graduate degree earn the most with the average annual earnings of $66,778, while those with less than high school education have the smallest earnings of $22,565.
| Educational Attainment | Male Income | Female Income |
| Less than High School | $31,250 | $22,565 |
| High School Diploma | $36,494 | $26,896 |
| College or Associate's Degree | $42,438 | $30,781 |
| Bachelor's Degree | $56,621 | $44,279 |
| Graduate Degree | $72,880 | $66,778 |
| Total | $42,141 | $33,191 |
Family Income in Muskogee
Family Income Brackets in Muskogee
According to the Muskogee family income data, there are 1,716 families falling into the $35,000 to $49,999 income range, which is the most common income bracket and makes up 18.7% of all families. Conversely, the $10,000 to $14,999 income bracket is the least frequent group with only 229 families (2.5%) belonging to this category.
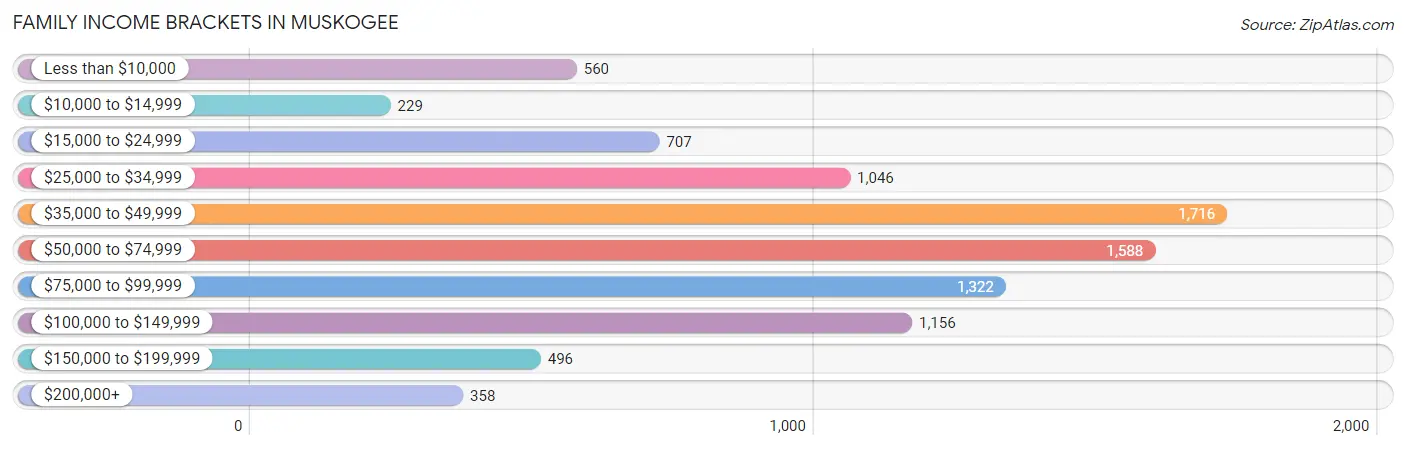
| Income Bracket | # Families | % Families |
| Less than $10,000 | 560 | 6.1% |
| $10,000 to $14,999 | 229 | 2.5% |
| $15,000 to $24,999 | 707 | 7.7% |
| $25,000 to $34,999 | 1,046 | 11.4% |
| $35,000 to $49,999 | 1,716 | 18.7% |
| $50,000 to $74,999 | 1,588 | 17.3% |
| $75,000 to $99,999 | 1,322 | 14.4% |
| $100,000 to $149,999 | 1,156 | 12.6% |
| $150,000 to $199,999 | 496 | 5.4% |
| $200,000+ | 358 | 3.9% |
Family Income by Famaliy Size in Muskogee
6-person families (212 | 2.3%) account for the highest median family income in Muskogee with $67,596 per family, while 2-person families (4,335 | 47.2%) have the highest median income of $27,125 per family member.
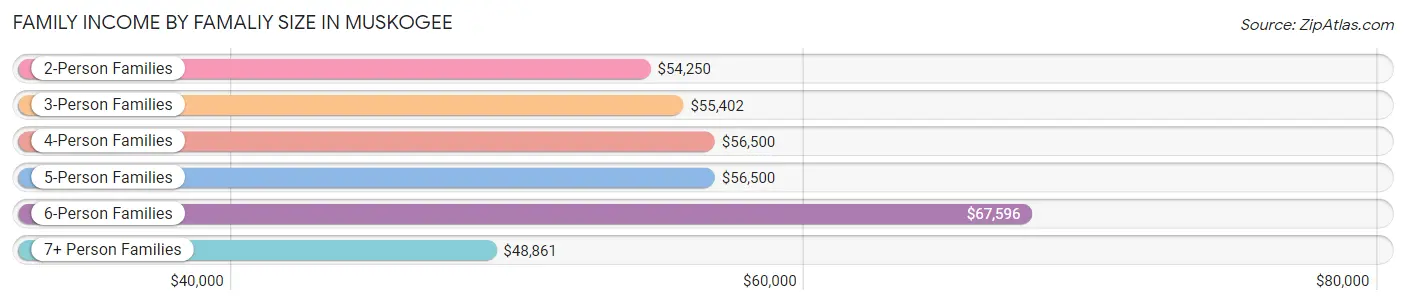
| Income Bracket | # Families | Median Income |
| 2-Person Families | 4,335 (47.2%) | $54,250 |
| 3-Person Families | 2,206 (24.0%) | $55,402 |
| 4-Person Families | 1,474 (16.1%) | $56,500 |
| 5-Person Families | 676 (7.4%) | $56,500 |
| 6-Person Families | 212 (2.3%) | $67,596 |
| 7+ Person Families | 275 (3.0%) | $48,861 |
| Total | 9,178 (100.0%) | $53,842 |
Family Income by Number of Earners in Muskogee
The median family income in Muskogee is $53,842, with families comprising 3+ earners (740) having the highest median family income of $107,813, while families with no earners (1,402) have the lowest median family income of $33,882, accounting for 8.1% and 15.3% of families, respectively.
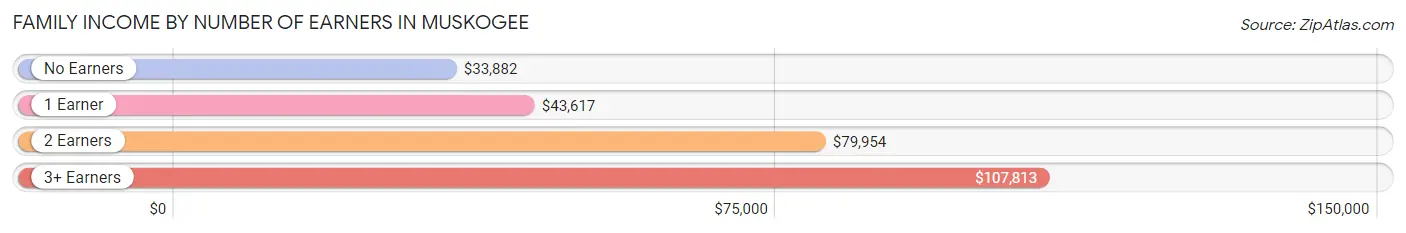
| Number of Earners | # Families | Median Income |
| No Earners | 1,402 (15.3%) | $33,882 |
| 1 Earner | 4,269 (46.5%) | $43,617 |
| 2 Earners | 2,767 (30.1%) | $79,954 |
| 3+ Earners | 740 (8.1%) | $107,813 |
| Total | 9,178 (100.0%) | $53,842 |
Household Income in Muskogee
Household Income Brackets in Muskogee
With 2,590 households falling in the category, the $50,000 to $74,999 income range is the most frequent in Muskogee, accounting for 17.8% of all households. In contrast, only 393 households (2.7%) fall into the $200,000+ income bracket, making it the least populous group.
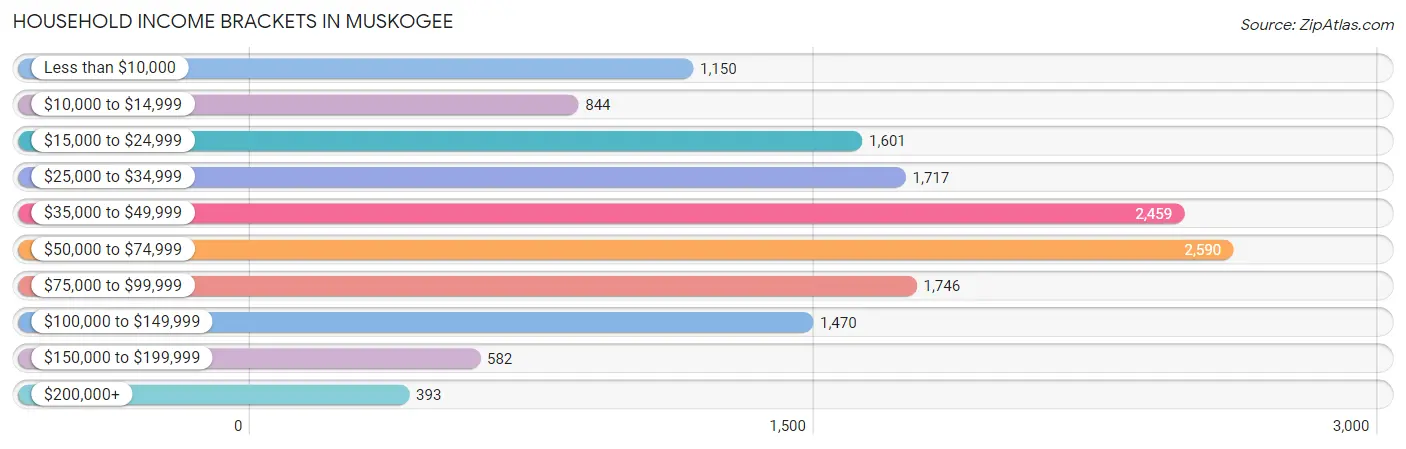
| Income Bracket | # Households | % Households |
| Less than $10,000 | 1,150 | 7.9% |
| $10,000 to $14,999 | 844 | 5.8% |
| $15,000 to $24,999 | 1,601 | 11.0% |
| $25,000 to $34,999 | 1,717 | 11.8% |
| $35,000 to $49,999 | 2,459 | 16.9% |
| $50,000 to $74,999 | 2,590 | 17.8% |
| $75,000 to $99,999 | 1,746 | 12.0% |
| $100,000 to $149,999 | 1,470 | 10.1% |
| $150,000 to $199,999 | 582 | 4.0% |
| $200,000+ | 393 | 2.7% |
Household Income by Householder Age in Muskogee
The median household income in Muskogee is $46,825, with the highest median household income of $55,582 found in the 45 to 64 years age bracket for the primary householder. A total of 5,118 households (35.2%) fall into this category. Meanwhile, the 15 to 24 years age bracket for the primary householder has the lowest median household income of $34,803, with 715 households (4.9%) in this group.
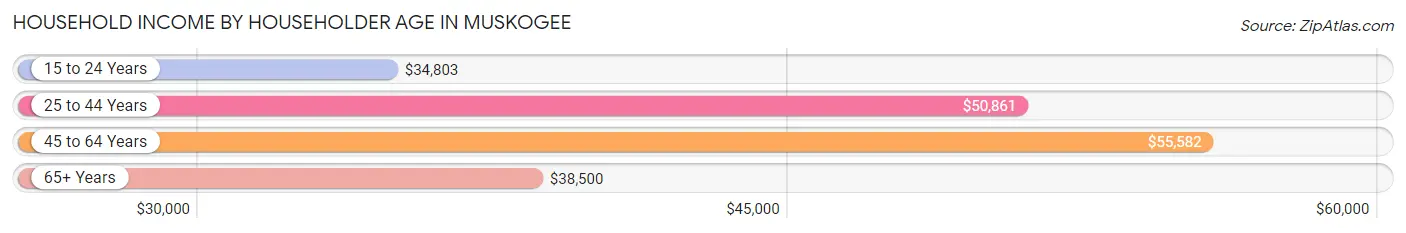
| Income Bracket | # Households | Median Income |
| 15 to 24 Years | 715 (4.9%) | $34,803 |
| 25 to 44 Years | 4,832 (33.2%) | $50,861 |
| 45 to 64 Years | 5,118 (35.2%) | $55,582 |
| 65+ Years | 3,888 (26.7%) | $38,500 |
| Total | 14,553 (100.0%) | $46,825 |
Poverty in Muskogee
Income Below Poverty by Sex and Age in Muskogee
With 19.7% poverty level for males and 25.2% for females among the residents of Muskogee, 15 year old males and under 5 year old females are the most vulnerable to poverty, with 125 males (40.2%) and 545 females (42.3%) in their respective age groups living below the poverty level.
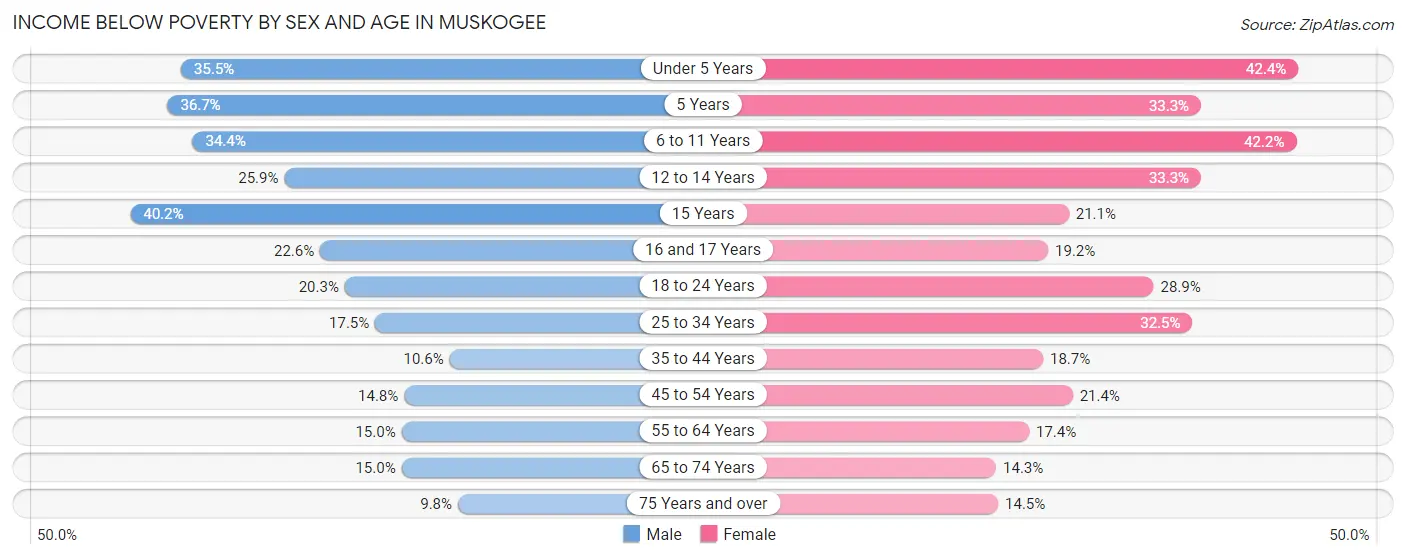
| Age Bracket | Male | Female |
| Under 5 Years | 434 (35.5%) | 545 (42.3%) |
| 5 Years | 79 (36.7%) | 99 (33.3%) |
| 6 to 11 Years | 510 (34.4%) | 603 (42.2%) |
| 12 to 14 Years | 251 (25.9%) | 295 (33.3%) |
| 15 Years | 125 (40.2%) | 67 (21.1%) |
| 16 and 17 Years | 119 (22.6%) | 99 (19.2%) |
| 18 to 24 Years | 325 (20.3%) | 412 (28.9%) |
| 25 to 34 Years | 427 (17.5%) | 784 (32.5%) |
| 35 to 44 Years | 225 (10.6%) | 408 (18.7%) |
| 45 to 54 Years | 303 (14.8%) | 390 (21.4%) |
| 55 to 64 Years | 341 (15.0%) | 405 (17.4%) |
| 65 to 74 Years | 192 (15.0%) | 260 (14.3%) |
| 75 Years and over | 78 (9.8%) | 207 (14.5%) |
| Total | 3,409 (19.7%) | 4,574 (25.2%) |
Income Above Poverty by Sex and Age in Muskogee
According to the poverty statistics in Muskogee, males aged 75 years and over and females aged 65 to 74 years are the age groups that are most secure financially, with 90.2% of males and 85.7% of females in these age groups living above the poverty line.
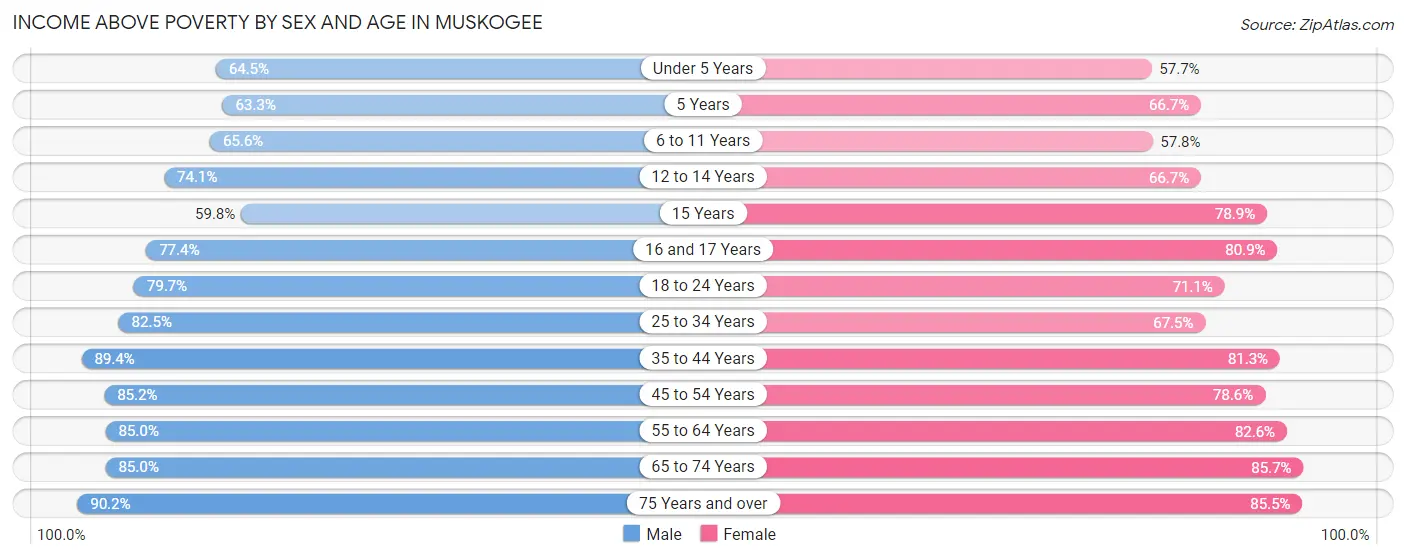
| Age Bracket | Male | Female |
| Under 5 Years | 789 (64.5%) | 742 (57.7%) |
| 5 Years | 136 (63.3%) | 198 (66.7%) |
| 6 to 11 Years | 972 (65.6%) | 827 (57.8%) |
| 12 to 14 Years | 718 (74.1%) | 590 (66.7%) |
| 15 Years | 186 (59.8%) | 251 (78.9%) |
| 16 and 17 Years | 408 (77.4%) | 418 (80.8%) |
| 18 to 24 Years | 1,277 (79.7%) | 1,012 (71.1%) |
| 25 to 34 Years | 2,017 (82.5%) | 1,626 (67.5%) |
| 35 to 44 Years | 1,905 (89.4%) | 1,776 (81.3%) |
| 45 to 54 Years | 1,747 (85.2%) | 1,430 (78.6%) |
| 55 to 64 Years | 1,930 (85.0%) | 1,925 (82.6%) |
| 65 to 74 Years | 1,086 (85.0%) | 1,556 (85.7%) |
| 75 Years and over | 719 (90.2%) | 1,220 (85.5%) |
| Total | 13,890 (80.3%) | 13,571 (74.8%) |
Income Below Poverty Among Married-Couple Families in Muskogee
The poverty statistics for married-couple families in Muskogee show that 8.9% or 496 of the total 5,573 families live below the poverty line. Families with 5 or more children have the highest poverty rate of 46.4%, comprising of 26 families. On the other hand, families with no children have the lowest poverty rate of 6.4%, which includes 214 families.
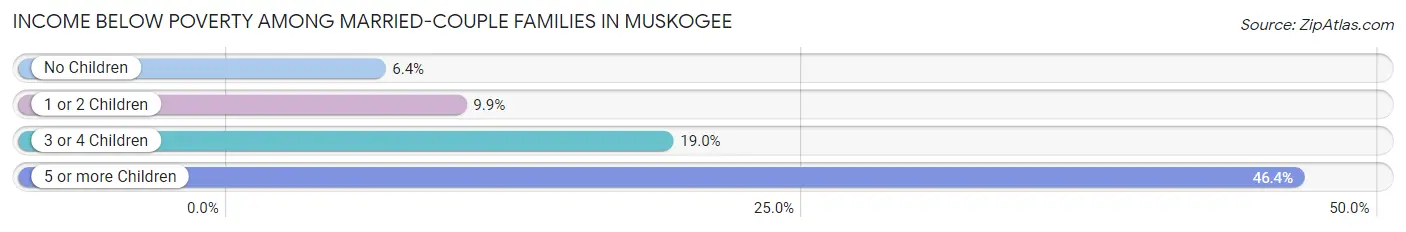
| Children | Above Poverty | Below Poverty |
| No Children | 3,125 (93.6%) | 214 (6.4%) |
| 1 or 2 Children | 1,567 (90.1%) | 173 (9.9%) |
| 3 or 4 Children | 355 (81.0%) | 83 (19.0%) |
| 5 or more Children | 30 (53.6%) | 26 (46.4%) |
| Total | 5,077 (91.1%) | 496 (8.9%) |
Income Below Poverty Among Single-Parent Households in Muskogee
According to the poverty data in Muskogee, 10.7% or 77 single-father households and 31.3% or 905 single-mother households are living below the poverty line. Among single-father households, those with 3 or 4 children have the highest poverty rate, with 8 households (21.0%) experiencing poverty. Likewise, among single-mother households, those with 5 or more children have the highest poverty rate, with 33 households (100.0%) falling below the poverty line.
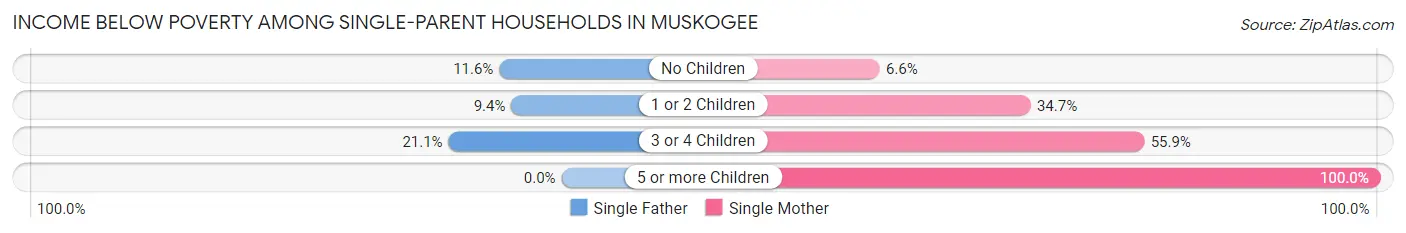
| Children | Single Father | Single Mother |
| No Children | 29 (11.6%) | 52 (6.6%) |
| 1 or 2 Children | 40 (9.3%) | 549 (34.7%) |
| 3 or 4 Children | 8 (21.0%) | 271 (55.9%) |
| 5 or more Children | 0 (0.0%) | 33 (100.0%) |
| Total | 77 (10.7%) | 905 (31.3%) |
Income Below Poverty Among Married-Couple vs Single-Parent Households in Muskogee
The poverty data for Muskogee shows that 496 of the married-couple family households (8.9%) and 982 of the single-parent households (27.2%) are living below the poverty level. Within the married-couple family households, those with 5 or more children have the highest poverty rate, with 26 households (46.4%) falling below the poverty line. Among the single-parent households, those with 5 or more children have the highest poverty rate, with 33 household (100.0%) living below poverty.
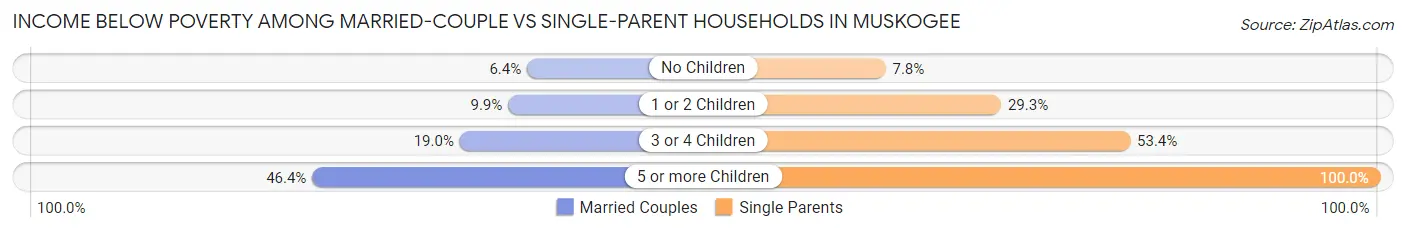
| Children | Married-Couple Families | Single-Parent Households |
| No Children | 214 (6.4%) | 81 (7.8%) |
| 1 or 2 Children | 173 (9.9%) | 589 (29.3%) |
| 3 or 4 Children | 83 (19.0%) | 279 (53.3%) |
| 5 or more Children | 26 (46.4%) | 33 (100.0%) |
| Total | 496 (8.9%) | 982 (27.2%) |
Race in Muskogee
The most populous races in Muskogee are White / Caucasian (19,068 | 51.6%), Native / Alaskan (5,594 | 15.1%), and Black / African American (5,563 | 15.1%).
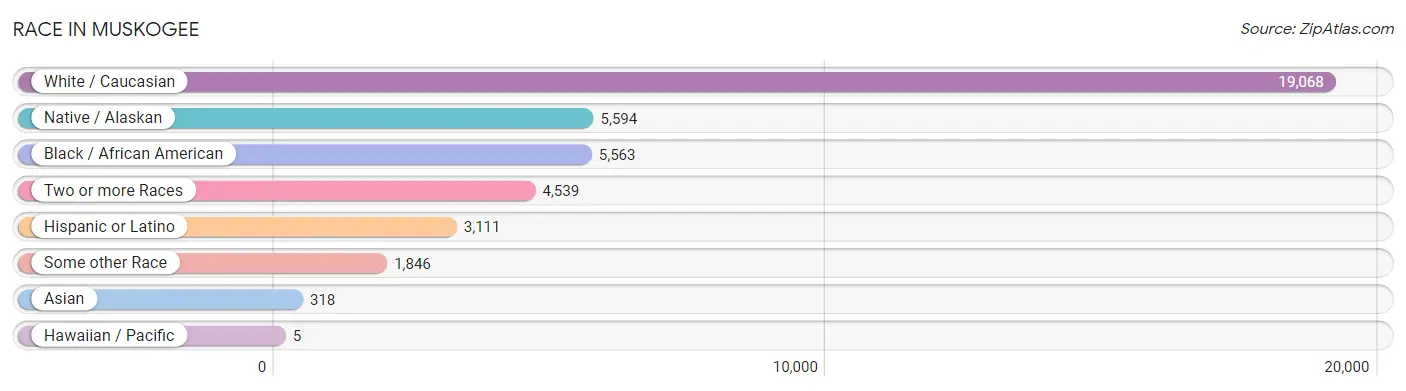
| Race | # Population | % Population |
| Asian | 318 | 0.9% |
| Black / African American | 5,563 | 15.1% |
| Hawaiian / Pacific | 5 | 0.0% |
| Hispanic or Latino | 3,111 | 8.4% |
| Native / Alaskan | 5,594 | 15.1% |
| White / Caucasian | 19,068 | 51.6% |
| Two or more Races | 4,539 | 12.3% |
| Some other Race | 1,846 | 5.0% |
| Total | 36,933 | 100.0% |
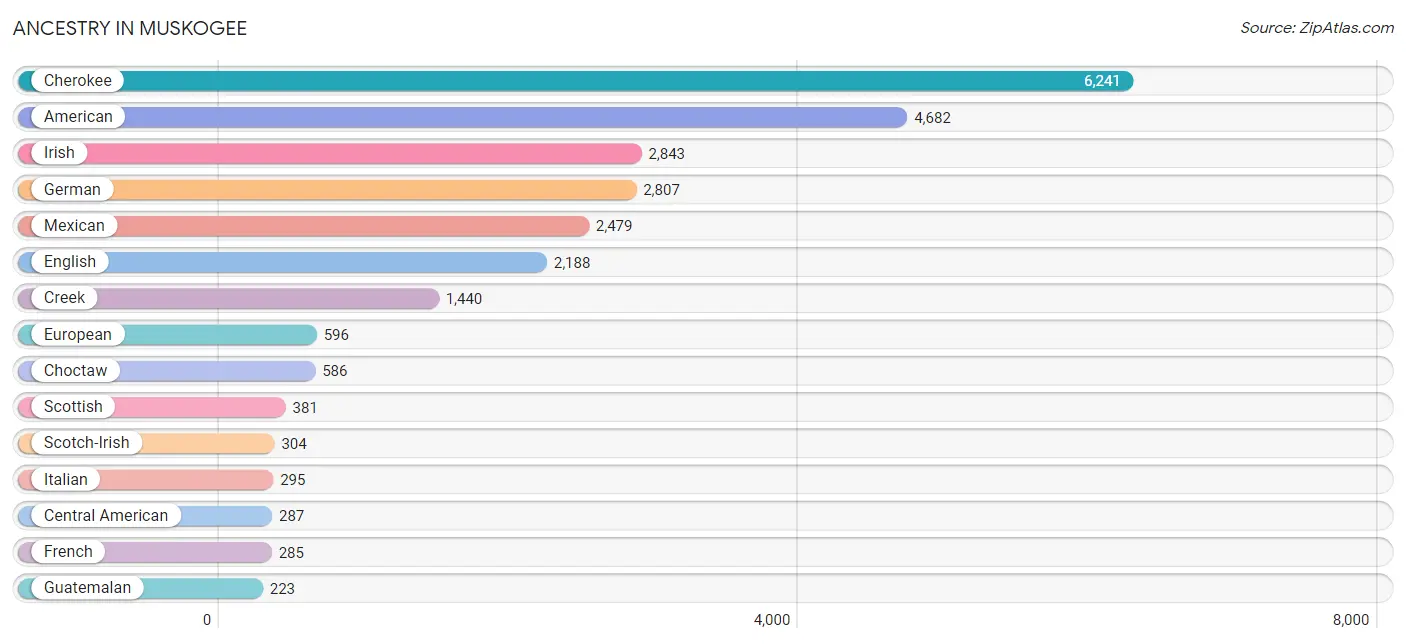
Ancestry in Muskogee
The most populous ancestries reported in Muskogee are Cherokee (6,241 | 16.9%), American (4,682 | 12.7%), Irish (2,843 | 7.7%), German (2,807 | 7.6%), and Mexican (2,479 | 6.7%), together accounting for 51.6% of all Muskogee residents.
| Ancestry | # Population | % Population |
| African | 12 | 0.0% |
| Alaskan Athabascan | 9 | 0.0% |
| American | 4,682 | 12.7% |
| Apache | 6 | 0.0% |
| Arab | 32 | 0.1% |
| Argentinean | 8 | 0.0% |
| Bhutanese | 93 | 0.3% |
| Blackfeet | 22 | 0.1% |
| British | 132 | 0.4% |
| Burmese | 62 | 0.2% |
| Canadian | 55 | 0.2% |
| Celtic | 9 | 0.0% |
| Central American | 287 | 0.8% |
| Cherokee | 6,241 | 16.9% |
| Chickasaw | 51 | 0.1% |
| Chippewa | 29 | 0.1% |
| Choctaw | 586 | 1.6% |
| Colombian | 89 | 0.2% |
| Comanche | 16 | 0.0% |
| Creek | 1,440 | 3.9% |
| Cuban | 8 | 0.0% |
| Danish | 43 | 0.1% |
| Dominican | 9 | 0.0% |
| Dutch | 153 | 0.4% |
| Dutch West Indian | 76 | 0.2% |
| Eastern European | 51 | 0.1% |
| English | 2,188 | 5.9% |
| European | 596 | 1.6% |
| Filipino | 31 | 0.1% |
| Finnish | 18 | 0.1% |
| French | 285 | 0.8% |
| French Canadian | 49 | 0.1% |
| German | 2,807 | 7.6% |
| Greek | 32 | 0.1% |
| Guamanian / Chamorro | 6 | 0.0% |
| Guatemalan | 223 | 0.6% |
| Haitian | 58 | 0.2% |
| Honduran | 59 | 0.2% |
| Hopi | 15 | 0.0% |
| Hungarian | 88 | 0.2% |
| Icelander | 1 | 0.0% |
| Indian (Asian) | 13 | 0.0% |
| Irish | 2,843 | 7.7% |
| Iroquois | 10 | 0.0% |
| Israeli | 42 | 0.1% |
| Italian | 295 | 0.8% |
| Jamaican | 6 | 0.0% |
| Kiowa | 41 | 0.1% |
| Korean | 108 | 0.3% |
| Lebanese | 20 | 0.1% |
| Malaysian | 16 | 0.0% |
| Mexican | 2,479 | 6.7% |
| Navajo | 26 | 0.1% |
| Nicaraguan | 5 | 0.0% |
| Nigerian | 5 | 0.0% |
| Northern European | 24 | 0.1% |
| Norwegian | 126 | 0.3% |
| Osage | 12 | 0.0% |
| Pakistani | 82 | 0.2% |
| Polish | 163 | 0.4% |
| Portuguese | 9 | 0.0% |
| Potawatomi | 10 | 0.0% |
| Pueblo | 7 | 0.0% |
| Puerto Rican | 128 | 0.4% |
| Russian | 48 | 0.1% |
| Scandinavian | 65 | 0.2% |
| Scotch-Irish | 304 | 0.8% |
| Scottish | 381 | 1.0% |
| Seminole | 59 | 0.2% |
| Sioux | 9 | 0.0% |
| South American | 97 | 0.3% |
| Spaniard | 10 | 0.0% |
| Spanish | 9 | 0.0% |
| Sri Lankan | 112 | 0.3% |
| Subsaharan African | 26 | 0.1% |
| Swedish | 168 | 0.4% |
| Swiss | 16 | 0.0% |
| Thai | 4 | 0.0% |
| Welsh | 96 | 0.3% | View All 79 Rows |
Immigrants in Muskogee
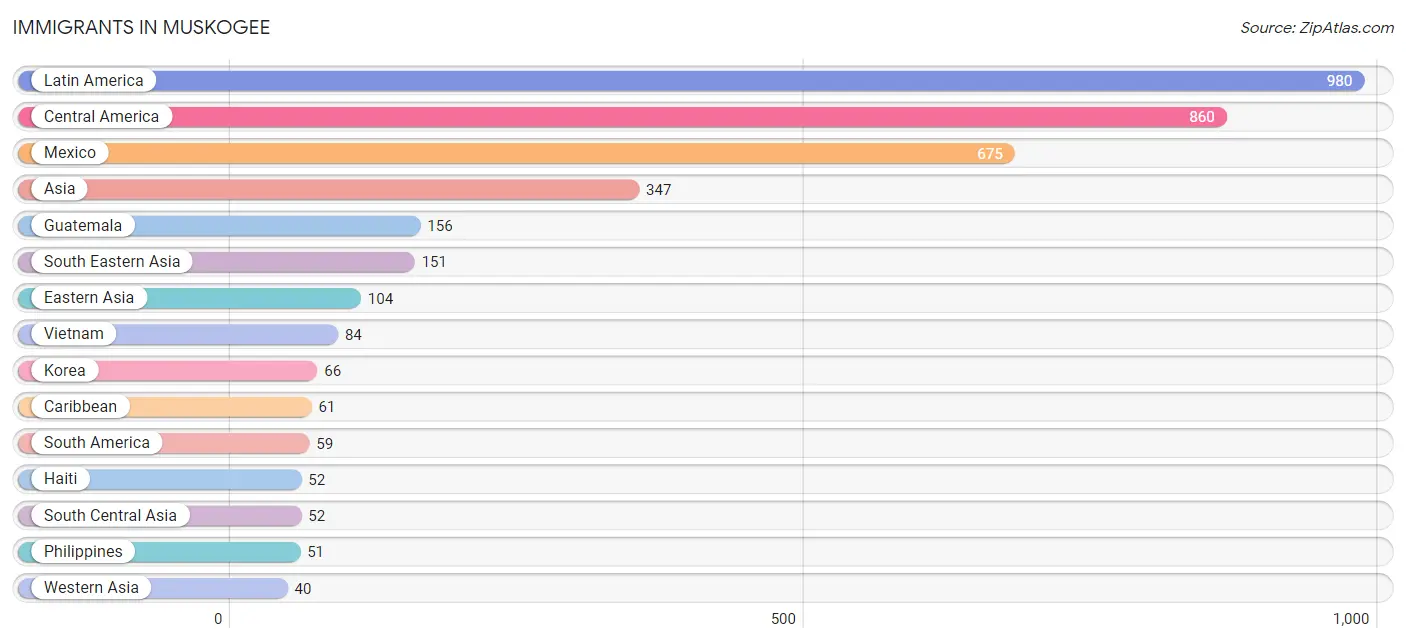
The most numerous immigrant groups reported in Muskogee came from Latin America (980 | 2.6%), Central America (860 | 2.3%), Mexico (675 | 1.8%), Asia (347 | 0.9%), and Guatemala (156 | 0.4%), together accounting for 8.2% of all Muskogee residents.
| Immigration Origin | # Population | % Population |
| Africa | 17 | 0.1% |
| Argentina | 10 | 0.0% |
| Asia | 347 | 0.9% |
| Brazil | 20 | 0.1% |
| Canada | 22 | 0.1% |
| Caribbean | 61 | 0.2% |
| Central America | 860 | 2.3% |
| China | 31 | 0.1% |
| Colombia | 29 | 0.1% |
| Dominican Republic | 9 | 0.0% |
| Eastern Asia | 104 | 0.3% |
| Europe | 11 | 0.0% |
| France | 11 | 0.0% |
| Guatemala | 156 | 0.4% |
| Haiti | 52 | 0.1% |
| Honduras | 29 | 0.1% |
| India | 19 | 0.1% |
| Israel | 30 | 0.1% |
| Japan | 7 | 0.0% |
| Korea | 66 | 0.2% |
| Kuwait | 10 | 0.0% |
| Laos | 16 | 0.0% |
| Latin America | 980 | 2.6% |
| Mexico | 675 | 1.8% |
| Nepal | 23 | 0.1% |
| Oceania | 5 | 0.0% |
| Pakistan | 10 | 0.0% |
| Philippines | 51 | 0.1% |
| South Africa | 8 | 0.0% |
| South America | 59 | 0.2% |
| South Central Asia | 52 | 0.1% |
| South Eastern Asia | 151 | 0.4% |
| Taiwan | 31 | 0.1% |
| Vietnam | 84 | 0.2% |
| Western Asia | 40 | 0.1% |
| Western Europe | 11 | 0.0% | View All 36 Rows |
Sex and Age in Muskogee
Sex and Age in Muskogee
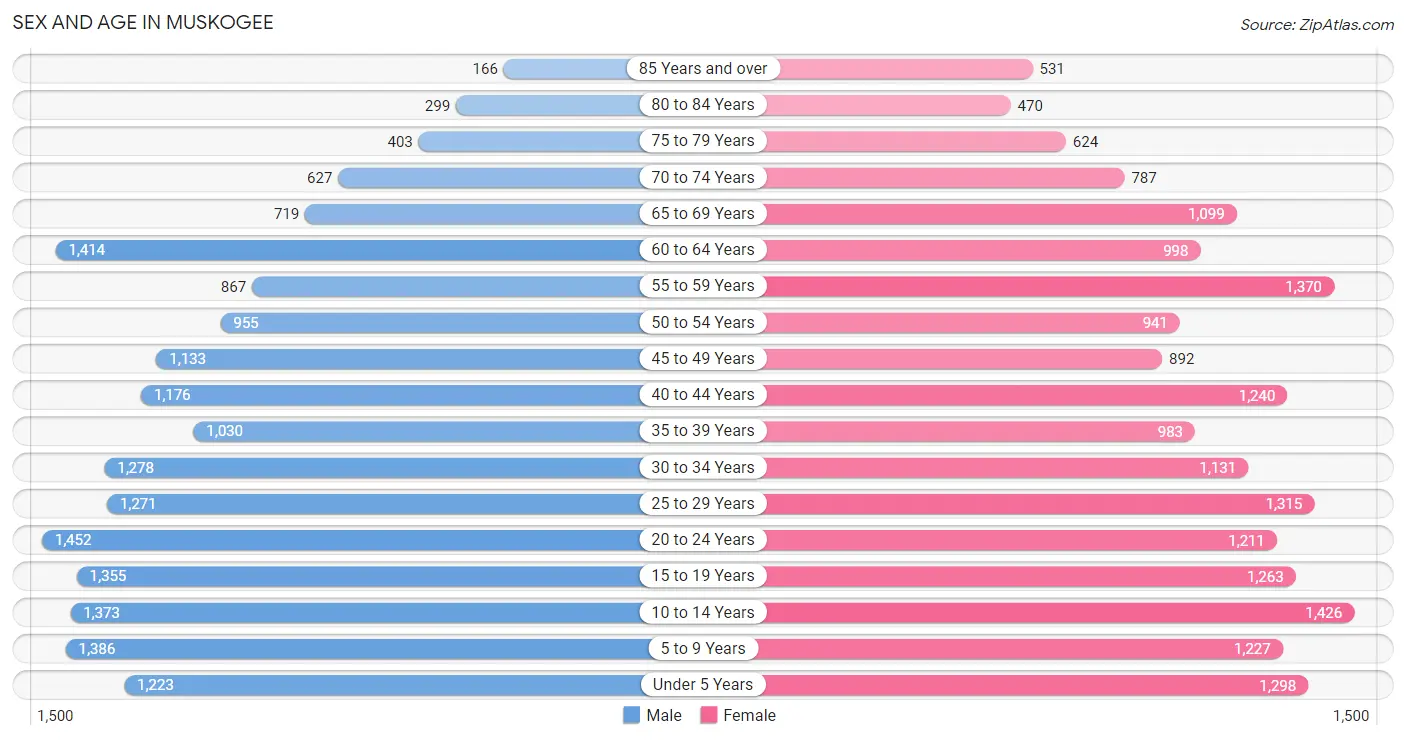
The most populous age groups in Muskogee are 20 to 24 Years (1,452 | 8.0%) for men and 10 to 14 Years (1,426 | 7.6%) for women.
| Age Bracket | Male | Female |
| Under 5 Years | 1,223 (6.8%) | 1,298 (6.9%) |
| 5 to 9 Years | 1,386 (7.6%) | 1,227 (6.5%) |
| 10 to 14 Years | 1,373 (7.6%) | 1,426 (7.6%) |
| 15 to 19 Years | 1,355 (7.5%) | 1,263 (6.7%) |
| 20 to 24 Years | 1,452 (8.0%) | 1,211 (6.4%) |
| 25 to 29 Years | 1,271 (7.0%) | 1,315 (7.0%) |
| 30 to 34 Years | 1,278 (7.0%) | 1,131 (6.0%) |
| 35 to 39 Years | 1,030 (5.7%) | 983 (5.2%) |
| 40 to 44 Years | 1,176 (6.5%) | 1,240 (6.6%) |
| 45 to 49 Years | 1,133 (6.2%) | 892 (4.7%) |
| 50 to 54 Years | 955 (5.3%) | 941 (5.0%) |
| 55 to 59 Years | 867 (4.8%) | 1,370 (7.3%) |
| 60 to 64 Years | 1,414 (7.8%) | 998 (5.3%) |
| 65 to 69 Years | 719 (4.0%) | 1,099 (5.8%) |
| 70 to 74 Years | 627 (3.5%) | 787 (4.2%) |
| 75 to 79 Years | 403 (2.2%) | 624 (3.3%) |
| 80 to 84 Years | 299 (1.7%) | 470 (2.5%) |
| 85 Years and over | 166 (0.9%) | 531 (2.8%) |
| Total | 18,127 (100.0%) | 18,806 (100.0%) |
Families and Households in Muskogee
Median Family Size in Muskogee
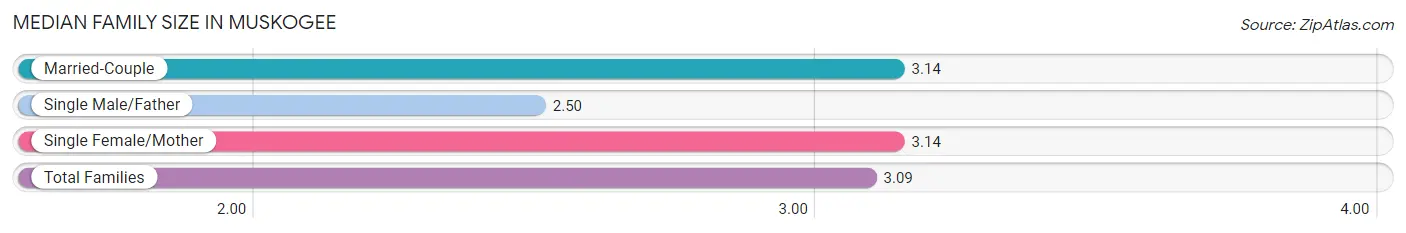
The median family size in Muskogee is 3.09 persons per family, with married-couple families (5,573 | 60.7%) accounting for the largest median family size of 3.14 persons per family. On the other hand, single male/father families (716 | 7.8%) represent the smallest median family size with 2.50 persons per family.
| Family Type | # Families | Family Size |
| Married-Couple | 5,573 (60.7%) | 3.14 |
| Single Male/Father | 716 (7.8%) | 2.50 |
| Single Female/Mother | 2,889 (31.5%) | 3.14 |
| Total Families | 9,178 (100.0%) | 3.09 |
Median Household Size in Muskogee
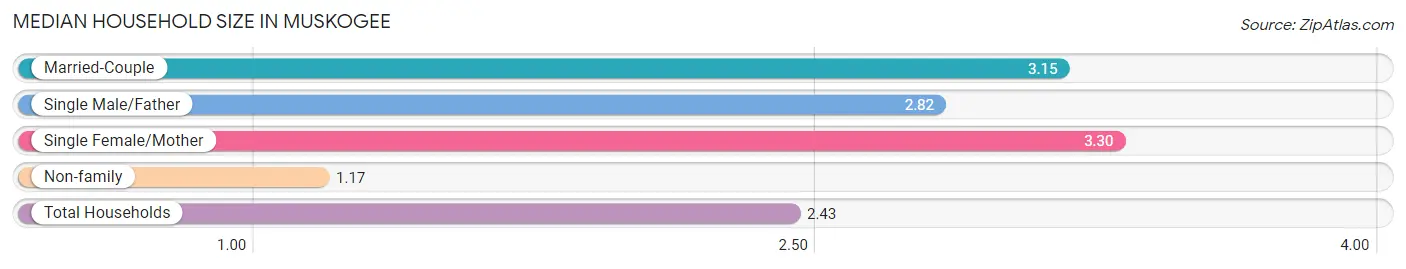
The median household size in Muskogee is 2.43 persons per household, with single female/mother households (2,889 | 19.9%) accounting for the largest median household size of 3.3 persons per household. non-family households (5,375 | 36.9%) represent the smallest median household size with 1.17 persons per household.
| Household Type | # Households | Household Size |
| Married-Couple | 5,573 (38.3%) | 3.15 |
| Single Male/Father | 716 (4.9%) | 2.82 |
| Single Female/Mother | 2,889 (19.9%) | 3.30 |
| Non-family | 5,375 (36.9%) | 1.17 |
| Total Households | 14,553 (100.0%) | 2.43 |
Household Size by Marriage Status in Muskogee
Out of a total of 14,553 households in Muskogee, 9,178 (63.1%) are family households, while 5,375 (36.9%) are nonfamily households. The most numerous type of family households are 2-person households, comprising 4,023, and the most common type of nonfamily households are 1-person households, comprising 4,651.
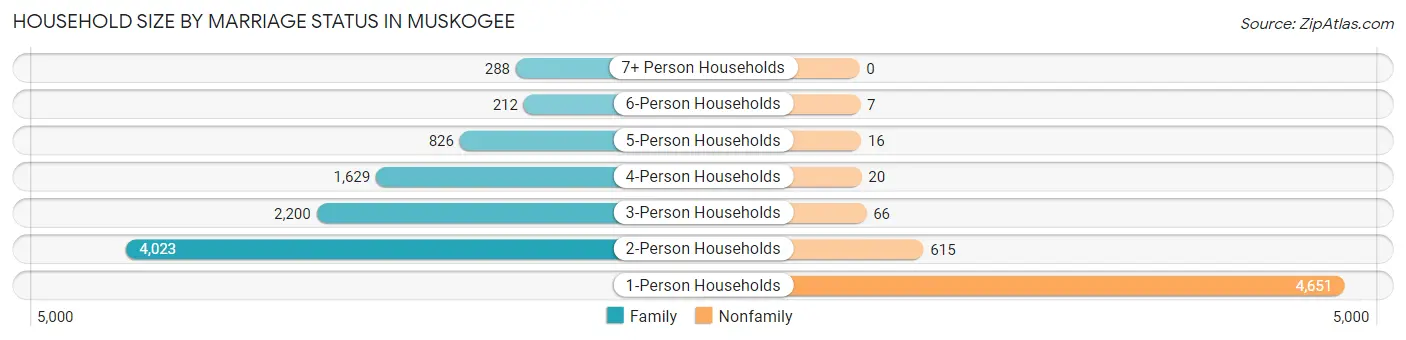
| Household Size | Family Households | Nonfamily Households |
| 1-Person Households | - | 4,651 (32.0%) |
| 2-Person Households | 4,023 (27.6%) | 615 (4.2%) |
| 3-Person Households | 2,200 (15.1%) | 66 (0.4%) |
| 4-Person Households | 1,629 (11.2%) | 20 (0.1%) |
| 5-Person Households | 826 (5.7%) | 16 (0.1%) |
| 6-Person Households | 212 (1.5%) | 7 (0.1%) |
| 7+ Person Households | 288 (2.0%) | 0 (0.0%) |
| Total | 9,178 (63.1%) | 5,375 (36.9%) |
Female Fertility in Muskogee
Fertility by Age in Muskogee
Average fertility rate in Muskogee is 65.0 births per 1,000 women. Women in the age bracket of 20 to 34 years have the highest fertility rate with 112.0 births per 1,000 women. Women in the age bracket of 20 to 34 years acount for 75.3% of all women with births.
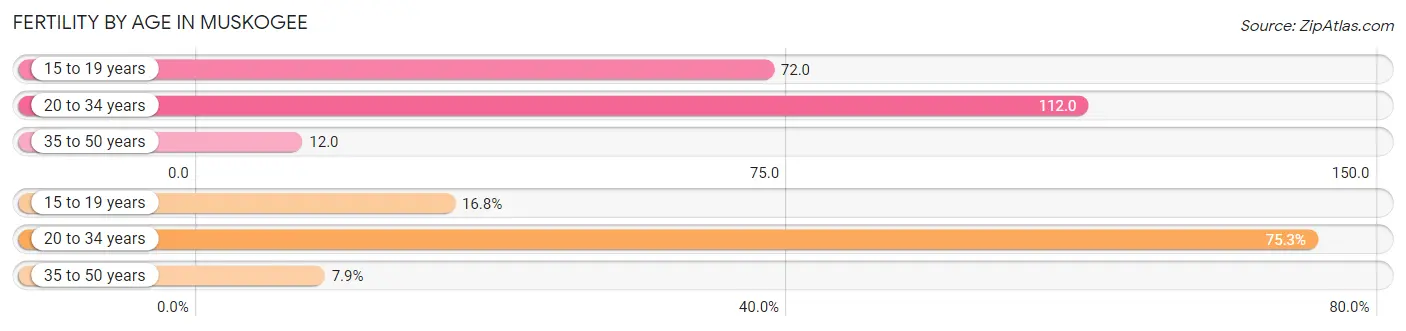
| Age Bracket | Women with Births | Births / 1,000 Women |
| 15 to 19 years | 91 (16.8%) | 72.0 |
| 20 to 34 years | 409 (75.3%) | 112.0 |
| 35 to 50 years | 43 (7.9%) | 12.0 |
| Total | 543 (100.0%) | 65.0 |
Fertility by Age by Marriage Status in Muskogee
45.5% of women with births (543) in Muskogee are married. The highest percentage of unmarried women with births falls into 15 to 19 years age bracket with 100.0% of them unmarried at the time of birth, while the lowest percentage of unmarried women with births belong to 35 to 50 years age bracket with 37.2% of them unmarried.
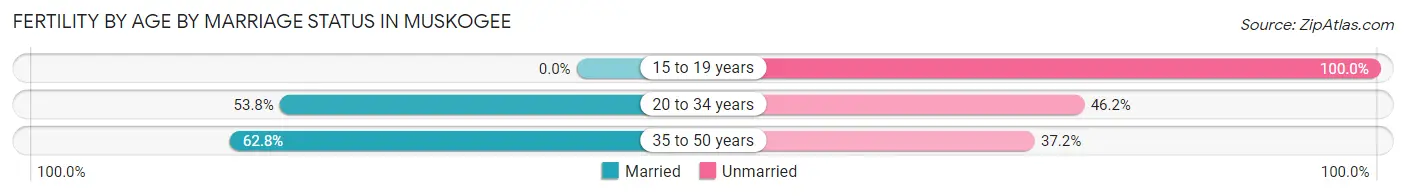
| Age Bracket | Married | Unmarried |
| 15 to 19 years | 0 (0.0%) | 91 (100.0%) |
| 20 to 34 years | 220 (53.8%) | 189 (46.2%) |
| 35 to 50 years | 27 (62.8%) | 16 (37.2%) |
| Total | 247 (45.5%) | 296 (54.5%) |
Fertility by Education in Muskogee
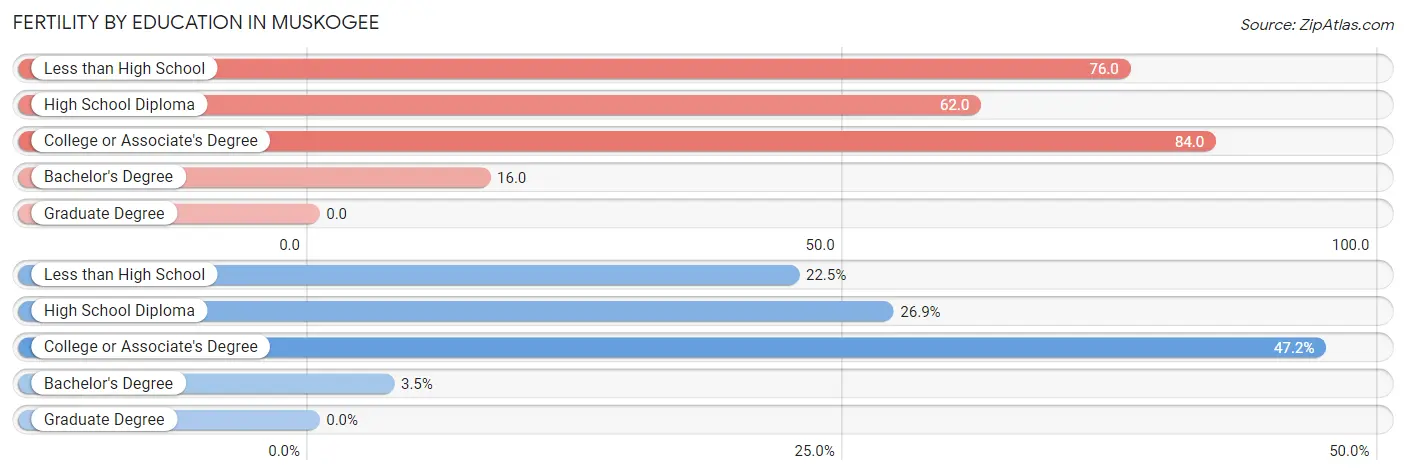
| Educational Attainment | Women with Births | Births / 1,000 Women |
| Less than High School | 122 (22.5%) | 76.0 |
| High School Diploma | 146 (26.9%) | 62.0 |
| College or Associate's Degree | 256 (47.1%) | 84.0 |
| Bachelor's Degree | 19 (3.5%) | 16.0 |
| Graduate Degree | 0 (0.0%) | 0.0 |
| Total | 543 (100.0%) | 65.0 |
Fertility by Education by Marriage Status in Muskogee
54.5% of women with births in Muskogee are unmarried. Women with the educational attainment of bachelor's degree are most likely to be married with 100.0% of them married at childbirth, while women with the educational attainment of less than high school are least likely to be married with 84.4% of them unmarried at childbirth.
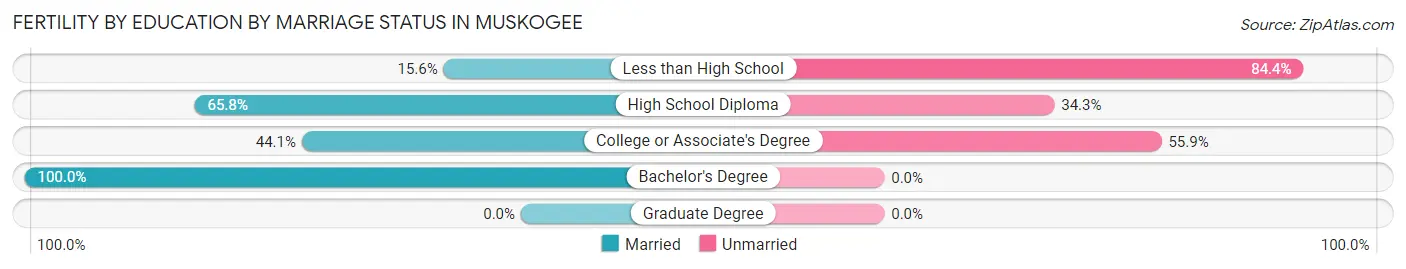
| Educational Attainment | Married | Unmarried |
| Less than High School | 19 (15.6%) | 103 (84.4%) |
| High School Diploma | 96 (65.7%) | 50 (34.3%) |
| College or Associate's Degree | 113 (44.1%) | 143 (55.9%) |
| Bachelor's Degree | 19 (100.0%) | 0 (0.0%) |
| Graduate Degree | 0 (0.0%) | 0 (0.0%) |
| Total | 247 (45.5%) | 296 (54.5%) |
Employment Characteristics in Muskogee
Employment by Class of Employer in Muskogee
Among the 14,674 employed individuals in Muskogee, private company employees (9,514 | 64.8%), federal government employees (1,373 | 9.4%), and local government employees (1,017 | 6.9%) make up the most common classes of employment.
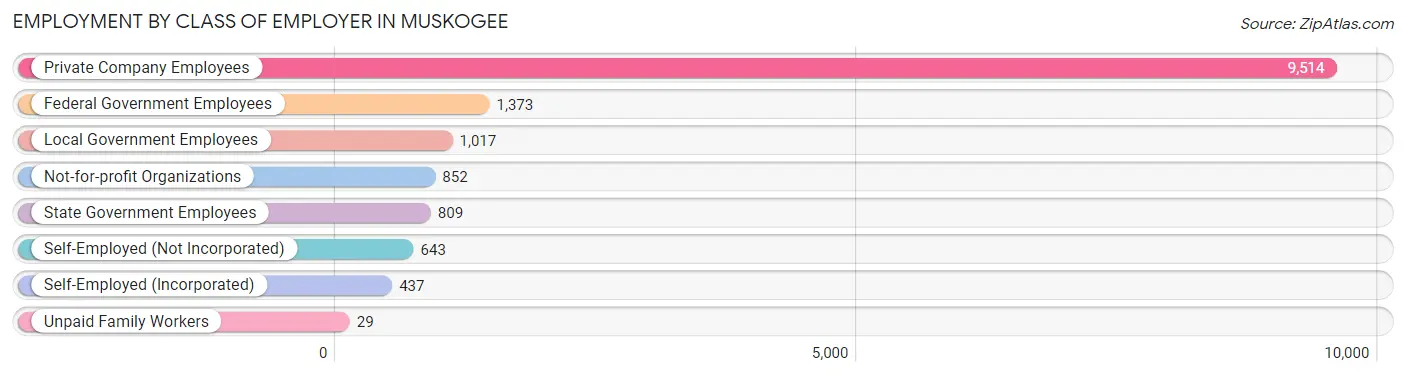
| Employer Class | # Employees | % Employees |
| Private Company Employees | 9,514 | 64.8% |
| Self-Employed (Incorporated) | 437 | 3.0% |
| Self-Employed (Not Incorporated) | 643 | 4.4% |
| Not-for-profit Organizations | 852 | 5.8% |
| Local Government Employees | 1,017 | 6.9% |
| State Government Employees | 809 | 5.5% |
| Federal Government Employees | 1,373 | 9.4% |
| Unpaid Family Workers | 29 | 0.2% |
| Total | 14,674 | 100.0% |
Employment Status by Age in Muskogee
According to the labor force statistics for Muskogee, out of the total population over 16 years of age (28,368), 56.6% or 16,056 individuals are in the labor force, with 6.5% or 1,044 of them unemployed. The age group with the highest labor force participation rate is 35 to 44 years, with 82.2% or 3,641 individuals in the labor force. Within the labor force, the 16 to 19 years age range has the highest percentage of unemployed individuals, with 13.4% or 96 of them being unemployed.
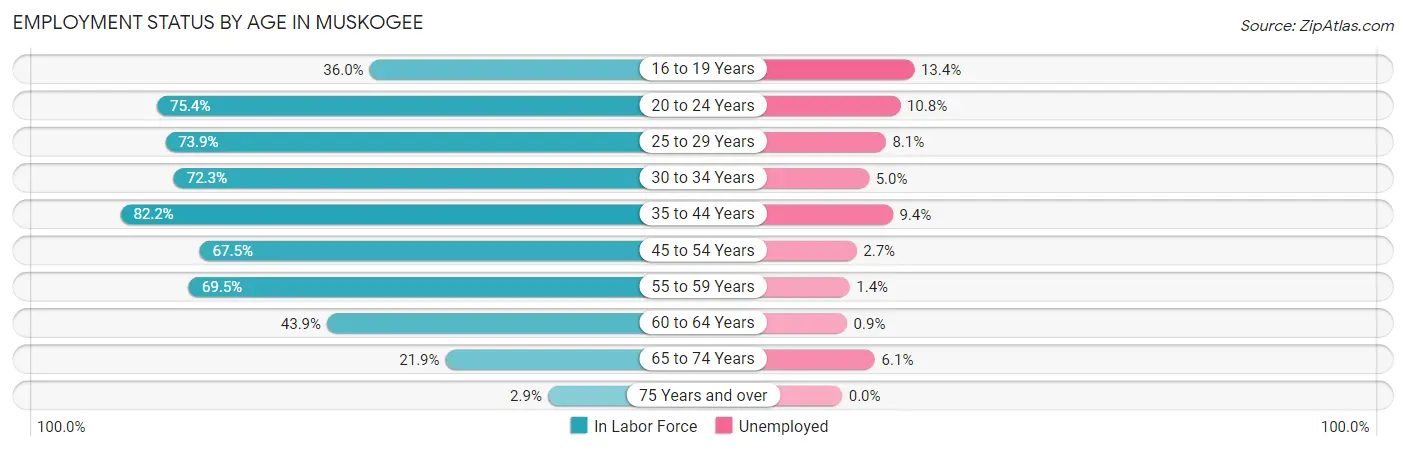
| Age Bracket | In Labor Force | Unemployed |
| 16 to 19 Years | 715 (36.0%) | 96 (13.4%) |
| 20 to 24 Years | 2,008 (75.4%) | 217 (10.8%) |
| 25 to 29 Years | 1,911 (73.9%) | 155 (8.1%) |
| 30 to 34 Years | 1,742 (72.3%) | 87 (5.0%) |
| 35 to 44 Years | 3,641 (82.2%) | 342 (9.4%) |
| 45 to 54 Years | 2,647 (67.5%) | 71 (2.7%) |
| 55 to 59 Years | 1,555 (69.5%) | 22 (1.4%) |
| 60 to 64 Years | 1,059 (43.9%) | 10 (0.9%) |
| 65 to 74 Years | 708 (21.9%) | 43 (6.1%) |
| 75 Years and over | 72 (2.9%) | 0 (0.0%) |
| Total | 16,056 (56.6%) | 1,044 (6.5%) |
Employment Status by Educational Attainment in Muskogee
According to labor force statistics for Muskogee, 69.8% of individuals (12,560) out of the total population between 25 and 64 years of age (17,994) are in the labor force, with 5.5% or 691 of them being unemployed. The group with the highest labor force participation rate are those with the educational attainment of bachelor's degree or higher, with 86.4% or 3,107 individuals in the labor force. Within the labor force, individuals with less than high school education have the highest percentage of unemployment, with 9.6% or 134 of them being unemployed.
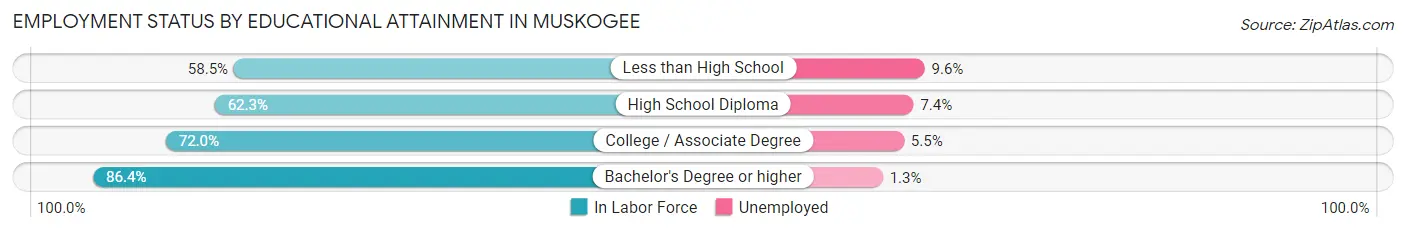
| Educational Attainment | In Labor Force | Unemployed |
| Less than High School | 1,399 (58.5%) | 230 (9.6%) |
| High School Diploma | 3,846 (62.3%) | 457 (7.4%) |
| College / Associate Degree | 4,199 (72.0%) | 321 (5.5%) |
| Bachelor's Degree or higher | 3,107 (86.4%) | 47 (1.3%) |
| Total | 12,560 (69.8%) | 990 (5.5%) |
Employment Occupations by Sex in Muskogee
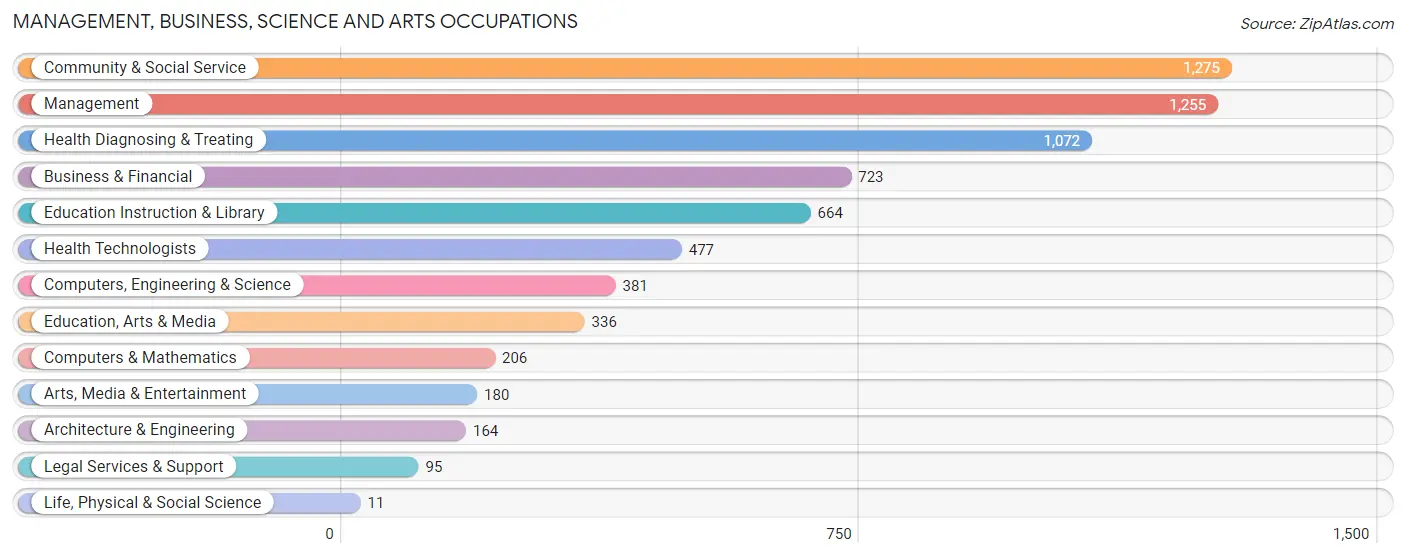
Management, Business, Science and Arts Occupations
The most common Management, Business, Science and Arts occupations in Muskogee are Community & Social Service (1,275 | 8.5%), Management (1,255 | 8.4%), Health Diagnosing & Treating (1,072 | 7.1%), Business & Financial (723 | 4.8%), and Education Instruction & Library (664 | 4.4%).
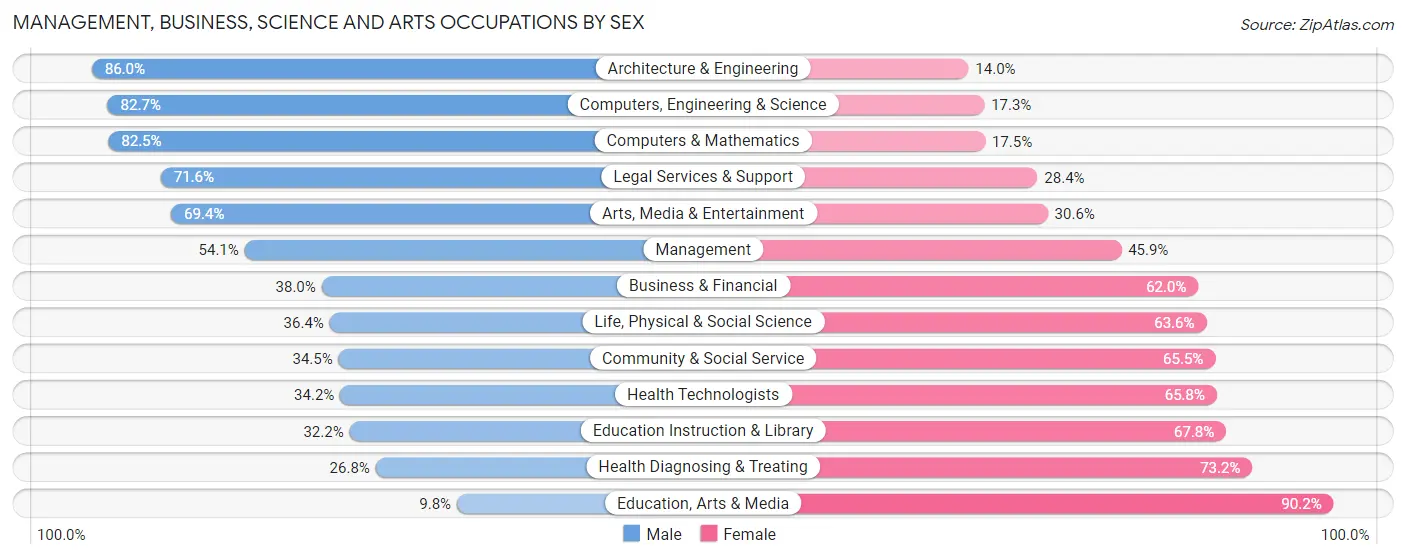
Management, Business, Science and Arts Occupations by Sex
Within the Management, Business, Science and Arts occupations in Muskogee, the most male-oriented occupations are Architecture & Engineering (86.0%), Computers, Engineering & Science (82.7%), and Computers & Mathematics (82.5%), while the most female-oriented occupations are Education, Arts & Media (90.2%), Health Diagnosing & Treating (73.2%), and Education Instruction & Library (67.8%).
| Occupation | Male | Female |
| Management | 679 (54.1%) | 576 (45.9%) |
| Business & Financial | 275 (38.0%) | 448 (62.0%) |
| Computers, Engineering & Science | 315 (82.7%) | 66 (17.3%) |
| Computers & Mathematics | 170 (82.5%) | 36 (17.5%) |
| Architecture & Engineering | 141 (86.0%) | 23 (14.0%) |
| Life, Physical & Social Science | 4 (36.4%) | 7 (63.6%) |
| Community & Social Service | 440 (34.5%) | 835 (65.5%) |
| Education, Arts & Media | 33 (9.8%) | 303 (90.2%) |
| Legal Services & Support | 68 (71.6%) | 27 (28.4%) |
| Education Instruction & Library | 214 (32.2%) | 450 (67.8%) |
| Arts, Media & Entertainment | 125 (69.4%) | 55 (30.6%) |
| Health Diagnosing & Treating | 287 (26.8%) | 785 (73.2%) |
| Health Technologists | 163 (34.2%) | 314 (65.8%) |
| Total (Category) | 1,996 (42.4%) | 2,710 (57.6%) |
| Total (Overall) | 7,852 (52.3%) | 7,150 (47.7%) |
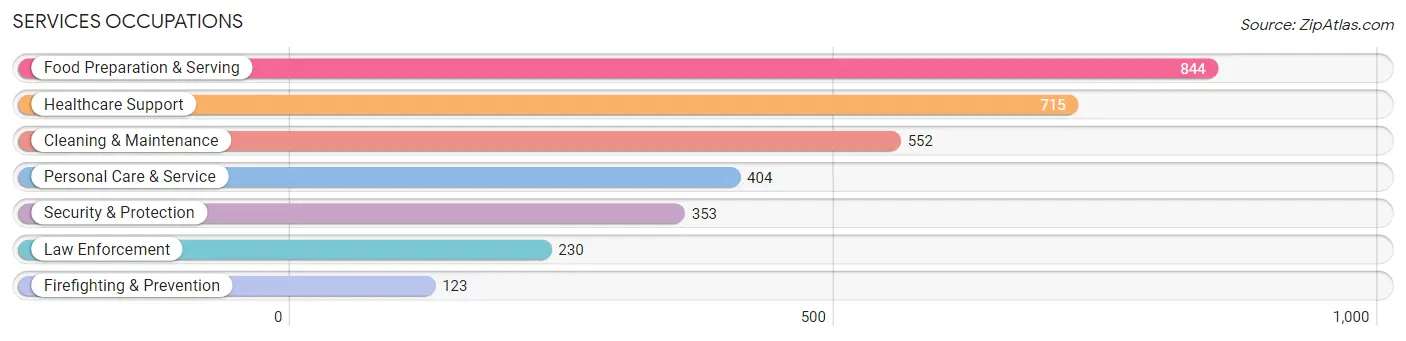
Services Occupations
The most common Services occupations in Muskogee are Food Preparation & Serving (844 | 5.6%), Healthcare Support (715 | 4.8%), Cleaning & Maintenance (552 | 3.7%), Personal Care & Service (404 | 2.7%), and Security & Protection (353 | 2.4%).
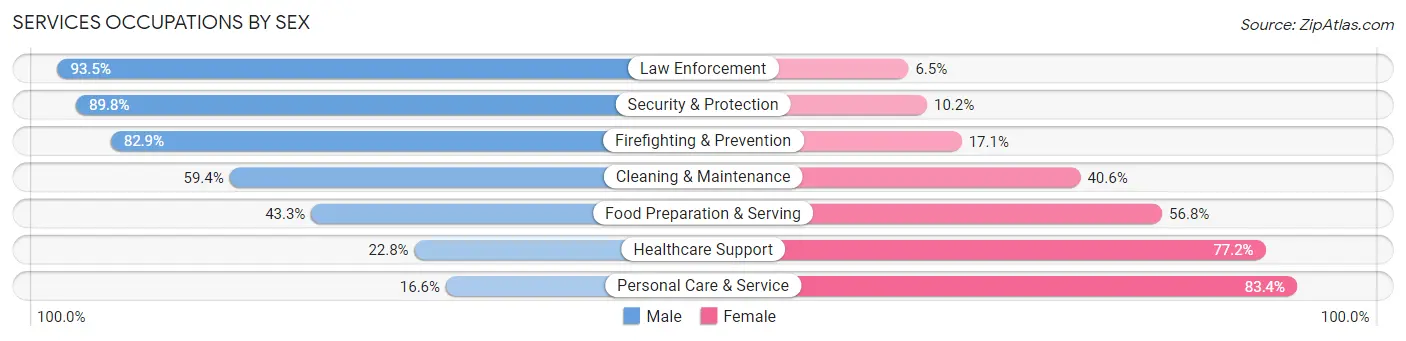
Services Occupations by Sex
Within the Services occupations in Muskogee, the most male-oriented occupations are Law Enforcement (93.5%), Security & Protection (89.8%), and Firefighting & Prevention (82.9%), while the most female-oriented occupations are Personal Care & Service (83.4%), Healthcare Support (77.2%), and Food Preparation & Serving (56.8%).
| Occupation | Male | Female |
| Healthcare Support | 163 (22.8%) | 552 (77.2%) |
| Security & Protection | 317 (89.8%) | 36 (10.2%) |
| Firefighting & Prevention | 102 (82.9%) | 21 (17.1%) |
| Law Enforcement | 215 (93.5%) | 15 (6.5%) |
| Food Preparation & Serving | 365 (43.2%) | 479 (56.8%) |
| Cleaning & Maintenance | 328 (59.4%) | 224 (40.6%) |
| Personal Care & Service | 67 (16.6%) | 337 (83.4%) |
| Total (Category) | 1,240 (43.2%) | 1,628 (56.8%) |
| Total (Overall) | 7,852 (52.3%) | 7,150 (47.7%) |
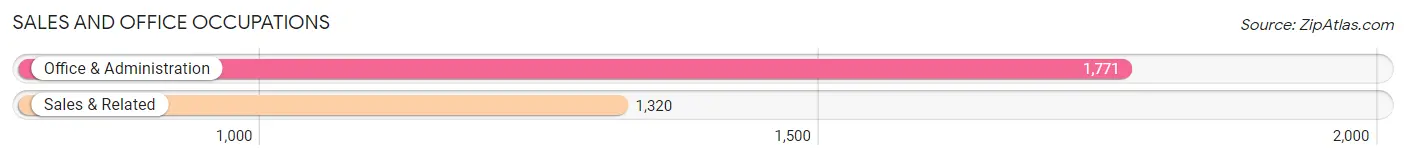
Sales and Office Occupations
The most common Sales and Office occupations in Muskogee are Office & Administration (1,771 | 11.8%), and Sales & Related (1,320 | 8.8%).
Sales and Office Occupations by Sex
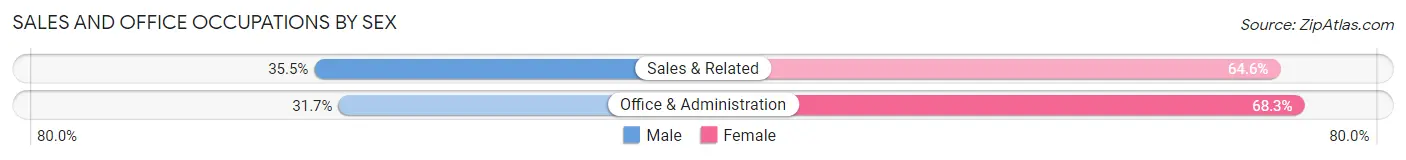
| Occupation | Male | Female |
| Sales & Related | 468 (35.4%) | 852 (64.5%) |
| Office & Administration | 562 (31.7%) | 1,209 (68.3%) |
| Total (Category) | 1,030 (33.3%) | 2,061 (66.7%) |
| Total (Overall) | 7,852 (52.3%) | 7,150 (47.7%) |
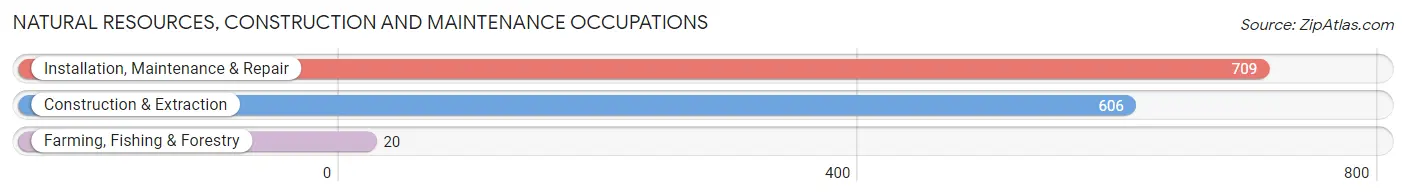
Natural Resources, Construction and Maintenance Occupations
The most common Natural Resources, Construction and Maintenance occupations in Muskogee are Installation, Maintenance & Repair (709 | 4.7%), Construction & Extraction (606 | 4.0%), and Farming, Fishing & Forestry (20 | 0.1%).
Natural Resources, Construction and Maintenance Occupations by Sex
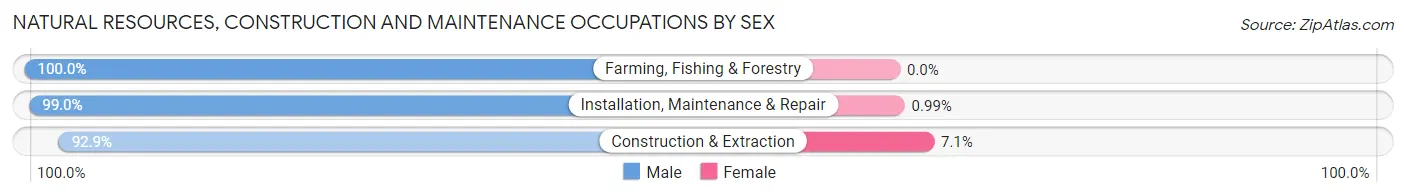
| Occupation | Male | Female |
| Farming, Fishing & Forestry | 20 (100.0%) | 0 (0.0%) |
| Construction & Extraction | 563 (92.9%) | 43 (7.1%) |
| Installation, Maintenance & Repair | 702 (99.0%) | 7 (1.0%) |
| Total (Category) | 1,285 (96.3%) | 50 (3.7%) |
| Total (Overall) | 7,852 (52.3%) | 7,150 (47.7%) |
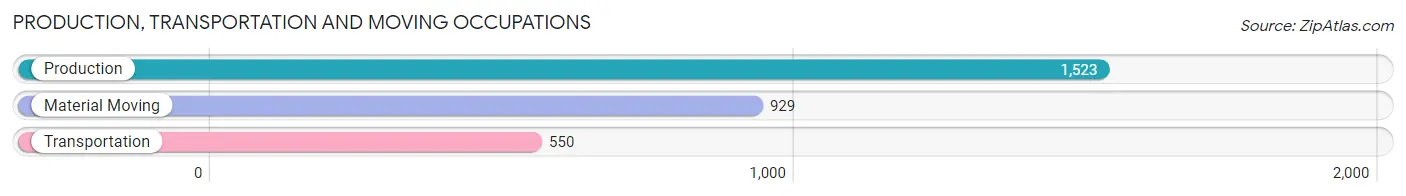
Production, Transportation and Moving Occupations
The most common Production, Transportation and Moving occupations in Muskogee are Production (1,523 | 10.2%), Material Moving (929 | 6.2%), and Transportation (550 | 3.7%).
Production, Transportation and Moving Occupations by Sex
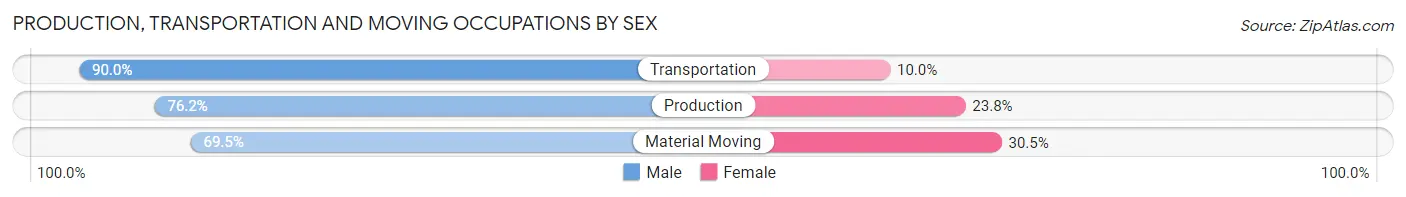
| Occupation | Male | Female |
| Production | 1,160 (76.2%) | 363 (23.8%) |
| Transportation | 495 (90.0%) | 55 (10.0%) |
| Material Moving | 646 (69.5%) | 283 (30.5%) |
| Total (Category) | 2,301 (76.6%) | 701 (23.4%) |
| Total (Overall) | 7,852 (52.3%) | 7,150 (47.7%) |
Employment Industries by Sex in Muskogee
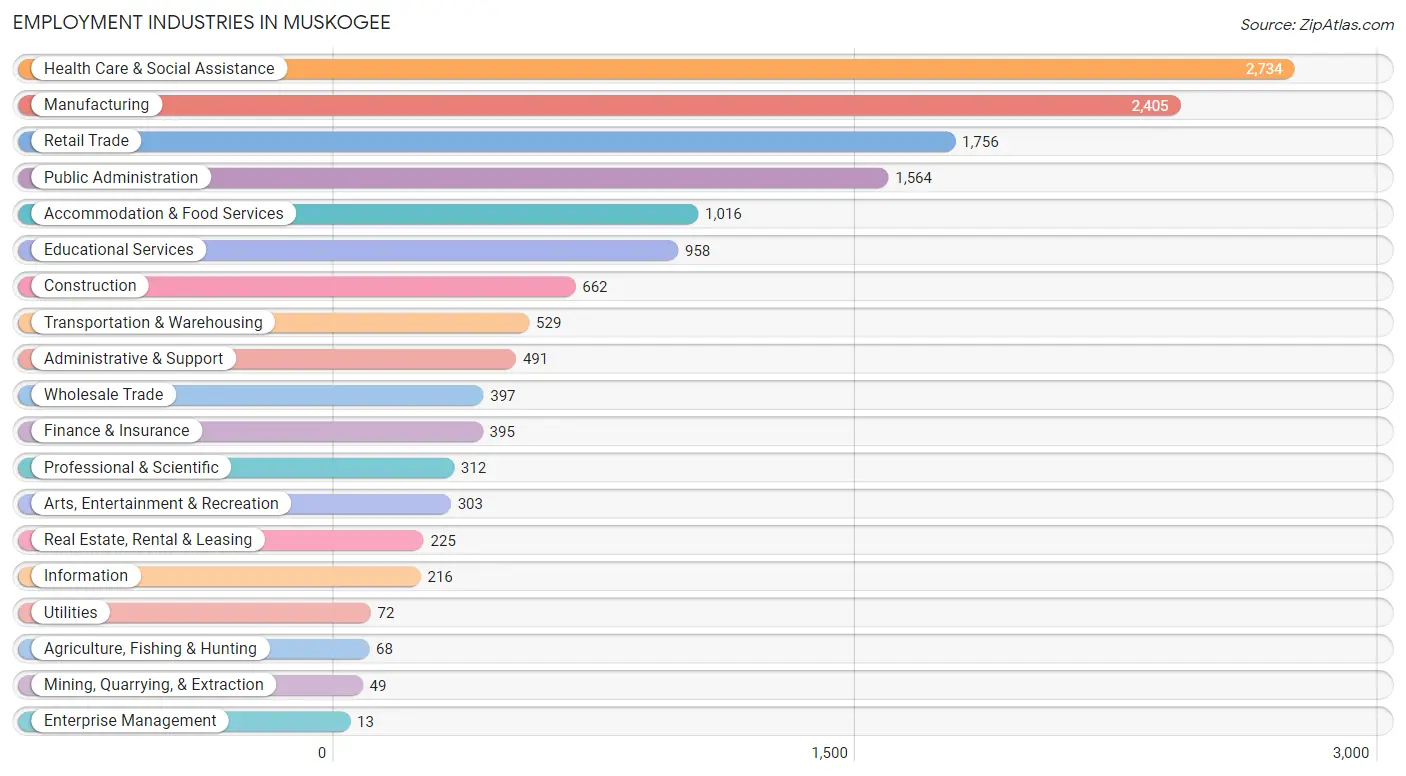
Employment Industries in Muskogee
The major employment industries in Muskogee include Health Care & Social Assistance (2,734 | 18.2%), Manufacturing (2,405 | 16.0%), Retail Trade (1,756 | 11.7%), Public Administration (1,564 | 10.4%), and Accommodation & Food Services (1,016 | 6.8%).
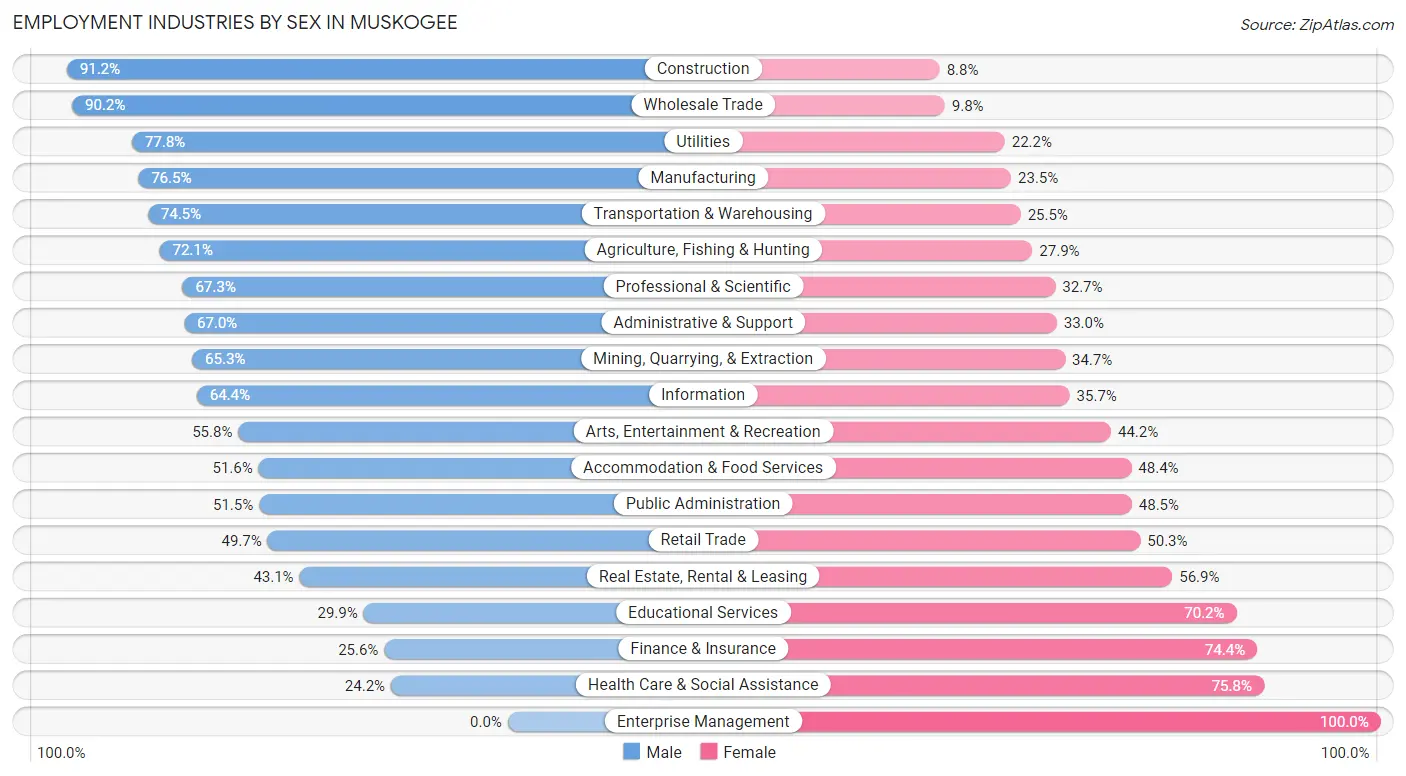
Employment Industries by Sex in Muskogee
The Muskogee industries that see more men than women are Construction (91.2%), Wholesale Trade (90.2%), and Utilities (77.8%), whereas the industries that tend to have a higher number of women are Enterprise Management (100.0%), Health Care & Social Assistance (75.8%), and Finance & Insurance (74.4%).
| Industry | Male | Female |
| Agriculture, Fishing & Hunting | 49 (72.1%) | 19 (27.9%) |
| Mining, Quarrying, & Extraction | 32 (65.3%) | 17 (34.7%) |
| Construction | 604 (91.2%) | 58 (8.8%) |
| Manufacturing | 1,839 (76.5%) | 566 (23.5%) |
| Wholesale Trade | 358 (90.2%) | 39 (9.8%) |
| Retail Trade | 873 (49.7%) | 883 (50.3%) |
| Transportation & Warehousing | 394 (74.5%) | 135 (25.5%) |
| Utilities | 56 (77.8%) | 16 (22.2%) |
| Information | 139 (64.3%) | 77 (35.6%) |
| Finance & Insurance | 101 (25.6%) | 294 (74.4%) |
| Real Estate, Rental & Leasing | 97 (43.1%) | 128 (56.9%) |
| Professional & Scientific | 210 (67.3%) | 102 (32.7%) |
| Enterprise Management | 0 (0.0%) | 13 (100.0%) |
| Administrative & Support | 329 (67.0%) | 162 (33.0%) |
| Educational Services | 286 (29.8%) | 672 (70.2%) |
| Health Care & Social Assistance | 661 (24.2%) | 2,073 (75.8%) |
| Arts, Entertainment & Recreation | 169 (55.8%) | 134 (44.2%) |
| Accommodation & Food Services | 524 (51.6%) | 492 (48.4%) |
| Public Administration | 805 (51.5%) | 759 (48.5%) |
| Total | 7,852 (52.3%) | 7,150 (47.7%) |
Education in Muskogee
School Enrollment in Muskogee
The most common levels of schooling among the 9,437 students in Muskogee are middle school (2,199 | 23.3%), elementary school (2,105 | 22.3%), and high school (2,009 | 21.3%).
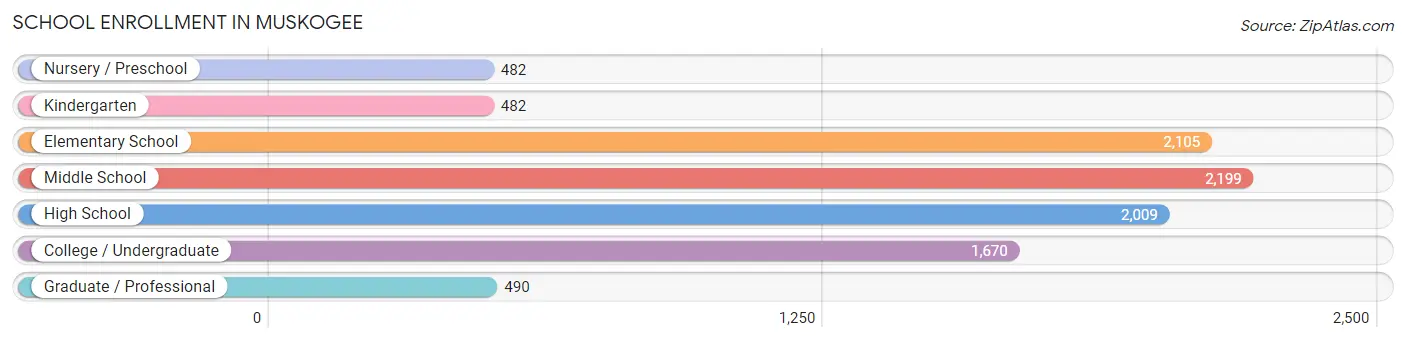
| School Level | # Students | % Students |
| Nursery / Preschool | 482 | 5.1% |
| Kindergarten | 482 | 5.1% |
| Elementary School | 2,105 | 22.3% |
| Middle School | 2,199 | 23.3% |
| High School | 2,009 | 21.3% |
| College / Undergraduate | 1,670 | 17.7% |
| Graduate / Professional | 490 | 5.2% |
| Total | 9,437 | 100.0% |
School Enrollment by Age by Funding Source in Muskogee
Out of a total of 9,437 students who are enrolled in schools in Muskogee, 632 (6.7%) attend a private institution, while the remaining 8,805 (93.3%) are enrolled in public schools. The age group of 35 years and over has the highest likelihood of being enrolled in private schools, with 95 (18.2% in the age bracket) enrolled. Conversely, the age group of 3 to 4 year olds has the lowest likelihood of being enrolled in a private school, with 384 (100.0% in the age bracket) attending a public institution.
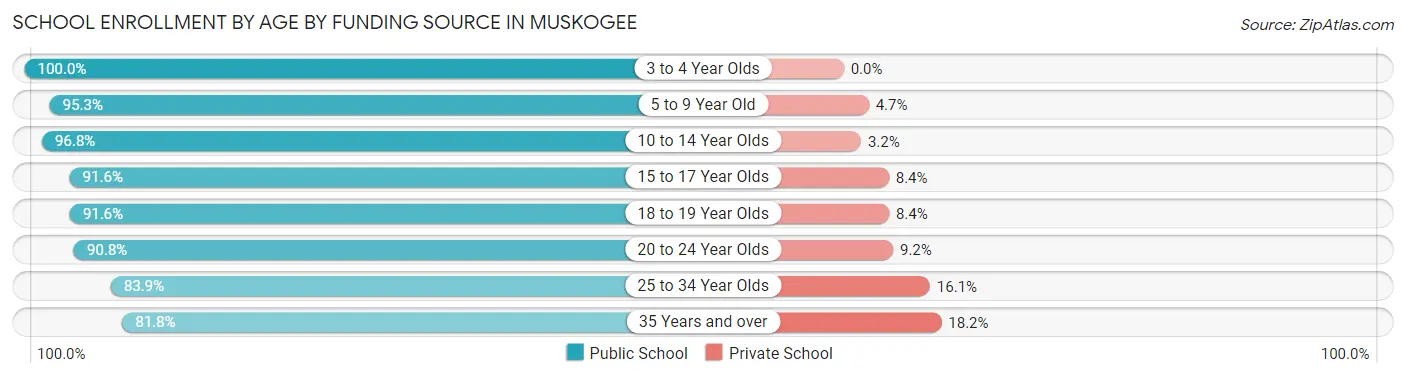
| Age Bracket | Public School | Private School |
| 3 to 4 Year Olds | 384 (100.0%) | 0 (0.0%) |
| 5 to 9 Year Old | 2,265 (95.3%) | 111 (4.7%) |
| 10 to 14 Year Olds | 2,515 (96.8%) | 84 (3.2%) |
| 15 to 17 Year Olds | 1,439 (91.6%) | 132 (8.4%) |
| 18 to 19 Year Olds | 651 (91.6%) | 60 (8.4%) |
| 20 to 24 Year Olds | 682 (90.8%) | 69 (9.2%) |
| 25 to 34 Year Olds | 439 (83.9%) | 84 (16.1%) |
| 35 Years and over | 427 (81.8%) | 95 (18.2%) |
| Total | 8,805 (93.3%) | 632 (6.7%) |
Educational Attainment by Field of Study in Muskogee
Education (1,112 | 22.0%), business (857 | 17.0%), science & technology (621 | 12.3%), arts & humanities (496 | 9.8%), and bio, nature & agricultural (328 | 6.5%) are the most common fields of study among 5,051 individuals in Muskogee who have obtained a bachelor's degree or higher.
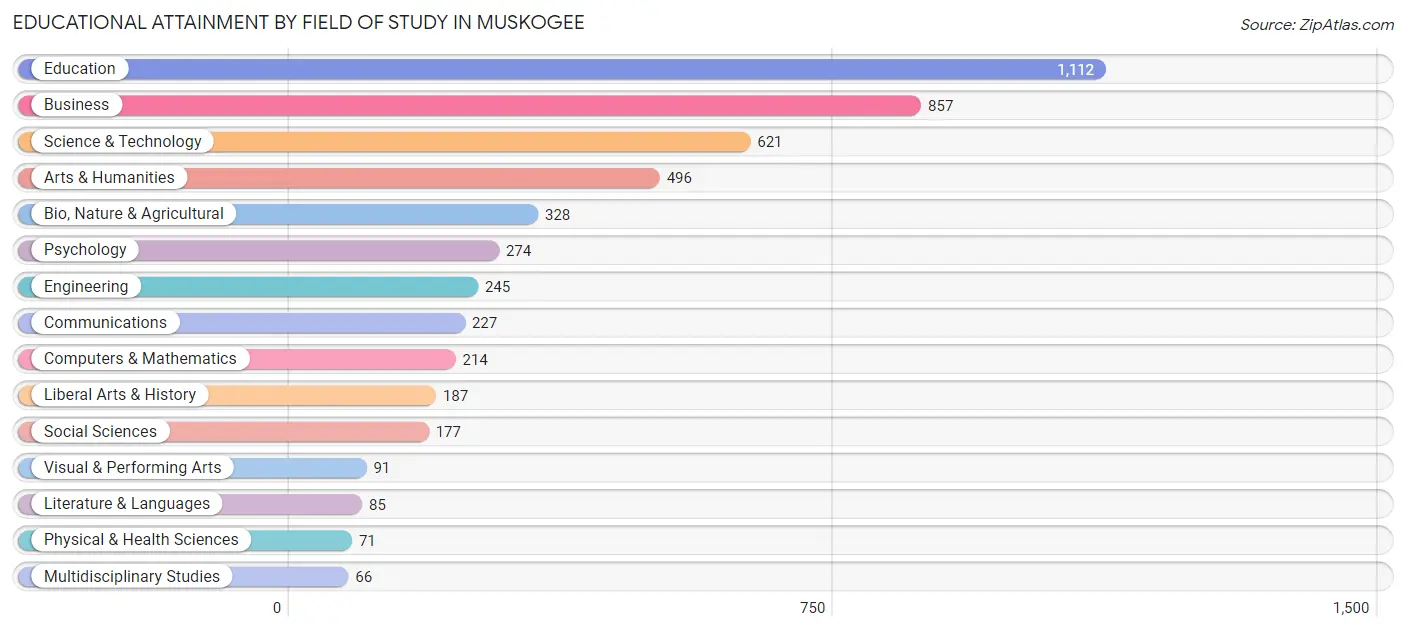
| Field of Study | # Graduates | % Graduates |
| Computers & Mathematics | 214 | 4.2% |
| Bio, Nature & Agricultural | 328 | 6.5% |
| Physical & Health Sciences | 71 | 1.4% |
| Psychology | 274 | 5.4% |
| Social Sciences | 177 | 3.5% |
| Engineering | 245 | 4.9% |
| Multidisciplinary Studies | 66 | 1.3% |
| Science & Technology | 621 | 12.3% |
| Business | 857 | 17.0% |
| Education | 1,112 | 22.0% |
| Literature & Languages | 85 | 1.7% |
| Liberal Arts & History | 187 | 3.7% |
| Visual & Performing Arts | 91 | 1.8% |
| Communications | 227 | 4.5% |
| Arts & Humanities | 496 | 9.8% |
| Total | 5,051 | 100.0% |
Transportation & Commute in Muskogee
Vehicle Availability by Sex in Muskogee
The most prevalent vehicle ownership categories in Muskogee are males with 2 vehicles (3,480, accounting for 46.3%) and females with 2 vehicles (2,870, making up 50.6%).
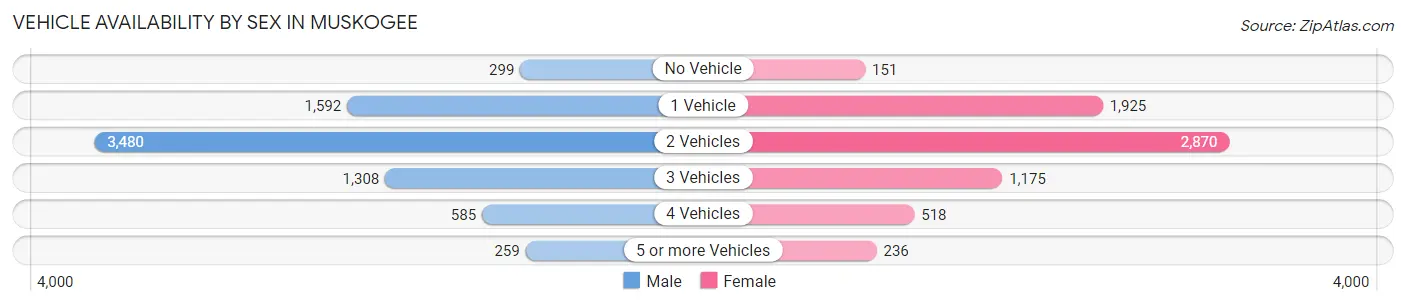
| Vehicles Available | Male | Female |
| No Vehicle | 299 (4.0%) | 151 (2.2%) |
| 1 Vehicle | 1,592 (21.2%) | 1,925 (28.0%) |
| 2 Vehicles | 3,480 (46.3%) | 2,870 (41.7%) |
| 3 Vehicles | 1,308 (17.4%) | 1,175 (17.1%) |
| 4 Vehicles | 585 (7.8%) | 518 (7.5%) |
| 5 or more Vehicles | 259 (3.4%) | 236 (3.4%) |
| Total | 7,523 (100.0%) | 6,875 (100.0%) |
Commute Time in Muskogee
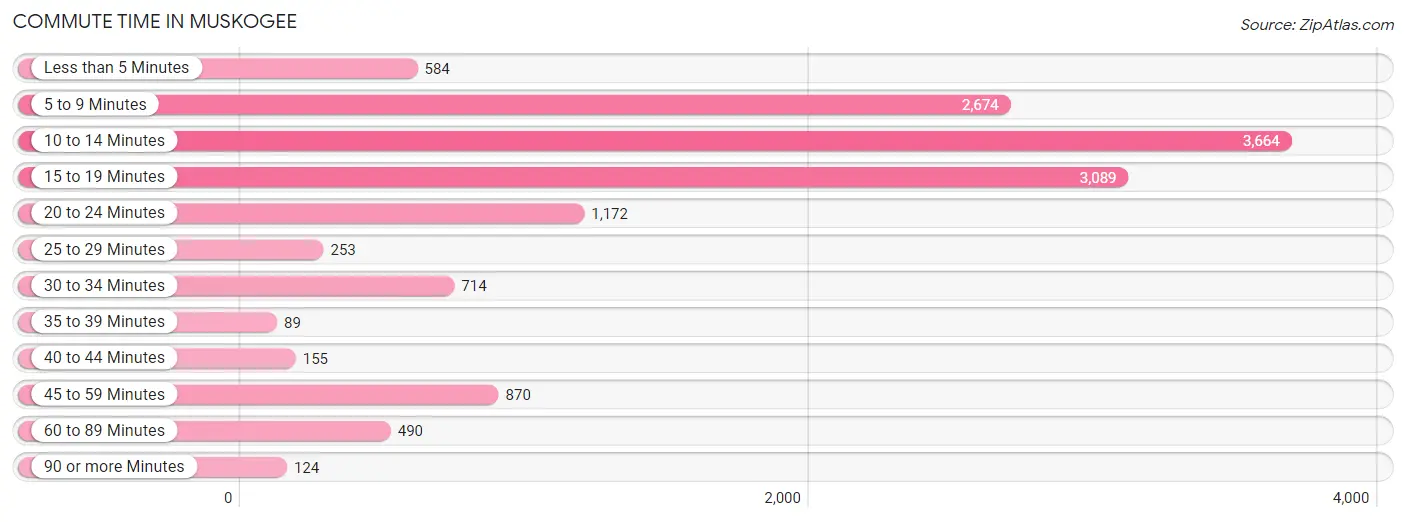
The most frequently occuring commute durations in Muskogee are 10 to 14 minutes (3,664 commuters, 26.4%), 15 to 19 minutes (3,089 commuters, 22.3%), and 5 to 9 minutes (2,674 commuters, 19.3%).
| Commute Time | # Commuters | % Commuters |
| Less than 5 Minutes | 584 | 4.2% |
| 5 to 9 Minutes | 2,674 | 19.3% |
| 10 to 14 Minutes | 3,664 | 26.4% |
| 15 to 19 Minutes | 3,089 | 22.3% |
| 20 to 24 Minutes | 1,172 | 8.5% |
| 25 to 29 Minutes | 253 | 1.8% |
| 30 to 34 Minutes | 714 | 5.1% |
| 35 to 39 Minutes | 89 | 0.6% |
| 40 to 44 Minutes | 155 | 1.1% |
| 45 to 59 Minutes | 870 | 6.3% |
| 60 to 89 Minutes | 490 | 3.5% |
| 90 or more Minutes | 124 | 0.9% |
Commute Time by Sex in Muskogee
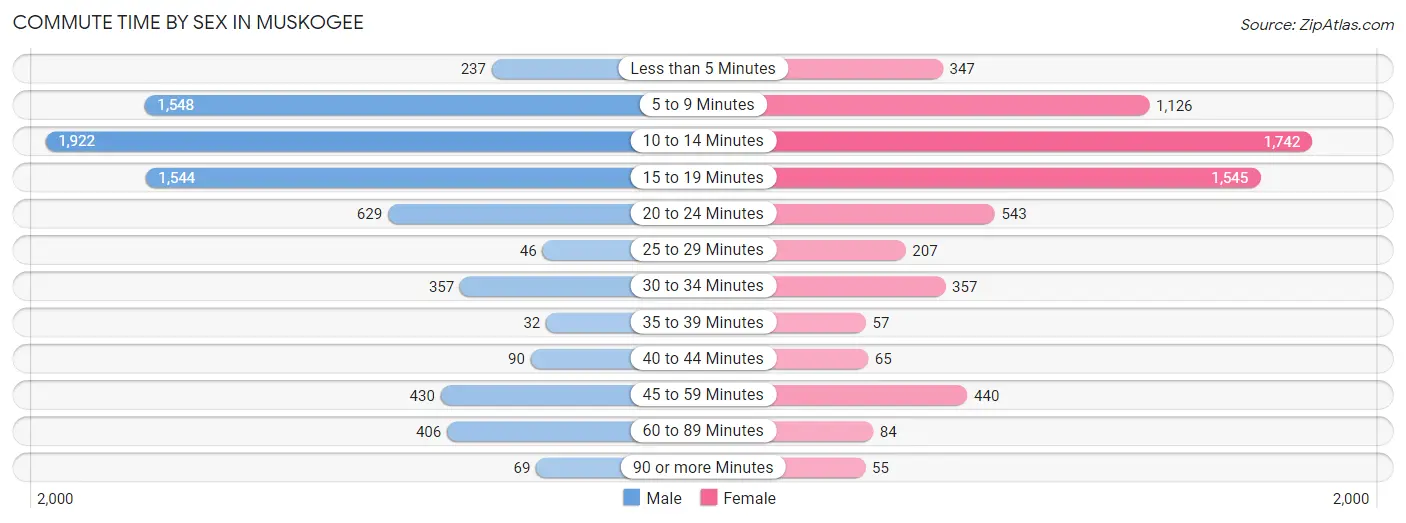
The most common commute times in Muskogee are 10 to 14 minutes (1,922 commuters, 26.3%) for males and 10 to 14 minutes (1,742 commuters, 26.5%) for females.
| Commute Time | Male | Female |
| Less than 5 Minutes | 237 (3.2%) | 347 (5.3%) |
| 5 to 9 Minutes | 1,548 (21.2%) | 1,126 (17.1%) |
| 10 to 14 Minutes | 1,922 (26.3%) | 1,742 (26.5%) |
| 15 to 19 Minutes | 1,544 (21.1%) | 1,545 (23.5%) |
| 20 to 24 Minutes | 629 (8.6%) | 543 (8.3%) |
| 25 to 29 Minutes | 46 (0.6%) | 207 (3.2%) |
| 30 to 34 Minutes | 357 (4.9%) | 357 (5.4%) |
| 35 to 39 Minutes | 32 (0.4%) | 57 (0.9%) |
| 40 to 44 Minutes | 90 (1.2%) | 65 (1.0%) |
| 45 to 59 Minutes | 430 (5.9%) | 440 (6.7%) |
| 60 to 89 Minutes | 406 (5.6%) | 84 (1.3%) |
| 90 or more Minutes | 69 (0.9%) | 55 (0.8%) |
Time of Departure to Work by Sex in Muskogee
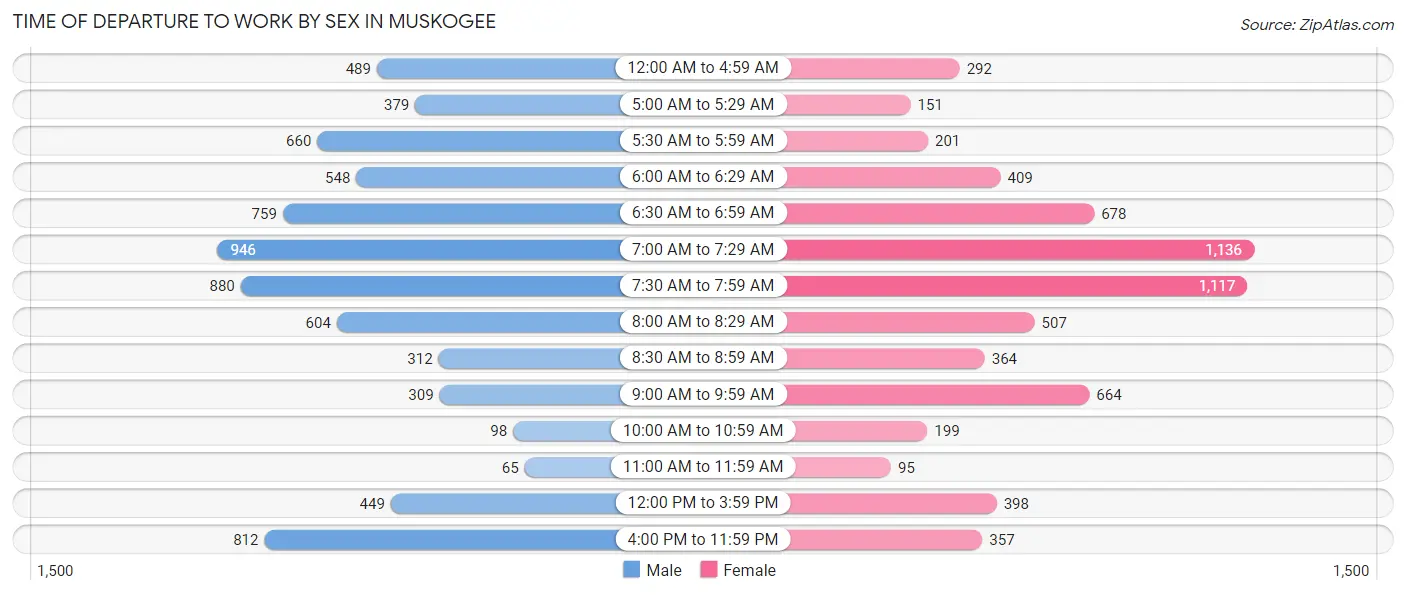
The most frequent times of departure to work in Muskogee are 7:00 AM to 7:29 AM (946, 12.9%) for males and 7:00 AM to 7:29 AM (1,136, 17.3%) for females.
| Time of Departure | Male | Female |
| 12:00 AM to 4:59 AM | 489 (6.7%) | 292 (4.4%) |
| 5:00 AM to 5:29 AM | 379 (5.2%) | 151 (2.3%) |
| 5:30 AM to 5:59 AM | 660 (9.0%) | 201 (3.1%) |
| 6:00 AM to 6:29 AM | 548 (7.5%) | 409 (6.2%) |
| 6:30 AM to 6:59 AM | 759 (10.4%) | 678 (10.3%) |
| 7:00 AM to 7:29 AM | 946 (12.9%) | 1,136 (17.3%) |
| 7:30 AM to 7:59 AM | 880 (12.0%) | 1,117 (17.0%) |
| 8:00 AM to 8:29 AM | 604 (8.3%) | 507 (7.7%) |
| 8:30 AM to 8:59 AM | 312 (4.3%) | 364 (5.5%) |
| 9:00 AM to 9:59 AM | 309 (4.2%) | 664 (10.1%) |
| 10:00 AM to 10:59 AM | 98 (1.3%) | 199 (3.0%) |
| 11:00 AM to 11:59 AM | 65 (0.9%) | 95 (1.5%) |
| 12:00 PM to 3:59 PM | 449 (6.1%) | 398 (6.1%) |
| 4:00 PM to 11:59 PM | 812 (11.1%) | 357 (5.4%) |
| Total | 7,310 (100.0%) | 6,568 (100.0%) |
Housing Occupancy in Muskogee
Occupancy by Ownership in Muskogee
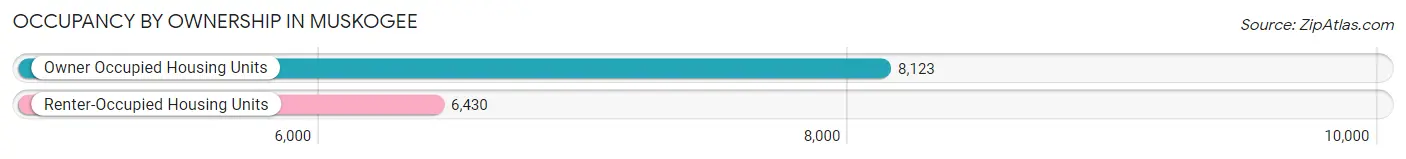
Of the total 14,553 dwellings in Muskogee, owner-occupied units account for 8,123 (55.8%), while renter-occupied units make up 6,430 (44.2%).
| Occupancy | # Housing Units | % Housing Units |
| Owner Occupied Housing Units | 8,123 | 55.8% |
| Renter-Occupied Housing Units | 6,430 | 44.2% |
| Total Occupied Housing Units | 14,553 | 100.0% |
Occupancy by Household Size in Muskogee
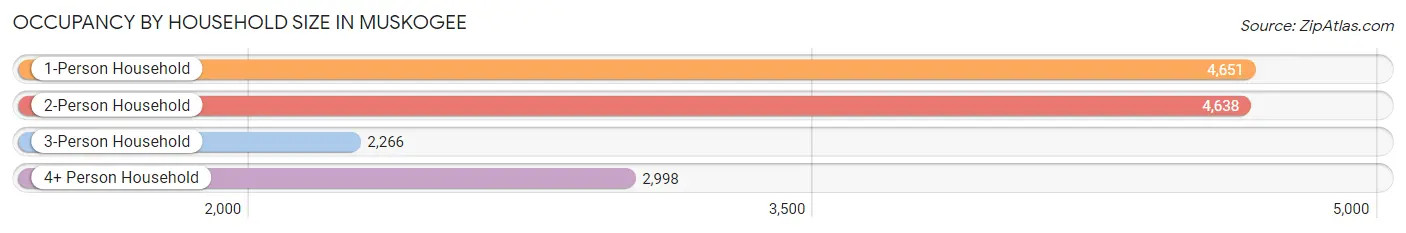
| Household Size | # Housing Units | % Housing Units |
| 1-Person Household | 4,651 | 32.0% |
| 2-Person Household | 4,638 | 31.9% |
| 3-Person Household | 2,266 | 15.6% |
| 4+ Person Household | 2,998 | 20.6% |
| Total Housing Units | 14,553 | 100.0% |
Occupancy by Ownership by Household Size in Muskogee
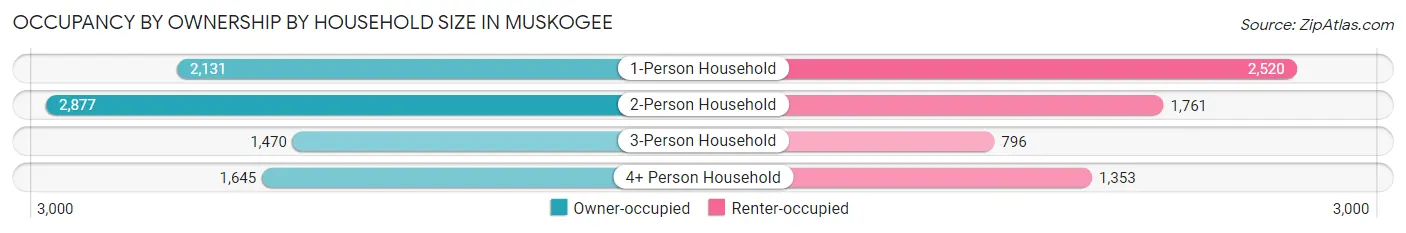
| Household Size | Owner-occupied | Renter-occupied |
| 1-Person Household | 2,131 (45.8%) | 2,520 (54.2%) |
| 2-Person Household | 2,877 (62.0%) | 1,761 (38.0%) |
| 3-Person Household | 1,470 (64.9%) | 796 (35.1%) |
| 4+ Person Household | 1,645 (54.9%) | 1,353 (45.1%) |
| Total Housing Units | 8,123 (55.8%) | 6,430 (44.2%) |
Occupancy by Educational Attainment in Muskogee
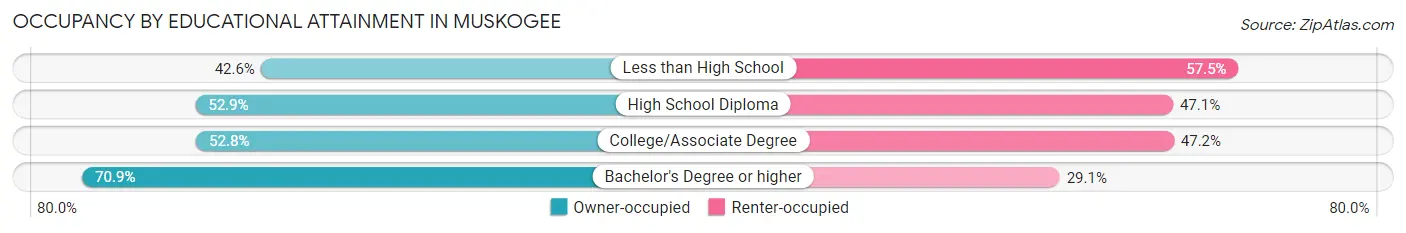
| Household Size | Owner-occupied | Renter-occupied |
| Less than High School | 737 (42.5%) | 995 (57.5%) |
| High School Diploma | 2,426 (52.9%) | 2,158 (47.1%) |
| College/Associate Degree | 2,562 (52.8%) | 2,292 (47.2%) |
| Bachelor's Degree or higher | 2,398 (70.9%) | 985 (29.1%) |
Occupancy by Age of Householder in Muskogee
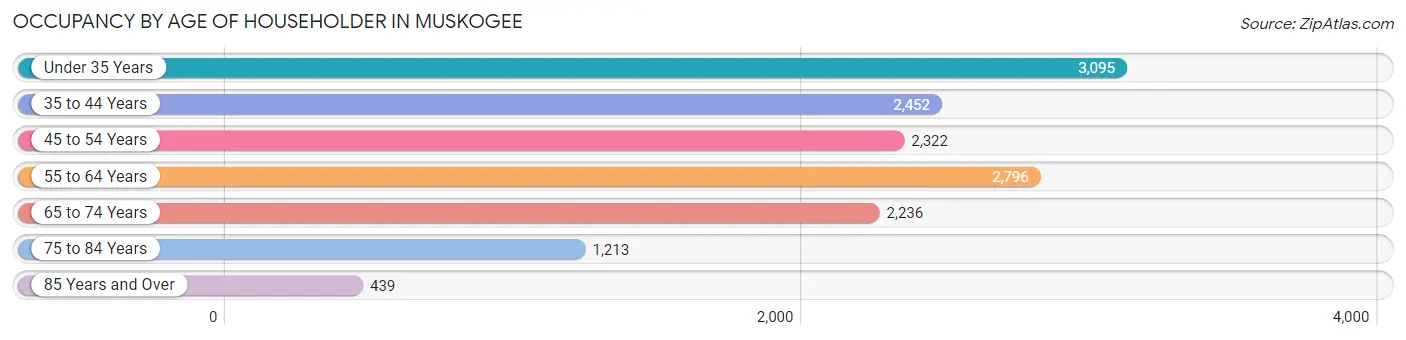
| Age Bracket | # Households | % Households |
| Under 35 Years | 3,095 | 21.3% |
| 35 to 44 Years | 2,452 | 16.9% |
| 45 to 54 Years | 2,322 | 16.0% |
| 55 to 64 Years | 2,796 | 19.2% |
| 65 to 74 Years | 2,236 | 15.4% |
| 75 to 84 Years | 1,213 | 8.3% |
| 85 Years and Over | 439 | 3.0% |
| Total | 14,553 | 100.0% |
Housing Finances in Muskogee
Median Income by Occupancy in Muskogee
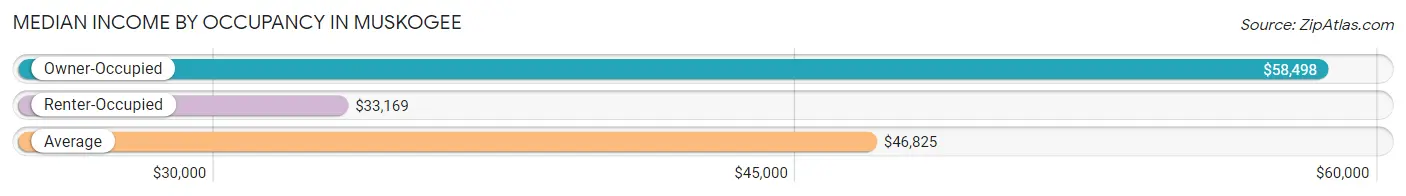
| Occupancy Type | # Households | Median Income |
| Owner-Occupied | 8,123 (55.8%) | $58,498 |
| Renter-Occupied | 6,430 (44.2%) | $33,169 |
| Average | 14,553 (100.0%) | $46,825 |
Occupancy by Householder Income Bracket in Muskogee
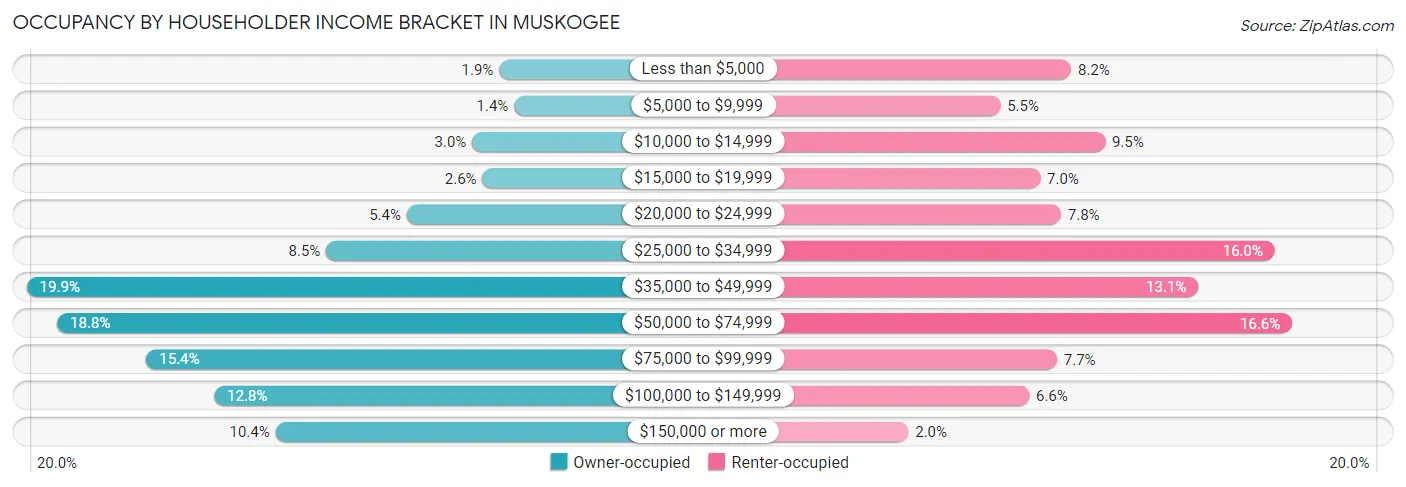
| Income Bracket | Owner-occupied | Renter-occupied |
| Less than $5,000 | 156 (1.9%) | 528 (8.2%) |
| $5,000 to $9,999 | 110 (1.3%) | 354 (5.5%) |
| $10,000 to $14,999 | 240 (2.9%) | 611 (9.5%) |
| $15,000 to $19,999 | 208 (2.6%) | 452 (7.0%) |
| $20,000 to $24,999 | 442 (5.4%) | 503 (7.8%) |
| $25,000 to $34,999 | 691 (8.5%) | 1,027 (16.0%) |
| $35,000 to $49,999 | 1,618 (19.9%) | 839 (13.1%) |
| $50,000 to $74,999 | 1,524 (18.8%) | 1,069 (16.6%) |
| $75,000 to $99,999 | 1,248 (15.4%) | 493 (7.7%) |
| $100,000 to $149,999 | 1,038 (12.8%) | 425 (6.6%) |
| $150,000 or more | 848 (10.4%) | 129 (2.0%) |
| Total | 8,123 (100.0%) | 6,430 (100.0%) |
Monthly Housing Cost Tiers in Muskogee
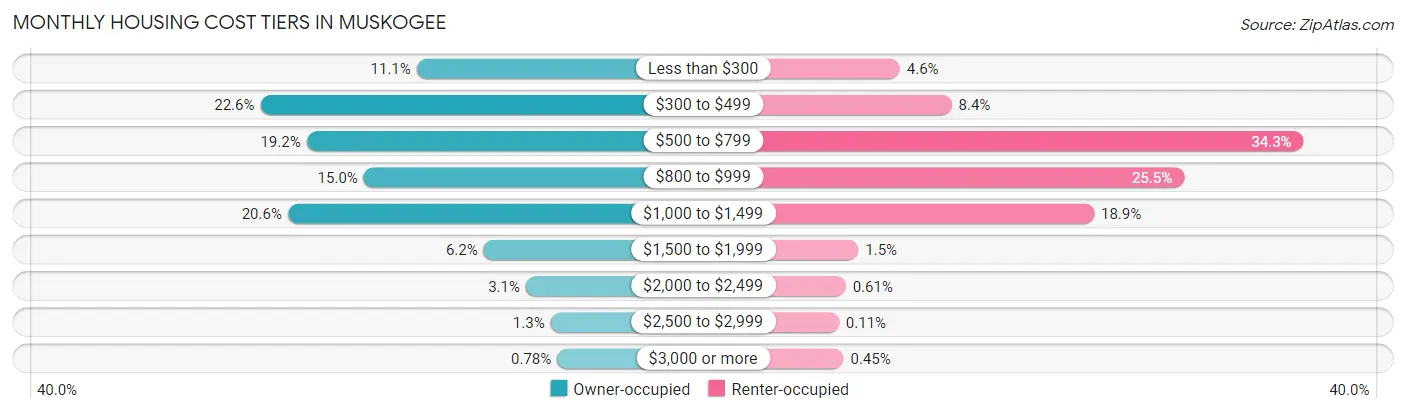
| Monthly Cost | Owner-occupied | Renter-occupied |
| Less than $300 | 904 (11.1%) | 296 (4.6%) |
| $300 to $499 | 1,839 (22.6%) | 541 (8.4%) |
| $500 to $799 | 1,563 (19.2%) | 2,207 (34.3%) |
| $800 to $999 | 1,221 (15.0%) | 1,641 (25.5%) |
| $1,000 to $1,499 | 1,675 (20.6%) | 1,215 (18.9%) |
| $1,500 to $1,999 | 504 (6.2%) | 99 (1.5%) |
| $2,000 to $2,499 | 251 (3.1%) | 39 (0.6%) |
| $2,500 to $2,999 | 103 (1.3%) | 7 (0.1%) |
| $3,000 or more | 63 (0.8%) | 29 (0.4%) |
| Total | 8,123 (100.0%) | 6,430 (100.0%) |
Physical Housing Characteristics in Muskogee
Housing Structures in Muskogee
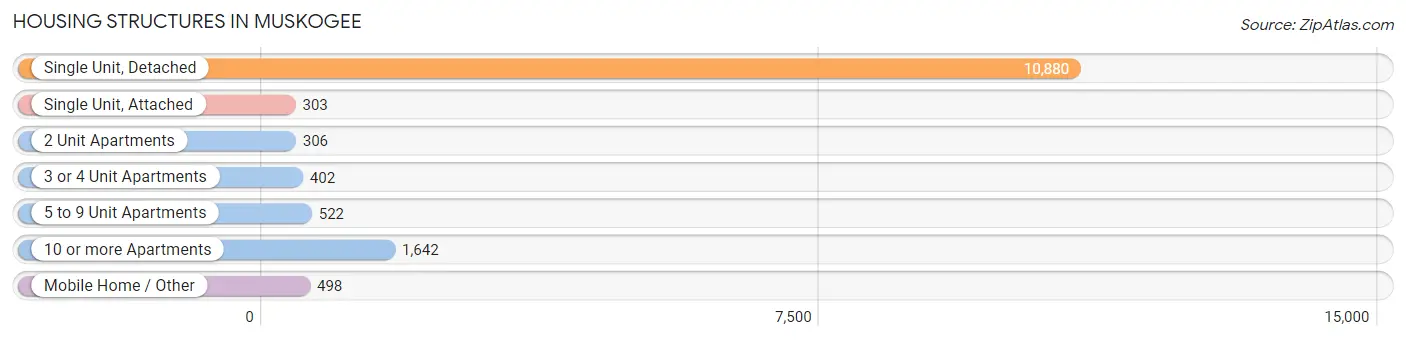
| Structure Type | # Housing Units | % Housing Units |
| Single Unit, Detached | 10,880 | 74.8% |
| Single Unit, Attached | 303 | 2.1% |
| 2 Unit Apartments | 306 | 2.1% |
| 3 or 4 Unit Apartments | 402 | 2.8% |
| 5 to 9 Unit Apartments | 522 | 3.6% |
| 10 or more Apartments | 1,642 | 11.3% |
| Mobile Home / Other | 498 | 3.4% |
| Total | 14,553 | 100.0% |
Housing Structures by Occupancy in Muskogee
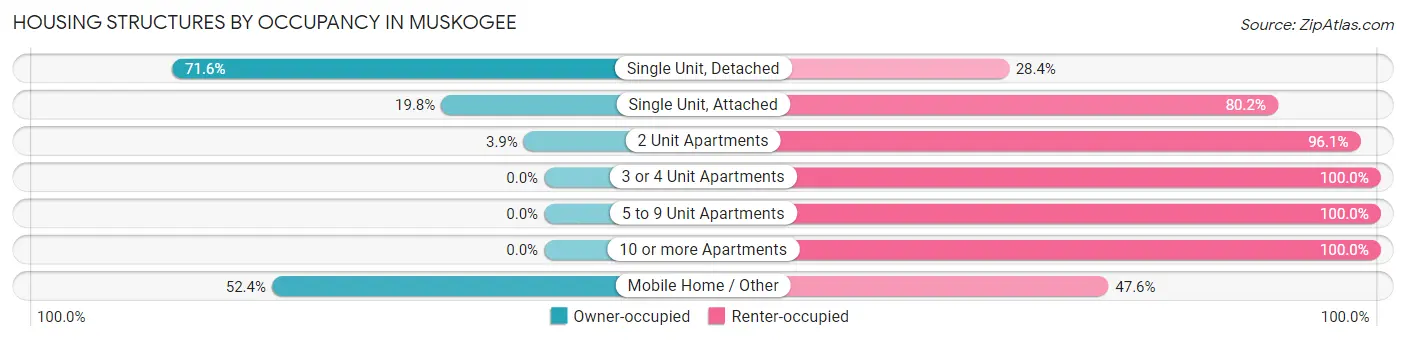
| Structure Type | Owner-occupied | Renter-occupied |
| Single Unit, Detached | 7,790 (71.6%) | 3,090 (28.4%) |
| Single Unit, Attached | 60 (19.8%) | 243 (80.2%) |
| 2 Unit Apartments | 12 (3.9%) | 294 (96.1%) |
| 3 or 4 Unit Apartments | 0 (0.0%) | 402 (100.0%) |
| 5 to 9 Unit Apartments | 0 (0.0%) | 522 (100.0%) |
| 10 or more Apartments | 0 (0.0%) | 1,642 (100.0%) |
| Mobile Home / Other | 261 (52.4%) | 237 (47.6%) |
| Total | 8,123 (55.8%) | 6,430 (44.2%) |
Housing Structures by Number of Rooms in Muskogee
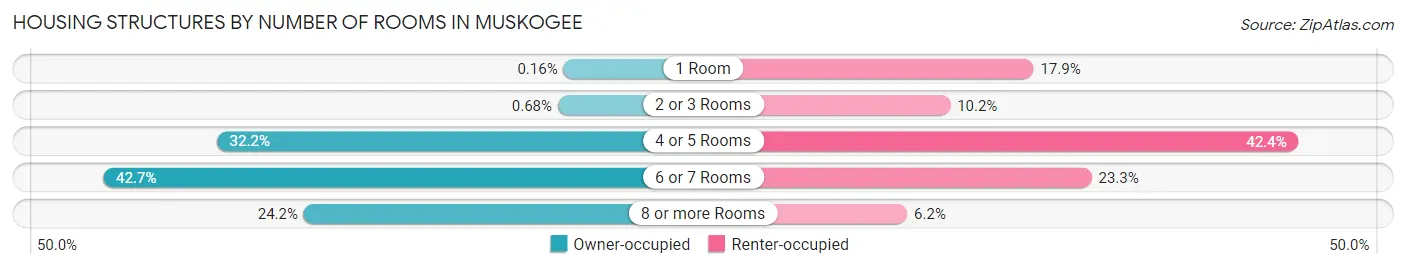
| Number of Rooms | Owner-occupied | Renter-occupied |
| 1 Room | 13 (0.2%) | 1,151 (17.9%) |
| 2 or 3 Rooms | 55 (0.7%) | 656 (10.2%) |
| 4 or 5 Rooms | 2,619 (32.2%) | 2,727 (42.4%) |
| 6 or 7 Rooms | 3,472 (42.7%) | 1,496 (23.3%) |
| 8 or more Rooms | 1,964 (24.2%) | 400 (6.2%) |
| Total | 8,123 (100.0%) | 6,430 (100.0%) |
Housing Structure by Heating Type in Muskogee
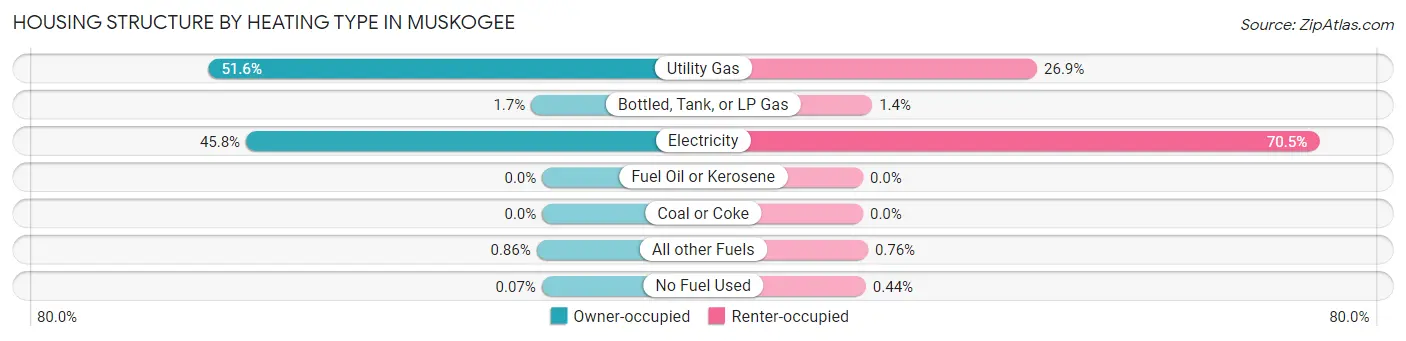
| Heating Type | Owner-occupied | Renter-occupied |
| Utility Gas | 4,189 (51.6%) | 1,730 (26.9%) |
| Bottled, Tank, or LP Gas | 139 (1.7%) | 91 (1.4%) |
| Electricity | 3,719 (45.8%) | 4,532 (70.5%) |
| Fuel Oil or Kerosene | 0 (0.0%) | 0 (0.0%) |
| Coal or Coke | 0 (0.0%) | 0 (0.0%) |
| All other Fuels | 70 (0.9%) | 49 (0.8%) |
| No Fuel Used | 6 (0.1%) | 28 (0.4%) |
| Total | 8,123 (100.0%) | 6,430 (100.0%) |
Household Vehicle Usage in Muskogee
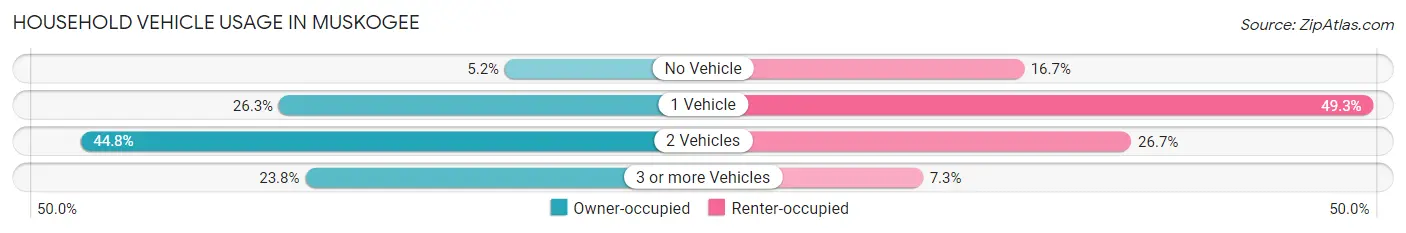
| Vehicles per Household | Owner-occupied | Renter-occupied |
| No Vehicle | 419 (5.2%) | 1,073 (16.7%) |
| 1 Vehicle | 2,133 (26.3%) | 3,172 (49.3%) |
| 2 Vehicles | 3,638 (44.8%) | 1,718 (26.7%) |
| 3 or more Vehicles | 1,933 (23.8%) | 467 (7.3%) |
| Total | 8,123 (100.0%) | 6,430 (100.0%) |
Real Estate & Mortgages in Muskogee
Real Estate and Mortgage Overview in Muskogee
| Characteristic | Without Mortgage | With Mortgage |
| Housing Units | 3,985 | 4,138 |
| Median Property Value | $98,900 | $131,900 |
| Median Household Income | $47,173 | $510 |
| Monthly Housing Costs | $426 | $52 |
| Real Estate Taxes | $685 | $418 |
Property Value by Mortgage Status in Muskogee
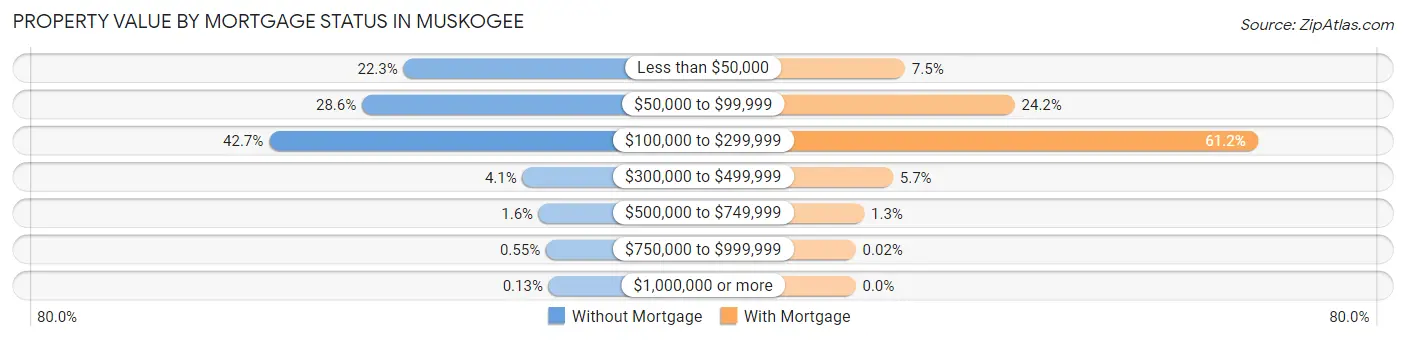
| Property Value | Without Mortgage | With Mortgage |
| Less than $50,000 | 887 (22.3%) | 311 (7.5%) |
| $50,000 to $99,999 | 1,139 (28.6%) | 1,003 (24.2%) |
| $100,000 to $299,999 | 1,703 (42.7%) | 2,534 (61.2%) |
| $300,000 to $499,999 | 164 (4.1%) | 235 (5.7%) |
| $500,000 to $749,999 | 65 (1.6%) | 54 (1.3%) |
| $750,000 to $999,999 | 22 (0.5%) | 1 (0.0%) |
| $1,000,000 or more | 5 (0.1%) | 0 (0.0%) |
| Total | 3,985 (100.0%) | 4,138 (100.0%) |
Household Income by Mortgage Status in Muskogee
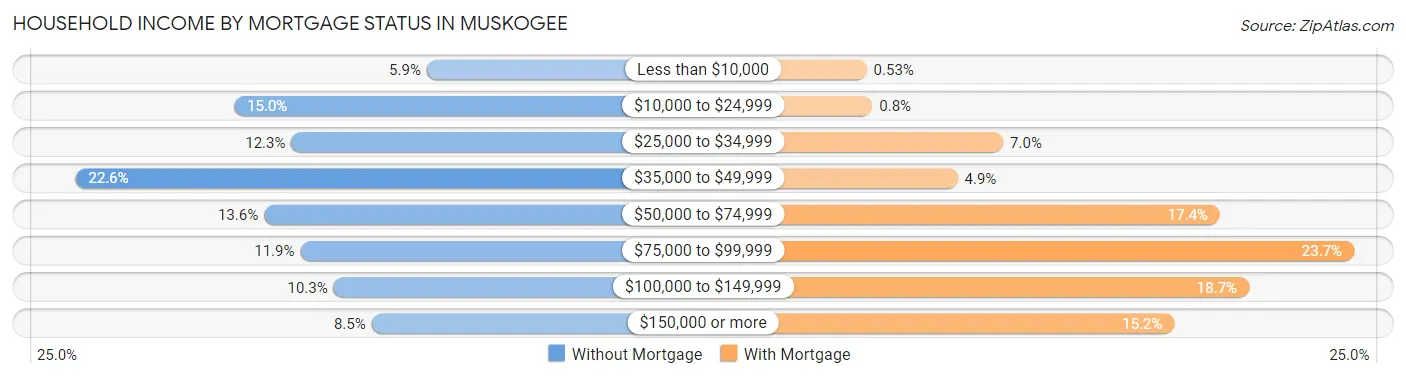
| Household Income | Without Mortgage | With Mortgage |
| Less than $10,000 | 233 (5.9%) | 22 (0.5%) |
| $10,000 to $24,999 | 599 (15.0%) | 33 (0.8%) |
| $25,000 to $34,999 | 490 (12.3%) | 291 (7.0%) |
| $35,000 to $49,999 | 900 (22.6%) | 201 (4.9%) |
| $50,000 to $74,999 | 542 (13.6%) | 718 (17.3%) |
| $75,000 to $99,999 | 473 (11.9%) | 982 (23.7%) |
| $100,000 to $149,999 | 410 (10.3%) | 775 (18.7%) |
| $150,000 or more | 338 (8.5%) | 628 (15.2%) |
| Total | 3,985 (100.0%) | 4,138 (100.0%) |
Property Value to Household Income Ratio in Muskogee
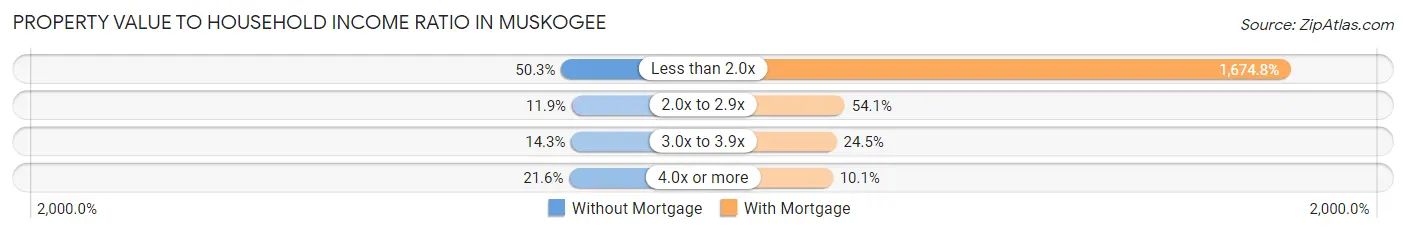
| Value-to-Income Ratio | Without Mortgage | With Mortgage |
| Less than 2.0x | 2,006 (50.3%) | 69,303 (1,674.8%) |
| 2.0x to 2.9x | 475 (11.9%) | 2,239 (54.1%) |
| 3.0x to 3.9x | 568 (14.2%) | 1,014 (24.5%) |
| 4.0x or more | 860 (21.6%) | 418 (10.1%) |
| Total | 3,985 (100.0%) | 4,138 (100.0%) |
Real Estate Taxes by Mortgage Status in Muskogee
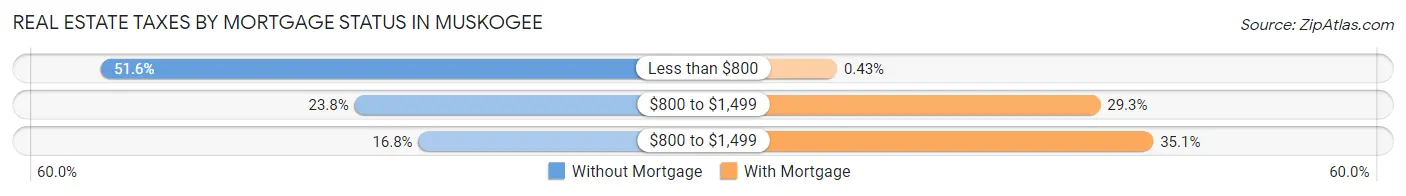
| Property Taxes | Without Mortgage | With Mortgage |
| Less than $800 | 2,057 (51.6%) | 18 (0.4%) |
| $800 to $1,499 | 950 (23.8%) | 1,212 (29.3%) |
| $800 to $1,499 | 671 (16.8%) | 1,452 (35.1%) |
| Total | 3,985 (100.0%) | 4,138 (100.0%) |
Health & Disability in Muskogee
Health Insurance Coverage by Age in Muskogee
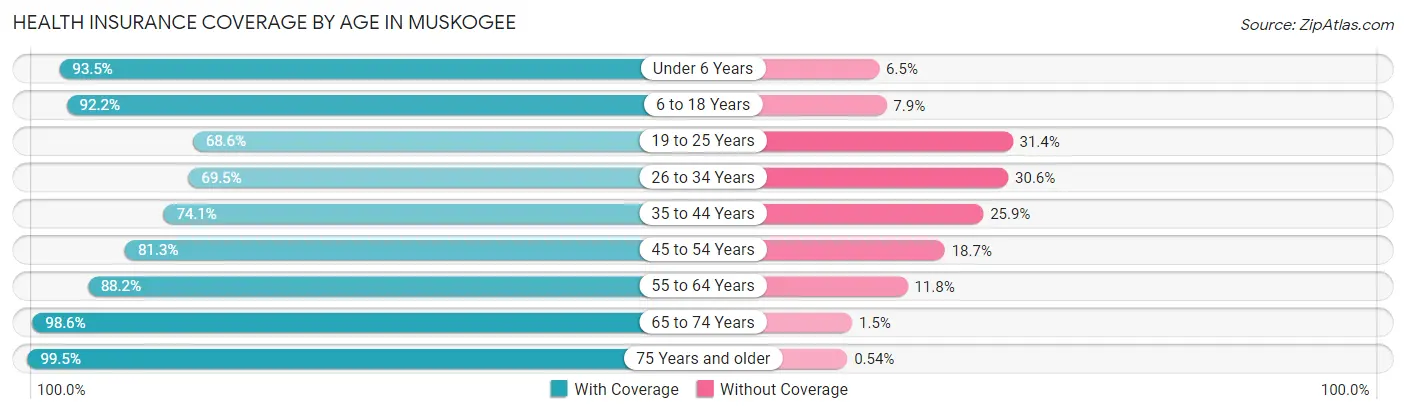
| Age Bracket | With Coverage | Without Coverage |
| Under 6 Years | 2,848 (93.5%) | 198 (6.5%) |
| 6 to 18 Years | 6,526 (92.1%) | 556 (7.9%) |
| 19 to 25 Years | 2,260 (68.6%) | 1,033 (31.4%) |
| 26 to 34 Years | 3,165 (69.5%) | 1,392 (30.5%) |
| 35 to 44 Years | 3,205 (74.1%) | 1,120 (25.9%) |
| 45 to 54 Years | 3,145 (81.3%) | 725 (18.7%) |
| 55 to 64 Years | 4,059 (88.2%) | 542 (11.8%) |
| 65 to 74 Years | 3,049 (98.6%) | 45 (1.5%) |
| 75 Years and older | 2,212 (99.5%) | 12 (0.5%) |
| Total | 30,469 (84.4%) | 5,623 (15.6%) |
Health Insurance Coverage by Citizenship Status in Muskogee
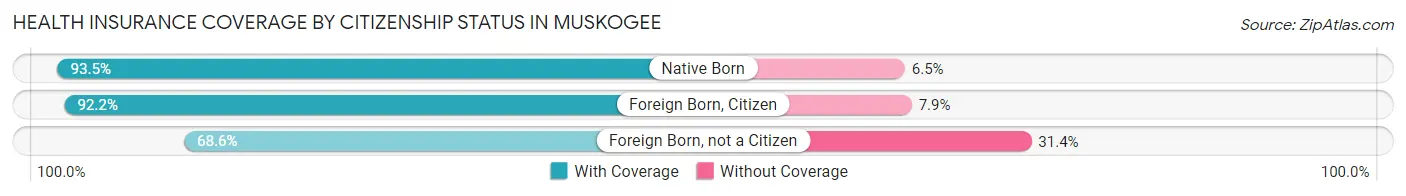
| Citizenship Status | With Coverage | Without Coverage |
| Native Born | 2,848 (93.5%) | 198 (6.5%) |
| Foreign Born, Citizen | 6,526 (92.1%) | 556 (7.9%) |
| Foreign Born, not a Citizen | 2,260 (68.6%) | 1,033 (31.4%) |
Health Insurance Coverage by Household Income in Muskogee
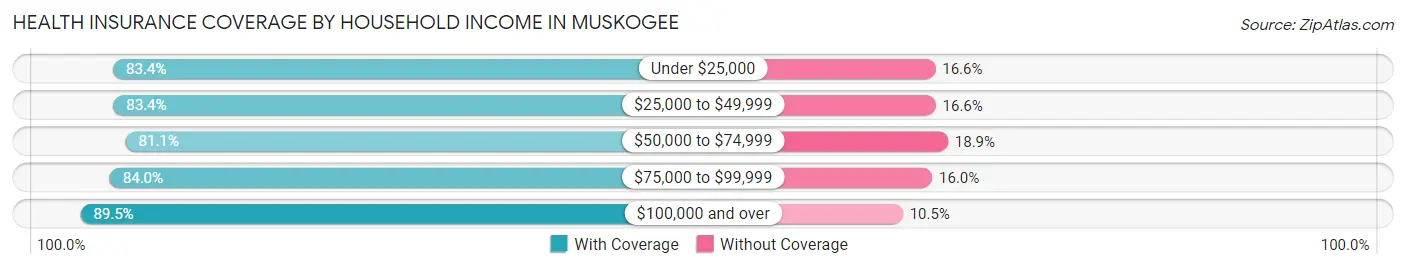
| Household Income | With Coverage | Without Coverage |
| Under $25,000 | 5,776 (83.4%) | 1,148 (16.6%) |
| $25,000 to $49,999 | 8,098 (83.4%) | 1,617 (16.6%) |
| $50,000 to $74,999 | 5,239 (81.1%) | 1,223 (18.9%) |
| $75,000 to $99,999 | 3,958 (84.0%) | 753 (16.0%) |
| $100,000 and over | 6,814 (89.5%) | 797 (10.5%) |
Public vs Private Health Insurance Coverage by Age in Muskogee
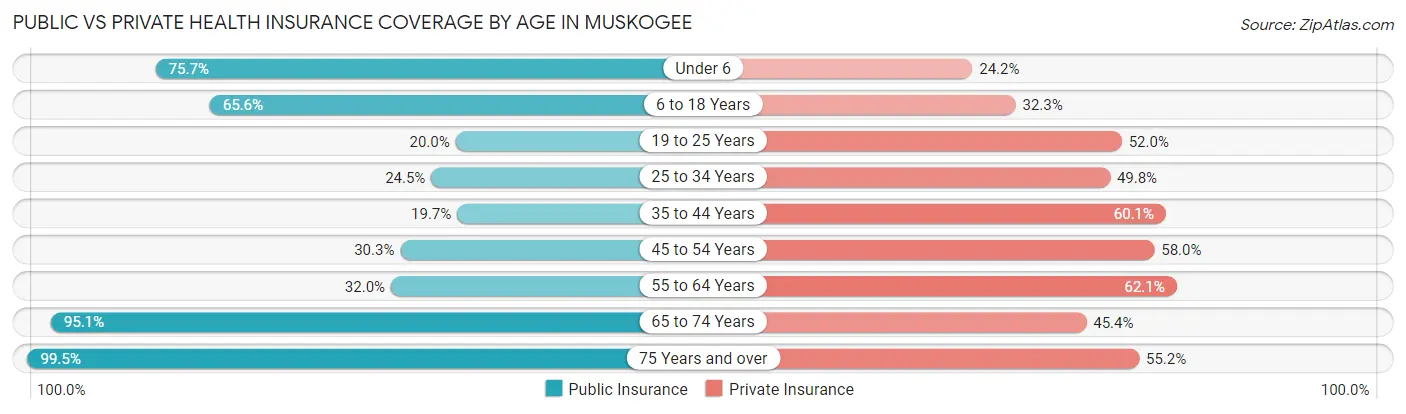
| Age Bracket | Public Insurance | Private Insurance |
| Under 6 | 2,305 (75.7%) | 738 (24.2%) |
| 6 to 18 Years | 4,647 (65.6%) | 2,284 (32.3%) |
| 19 to 25 Years | 659 (20.0%) | 1,711 (52.0%) |
| 25 to 34 Years | 1,118 (24.5%) | 2,268 (49.8%) |
| 35 to 44 Years | 853 (19.7%) | 2,601 (60.1%) |
| 45 to 54 Years | 1,172 (30.3%) | 2,245 (58.0%) |
| 55 to 64 Years | 1,473 (32.0%) | 2,858 (62.1%) |
| 65 to 74 Years | 2,943 (95.1%) | 1,404 (45.4%) |
| 75 Years and over | 2,212 (99.5%) | 1,227 (55.2%) |
| Total | 17,382 (48.2%) | 17,336 (48.0%) |
Disability Status by Sex by Age in Muskogee
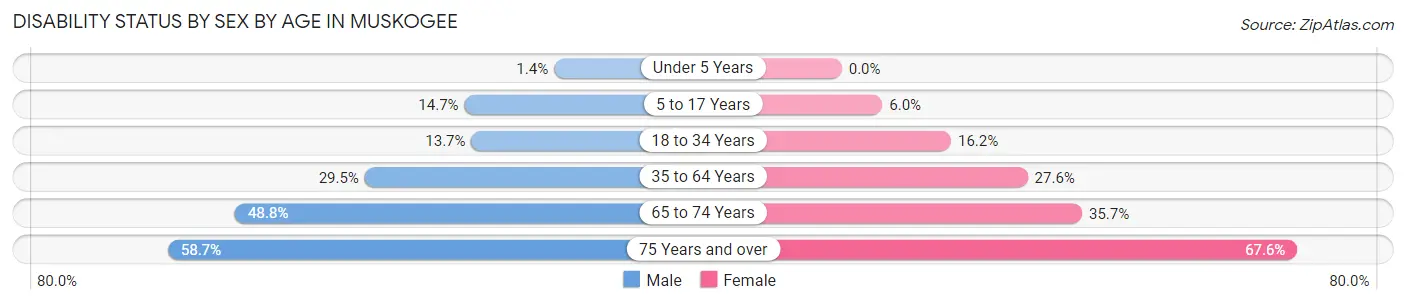
| Age Bracket | Male | Female |
| Under 5 Years | 17 (1.4%) | 0 (0.0%) |
| 5 to 17 Years | 528 (14.7%) | 210 (6.0%) |
| 18 to 34 Years | 595 (13.7%) | 652 (16.2%) |
| 35 to 64 Years | 1,906 (29.5%) | 1,748 (27.6%) |
| 65 to 74 Years | 623 (48.7%) | 648 (35.7%) |
| 75 Years and over | 468 (58.7%) | 965 (67.6%) |
Disability Class by Sex by Age in Muskogee
Disability Class: Hearing Difficulty
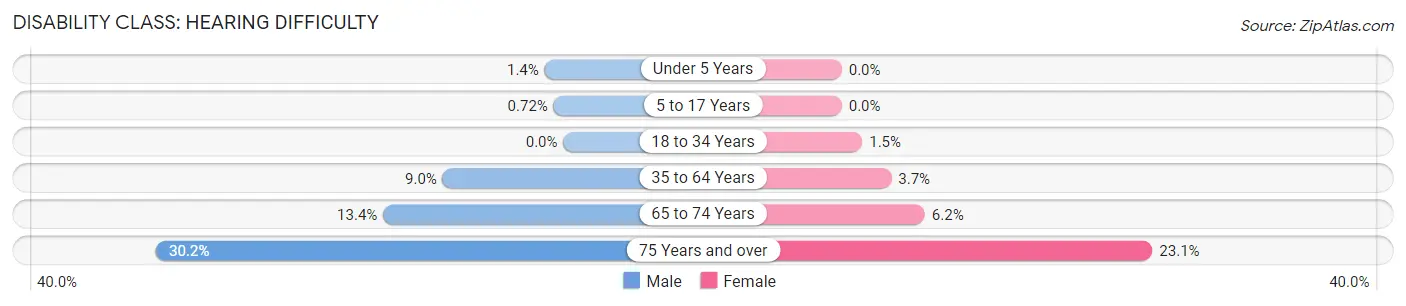
| Age Bracket | Male | Female |
| Under 5 Years | 17 (1.4%) | 0 (0.0%) |
| 5 to 17 Years | 26 (0.7%) | 0 (0.0%) |
| 18 to 34 Years | 0 (0.0%) | 61 (1.5%) |
| 35 to 64 Years | 579 (9.0%) | 233 (3.7%) |
| 65 to 74 Years | 171 (13.4%) | 112 (6.2%) |
| 75 Years and over | 241 (30.2%) | 329 (23.1%) |
Disability Class: Vision Difficulty
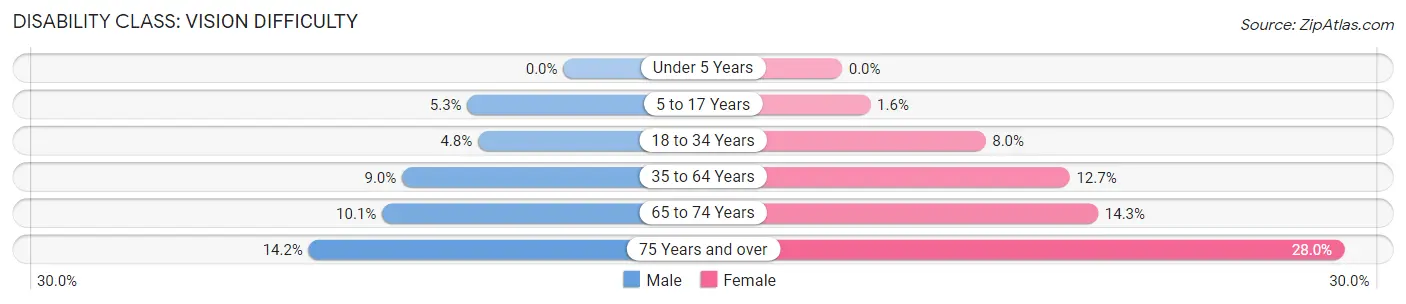
| Age Bracket | Male | Female |
| Under 5 Years | 0 (0.0%) | 0 (0.0%) |
| 5 to 17 Years | 192 (5.3%) | 55 (1.6%) |
| 18 to 34 Years | 207 (4.8%) | 321 (8.0%) |
| 35 to 64 Years | 580 (9.0%) | 803 (12.7%) |
| 65 to 74 Years | 129 (10.1%) | 259 (14.3%) |
| 75 Years and over | 113 (14.2%) | 399 (28.0%) |
Disability Class: Cognitive Difficulty
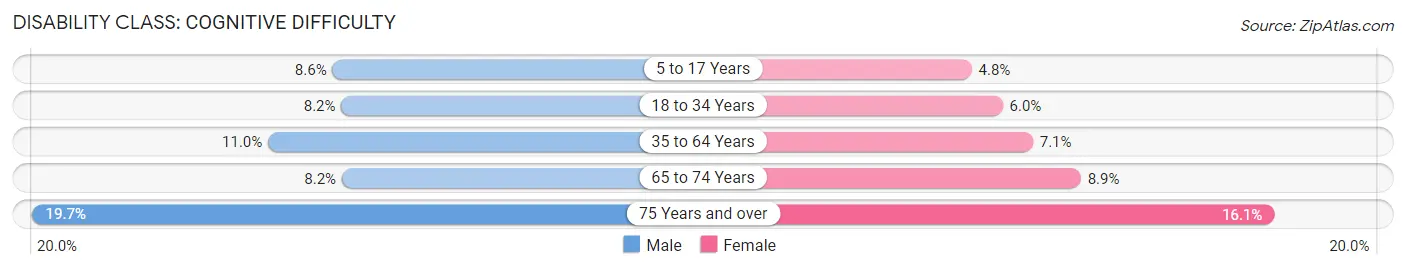
| Age Bracket | Male | Female |
| 5 to 17 Years | 308 (8.6%) | 168 (4.8%) |
| 18 to 34 Years | 359 (8.2%) | 240 (6.0%) |
| 35 to 64 Years | 708 (11.0%) | 449 (7.1%) |
| 65 to 74 Years | 105 (8.2%) | 161 (8.9%) |
| 75 Years and over | 157 (19.7%) | 229 (16.1%) |
Disability Class: Ambulatory Difficulty
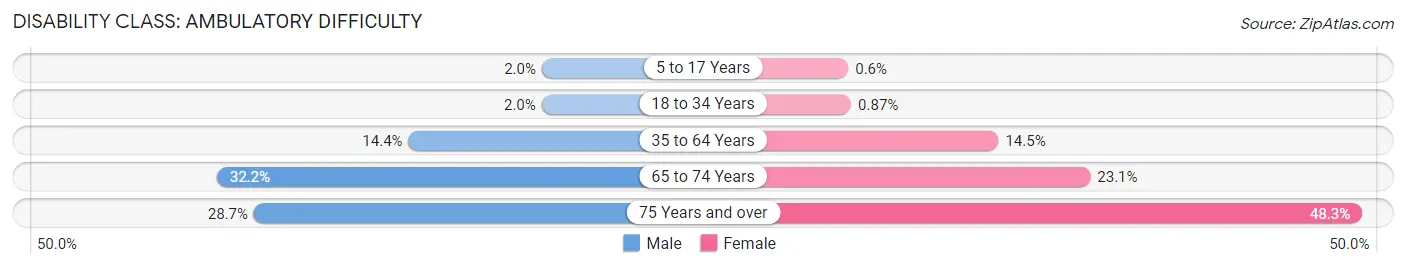
| Age Bracket | Male | Female |
| 5 to 17 Years | 72 (2.0%) | 21 (0.6%) |
| 18 to 34 Years | 88 (2.0%) | 35 (0.9%) |
| 35 to 64 Years | 929 (14.4%) | 921 (14.5%) |
| 65 to 74 Years | 411 (32.2%) | 419 (23.1%) |
| 75 Years and over | 229 (28.7%) | 689 (48.3%) |
Disability Class: Self-Care Difficulty
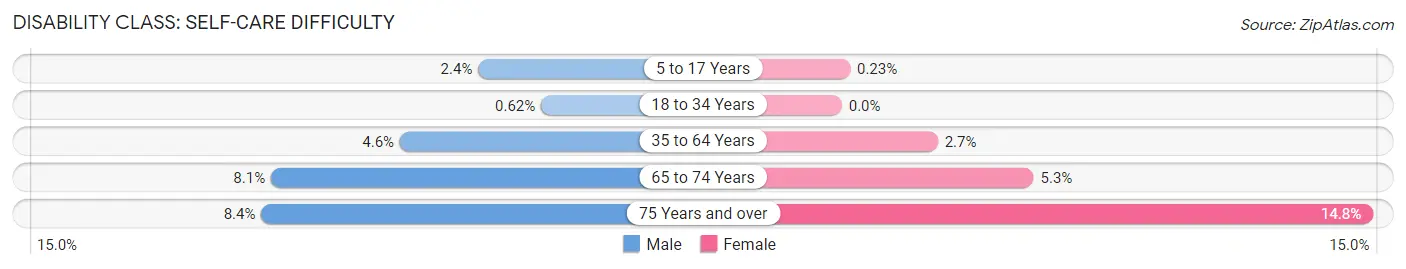
| Age Bracket | Male | Female |
| 5 to 17 Years | 85 (2.4%) | 8 (0.2%) |
| 18 to 34 Years | 27 (0.6%) | 0 (0.0%) |
| 35 to 64 Years | 294 (4.5%) | 169 (2.7%) |
| 65 to 74 Years | 104 (8.1%) | 97 (5.3%) |
| 75 Years and over | 67 (8.4%) | 211 (14.8%) |
Technology Access in Muskogee
Computing Device Access in Muskogee
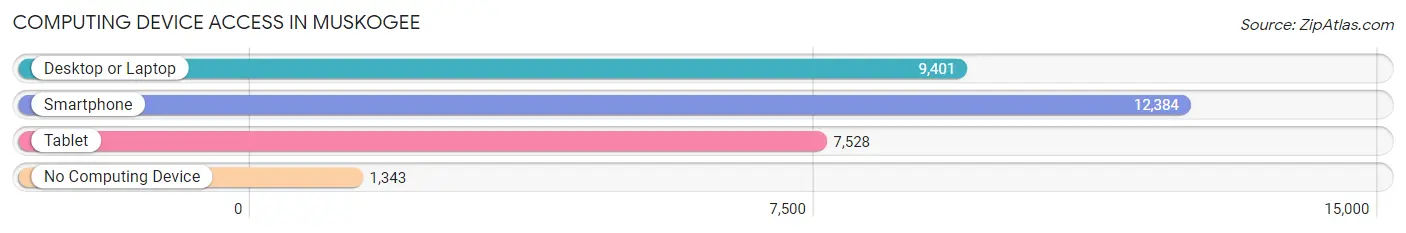
| Device Type | # Households | % Households |
| Desktop or Laptop | 9,401 | 64.6% |
| Smartphone | 12,384 | 85.1% |
| Tablet | 7,528 | 51.7% |
| No Computing Device | 1,343 | 9.2% |
| Total | 14,553 | 100.0% |
Internet Access in Muskogee
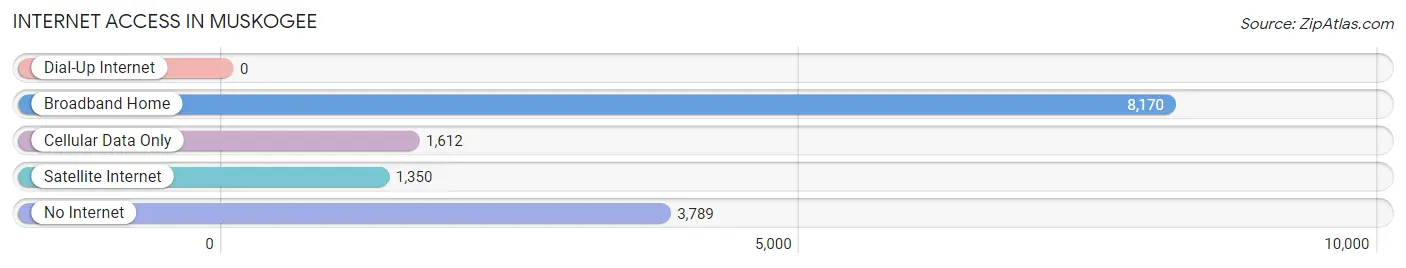
| Internet Type | # Households | % Households |
| Dial-Up Internet | 0 | 0.0% |
| Broadband Home | 8,170 | 56.1% |
| Cellular Data Only | 1,612 | 11.1% |
| Satellite Internet | 1,350 | 9.3% |
| No Internet | 3,789 | 26.0% |
| Total | 14,553 | 100.0% |
Muskogee Summary
Muskogee, Oklahoma is a city located in the southeastern part of the state, in Muskogee County. It is situated on the Arkansas River, near the foothills of the Ozark Mountains. The city is the county seat of Muskogee County and is the principal city of the Muskogee, Oklahoma Metropolitan Statistical Area. As of the 2010 census, the city had a population of 39,223.
History
The area that is now Muskogee was originally inhabited by the Creek and Seminole Native American tribes. The first European settlers arrived in the area in the early 1800s, and the city was officially founded in 1872. The city was named after the Muscogee Creek Nation, which had been relocated to the area in the 1830s.
In the late 1800s, Muskogee became an important trading center for the region, and the city was incorporated in 1898. During the early 1900s, Muskogee experienced a period of rapid growth and development, and the city was a major hub for the oil and gas industry.
Geography
Muskogee is located in the southeastern part of Oklahoma, in Muskogee County. It is situated on the Arkansas River, near the foothills of the Ozark Mountains. The city has a total area of 24.2 square miles, of which 23.9 square miles is land and 0.3 square miles is water.
Economy
Muskogee’s economy is largely based on the oil and gas industry, as well as manufacturing and agriculture. The city is home to several major employers, including the Muskogee Regional Medical Center, Muskogee Public Schools, and the Muskogee County government.
Demographics
As of the 2010 census, the city had a population of 39,223. The racial makeup of the city was 68.2% White, 17.3% African American, 8.2% Native American, 1.2% Asian, 0.2% Pacific Islander, and 3.9% from other races. Hispanic or Latino of any race were 5.3% of the population.
The median income for a household in the city was $32,945, and the median income for a family was $41,945. The per capita income for the city was $17,845. About 17.2% of families and 21.3% of the population were below the poverty line, including 30.2% of those under age 18 and 11.2% of those age 65 or over.
Common Questions
What is Per Capita Income in Muskogee?
Per Capita income in Muskogee is $25,227.
What is the Median Family Income in Muskogee?
Median Family Income in Muskogee is $53,842.
What is the Median Household income in Muskogee?
Median Household Income in Muskogee is $46,825.
What is Income or Wage Gap in Muskogee?
Income or Wage Gap in Muskogee is 24.7%.
Women in Muskogee earn 75.3 cents for every dollar earned by a man.
What is Family Income Deficit in Muskogee?
Family Income Deficit in Muskogee is $11,647.
Families that are below poverty line in Muskogee earn $11,647 less on average than the poverty threshold level.
What is Inequality or Gini Index in Muskogee?
Inequality or Gini Index in Muskogee is 0.45.
What is the Total Population of Muskogee?
Total Population of Muskogee is 36,933.
What is the Total Male Population of Muskogee?
Total Male Population of Muskogee is 18,127.
What is the Total Female Population of Muskogee?
Total Female Population of Muskogee is 18,806.
What is the Ratio of Males per 100 Females in Muskogee?
There are 96.39 Males per 100 Females in Muskogee.
What is the Ratio of Females per 100 Males in Muskogee?
There are 103.75 Females per 100 Males in Muskogee.
What is the Median Population Age in Muskogee?
Median Population Age in Muskogee is 36.0 Years.
What is the Average Family Size in Muskogee
Average Family Size in Muskogee is 3.1 People.
What is the Average Household Size in Muskogee
Average Household Size in Muskogee is 2.4 People.
How Large is the Labor Force in Muskogee?
There are 16,056 People in the Labor Forcein in Muskogee.
What is the Percentage of People in the Labor Force in Muskogee?
56.6% of People are in the Labor Force in Muskogee.
What is the Unemployment Rate in Muskogee?
Unemployment Rate in Muskogee is 6.5%.