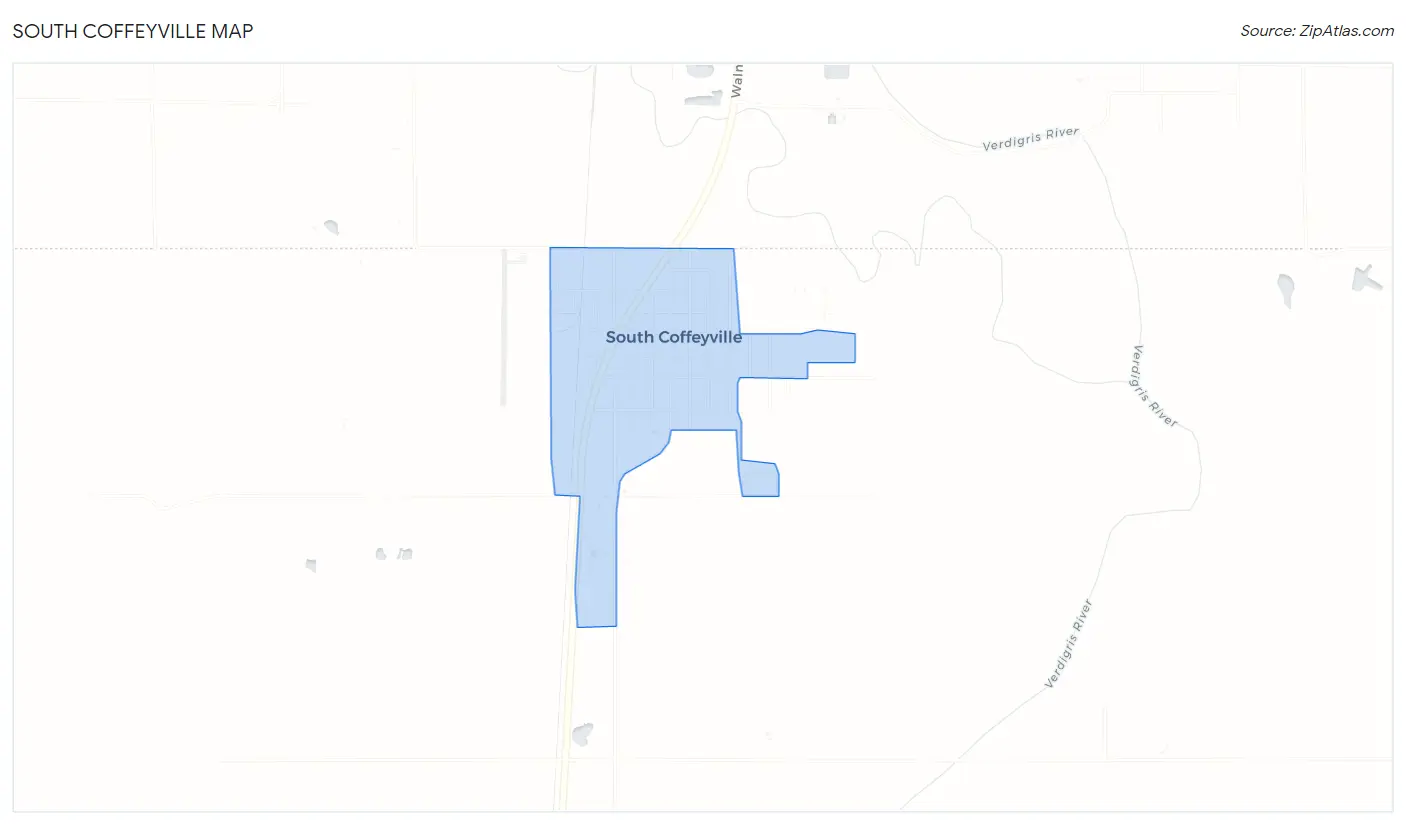
South Coffeyville, OK Map & Demographics
South Coffeyville Map
South Coffeyville Overview
$28,322
PER CAPITA INCOME
$80,278
AVG FAMILY INCOME
$53,750
AVG HOUSEHOLD INCOME
50.5%
WAGE / INCOME GAP [ % ]
49.5¢/ $1
WAGE / INCOME GAP [ $ ]
$14,257
FAMILY INCOME DEFICIT
0.40
INEQUALITY / GINI INDEX
691
TOTAL POPULATION
352
MALE POPULATION
339
FEMALE POPULATION
103.83
MALES / 100 FEMALES
96.31
FEMALES / 100 MALES
37.8
MEDIAN AGE
3.2
AVG FAMILY SIZE
2.5
AVG HOUSEHOLD SIZE
328
LABOR FORCE [ PEOPLE ]
63.4%
PERCENT IN LABOR FORCE
3.7%
UNEMPLOYMENT RATE
Income in South Coffeyville
Income Overview in South Coffeyville
Per Capita Income in South Coffeyville is $28,322, while median incomes of families and households are $80,278 and $53,750 respectively.
| Characteristic | Number | Measure |
| Per Capita Income | 691 | $28,322 |
| Median Family Income | 178 | $80,278 |
| Mean Family Income | 178 | $84,463 |
| Median Household Income | 279 | $53,750 |
| Mean Household Income | 279 | $69,385 |
| Income Deficit | 178 | $14,257 |
| Wage / Income Gap (%) | 691 | 50.49% |
| Wage / Income Gap ($) | 691 | 49.51¢ per $1 |
| Gini / Inequality Index | 691 | 0.40 |
Earnings by Sex in South Coffeyville
Average Earnings in South Coffeyville are $40,313, $57,955 for men and $28,693 for women, a difference of 50.5%.
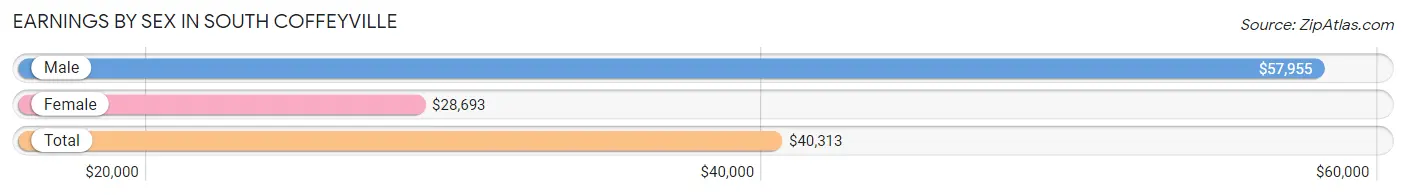
| Sex | Number | Average Earnings |
| Male | 188 (57.5%) | $57,955 |
| Female | 139 (42.5%) | $28,693 |
| Total | 327 (100.0%) | $40,313 |
Earnings by Sex by Income Bracket in South Coffeyville
The most common earnings brackets in South Coffeyville are $100,000+ for men (38 | 20.2%) and $25,000 to $29,999 for women (30 | 21.6%).
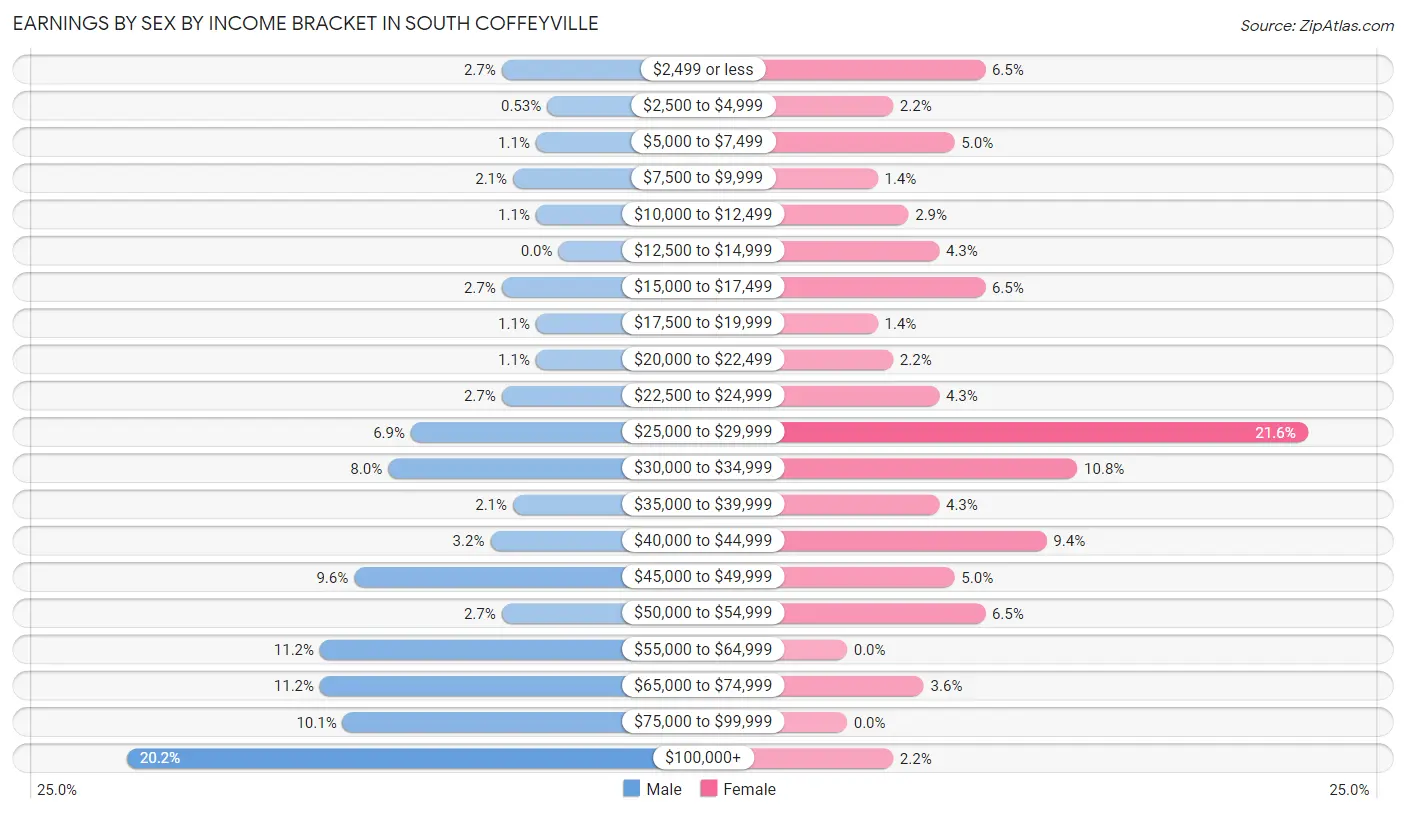
| Income | Male | Female |
| $2,499 or less | 5 (2.7%) | 9 (6.5%) |
| $2,500 to $4,999 | 1 (0.5%) | 3 (2.2%) |
| $5,000 to $7,499 | 2 (1.1%) | 7 (5.0%) |
| $7,500 to $9,999 | 4 (2.1%) | 2 (1.4%) |
| $10,000 to $12,499 | 2 (1.1%) | 4 (2.9%) |
| $12,500 to $14,999 | 0 (0.0%) | 6 (4.3%) |
| $15,000 to $17,499 | 5 (2.7%) | 9 (6.5%) |
| $17,500 to $19,999 | 2 (1.1%) | 2 (1.4%) |
| $20,000 to $22,499 | 2 (1.1%) | 3 (2.2%) |
| $22,500 to $24,999 | 5 (2.7%) | 6 (4.3%) |
| $25,000 to $29,999 | 13 (6.9%) | 30 (21.6%) |
| $30,000 to $34,999 | 15 (8.0%) | 15 (10.8%) |
| $35,000 to $39,999 | 4 (2.1%) | 6 (4.3%) |
| $40,000 to $44,999 | 6 (3.2%) | 13 (9.3%) |
| $45,000 to $49,999 | 18 (9.6%) | 7 (5.0%) |
| $50,000 to $54,999 | 5 (2.7%) | 9 (6.5%) |
| $55,000 to $64,999 | 21 (11.2%) | 0 (0.0%) |
| $65,000 to $74,999 | 21 (11.2%) | 5 (3.6%) |
| $75,000 to $99,999 | 19 (10.1%) | 0 (0.0%) |
| $100,000+ | 38 (20.2%) | 3 (2.2%) |
| Total | 188 (100.0%) | 139 (100.0%) |
Earnings by Sex by Educational Attainment in South Coffeyville
Average earnings in South Coffeyville are $60,000 for men and $29,318 for women, a difference of 51.1%. Men with an educational attainment of college or associate's degree enjoy the highest average annual earnings of $64,167, while those with less than high school education earn the least with $45,313. Women with an educational attainment of bachelor's degree earn the most with the average annual earnings of $40,625, while those with high school diploma education have the smallest earnings of $27,500.
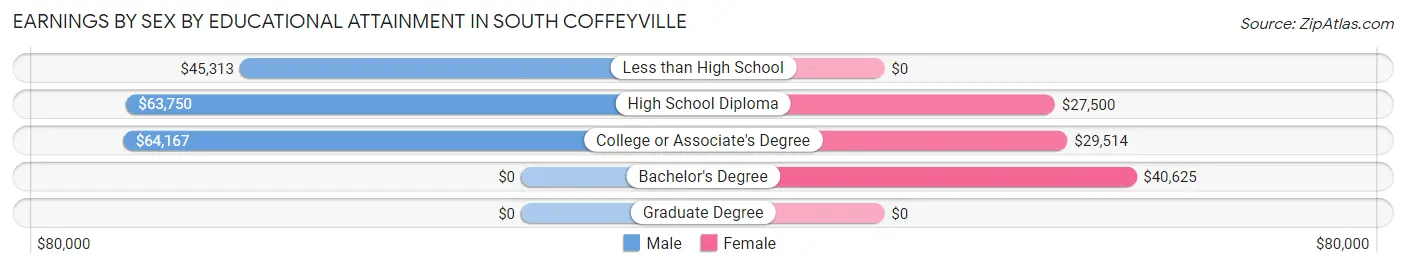
| Educational Attainment | Male Income | Female Income |
| Less than High School | $45,313 | $0 |
| High School Diploma | $63,750 | $27,500 |
| College or Associate's Degree | $64,167 | $29,514 |
| Bachelor's Degree | - | - |
| Graduate Degree | - | - |
| Total | $60,000 | $29,318 |
Family Income in South Coffeyville
Family Income Brackets in South Coffeyville
According to the South Coffeyville family income data, there are 37 families falling into the $75,000 to $99,999 income range, which is the most common income bracket and makes up 20.8% of all families. Conversely, the $10,000 to $14,999 income bracket is the least frequent group with only 2 families (1.1%) belonging to this category.
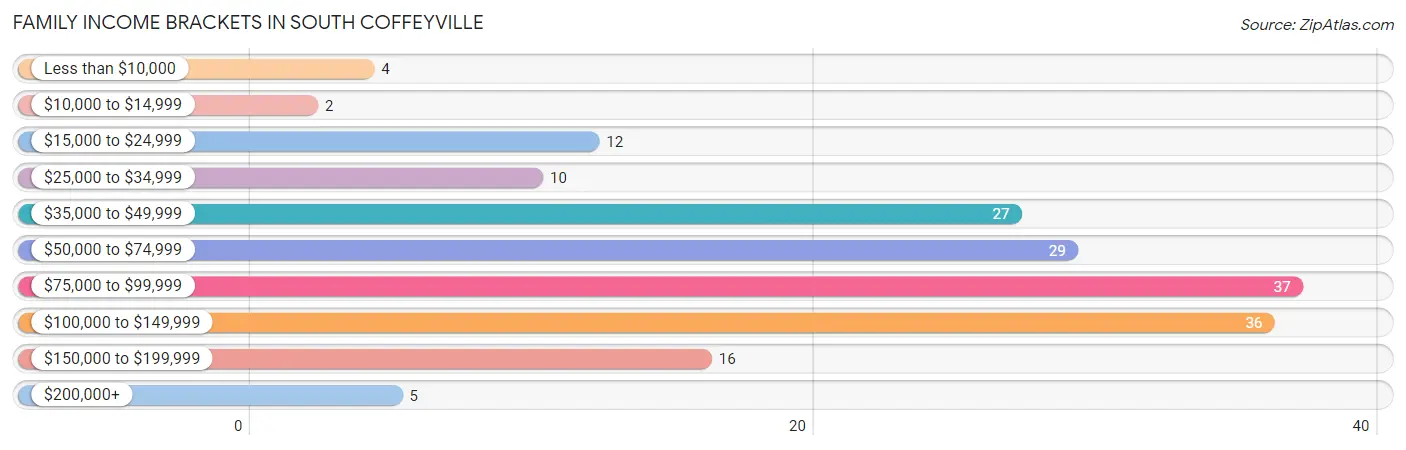
| Income Bracket | # Families | % Families |
| Less than $10,000 | 4 | 2.2% |
| $10,000 to $14,999 | 2 | 1.1% |
| $15,000 to $24,999 | 12 | 6.7% |
| $25,000 to $34,999 | 10 | 5.6% |
| $35,000 to $49,999 | 27 | 15.2% |
| $50,000 to $74,999 | 29 | 16.3% |
| $75,000 to $99,999 | 37 | 20.8% |
| $100,000 to $149,999 | 36 | 20.2% |
| $150,000 to $199,999 | 16 | 9.0% |
| $200,000+ | 5 | 2.8% |
Family Income by Famaliy Size in South Coffeyville
5-person families (22 | 12.4%) account for the highest median family income in South Coffeyville with $123,125 per family, while 2-person families (68 | 38.2%) have the highest median income of $36,875 per family member.

| Income Bracket | # Families | Median Income |
| 2-Person Families | 68 (38.2%) | $73,750 |
| 3-Person Families | 45 (25.3%) | $51,563 |
| 4-Person Families | 39 (21.9%) | $93,750 |
| 5-Person Families | 22 (12.4%) | $123,125 |
| 6-Person Families | 0 (0.0%) | $0 |
| 7+ Person Families | 4 (2.2%) | $0 |
| Total | 178 (100.0%) | $80,278 |
Family Income by Number of Earners in South Coffeyville
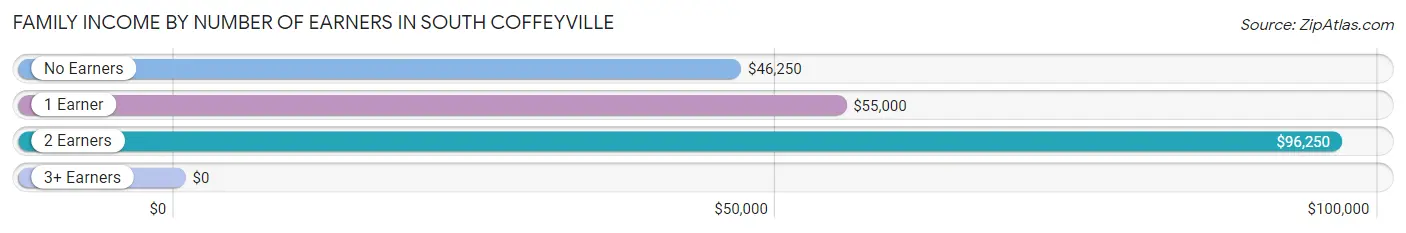
| Number of Earners | # Families | Median Income |
| No Earners | 35 (19.7%) | $46,250 |
| 1 Earner | 48 (27.0%) | $55,000 |
| 2 Earners | 85 (47.7%) | $96,250 |
| 3+ Earners | 10 (5.6%) | $0 |
| Total | 178 (100.0%) | $80,278 |
Household Income in South Coffeyville
Household Income Brackets in South Coffeyville
With 45 households falling in the category, the $35,000 to $49,999 income range is the most frequent in South Coffeyville, accounting for 16.1% of all households. In contrast, only 5 households (1.8%) fall into the $200,000+ income bracket, making it the least populous group.
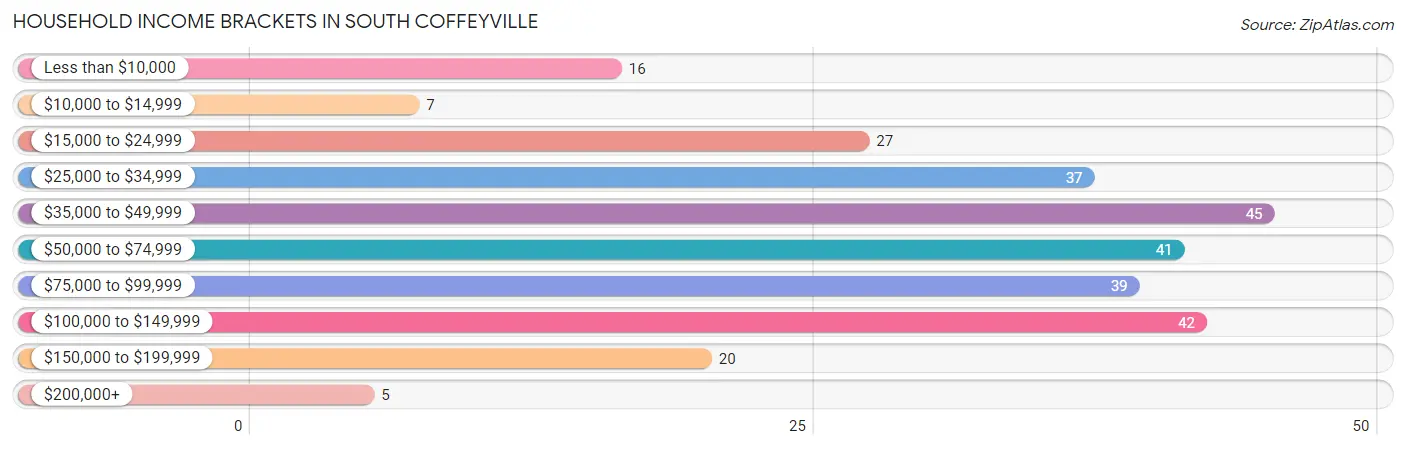
| Income Bracket | # Households | % Households |
| Less than $10,000 | 16 | 5.7% |
| $10,000 to $14,999 | 7 | 2.5% |
| $15,000 to $24,999 | 27 | 9.7% |
| $25,000 to $34,999 | 37 | 13.3% |
| $35,000 to $49,999 | 45 | 16.1% |
| $50,000 to $74,999 | 41 | 14.7% |
| $75,000 to $99,999 | 39 | 14.0% |
| $100,000 to $149,999 | 42 | 15.1% |
| $150,000 to $199,999 | 20 | 7.2% |
| $200,000+ | 5 | 1.8% |
Household Income by Householder Age in South Coffeyville
The median household income in South Coffeyville is $53,750, with the highest median household income of $71,250 found in the 25 to 44 years age bracket for the primary householder. A total of 106 households (38.0%) fall into this category. Meanwhile, the 15 to 24 years age bracket for the primary householder has the lowest median household income of $0, with 14 households (5.0%) in this group.
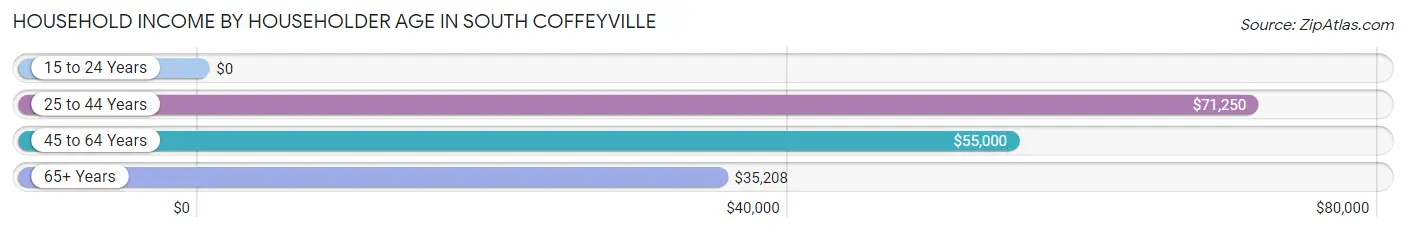
| Income Bracket | # Households | Median Income |
| 15 to 24 Years | 14 (5.0%) | $0 |
| 25 to 44 Years | 106 (38.0%) | $71,250 |
| 45 to 64 Years | 86 (30.8%) | $55,000 |
| 65+ Years | 73 (26.2%) | $35,208 |
| Total | 279 (100.0%) | $53,750 |
Poverty in South Coffeyville
Income Below Poverty by Sex and Age in South Coffeyville
With 8.0% poverty level for males and 16.5% for females among the residents of South Coffeyville, 12 to 14 year old males and 5 year old females are the most vulnerable to poverty, with 6 males (50.0%) and 5 females (62.5%) in their respective age groups living below the poverty level.
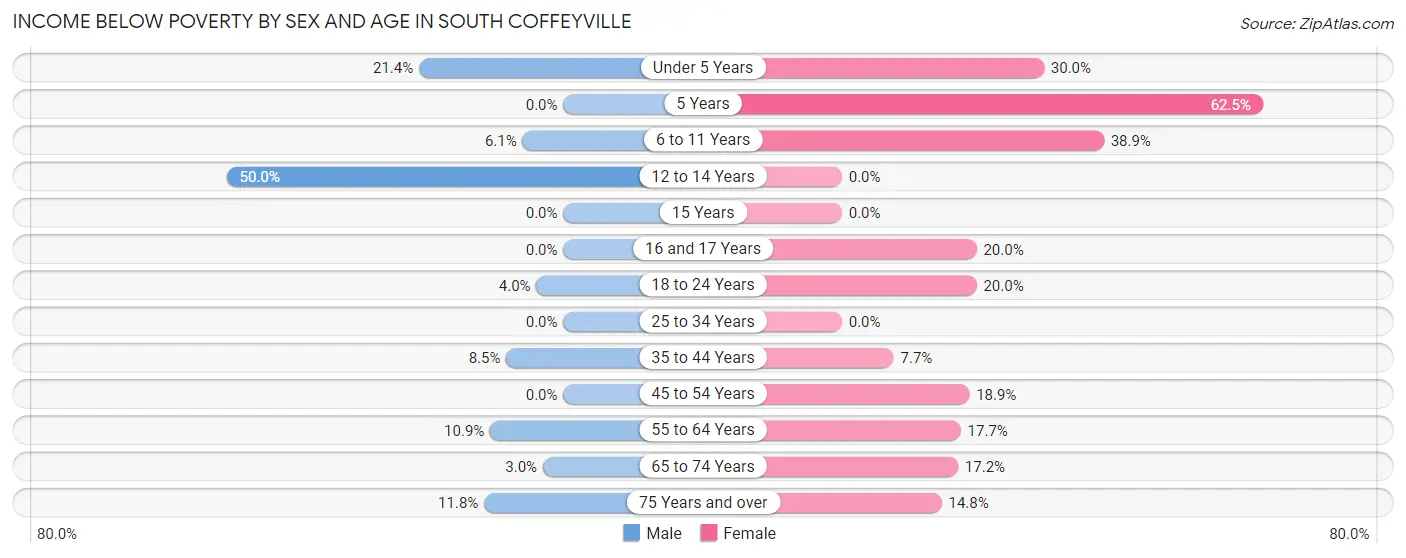
| Age Bracket | Male | Female |
| Under 5 Years | 6 (21.4%) | 6 (30.0%) |
| 5 Years | 0 (0.0%) | 5 (62.5%) |
| 6 to 11 Years | 2 (6.1%) | 14 (38.9%) |
| 12 to 14 Years | 6 (50.0%) | 0 (0.0%) |
| 15 Years | 0 (0.0%) | 0 (0.0%) |
| 16 and 17 Years | 0 (0.0%) | 3 (20.0%) |
| 18 to 24 Years | 1 (4.0%) | 2 (20.0%) |
| 25 to 34 Years | 0 (0.0%) | 0 (0.0%) |
| 35 to 44 Years | 5 (8.5%) | 4 (7.7%) |
| 45 to 54 Years | 0 (0.0%) | 7 (18.9%) |
| 55 to 64 Years | 5 (10.9%) | 6 (17.6%) |
| 65 to 74 Years | 1 (3.0%) | 5 (17.2%) |
| 75 Years and over | 2 (11.8%) | 4 (14.8%) |
| Total | 28 (8.0%) | 56 (16.5%) |
Income Above Poverty by Sex and Age in South Coffeyville
According to the poverty statistics in South Coffeyville, males aged 5 years and females aged 12 to 14 years are the age groups that are most secure financially, with 100.0% of males and 100.0% of females in these age groups living above the poverty line.
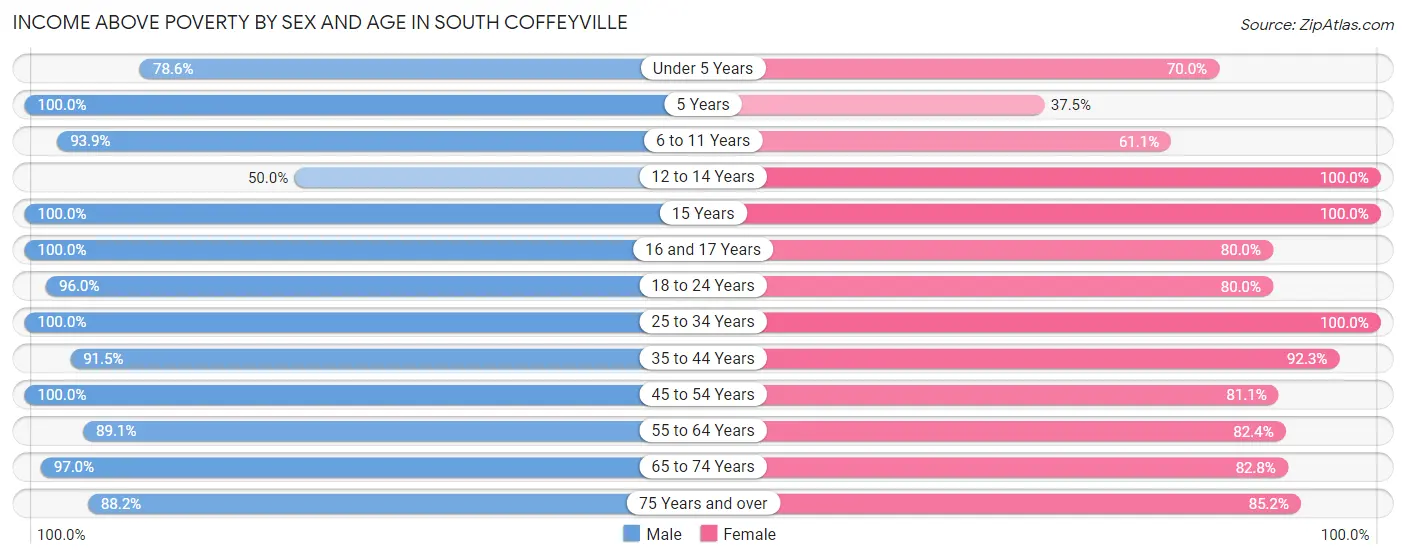
| Age Bracket | Male | Female |
| Under 5 Years | 22 (78.6%) | 14 (70.0%) |
| 5 Years | 3 (100.0%) | 3 (37.5%) |
| 6 to 11 Years | 31 (93.9%) | 22 (61.1%) |
| 12 to 14 Years | 6 (50.0%) | 14 (100.0%) |
| 15 Years | 16 (100.0%) | 4 (100.0%) |
| 16 and 17 Years | 9 (100.0%) | 12 (80.0%) |
| 18 to 24 Years | 24 (96.0%) | 8 (80.0%) |
| 25 to 34 Years | 29 (100.0%) | 53 (100.0%) |
| 35 to 44 Years | 54 (91.5%) | 48 (92.3%) |
| 45 to 54 Years | 42 (100.0%) | 30 (81.1%) |
| 55 to 64 Years | 41 (89.1%) | 28 (82.4%) |
| 65 to 74 Years | 32 (97.0%) | 24 (82.8%) |
| 75 Years and over | 15 (88.2%) | 23 (85.2%) |
| Total | 324 (92.0%) | 283 (83.5%) |
Income Below Poverty Among Married-Couple Families in South Coffeyville
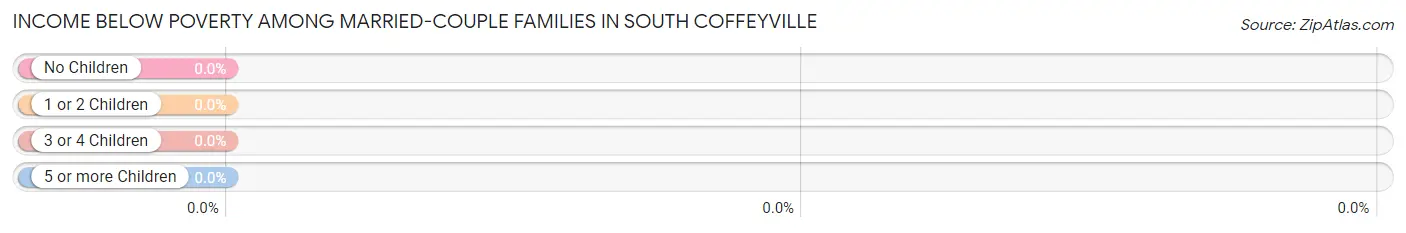
| Children | Above Poverty | Below Poverty |
| No Children | 70 (100.0%) | 0 (0.0%) |
| 1 or 2 Children | 59 (100.0%) | 0 (0.0%) |
| 3 or 4 Children | 15 (100.0%) | 0 (0.0%) |
| 5 or more Children | 2 (100.0%) | 0 (0.0%) |
| Total | 146 (100.0%) | 0 (0.0%) |
Income Below Poverty Among Single-Parent Households in South Coffeyville
According to the poverty data in South Coffeyville, 44.4% or 8 single-father households and 42.9% or 6 single-mother households are living below the poverty line. Among single-father households, those with no children have the highest poverty rate, with 1 households (100.0%) experiencing poverty. Likewise, among single-mother households, those with 3 or 4 children have the highest poverty rate, with 4 households (100.0%) falling below the poverty line.
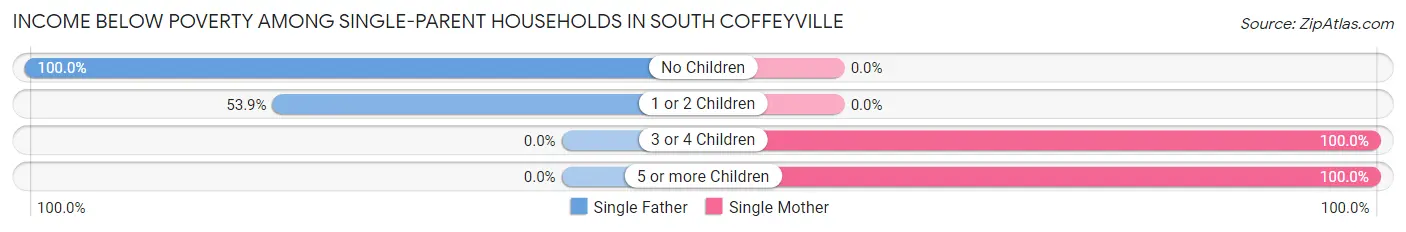
| Children | Single Father | Single Mother |
| No Children | 1 (100.0%) | 0 (0.0%) |
| 1 or 2 Children | 7 (53.8%) | 0 (0.0%) |
| 3 or 4 Children | 0 (0.0%) | 4 (100.0%) |
| 5 or more Children | 0 (0.0%) | 2 (100.0%) |
| Total | 8 (44.4%) | 6 (42.9%) |
Income Below Poverty Among Married-Couple vs Single-Parent Households in South Coffeyville
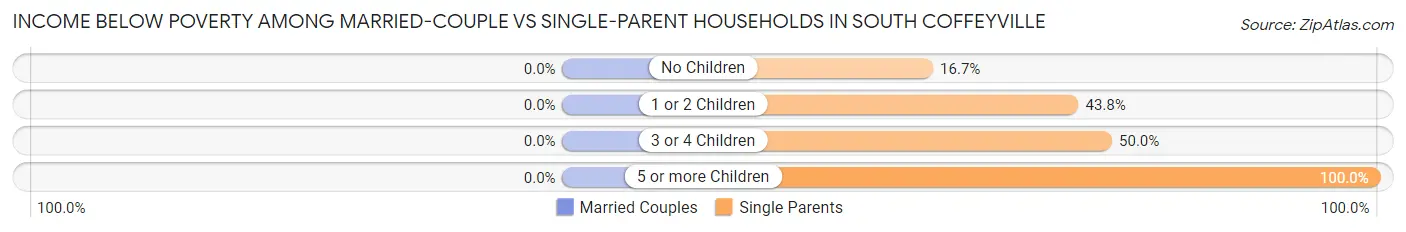
| Children | Married-Couple Families | Single-Parent Households |
| No Children | 0 (0.0%) | 1 (16.7%) |
| 1 or 2 Children | 0 (0.0%) | 7 (43.8%) |
| 3 or 4 Children | 0 (0.0%) | 4 (50.0%) |
| 5 or more Children | 0 (0.0%) | 2 (100.0%) |
| Total | 0 (0.0%) | 14 (43.8%) |
Race in South Coffeyville
The most populous races in South Coffeyville are White / Caucasian (423 | 61.2%), Native / Alaskan (121 | 17.5%), and Two or more Races (119 | 17.2%).
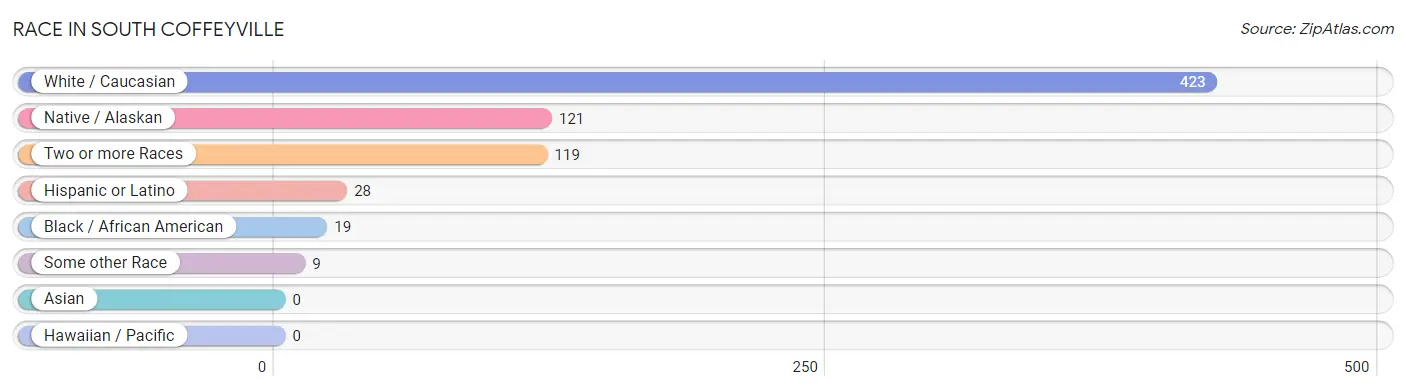
| Race | # Population | % Population |
| Asian | 0 | 0.0% |
| Black / African American | 19 | 2.8% |
| Hawaiian / Pacific | 0 | 0.0% |
| Hispanic or Latino | 28 | 4.1% |
| Native / Alaskan | 121 | 17.5% |
| White / Caucasian | 423 | 61.2% |
| Two or more Races | 119 | 17.2% |
| Some other Race | 9 | 1.3% |
| Total | 691 | 100.0% |
Ancestry in South Coffeyville
The most populous ancestries reported in South Coffeyville are Cherokee (182 | 26.3%), German (153 | 22.1%), Irish (72 | 10.4%), Scottish (39 | 5.6%), and English (35 | 5.1%), together accounting for 69.6% of all South Coffeyville residents.
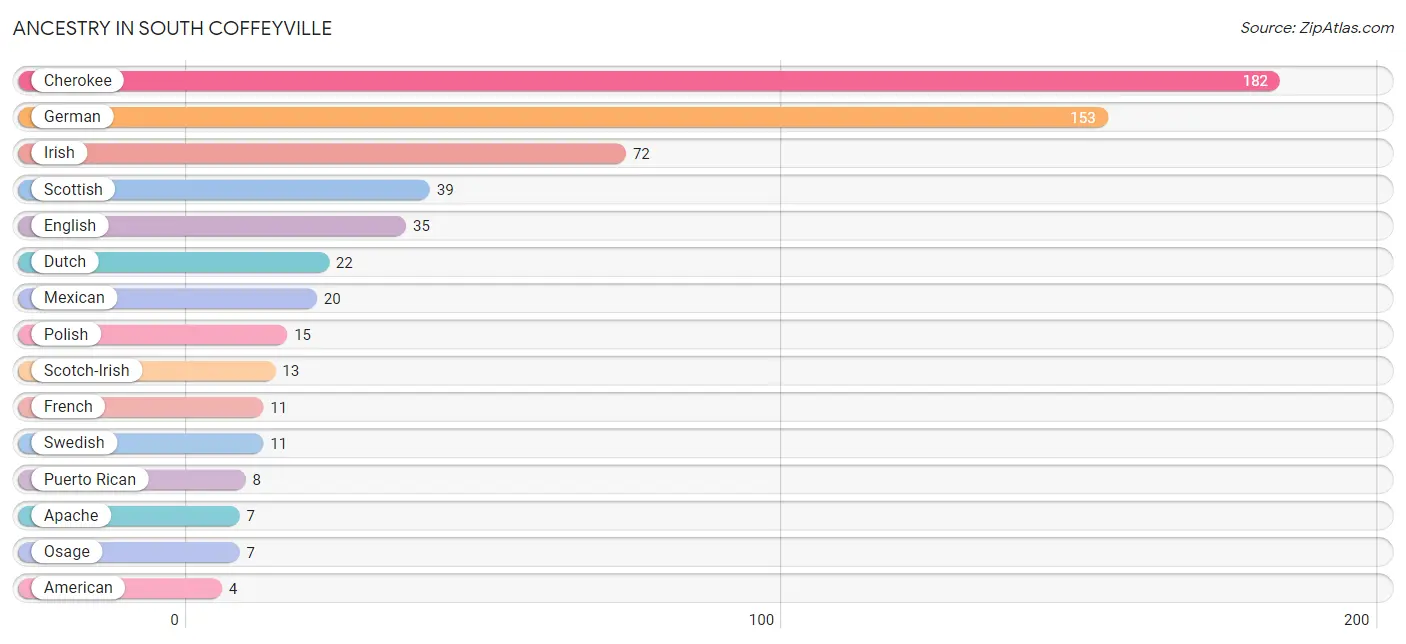
| Ancestry | # Population | % Population |
| American | 4 | 0.6% |
| Apache | 7 | 1.0% |
| Blackfeet | 3 | 0.4% |
| Cherokee | 182 | 26.3% |
| Chickasaw | 3 | 0.4% |
| Choctaw | 4 | 0.6% |
| Creek | 3 | 0.4% |
| Delaware | 1 | 0.1% |
| Dutch | 22 | 3.2% |
| English | 35 | 5.1% |
| European | 4 | 0.6% |
| French | 11 | 1.6% |
| French Canadian | 2 | 0.3% |
| German | 153 | 22.1% |
| Greek | 2 | 0.3% |
| Irish | 72 | 10.4% |
| Italian | 2 | 0.3% |
| Mexican | 20 | 2.9% |
| Norwegian | 2 | 0.3% |
| Osage | 7 | 1.0% |
| Ottawa | 3 | 0.4% |
| Polish | 15 | 2.2% |
| Potawatomi | 3 | 0.4% |
| Puerto Rican | 8 | 1.2% |
| Scotch-Irish | 13 | 1.9% |
| Scottish | 39 | 5.6% |
| Swedish | 11 | 1.6% |
| Welsh | 3 | 0.4% | View All 28 Rows |
Immigrants in South Coffeyville
The most numerous immigrant groups reported in South Coffeyville came from Central America (6 | 0.9%), Latin America (6 | 0.9%), and Mexico (6 | 0.9%), together accounting for 2.6% of all South Coffeyville residents.
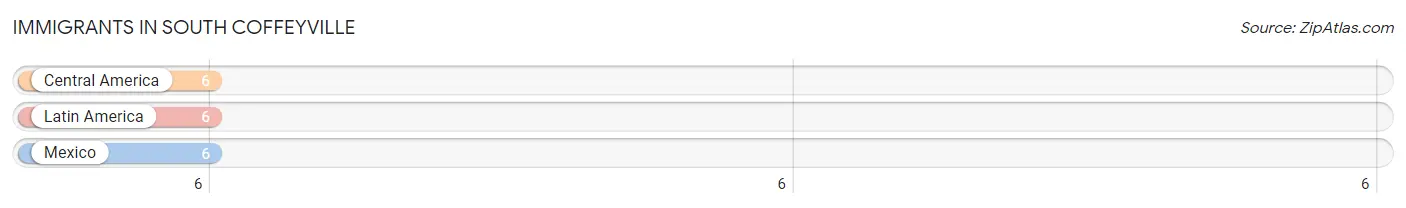
| Immigration Origin | # Population | % Population |
| Central America | 6 | 0.9% |
| Latin America | 6 | 0.9% |
| Mexico | 6 | 0.9% | View All 3 Rows |
Sex and Age in South Coffeyville
Sex and Age in South Coffeyville
The most populous age groups in South Coffeyville are 15 to 19 Years (41 | 11.7%) for men and 10 to 14 Years (35 | 10.3%) for women.
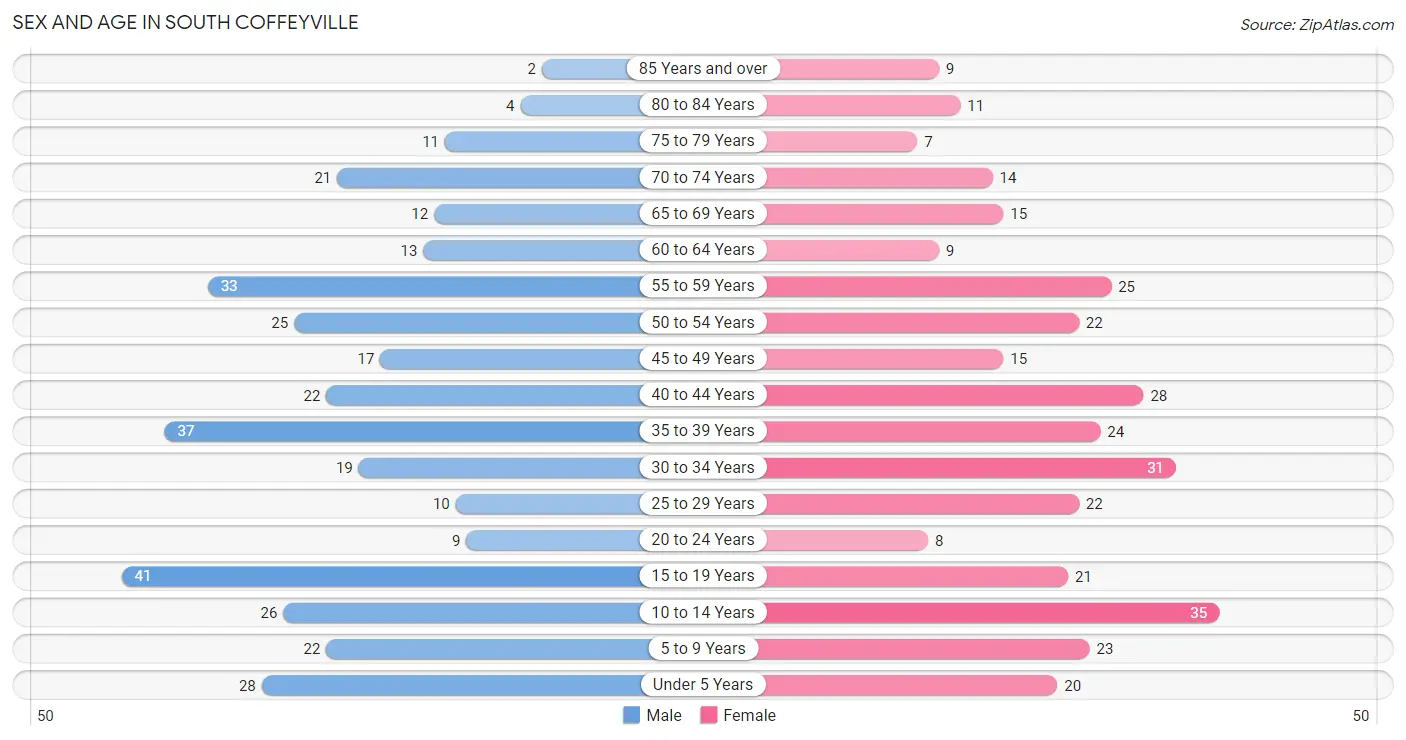
| Age Bracket | Male | Female |
| Under 5 Years | 28 (8.0%) | 20 (5.9%) |
| 5 to 9 Years | 22 (6.2%) | 23 (6.8%) |
| 10 to 14 Years | 26 (7.4%) | 35 (10.3%) |
| 15 to 19 Years | 41 (11.7%) | 21 (6.2%) |
| 20 to 24 Years | 9 (2.6%) | 8 (2.4%) |
| 25 to 29 Years | 10 (2.8%) | 22 (6.5%) |
| 30 to 34 Years | 19 (5.4%) | 31 (9.1%) |
| 35 to 39 Years | 37 (10.5%) | 24 (7.1%) |
| 40 to 44 Years | 22 (6.2%) | 28 (8.3%) |
| 45 to 49 Years | 17 (4.8%) | 15 (4.4%) |
| 50 to 54 Years | 25 (7.1%) | 22 (6.5%) |
| 55 to 59 Years | 33 (9.4%) | 25 (7.4%) |
| 60 to 64 Years | 13 (3.7%) | 9 (2.6%) |
| 65 to 69 Years | 12 (3.4%) | 15 (4.4%) |
| 70 to 74 Years | 21 (6.0%) | 14 (4.1%) |
| 75 to 79 Years | 11 (3.1%) | 7 (2.1%) |
| 80 to 84 Years | 4 (1.1%) | 11 (3.2%) |
| 85 Years and over | 2 (0.6%) | 9 (2.6%) |
| Total | 352 (100.0%) | 339 (100.0%) |
Families and Households in South Coffeyville
Median Family Size in South Coffeyville
The median family size in South Coffeyville is 3.22 persons per family, with single female/mother families (14 | 7.9%) accounting for the largest median family size of 4.07 persons per family. On the other hand, married-couple families (146 | 82.0%) represent the smallest median family size with 3.10 persons per family.
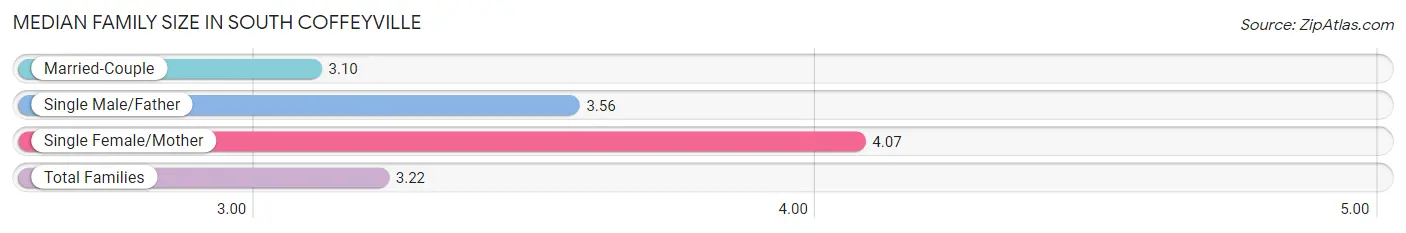
| Family Type | # Families | Family Size |
| Married-Couple | 146 (82.0%) | 3.10 |
| Single Male/Father | 18 (10.1%) | 3.56 |
| Single Female/Mother | 14 (7.9%) | 4.07 |
| Total Families | 178 (100.0%) | 3.22 |
Median Household Size in South Coffeyville
The median household size in South Coffeyville is 2.48 persons per household, with single female/mother households (14 | 5.0%) accounting for the largest median household size of 4.5 persons per household. non-family households (101 | 36.2%) represent the smallest median household size with 1.06 persons per household.
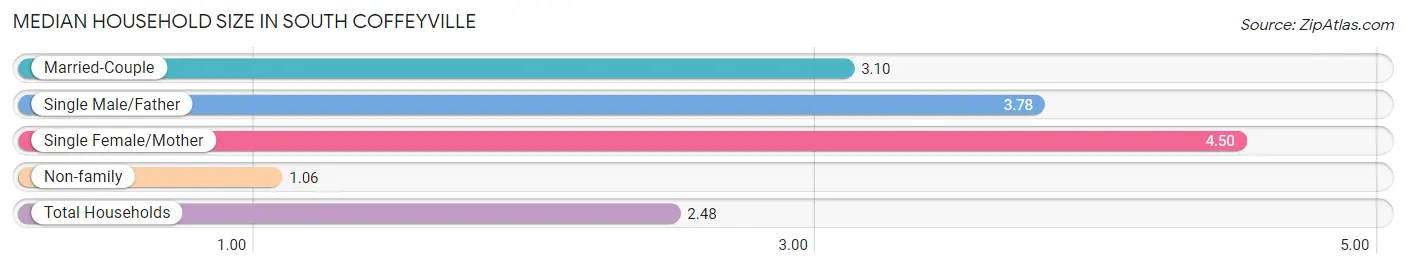
| Household Type | # Households | Household Size |
| Married-Couple | 146 (52.3%) | 3.10 |
| Single Male/Father | 18 (6.5%) | 3.78 |
| Single Female/Mother | 14 (5.0%) | 4.50 |
| Non-family | 101 (36.2%) | 1.06 |
| Total Households | 279 (100.0%) | 2.48 |
Household Size by Marriage Status in South Coffeyville
Out of a total of 279 households in South Coffeyville, 178 (63.8%) are family households, while 101 (36.2%) are nonfamily households. The most numerous type of family households are 2-person households, comprising 68, and the most common type of nonfamily households are 1-person households, comprising 93.
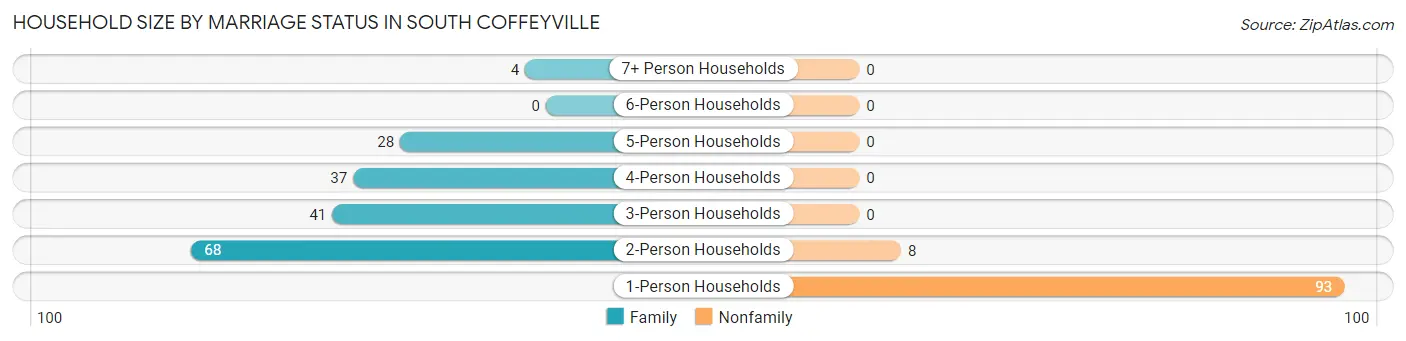
| Household Size | Family Households | Nonfamily Households |
| 1-Person Households | - | 93 (33.3%) |
| 2-Person Households | 68 (24.4%) | 8 (2.9%) |
| 3-Person Households | 41 (14.7%) | 0 (0.0%) |
| 4-Person Households | 37 (13.3%) | 0 (0.0%) |
| 5-Person Households | 28 (10.0%) | 0 (0.0%) |
| 6-Person Households | 0 (0.0%) | 0 (0.0%) |
| 7+ Person Households | 4 (1.4%) | 0 (0.0%) |
| Total | 178 (63.8%) | 101 (36.2%) |
Female Fertility in South Coffeyville
Fertility by Age in South Coffeyville
Average fertility rate in South Coffeyville is 84.0 births per 1,000 women. Women in the age bracket of 15 to 19 years have the highest fertility rate with 190.0 births per 1,000 women. Women in the age bracket of 20 to 34 years acount for 69.2% of all women with births.
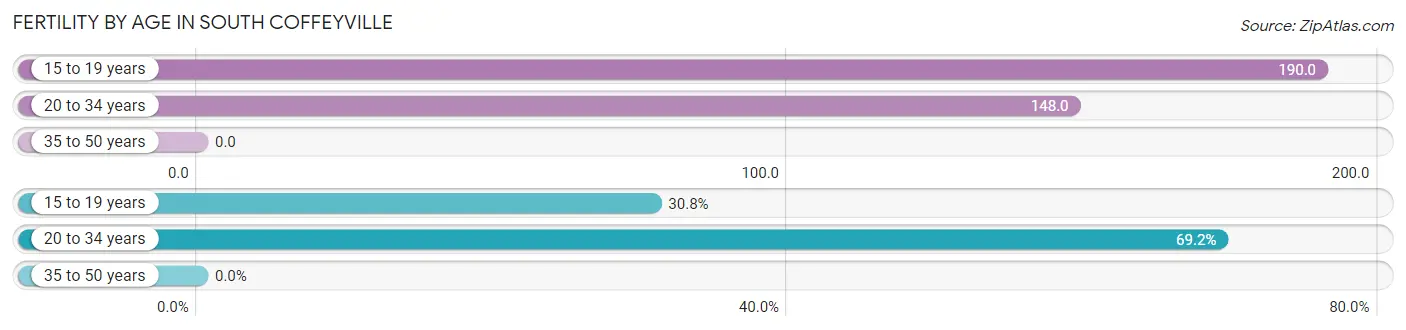
| Age Bracket | Women with Births | Births / 1,000 Women |
| 15 to 19 years | 4 (30.8%) | 190.0 |
| 20 to 34 years | 9 (69.2%) | 148.0 |
| 35 to 50 years | 0 (0.0%) | 0.0 |
| Total | 13 (100.0%) | 84.0 |
Fertility by Age by Marriage Status in South Coffeyville
53.8% of women with births (13) in South Coffeyville are married. The highest percentage of unmarried women with births falls into 15 to 19 years age bracket with 100.0% of them unmarried at the time of birth, while the lowest percentage of unmarried women with births belong to 20 to 34 years age bracket with 22.2% of them unmarried.
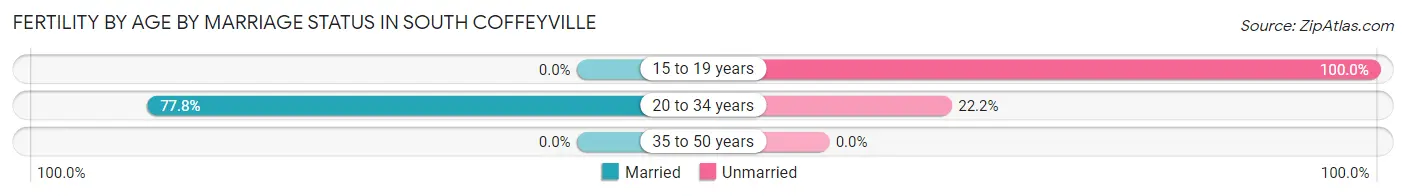
| Age Bracket | Married | Unmarried |
| 15 to 19 years | 0 (0.0%) | 4 (100.0%) |
| 20 to 34 years | 7 (77.8%) | 2 (22.2%) |
| 35 to 50 years | 0 (0.0%) | 0 (0.0%) |
| Total | 7 (53.8%) | 6 (46.2%) |
Fertility by Education in South Coffeyville
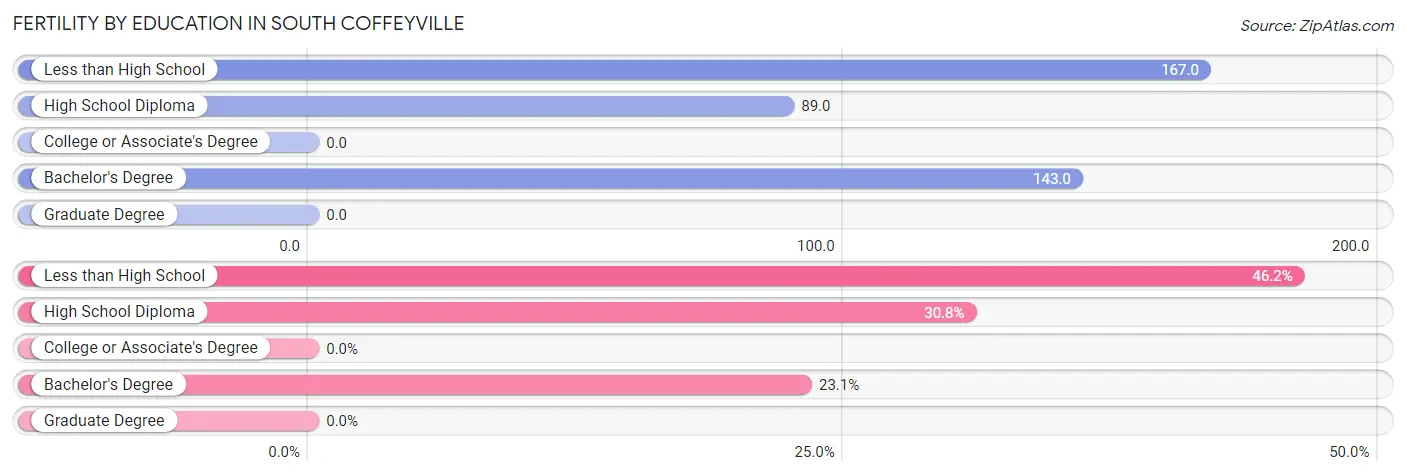
| Educational Attainment | Women with Births | Births / 1,000 Women |
| Less than High School | 6 (46.2%) | 167.0 |
| High School Diploma | 4 (30.8%) | 89.0 |
| College or Associate's Degree | 0 (0.0%) | 0.0 |
| Bachelor's Degree | 3 (23.1%) | 143.0 |
| Graduate Degree | 0 (0.0%) | 0.0 |
| Total | 13 (100.0%) | 84.0 |
Fertility by Education by Marriage Status in South Coffeyville
46.2% of women with births in South Coffeyville are unmarried. Women with the educational attainment of high school diploma are most likely to be married with 100.0% of them married at childbirth, while women with the educational attainment of less than high school are least likely to be married with 100.0% of them unmarried at childbirth.
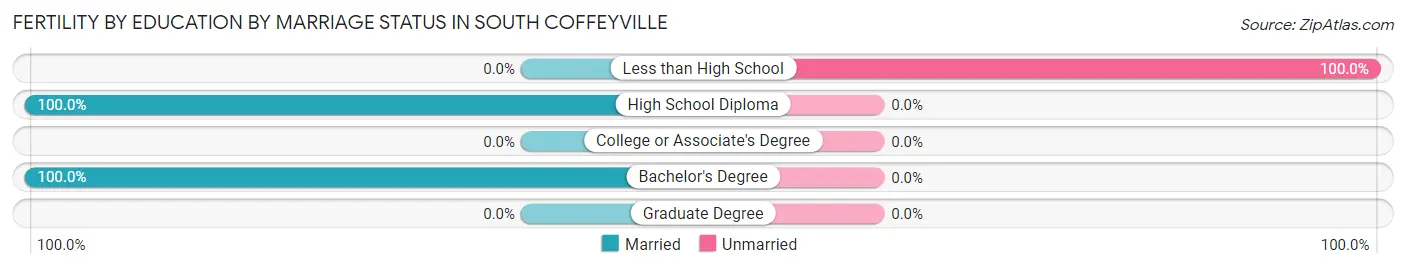
| Educational Attainment | Married | Unmarried |
| Less than High School | 0 (0.0%) | 6 (100.0%) |
| High School Diploma | 4 (100.0%) | 0 (0.0%) |
| College or Associate's Degree | 0 (0.0%) | 0 (0.0%) |
| Bachelor's Degree | 3 (100.0%) | 0 (0.0%) |
| Graduate Degree | 0 (0.0%) | 0 (0.0%) |
| Total | 7 (53.8%) | 6 (46.2%) |
Employment Characteristics in South Coffeyville
Employment by Class of Employer in South Coffeyville
Among the 303 employed individuals in South Coffeyville, private company employees (242 | 79.9%), self-employed (not incorporated) (16 | 5.3%), and federal government employees (12 | 4.0%) make up the most common classes of employment.
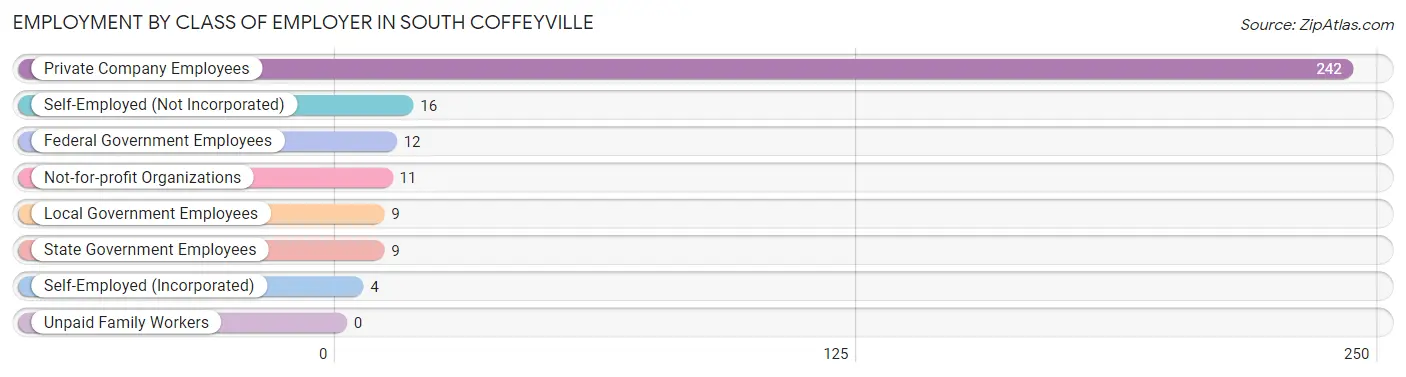
| Employer Class | # Employees | % Employees |
| Private Company Employees | 242 | 79.9% |
| Self-Employed (Incorporated) | 4 | 1.3% |
| Self-Employed (Not Incorporated) | 16 | 5.3% |
| Not-for-profit Organizations | 11 | 3.6% |
| Local Government Employees | 9 | 3.0% |
| State Government Employees | 9 | 3.0% |
| Federal Government Employees | 12 | 4.0% |
| Unpaid Family Workers | 0 | 0.0% |
| Total | 303 | 100.0% |
Employment Status by Age in South Coffeyville
According to the labor force statistics for South Coffeyville, out of the total population over 16 years of age (517), 63.4% or 328 individuals are in the labor force, with 3.7% or 12 of them unemployed. The age group with the highest labor force participation rate is 35 to 44 years, with 96.4% or 107 individuals in the labor force. Within the labor force, the 16 to 19 years age range has the highest percentage of unemployed individuals, with 15.8% or 3 of them being unemployed.
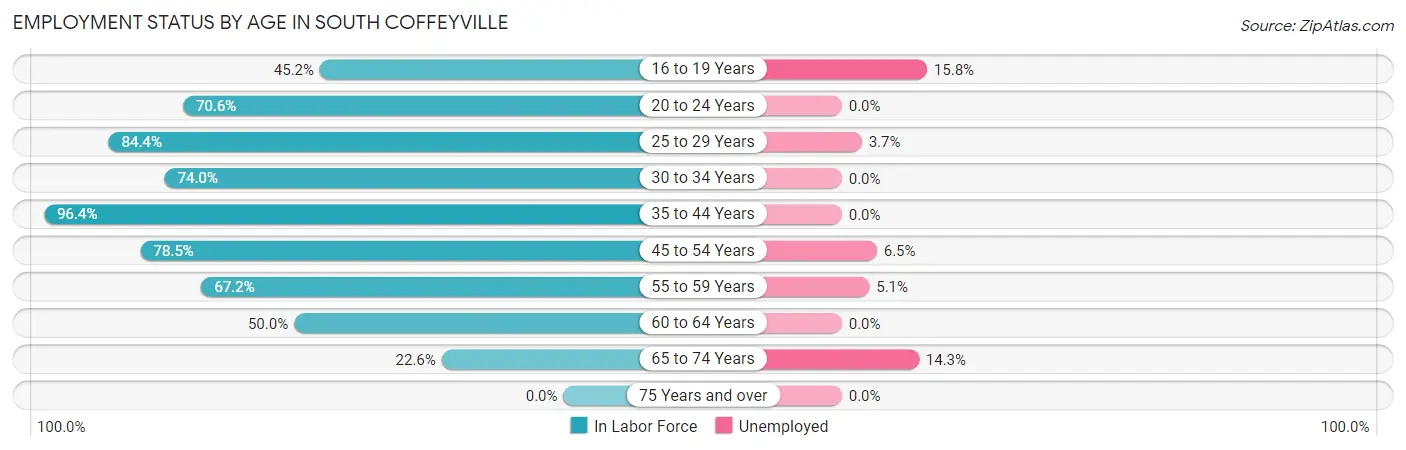
| Age Bracket | In Labor Force | Unemployed |
| 16 to 19 Years | 19 (45.2%) | 3 (15.8%) |
| 20 to 24 Years | 12 (70.6%) | 0 (0.0%) |
| 25 to 29 Years | 27 (84.4%) | 1 (3.7%) |
| 30 to 34 Years | 37 (74.0%) | 0 (0.0%) |
| 35 to 44 Years | 107 (96.4%) | 0 (0.0%) |
| 45 to 54 Years | 62 (78.5%) | 4 (6.5%) |
| 55 to 59 Years | 39 (67.2%) | 2 (5.1%) |
| 60 to 64 Years | 11 (50.0%) | 0 (0.0%) |
| 65 to 74 Years | 14 (22.6%) | 2 (14.3%) |
| 75 Years and over | 0 (0.0%) | 0 (0.0%) |
| Total | 328 (63.4%) | 12 (3.7%) |
Employment Status by Educational Attainment in South Coffeyville
According to labor force statistics for South Coffeyville, 80.4% of individuals (283) out of the total population between 25 and 64 years of age (352) are in the labor force, with 2.5% or 7 of them being unemployed. The group with the highest labor force participation rate are those with the educational attainment of college / associate degree, with 90.1% or 100 individuals in the labor force. Within the labor force, individuals with high school diploma education have the highest percentage of unemployment, with 5.9% or 7 of them being unemployed.
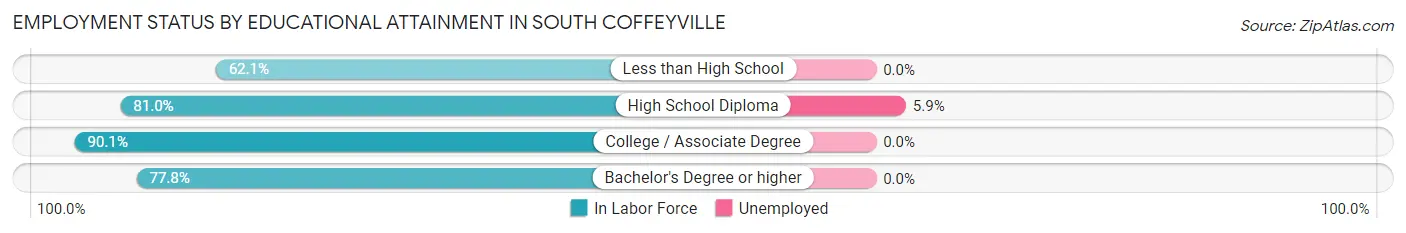
| Educational Attainment | In Labor Force | Unemployed |
| Less than High School | 36 (62.1%) | 0 (0.0%) |
| High School Diploma | 119 (81.0%) | 9 (5.9%) |
| College / Associate Degree | 100 (90.1%) | 0 (0.0%) |
| Bachelor's Degree or higher | 28 (77.8%) | 0 (0.0%) |
| Total | 283 (80.4%) | 9 (2.5%) |
Employment Occupations by Sex in South Coffeyville
Management, Business, Science and Arts Occupations
The most common Management, Business, Science and Arts occupations in South Coffeyville are Health Diagnosing & Treating (21 | 6.7%), Health Technologists (17 | 5.4%), Community & Social Service (16 | 5.1%), Management (15 | 4.8%), and Education Instruction & Library (10 | 3.2%).
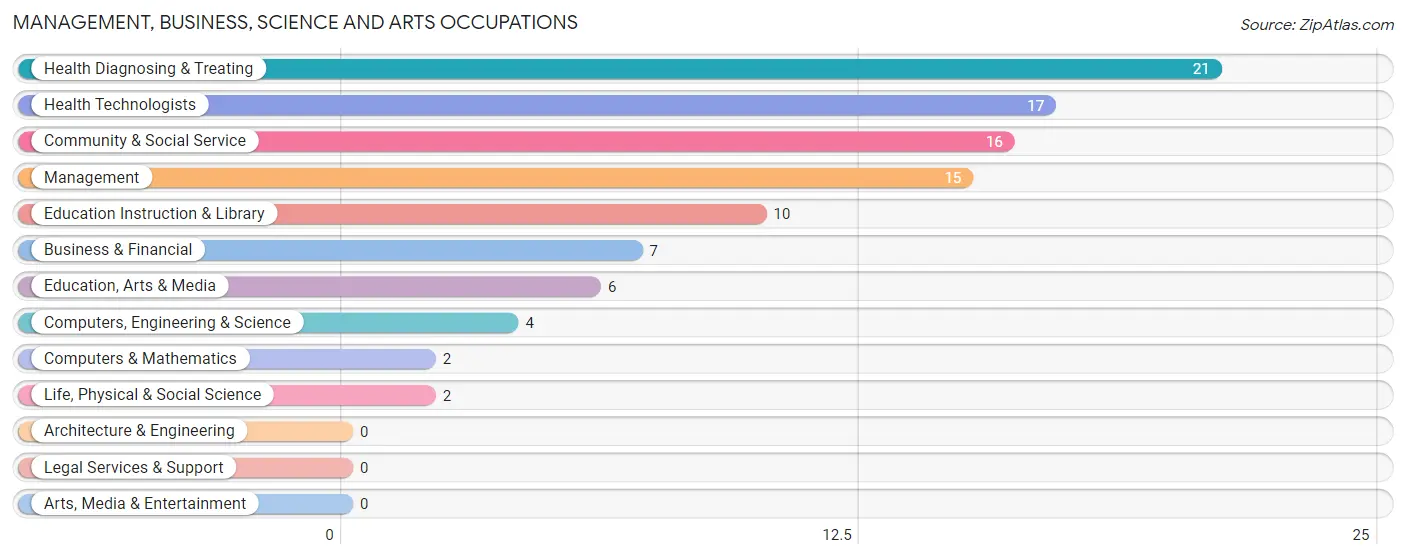
Management, Business, Science and Arts Occupations by Sex
Within the Management, Business, Science and Arts occupations in South Coffeyville, the most male-oriented occupations are Computers, Engineering & Science (100.0%), Computers & Mathematics (100.0%), and Life, Physical & Social Science (100.0%), while the most female-oriented occupations are Community & Social Service (100.0%), Education, Arts & Media (100.0%), and Education Instruction & Library (100.0%).
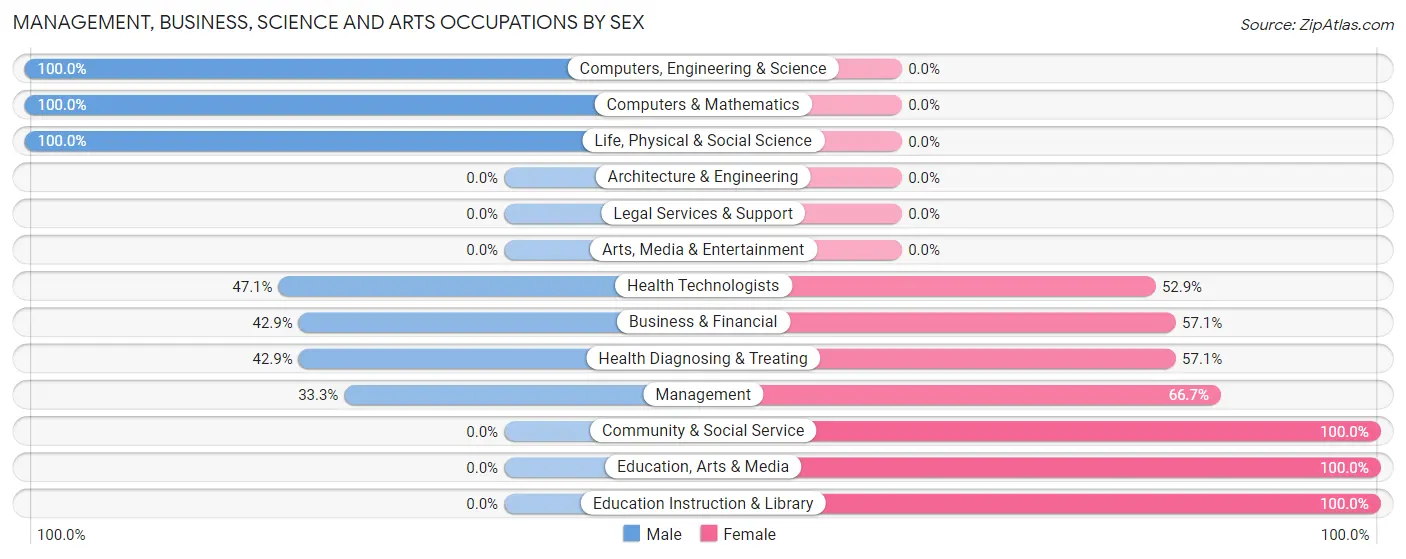
| Occupation | Male | Female |
| Management | 5 (33.3%) | 10 (66.7%) |
| Business & Financial | 3 (42.9%) | 4 (57.1%) |
| Computers, Engineering & Science | 4 (100.0%) | 0 (0.0%) |
| Computers & Mathematics | 2 (100.0%) | 0 (0.0%) |
| Architecture & Engineering | 0 (0.0%) | 0 (0.0%) |
| Life, Physical & Social Science | 2 (100.0%) | 0 (0.0%) |
| Community & Social Service | 0 (0.0%) | 16 (100.0%) |
| Education, Arts & Media | 0 (0.0%) | 6 (100.0%) |
| Legal Services & Support | 0 (0.0%) | 0 (0.0%) |
| Education Instruction & Library | 0 (0.0%) | 10 (100.0%) |
| Arts, Media & Entertainment | 0 (0.0%) | 0 (0.0%) |
| Health Diagnosing & Treating | 9 (42.9%) | 12 (57.1%) |
| Health Technologists | 8 (47.1%) | 9 (52.9%) |
| Total (Category) | 21 (33.3%) | 42 (66.7%) |
| Total (Overall) | 186 (58.9%) | 130 (41.1%) |
Services Occupations
The most common Services occupations in South Coffeyville are Healthcare Support (13 | 4.1%), Food Preparation & Serving (13 | 4.1%), Cleaning & Maintenance (13 | 4.1%), Security & Protection (9 | 2.9%), and Personal Care & Service (9 | 2.9%).
Services Occupations by Sex
Within the Services occupations in South Coffeyville, the most male-oriented occupations are Firefighting & Prevention (100.0%), Cleaning & Maintenance (100.0%), and Security & Protection (88.9%), while the most female-oriented occupations are Food Preparation & Serving (100.0%), Personal Care & Service (100.0%), and Healthcare Support (61.5%).
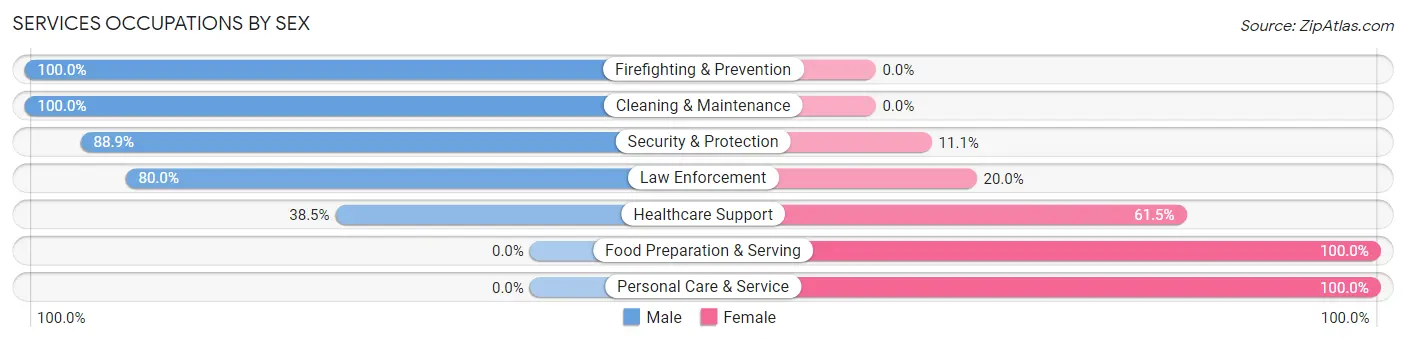
| Occupation | Male | Female |
| Healthcare Support | 5 (38.5%) | 8 (61.5%) |
| Security & Protection | 8 (88.9%) | 1 (11.1%) |
| Firefighting & Prevention | 4 (100.0%) | 0 (0.0%) |
| Law Enforcement | 4 (80.0%) | 1 (20.0%) |
| Food Preparation & Serving | 0 (0.0%) | 13 (100.0%) |
| Cleaning & Maintenance | 13 (100.0%) | 0 (0.0%) |
| Personal Care & Service | 0 (0.0%) | 9 (100.0%) |
| Total (Category) | 26 (45.6%) | 31 (54.4%) |
| Total (Overall) | 186 (58.9%) | 130 (41.1%) |
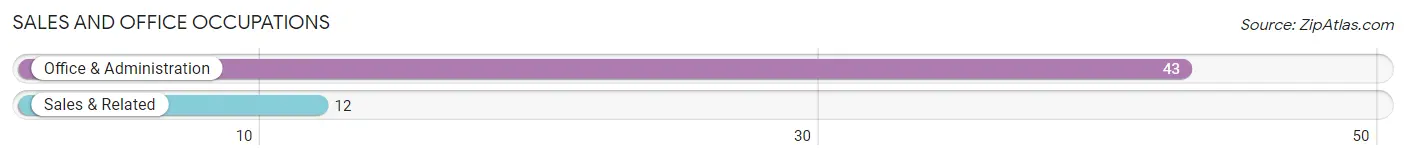
Sales and Office Occupations
The most common Sales and Office occupations in South Coffeyville are Office & Administration (43 | 13.6%), and Sales & Related (12 | 3.8%).
Sales and Office Occupations by Sex
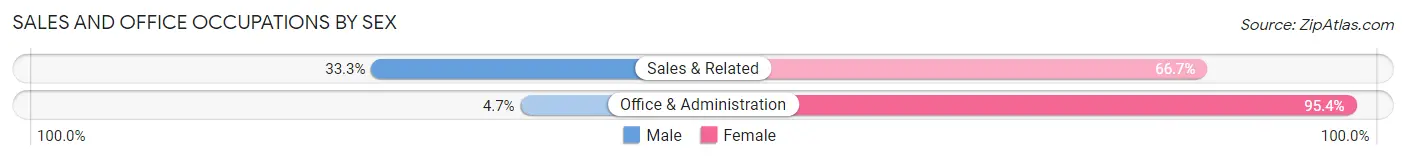
| Occupation | Male | Female |
| Sales & Related | 4 (33.3%) | 8 (66.7%) |
| Office & Administration | 2 (4.6%) | 41 (95.4%) |
| Total (Category) | 6 (10.9%) | 49 (89.1%) |
| Total (Overall) | 186 (58.9%) | 130 (41.1%) |
Natural Resources, Construction and Maintenance Occupations
The most common Natural Resources, Construction and Maintenance occupations in South Coffeyville are Installation, Maintenance & Repair (18 | 5.7%), and Construction & Extraction (17 | 5.4%).
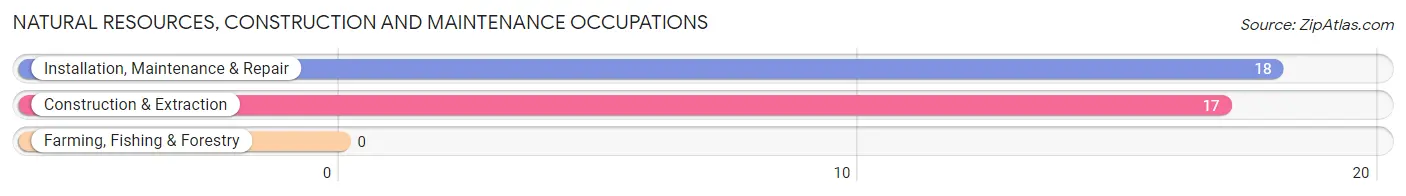
Natural Resources, Construction and Maintenance Occupations by Sex
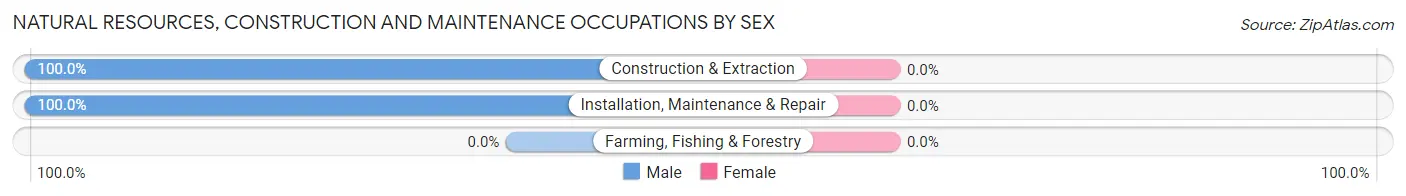
| Occupation | Male | Female |
| Farming, Fishing & Forestry | 0 (0.0%) | 0 (0.0%) |
| Construction & Extraction | 17 (100.0%) | 0 (0.0%) |
| Installation, Maintenance & Repair | 18 (100.0%) | 0 (0.0%) |
| Total (Category) | 35 (100.0%) | 0 (0.0%) |
| Total (Overall) | 186 (58.9%) | 130 (41.1%) |
Production, Transportation and Moving Occupations
The most common Production, Transportation and Moving occupations in South Coffeyville are Production (62 | 19.6%), Transportation (36 | 11.4%), and Material Moving (8 | 2.5%).
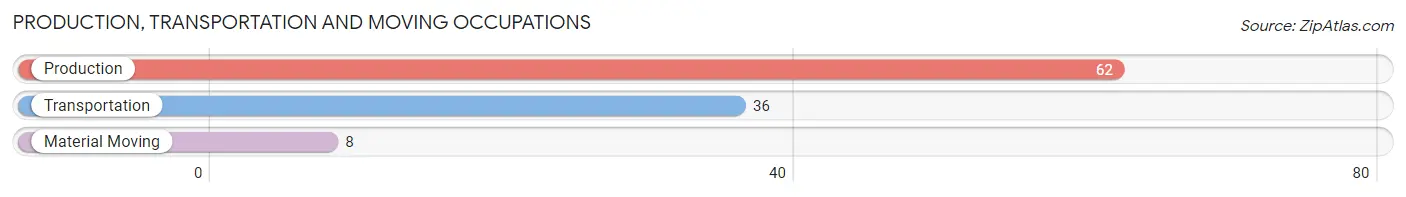
Production, Transportation and Moving Occupations by Sex
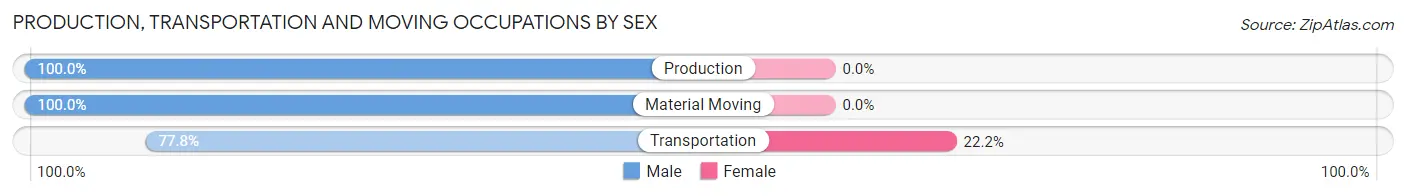
| Occupation | Male | Female |
| Production | 62 (100.0%) | 0 (0.0%) |
| Transportation | 28 (77.8%) | 8 (22.2%) |
| Material Moving | 8 (100.0%) | 0 (0.0%) |
| Total (Category) | 98 (92.4%) | 8 (7.5%) |
| Total (Overall) | 186 (58.9%) | 130 (41.1%) |
Employment Industries by Sex in South Coffeyville
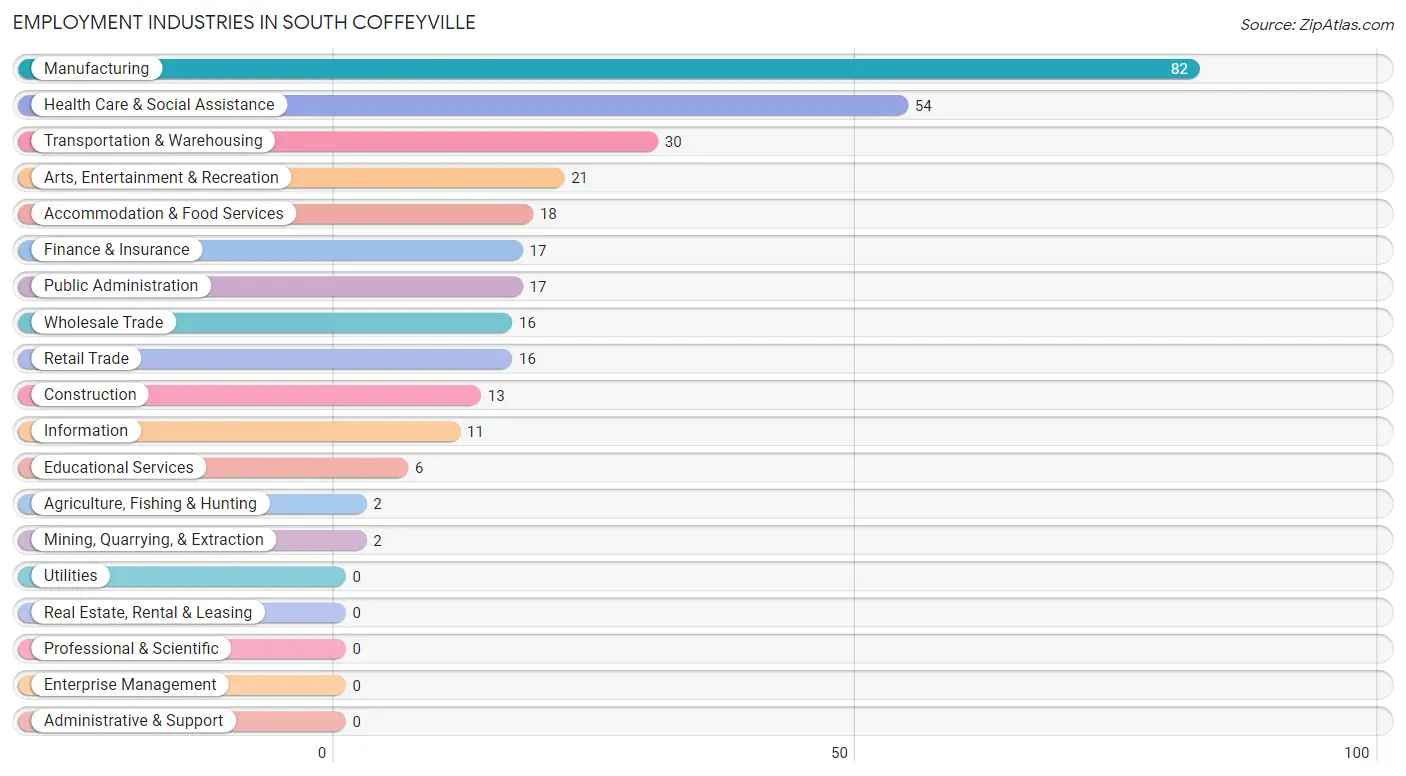
Employment Industries in South Coffeyville
The major employment industries in South Coffeyville include Manufacturing (82 | 26.0%), Health Care & Social Assistance (54 | 17.1%), Transportation & Warehousing (30 | 9.5%), Arts, Entertainment & Recreation (21 | 6.7%), and Accommodation & Food Services (18 | 5.7%).
Employment Industries by Sex in South Coffeyville
The South Coffeyville industries that see more men than women are Agriculture, Fishing & Hunting (100.0%), Mining, Quarrying, & Extraction (100.0%), and Construction (100.0%), whereas the industries that tend to have a higher number of women are Information (100.0%), Finance & Insurance (100.0%), and Educational Services (100.0%).
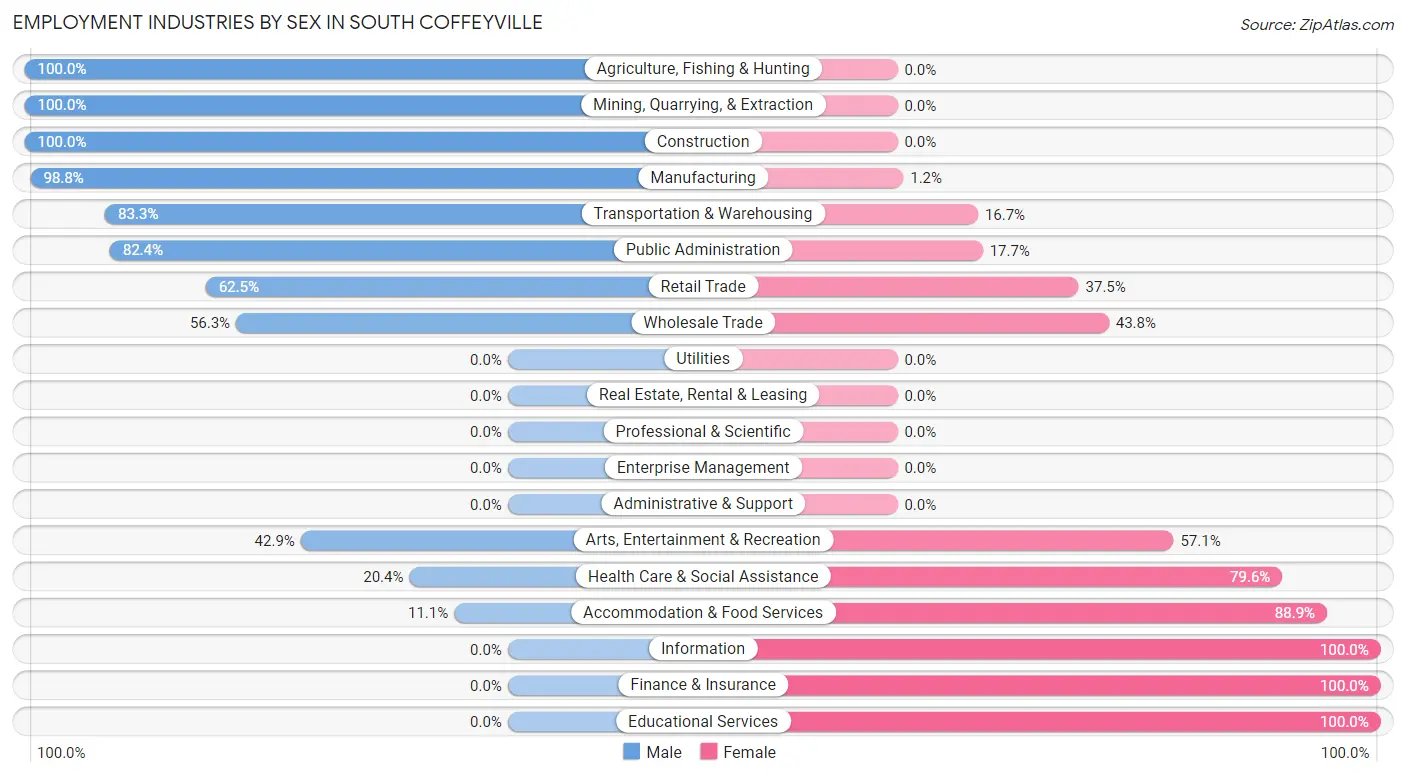
| Industry | Male | Female |
| Agriculture, Fishing & Hunting | 2 (100.0%) | 0 (0.0%) |
| Mining, Quarrying, & Extraction | 2 (100.0%) | 0 (0.0%) |
| Construction | 13 (100.0%) | 0 (0.0%) |
| Manufacturing | 81 (98.8%) | 1 (1.2%) |
| Wholesale Trade | 9 (56.2%) | 7 (43.8%) |
| Retail Trade | 10 (62.5%) | 6 (37.5%) |
| Transportation & Warehousing | 25 (83.3%) | 5 (16.7%) |
| Utilities | 0 (0.0%) | 0 (0.0%) |
| Information | 0 (0.0%) | 11 (100.0%) |
| Finance & Insurance | 0 (0.0%) | 17 (100.0%) |
| Real Estate, Rental & Leasing | 0 (0.0%) | 0 (0.0%) |
| Professional & Scientific | 0 (0.0%) | 0 (0.0%) |
| Enterprise Management | 0 (0.0%) | 0 (0.0%) |
| Administrative & Support | 0 (0.0%) | 0 (0.0%) |
| Educational Services | 0 (0.0%) | 6 (100.0%) |
| Health Care & Social Assistance | 11 (20.4%) | 43 (79.6%) |
| Arts, Entertainment & Recreation | 9 (42.9%) | 12 (57.1%) |
| Accommodation & Food Services | 2 (11.1%) | 16 (88.9%) |
| Public Administration | 14 (82.4%) | 3 (17.6%) |
| Total | 186 (58.9%) | 130 (41.1%) |
Education in South Coffeyville
School Enrollment in South Coffeyville
The most common levels of schooling among the 180 students in South Coffeyville are high school (49 | 27.2%), middle school (43 | 23.9%), and elementary school (38 | 21.1%).
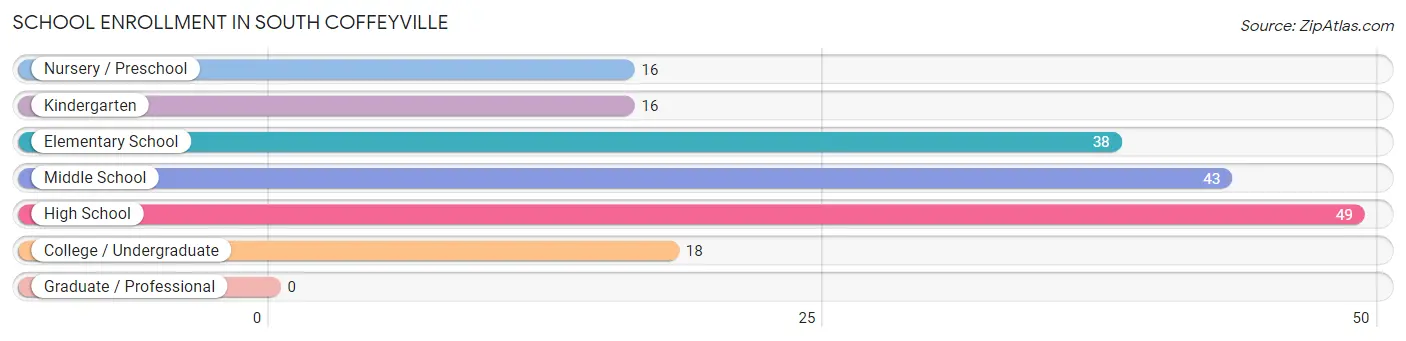
| School Level | # Students | % Students |
| Nursery / Preschool | 16 | 8.9% |
| Kindergarten | 16 | 8.9% |
| Elementary School | 38 | 21.1% |
| Middle School | 43 | 23.9% |
| High School | 49 | 27.2% |
| College / Undergraduate | 18 | 10.0% |
| Graduate / Professional | 0 | 0.0% |
| Total | 180 | 100.0% |
School Enrollment by Age by Funding Source in South Coffeyville
Out of a total of 180 students who are enrolled in schools in South Coffeyville, 10 (5.6%) attend a private institution, while the remaining 170 (94.4%) are enrolled in public schools. The age group of 25 to 34 year olds has the highest likelihood of being enrolled in private schools, with 5 (55.6% in the age bracket) enrolled. Conversely, the age group of 3 to 4 year olds has the lowest likelihood of being enrolled in a private school, with 13 (100.0% in the age bracket) attending a public institution.
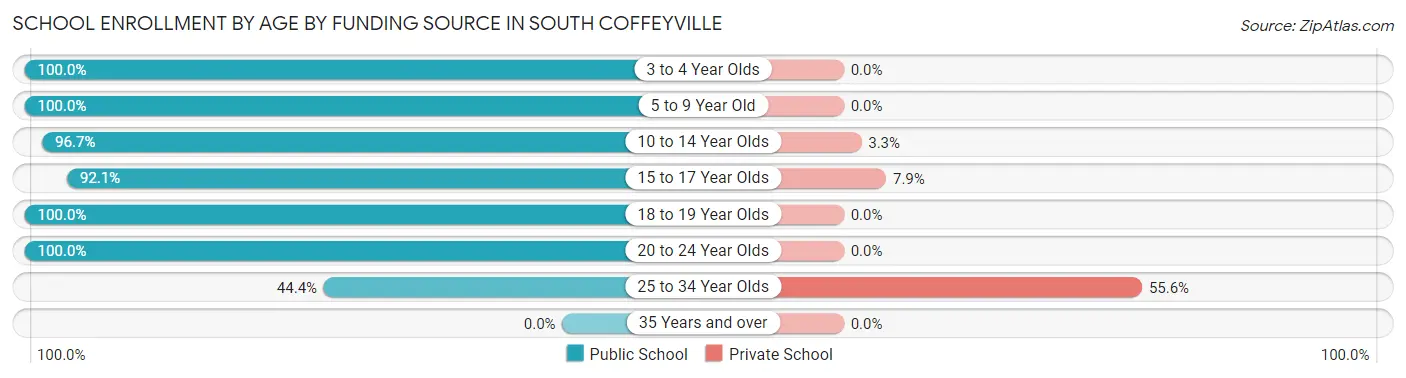
| Age Bracket | Public School | Private School |
| 3 to 4 Year Olds | 13 (100.0%) | 0 (0.0%) |
| 5 to 9 Year Old | 41 (100.0%) | 0 (0.0%) |
| 10 to 14 Year Olds | 59 (96.7%) | 2 (3.3%) |
| 15 to 17 Year Olds | 35 (92.1%) | 3 (7.9%) |
| 18 to 19 Year Olds | 15 (100.0%) | 0 (0.0%) |
| 20 to 24 Year Olds | 3 (100.0%) | 0 (0.0%) |
| 25 to 34 Year Olds | 4 (44.4%) | 5 (55.6%) |
| 35 Years and over | 0 (0.0%) | 0 (0.0%) |
| Total | 170 (94.4%) | 10 (5.6%) |
Educational Attainment by Field of Study in South Coffeyville
Education (17 | 28.8%), business (15 | 25.4%), bio, nature & agricultural (8 | 13.6%), science & technology (8 | 13.6%), and arts & humanities (6 | 10.2%) are the most common fields of study among 59 individuals in South Coffeyville who have obtained a bachelor's degree or higher.
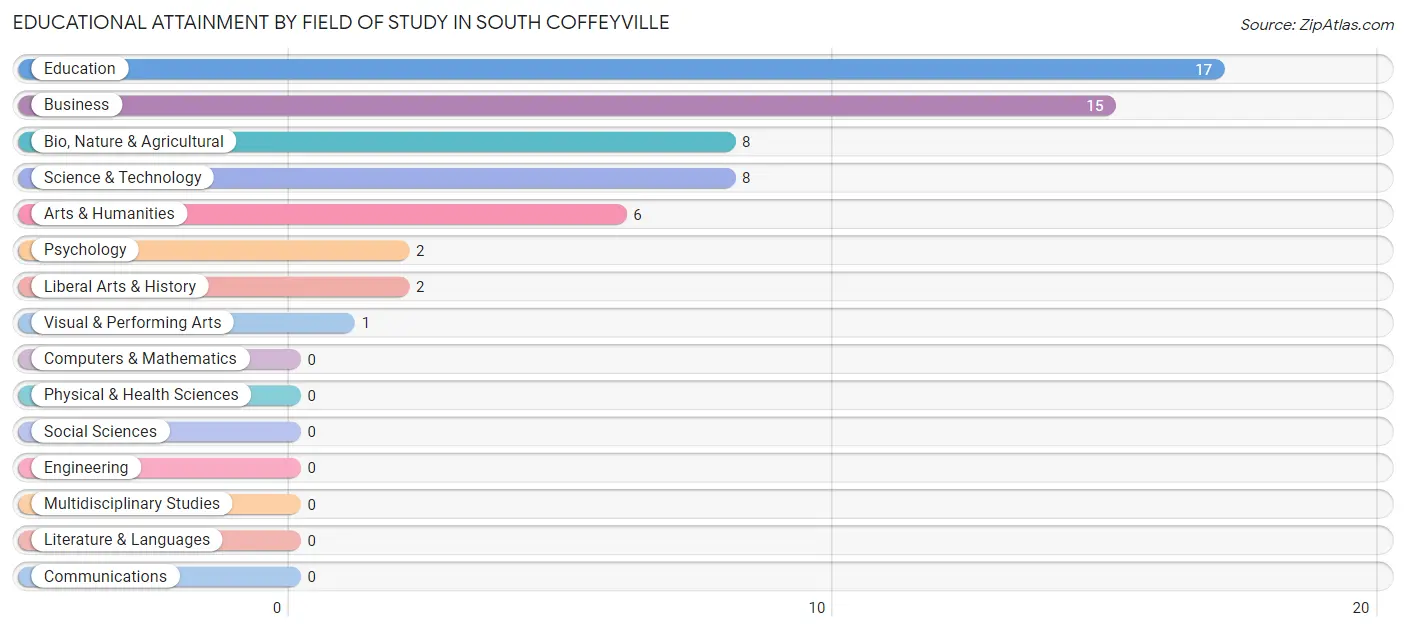
| Field of Study | # Graduates | % Graduates |
| Computers & Mathematics | 0 | 0.0% |
| Bio, Nature & Agricultural | 8 | 13.6% |
| Physical & Health Sciences | 0 | 0.0% |
| Psychology | 2 | 3.4% |
| Social Sciences | 0 | 0.0% |
| Engineering | 0 | 0.0% |
| Multidisciplinary Studies | 0 | 0.0% |
| Science & Technology | 8 | 13.6% |
| Business | 15 | 25.4% |
| Education | 17 | 28.8% |
| Literature & Languages | 0 | 0.0% |
| Liberal Arts & History | 2 | 3.4% |
| Visual & Performing Arts | 1 | 1.7% |
| Communications | 0 | 0.0% |
| Arts & Humanities | 6 | 10.2% |
| Total | 59 | 100.0% |
Transportation & Commute in South Coffeyville
Vehicle Availability by Sex in South Coffeyville
The most prevalent vehicle ownership categories in South Coffeyville are males with 2 vehicles (90, accounting for 49.7%) and females with 2 vehicles (64, making up 73.8%).
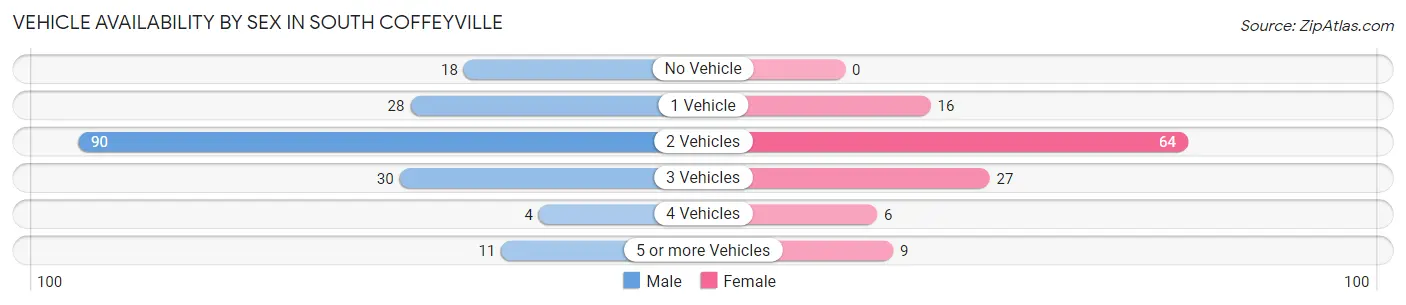
| Vehicles Available | Male | Female |
| No Vehicle | 18 (9.9%) | 0 (0.0%) |
| 1 Vehicle | 28 (15.5%) | 16 (13.1%) |
| 2 Vehicles | 90 (49.7%) | 64 (52.5%) |
| 3 Vehicles | 30 (16.6%) | 27 (22.1%) |
| 4 Vehicles | 4 (2.2%) | 6 (4.9%) |
| 5 or more Vehicles | 11 (6.1%) | 9 (7.4%) |
| Total | 181 (100.0%) | 122 (100.0%) |
Commute Time in South Coffeyville
The most frequently occuring commute durations in South Coffeyville are 10 to 14 minutes (87 commuters, 29.3%), 15 to 19 minutes (78 commuters, 26.3%), and 5 to 9 minutes (50 commuters, 16.8%).
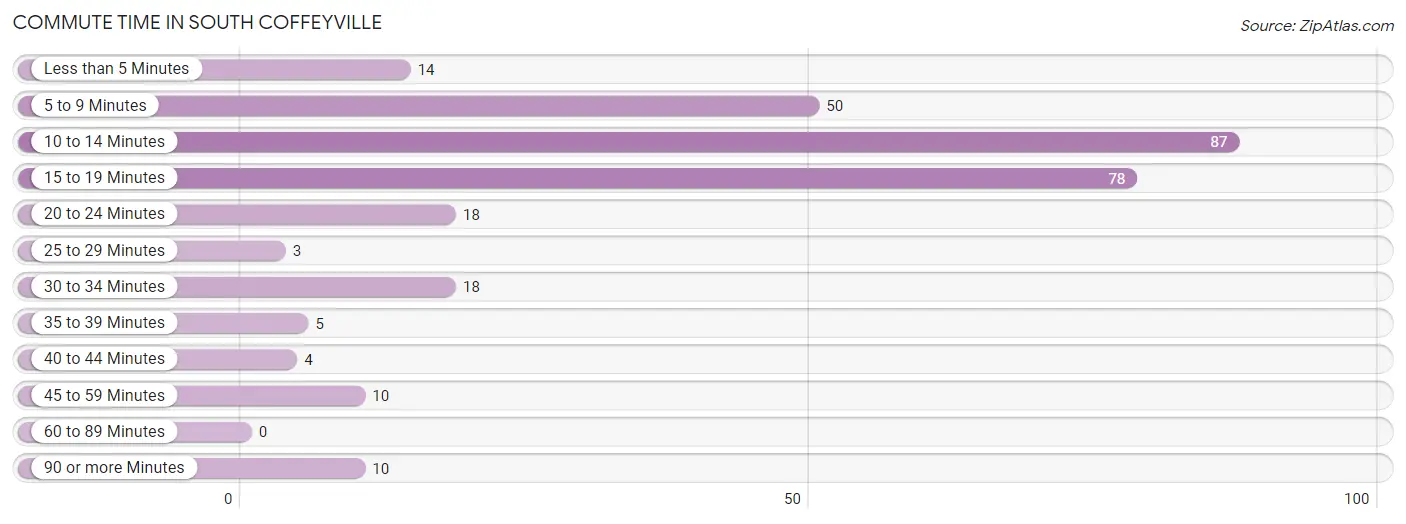
| Commute Time | # Commuters | % Commuters |
| Less than 5 Minutes | 14 | 4.7% |
| 5 to 9 Minutes | 50 | 16.8% |
| 10 to 14 Minutes | 87 | 29.3% |
| 15 to 19 Minutes | 78 | 26.3% |
| 20 to 24 Minutes | 18 | 6.1% |
| 25 to 29 Minutes | 3 | 1.0% |
| 30 to 34 Minutes | 18 | 6.1% |
| 35 to 39 Minutes | 5 | 1.7% |
| 40 to 44 Minutes | 4 | 1.3% |
| 45 to 59 Minutes | 10 | 3.4% |
| 60 to 89 Minutes | 0 | 0.0% |
| 90 or more Minutes | 10 | 3.4% |
Commute Time by Sex in South Coffeyville
The most common commute times in South Coffeyville are 10 to 14 minutes (55 commuters, 30.4%) for males and 10 to 14 minutes (32 commuters, 27.6%) for females.
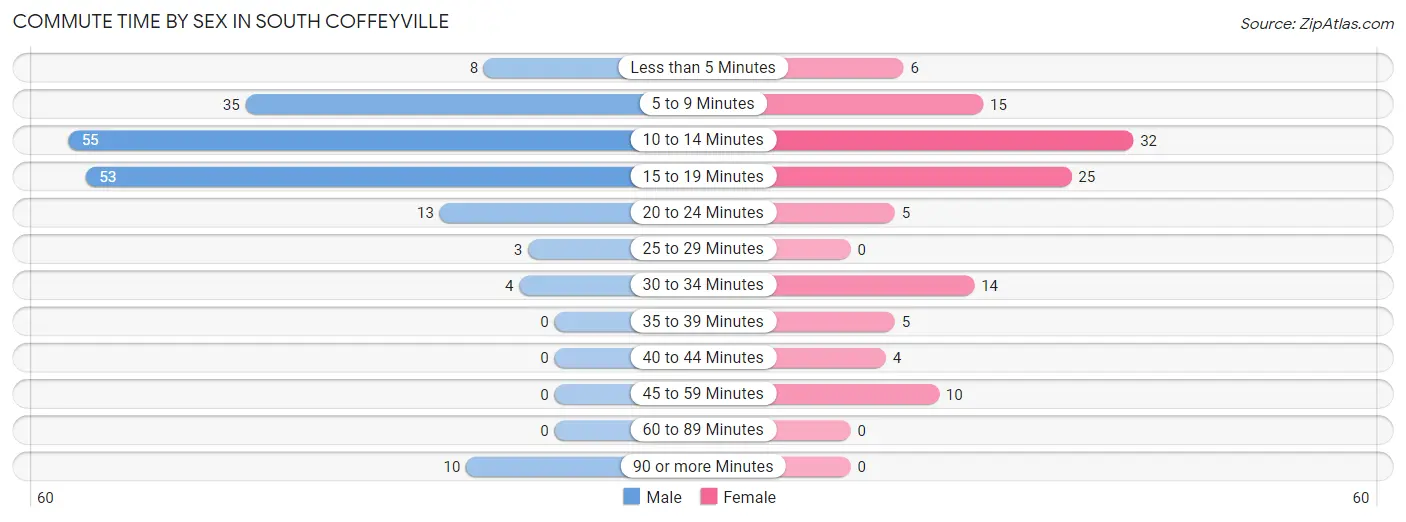
| Commute Time | Male | Female |
| Less than 5 Minutes | 8 (4.4%) | 6 (5.2%) |
| 5 to 9 Minutes | 35 (19.3%) | 15 (12.9%) |
| 10 to 14 Minutes | 55 (30.4%) | 32 (27.6%) |
| 15 to 19 Minutes | 53 (29.3%) | 25 (21.5%) |
| 20 to 24 Minutes | 13 (7.2%) | 5 (4.3%) |
| 25 to 29 Minutes | 3 (1.7%) | 0 (0.0%) |
| 30 to 34 Minutes | 4 (2.2%) | 14 (12.1%) |
| 35 to 39 Minutes | 0 (0.0%) | 5 (4.3%) |
| 40 to 44 Minutes | 0 (0.0%) | 4 (3.5%) |
| 45 to 59 Minutes | 0 (0.0%) | 10 (8.6%) |
| 60 to 89 Minutes | 0 (0.0%) | 0 (0.0%) |
| 90 or more Minutes | 10 (5.5%) | 0 (0.0%) |
Time of Departure to Work by Sex in South Coffeyville
The most frequent times of departure to work in South Coffeyville are 12:00 AM to 4:59 AM (42, 23.2%) for males and 7:30 AM to 7:59 AM (33, 28.4%) for females.
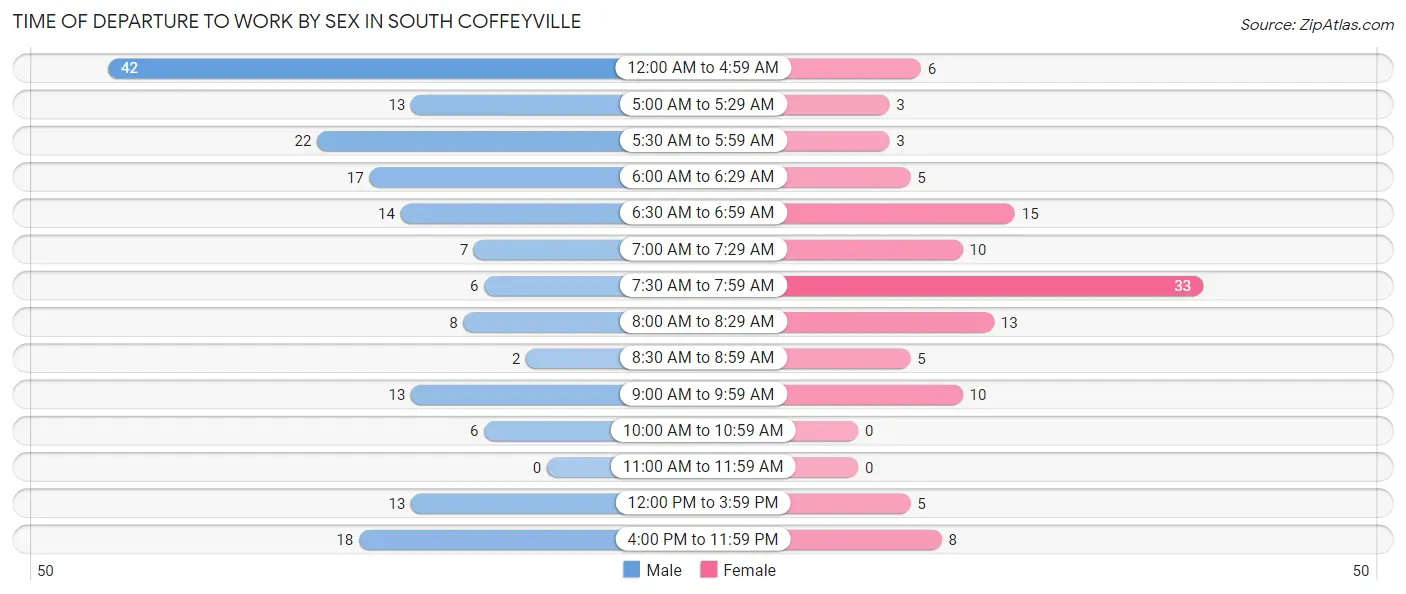
| Time of Departure | Male | Female |
| 12:00 AM to 4:59 AM | 42 (23.2%) | 6 (5.2%) |
| 5:00 AM to 5:29 AM | 13 (7.2%) | 3 (2.6%) |
| 5:30 AM to 5:59 AM | 22 (12.1%) | 3 (2.6%) |
| 6:00 AM to 6:29 AM | 17 (9.4%) | 5 (4.3%) |
| 6:30 AM to 6:59 AM | 14 (7.7%) | 15 (12.9%) |
| 7:00 AM to 7:29 AM | 7 (3.9%) | 10 (8.6%) |
| 7:30 AM to 7:59 AM | 6 (3.3%) | 33 (28.4%) |
| 8:00 AM to 8:29 AM | 8 (4.4%) | 13 (11.2%) |
| 8:30 AM to 8:59 AM | 2 (1.1%) | 5 (4.3%) |
| 9:00 AM to 9:59 AM | 13 (7.2%) | 10 (8.6%) |
| 10:00 AM to 10:59 AM | 6 (3.3%) | 0 (0.0%) |
| 11:00 AM to 11:59 AM | 0 (0.0%) | 0 (0.0%) |
| 12:00 PM to 3:59 PM | 13 (7.2%) | 5 (4.3%) |
| 4:00 PM to 11:59 PM | 18 (9.9%) | 8 (6.9%) |
| Total | 181 (100.0%) | 116 (100.0%) |
Housing Occupancy in South Coffeyville
Occupancy by Ownership in South Coffeyville
Of the total 279 dwellings in South Coffeyville, owner-occupied units account for 189 (67.7%), while renter-occupied units make up 90 (32.3%).
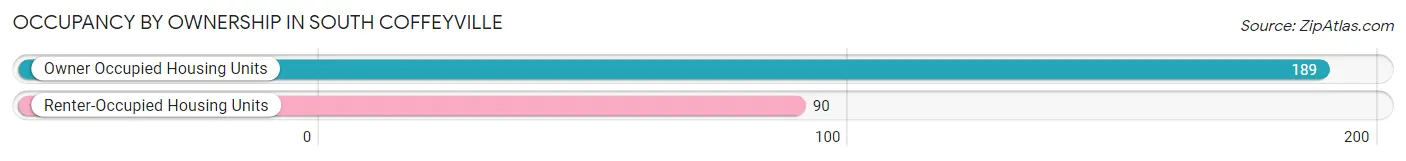
| Occupancy | # Housing Units | % Housing Units |
| Owner Occupied Housing Units | 189 | 67.7% |
| Renter-Occupied Housing Units | 90 | 32.3% |
| Total Occupied Housing Units | 279 | 100.0% |
Occupancy by Household Size in South Coffeyville
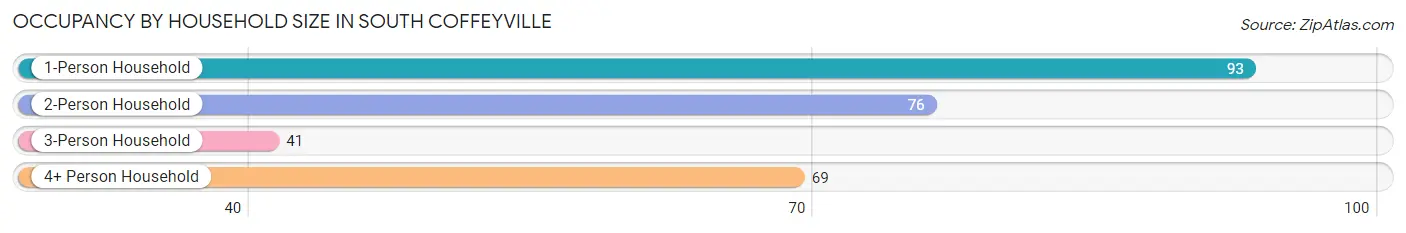
| Household Size | # Housing Units | % Housing Units |
| 1-Person Household | 93 | 33.3% |
| 2-Person Household | 76 | 27.2% |
| 3-Person Household | 41 | 14.7% |
| 4+ Person Household | 69 | 24.7% |
| Total Housing Units | 279 | 100.0% |
Occupancy by Ownership by Household Size in South Coffeyville
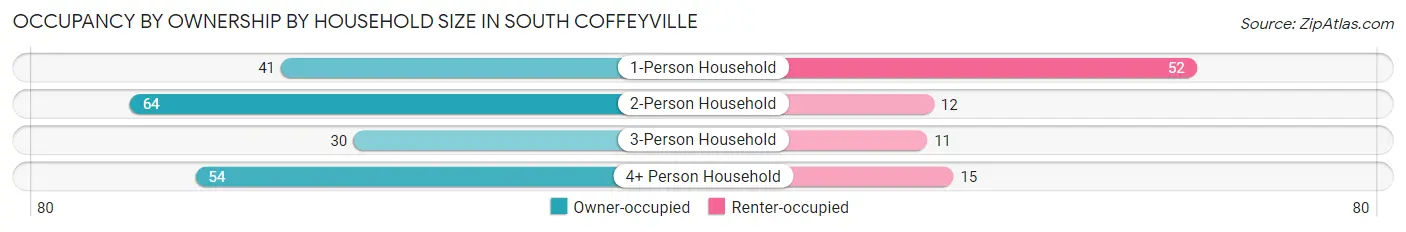
| Household Size | Owner-occupied | Renter-occupied |
| 1-Person Household | 41 (44.1%) | 52 (55.9%) |
| 2-Person Household | 64 (84.2%) | 12 (15.8%) |
| 3-Person Household | 30 (73.2%) | 11 (26.8%) |
| 4+ Person Household | 54 (78.3%) | 15 (21.7%) |
| Total Housing Units | 189 (67.7%) | 90 (32.3%) |
Occupancy by Educational Attainment in South Coffeyville
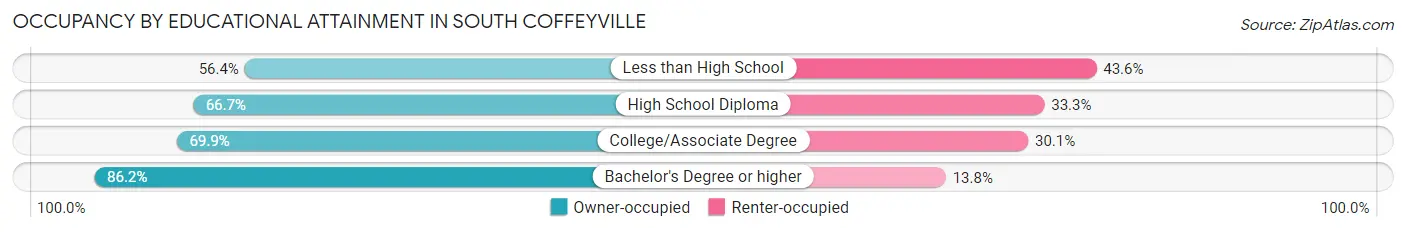
| Household Size | Owner-occupied | Renter-occupied |
| Less than High School | 31 (56.4%) | 24 (43.6%) |
| High School Diploma | 68 (66.7%) | 34 (33.3%) |
| College/Associate Degree | 65 (69.9%) | 28 (30.1%) |
| Bachelor's Degree or higher | 25 (86.2%) | 4 (13.8%) |
Occupancy by Age of Householder in South Coffeyville
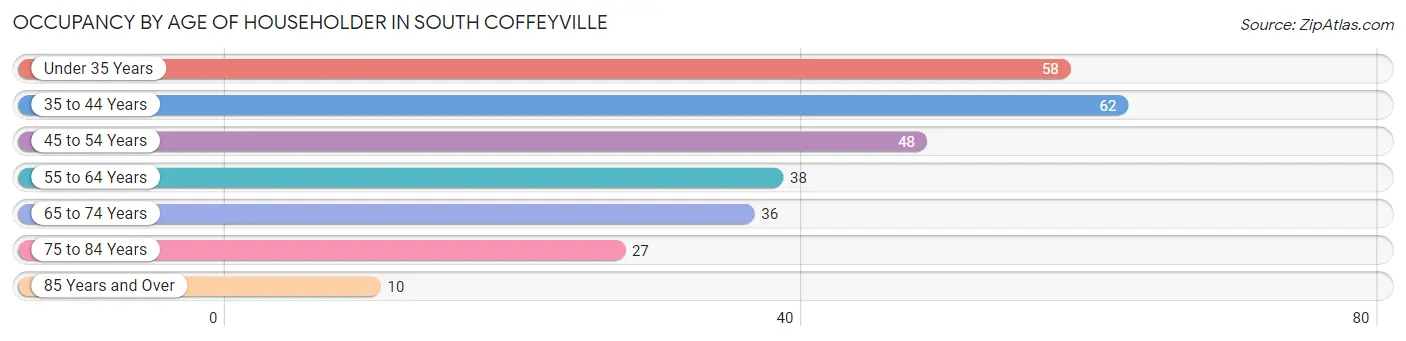
| Age Bracket | # Households | % Households |
| Under 35 Years | 58 | 20.8% |
| 35 to 44 Years | 62 | 22.2% |
| 45 to 54 Years | 48 | 17.2% |
| 55 to 64 Years | 38 | 13.6% |
| 65 to 74 Years | 36 | 12.9% |
| 75 to 84 Years | 27 | 9.7% |
| 85 Years and Over | 10 | 3.6% |
| Total | 279 | 100.0% |
Housing Finances in South Coffeyville
Median Income by Occupancy in South Coffeyville
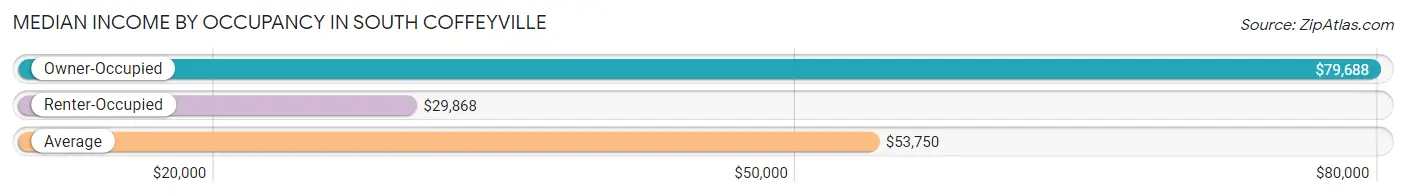
| Occupancy Type | # Households | Median Income |
| Owner-Occupied | 189 (67.7%) | $79,688 |
| Renter-Occupied | 90 (32.3%) | $29,868 |
| Average | 279 (100.0%) | $53,750 |
Occupancy by Householder Income Bracket in South Coffeyville
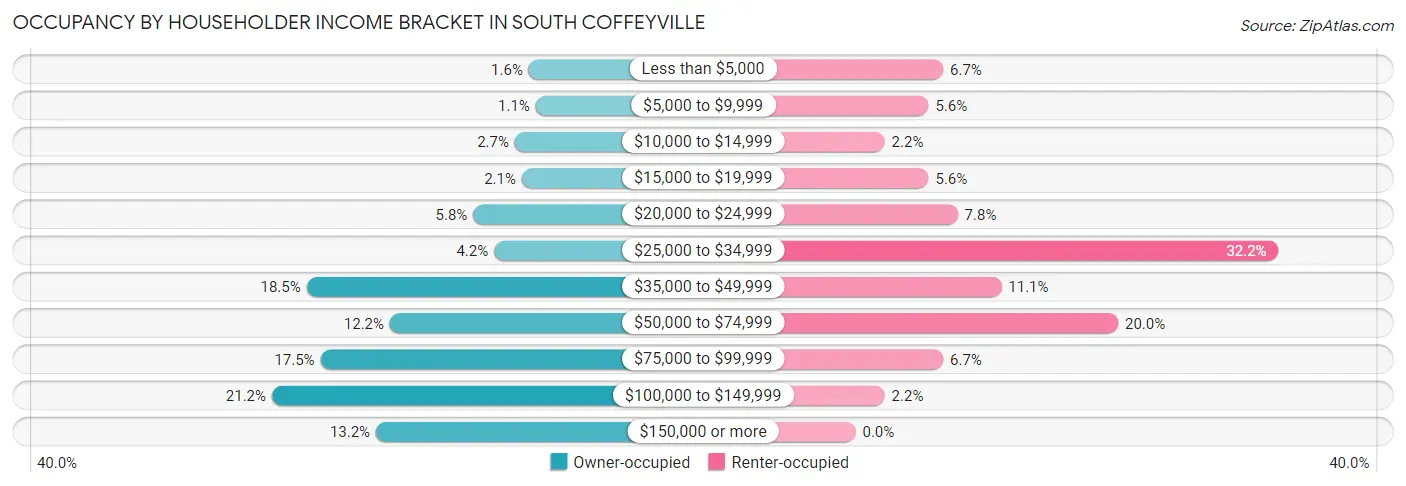
| Income Bracket | Owner-occupied | Renter-occupied |
| Less than $5,000 | 3 (1.6%) | 6 (6.7%) |
| $5,000 to $9,999 | 2 (1.1%) | 5 (5.6%) |
| $10,000 to $14,999 | 5 (2.6%) | 2 (2.2%) |
| $15,000 to $19,999 | 4 (2.1%) | 5 (5.6%) |
| $20,000 to $24,999 | 11 (5.8%) | 7 (7.8%) |
| $25,000 to $34,999 | 8 (4.2%) | 29 (32.2%) |
| $35,000 to $49,999 | 35 (18.5%) | 10 (11.1%) |
| $50,000 to $74,999 | 23 (12.2%) | 18 (20.0%) |
| $75,000 to $99,999 | 33 (17.5%) | 6 (6.7%) |
| $100,000 to $149,999 | 40 (21.2%) | 2 (2.2%) |
| $150,000 or more | 25 (13.2%) | 0 (0.0%) |
| Total | 189 (100.0%) | 90 (100.0%) |
Monthly Housing Cost Tiers in South Coffeyville
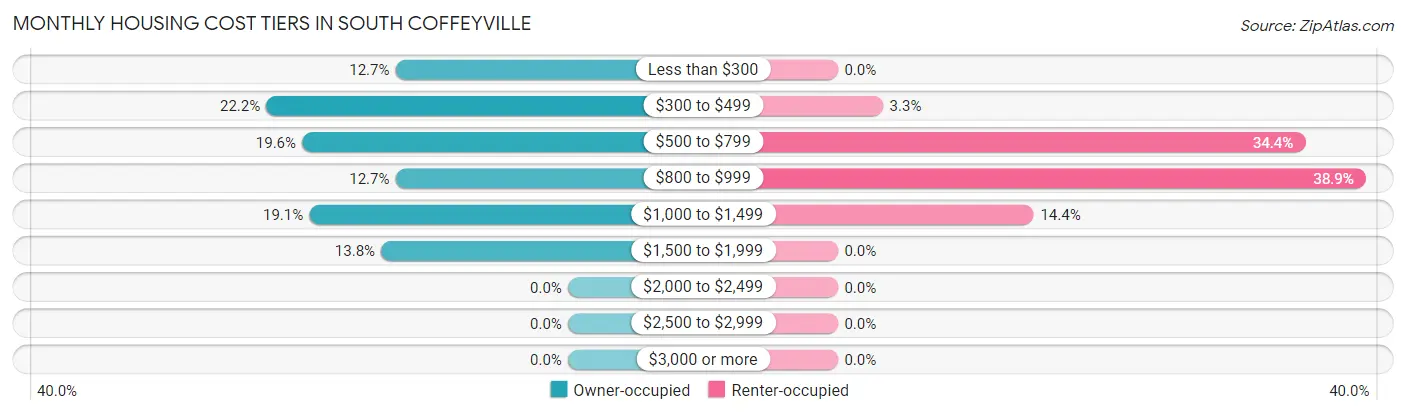
| Monthly Cost | Owner-occupied | Renter-occupied |
| Less than $300 | 24 (12.7%) | 0 (0.0%) |
| $300 to $499 | 42 (22.2%) | 3 (3.3%) |
| $500 to $799 | 37 (19.6%) | 31 (34.4%) |
| $800 to $999 | 24 (12.7%) | 35 (38.9%) |
| $1,000 to $1,499 | 36 (19.1%) | 13 (14.4%) |
| $1,500 to $1,999 | 26 (13.8%) | 0 (0.0%) |
| $2,000 to $2,499 | 0 (0.0%) | 0 (0.0%) |
| $2,500 to $2,999 | 0 (0.0%) | 0 (0.0%) |
| $3,000 or more | 0 (0.0%) | 0 (0.0%) |
| Total | 189 (100.0%) | 90 (100.0%) |
Physical Housing Characteristics in South Coffeyville
Housing Structures in South Coffeyville
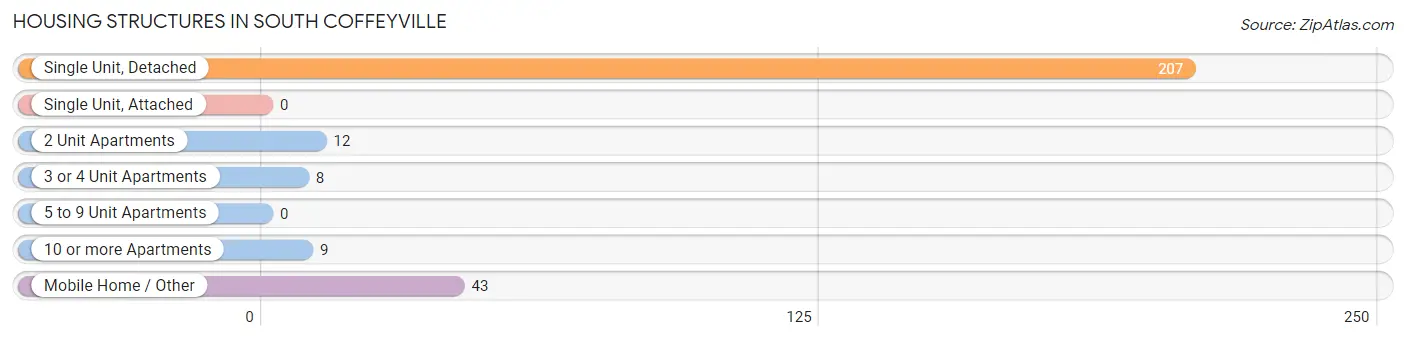
| Structure Type | # Housing Units | % Housing Units |
| Single Unit, Detached | 207 | 74.2% |
| Single Unit, Attached | 0 | 0.0% |
| 2 Unit Apartments | 12 | 4.3% |
| 3 or 4 Unit Apartments | 8 | 2.9% |
| 5 to 9 Unit Apartments | 0 | 0.0% |
| 10 or more Apartments | 9 | 3.2% |
| Mobile Home / Other | 43 | 15.4% |
| Total | 279 | 100.0% |
Housing Structures by Occupancy in South Coffeyville
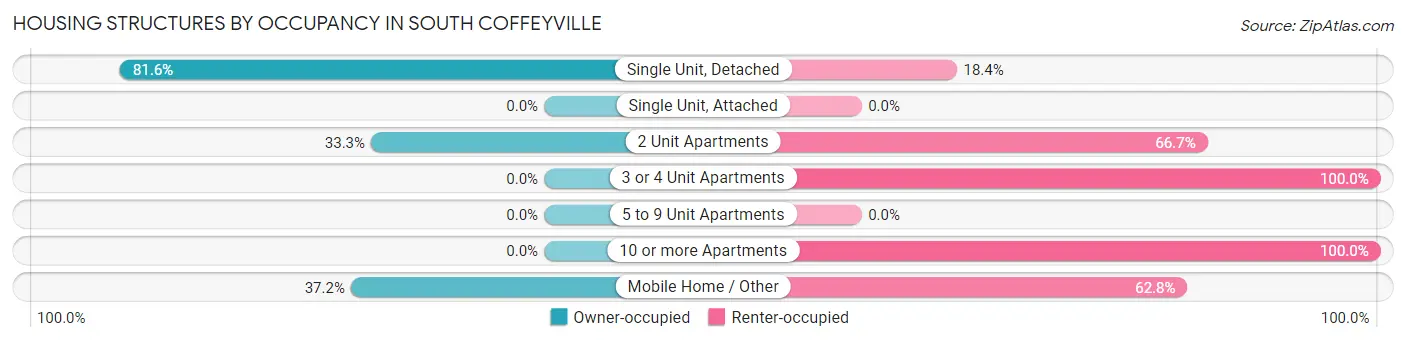
| Structure Type | Owner-occupied | Renter-occupied |
| Single Unit, Detached | 169 (81.6%) | 38 (18.4%) |
| Single Unit, Attached | 0 (0.0%) | 0 (0.0%) |
| 2 Unit Apartments | 4 (33.3%) | 8 (66.7%) |
| 3 or 4 Unit Apartments | 0 (0.0%) | 8 (100.0%) |
| 5 to 9 Unit Apartments | 0 (0.0%) | 0 (0.0%) |
| 10 or more Apartments | 0 (0.0%) | 9 (100.0%) |
| Mobile Home / Other | 16 (37.2%) | 27 (62.8%) |
| Total | 189 (67.7%) | 90 (32.3%) |
Housing Structures by Number of Rooms in South Coffeyville
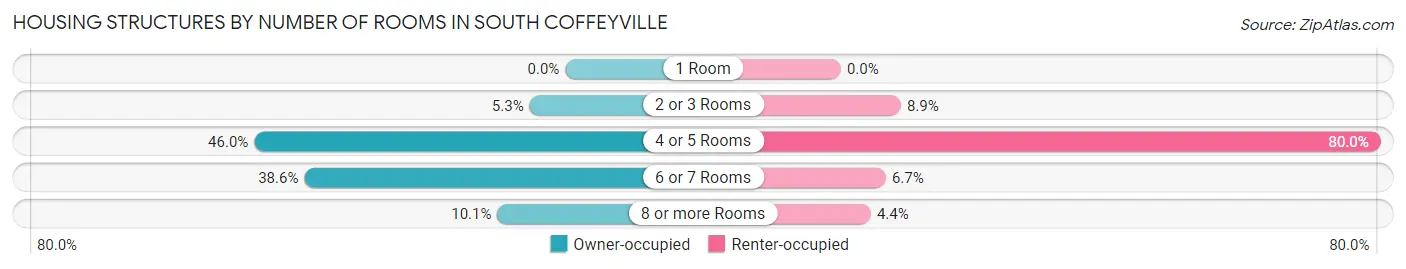
| Number of Rooms | Owner-occupied | Renter-occupied |
| 1 Room | 0 (0.0%) | 0 (0.0%) |
| 2 or 3 Rooms | 10 (5.3%) | 8 (8.9%) |
| 4 or 5 Rooms | 87 (46.0%) | 72 (80.0%) |
| 6 or 7 Rooms | 73 (38.6%) | 6 (6.7%) |
| 8 or more Rooms | 19 (10.1%) | 4 (4.4%) |
| Total | 189 (100.0%) | 90 (100.0%) |
Housing Structure by Heating Type in South Coffeyville
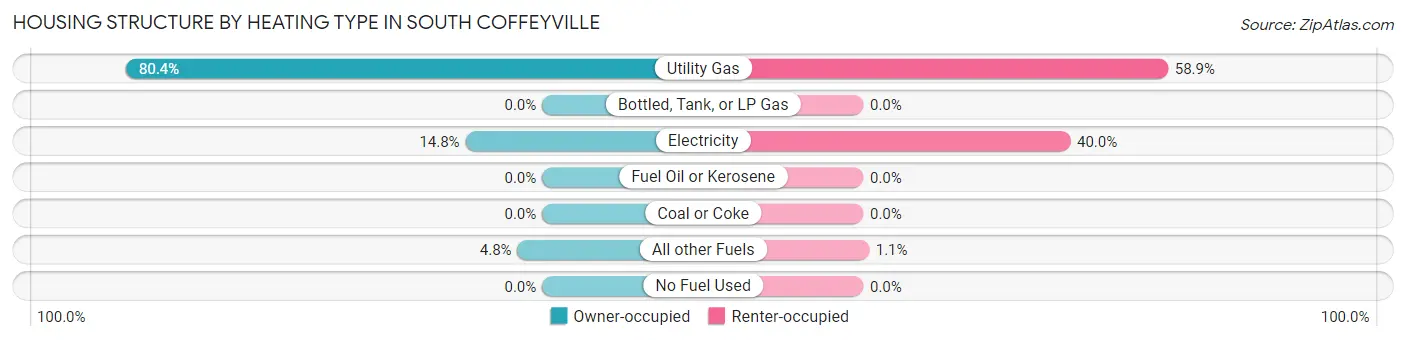
| Heating Type | Owner-occupied | Renter-occupied |
| Utility Gas | 152 (80.4%) | 53 (58.9%) |
| Bottled, Tank, or LP Gas | 0 (0.0%) | 0 (0.0%) |
| Electricity | 28 (14.8%) | 36 (40.0%) |
| Fuel Oil or Kerosene | 0 (0.0%) | 0 (0.0%) |
| Coal or Coke | 0 (0.0%) | 0 (0.0%) |
| All other Fuels | 9 (4.8%) | 1 (1.1%) |
| No Fuel Used | 0 (0.0%) | 0 (0.0%) |
| Total | 189 (100.0%) | 90 (100.0%) |
Household Vehicle Usage in South Coffeyville
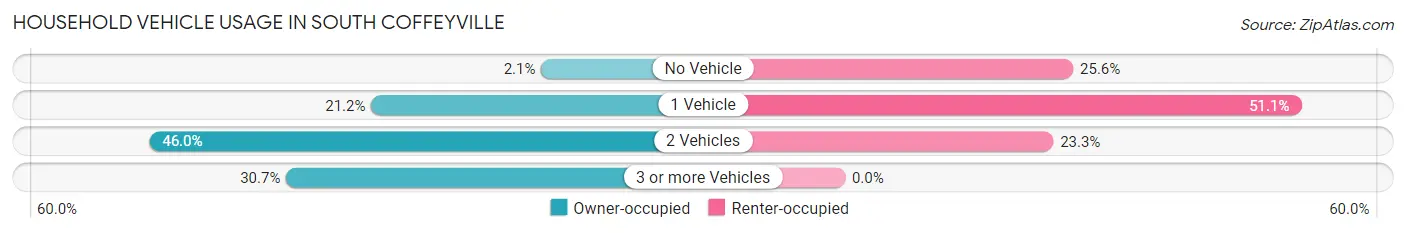
| Vehicles per Household | Owner-occupied | Renter-occupied |
| No Vehicle | 4 (2.1%) | 23 (25.6%) |
| 1 Vehicle | 40 (21.2%) | 46 (51.1%) |
| 2 Vehicles | 87 (46.0%) | 21 (23.3%) |
| 3 or more Vehicles | 58 (30.7%) | 0 (0.0%) |
| Total | 189 (100.0%) | 90 (100.0%) |
Real Estate & Mortgages in South Coffeyville
Real Estate and Mortgage Overview in South Coffeyville
| Characteristic | Without Mortgage | With Mortgage |
| Housing Units | 82 | 107 |
| Median Property Value | $67,500 | $99,100 |
| Median Household Income | $50,000 | $24 |
| Monthly Housing Costs | $410 | $0 |
| Real Estate Taxes | $386 | $5 |
Property Value by Mortgage Status in South Coffeyville
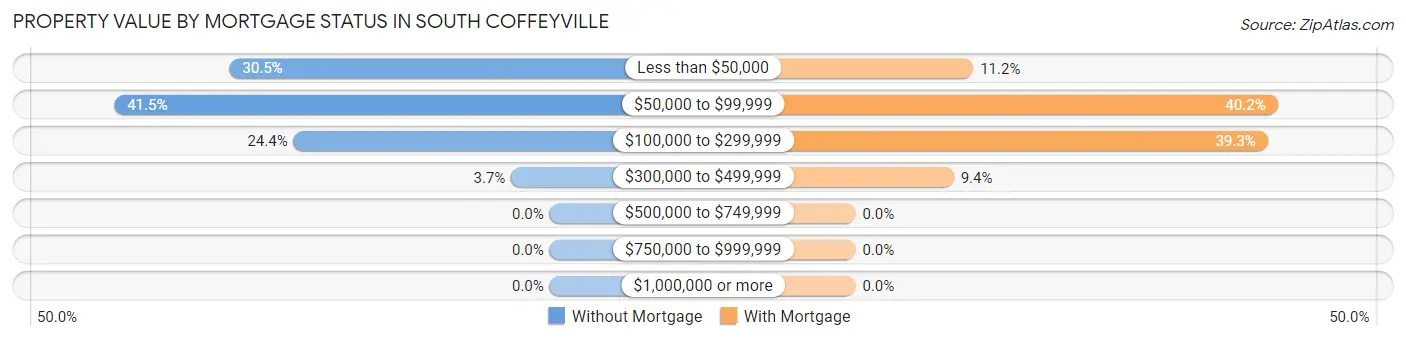
| Property Value | Without Mortgage | With Mortgage |
| Less than $50,000 | 25 (30.5%) | 12 (11.2%) |
| $50,000 to $99,999 | 34 (41.5%) | 43 (40.2%) |
| $100,000 to $299,999 | 20 (24.4%) | 42 (39.3%) |
| $300,000 to $499,999 | 3 (3.7%) | 10 (9.3%) |
| $500,000 to $749,999 | 0 (0.0%) | 0 (0.0%) |
| $750,000 to $999,999 | 0 (0.0%) | 0 (0.0%) |
| $1,000,000 or more | 0 (0.0%) | 0 (0.0%) |
| Total | 82 (100.0%) | 107 (100.0%) |
Household Income by Mortgage Status in South Coffeyville
| Household Income | Without Mortgage | With Mortgage |
| Less than $10,000 | 3 (3.7%) | 4 (3.7%) |
| $10,000 to $24,999 | 18 (22.0%) | 2 (1.9%) |
| $25,000 to $34,999 | 7 (8.5%) | 2 (1.9%) |
| $35,000 to $49,999 | 13 (15.9%) | 1 (0.9%) |
| $50,000 to $74,999 | 14 (17.1%) | 22 (20.6%) |
| $75,000 to $99,999 | 12 (14.6%) | 9 (8.4%) |
| $100,000 to $149,999 | 14 (17.1%) | 21 (19.6%) |
| $150,000 or more | 1 (1.2%) | 26 (24.3%) |
| Total | 82 (100.0%) | 107 (100.0%) |
Property Value to Household Income Ratio in South Coffeyville
| Value-to-Income Ratio | Without Mortgage | With Mortgage |
| Less than 2.0x | 51 (62.2%) | 95,313 (89,077.6%) |
| 2.0x to 2.9x | 9 (11.0%) | 91 (85.1%) |
| 3.0x to 3.9x | 9 (11.0%) | 12 (11.2%) |
| 4.0x or more | 13 (15.9%) | 2 (1.9%) |
| Total | 82 (100.0%) | 107 (100.0%) |
Real Estate Taxes by Mortgage Status in South Coffeyville
| Property Taxes | Without Mortgage | With Mortgage |
| Less than $800 | 76 (92.7%) | 0 (0.0%) |
| $800 to $1,499 | 2 (2.4%) | 55 (51.4%) |
| $800 to $1,499 | 0 (0.0%) | 39 (36.4%) |
| Total | 82 (100.0%) | 107 (100.0%) |
Health & Disability in South Coffeyville
Health Insurance Coverage by Age in South Coffeyville
| Age Bracket | With Coverage | Without Coverage |
| Under 6 Years | 56 (94.9%) | 3 (5.1%) |
| 6 to 18 Years | 136 (90.1%) | 15 (9.9%) |
| 19 to 25 Years | 23 (88.5%) | 3 (11.5%) |
| 26 to 34 Years | 60 (75.9%) | 19 (24.0%) |
| 35 to 44 Years | 87 (78.4%) | 24 (21.6%) |
| 45 to 54 Years | 59 (74.7%) | 20 (25.3%) |
| 55 to 64 Years | 69 (86.3%) | 11 (13.8%) |
| 65 to 74 Years | 62 (100.0%) | 0 (0.0%) |
| 75 Years and older | 44 (100.0%) | 0 (0.0%) |
| Total | 596 (86.3%) | 95 (13.8%) |
Health Insurance Coverage by Citizenship Status in South Coffeyville
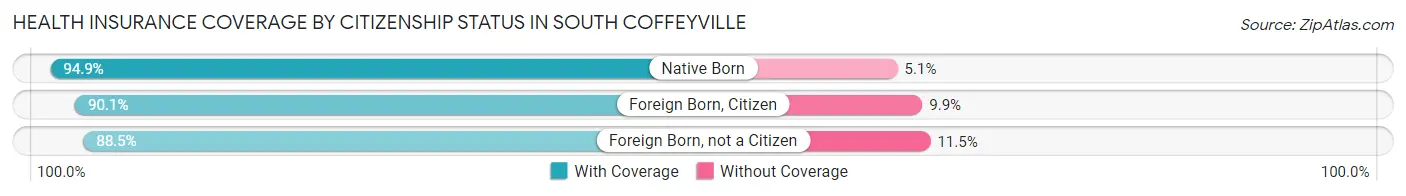
| Citizenship Status | With Coverage | Without Coverage |
| Native Born | 56 (94.9%) | 3 (5.1%) |
| Foreign Born, Citizen | 136 (90.1%) | 15 (9.9%) |
| Foreign Born, not a Citizen | 23 (88.5%) | 3 (11.5%) |
Health Insurance Coverage by Household Income in South Coffeyville
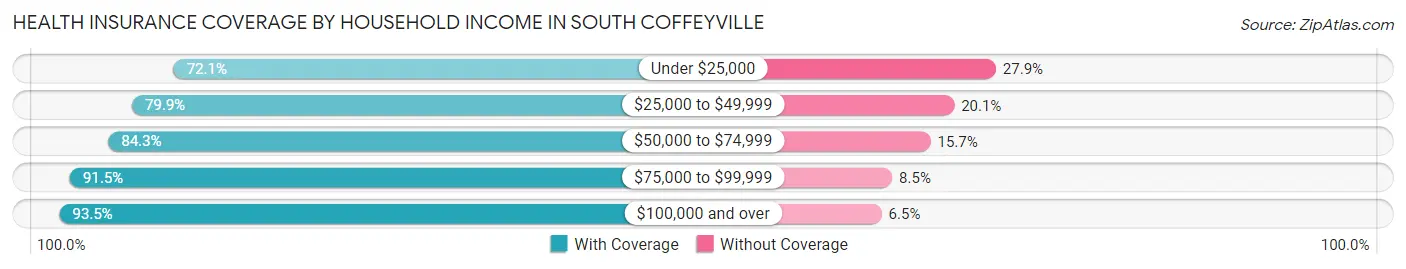
| Household Income | With Coverage | Without Coverage |
| Under $25,000 | 49 (72.1%) | 19 (27.9%) |
| $25,000 to $49,999 | 135 (79.9%) | 34 (20.1%) |
| $50,000 to $74,999 | 86 (84.3%) | 16 (15.7%) |
| $75,000 to $99,999 | 140 (91.5%) | 13 (8.5%) |
| $100,000 and over | 186 (93.5%) | 13 (6.5%) |
Public vs Private Health Insurance Coverage by Age in South Coffeyville
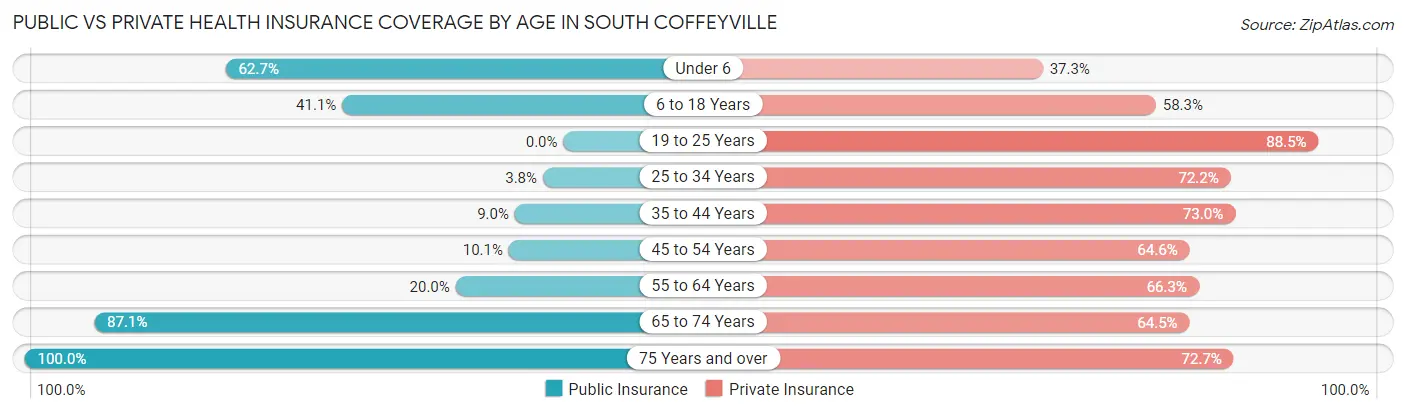
| Age Bracket | Public Insurance | Private Insurance |
| Under 6 | 37 (62.7%) | 22 (37.3%) |
| 6 to 18 Years | 62 (41.1%) | 88 (58.3%) |
| 19 to 25 Years | 0 (0.0%) | 23 (88.5%) |
| 25 to 34 Years | 3 (3.8%) | 57 (72.2%) |
| 35 to 44 Years | 10 (9.0%) | 81 (73.0%) |
| 45 to 54 Years | 8 (10.1%) | 51 (64.6%) |
| 55 to 64 Years | 16 (20.0%) | 53 (66.2%) |
| 65 to 74 Years | 54 (87.1%) | 40 (64.5%) |
| 75 Years and over | 44 (100.0%) | 32 (72.7%) |
| Total | 234 (33.9%) | 447 (64.7%) |
Disability Status by Sex by Age in South Coffeyville
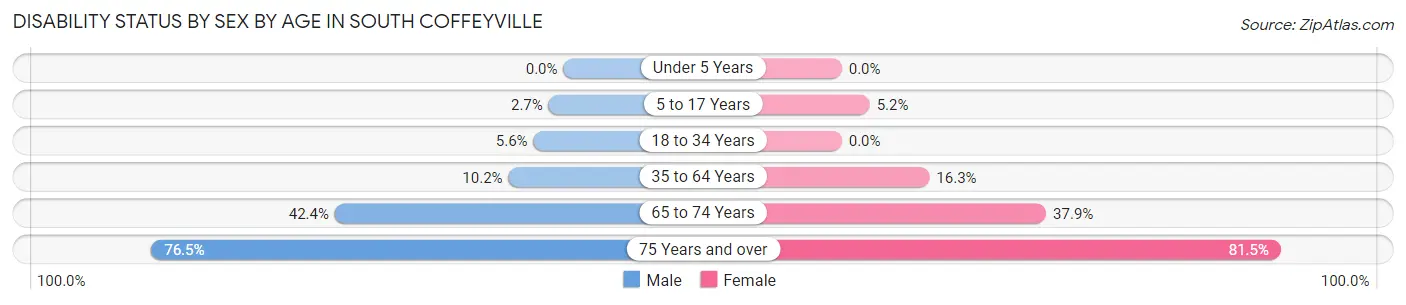
| Age Bracket | Male | Female |
| Under 5 Years | 0 (0.0%) | 0 (0.0%) |
| 5 to 17 Years | 2 (2.7%) | 4 (5.2%) |
| 18 to 34 Years | 3 (5.6%) | 0 (0.0%) |
| 35 to 64 Years | 15 (10.2%) | 20 (16.3%) |
| 65 to 74 Years | 14 (42.4%) | 11 (37.9%) |
| 75 Years and over | 13 (76.5%) | 22 (81.5%) |
Disability Class by Sex by Age in South Coffeyville
Disability Class: Hearing Difficulty
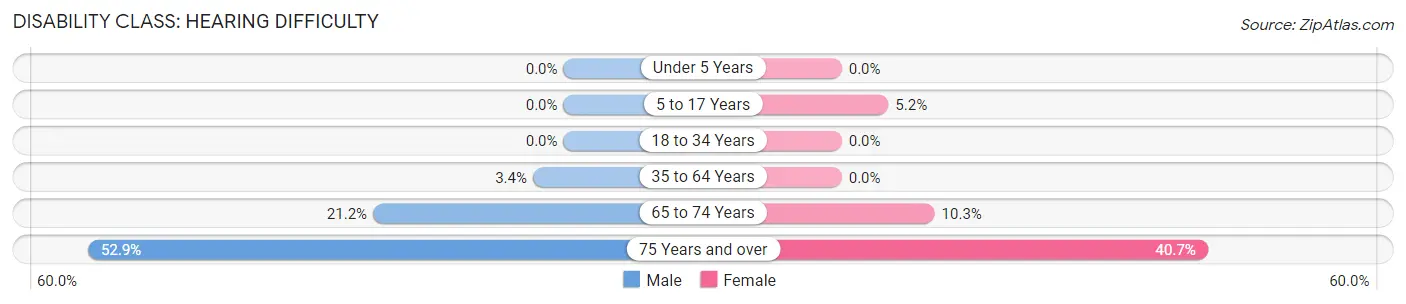
| Age Bracket | Male | Female |
| Under 5 Years | 0 (0.0%) | 0 (0.0%) |
| 5 to 17 Years | 0 (0.0%) | 4 (5.2%) |
| 18 to 34 Years | 0 (0.0%) | 0 (0.0%) |
| 35 to 64 Years | 5 (3.4%) | 0 (0.0%) |
| 65 to 74 Years | 7 (21.2%) | 3 (10.3%) |
| 75 Years and over | 9 (52.9%) | 11 (40.7%) |
Disability Class: Vision Difficulty
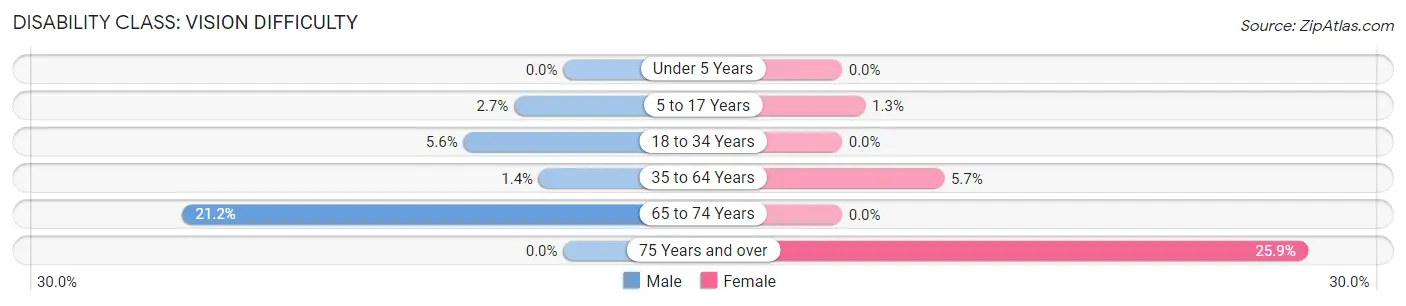
| Age Bracket | Male | Female |
| Under 5 Years | 0 (0.0%) | 0 (0.0%) |
| 5 to 17 Years | 2 (2.7%) | 1 (1.3%) |
| 18 to 34 Years | 3 (5.6%) | 0 (0.0%) |
| 35 to 64 Years | 2 (1.4%) | 7 (5.7%) |
| 65 to 74 Years | 7 (21.2%) | 0 (0.0%) |
| 75 Years and over | 0 (0.0%) | 7 (25.9%) |
Disability Class: Cognitive Difficulty
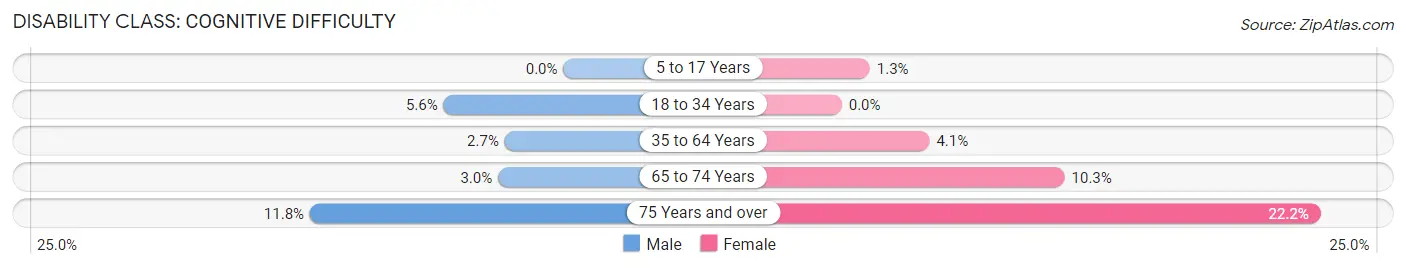
| Age Bracket | Male | Female |
| 5 to 17 Years | 0 (0.0%) | 1 (1.3%) |
| 18 to 34 Years | 3 (5.6%) | 0 (0.0%) |
| 35 to 64 Years | 4 (2.7%) | 5 (4.1%) |
| 65 to 74 Years | 1 (3.0%) | 3 (10.3%) |
| 75 Years and over | 2 (11.8%) | 6 (22.2%) |
Disability Class: Ambulatory Difficulty
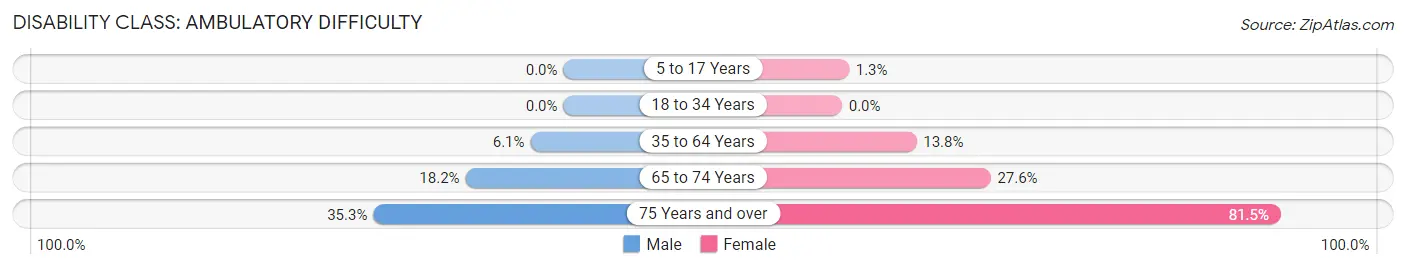
| Age Bracket | Male | Female |
| 5 to 17 Years | 0 (0.0%) | 1 (1.3%) |
| 18 to 34 Years | 0 (0.0%) | 0 (0.0%) |
| 35 to 64 Years | 9 (6.1%) | 17 (13.8%) |
| 65 to 74 Years | 6 (18.2%) | 8 (27.6%) |
| 75 Years and over | 6 (35.3%) | 22 (81.5%) |
Disability Class: Self-Care Difficulty
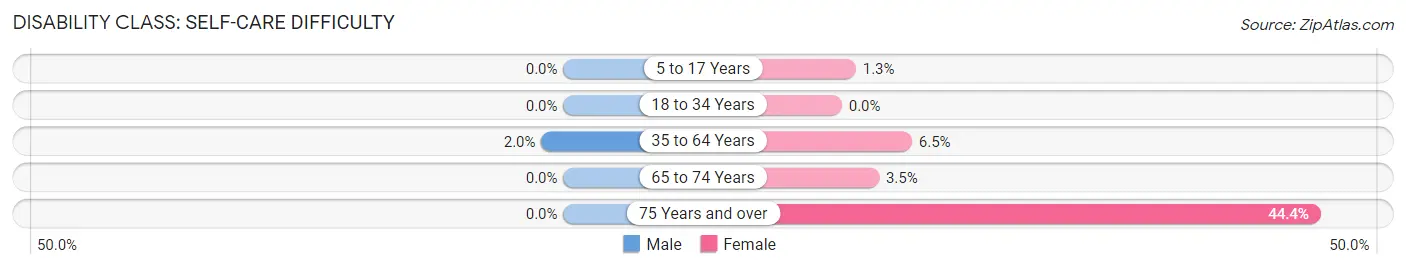
| Age Bracket | Male | Female |
| 5 to 17 Years | 0 (0.0%) | 1 (1.3%) |
| 18 to 34 Years | 0 (0.0%) | 0 (0.0%) |
| 35 to 64 Years | 3 (2.0%) | 8 (6.5%) |
| 65 to 74 Years | 0 (0.0%) | 1 (3.5%) |
| 75 Years and over | 0 (0.0%) | 12 (44.4%) |
Technology Access in South Coffeyville
Computing Device Access in South Coffeyville
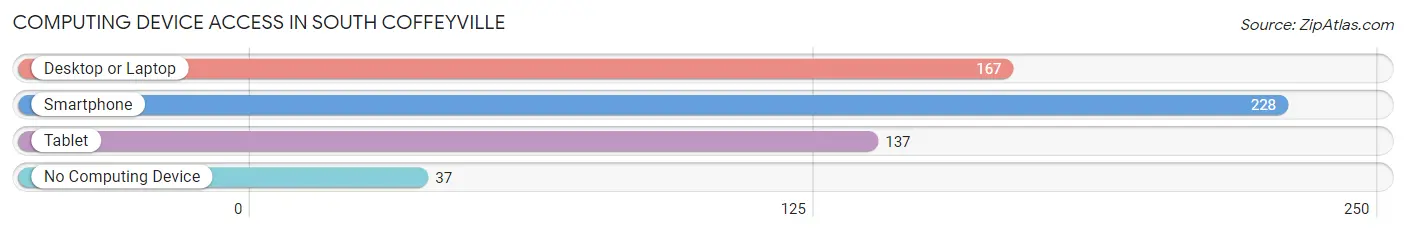
| Device Type | # Households | % Households |
| Desktop or Laptop | 167 | 59.9% |
| Smartphone | 228 | 81.7% |
| Tablet | 137 | 49.1% |
| No Computing Device | 37 | 13.3% |
| Total | 279 | 100.0% |
Internet Access in South Coffeyville
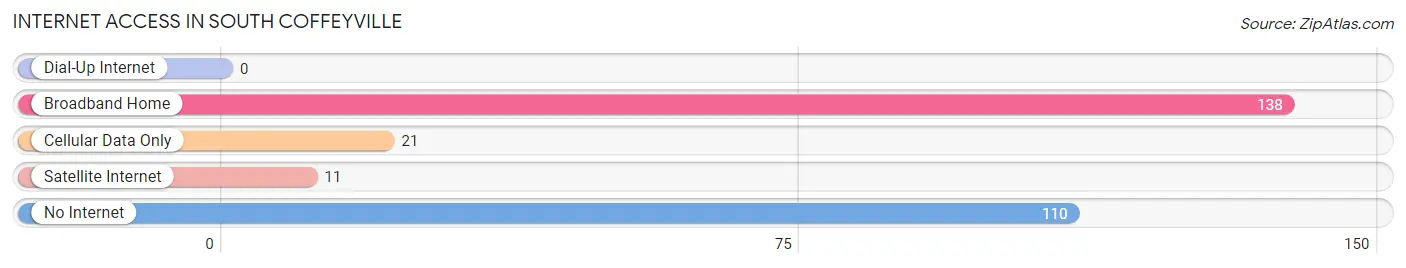
| Internet Type | # Households | % Households |
| Dial-Up Internet | 0 | 0.0% |
| Broadband Home | 138 | 49.5% |
| Cellular Data Only | 21 | 7.5% |
| Satellite Internet | 11 | 3.9% |
| No Internet | 110 | 39.4% |
| Total | 279 | 100.0% |
South Coffeyville Summary
History
The town of South Coffeyville, Oklahoma is located in Nowata County, in the northeastern corner of the state. It is situated on the banks of the Verdigris River, and is part of the Tulsa Metropolitan Statistical Area. The town was founded in 1891, when the Missouri, Kansas and Texas Railway (MKT) built a line through the area. The town was named for the Coffey family, who had settled in the area in the late 1800s.
The town grew rapidly in the early 1900s, and by 1910, it had a population of over 1,000. The town was incorporated in 1911, and the first mayor was elected in 1912. The town was a major center for the oil and gas industry, and by the 1920s, it had become one of the largest oil-producing towns in the state.
In the 1930s, the town was hit hard by the Great Depression, and many of the businesses closed. However, the town was able to recover, and by the 1950s, it had become a major center for the agricultural industry. The town also had a thriving business district, with several stores, restaurants, and other businesses.
Geography
South Coffeyville is located in the northeastern corner of Oklahoma, in Nowata County. It is situated on the banks of the Verdigris River, and is part of the Tulsa Metropolitan Statistical Area. The town is located about 25 miles south of Tulsa, and about 50 miles north of Oklahoma City.
The town has a total area of 1.2 square miles, all of which is land. The town is located in a mostly flat area, with some rolling hills in the surrounding area. The climate is humid subtropical, with hot summers and mild winters.
Economy
The economy of South Coffeyville is largely based on agriculture and oil and gas production. The town is home to several large agricultural operations, including cattle ranches, grain farms, and poultry farms. The town is also home to several oil and gas production companies, which are responsible for much of the town’s economic activity.
In addition to agriculture and oil and gas production, the town also has a thriving business district, with several stores, restaurants, and other businesses. The town is also home to several manufacturing companies, which produce a variety of products, including furniture, clothing, and automotive parts.
Demographics
As of the 2010 census, the town of South Coffeyville had a population of 1,845. The racial makeup of the town was 79.2% White, 15.2% Native American, 0.7% Asian, 0.2% African American, and 4.7% from other races. The median household income was $31,250, and the median family income was $37,500.
The town has a large Native American population, with many members of the Cherokee, Creek, and Osage tribes living in the area. The town also has a large Hispanic population, with many Mexican and Central American immigrants living in the area. The town is also home to a large number of retirees, who have moved to the area for its low cost of living and peaceful atmosphere.
Common Questions
What is Per Capita Income in South Coffeyville?
Per Capita income in South Coffeyville is $28,322.
What is the Median Family Income in South Coffeyville?
Median Family Income in South Coffeyville is $80,278.
What is the Median Household income in South Coffeyville?
Median Household Income in South Coffeyville is $53,750.
What is Income or Wage Gap in South Coffeyville?
Income or Wage Gap in South Coffeyville is 50.5%.
Women in South Coffeyville earn 49.5 cents for every dollar earned by a man.
What is Family Income Deficit in South Coffeyville?
Family Income Deficit in South Coffeyville is $14,257.
Families that are below poverty line in South Coffeyville earn $14,257 less on average than the poverty threshold level.
What is Inequality or Gini Index in South Coffeyville?
Inequality or Gini Index in South Coffeyville is 0.40.
What is the Total Population of South Coffeyville?
Total Population of South Coffeyville is 691.
What is the Total Male Population of South Coffeyville?
Total Male Population of South Coffeyville is 352.
What is the Total Female Population of South Coffeyville?
Total Female Population of South Coffeyville is 339.
What is the Ratio of Males per 100 Females in South Coffeyville?
There are 103.83 Males per 100 Females in South Coffeyville.
What is the Ratio of Females per 100 Males in South Coffeyville?
There are 96.31 Females per 100 Males in South Coffeyville.
What is the Median Population Age in South Coffeyville?
Median Population Age in South Coffeyville is 37.8 Years.
What is the Average Family Size in South Coffeyville
Average Family Size in South Coffeyville is 3.2 People.
What is the Average Household Size in South Coffeyville
Average Household Size in South Coffeyville is 2.5 People.
How Large is the Labor Force in South Coffeyville?
There are 328 People in the Labor Forcein in South Coffeyville.
What is the Percentage of People in the Labor Force in South Coffeyville?
63.4% of People are in the Labor Force in South Coffeyville.
What is the Unemployment Rate in South Coffeyville?
Unemployment Rate in South Coffeyville is 3.7%.