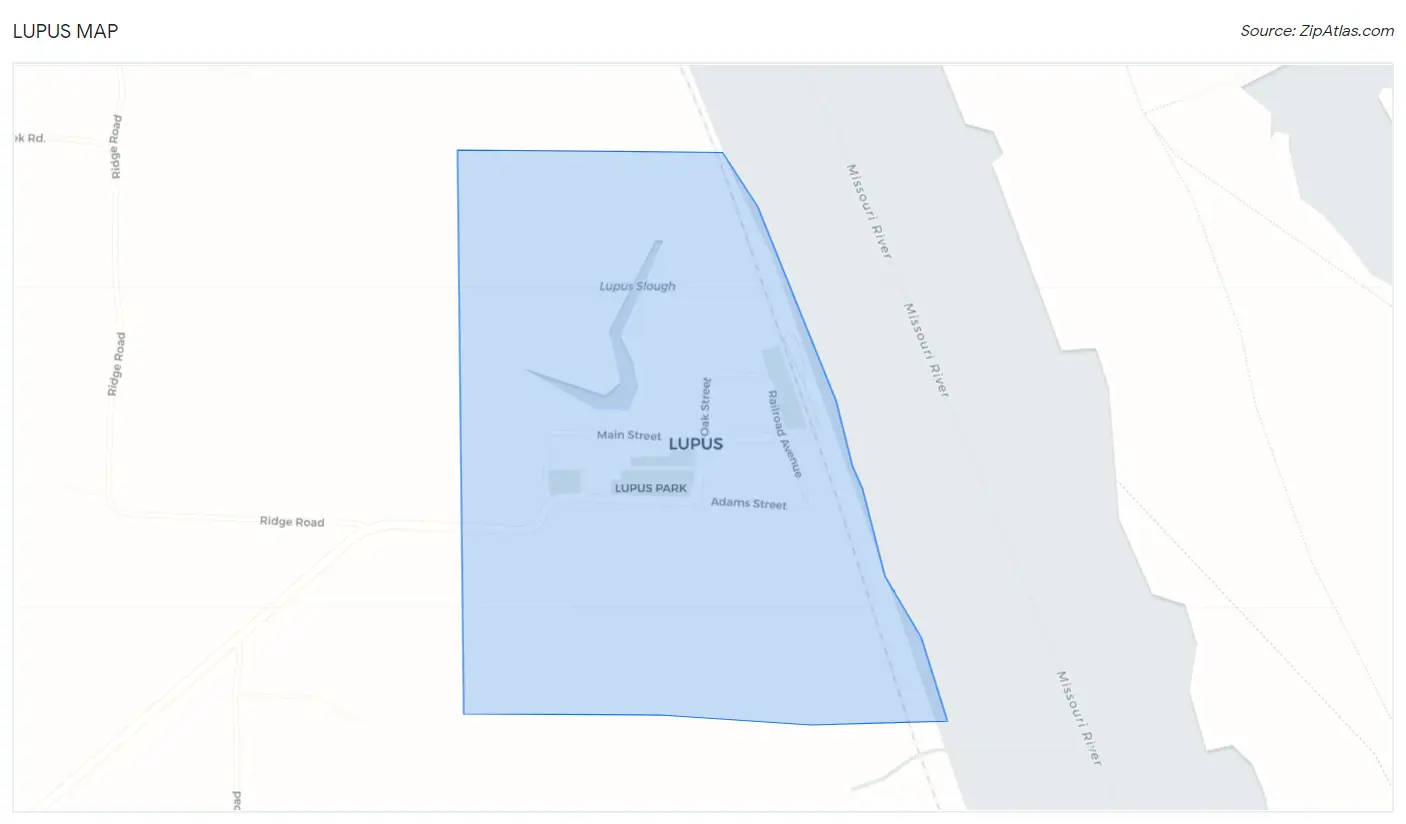
Lupus, MO Map & Demographics
Lupus Map
Lupus Overview
$27,744
PER CAPITA INCOME
$44,375
AVG HOUSEHOLD INCOME
0.29
INEQUALITY / GINI INDEX
27
TOTAL POPULATION
12
MALE POPULATION
15
FEMALE POPULATION
80.00
MALES / 100 FEMALES
125.00
FEMALES / 100 MALES
50.5
MEDIAN AGE
2.7
AVG FAMILY SIZE
1.9
AVG HOUSEHOLD SIZE
10
LABOR FORCE [ PEOPLE ]
41.7%
PERCENT IN LABOR FORCE
Income in Lupus
Income Overview in Lupus
| Characteristic | Number | Measure |
| Per Capita Income | 27 | $27,744 |
| Median Family Income | 6 | $0 |
| Mean Family Income | 6 | $59,700 |
| Median Household Income | 14 | $44,375 |
| Mean Household Income | 14 | $50,550 |
| Income Deficit | 6 | $0 |
| Wage / Income Gap (%) | 27 | 0.00% |
| Wage / Income Gap ($) | 27 | 100.00¢ per $1 |
| Gini / Inequality Index | 27 | 0.29 |
Earnings by Sex in Lupus
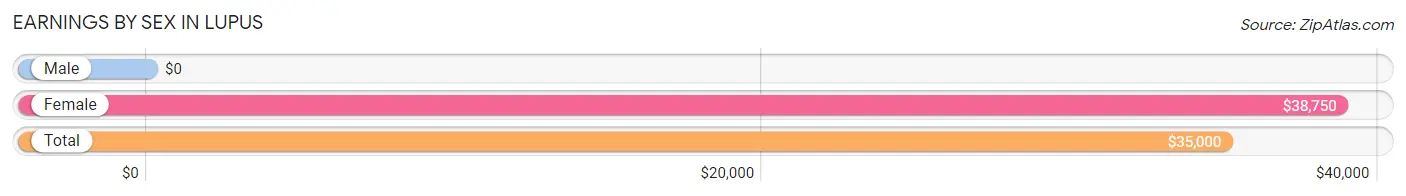
| Sex | Number | Average Earnings |
| Male | 4 (40.0%) | $0 |
| Female | 6 (60.0%) | $38,750 |
| Total | 10 (100.0%) | $35,000 |
Earnings by Sex by Income Bracket in Lupus
The most common earnings brackets in Lupus are $5,000 to $7,499 for men (1 | 25.0%) and $35,000 to $39,999 for women (2 | 33.3%).
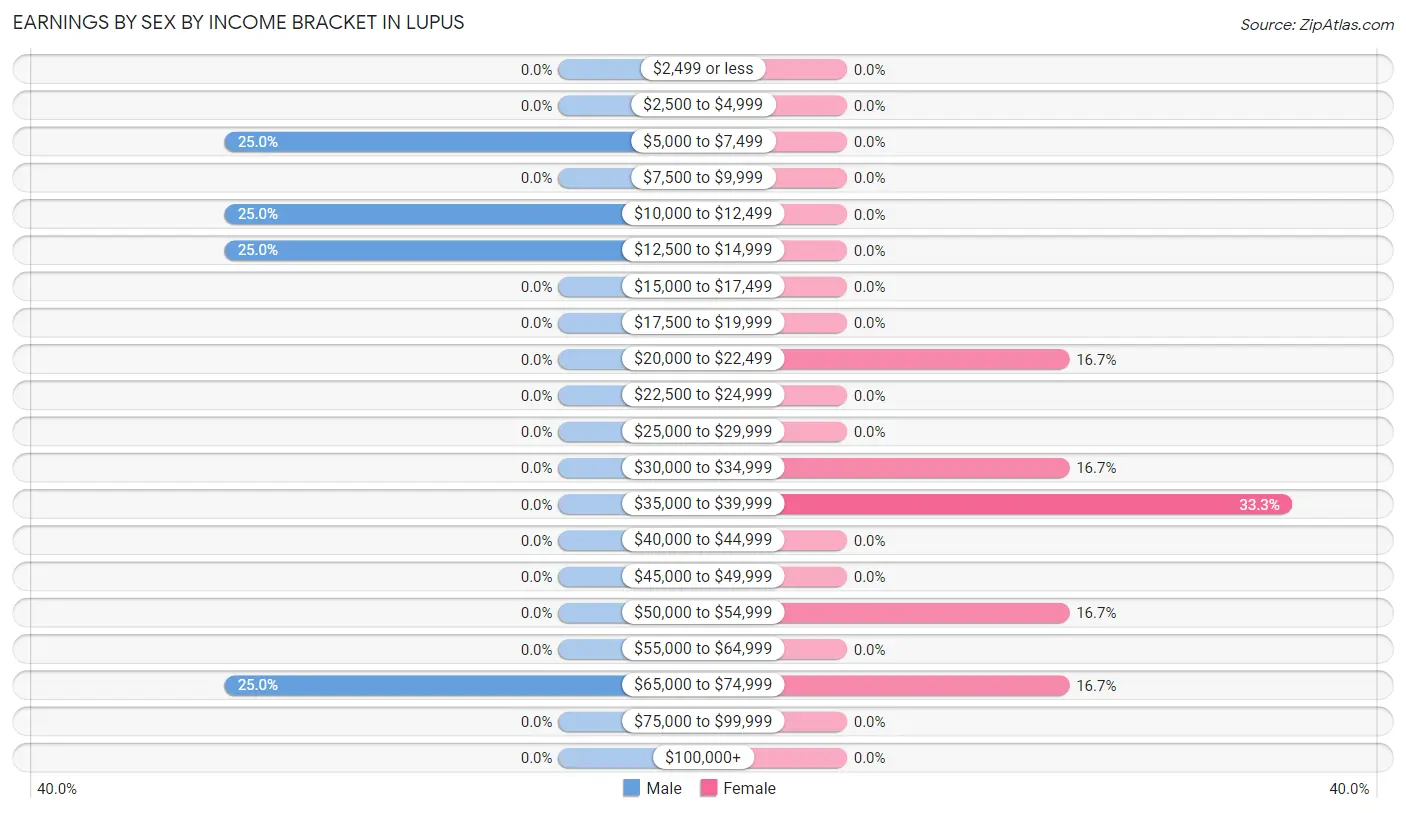
| Income | Male | Female |
| $2,499 or less | 0 (0.0%) | 0 (0.0%) |
| $2,500 to $4,999 | 0 (0.0%) | 0 (0.0%) |
| $5,000 to $7,499 | 1 (25.0%) | 0 (0.0%) |
| $7,500 to $9,999 | 0 (0.0%) | 0 (0.0%) |
| $10,000 to $12,499 | 1 (25.0%) | 0 (0.0%) |
| $12,500 to $14,999 | 1 (25.0%) | 0 (0.0%) |
| $15,000 to $17,499 | 0 (0.0%) | 0 (0.0%) |
| $17,500 to $19,999 | 0 (0.0%) | 0 (0.0%) |
| $20,000 to $22,499 | 0 (0.0%) | 1 (16.7%) |
| $22,500 to $24,999 | 0 (0.0%) | 0 (0.0%) |
| $25,000 to $29,999 | 0 (0.0%) | 0 (0.0%) |
| $30,000 to $34,999 | 0 (0.0%) | 1 (16.7%) |
| $35,000 to $39,999 | 0 (0.0%) | 2 (33.3%) |
| $40,000 to $44,999 | 0 (0.0%) | 0 (0.0%) |
| $45,000 to $49,999 | 0 (0.0%) | 0 (0.0%) |
| $50,000 to $54,999 | 0 (0.0%) | 1 (16.7%) |
| $55,000 to $64,999 | 0 (0.0%) | 0 (0.0%) |
| $65,000 to $74,999 | 1 (25.0%) | 1 (16.7%) |
| $75,000 to $99,999 | 0 (0.0%) | 0 (0.0%) |
| $100,000+ | 0 (0.0%) | 0 (0.0%) |
| Total | 4 (100.0%) | 6 (100.0%) |
Earnings by Sex by Educational Attainment in Lupus
| Educational Attainment | Male Income | Female Income |
| Less than High School | - | - |
| High School Diploma | - | - |
| College or Associate's Degree | - | - |
| Bachelor's Degree | - | - |
| Graduate Degree | - | - |
| Total | - | - |
Family Income in Lupus
Family Income Brackets in Lupus
According to the Lupus family income data, there are 2 families falling into the $35,000 to $49,999 income range, which is the most common income bracket and makes up 33.3% of all families.
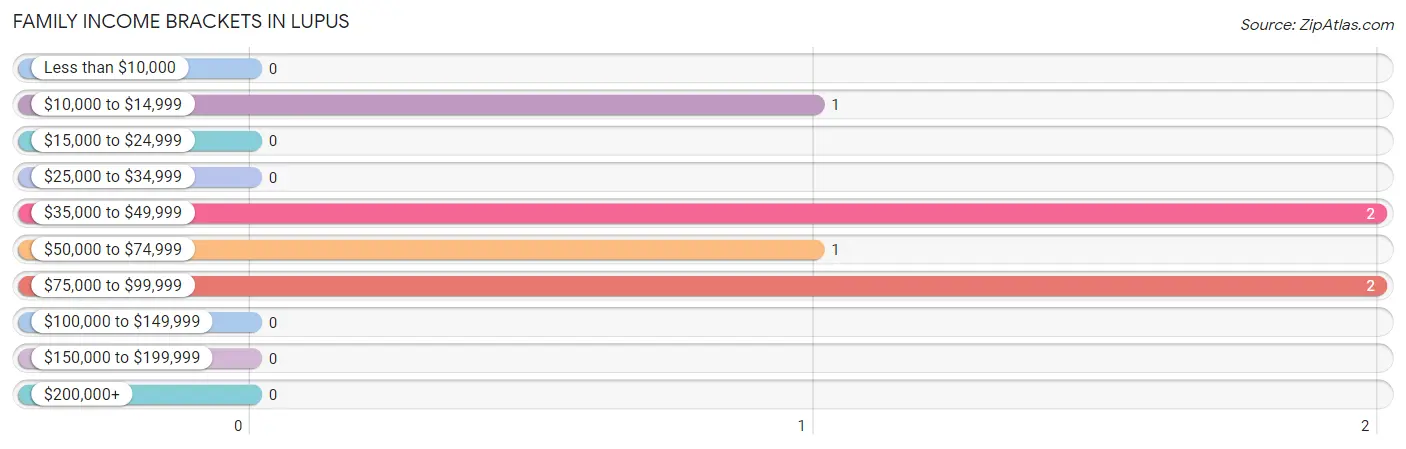
| Income Bracket | # Families | % Families |
| Less than $10,000 | 0 | 0.0% |
| $10,000 to $14,999 | 1 | 16.7% |
| $15,000 to $24,999 | 0 | 0.0% |
| $25,000 to $34,999 | 0 | 0.0% |
| $35,000 to $49,999 | 2 | 33.3% |
| $50,000 to $74,999 | 1 | 16.7% |
| $75,000 to $99,999 | 2 | 33.3% |
| $100,000 to $149,999 | 0 | 0.0% |
| $150,000 to $199,999 | 0 | 0.0% |
| $200,000+ | 0 | 0.0% |
Family Income by Famaliy Size in Lupus
| Income Bracket | # Families | Median Income |
| 2-Person Families | 2 (33.3%) | $0 |
| 3-Person Families | 3 (50.0%) | $0 |
| 4-Person Families | 1 (16.7%) | $0 |
| 5-Person Families | 0 (0.0%) | $0 |
| 6-Person Families | 0 (0.0%) | $0 |
| 7+ Person Families | 0 (0.0%) | $0 |
| Total | 6 (100.0%) | $0 |
Family Income by Number of Earners in Lupus
| Number of Earners | # Families | Median Income |
| No Earners | 2 (33.3%) | $0 |
| 1 Earner | 1 (16.7%) | $0 |
| 2 Earners | 3 (50.0%) | $0 |
| 3+ Earners | 0 (0.0%) | $0 |
| Total | 6 (100.0%) | $0 |
Household Income in Lupus
Household Income Brackets in Lupus
With 5 households falling in the category, the $35,000 to $49,999 income range is the most frequent in Lupus, accounting for 35.7% of all households.
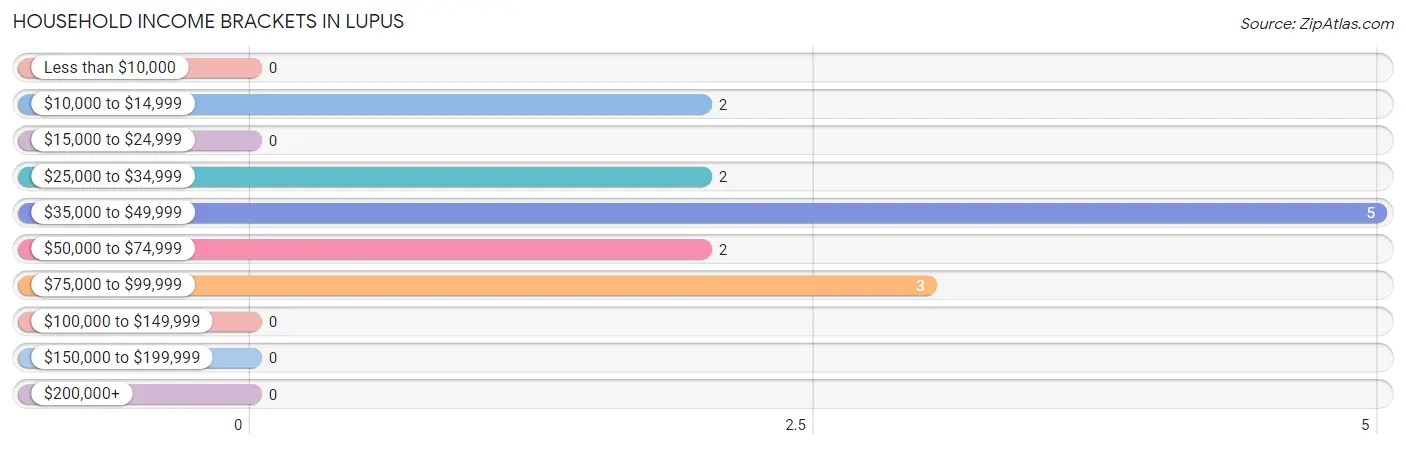
| Income Bracket | # Households | % Households |
| Less than $10,000 | 0 | 0.0% |
| $10,000 to $14,999 | 2 | 14.3% |
| $15,000 to $24,999 | 0 | 0.0% |
| $25,000 to $34,999 | 2 | 14.3% |
| $35,000 to $49,999 | 5 | 35.7% |
| $50,000 to $74,999 | 2 | 14.3% |
| $75,000 to $99,999 | 3 | 21.4% |
| $100,000 to $149,999 | 0 | 0.0% |
| $150,000 to $199,999 | 0 | 0.0% |
| $200,000+ | 0 | 0.0% |
Household Income by Householder Age in Lupus
The median household income in Lupus is $44,375, with the highest median household income of $45,000 found in the 65+ years age bracket for the primary householder. A total of 6 households (42.9%) fall into this category.
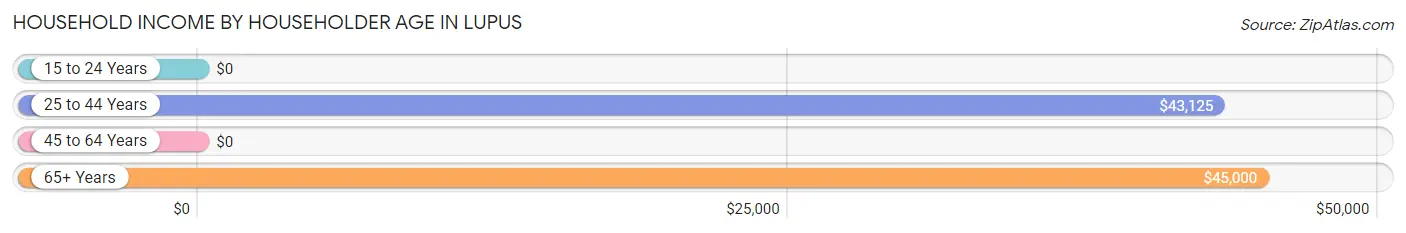
| Income Bracket | # Households | Median Income |
| 15 to 24 Years | 0 (0.0%) | $0 |
| 25 to 44 Years | 5 (35.7%) | $43,125 |
| 45 to 64 Years | 3 (21.4%) | $0 |
| 65+ Years | 6 (42.9%) | $45,000 |
| Total | 14 (100.0%) | $44,375 |
Poverty in Lupus
Income Below Poverty by Sex and Age in Lupus
With 16.7% poverty level for males and 33.3% for females among the residents of Lupus, 25 to 34 year old males and under 5 year old females are the most vulnerable to poverty, with 1 males (50.0%) and 1 females (100.0%) in their respective age groups living below the poverty level.
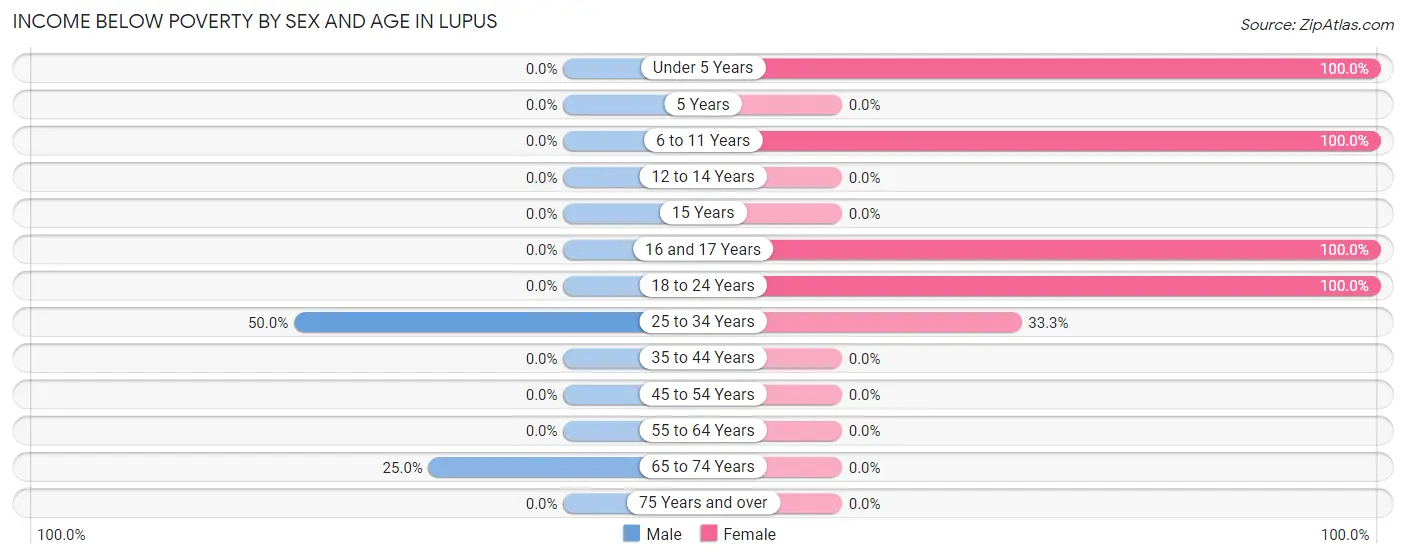
| Age Bracket | Male | Female |
| Under 5 Years | 0 (0.0%) | 1 (100.0%) |
| 5 Years | 0 (0.0%) | 0 (0.0%) |
| 6 to 11 Years | 0 (0.0%) | 1 (100.0%) |
| 12 to 14 Years | 0 (0.0%) | 0 (0.0%) |
| 15 Years | 0 (0.0%) | 0 (0.0%) |
| 16 and 17 Years | 0 (0.0%) | 1 (100.0%) |
| 18 to 24 Years | 0 (0.0%) | 1 (100.0%) |
| 25 to 34 Years | 1 (50.0%) | 1 (33.3%) |
| 35 to 44 Years | 0 (0.0%) | 0 (0.0%) |
| 45 to 54 Years | 0 (0.0%) | 0 (0.0%) |
| 55 to 64 Years | 0 (0.0%) | 0 (0.0%) |
| 65 to 74 Years | 1 (25.0%) | 0 (0.0%) |
| 75 Years and over | 0 (0.0%) | 0 (0.0%) |
| Total | 2 (16.7%) | 5 (33.3%) |
Income Above Poverty by Sex and Age in Lupus
According to the poverty statistics in Lupus, males aged 35 to 44 years and females aged 5 years are the age groups that are most secure financially, with 100.0% of males and 100.0% of females in these age groups living above the poverty line.
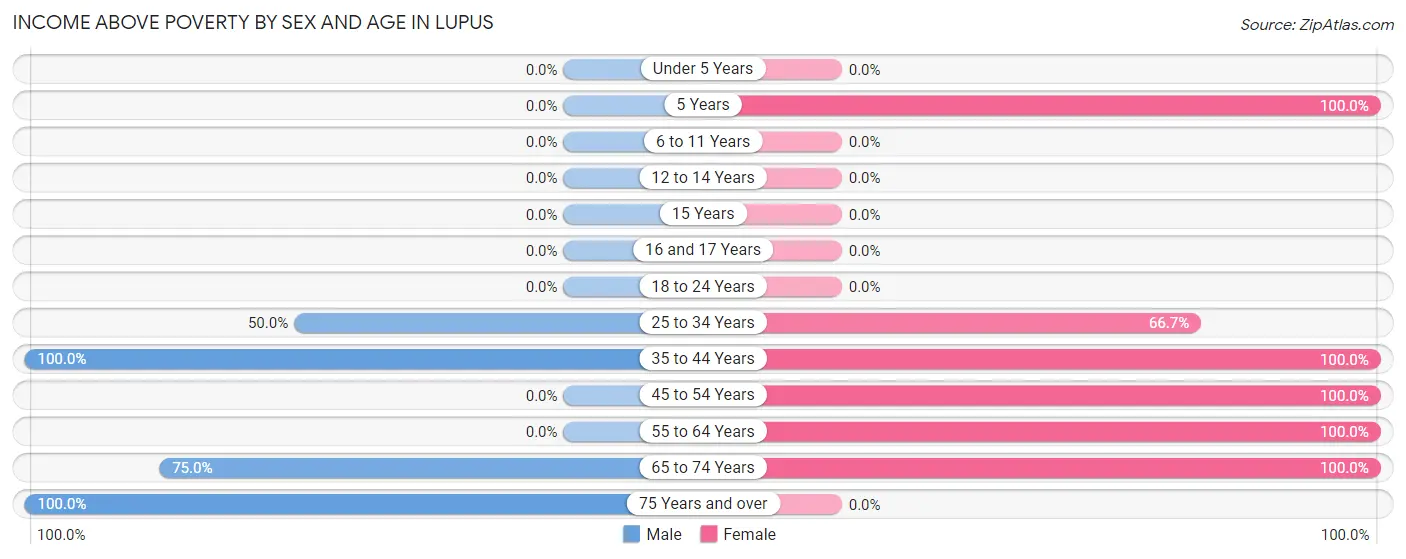
| Age Bracket | Male | Female |
| Under 5 Years | 0 (0.0%) | 0 (0.0%) |
| 5 Years | 0 (0.0%) | 1 (100.0%) |
| 6 to 11 Years | 0 (0.0%) | 0 (0.0%) |
| 12 to 14 Years | 0 (0.0%) | 0 (0.0%) |
| 15 Years | 0 (0.0%) | 0 (0.0%) |
| 16 and 17 Years | 0 (0.0%) | 0 (0.0%) |
| 18 to 24 Years | 0 (0.0%) | 0 (0.0%) |
| 25 to 34 Years | 1 (50.0%) | 2 (66.7%) |
| 35 to 44 Years | 2 (100.0%) | 1 (100.0%) |
| 45 to 54 Years | 0 (0.0%) | 1 (100.0%) |
| 55 to 64 Years | 0 (0.0%) | 3 (100.0%) |
| 65 to 74 Years | 3 (75.0%) | 2 (100.0%) |
| 75 Years and over | 4 (100.0%) | 0 (0.0%) |
| Total | 10 (83.3%) | 10 (66.7%) |
Income Below Poverty Among Married-Couple Families in Lupus
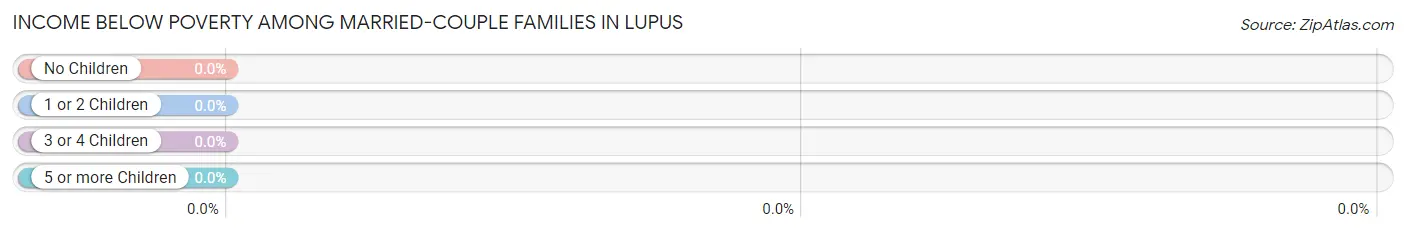
| Children | Above Poverty | Below Poverty |
| No Children | 3 (100.0%) | 0 (0.0%) |
| 1 or 2 Children | 2 (100.0%) | 0 (0.0%) |
| 3 or 4 Children | 0 (0.0%) | 0 (0.0%) |
| 5 or more Children | 0 (0.0%) | 0 (0.0%) |
| Total | 5 (100.0%) | 0 (0.0%) |
Income Below Poverty Among Single-Parent Households in Lupus
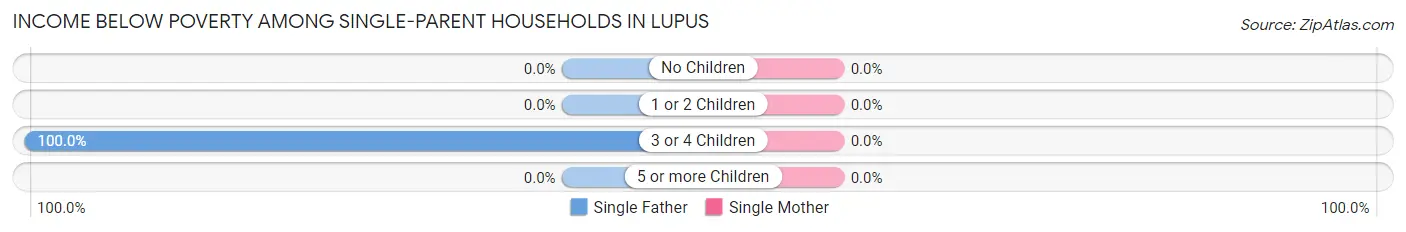
| Children | Single Father | Single Mother |
| No Children | 0 (0.0%) | 0 (0.0%) |
| 1 or 2 Children | 0 (0.0%) | 0 (0.0%) |
| 3 or 4 Children | 1 (100.0%) | 0 (0.0%) |
| 5 or more Children | 0 (0.0%) | 0 (0.0%) |
| Total | 1 (100.0%) | 0 (0.0%) |
Income Below Poverty Among Married-Couple vs Single-Parent Households in Lupus
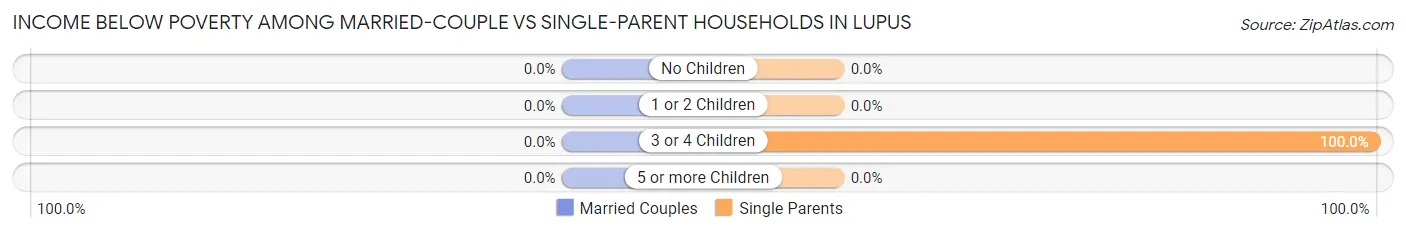
| Children | Married-Couple Families | Single-Parent Households |
| No Children | 0 (0.0%) | 0 (0.0%) |
| 1 or 2 Children | 0 (0.0%) | 0 (0.0%) |
| 3 or 4 Children | 0 (0.0%) | 1 (100.0%) |
| 5 or more Children | 0 (0.0%) | 0 (0.0%) |
| Total | 0 (0.0%) | 1 (100.0%) |
Race in Lupus
The most populous races in Lupus are White / Caucasian (25 | 92.6%), and Two or more Races (2 | 7.4%).
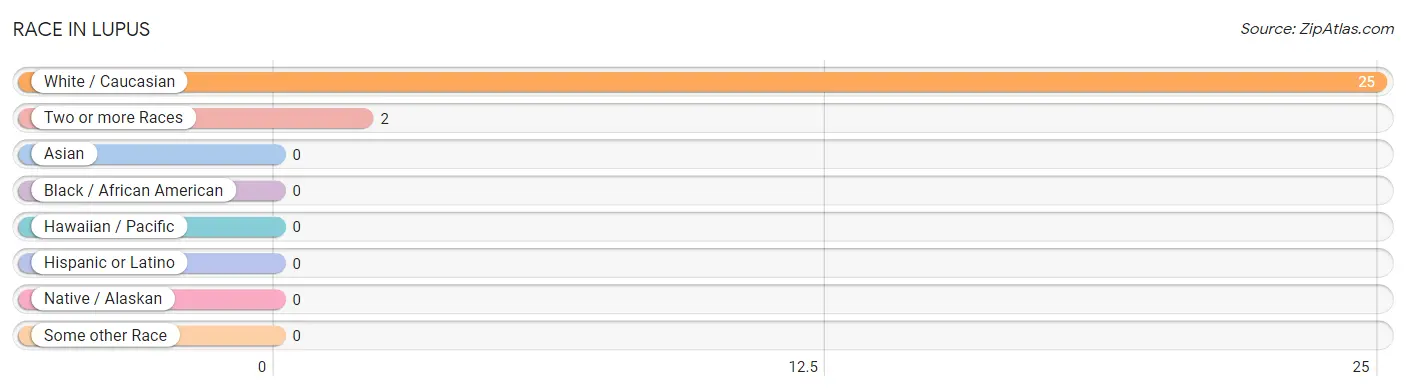
| Race | # Population | % Population |
| Asian | 0 | 0.0% |
| Black / African American | 0 | 0.0% |
| Hawaiian / Pacific | 0 | 0.0% |
| Hispanic or Latino | 0 | 0.0% |
| Native / Alaskan | 0 | 0.0% |
| White / Caucasian | 25 | 92.6% |
| Two or more Races | 2 | 7.4% |
| Some other Race | 0 | 0.0% |
| Total | 27 | 100.0% |
Ancestry in Lupus
The most populous ancestries reported in Lupus are English (9 | 33.3%), Irish (7 | 25.9%), American (4 | 14.8%), German (3 | 11.1%), and Scotch-Irish (3 | 11.1%), together accounting for 96.3% of all Lupus residents.
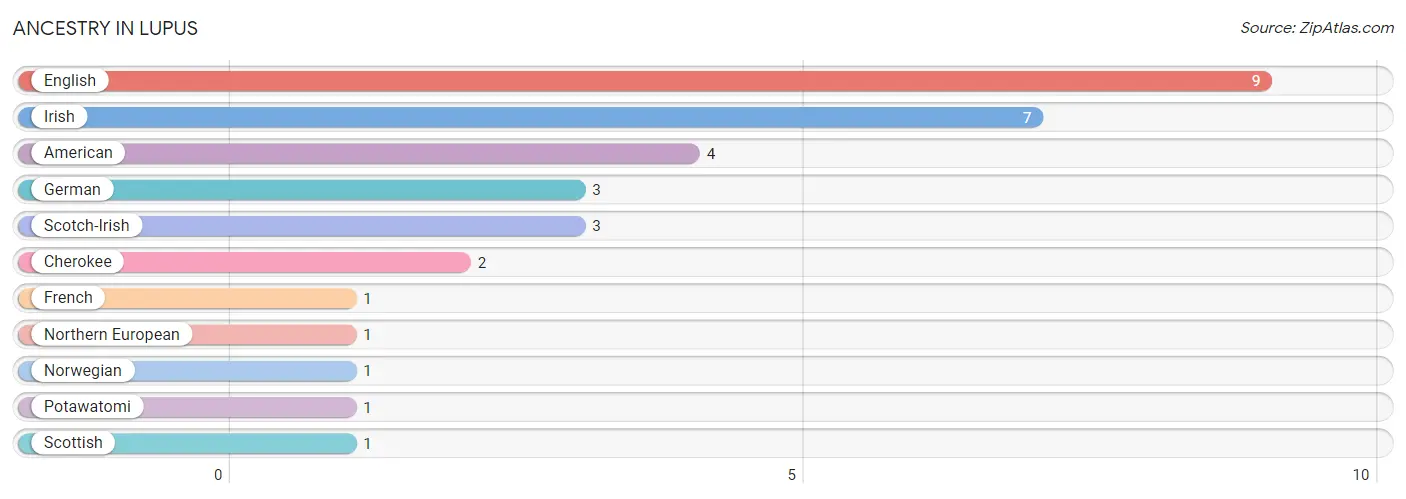
| Ancestry | # Population | % Population |
| American | 4 | 14.8% |
| Cherokee | 2 | 7.4% |
| English | 9 | 33.3% |
| French | 1 | 3.7% |
| German | 3 | 11.1% |
| Irish | 7 | 25.9% |
| Northern European | 1 | 3.7% |
| Norwegian | 1 | 3.7% |
| Potawatomi | 1 | 3.7% |
| Scotch-Irish | 3 | 11.1% |
| Scottish | 1 | 3.7% | View All 11 Rows |
Immigrants in Lupus

| Immigration Origin | # Population | % Population | View All 0 Rows |
Sex and Age in Lupus
Sex and Age in Lupus
The most populous age groups in Lupus are 75 to 79 Years (4 | 33.3%) for men and 30 to 34 Years (3 | 20.0%) for women.
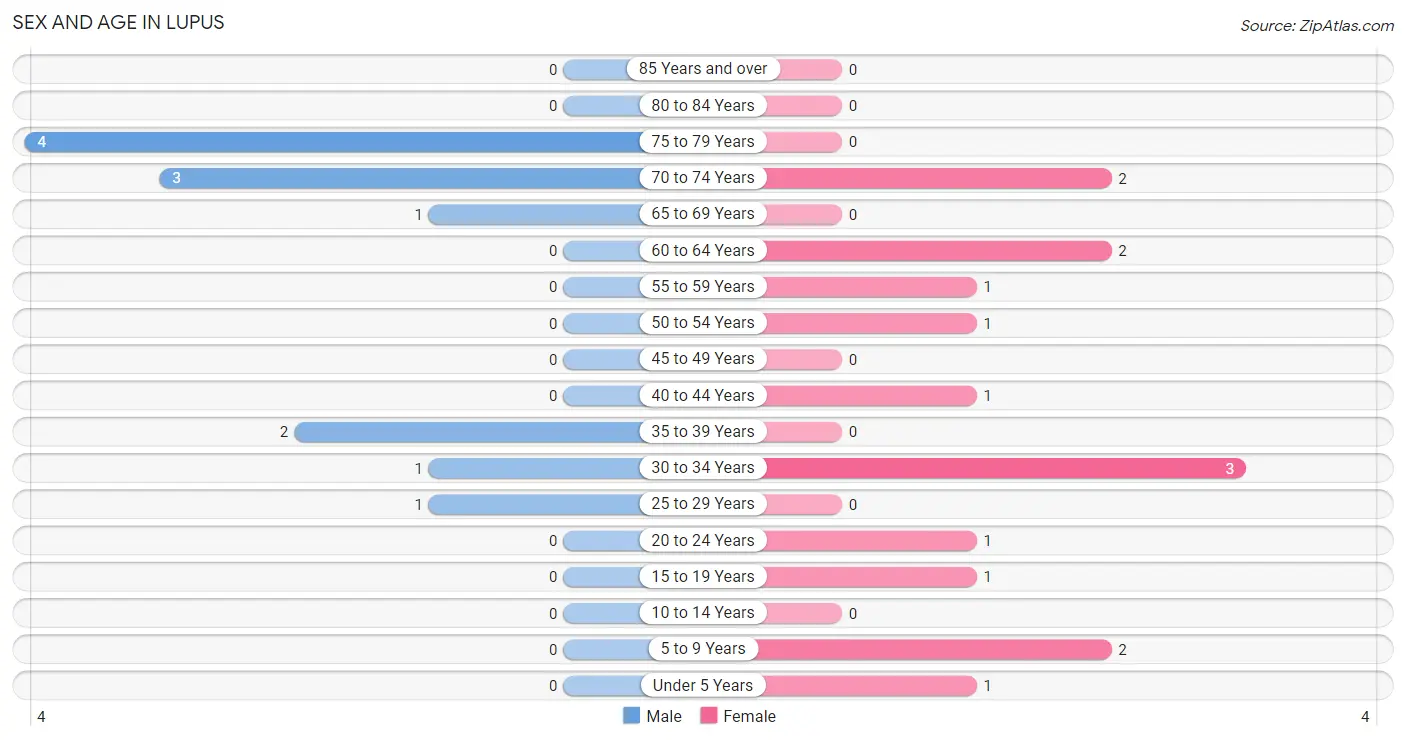
| Age Bracket | Male | Female |
| Under 5 Years | 0 (0.0%) | 1 (6.7%) |
| 5 to 9 Years | 0 (0.0%) | 2 (13.3%) |
| 10 to 14 Years | 0 (0.0%) | 0 (0.0%) |
| 15 to 19 Years | 0 (0.0%) | 1 (6.7%) |
| 20 to 24 Years | 0 (0.0%) | 1 (6.7%) |
| 25 to 29 Years | 1 (8.3%) | 0 (0.0%) |
| 30 to 34 Years | 1 (8.3%) | 3 (20.0%) |
| 35 to 39 Years | 2 (16.7%) | 0 (0.0%) |
| 40 to 44 Years | 0 (0.0%) | 1 (6.7%) |
| 45 to 49 Years | 0 (0.0%) | 0 (0.0%) |
| 50 to 54 Years | 0 (0.0%) | 1 (6.7%) |
| 55 to 59 Years | 0 (0.0%) | 1 (6.7%) |
| 60 to 64 Years | 0 (0.0%) | 2 (13.3%) |
| 65 to 69 Years | 1 (8.3%) | 0 (0.0%) |
| 70 to 74 Years | 3 (25.0%) | 2 (13.3%) |
| 75 to 79 Years | 4 (33.3%) | 0 (0.0%) |
| 80 to 84 Years | 0 (0.0%) | 0 (0.0%) |
| 85 Years and over | 0 (0.0%) | 0 (0.0%) |
| Total | 12 (100.0%) | 15 (100.0%) |
Families and Households in Lupus
Median Family Size in Lupus
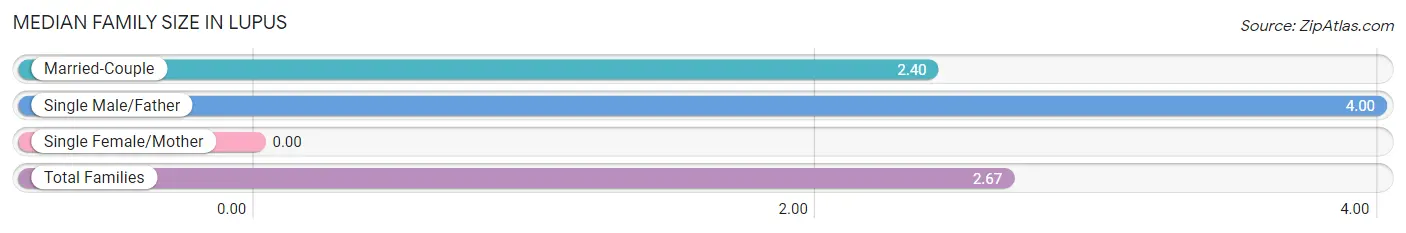
| Family Type | # Families | Family Size |
| Married-Couple | 5 (83.3%) | 2.40 |
| Single Male/Father | 1 (16.7%) | 4.00 |
| Single Female/Mother | 0 (0.0%) | - |
| Total Families | 6 (100.0%) | 2.67 |
Median Household Size in Lupus
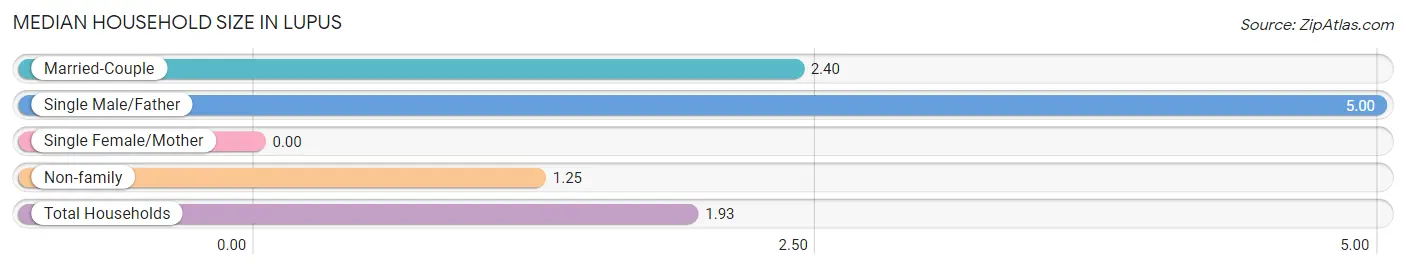
| Household Type | # Households | Household Size |
| Married-Couple | 5 (35.7%) | 2.40 |
| Single Male/Father | 1 (7.1%) | 5.00 |
| Single Female/Mother | 0 (0.0%) | - |
| Non-family | 8 (57.1%) | 1.25 |
| Total Households | 14 (100.0%) | 1.93 |
Household Size by Marriage Status in Lupus
Out of a total of 14 households in Lupus, 6 (42.9%) are family households, while 8 (57.1%) are nonfamily households. The most numerous type of family households are 3-person households, comprising 3, and the most common type of nonfamily households are 1-person households, comprising 7.
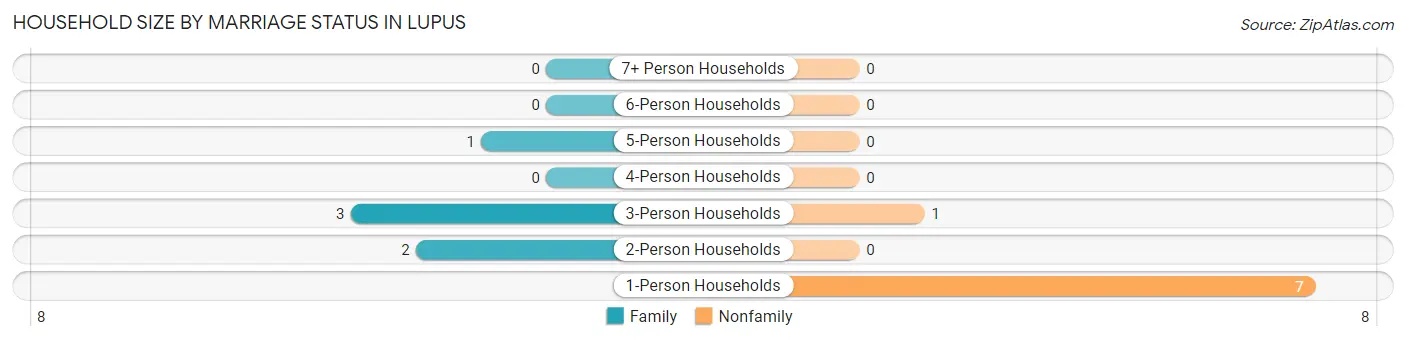
| Household Size | Family Households | Nonfamily Households |
| 1-Person Households | - | 7 (50.0%) |
| 2-Person Households | 2 (14.3%) | 0 (0.0%) |
| 3-Person Households | 3 (21.4%) | 1 (7.1%) |
| 4-Person Households | 0 (0.0%) | 0 (0.0%) |
| 5-Person Households | 1 (7.1%) | 0 (0.0%) |
| 6-Person Households | 0 (0.0%) | 0 (0.0%) |
| 7+ Person Households | 0 (0.0%) | 0 (0.0%) |
| Total | 6 (42.9%) | 8 (57.1%) |
Female Fertility in Lupus
Fertility by Age in Lupus
Average fertility rate in Lupus is 143.0 births per 1,000 women. Women in the age bracket of 20 to 34 years have the highest fertility rate with 250.0 births per 1,000 women. Women in the age bracket of 20 to 34 years acount for 100.0% of all women with births.
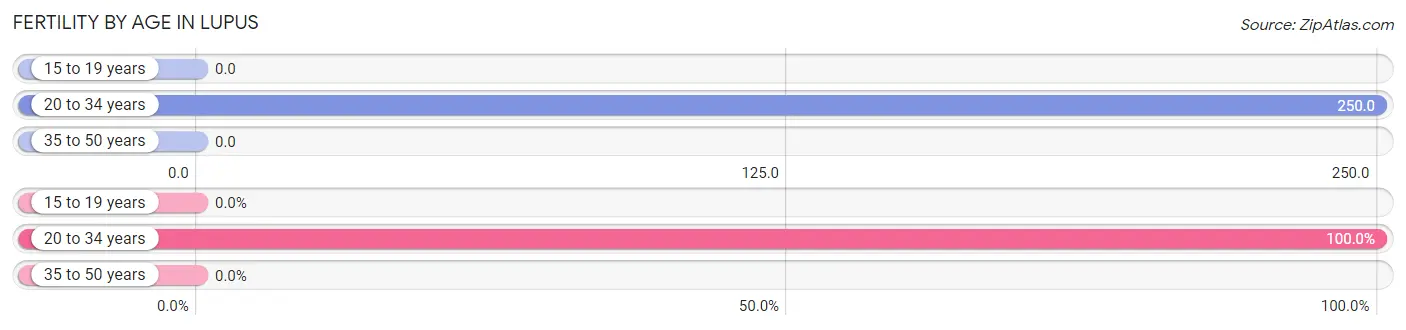
| Age Bracket | Women with Births | Births / 1,000 Women |
| 15 to 19 years | 0 (0.0%) | 0.0 |
| 20 to 34 years | 1 (100.0%) | 250.0 |
| 35 to 50 years | 0 (0.0%) | 0.0 |
| Total | 1 (100.0%) | 143.0 |
Fertility by Age by Marriage Status in Lupus
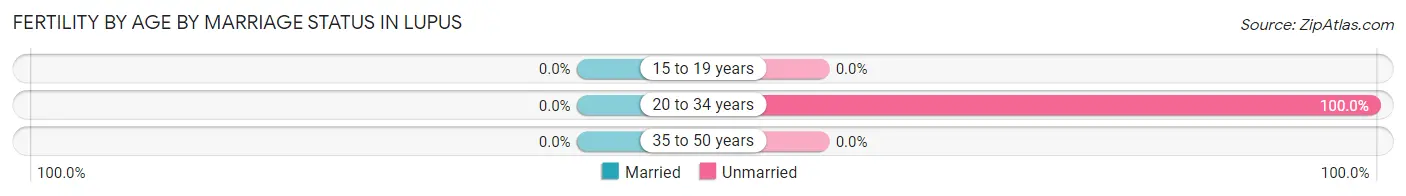
| Age Bracket | Married | Unmarried |
| 15 to 19 years | 0 (0.0%) | 0 (0.0%) |
| 20 to 34 years | 0 (0.0%) | 1 (100.0%) |
| 35 to 50 years | 0 (0.0%) | 0 (0.0%) |
| Total | 0 (0.0%) | 1 (100.0%) |
Fertility by Education in Lupus
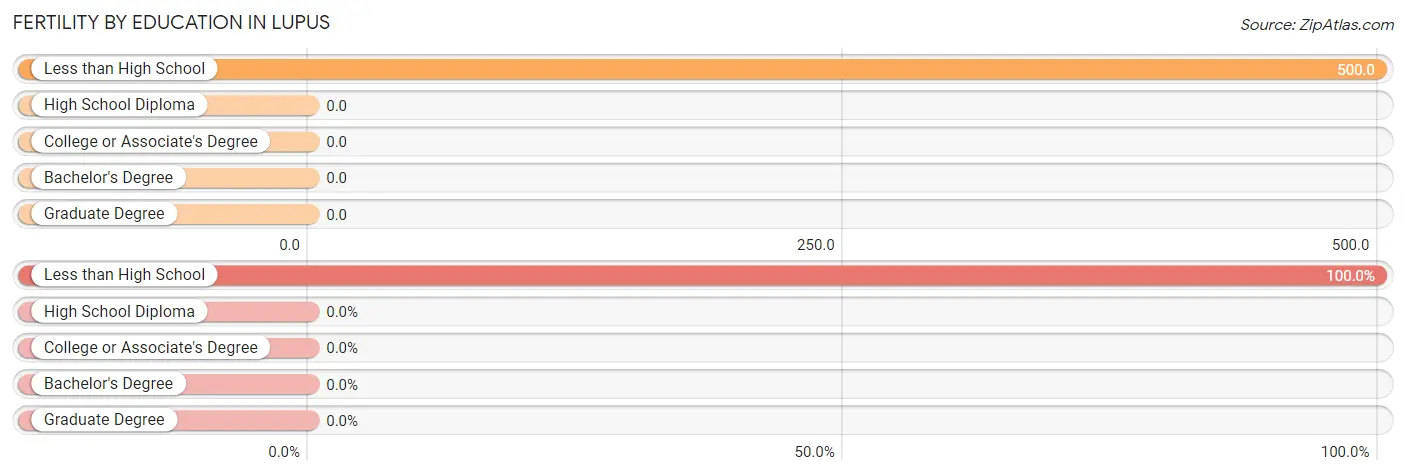
| Educational Attainment | Women with Births | Births / 1,000 Women |
| Less than High School | 1 (100.0%) | 500.0 |
| High School Diploma | 0 (0.0%) | 0.0 |
| College or Associate's Degree | 0 (0.0%) | 0.0 |
| Bachelor's Degree | 0 (0.0%) | 0.0 |
| Graduate Degree | 0 (0.0%) | 0.0 |
| Total | 1 (100.0%) | 143.0 |
Fertility by Education by Marriage Status in Lupus
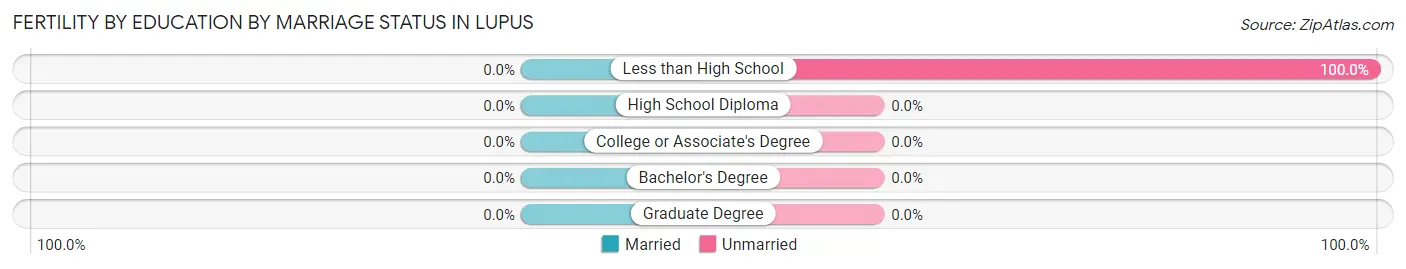
| Educational Attainment | Married | Unmarried |
| Less than High School | 0 (0.0%) | 1 (100.0%) |
| High School Diploma | 0 (0.0%) | 0 (0.0%) |
| College or Associate's Degree | 0 (0.0%) | 0 (0.0%) |
| Bachelor's Degree | 0 (0.0%) | 0 (0.0%) |
| Graduate Degree | 0 (0.0%) | 0 (0.0%) |
| Total | 0 (0.0%) | 1 (100.0%) |
Employment Characteristics in Lupus
Employment by Class of Employer in Lupus
Among the 10 employed individuals in Lupus, private company employees (3 | 30.0%), state government employees (3 | 30.0%), and self-employed (not incorporated) (2 | 20.0%) make up the most common classes of employment.
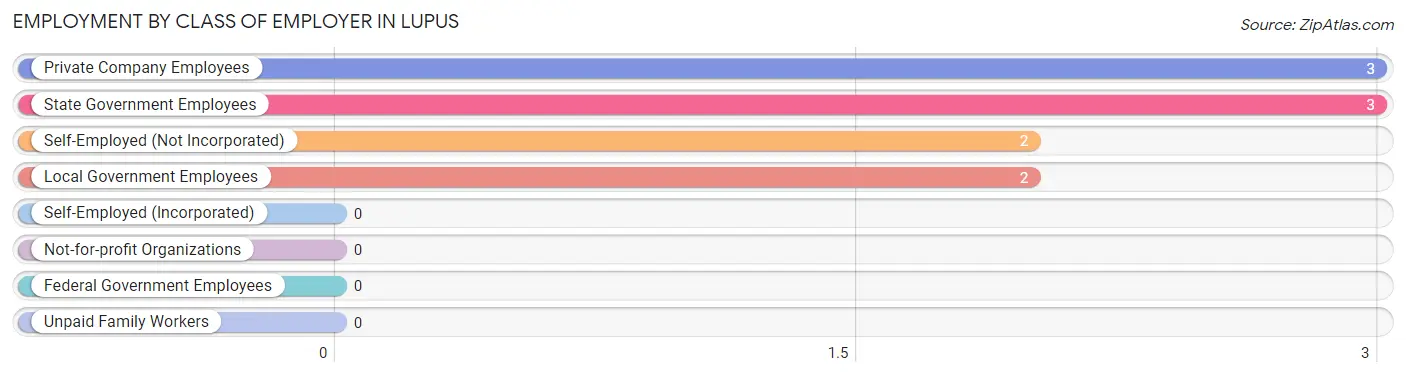
| Employer Class | # Employees | % Employees |
| Private Company Employees | 3 | 30.0% |
| Self-Employed (Incorporated) | 0 | 0.0% |
| Self-Employed (Not Incorporated) | 2 | 20.0% |
| Not-for-profit Organizations | 0 | 0.0% |
| Local Government Employees | 2 | 20.0% |
| State Government Employees | 3 | 30.0% |
| Federal Government Employees | 0 | 0.0% |
| Unpaid Family Workers | 0 | 0.0% |
| Total | 10 | 100.0% |
Employment Status by Age in Lupus
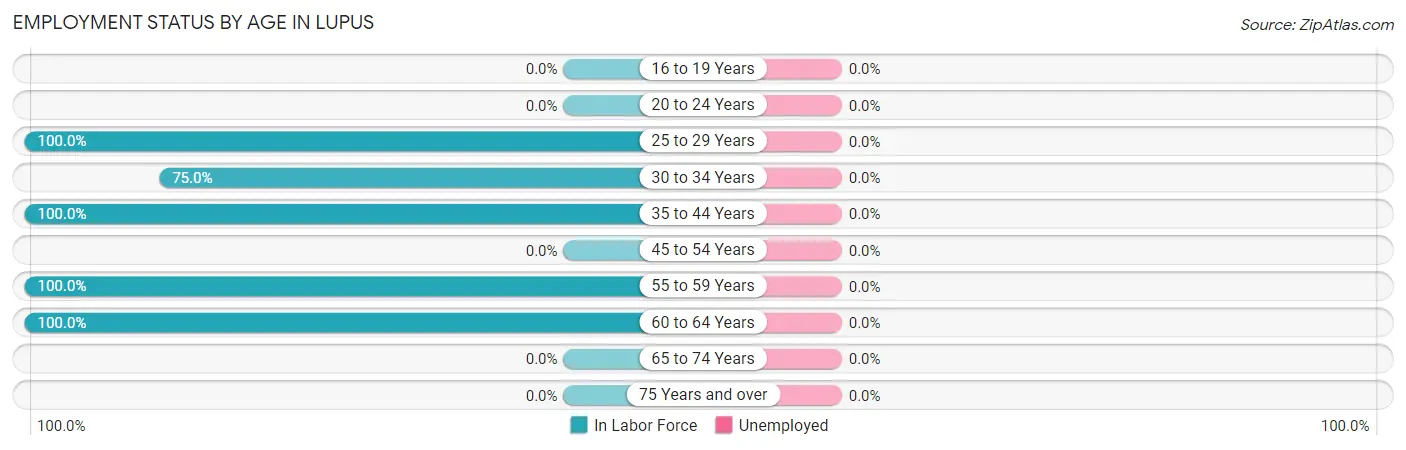
| Age Bracket | In Labor Force | Unemployed |
| 16 to 19 Years | 0 (0.0%) | 0 (0.0%) |
| 20 to 24 Years | 0 (0.0%) | 0 (0.0%) |
| 25 to 29 Years | 1 (100.0%) | 0 (0.0%) |
| 30 to 34 Years | 3 (75.0%) | 0 (0.0%) |
| 35 to 44 Years | 3 (100.0%) | 0 (0.0%) |
| 45 to 54 Years | 0 (0.0%) | 0 (0.0%) |
| 55 to 59 Years | 1 (100.0%) | 0 (0.0%) |
| 60 to 64 Years | 2 (100.0%) | 0 (0.0%) |
| 65 to 74 Years | 0 (0.0%) | 0 (0.0%) |
| 75 Years and over | 0 (0.0%) | 0 (0.0%) |
| Total | 10 (41.7%) | 0 (0.0%) |
Employment Status by Educational Attainment in Lupus
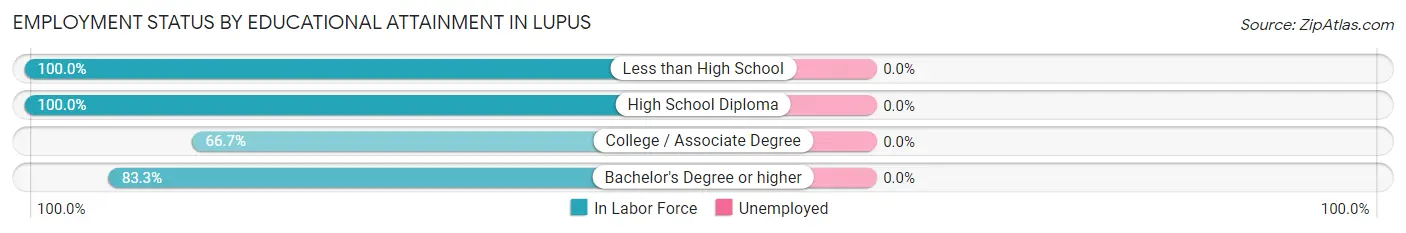
| Educational Attainment | In Labor Force | Unemployed |
| Less than High School | 1 (100.0%) | 0 (0.0%) |
| High School Diploma | 2 (100.0%) | 0 (0.0%) |
| College / Associate Degree | 2 (66.7%) | 0 (0.0%) |
| Bachelor's Degree or higher | 5 (83.3%) | 0 (0.0%) |
| Total | 10 (83.3%) | 0 (0.0%) |
Employment Occupations by Sex in Lupus
Management, Business, Science and Arts Occupations
The most common Management, Business, Science and Arts occupations in Lupus are Computers, Engineering & Science (3 | 30.0%), Architecture & Engineering (2 | 20.0%), Life, Physical & Social Science (1 | 10.0%), Community & Social Service (1 | 10.0%), and Education Instruction & Library (1 | 10.0%).
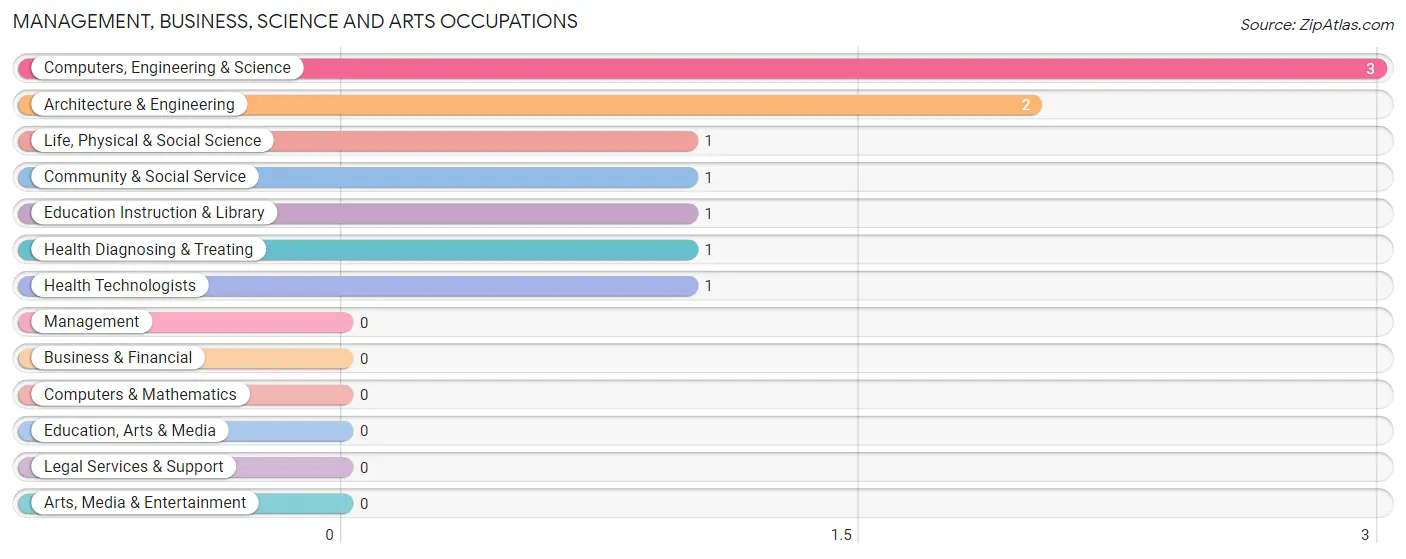
Management, Business, Science and Arts Occupations by Sex
Within the Management, Business, Science and Arts occupations in Lupus, the most male-oriented occupations are Community & Social Service (100.0%), Education Instruction & Library (100.0%), and Architecture & Engineering (50.0%), while the most female-oriented occupations are Life, Physical & Social Science (100.0%), Health Diagnosing & Treating (100.0%), and Health Technologists (100.0%).
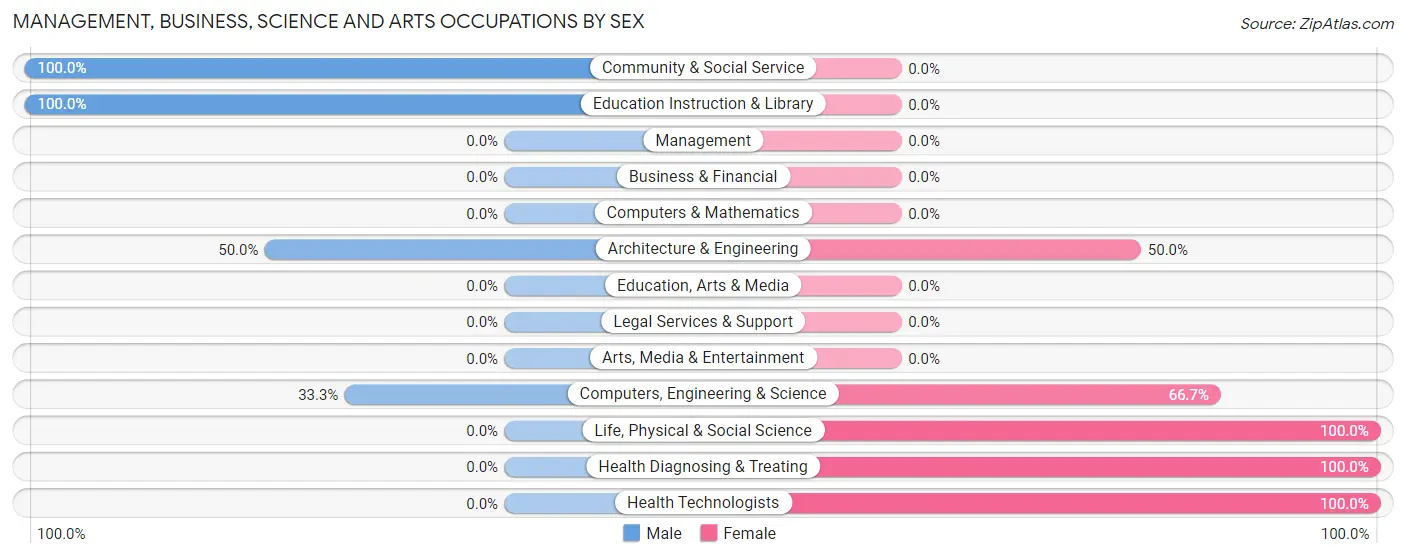
| Occupation | Male | Female |
| Management | 0 (0.0%) | 0 (0.0%) |
| Business & Financial | 0 (0.0%) | 0 (0.0%) |
| Computers, Engineering & Science | 1 (33.3%) | 2 (66.7%) |
| Computers & Mathematics | 0 (0.0%) | 0 (0.0%) |
| Architecture & Engineering | 1 (50.0%) | 1 (50.0%) |
| Life, Physical & Social Science | 0 (0.0%) | 1 (100.0%) |
| Community & Social Service | 1 (100.0%) | 0 (0.0%) |
| Education, Arts & Media | 0 (0.0%) | 0 (0.0%) |
| Legal Services & Support | 0 (0.0%) | 0 (0.0%) |
| Education Instruction & Library | 1 (100.0%) | 0 (0.0%) |
| Arts, Media & Entertainment | 0 (0.0%) | 0 (0.0%) |
| Health Diagnosing & Treating | 0 (0.0%) | 1 (100.0%) |
| Health Technologists | 0 (0.0%) | 1 (100.0%) |
| Total (Category) | 2 (40.0%) | 3 (60.0%) |
| Total (Overall) | 4 (40.0%) | 6 (60.0%) |
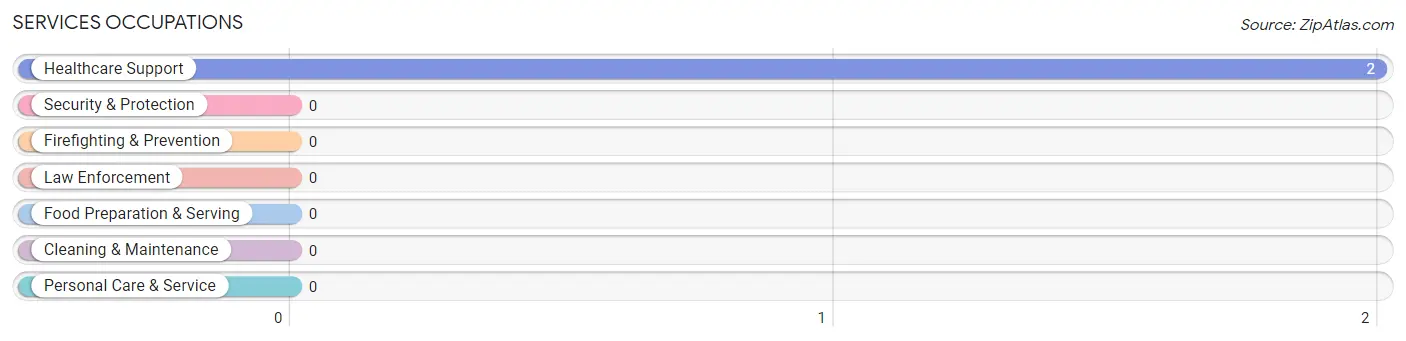
Services Occupations
The most common Services occupations in Lupus are , and Healthcare Support (2 | 20.0%).
Services Occupations by Sex
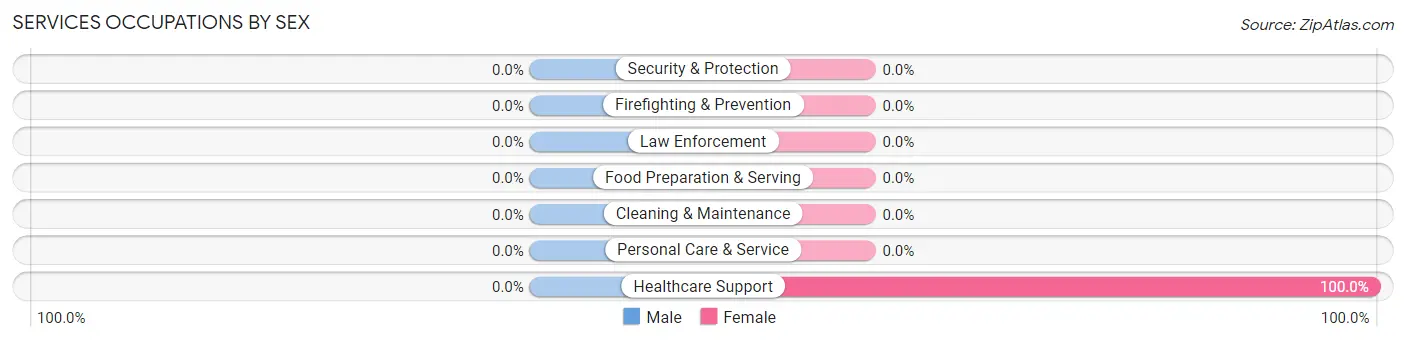
| Occupation | Male | Female |
| Healthcare Support | 0 (0.0%) | 2 (100.0%) |
| Security & Protection | 0 (0.0%) | 0 (0.0%) |
| Firefighting & Prevention | 0 (0.0%) | 0 (0.0%) |
| Law Enforcement | 0 (0.0%) | 0 (0.0%) |
| Food Preparation & Serving | 0 (0.0%) | 0 (0.0%) |
| Cleaning & Maintenance | 0 (0.0%) | 0 (0.0%) |
| Personal Care & Service | 0 (0.0%) | 0 (0.0%) |
| Total (Category) | 0 (0.0%) | 2 (100.0%) |
| Total (Overall) | 4 (40.0%) | 6 (60.0%) |
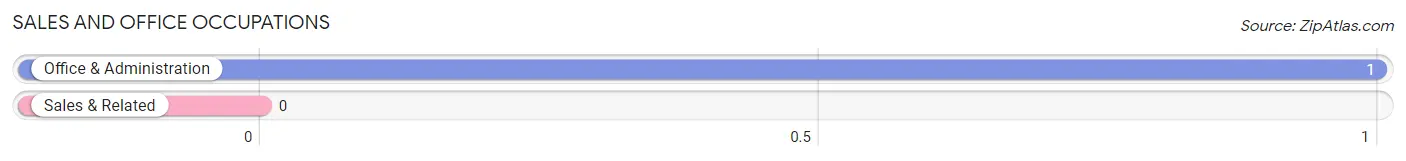
Sales and Office Occupations
The most common Sales and Office occupations in Lupus are , and Office & Administration (1 | 10.0%).
Sales and Office Occupations by Sex
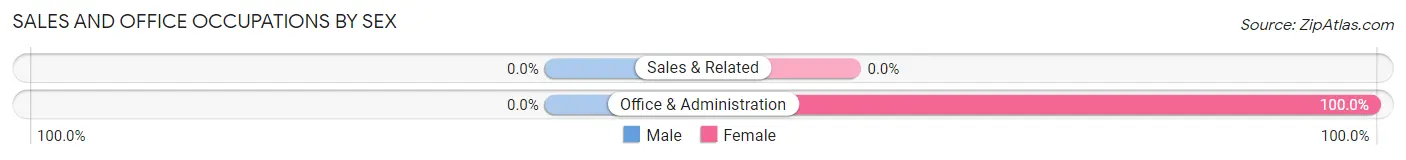
| Occupation | Male | Female |
| Sales & Related | 0 (0.0%) | 0 (0.0%) |
| Office & Administration | 0 (0.0%) | 1 (100.0%) |
| Total (Category) | 0 (0.0%) | 1 (100.0%) |
| Total (Overall) | 4 (40.0%) | 6 (60.0%) |
Natural Resources, Construction and Maintenance Occupations
The most common Natural Resources, Construction and Maintenance occupations in Lupus are , and Construction & Extraction (1 | 10.0%).
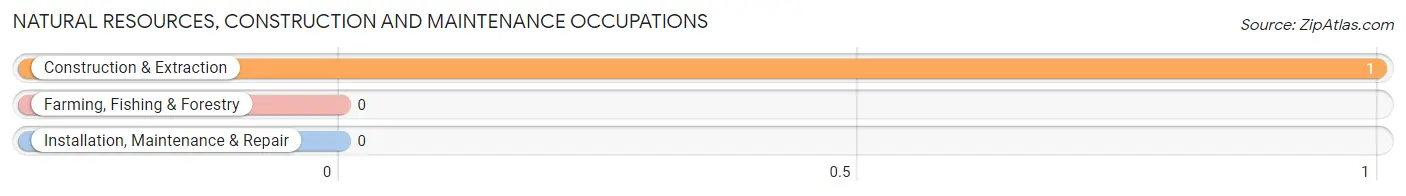
Natural Resources, Construction and Maintenance Occupations by Sex
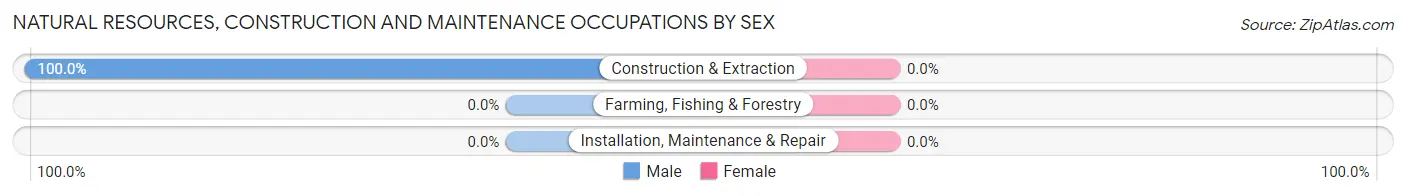
| Occupation | Male | Female |
| Farming, Fishing & Forestry | 0 (0.0%) | 0 (0.0%) |
| Construction & Extraction | 1 (100.0%) | 0 (0.0%) |
| Installation, Maintenance & Repair | 0 (0.0%) | 0 (0.0%) |
| Total (Category) | 1 (100.0%) | 0 (0.0%) |
| Total (Overall) | 4 (40.0%) | 6 (60.0%) |
Production, Transportation and Moving Occupations
The most common Production, Transportation and Moving occupations in Lupus are , and Production (1 | 10.0%).
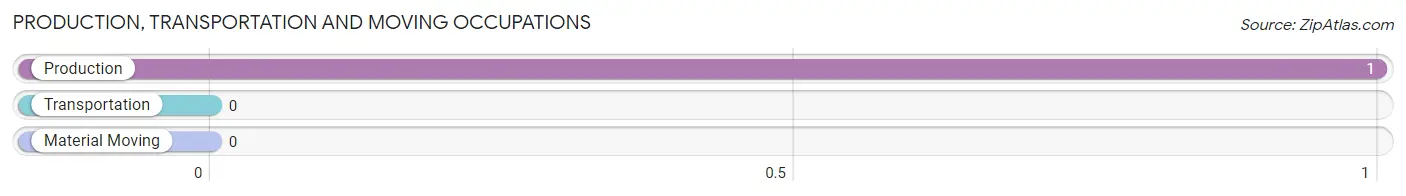
Production, Transportation and Moving Occupations by Sex
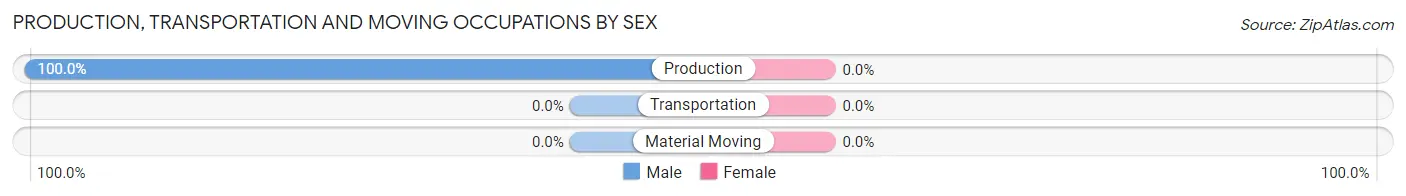
| Occupation | Male | Female |
| Production | 1 (100.0%) | 0 (0.0%) |
| Transportation | 0 (0.0%) | 0 (0.0%) |
| Material Moving | 0 (0.0%) | 0 (0.0%) |
| Total (Category) | 1 (100.0%) | 0 (0.0%) |
| Total (Overall) | 4 (40.0%) | 6 (60.0%) |
Employment Industries by Sex in Lupus
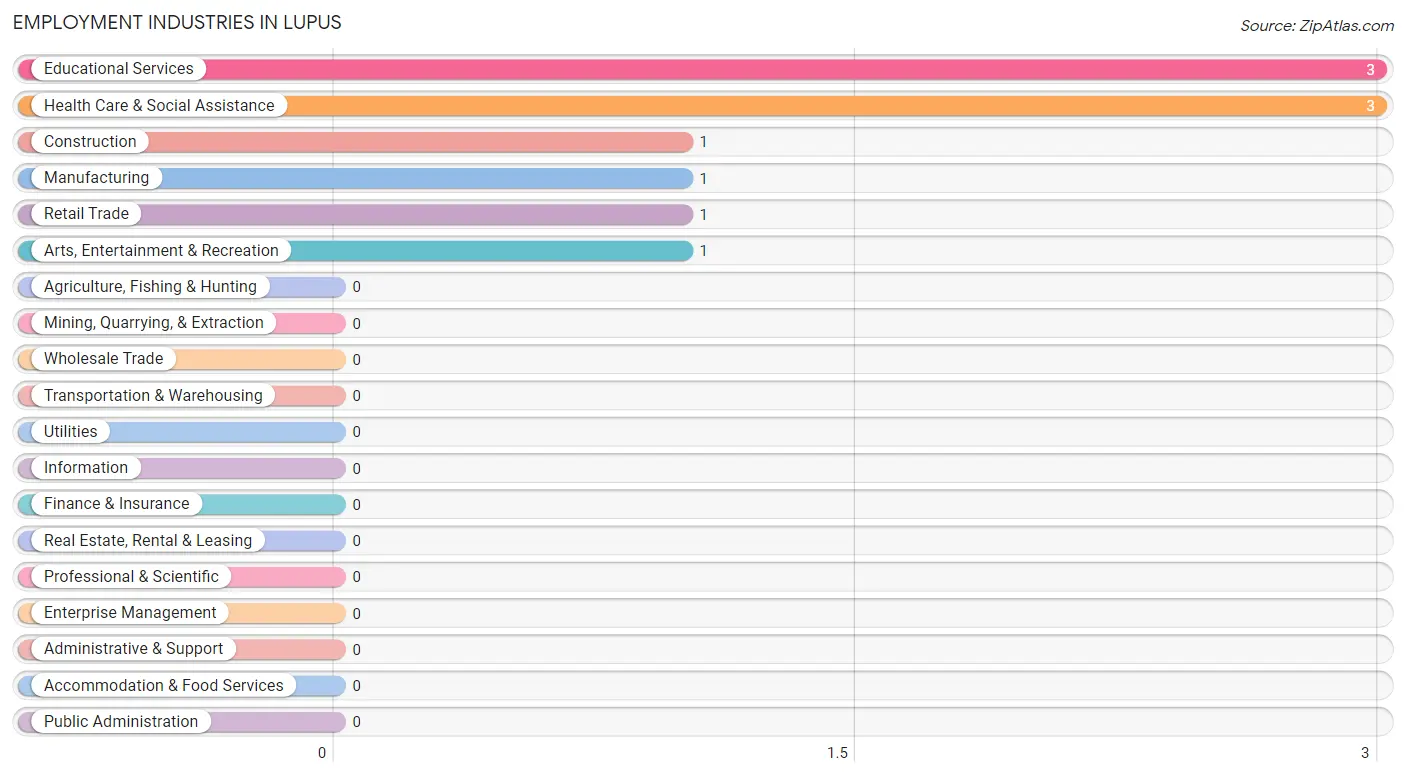
Employment Industries in Lupus
The major employment industries in Lupus include Educational Services (3 | 30.0%), Health Care & Social Assistance (3 | 30.0%), Construction (1 | 10.0%), Manufacturing (1 | 10.0%), and Retail Trade (1 | 10.0%).
Employment Industries by Sex in Lupus
The Lupus industries that see more men than women are Construction (100.0%), Manufacturing (100.0%), and Arts, Entertainment & Recreation (100.0%), whereas the industries that tend to have a higher number of women are Retail Trade (100.0%), Health Care & Social Assistance (100.0%), and Educational Services (66.7%).
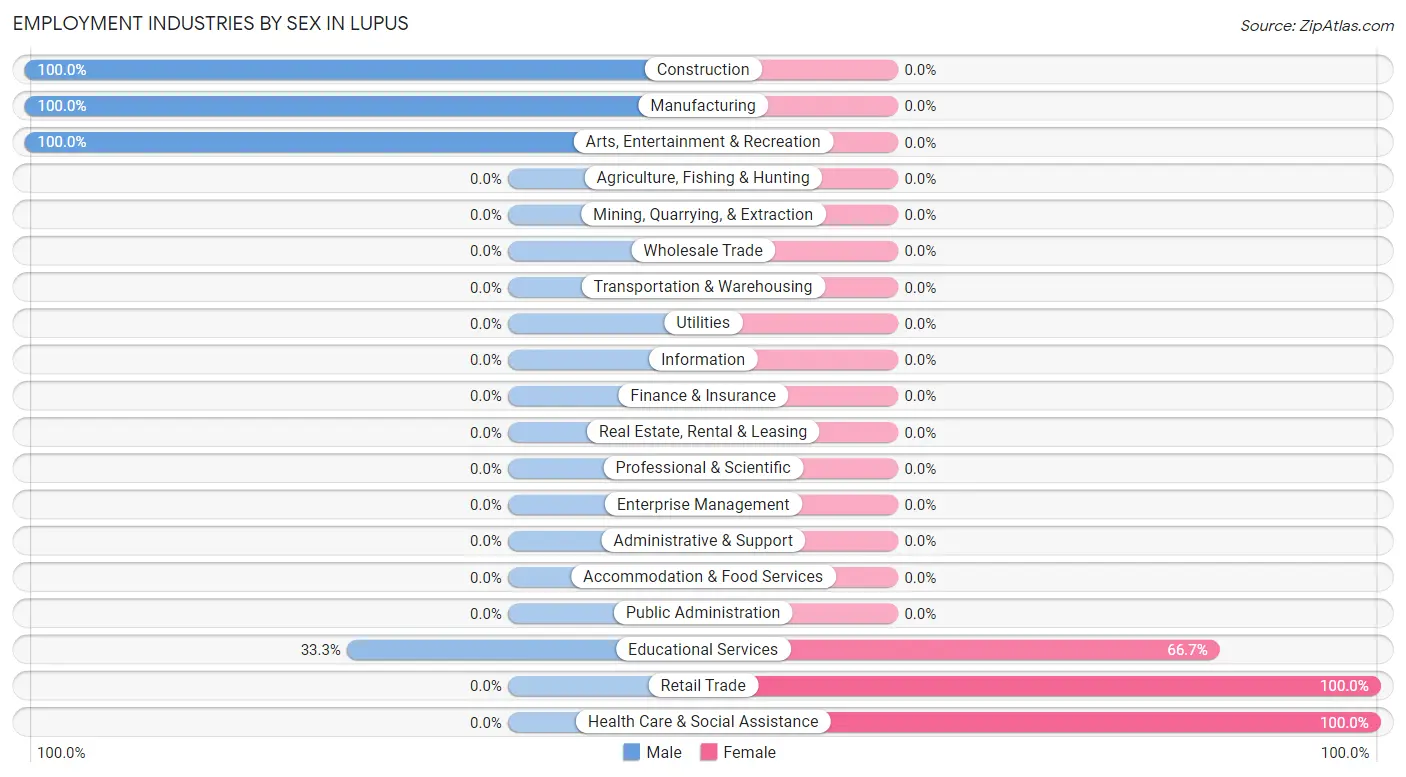
| Industry | Male | Female |
| Agriculture, Fishing & Hunting | 0 (0.0%) | 0 (0.0%) |
| Mining, Quarrying, & Extraction | 0 (0.0%) | 0 (0.0%) |
| Construction | 1 (100.0%) | 0 (0.0%) |
| Manufacturing | 1 (100.0%) | 0 (0.0%) |
| Wholesale Trade | 0 (0.0%) | 0 (0.0%) |
| Retail Trade | 0 (0.0%) | 1 (100.0%) |
| Transportation & Warehousing | 0 (0.0%) | 0 (0.0%) |
| Utilities | 0 (0.0%) | 0 (0.0%) |
| Information | 0 (0.0%) | 0 (0.0%) |
| Finance & Insurance | 0 (0.0%) | 0 (0.0%) |
| Real Estate, Rental & Leasing | 0 (0.0%) | 0 (0.0%) |
| Professional & Scientific | 0 (0.0%) | 0 (0.0%) |
| Enterprise Management | 0 (0.0%) | 0 (0.0%) |
| Administrative & Support | 0 (0.0%) | 0 (0.0%) |
| Educational Services | 1 (33.3%) | 2 (66.7%) |
| Health Care & Social Assistance | 0 (0.0%) | 3 (100.0%) |
| Arts, Entertainment & Recreation | 1 (100.0%) | 0 (0.0%) |
| Accommodation & Food Services | 0 (0.0%) | 0 (0.0%) |
| Public Administration | 0 (0.0%) | 0 (0.0%) |
| Total | 4 (40.0%) | 6 (60.0%) |
Education in Lupus
School Enrollment in Lupus
The most common levels of schooling among the 4 students in Lupus are kindergarten (1 | 25.0%), elementary school (1 | 25.0%), and high school (1 | 25.0%).
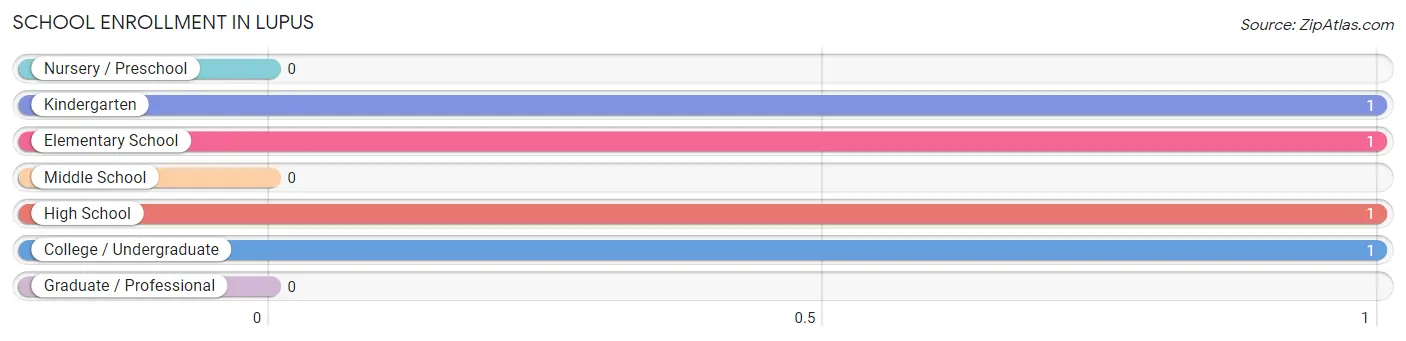
| School Level | # Students | % Students |
| Nursery / Preschool | 0 | 0.0% |
| Kindergarten | 1 | 25.0% |
| Elementary School | 1 | 25.0% |
| Middle School | 0 | 0.0% |
| High School | 1 | 25.0% |
| College / Undergraduate | 1 | 25.0% |
| Graduate / Professional | 0 | 0.0% |
| Total | 4 | 100.0% |
School Enrollment by Age by Funding Source in Lupus
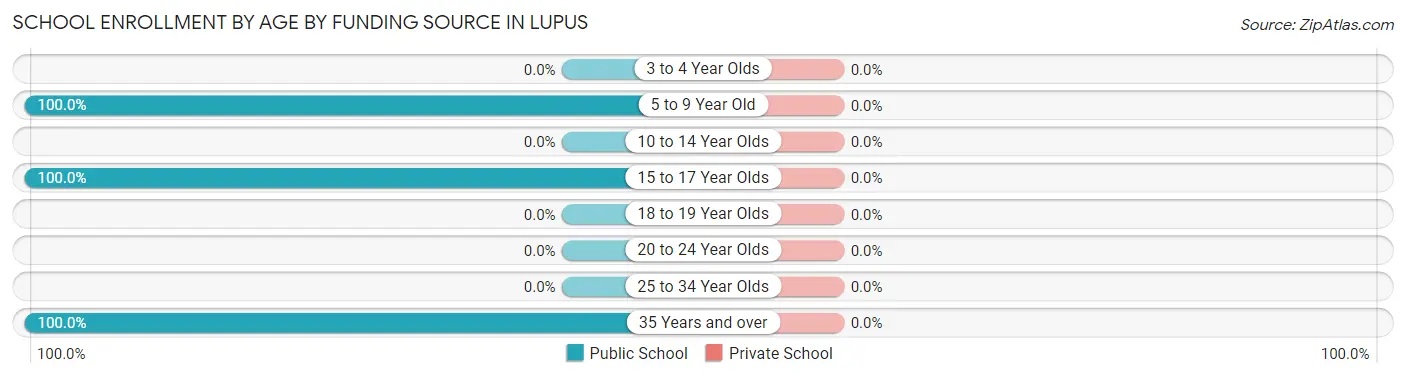
| Age Bracket | Public School | Private School |
| 3 to 4 Year Olds | 0 (0.0%) | 0 (0.0%) |
| 5 to 9 Year Old | 2 (100.0%) | 0 (0.0%) |
| 10 to 14 Year Olds | 0 (0.0%) | 0 (0.0%) |
| 15 to 17 Year Olds | 1 (100.0%) | 0 (0.0%) |
| 18 to 19 Year Olds | 0 (0.0%) | 0 (0.0%) |
| 20 to 24 Year Olds | 0 (0.0%) | 0 (0.0%) |
| 25 to 34 Year Olds | 0 (0.0%) | 0 (0.0%) |
| 35 Years and over | 1 (100.0%) | 0 (0.0%) |
| Total | 4 (100.0%) | 0 (0.0%) |
Educational Attainment by Field of Study in Lupus
Physical & health sciences (5 | 38.5%), liberal arts & history (3 | 23.1%), bio, nature & agricultural (1 | 7.7%), engineering (1 | 7.7%), and science & technology (1 | 7.7%) are the most common fields of study among 13 individuals in Lupus who have obtained a bachelor's degree or higher.
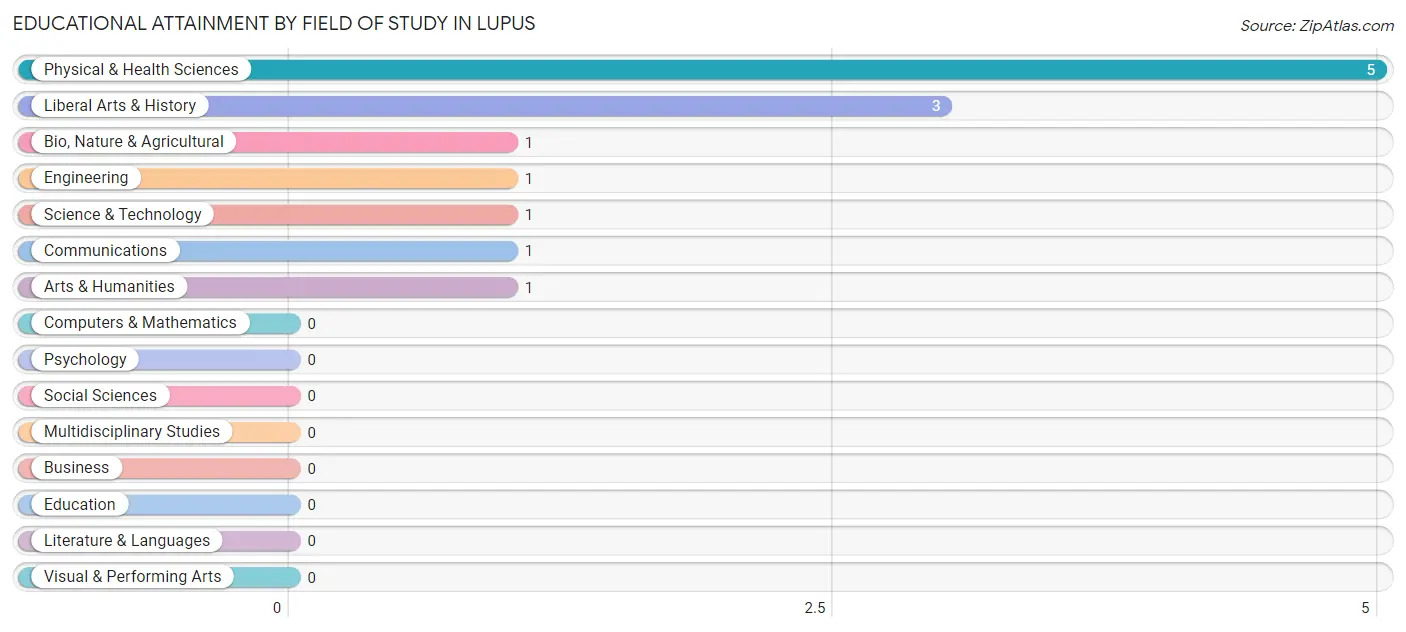
| Field of Study | # Graduates | % Graduates |
| Computers & Mathematics | 0 | 0.0% |
| Bio, Nature & Agricultural | 1 | 7.7% |
| Physical & Health Sciences | 5 | 38.5% |
| Psychology | 0 | 0.0% |
| Social Sciences | 0 | 0.0% |
| Engineering | 1 | 7.7% |
| Multidisciplinary Studies | 0 | 0.0% |
| Science & Technology | 1 | 7.7% |
| Business | 0 | 0.0% |
| Education | 0 | 0.0% |
| Literature & Languages | 0 | 0.0% |
| Liberal Arts & History | 3 | 23.1% |
| Visual & Performing Arts | 0 | 0.0% |
| Communications | 1 | 7.7% |
| Arts & Humanities | 1 | 7.7% |
| Total | 13 | 100.0% |
Transportation & Commute in Lupus
Vehicle Availability by Sex in Lupus
The most prevalent vehicle ownership categories in Lupus are males with 2 vehicles (2, accounting for 50.0%) and females with 2 vehicles (2, making up 33.3%).
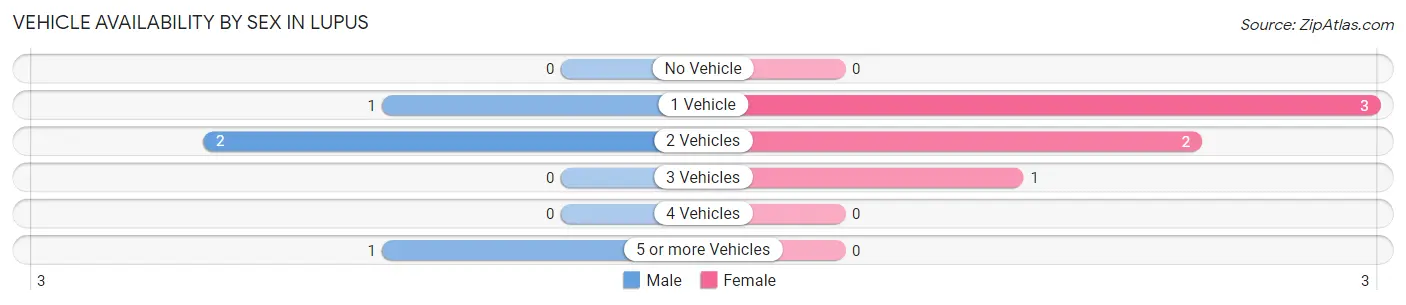
| Vehicles Available | Male | Female |
| No Vehicle | 0 (0.0%) | 0 (0.0%) |
| 1 Vehicle | 1 (25.0%) | 3 (50.0%) |
| 2 Vehicles | 2 (50.0%) | 2 (33.3%) |
| 3 Vehicles | 0 (0.0%) | 1 (16.7%) |
| 4 Vehicles | 0 (0.0%) | 0 (0.0%) |
| 5 or more Vehicles | 1 (25.0%) | 0 (0.0%) |
| Total | 4 (100.0%) | 6 (100.0%) |
Commute Time in Lupus
The most frequently occuring commute durations in Lupus are 45 to 59 minutes (5 commuters, 55.6%), 60 to 89 minutes (2 commuters, 22.2%), and 30 to 34 minutes (1 commuters, 11.1%).
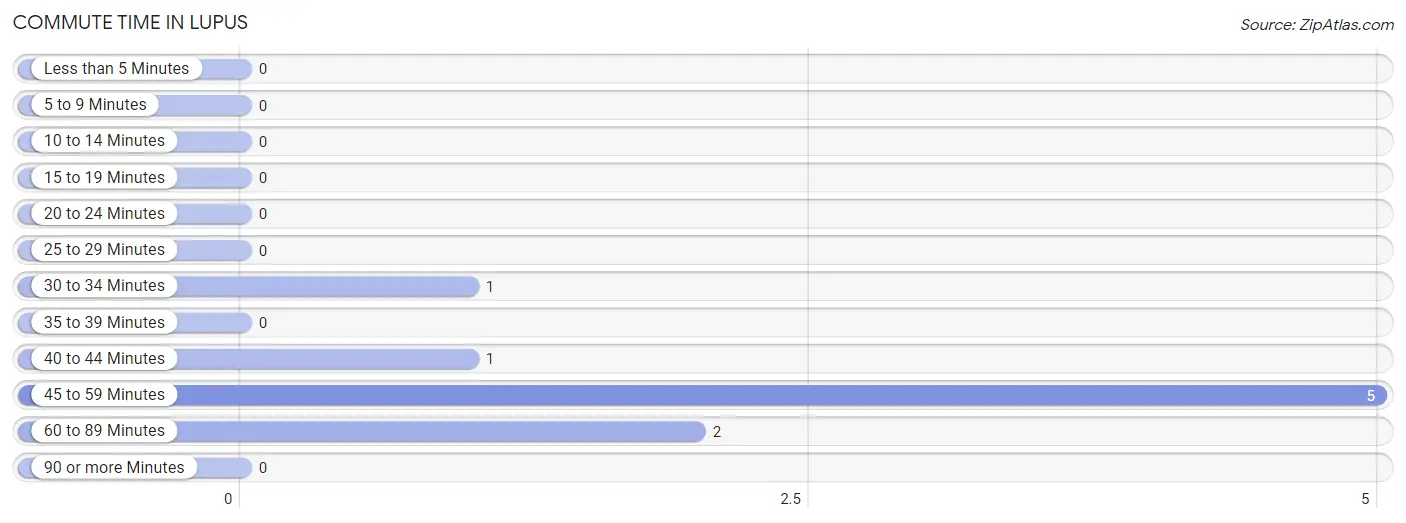
| Commute Time | # Commuters | % Commuters |
| Less than 5 Minutes | 0 | 0.0% |
| 5 to 9 Minutes | 0 | 0.0% |
| 10 to 14 Minutes | 0 | 0.0% |
| 15 to 19 Minutes | 0 | 0.0% |
| 20 to 24 Minutes | 0 | 0.0% |
| 25 to 29 Minutes | 0 | 0.0% |
| 30 to 34 Minutes | 1 | 11.1% |
| 35 to 39 Minutes | 0 | 0.0% |
| 40 to 44 Minutes | 1 | 11.1% |
| 45 to 59 Minutes | 5 | 55.6% |
| 60 to 89 Minutes | 2 | 22.2% |
| 90 or more Minutes | 0 | 0.0% |
Commute Time by Sex in Lupus
The most common commute times in Lupus are 45 to 59 minutes (2 commuters, 66.7%) for males and 45 to 59 minutes (3 commuters, 50.0%) for females.
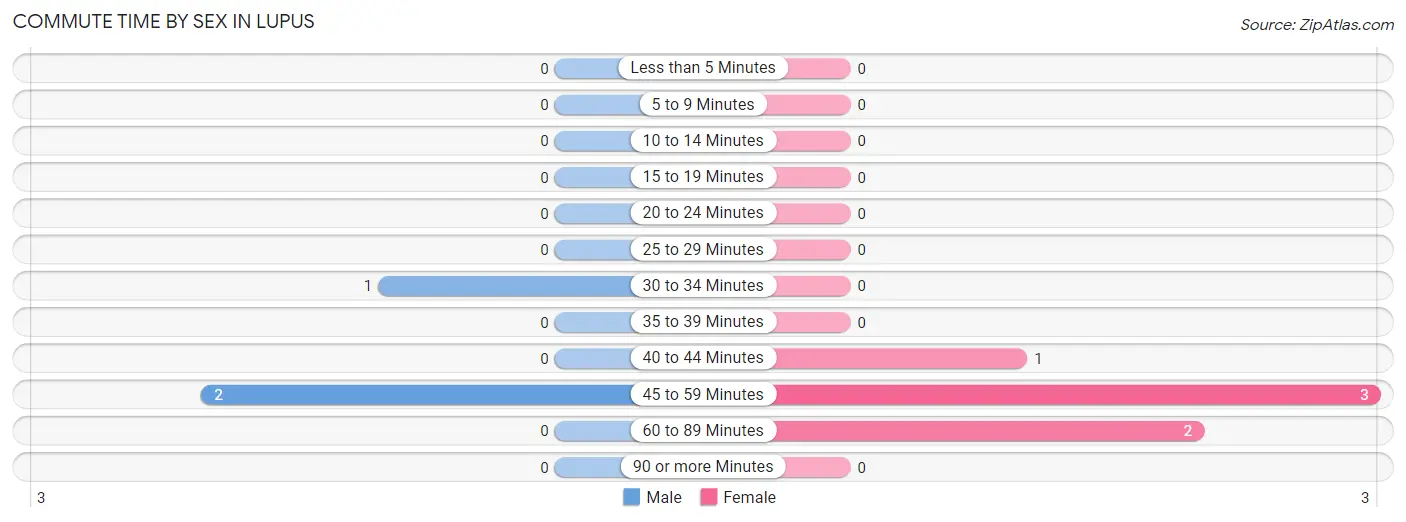
| Commute Time | Male | Female |
| Less than 5 Minutes | 0 (0.0%) | 0 (0.0%) |
| 5 to 9 Minutes | 0 (0.0%) | 0 (0.0%) |
| 10 to 14 Minutes | 0 (0.0%) | 0 (0.0%) |
| 15 to 19 Minutes | 0 (0.0%) | 0 (0.0%) |
| 20 to 24 Minutes | 0 (0.0%) | 0 (0.0%) |
| 25 to 29 Minutes | 0 (0.0%) | 0 (0.0%) |
| 30 to 34 Minutes | 1 (33.3%) | 0 (0.0%) |
| 35 to 39 Minutes | 0 (0.0%) | 0 (0.0%) |
| 40 to 44 Minutes | 0 (0.0%) | 1 (16.7%) |
| 45 to 59 Minutes | 2 (66.7%) | 3 (50.0%) |
| 60 to 89 Minutes | 0 (0.0%) | 2 (33.3%) |
| 90 or more Minutes | 0 (0.0%) | 0 (0.0%) |
Time of Departure to Work by Sex in Lupus
The most frequent times of departure to work in Lupus are 7:00 AM to 7:29 AM (2, 66.7%) for males and 7:00 AM to 7:29 AM (3, 50.0%) for females.
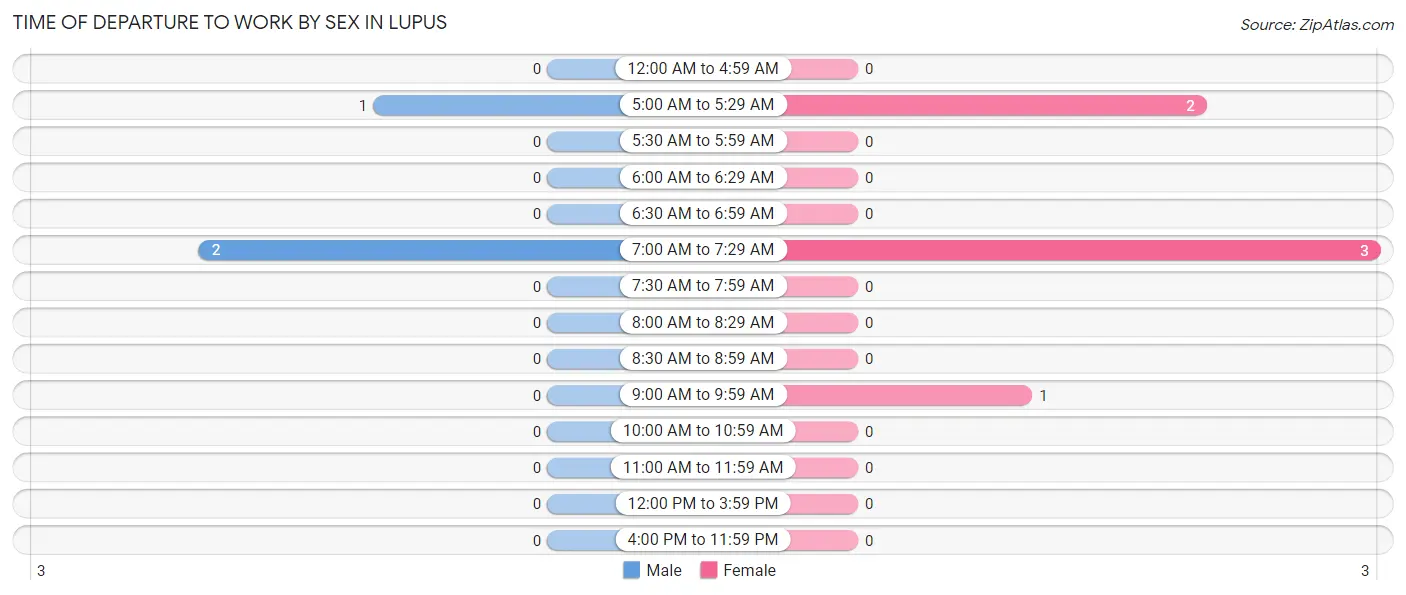
| Time of Departure | Male | Female |
| 12:00 AM to 4:59 AM | 0 (0.0%) | 0 (0.0%) |
| 5:00 AM to 5:29 AM | 1 (33.3%) | 2 (33.3%) |
| 5:30 AM to 5:59 AM | 0 (0.0%) | 0 (0.0%) |
| 6:00 AM to 6:29 AM | 0 (0.0%) | 0 (0.0%) |
| 6:30 AM to 6:59 AM | 0 (0.0%) | 0 (0.0%) |
| 7:00 AM to 7:29 AM | 2 (66.7%) | 3 (50.0%) |
| 7:30 AM to 7:59 AM | 0 (0.0%) | 0 (0.0%) |
| 8:00 AM to 8:29 AM | 0 (0.0%) | 0 (0.0%) |
| 8:30 AM to 8:59 AM | 0 (0.0%) | 0 (0.0%) |
| 9:00 AM to 9:59 AM | 0 (0.0%) | 1 (16.7%) |
| 10:00 AM to 10:59 AM | 0 (0.0%) | 0 (0.0%) |
| 11:00 AM to 11:59 AM | 0 (0.0%) | 0 (0.0%) |
| 12:00 PM to 3:59 PM | 0 (0.0%) | 0 (0.0%) |
| 4:00 PM to 11:59 PM | 0 (0.0%) | 0 (0.0%) |
| Total | 3 (100.0%) | 6 (100.0%) |
Housing Occupancy in Lupus
Occupancy by Ownership in Lupus
Of the total 14 dwellings in Lupus, owner-occupied units account for 14 (100.0%), while renter-occupied units make up 0 (0.0%).
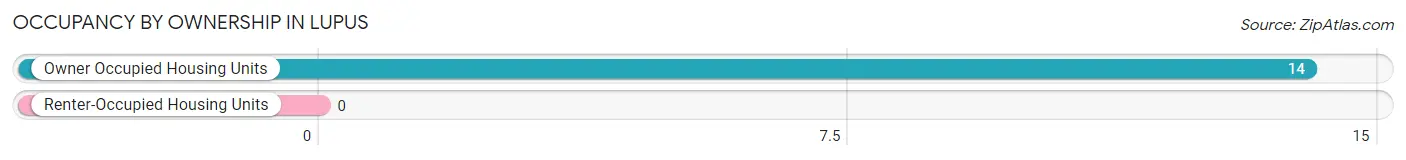
| Occupancy | # Housing Units | % Housing Units |
| Owner Occupied Housing Units | 14 | 100.0% |
| Renter-Occupied Housing Units | 0 | 0.0% |
| Total Occupied Housing Units | 14 | 100.0% |
Occupancy by Household Size in Lupus
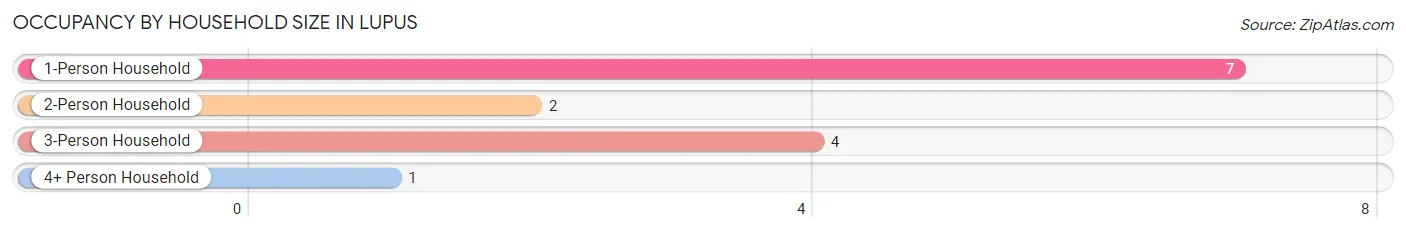
| Household Size | # Housing Units | % Housing Units |
| 1-Person Household | 7 | 50.0% |
| 2-Person Household | 2 | 14.3% |
| 3-Person Household | 4 | 28.6% |
| 4+ Person Household | 1 | 7.1% |
| Total Housing Units | 14 | 100.0% |
Occupancy by Ownership by Household Size in Lupus
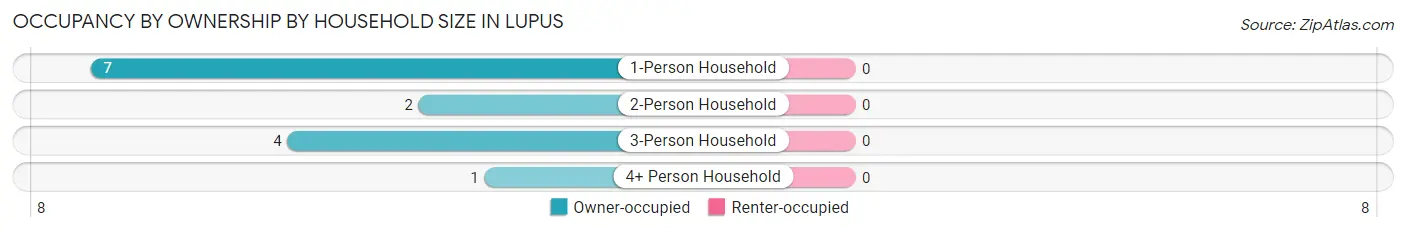
| Household Size | Owner-occupied | Renter-occupied |
| 1-Person Household | 7 (100.0%) | 0 (0.0%) |
| 2-Person Household | 2 (100.0%) | 0 (0.0%) |
| 3-Person Household | 4 (100.0%) | 0 (0.0%) |
| 4+ Person Household | 1 (100.0%) | 0 (0.0%) |
| Total Housing Units | 14 (100.0%) | 0 (0.0%) |
Occupancy by Educational Attainment in Lupus
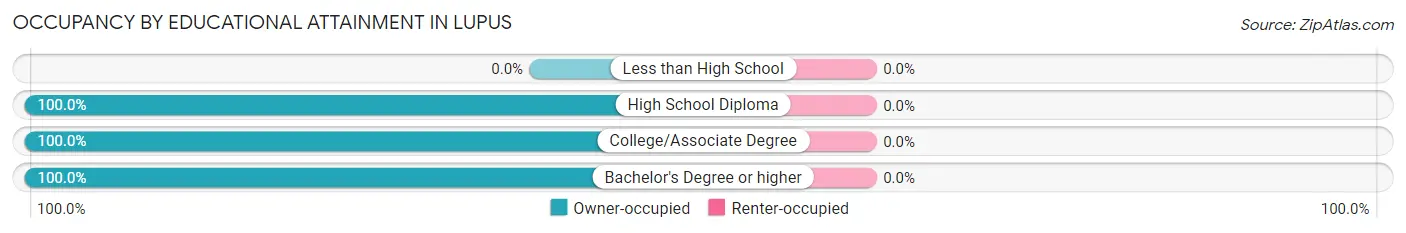
| Household Size | Owner-occupied | Renter-occupied |
| Less than High School | 0 (0.0%) | 0 (0.0%) |
| High School Diploma | 3 (100.0%) | 0 (0.0%) |
| College/Associate Degree | 1 (100.0%) | 0 (0.0%) |
| Bachelor's Degree or higher | 10 (100.0%) | 0 (0.0%) |
Occupancy by Age of Householder in Lupus
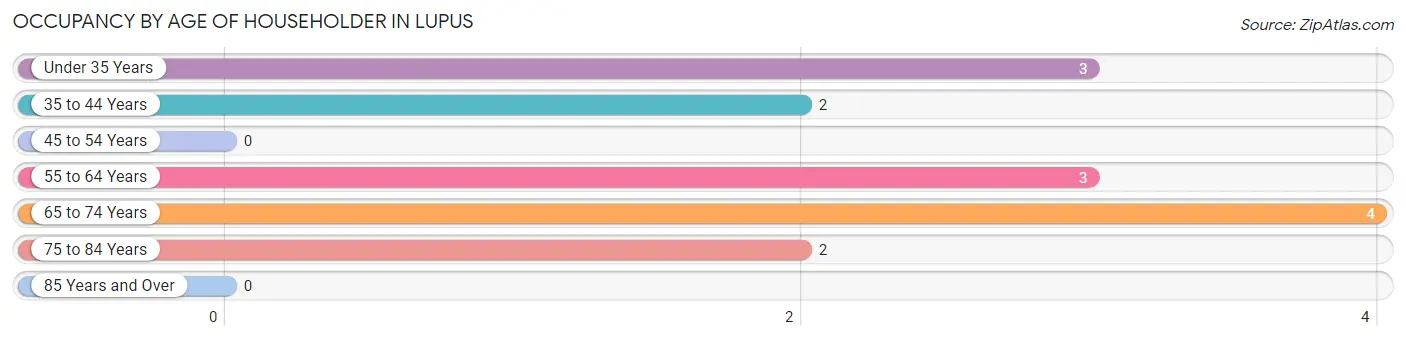
| Age Bracket | # Households | % Households |
| Under 35 Years | 3 | 21.4% |
| 35 to 44 Years | 2 | 14.3% |
| 45 to 54 Years | 0 | 0.0% |
| 55 to 64 Years | 3 | 21.4% |
| 65 to 74 Years | 4 | 28.6% |
| 75 to 84 Years | 2 | 14.3% |
| 85 Years and Over | 0 | 0.0% |
| Total | 14 | 100.0% |
Housing Finances in Lupus
Median Income by Occupancy in Lupus
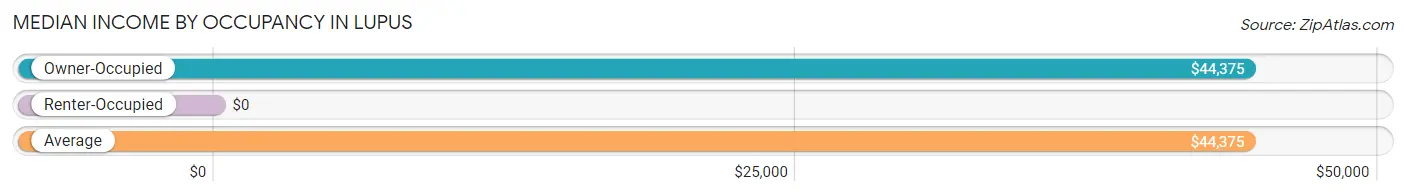
| Occupancy Type | # Households | Median Income |
| Owner-Occupied | 14 (100.0%) | $44,375 |
| Renter-Occupied | 0 (0.0%) | $0 |
| Average | 14 (100.0%) | $44,375 |
Occupancy by Householder Income Bracket in Lupus
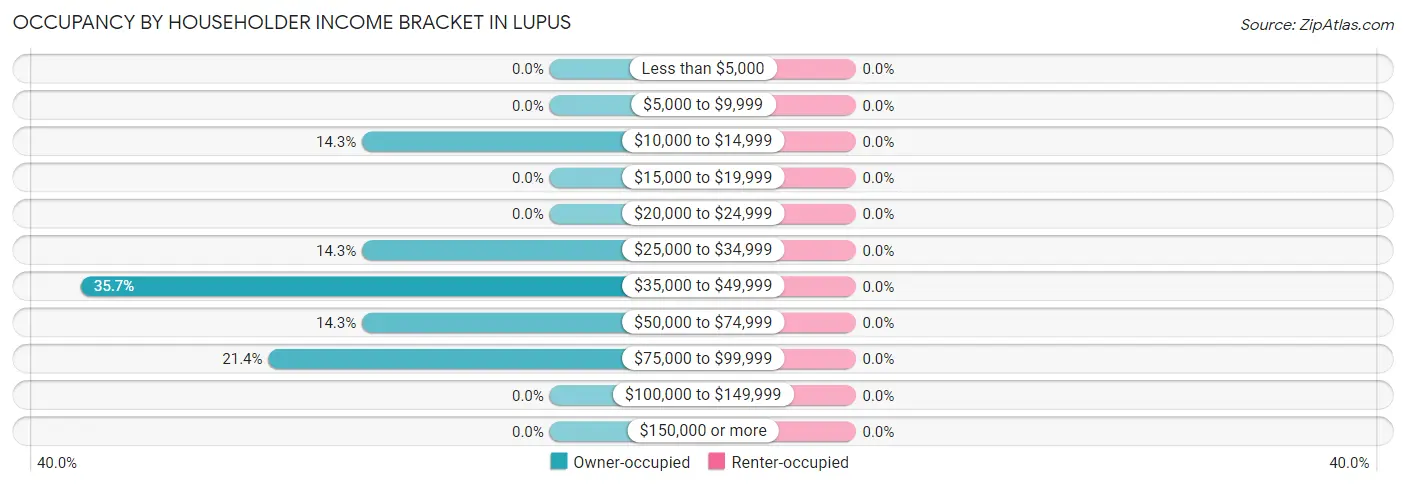
| Income Bracket | Owner-occupied | Renter-occupied |
| Less than $5,000 | 0 (0.0%) | 0 (0.0%) |
| $5,000 to $9,999 | 0 (0.0%) | 0 (0.0%) |
| $10,000 to $14,999 | 2 (14.3%) | 0 (0.0%) |
| $15,000 to $19,999 | 0 (0.0%) | 0 (0.0%) |
| $20,000 to $24,999 | 0 (0.0%) | 0 (0.0%) |
| $25,000 to $34,999 | 2 (14.3%) | 0 (0.0%) |
| $35,000 to $49,999 | 5 (35.7%) | 0 (0.0%) |
| $50,000 to $74,999 | 2 (14.3%) | 0 (0.0%) |
| $75,000 to $99,999 | 3 (21.4%) | 0 (0.0%) |
| $100,000 to $149,999 | 0 (0.0%) | 0 (0.0%) |
| $150,000 or more | 0 (0.0%) | 0 (0.0%) |
| Total | 14 (100.0%) | 0 (0.0%) |
Monthly Housing Cost Tiers in Lupus
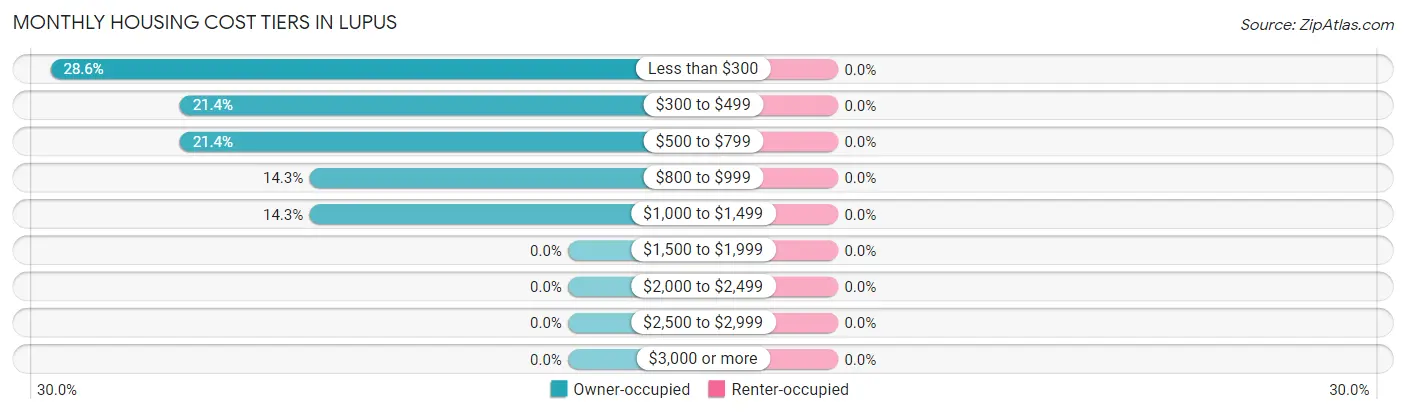
| Monthly Cost | Owner-occupied | Renter-occupied |
| Less than $300 | 4 (28.6%) | 0 (0.0%) |
| $300 to $499 | 3 (21.4%) | 0 (0.0%) |
| $500 to $799 | 3 (21.4%) | 0 (0.0%) |
| $800 to $999 | 2 (14.3%) | 0 (0.0%) |
| $1,000 to $1,499 | 2 (14.3%) | 0 (0.0%) |
| $1,500 to $1,999 | 0 (0.0%) | 0 (0.0%) |
| $2,000 to $2,499 | 0 (0.0%) | 0 (0.0%) |
| $2,500 to $2,999 | 0 (0.0%) | 0 (0.0%) |
| $3,000 or more | 0 (0.0%) | 0 (0.0%) |
| Total | 14 (100.0%) | 0 (0.0%) |
Physical Housing Characteristics in Lupus
Housing Structures in Lupus
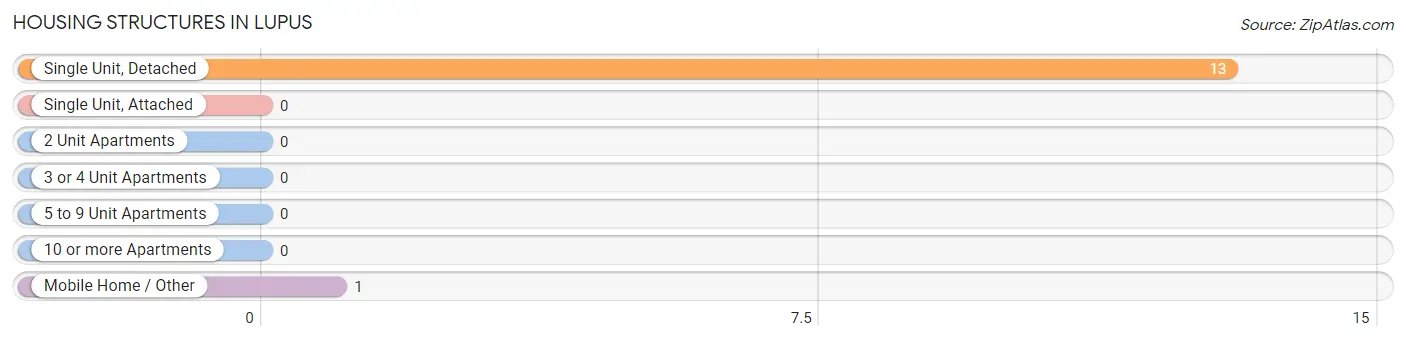
| Structure Type | # Housing Units | % Housing Units |
| Single Unit, Detached | 13 | 92.9% |
| Single Unit, Attached | 0 | 0.0% |
| 2 Unit Apartments | 0 | 0.0% |
| 3 or 4 Unit Apartments | 0 | 0.0% |
| 5 to 9 Unit Apartments | 0 | 0.0% |
| 10 or more Apartments | 0 | 0.0% |
| Mobile Home / Other | 1 | 7.1% |
| Total | 14 | 100.0% |
Housing Structures by Occupancy in Lupus
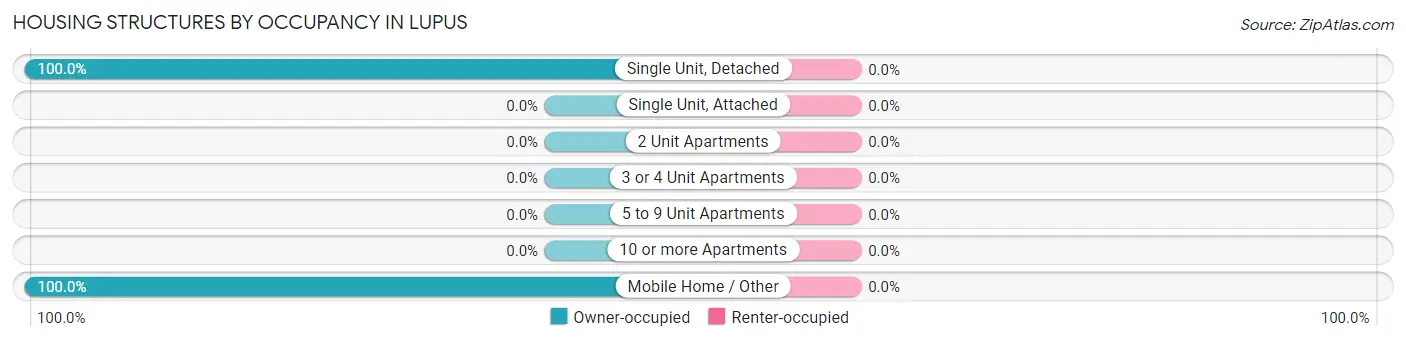
| Structure Type | Owner-occupied | Renter-occupied |
| Single Unit, Detached | 13 (100.0%) | 0 (0.0%) |
| Single Unit, Attached | 0 (0.0%) | 0 (0.0%) |
| 2 Unit Apartments | 0 (0.0%) | 0 (0.0%) |
| 3 or 4 Unit Apartments | 0 (0.0%) | 0 (0.0%) |
| 5 to 9 Unit Apartments | 0 (0.0%) | 0 (0.0%) |
| 10 or more Apartments | 0 (0.0%) | 0 (0.0%) |
| Mobile Home / Other | 1 (100.0%) | 0 (0.0%) |
| Total | 14 (100.0%) | 0 (0.0%) |
Housing Structures by Number of Rooms in Lupus
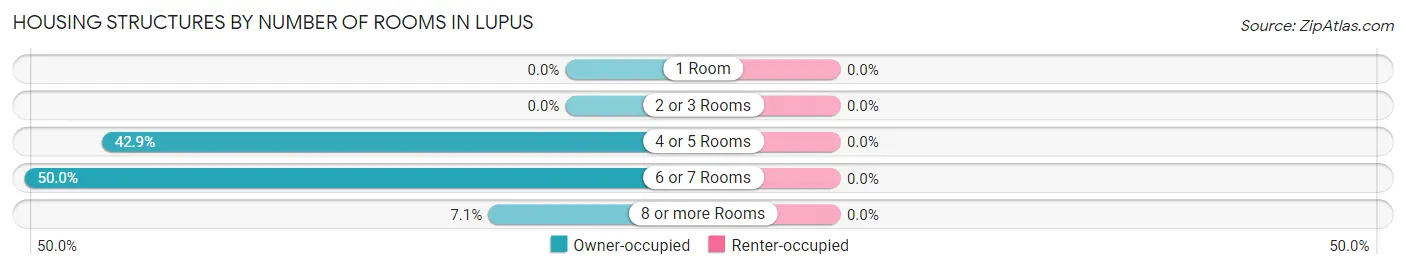
| Number of Rooms | Owner-occupied | Renter-occupied |
| 1 Room | 0 (0.0%) | 0 (0.0%) |
| 2 or 3 Rooms | 0 (0.0%) | 0 (0.0%) |
| 4 or 5 Rooms | 6 (42.9%) | 0 (0.0%) |
| 6 or 7 Rooms | 7 (50.0%) | 0 (0.0%) |
| 8 or more Rooms | 1 (7.1%) | 0 (0.0%) |
| Total | 14 (100.0%) | 0 (0.0%) |
Housing Structure by Heating Type in Lupus
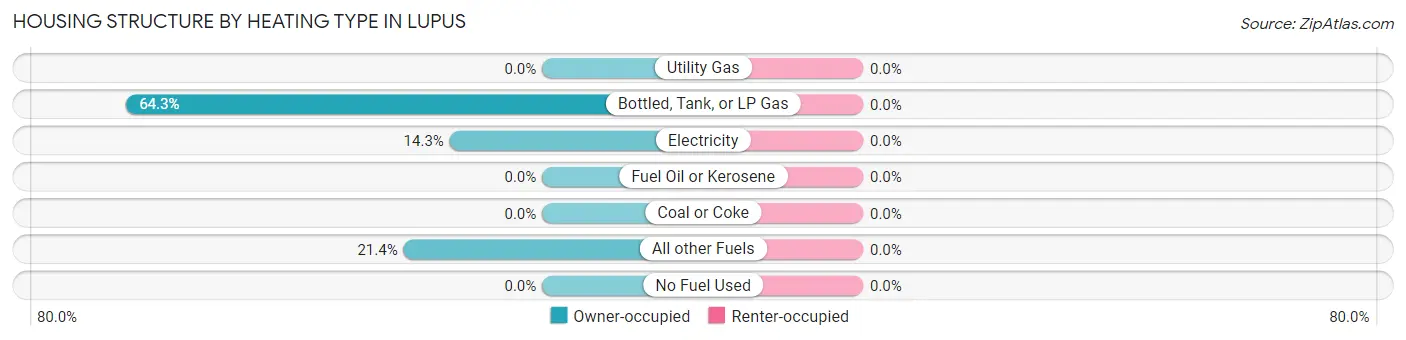
| Heating Type | Owner-occupied | Renter-occupied |
| Utility Gas | 0 (0.0%) | 0 (0.0%) |
| Bottled, Tank, or LP Gas | 9 (64.3%) | 0 (0.0%) |
| Electricity | 2 (14.3%) | 0 (0.0%) |
| Fuel Oil or Kerosene | 0 (0.0%) | 0 (0.0%) |
| Coal or Coke | 0 (0.0%) | 0 (0.0%) |
| All other Fuels | 3 (21.4%) | 0 (0.0%) |
| No Fuel Used | 0 (0.0%) | 0 (0.0%) |
| Total | 14 (100.0%) | 0 (0.0%) |
Household Vehicle Usage in Lupus
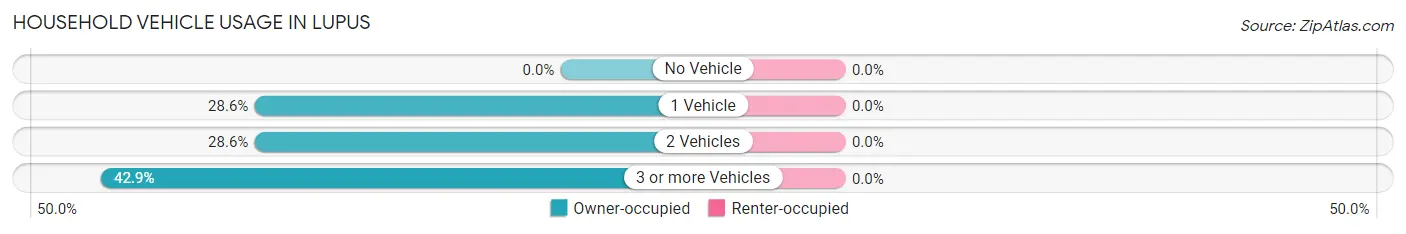
| Vehicles per Household | Owner-occupied | Renter-occupied |
| No Vehicle | 0 (0.0%) | 0 (0.0%) |
| 1 Vehicle | 4 (28.6%) | 0 (0.0%) |
| 2 Vehicles | 4 (28.6%) | 0 (0.0%) |
| 3 or more Vehicles | 6 (42.9%) | 0 (0.0%) |
| Total | 14 (100.0%) | 0 (0.0%) |
Real Estate & Mortgages in Lupus
Real Estate and Mortgage Overview in Lupus
| Characteristic | Without Mortgage | With Mortgage |
| Housing Units | 8 | 6 |
| Median Property Value | $80,000 | $80,000 |
| Median Household Income | $43,750 | $0 |
| Monthly Housing Costs | $275 | $0 |
| Real Estate Taxes | $300 | $2 |
Property Value by Mortgage Status in Lupus
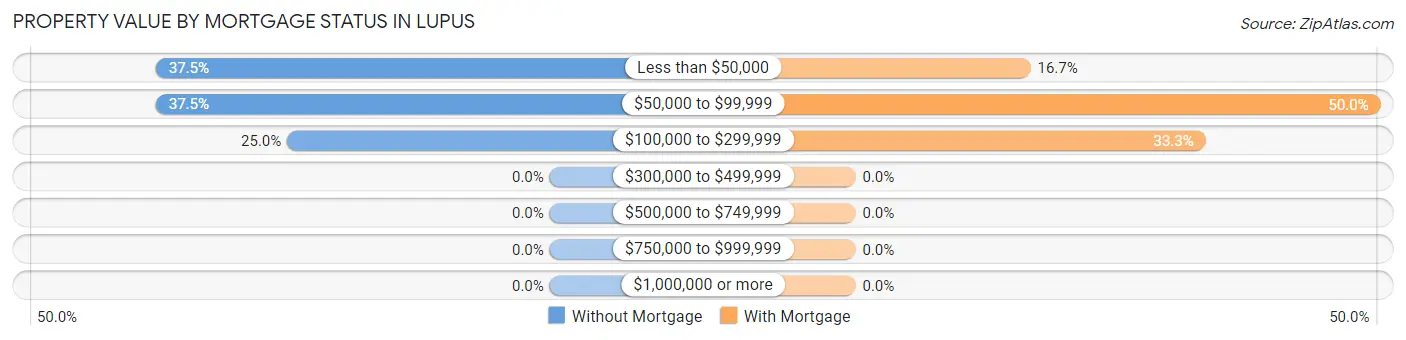
| Property Value | Without Mortgage | With Mortgage |
| Less than $50,000 | 3 (37.5%) | 1 (16.7%) |
| $50,000 to $99,999 | 3 (37.5%) | 3 (50.0%) |
| $100,000 to $299,999 | 2 (25.0%) | 2 (33.3%) |
| $300,000 to $499,999 | 0 (0.0%) | 0 (0.0%) |
| $500,000 to $749,999 | 0 (0.0%) | 0 (0.0%) |
| $750,000 to $999,999 | 0 (0.0%) | 0 (0.0%) |
| $1,000,000 or more | 0 (0.0%) | 0 (0.0%) |
| Total | 8 (100.0%) | 6 (100.0%) |
Household Income by Mortgage Status in Lupus
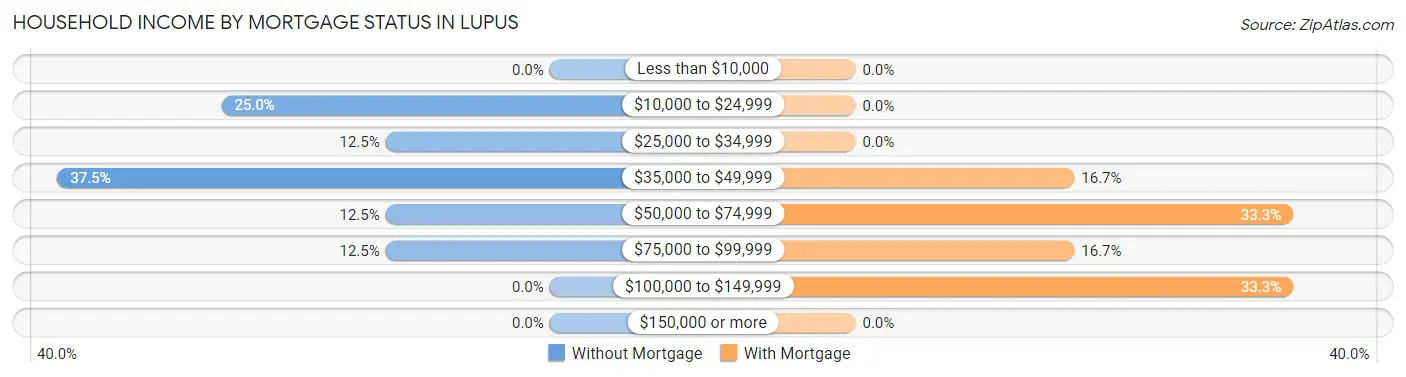
| Household Income | Without Mortgage | With Mortgage |
| Less than $10,000 | 0 (0.0%) | 0 (0.0%) |
| $10,000 to $24,999 | 2 (25.0%) | 0 (0.0%) |
| $25,000 to $34,999 | 1 (12.5%) | 0 (0.0%) |
| $35,000 to $49,999 | 3 (37.5%) | 1 (16.7%) |
| $50,000 to $74,999 | 1 (12.5%) | 2 (33.3%) |
| $75,000 to $99,999 | 1 (12.5%) | 1 (16.7%) |
| $100,000 to $149,999 | 0 (0.0%) | 2 (33.3%) |
| $150,000 or more | 0 (0.0%) | 0 (0.0%) |
| Total | 8 (100.0%) | 6 (100.0%) |
Property Value to Household Income Ratio in Lupus
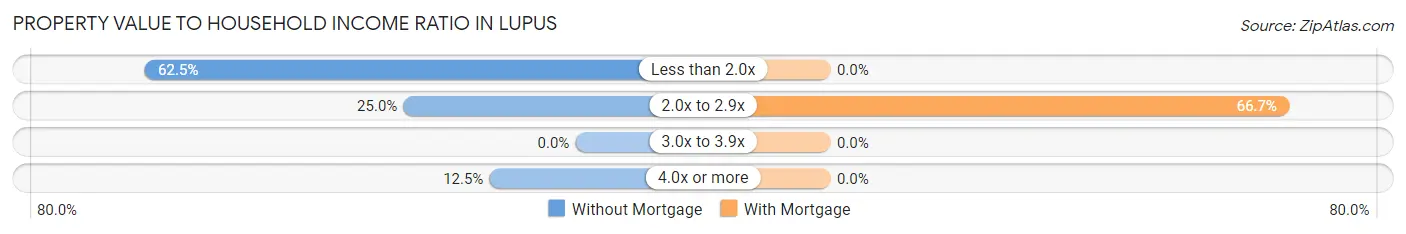
| Value-to-Income Ratio | Without Mortgage | With Mortgage |
| Less than 2.0x | 5 (62.5%) | 0 (0.0%) |
| 2.0x to 2.9x | 2 (25.0%) | 4 (66.7%) |
| 3.0x to 3.9x | 0 (0.0%) | 0 (0.0%) |
| 4.0x or more | 1 (12.5%) | 0 (0.0%) |
| Total | 8 (100.0%) | 6 (100.0%) |
Real Estate Taxes by Mortgage Status in Lupus
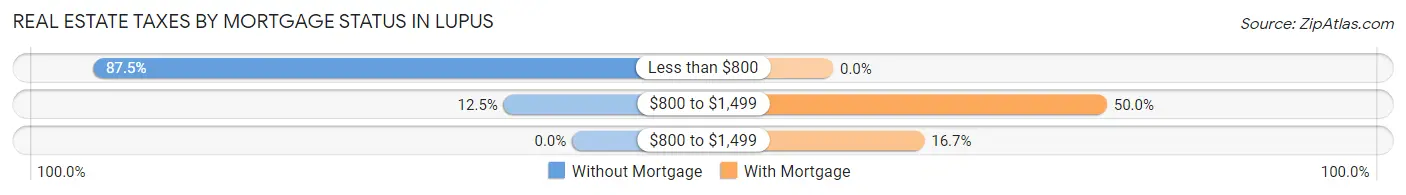
| Property Taxes | Without Mortgage | With Mortgage |
| Less than $800 | 7 (87.5%) | 0 (0.0%) |
| $800 to $1,499 | 1 (12.5%) | 3 (50.0%) |
| $800 to $1,499 | 0 (0.0%) | 1 (16.7%) |
| Total | 8 (100.0%) | 6 (100.0%) |
Health & Disability in Lupus
Health Insurance Coverage by Age in Lupus
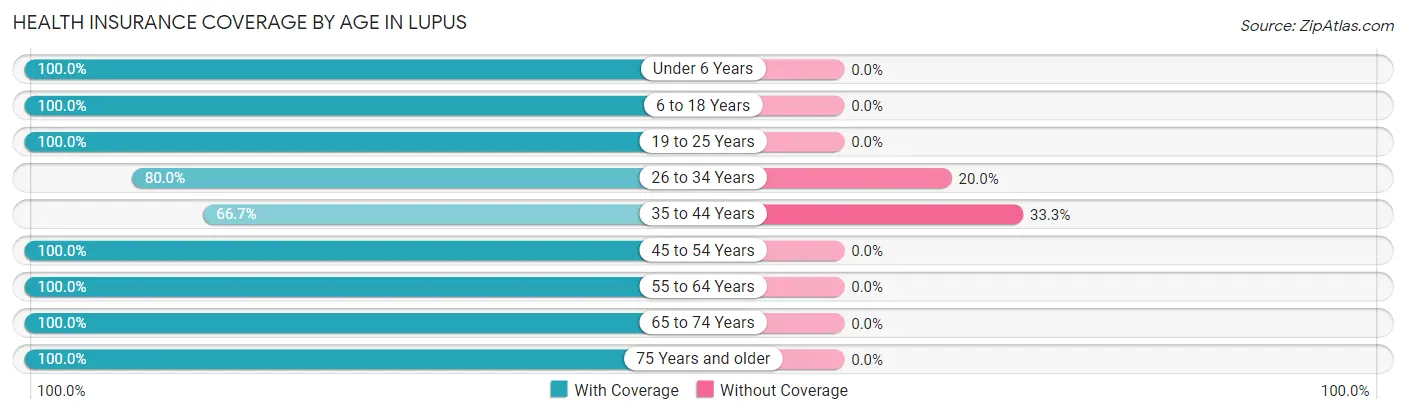
| Age Bracket | With Coverage | Without Coverage |
| Under 6 Years | 2 (100.0%) | 0 (0.0%) |
| 6 to 18 Years | 2 (100.0%) | 0 (0.0%) |
| 19 to 25 Years | 1 (100.0%) | 0 (0.0%) |
| 26 to 34 Years | 4 (80.0%) | 1 (20.0%) |
| 35 to 44 Years | 2 (66.7%) | 1 (33.3%) |
| 45 to 54 Years | 1 (100.0%) | 0 (0.0%) |
| 55 to 64 Years | 3 (100.0%) | 0 (0.0%) |
| 65 to 74 Years | 6 (100.0%) | 0 (0.0%) |
| 75 Years and older | 4 (100.0%) | 0 (0.0%) |
| Total | 25 (92.6%) | 2 (7.4%) |
Health Insurance Coverage by Citizenship Status in Lupus
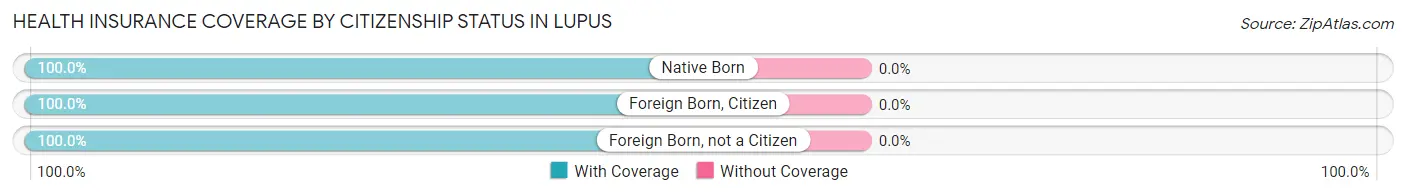
| Citizenship Status | With Coverage | Without Coverage |
| Native Born | 2 (100.0%) | 0 (0.0%) |
| Foreign Born, Citizen | 2 (100.0%) | 0 (0.0%) |
| Foreign Born, not a Citizen | 1 (100.0%) | 0 (0.0%) |
Health Insurance Coverage by Household Income in Lupus
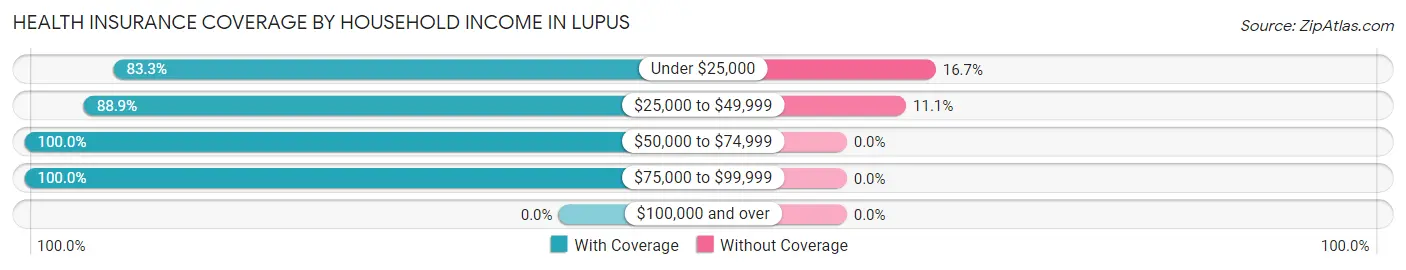
| Household Income | With Coverage | Without Coverage |
| Under $25,000 | 5 (83.3%) | 1 (16.7%) |
| $25,000 to $49,999 | 8 (88.9%) | 1 (11.1%) |
| $50,000 to $74,999 | 4 (100.0%) | 0 (0.0%) |
| $75,000 to $99,999 | 8 (100.0%) | 0 (0.0%) |
| $100,000 and over | 0 (0.0%) | 0 (0.0%) |
Public vs Private Health Insurance Coverage by Age in Lupus
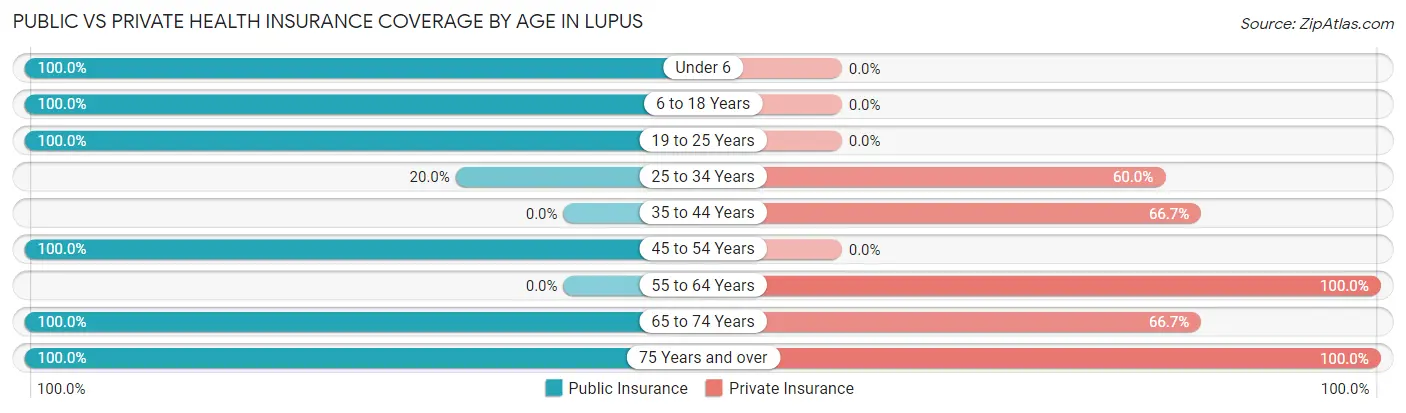
| Age Bracket | Public Insurance | Private Insurance |
| Under 6 | 2 (100.0%) | 0 (0.0%) |
| 6 to 18 Years | 2 (100.0%) | 0 (0.0%) |
| 19 to 25 Years | 1 (100.0%) | 0 (0.0%) |
| 25 to 34 Years | 1 (20.0%) | 3 (60.0%) |
| 35 to 44 Years | 0 (0.0%) | 2 (66.7%) |
| 45 to 54 Years | 1 (100.0%) | 0 (0.0%) |
| 55 to 64 Years | 0 (0.0%) | 3 (100.0%) |
| 65 to 74 Years | 6 (100.0%) | 4 (66.7%) |
| 75 Years and over | 4 (100.0%) | 4 (100.0%) |
| Total | 17 (63.0%) | 16 (59.3%) |
Disability Status by Sex by Age in Lupus
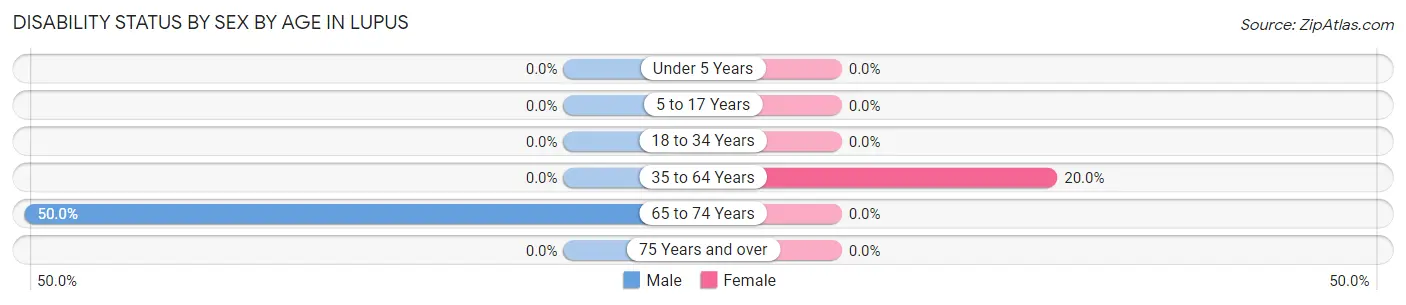
| Age Bracket | Male | Female |
| Under 5 Years | 0 (0.0%) | 0 (0.0%) |
| 5 to 17 Years | 0 (0.0%) | 0 (0.0%) |
| 18 to 34 Years | 0 (0.0%) | 0 (0.0%) |
| 35 to 64 Years | 0 (0.0%) | 1 (20.0%) |
| 65 to 74 Years | 2 (50.0%) | 0 (0.0%) |
| 75 Years and over | 0 (0.0%) | 0 (0.0%) |
Disability Class by Sex by Age in Lupus
Disability Class: Hearing Difficulty
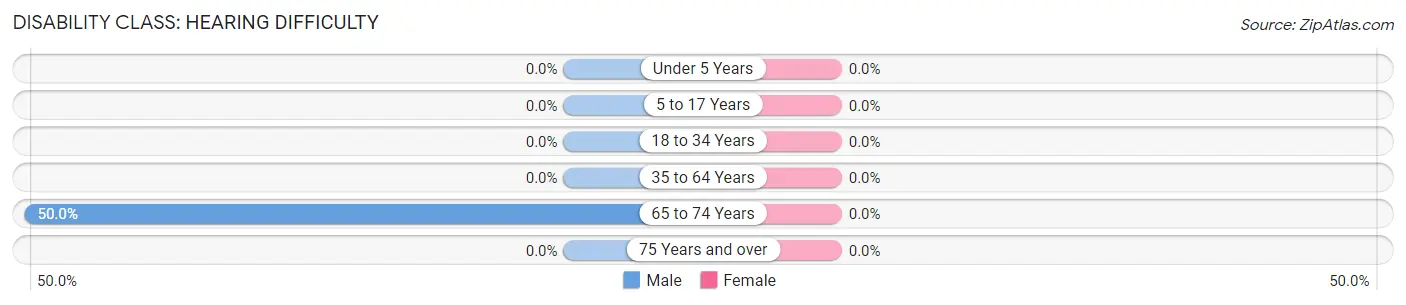
| Age Bracket | Male | Female |
| Under 5 Years | 0 (0.0%) | 0 (0.0%) |
| 5 to 17 Years | 0 (0.0%) | 0 (0.0%) |
| 18 to 34 Years | 0 (0.0%) | 0 (0.0%) |
| 35 to 64 Years | 0 (0.0%) | 0 (0.0%) |
| 65 to 74 Years | 2 (50.0%) | 0 (0.0%) |
| 75 Years and over | 0 (0.0%) | 0 (0.0%) |
Disability Class: Vision Difficulty
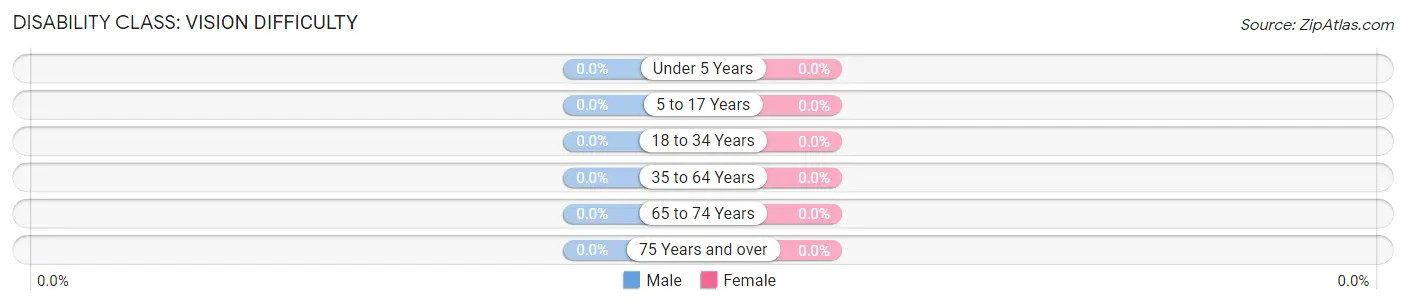
| Age Bracket | Male | Female |
| Under 5 Years | 0 (0.0%) | 0 (0.0%) |
| 5 to 17 Years | 0 (0.0%) | 0 (0.0%) |
| 18 to 34 Years | 0 (0.0%) | 0 (0.0%) |
| 35 to 64 Years | 0 (0.0%) | 0 (0.0%) |
| 65 to 74 Years | 0 (0.0%) | 0 (0.0%) |
| 75 Years and over | 0 (0.0%) | 0 (0.0%) |
Disability Class: Cognitive Difficulty
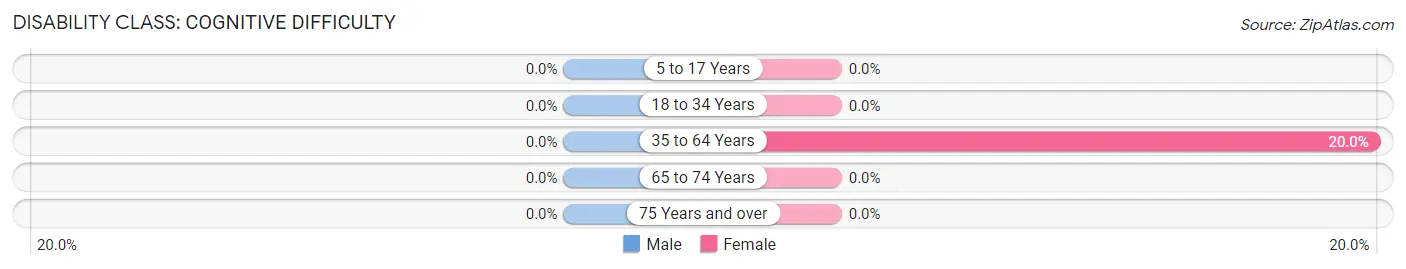
| Age Bracket | Male | Female |
| 5 to 17 Years | 0 (0.0%) | 0 (0.0%) |
| 18 to 34 Years | 0 (0.0%) | 0 (0.0%) |
| 35 to 64 Years | 0 (0.0%) | 1 (20.0%) |
| 65 to 74 Years | 0 (0.0%) | 0 (0.0%) |
| 75 Years and over | 0 (0.0%) | 0 (0.0%) |
Disability Class: Ambulatory Difficulty
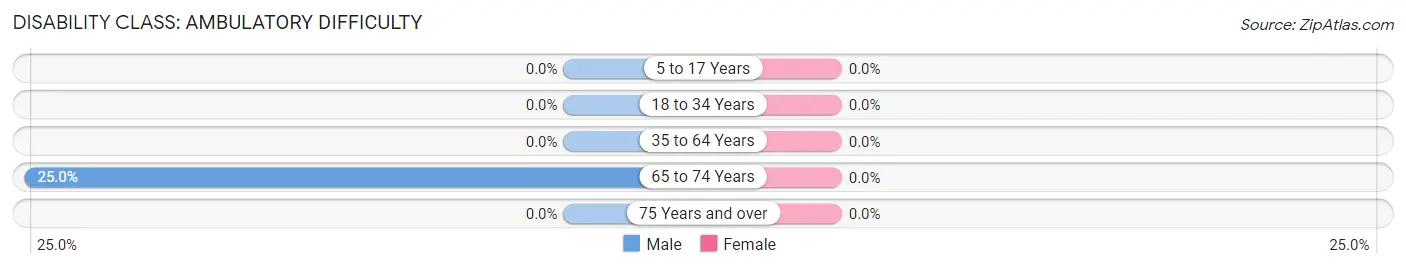
| Age Bracket | Male | Female |
| 5 to 17 Years | 0 (0.0%) | 0 (0.0%) |
| 18 to 34 Years | 0 (0.0%) | 0 (0.0%) |
| 35 to 64 Years | 0 (0.0%) | 0 (0.0%) |
| 65 to 74 Years | 1 (25.0%) | 0 (0.0%) |
| 75 Years and over | 0 (0.0%) | 0 (0.0%) |
Disability Class: Self-Care Difficulty
| Age Bracket | Male | Female |
| 5 to 17 Years | 0 (0.0%) | 0 (0.0%) |
| 18 to 34 Years | 0 (0.0%) | 0 (0.0%) |
| 35 to 64 Years | 0 (0.0%) | 0 (0.0%) |
| 65 to 74 Years | 0 (0.0%) | 0 (0.0%) |
| 75 Years and over | 0 (0.0%) | 0 (0.0%) |
Technology Access in Lupus
Computing Device Access in Lupus
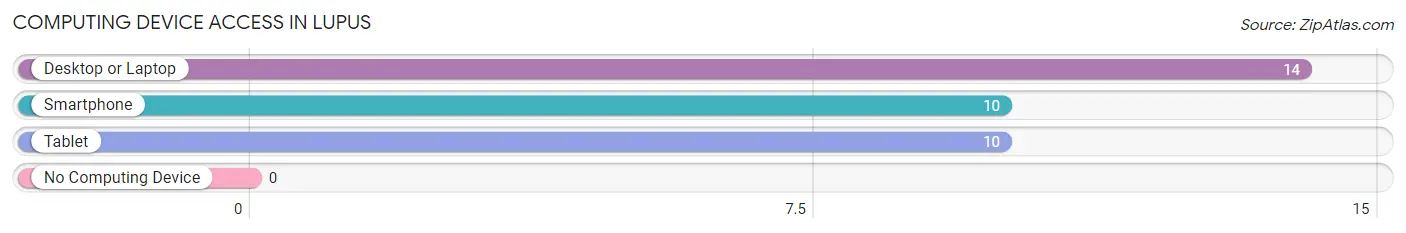
| Device Type | # Households | % Households |
| Desktop or Laptop | 14 | 100.0% |
| Smartphone | 10 | 71.4% |
| Tablet | 10 | 71.4% |
| No Computing Device | 0 | 0.0% |
| Total | 14 | 100.0% |
Internet Access in Lupus
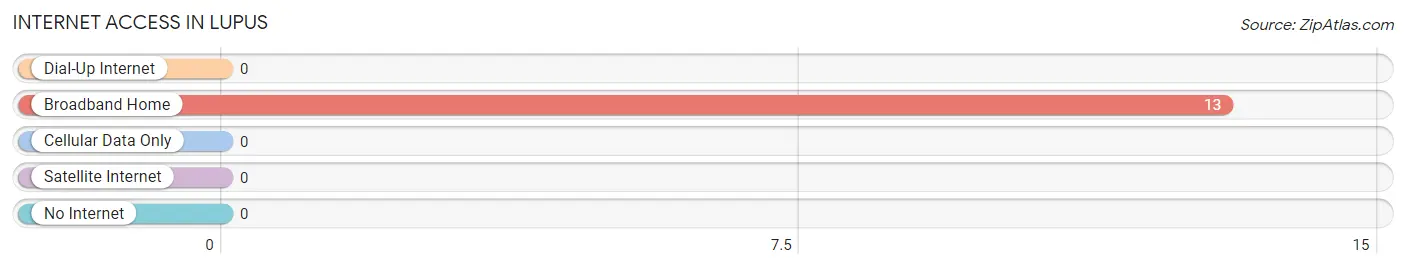
| Internet Type | # Households | % Households |
| Dial-Up Internet | 0 | 0.0% |
| Broadband Home | 13 | 92.9% |
| Cellular Data Only | 0 | 0.0% |
| Satellite Internet | 0 | 0.0% |
| No Internet | 0 | 0.0% |
| Total | 14 | 100.0% |
Lupus Summary
Lupus is an unincorporated community located in Moniteau County, Missouri, United States. It is situated along the Missouri River, approximately 10 miles south of the county seat of California. The population of Lupus was estimated to be around 200 people in 2000.
Geography
Lupus is located at 38°41'45"N 92°25'45"W (38.695833, -92.429167). It is situated along the Missouri River, approximately 10 miles south of the county seat of California. The elevation of Lupus is 645 feet above sea level.
The climate in Lupus is characterized by hot, humid summers and generally mild to cool winters. The average annual temperature is around 57°F, with an average high of around 79°F in the summer and an average low of around 35°F in the winter. The average annual precipitation is around 40 inches.
Economy
The economy of Lupus is largely based on agriculture. The main crops grown in the area are corn, soybeans, wheat, and hay. Livestock production is also important, with beef cattle, dairy cows, and hogs being the main animals raised.
In addition to agriculture, Lupus is home to several small businesses, including a general store, a gas station, a restaurant, and a bar. There is also a post office in the community.
Demographics
As of the 2000 census, there were 200 people living in Lupus. The racial makeup of the town was 97.5% White, 0.5% African American, 0.5% Native American, and 1.5% from two or more races. The median age was 40 years.
The median household income in Lupus was $30,000, and the median family income was $35,000. The per capita income was $14,000. About 10.5% of families and 13.5% of the population were below the poverty line, including 16.5% of those under the age of 18 and none of those 65 and older.
History
Lupus was founded in 1837 by a group of settlers from Kentucky. The town was named after the Latin word for wolf, in honor of the large number of wolves in the area at the time.
In the late 19th century, Lupus was a thriving community, with a population of over 500 people. The town had several stores, a hotel, a blacksmith shop, a school, and a post office.
In the early 20th century, the population of Lupus began to decline as people moved away in search of better economic opportunities. By the 1950s, the population had dropped to around 200 people.
Today, Lupus is a small, rural community. Although the population has remained relatively stable over the past few decades, the town has seen a decline in the number of businesses and services. Despite this, Lupus remains a close-knit community, with a strong sense of pride and identity.
Common Questions
What is Per Capita Income in Lupus?
Per Capita income in Lupus is $27,744.
What is the Median Household income in Lupus?
Median Household Income in Lupus is $44,375.
What is Inequality or Gini Index in Lupus?
Inequality or Gini Index in Lupus is 0.29.
What is the Total Population of Lupus?
Total Population of Lupus is 27.
What is the Total Male Population of Lupus?
Total Male Population of Lupus is 12.
What is the Total Female Population of Lupus?
Total Female Population of Lupus is 15.
What is the Ratio of Males per 100 Females in Lupus?
There are 80.00 Males per 100 Females in Lupus.
What is the Ratio of Females per 100 Males in Lupus?
There are 125.00 Females per 100 Males in Lupus.
What is the Median Population Age in Lupus?
Median Population Age in Lupus is 50.5 Years.
What is the Average Family Size in Lupus
Average Family Size in Lupus is 2.7 People.
What is the Average Household Size in Lupus
Average Household Size in Lupus is 1.9 People.
How Large is the Labor Force in Lupus?
There are 10 People in the Labor Forcein in Lupus.
What is the Percentage of People in the Labor Force in Lupus?
41.7% of People are in the Labor Force in Lupus.