Zip Codes with the Highest Percentage of Population Employed in Computer, Engineering & Science in Florissant, MO
RELATED REPORTS & OPTIONS
Computer, Engineering & Science
Florissant
Compare Zip Codes
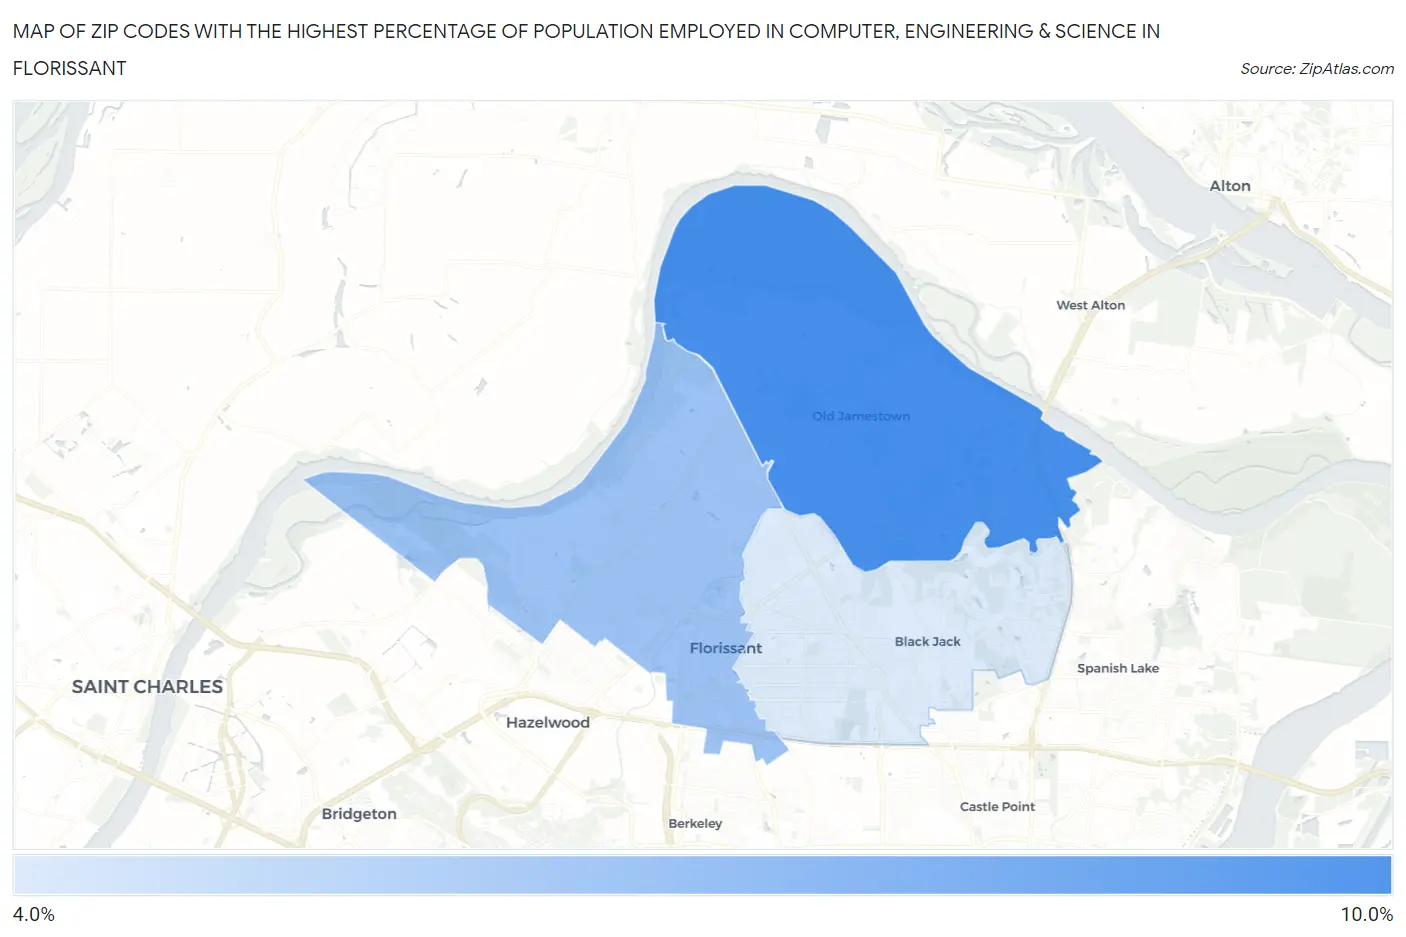
Map of Zip Codes with the Highest Percentage of Population Employed in Computer, Engineering & Science in Florissant
4.2%
10.0%
Zip Codes with the Highest Percentage of Population Employed in Computer, Engineering & Science in Florissant, MO
| Zip Code | % Employed | vs State | vs National | |
| 1. | 63034 | 10.0% | 5.9%(+4.10)#61 | 6.8%(+3.21)#3,239 |
| 2. | 63031 | 6.7% | 5.9%(+0.861)#151 | 6.8%(-0.024)#7,267 |
| 3. | 63033 | 4.2% | 5.9%(-1.65)#283 | 6.8%(-2.53)#13,731 |
1
Common Questions
What are the Top Zip Codes with the Highest Percentage of Population Employed in Computer, Engineering & Science in Florissant, MO?
Top Zip Codes with the Highest Percentage of Population Employed in Computer, Engineering & Science in Florissant, MO are:
What zip code has the Highest Percentage of Population Employed in Computer, Engineering & Science in Florissant, MO?
63034 has the Highest Percentage of Population Employed in Computer, Engineering & Science in Florissant, MO with 10.0%.
What is the Percentage of Population Employed in Computer, Engineering & Science in Florissant, MO?
Percentage of Population Employed in Computer, Engineering & Science in Florissant is 5.5%.
What is the Percentage of Population Employed in Computer, Engineering & Science in Missouri?
Percentage of Population Employed in Computer, Engineering & Science in Missouri is 5.9%.
What is the Percentage of Population Employed in Computer, Engineering & Science in the United States?
Percentage of Population Employed in Computer, Engineering & Science in the United States is 6.8%.