Shell Knob, MO Map & Demographics
Shell Knob Map
Shell Knob Overview
$37,428
PER CAPITA INCOME
$79,044
AVG FAMILY INCOME
$49,853
AVG HOUSEHOLD INCOME
0.42
INEQUALITY / GINI INDEX
1,415
TOTAL POPULATION
721
MALE POPULATION
694
FEMALE POPULATION
103.89
MALES / 100 FEMALES
96.26
FEMALES / 100 MALES
64.5
MEDIAN AGE
2.2
AVG FAMILY SIZE
1.9
AVG HOUSEHOLD SIZE
483
LABOR FORCE [ PEOPLE ]
36.3%
PERCENT IN LABOR FORCE
3.1%
UNEMPLOYMENT RATE
Shell Knob Zip Codes
Shell Knob Area Codes
Income in Shell Knob
Income Overview in Shell Knob
Per Capita Income in Shell Knob is $37,428, while median incomes of families and households are $79,044 and $49,853 respectively.
| Characteristic | Number | Measure |
| Per Capita Income | 1,415 | $37,428 |
| Median Family Income | 483 | $79,044 |
| Mean Family Income | 483 | $91,722 |
| Median Household Income | 736 | $49,853 |
| Mean Household Income | 736 | $73,625 |
| Income Deficit | 483 | $0 |
| Wage / Income Gap (%) | 1,415 | 0.00% |
| Wage / Income Gap ($) | 1,415 | 100.00¢ per $1 |
| Gini / Inequality Index | 1,415 | 0.42 |
Earnings by Sex in Shell Knob
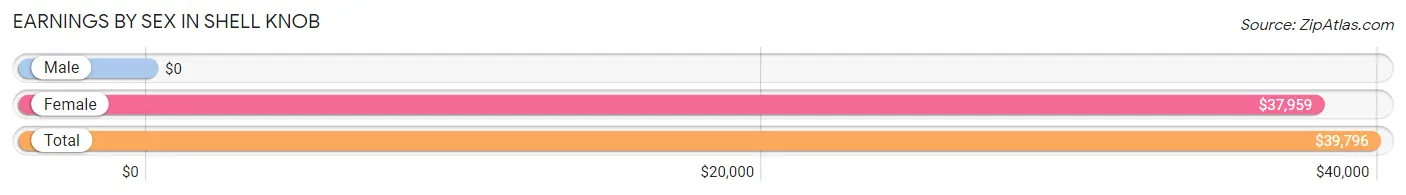
| Sex | Number | Average Earnings |
| Male | 352 (67.7%) | $0 |
| Female | 168 (32.3%) | $37,959 |
| Total | 520 (100.0%) | $39,796 |
Earnings by Sex by Income Bracket in Shell Knob
The most common earnings brackets in Shell Knob are $100,000+ for men (95 | 27.0%) and $35,000 to $39,999 for women (49 | 29.2%).
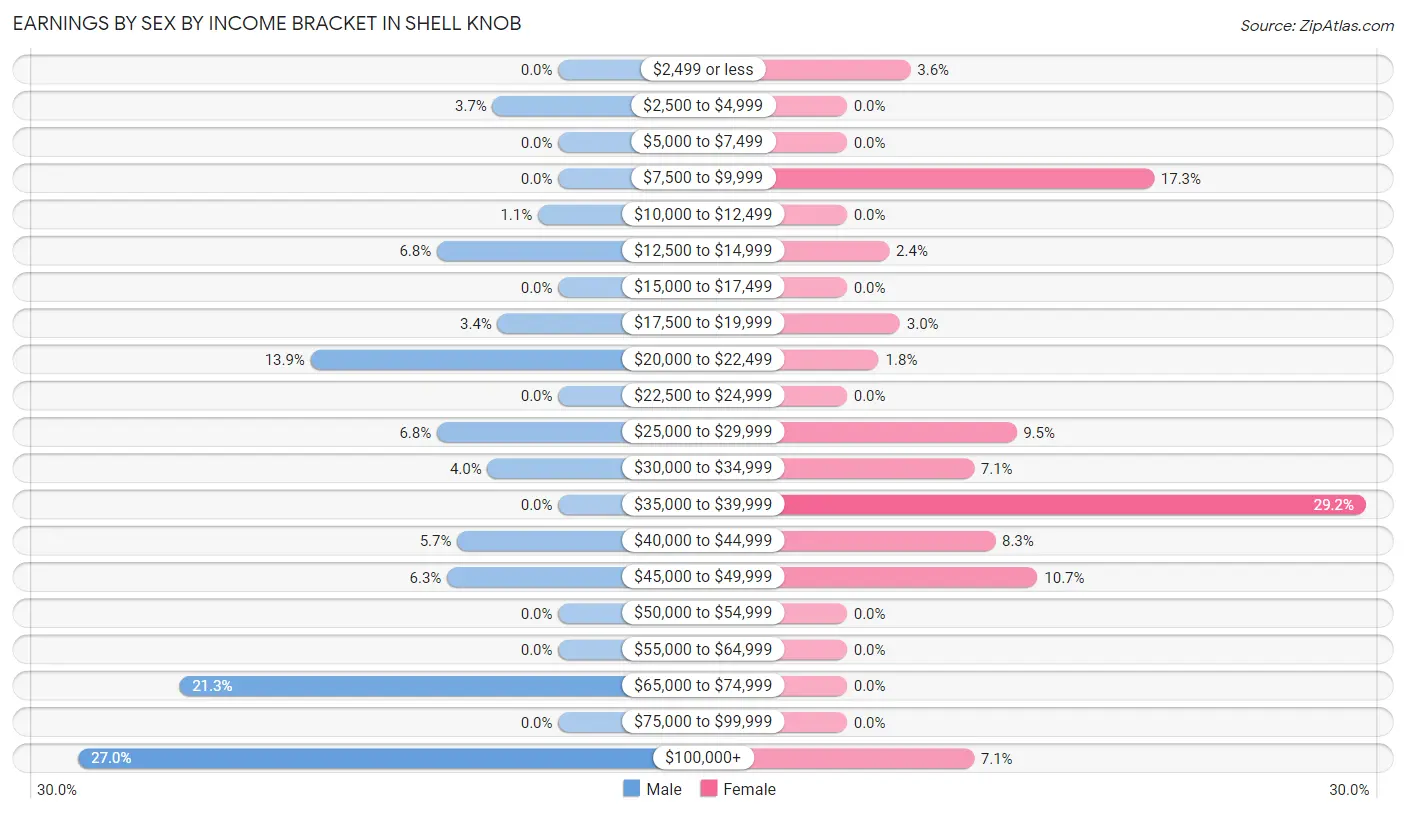
| Income | Male | Female |
| $2,499 or less | 0 (0.0%) | 6 (3.6%) |
| $2,500 to $4,999 | 13 (3.7%) | 0 (0.0%) |
| $5,000 to $7,499 | 0 (0.0%) | 0 (0.0%) |
| $7,500 to $9,999 | 0 (0.0%) | 29 (17.3%) |
| $10,000 to $12,499 | 4 (1.1%) | 0 (0.0%) |
| $12,500 to $14,999 | 24 (6.8%) | 4 (2.4%) |
| $15,000 to $17,499 | 0 (0.0%) | 0 (0.0%) |
| $17,500 to $19,999 | 12 (3.4%) | 5 (3.0%) |
| $20,000 to $22,499 | 49 (13.9%) | 3 (1.8%) |
| $22,500 to $24,999 | 0 (0.0%) | 0 (0.0%) |
| $25,000 to $29,999 | 24 (6.8%) | 16 (9.5%) |
| $30,000 to $34,999 | 14 (4.0%) | 12 (7.1%) |
| $35,000 to $39,999 | 0 (0.0%) | 49 (29.2%) |
| $40,000 to $44,999 | 20 (5.7%) | 14 (8.3%) |
| $45,000 to $49,999 | 22 (6.2%) | 18 (10.7%) |
| $50,000 to $54,999 | 0 (0.0%) | 0 (0.0%) |
| $55,000 to $64,999 | 0 (0.0%) | 0 (0.0%) |
| $65,000 to $74,999 | 75 (21.3%) | 0 (0.0%) |
| $75,000 to $99,999 | 0 (0.0%) | 0 (0.0%) |
| $100,000+ | 95 (27.0%) | 12 (7.1%) |
| Total | 352 (100.0%) | 168 (100.0%) |
Earnings by Sex by Educational Attainment in Shell Knob
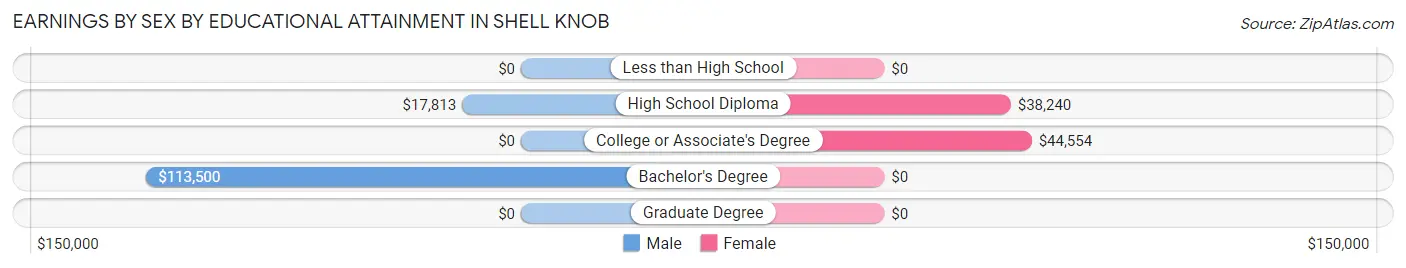
| Educational Attainment | Male Income | Female Income |
| Less than High School | - | - |
| High School Diploma | $17,813 | $38,240 |
| College or Associate's Degree | - | - |
| Bachelor's Degree | $113,500 | $0 |
| Graduate Degree | - | - |
| Total | - | - |
Family Income in Shell Knob
Family Income Brackets in Shell Knob
According to the Shell Knob family income data, there are 186 families falling into the $100,000 to $149,999 income range, which is the most common income bracket and makes up 38.5% of all families.
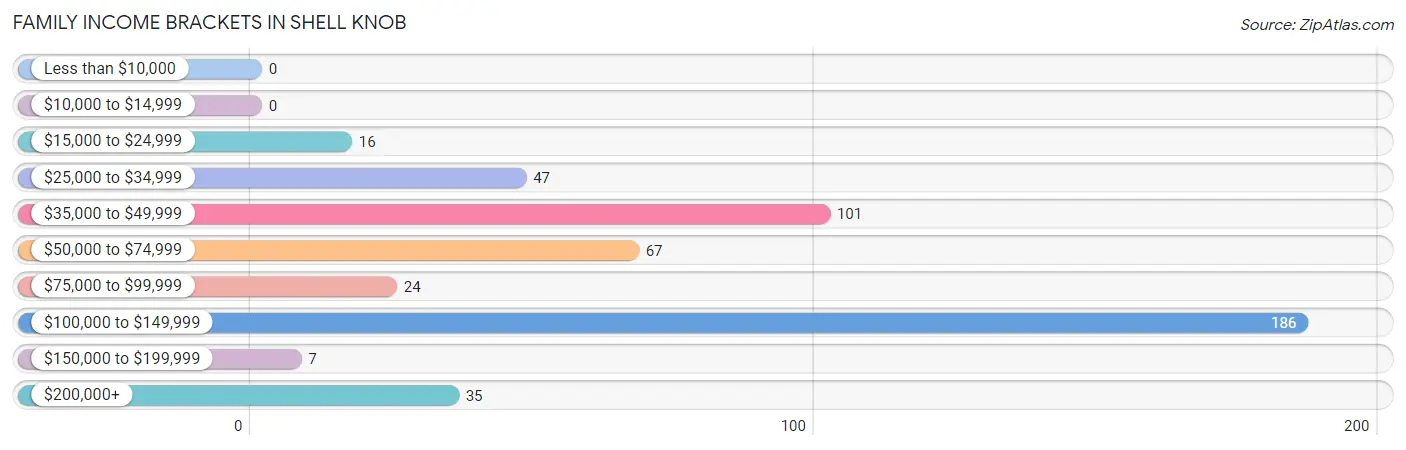
| Income Bracket | # Families | % Families |
| Less than $10,000 | 0 | 0.0% |
| $10,000 to $14,999 | 0 | 0.0% |
| $15,000 to $24,999 | 16 | 3.3% |
| $25,000 to $34,999 | 47 | 9.7% |
| $35,000 to $49,999 | 101 | 20.9% |
| $50,000 to $74,999 | 67 | 13.9% |
| $75,000 to $99,999 | 24 | 5.0% |
| $100,000 to $149,999 | 186 | 38.5% |
| $150,000 to $199,999 | 7 | 1.4% |
| $200,000+ | 35 | 7.2% |
Family Income by Famaliy Size in Shell Knob
| Income Bracket | # Families | Median Income |
| 2-Person Families | 387 (80.1%) | $0 |
| 3-Person Families | 4 (0.8%) | $0 |
| 4-Person Families | 67 (13.9%) | $0 |
| 5-Person Families | 25 (5.2%) | $0 |
| 6-Person Families | 0 (0.0%) | $0 |
| 7+ Person Families | 0 (0.0%) | $0 |
| Total | 483 (100.0%) | $79,044 |
Family Income by Number of Earners in Shell Knob
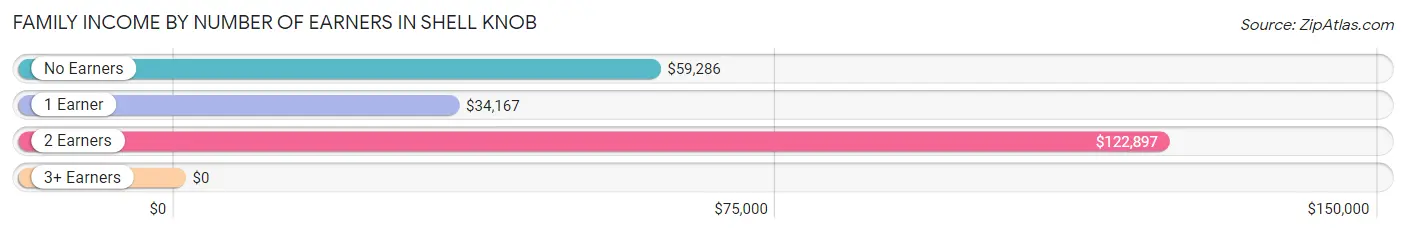
| Number of Earners | # Families | Median Income |
| No Earners | 210 (43.5%) | $59,286 |
| 1 Earner | 46 (9.5%) | $34,167 |
| 2 Earners | 223 (46.2%) | $122,897 |
| 3+ Earners | 4 (0.8%) | $0 |
| Total | 483 (100.0%) | $79,044 |
Household Income in Shell Knob
Household Income Brackets in Shell Knob
With 186 households falling in the category, the $100,000 to $149,999 income range is the most frequent in Shell Knob, accounting for 25.3% of all households. In contrast, only 7 households (0.9%) fall into the $150,000 to $199,999 income bracket, making it the least populous group.
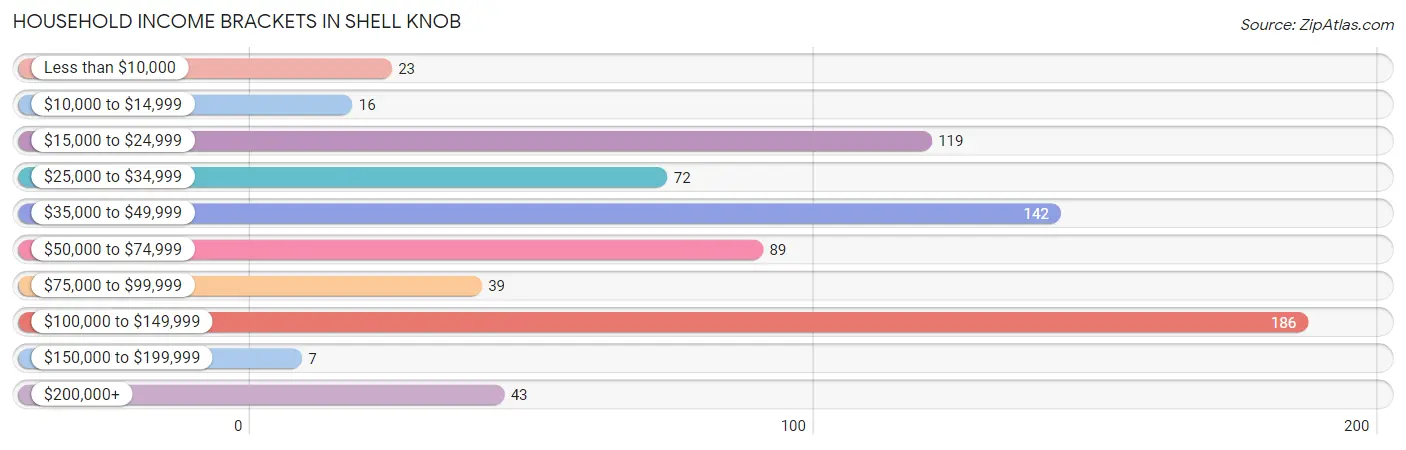
| Income Bracket | # Households | % Households |
| Less than $10,000 | 23 | 3.1% |
| $10,000 to $14,999 | 16 | 2.2% |
| $15,000 to $24,999 | 119 | 16.2% |
| $25,000 to $34,999 | 72 | 9.8% |
| $35,000 to $49,999 | 142 | 19.3% |
| $50,000 to $74,999 | 89 | 12.1% |
| $75,000 to $99,999 | 39 | 5.3% |
| $100,000 to $149,999 | 186 | 25.3% |
| $150,000 to $199,999 | 7 | 1.0% |
| $200,000+ | 43 | 5.8% |
Household Income by Householder Age in Shell Knob
The median household income in Shell Knob is $49,853, with the highest median household income of $49,206 found in the 65+ years age bracket for the primary householder. A total of 424 households (57.6%) fall into this category.
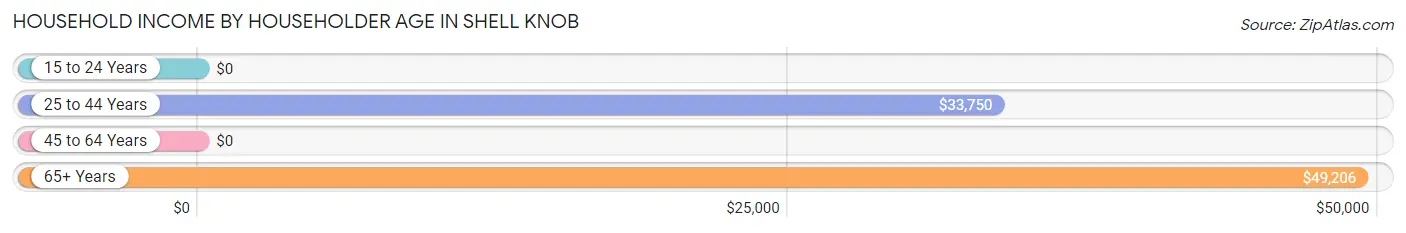
| Income Bracket | # Households | Median Income |
| 15 to 24 Years | 0 (0.0%) | $0 |
| 25 to 44 Years | 42 (5.7%) | $33,750 |
| 45 to 64 Years | 270 (36.7%) | $0 |
| 65+ Years | 424 (57.6%) | $49,206 |
| Total | 736 (100.0%) | $49,853 |
Poverty in Shell Knob
Income Below Poverty by Sex and Age in Shell Knob
With 10.3% poverty level for males and 19.7% for females among the residents of Shell Knob, 5 year old males and 25 to 34 year old females are the most vulnerable to poverty, with 14 males (100.0%) and 15 females (83.3%) in their respective age groups living below the poverty level.
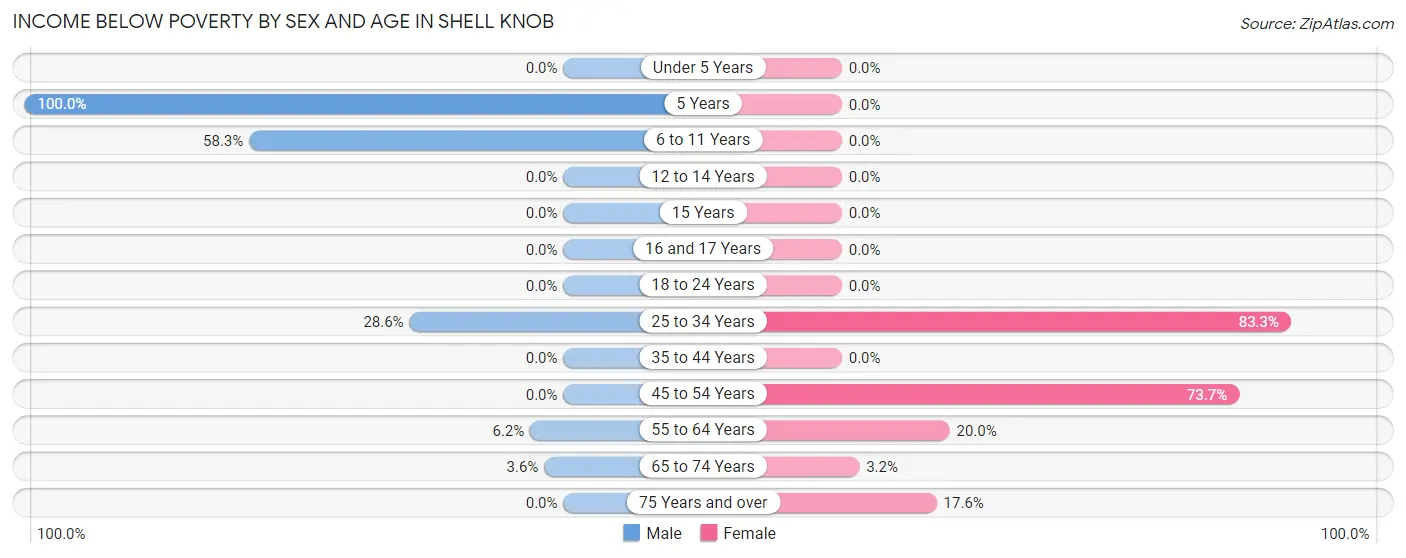
| Age Bracket | Male | Female |
| Under 5 Years | 0 (0.0%) | 0 (0.0%) |
| 5 Years | 14 (100.0%) | 0 (0.0%) |
| 6 to 11 Years | 28 (58.3%) | 0 (0.0%) |
| 12 to 14 Years | 0 (0.0%) | 0 (0.0%) |
| 15 Years | 0 (0.0%) | 0 (0.0%) |
| 16 and 17 Years | 0 (0.0%) | 0 (0.0%) |
| 18 to 24 Years | 0 (0.0%) | 0 (0.0%) |
| 25 to 34 Years | 14 (28.6%) | 15 (83.3%) |
| 35 to 44 Years | 0 (0.0%) | 0 (0.0%) |
| 45 to 54 Years | 0 (0.0%) | 73 (73.7%) |
| 55 to 64 Years | 10 (6.2%) | 15 (20.0%) |
| 65 to 74 Years | 8 (3.6%) | 6 (3.2%) |
| 75 Years and over | 0 (0.0%) | 28 (17.6%) |
| Total | 74 (10.3%) | 137 (19.7%) |
Income Above Poverty by Sex and Age in Shell Knob
According to the poverty statistics in Shell Knob, males aged 45 to 54 years and females aged 6 to 11 years are the age groups that are most secure financially, with 100.0% of males and 100.0% of females in these age groups living above the poverty line.
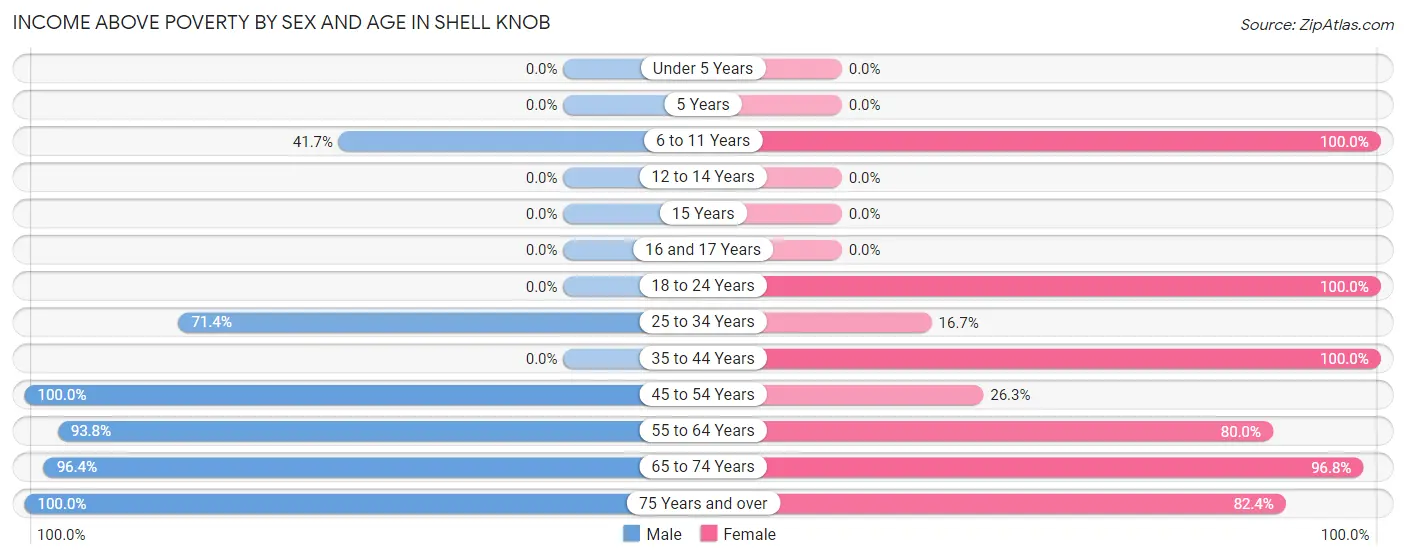
| Age Bracket | Male | Female |
| Under 5 Years | 0 (0.0%) | 0 (0.0%) |
| 5 Years | 0 (0.0%) | 0 (0.0%) |
| 6 to 11 Years | 20 (41.7%) | 22 (100.0%) |
| 12 to 14 Years | 0 (0.0%) | 0 (0.0%) |
| 15 Years | 0 (0.0%) | 0 (0.0%) |
| 16 and 17 Years | 0 (0.0%) | 0 (0.0%) |
| 18 to 24 Years | 0 (0.0%) | 40 (100.0%) |
| 25 to 34 Years | 35 (71.4%) | 3 (16.7%) |
| 35 to 44 Years | 0 (0.0%) | 95 (100.0%) |
| 45 to 54 Years | 117 (100.0%) | 26 (26.3%) |
| 55 to 64 Years | 152 (93.8%) | 60 (80.0%) |
| 65 to 74 Years | 217 (96.4%) | 180 (96.8%) |
| 75 Years and over | 106 (100.0%) | 131 (82.4%) |
| Total | 647 (89.7%) | 557 (80.3%) |
Income Below Poverty Among Married-Couple Families in Shell Knob
The poverty statistics for married-couple families in Shell Knob show that 5.0% or 23 of the total 463 families live below the poverty line. Families with 3 or 4 children have the highest poverty rate of 60.0%, comprising of 15 families. On the other hand, families with no children have the lowest poverty rate of 1.8%, which includes 8 families.
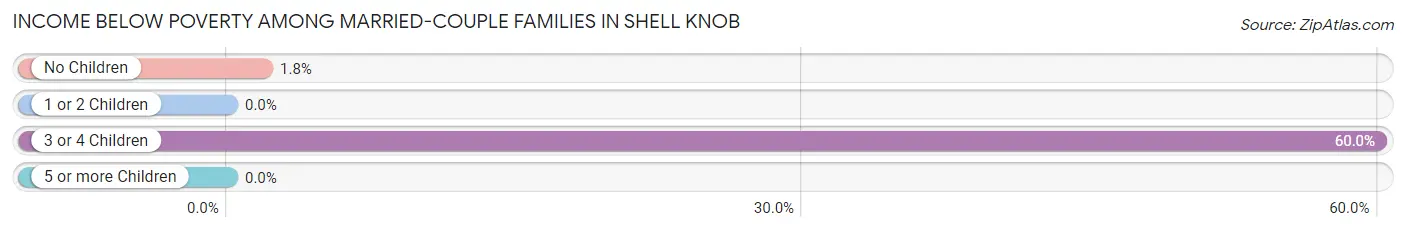
| Children | Above Poverty | Below Poverty |
| No Children | 430 (98.2%) | 8 (1.8%) |
| 1 or 2 Children | 0 (0.0%) | 0 (0.0%) |
| 3 or 4 Children | 10 (40.0%) | 15 (60.0%) |
| 5 or more Children | 0 (0.0%) | 0 (0.0%) |
| Total | 440 (95.0%) | 23 (5.0%) |
Income Below Poverty Among Single-Parent Households in Shell Knob
| Children | Single Father | Single Mother |
| No Children | 0 (0.0%) | 0 (0.0%) |
| 1 or 2 Children | 0 (0.0%) | 0 (0.0%) |
| 3 or 4 Children | 0 (0.0%) | 0 (0.0%) |
| 5 or more Children | 0 (0.0%) | 0 (0.0%) |
| Total | 0 (0.0%) | 0 (0.0%) |
Income Below Poverty Among Married-Couple vs Single-Parent Households in Shell Knob
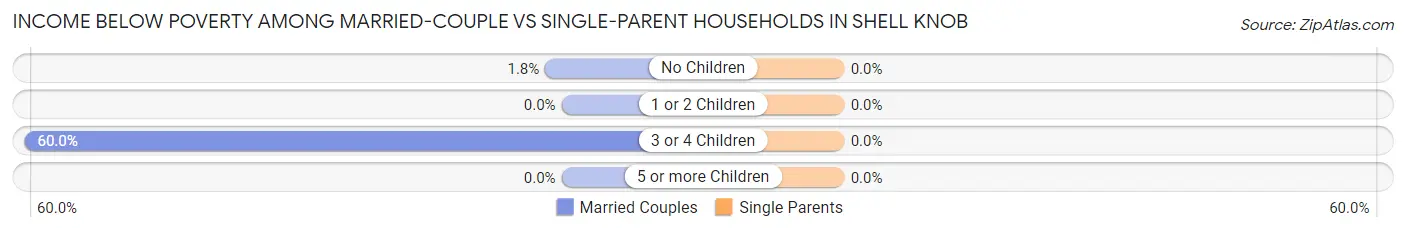
| Children | Married-Couple Families | Single-Parent Households |
| No Children | 8 (1.8%) | 0 (0.0%) |
| 1 or 2 Children | 0 (0.0%) | 0 (0.0%) |
| 3 or 4 Children | 15 (60.0%) | 0 (0.0%) |
| 5 or more Children | 0 (0.0%) | 0 (0.0%) |
| Total | 23 (5.0%) | 0 (0.0%) |
Race in Shell Knob
The most populous races in Shell Knob are White / Caucasian (1,150 | 81.3%), Two or more Races (227 | 16.0%), and Hispanic or Latino (149 | 10.5%).
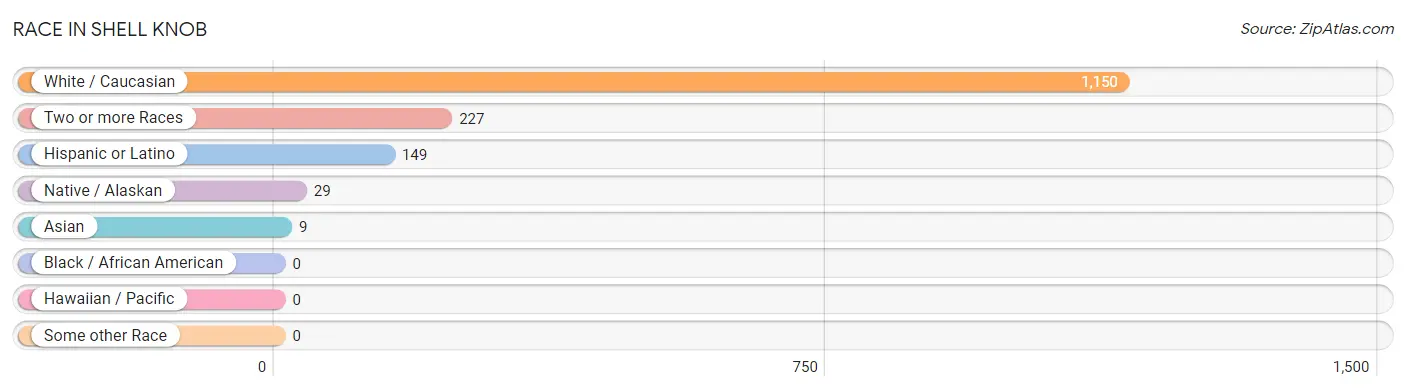
| Race | # Population | % Population |
| Asian | 9 | 0.6% |
| Black / African American | 0 | 0.0% |
| Hawaiian / Pacific | 0 | 0.0% |
| Hispanic or Latino | 149 | 10.5% |
| Native / Alaskan | 29 | 2.1% |
| White / Caucasian | 1,150 | 81.3% |
| Two or more Races | 227 | 16.0% |
| Some other Race | 0 | 0.0% |
| Total | 1,415 | 100.0% |
Ancestry in Shell Knob
The most populous ancestries reported in Shell Knob are German (260 | 18.4%), English (168 | 11.9%), Mexican (149 | 10.5%), Italian (85 | 6.0%), and French (52 | 3.7%), together accounting for 50.4% of all Shell Knob residents.
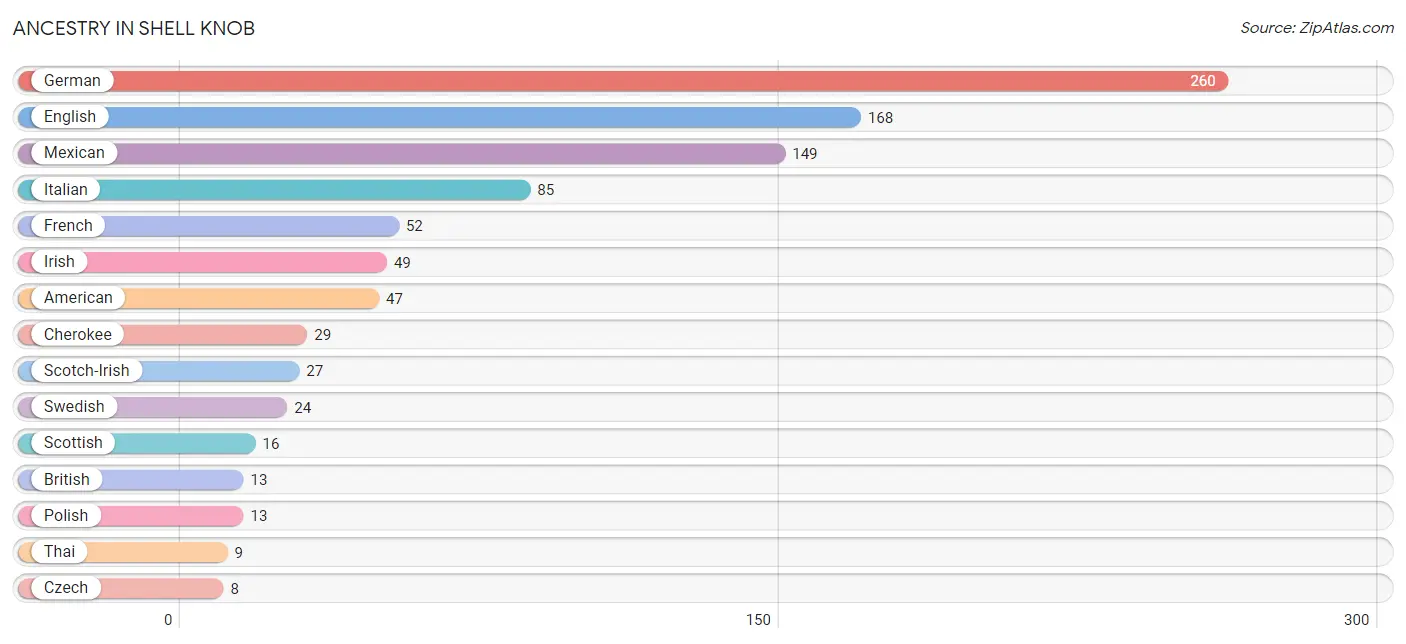
| Ancestry | # Population | % Population |
| American | 47 | 3.3% |
| British | 13 | 0.9% |
| Bulgarian | 5 | 0.4% |
| Cherokee | 29 | 2.1% |
| Czech | 8 | 0.6% |
| Dutch | 8 | 0.6% |
| English | 168 | 11.9% |
| French | 52 | 3.7% |
| German | 260 | 18.4% |
| Irish | 49 | 3.5% |
| Italian | 85 | 6.0% |
| Mexican | 149 | 10.5% |
| Polish | 13 | 0.9% |
| Scotch-Irish | 27 | 1.9% |
| Scottish | 16 | 1.1% |
| Swedish | 24 | 1.7% |
| Swiss | 8 | 0.6% |
| Thai | 9 | 0.6% |
| Welsh | 5 | 0.4% | View All 19 Rows |
Immigrants in Shell Knob
The most numerous immigrant groups reported in Shell Knob came from Caribbean (9 | 0.6%), Latin America (9 | 0.6%), and Trinidad and Tobago (9 | 0.6%), together accounting for 1.9% of all Shell Knob residents.
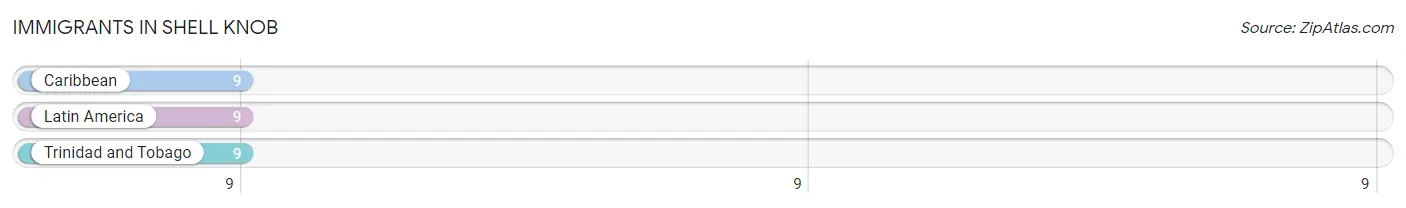
| Immigration Origin | # Population | % Population |
| Caribbean | 9 | 0.6% |
| Latin America | 9 | 0.6% |
| Trinidad and Tobago | 9 | 0.6% | View All 3 Rows |
Sex and Age in Shell Knob
Sex and Age in Shell Knob
The most populous age groups in Shell Knob are 65 to 69 Years (191 | 26.5%) for men and 80 to 84 Years (104 | 15.0%) for women.
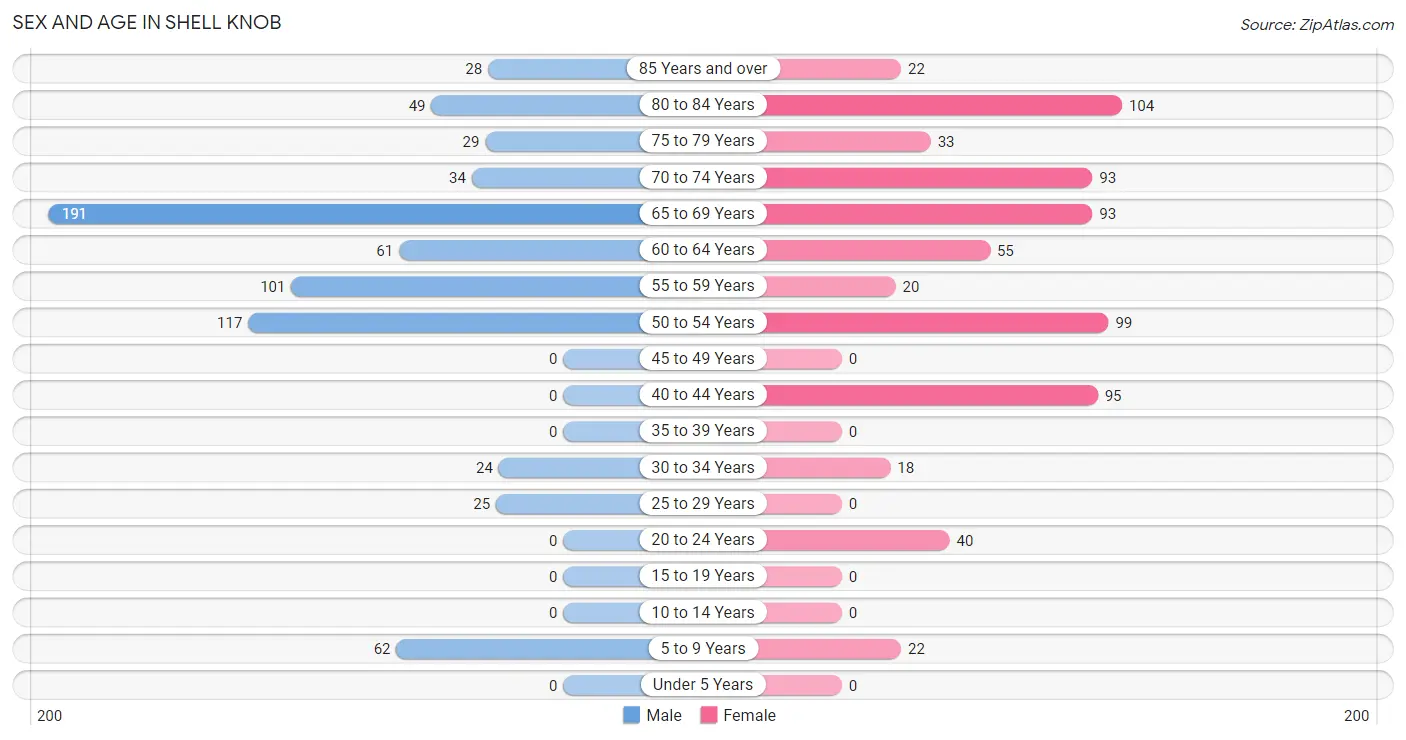
| Age Bracket | Male | Female |
| Under 5 Years | 0 (0.0%) | 0 (0.0%) |
| 5 to 9 Years | 62 (8.6%) | 22 (3.2%) |
| 10 to 14 Years | 0 (0.0%) | 0 (0.0%) |
| 15 to 19 Years | 0 (0.0%) | 0 (0.0%) |
| 20 to 24 Years | 0 (0.0%) | 40 (5.8%) |
| 25 to 29 Years | 25 (3.5%) | 0 (0.0%) |
| 30 to 34 Years | 24 (3.3%) | 18 (2.6%) |
| 35 to 39 Years | 0 (0.0%) | 0 (0.0%) |
| 40 to 44 Years | 0 (0.0%) | 95 (13.7%) |
| 45 to 49 Years | 0 (0.0%) | 0 (0.0%) |
| 50 to 54 Years | 117 (16.2%) | 99 (14.3%) |
| 55 to 59 Years | 101 (14.0%) | 20 (2.9%) |
| 60 to 64 Years | 61 (8.5%) | 55 (7.9%) |
| 65 to 69 Years | 191 (26.5%) | 93 (13.4%) |
| 70 to 74 Years | 34 (4.7%) | 93 (13.4%) |
| 75 to 79 Years | 29 (4.0%) | 33 (4.8%) |
| 80 to 84 Years | 49 (6.8%) | 104 (15.0%) |
| 85 Years and over | 28 (3.9%) | 22 (3.2%) |
| Total | 721 (100.0%) | 694 (100.0%) |
Families and Households in Shell Knob
Median Family Size in Shell Knob
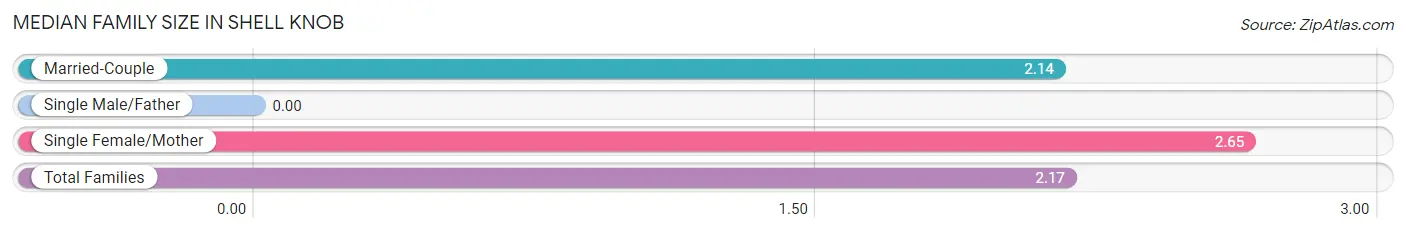
| Family Type | # Families | Family Size |
| Married-Couple | 463 (95.9%) | 2.14 |
| Single Male/Father | 0 (0.0%) | - |
| Single Female/Mother | 20 (4.1%) | 2.65 |
| Total Families | 483 (100.0%) | 2.17 |
Median Household Size in Shell Knob
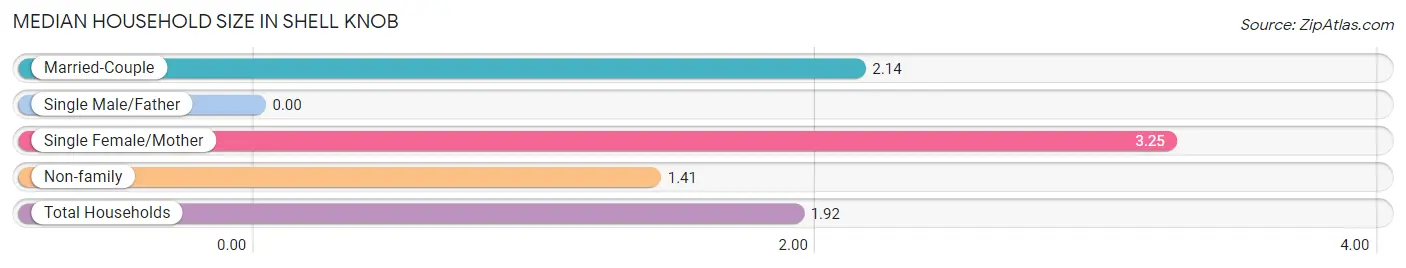
| Household Type | # Households | Household Size |
| Married-Couple | 463 (62.9%) | 2.14 |
| Single Male/Father | 0 (0.0%) | - |
| Single Female/Mother | 20 (2.7%) | 3.25 |
| Non-family | 253 (34.4%) | 1.41 |
| Total Households | 736 (100.0%) | 1.92 |
Household Size by Marriage Status in Shell Knob
Out of a total of 736 households in Shell Knob, 483 (65.6%) are family households, while 253 (34.4%) are nonfamily households. The most numerous type of family households are 2-person households, comprising 379, and the most common type of nonfamily households are 1-person households, comprising 170.
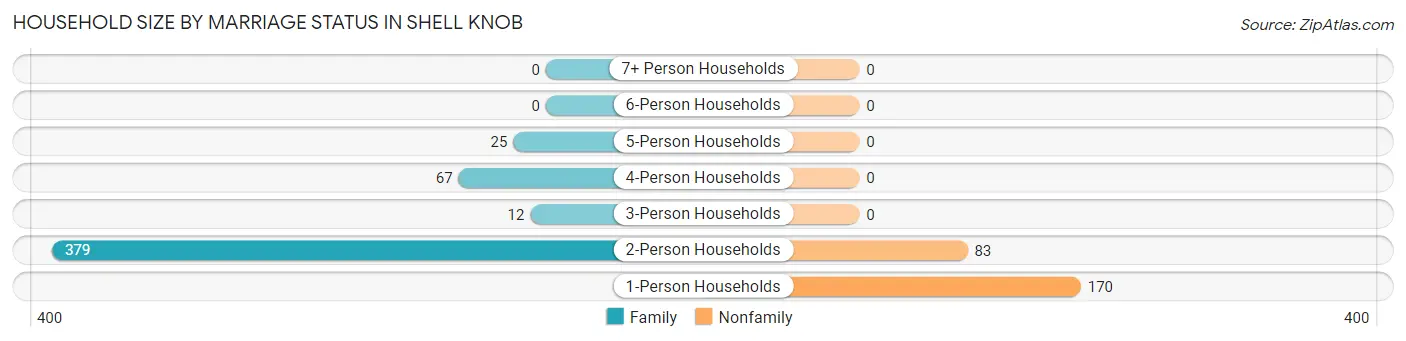
| Household Size | Family Households | Nonfamily Households |
| 1-Person Households | - | 170 (23.1%) |
| 2-Person Households | 379 (51.5%) | 83 (11.3%) |
| 3-Person Households | 12 (1.6%) | 0 (0.0%) |
| 4-Person Households | 67 (9.1%) | 0 (0.0%) |
| 5-Person Households | 25 (3.4%) | 0 (0.0%) |
| 6-Person Households | 0 (0.0%) | 0 (0.0%) |
| 7+ Person Households | 0 (0.0%) | 0 (0.0%) |
| Total | 483 (65.6%) | 253 (34.4%) |
Female Fertility in Shell Knob
Fertility by Age in Shell Knob
| Age Bracket | Women with Births | Births / 1,000 Women |
| 15 to 19 years | 0 (0.0%) | 0.0 |
| 20 to 34 years | 0 (0.0%) | 0.0 |
| 35 to 50 years | 0 (0.0%) | 0.0 |
| Total | 0 (0.0%) | 0.0 |
Fertility by Age by Marriage Status in Shell Knob
| Age Bracket | Married | Unmarried |
| 15 to 19 years | 0 (0.0%) | 0 (0.0%) |
| 20 to 34 years | 0 (0.0%) | 0 (0.0%) |
| 35 to 50 years | 0 (0.0%) | 0 (0.0%) |
| Total | 0 (0.0%) | 0 (0.0%) |
Fertility by Education in Shell Knob
| Educational Attainment | Women with Births | Births / 1,000 Women |
| Less than High School | 0 (0.0%) | 0.0 |
| High School Diploma | 0 (0.0%) | 0.0 |
| College or Associate's Degree | 0 (0.0%) | 0.0 |
| Bachelor's Degree | 0 (0.0%) | 0.0 |
| Graduate Degree | 0 (0.0%) | 0.0 |
| Total | 0 (0.0%) | 0.0 |
Fertility by Education by Marriage Status in Shell Knob
| Educational Attainment | Married | Unmarried |
| Less than High School | 0 (0.0%) | 0 (0.0%) |
| High School Diploma | 0 (0.0%) | 0 (0.0%) |
| College or Associate's Degree | 0 (0.0%) | 0 (0.0%) |
| Bachelor's Degree | 0 (0.0%) | 0 (0.0%) |
| Graduate Degree | 0 (0.0%) | 0 (0.0%) |
| Total | 0 (0.0%) | 0 (0.0%) |
Employment Characteristics in Shell Knob
Employment by Class of Employer in Shell Knob
Among the 463 employed individuals in Shell Knob, private company employees (293 | 63.3%), self-employed (not incorporated) (140 | 30.2%), and local government employees (17 | 3.7%) make up the most common classes of employment.
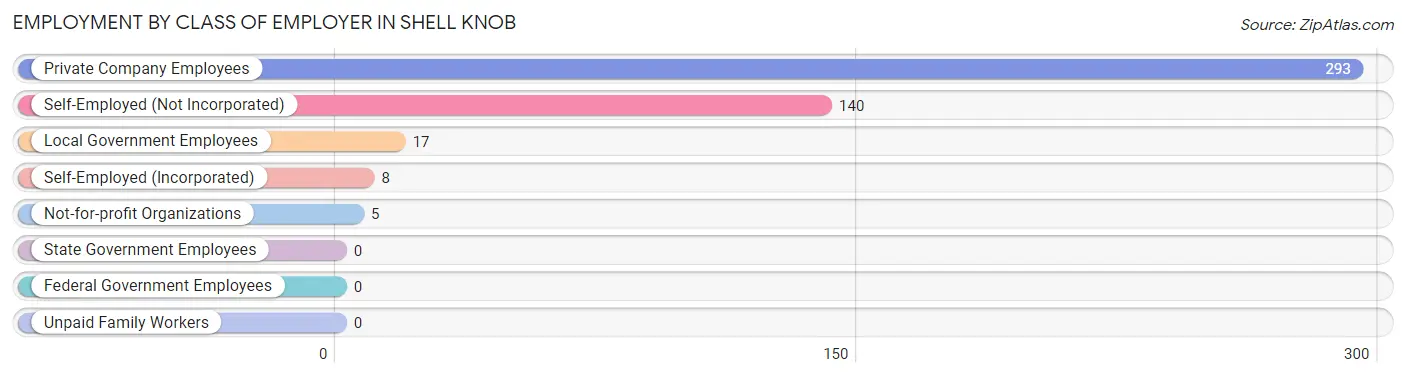
| Employer Class | # Employees | % Employees |
| Private Company Employees | 293 | 63.3% |
| Self-Employed (Incorporated) | 8 | 1.7% |
| Self-Employed (Not Incorporated) | 140 | 30.2% |
| Not-for-profit Organizations | 5 | 1.1% |
| Local Government Employees | 17 | 3.7% |
| State Government Employees | 0 | 0.0% |
| Federal Government Employees | 0 | 0.0% |
| Unpaid Family Workers | 0 | 0.0% |
| Total | 463 | 100.0% |
Employment Status by Age in Shell Knob
According to the labor force statistics for Shell Knob, out of the total population over 16 years of age (1,331), 36.3% or 483 individuals are in the labor force, with 3.1% or 15 of them unemployed. The age group with the highest labor force participation rate is 30 to 34 years, with 100.0% or 42 individuals in the labor force. Within the labor force, the 30 to 34 years age range has the highest percentage of unemployed individuals, with 35.7% or 15 of them being unemployed.
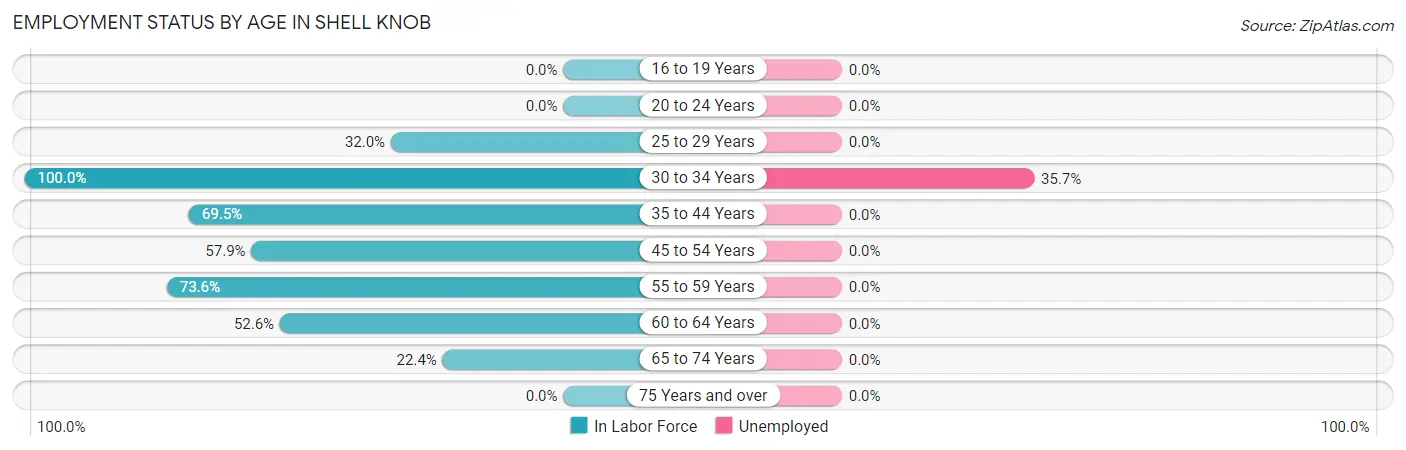
| Age Bracket | In Labor Force | Unemployed |
| 16 to 19 Years | 0 (0.0%) | 0 (0.0%) |
| 20 to 24 Years | 0 (0.0%) | 0 (0.0%) |
| 25 to 29 Years | 8 (32.0%) | 0 (0.0%) |
| 30 to 34 Years | 42 (100.0%) | 15 (35.7%) |
| 35 to 44 Years | 66 (69.5%) | 0 (0.0%) |
| 45 to 54 Years | 125 (57.9%) | 0 (0.0%) |
| 55 to 59 Years | 89 (73.6%) | 0 (0.0%) |
| 60 to 64 Years | 61 (52.6%) | 0 (0.0%) |
| 65 to 74 Years | 92 (22.4%) | 0 (0.0%) |
| 75 Years and over | 0 (0.0%) | 0 (0.0%) |
| Total | 483 (36.3%) | 15 (3.1%) |
Employment Status by Educational Attainment in Shell Knob
According to labor force statistics for Shell Knob, 63.6% of individuals (391) out of the total population between 25 and 64 years of age (615) are in the labor force, with 3.8% or 15 of them being unemployed. The group with the highest labor force participation rate are those with the educational attainment of college / associate degree, with 81.1% or 99 individuals in the labor force. Within the labor force, individuals with college / associate degree education have the highest percentage of unemployment, with 15.2% or 15 of them being unemployed.
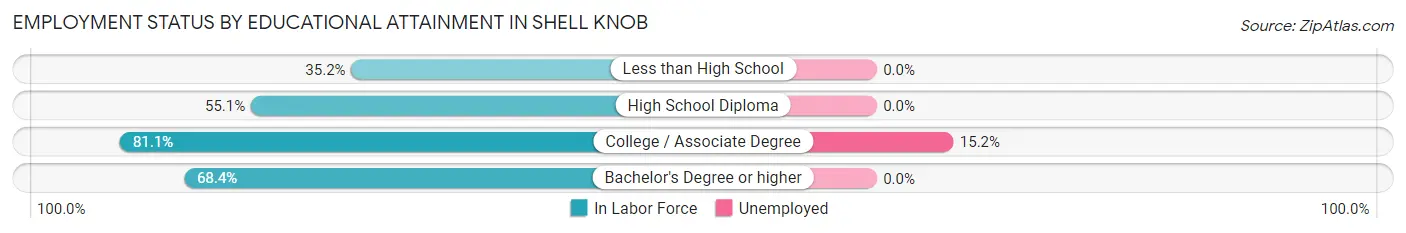
| Educational Attainment | In Labor Force | Unemployed |
| Less than High School | 19 (35.2%) | 0 (0.0%) |
| High School Diploma | 113 (55.1%) | 0 (0.0%) |
| College / Associate Degree | 99 (81.1%) | 19 (15.2%) |
| Bachelor's Degree or higher | 160 (68.4%) | 0 (0.0%) |
| Total | 391 (63.6%) | 23 (3.8%) |
Employment Occupations by Sex in Shell Knob
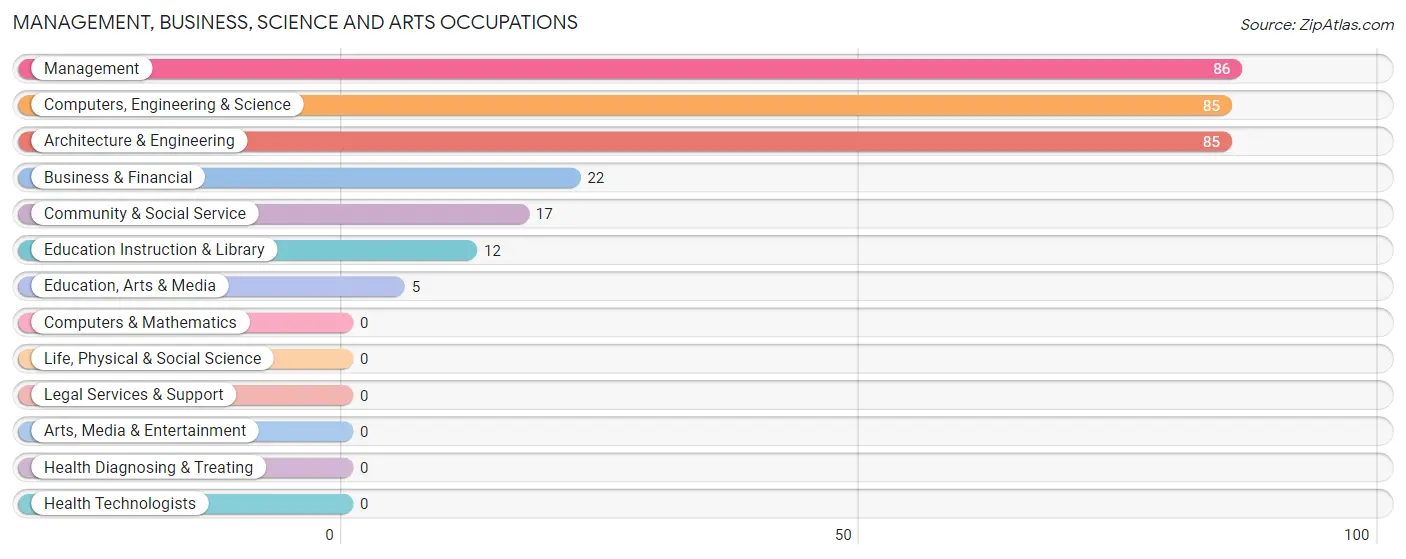
Management, Business, Science and Arts Occupations
The most common Management, Business, Science and Arts occupations in Shell Knob are Management (86 | 18.4%), Computers, Engineering & Science (85 | 18.2%), Architecture & Engineering (85 | 18.2%), Business & Financial (22 | 4.7%), and Community & Social Service (17 | 3.6%).
Management, Business, Science and Arts Occupations by Sex
Within the Management, Business, Science and Arts occupations in Shell Knob, the most male-oriented occupations are Computers, Engineering & Science (100.0%), Architecture & Engineering (100.0%), and Education, Arts & Media (100.0%), while the most female-oriented occupations are Education Instruction & Library (100.0%), Community & Social Service (70.6%), and Business & Financial (63.6%).
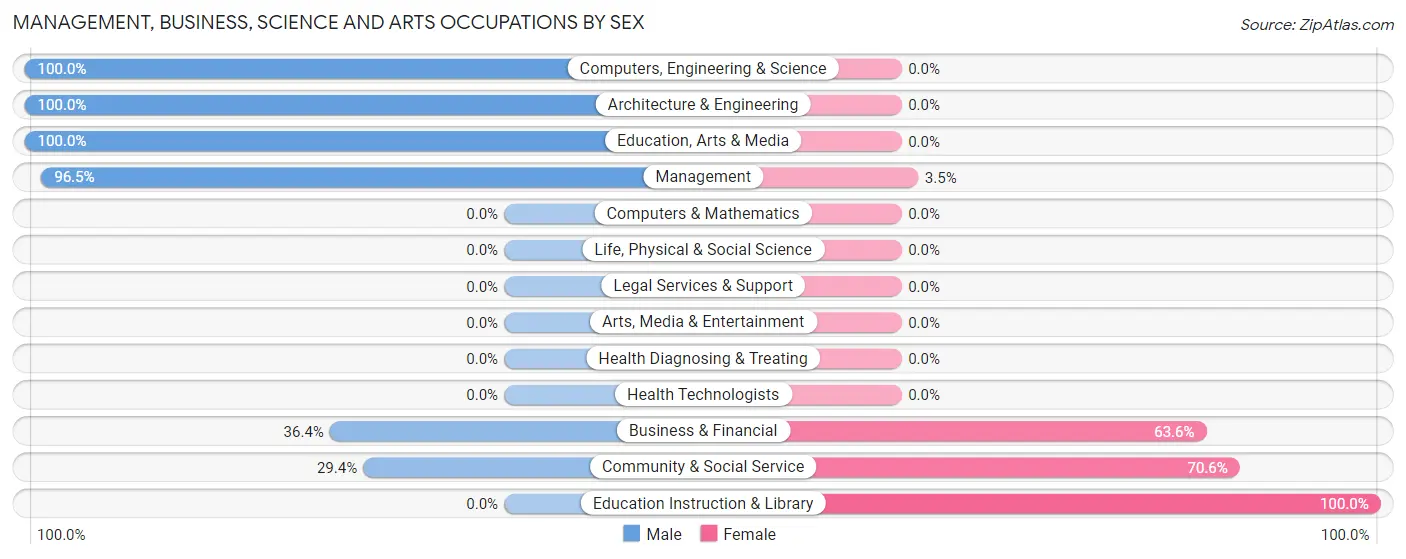
| Occupation | Male | Female |
| Management | 83 (96.5%) | 3 (3.5%) |
| Business & Financial | 8 (36.4%) | 14 (63.6%) |
| Computers, Engineering & Science | 85 (100.0%) | 0 (0.0%) |
| Computers & Mathematics | 0 (0.0%) | 0 (0.0%) |
| Architecture & Engineering | 85 (100.0%) | 0 (0.0%) |
| Life, Physical & Social Science | 0 (0.0%) | 0 (0.0%) |
| Community & Social Service | 5 (29.4%) | 12 (70.6%) |
| Education, Arts & Media | 5 (100.0%) | 0 (0.0%) |
| Legal Services & Support | 0 (0.0%) | 0 (0.0%) |
| Education Instruction & Library | 0 (0.0%) | 12 (100.0%) |
| Arts, Media & Entertainment | 0 (0.0%) | 0 (0.0%) |
| Health Diagnosing & Treating | 0 (0.0%) | 0 (0.0%) |
| Health Technologists | 0 (0.0%) | 0 (0.0%) |
| Total (Category) | 181 (86.2%) | 29 (13.8%) |
| Total (Overall) | 335 (71.6%) | 133 (28.4%) |
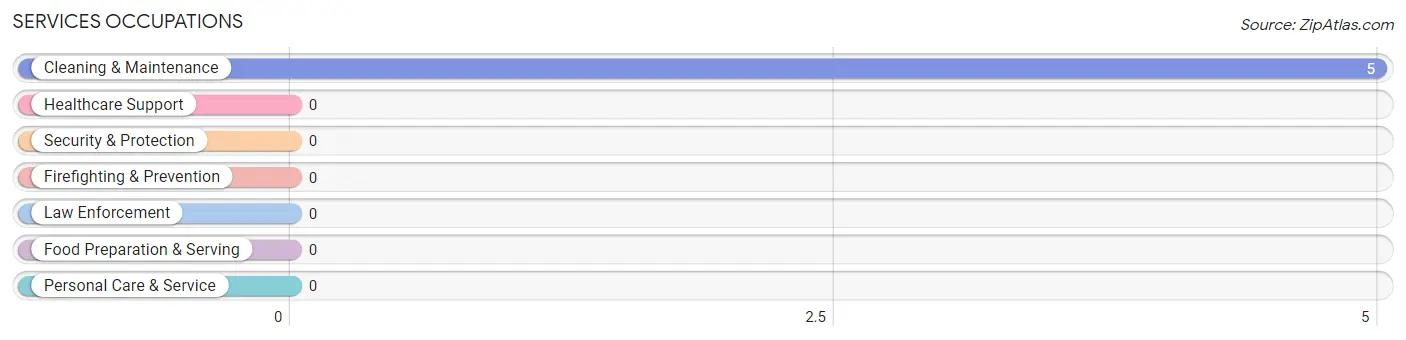
Services Occupations
The most common Services occupations in Shell Knob are , and Cleaning & Maintenance (5 | 1.1%).
Services Occupations by Sex
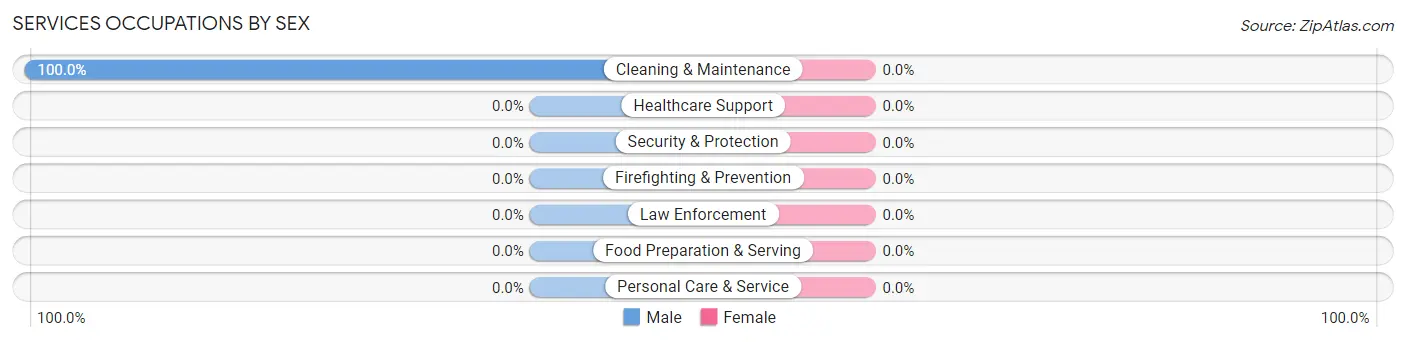
| Occupation | Male | Female |
| Healthcare Support | 0 (0.0%) | 0 (0.0%) |
| Security & Protection | 0 (0.0%) | 0 (0.0%) |
| Firefighting & Prevention | 0 (0.0%) | 0 (0.0%) |
| Law Enforcement | 0 (0.0%) | 0 (0.0%) |
| Food Preparation & Serving | 0 (0.0%) | 0 (0.0%) |
| Cleaning & Maintenance | 5 (100.0%) | 0 (0.0%) |
| Personal Care & Service | 0 (0.0%) | 0 (0.0%) |
| Total (Category) | 5 (100.0%) | 0 (0.0%) |
| Total (Overall) | 335 (71.6%) | 133 (28.4%) |
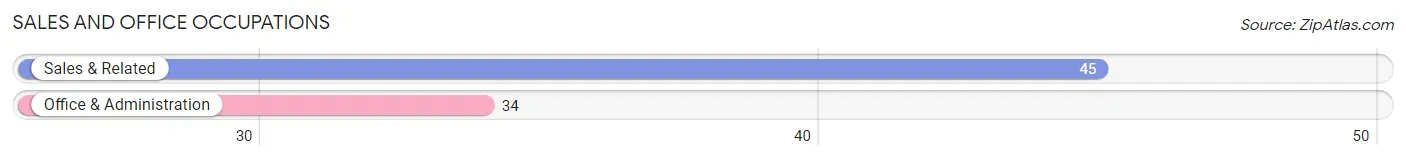
Sales and Office Occupations
The most common Sales and Office occupations in Shell Knob are Sales & Related (45 | 9.6%), and Office & Administration (34 | 7.3%).
Sales and Office Occupations by Sex
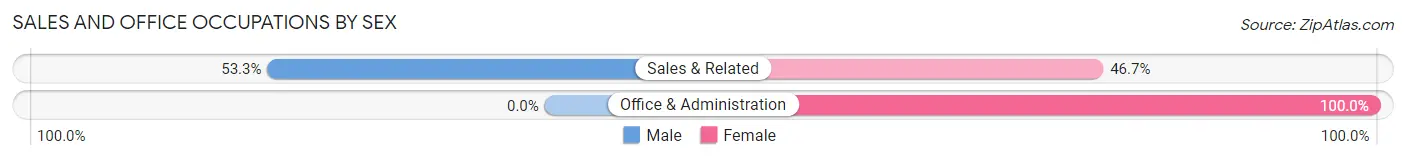
| Occupation | Male | Female |
| Sales & Related | 24 (53.3%) | 21 (46.7%) |
| Office & Administration | 0 (0.0%) | 34 (100.0%) |
| Total (Category) | 24 (30.4%) | 55 (69.6%) |
| Total (Overall) | 335 (71.6%) | 133 (28.4%) |
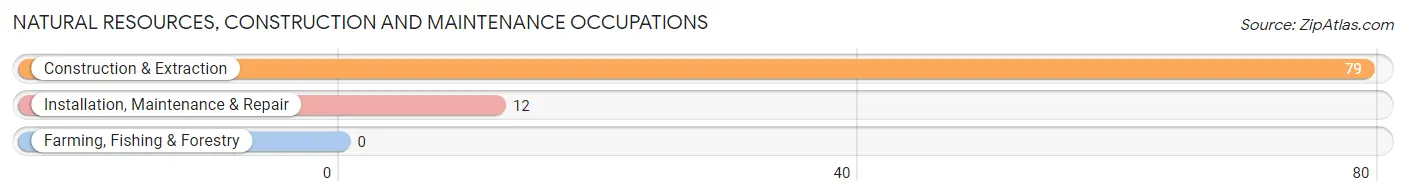
Natural Resources, Construction and Maintenance Occupations
The most common Natural Resources, Construction and Maintenance occupations in Shell Knob are Construction & Extraction (79 | 16.9%), and Installation, Maintenance & Repair (12 | 2.6%).
Natural Resources, Construction and Maintenance Occupations by Sex
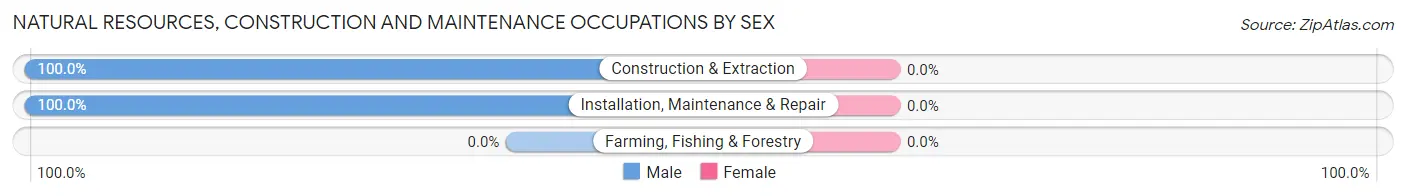
| Occupation | Male | Female |
| Farming, Fishing & Forestry | 0 (0.0%) | 0 (0.0%) |
| Construction & Extraction | 79 (100.0%) | 0 (0.0%) |
| Installation, Maintenance & Repair | 12 (100.0%) | 0 (0.0%) |
| Total (Category) | 91 (100.0%) | 0 (0.0%) |
| Total (Overall) | 335 (71.6%) | 133 (28.4%) |
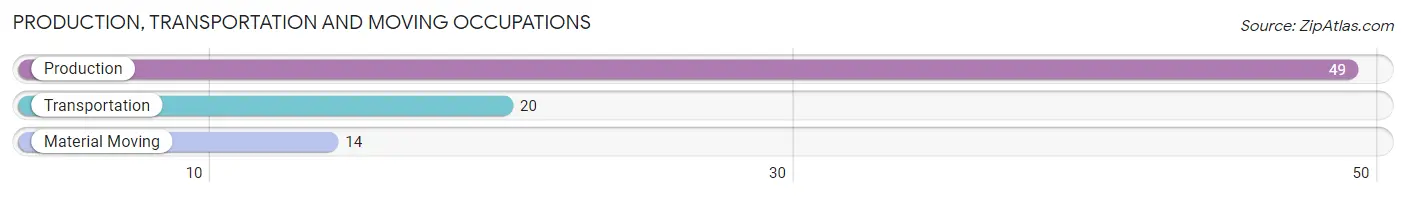
Production, Transportation and Moving Occupations
The most common Production, Transportation and Moving occupations in Shell Knob are Production (49 | 10.5%), Transportation (20 | 4.3%), and Material Moving (14 | 3.0%).
Production, Transportation and Moving Occupations by Sex
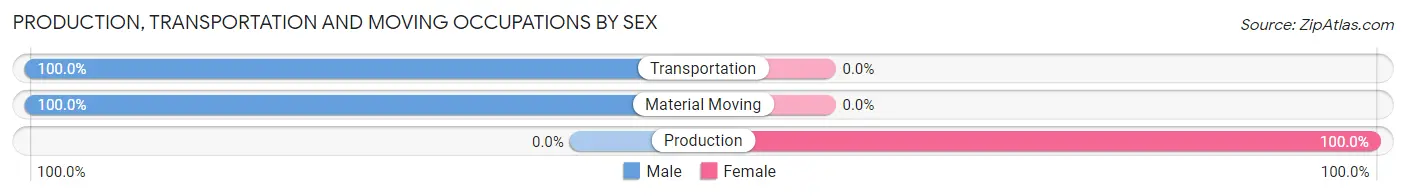
| Occupation | Male | Female |
| Production | 0 (0.0%) | 49 (100.0%) |
| Transportation | 20 (100.0%) | 0 (0.0%) |
| Material Moving | 14 (100.0%) | 0 (0.0%) |
| Total (Category) | 34 (41.0%) | 49 (59.0%) |
| Total (Overall) | 335 (71.6%) | 133 (28.4%) |
Employment Industries by Sex in Shell Knob
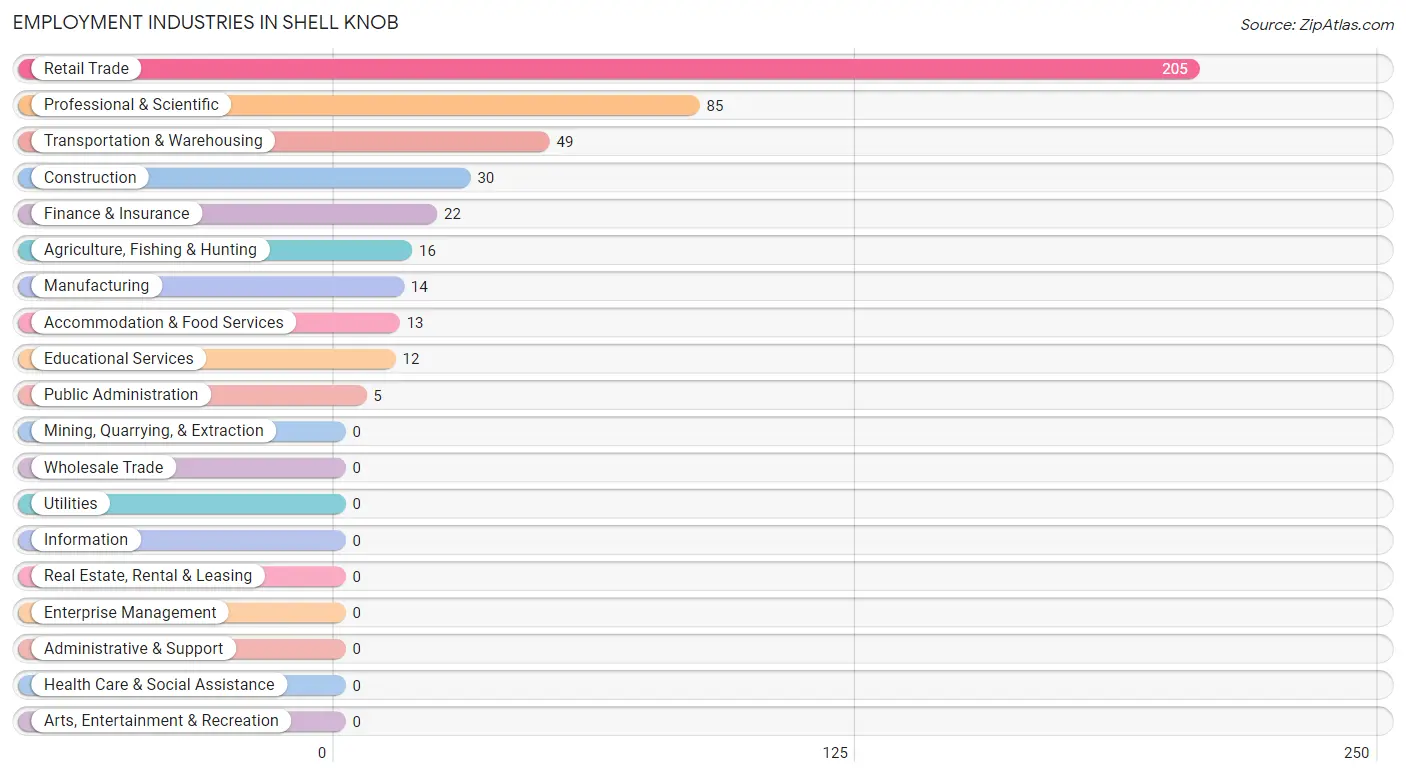
Employment Industries in Shell Knob
The major employment industries in Shell Knob include Retail Trade (205 | 43.8%), Professional & Scientific (85 | 18.2%), Transportation & Warehousing (49 | 10.5%), Construction (30 | 6.4%), and Finance & Insurance (22 | 4.7%).
Employment Industries by Sex in Shell Knob
The Shell Knob industries that see more men than women are Agriculture, Fishing & Hunting (100.0%), Manufacturing (100.0%), and Transportation & Warehousing (100.0%), whereas the industries that tend to have a higher number of women are Educational Services (100.0%), Construction (60.0%), and Finance & Insurance (54.5%).
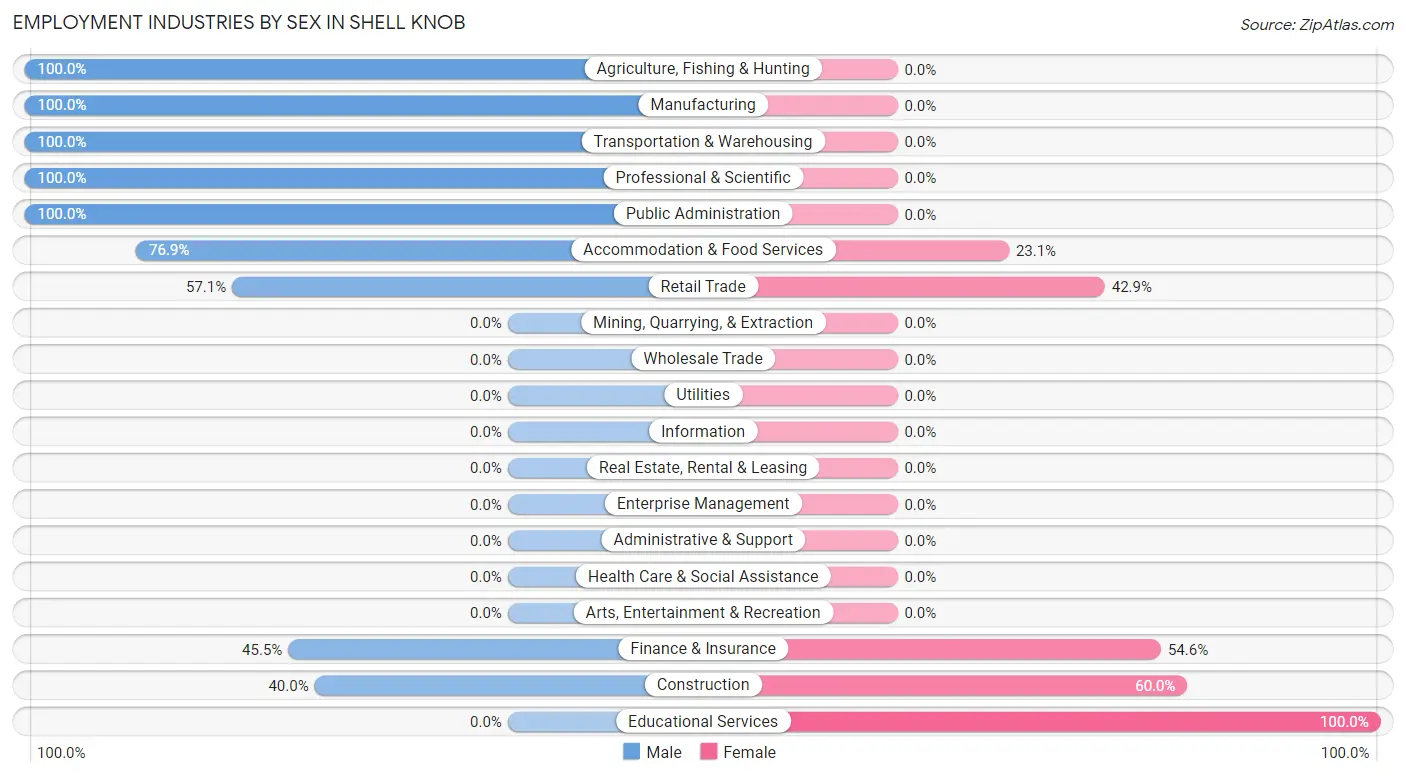
| Industry | Male | Female |
| Agriculture, Fishing & Hunting | 16 (100.0%) | 0 (0.0%) |
| Mining, Quarrying, & Extraction | 0 (0.0%) | 0 (0.0%) |
| Construction | 12 (40.0%) | 18 (60.0%) |
| Manufacturing | 14 (100.0%) | 0 (0.0%) |
| Wholesale Trade | 0 (0.0%) | 0 (0.0%) |
| Retail Trade | 117 (57.1%) | 88 (42.9%) |
| Transportation & Warehousing | 49 (100.0%) | 0 (0.0%) |
| Utilities | 0 (0.0%) | 0 (0.0%) |
| Information | 0 (0.0%) | 0 (0.0%) |
| Finance & Insurance | 10 (45.5%) | 12 (54.5%) |
| Real Estate, Rental & Leasing | 0 (0.0%) | 0 (0.0%) |
| Professional & Scientific | 85 (100.0%) | 0 (0.0%) |
| Enterprise Management | 0 (0.0%) | 0 (0.0%) |
| Administrative & Support | 0 (0.0%) | 0 (0.0%) |
| Educational Services | 0 (0.0%) | 12 (100.0%) |
| Health Care & Social Assistance | 0 (0.0%) | 0 (0.0%) |
| Arts, Entertainment & Recreation | 0 (0.0%) | 0 (0.0%) |
| Accommodation & Food Services | 10 (76.9%) | 3 (23.1%) |
| Public Administration | 5 (100.0%) | 0 (0.0%) |
| Total | 335 (71.6%) | 133 (28.4%) |
Education in Shell Knob
School Enrollment in Shell Knob
The most common levels of schooling among the 84 students in Shell Knob are elementary school (60 | 71.4%), nursery / preschool (14 | 16.7%), and middle school (10 | 11.9%).
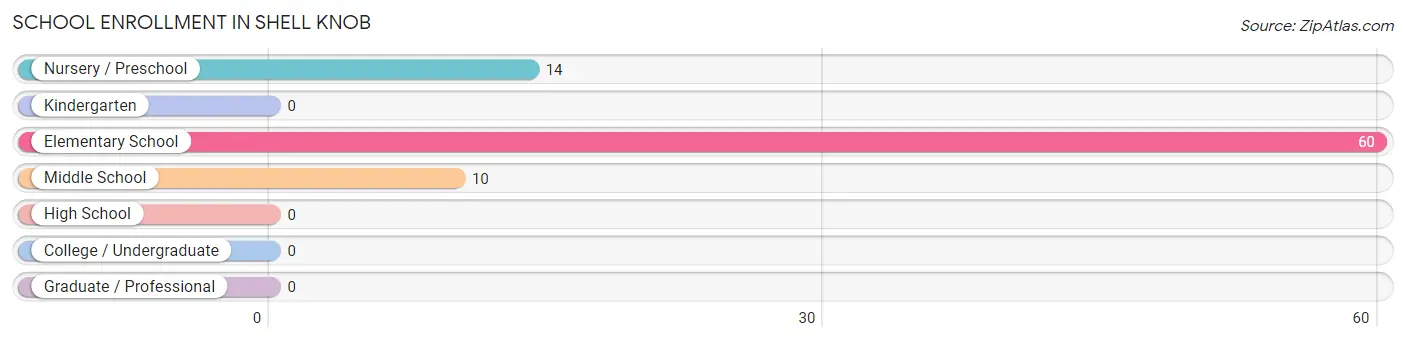
| School Level | # Students | % Students |
| Nursery / Preschool | 14 | 16.7% |
| Kindergarten | 0 | 0.0% |
| Elementary School | 60 | 71.4% |
| Middle School | 10 | 11.9% |
| High School | 0 | 0.0% |
| College / Undergraduate | 0 | 0.0% |
| Graduate / Professional | 0 | 0.0% |
| Total | 84 | 100.0% |
School Enrollment by Age by Funding Source in Shell Knob
Out of a total of 84 students who are enrolled in schools in Shell Knob, 30 (35.7%) attend a private institution, while the remaining 54 (64.3%) are enrolled in public schools. The age group of 5 to 9 year old has the highest likelihood of being enrolled in private schools, with 30 (35.7% in the age bracket) enrolled. Conversely, the age group of 5 to 9 year old has the lowest likelihood of being enrolled in a private school, with 54 (64.3% in the age bracket) attending a public institution.
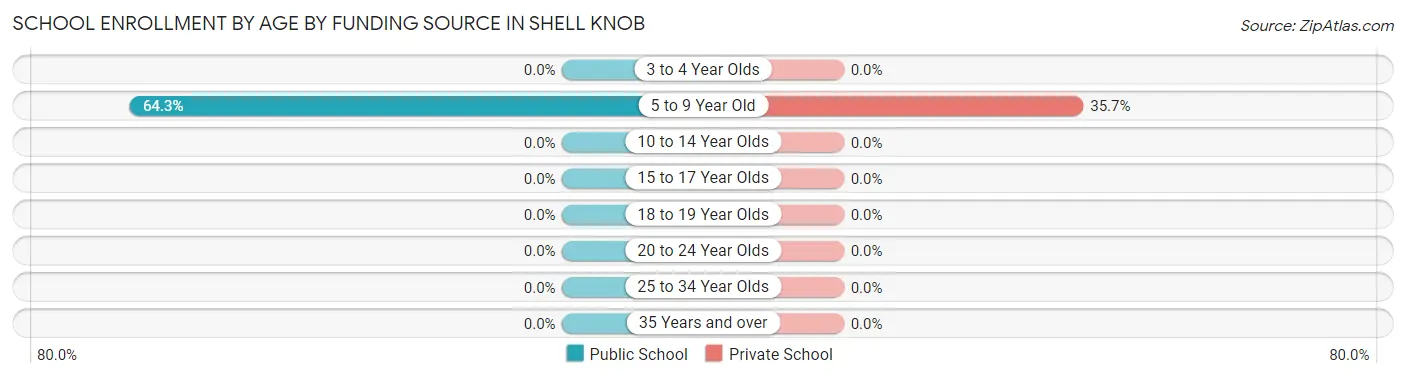
| Age Bracket | Public School | Private School |
| 3 to 4 Year Olds | 0 (0.0%) | 0 (0.0%) |
| 5 to 9 Year Old | 54 (64.3%) | 30 (35.7%) |
| 10 to 14 Year Olds | 0 (0.0%) | 0 (0.0%) |
| 15 to 17 Year Olds | 0 (0.0%) | 0 (0.0%) |
| 18 to 19 Year Olds | 0 (0.0%) | 0 (0.0%) |
| 20 to 24 Year Olds | 0 (0.0%) | 0 (0.0%) |
| 25 to 34 Year Olds | 0 (0.0%) | 0 (0.0%) |
| 35 Years and over | 0 (0.0%) | 0 (0.0%) |
| Total | 54 (64.3%) | 30 (35.7%) |
Educational Attainment by Field of Study in Shell Knob
Engineering (149 | 38.6%), business (90 | 23.3%), psychology (43 | 11.1%), science & technology (32 | 8.3%), and social sciences (29 | 7.5%) are the most common fields of study among 386 individuals in Shell Knob who have obtained a bachelor's degree or higher.
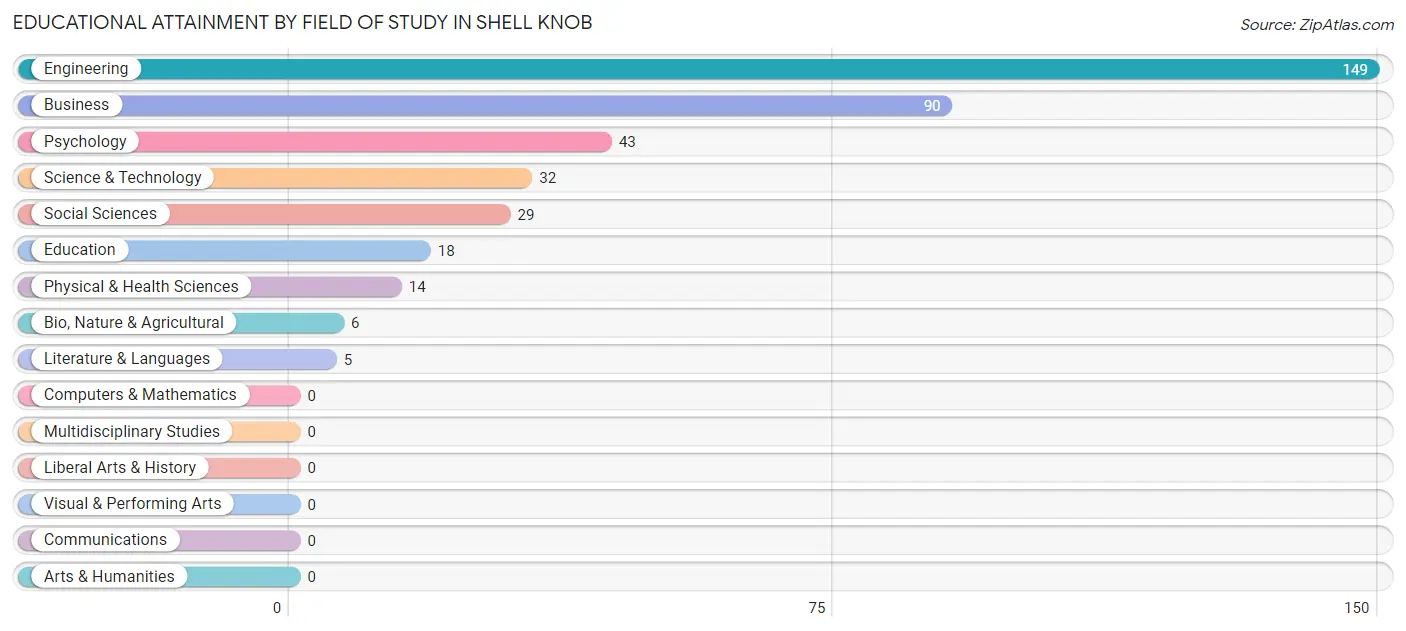
| Field of Study | # Graduates | % Graduates |
| Computers & Mathematics | 0 | 0.0% |
| Bio, Nature & Agricultural | 6 | 1.5% |
| Physical & Health Sciences | 14 | 3.6% |
| Psychology | 43 | 11.1% |
| Social Sciences | 29 | 7.5% |
| Engineering | 149 | 38.6% |
| Multidisciplinary Studies | 0 | 0.0% |
| Science & Technology | 32 | 8.3% |
| Business | 90 | 23.3% |
| Education | 18 | 4.7% |
| Literature & Languages | 5 | 1.3% |
| Liberal Arts & History | 0 | 0.0% |
| Visual & Performing Arts | 0 | 0.0% |
| Communications | 0 | 0.0% |
| Arts & Humanities | 0 | 0.0% |
| Total | 386 | 100.0% |
Transportation & Commute in Shell Knob
Vehicle Availability by Sex in Shell Knob
The most prevalent vehicle ownership categories in Shell Knob are males with 2 vehicles (160, accounting for 47.8%) and females with 2 vehicles (37, making up 125.0%).
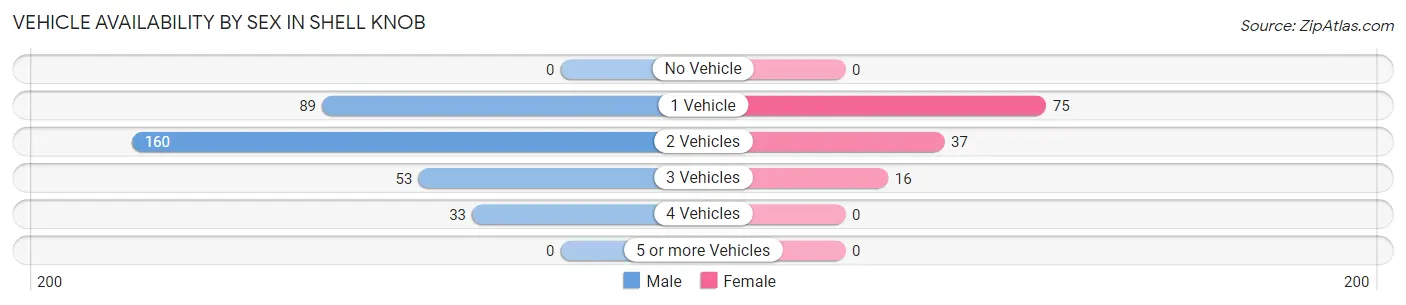
| Vehicles Available | Male | Female |
| No Vehicle | 0 (0.0%) | 0 (0.0%) |
| 1 Vehicle | 89 (26.6%) | 75 (58.6%) |
| 2 Vehicles | 160 (47.8%) | 37 (28.9%) |
| 3 Vehicles | 53 (15.8%) | 16 (12.5%) |
| 4 Vehicles | 33 (9.9%) | 0 (0.0%) |
| 5 or more Vehicles | 0 (0.0%) | 0 (0.0%) |
| Total | 335 (100.0%) | 128 (100.0%) |
Commute Time in Shell Knob
The most frequently occuring commute durations in Shell Knob are 45 to 59 minutes (97 commuters, 30.2%), 5 to 9 minutes (68 commuters, 21.2%), and 20 to 24 minutes (67 commuters, 20.9%).
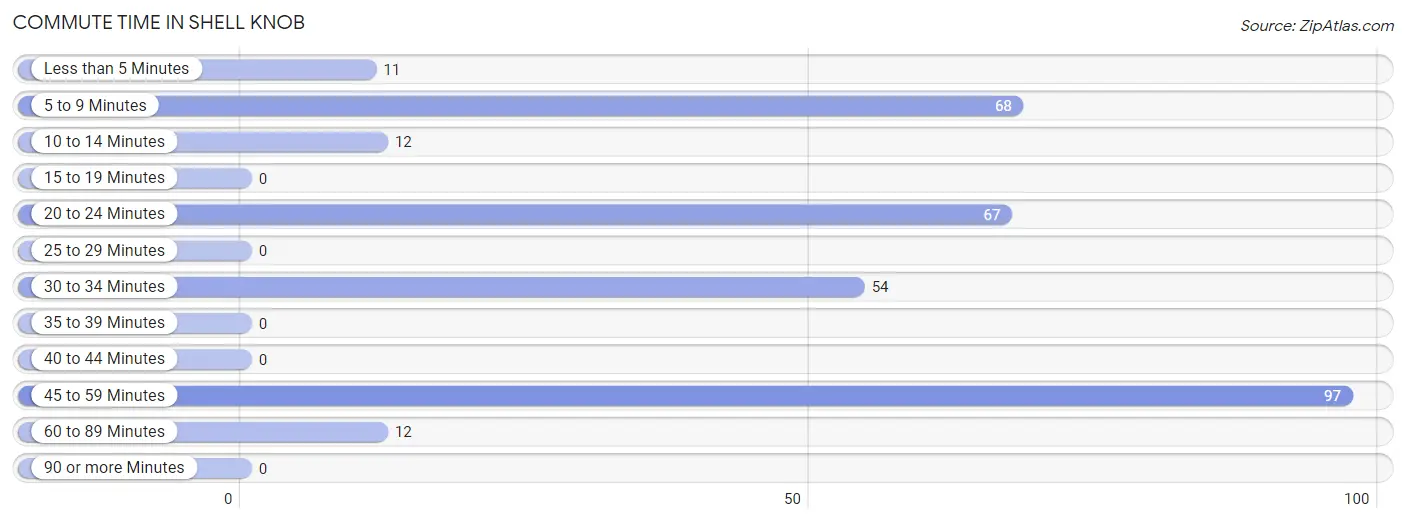
| Commute Time | # Commuters | % Commuters |
| Less than 5 Minutes | 11 | 3.4% |
| 5 to 9 Minutes | 68 | 21.2% |
| 10 to 14 Minutes | 12 | 3.7% |
| 15 to 19 Minutes | 0 | 0.0% |
| 20 to 24 Minutes | 67 | 20.9% |
| 25 to 29 Minutes | 0 | 0.0% |
| 30 to 34 Minutes | 54 | 16.8% |
| 35 to 39 Minutes | 0 | 0.0% |
| 40 to 44 Minutes | 0 | 0.0% |
| 45 to 59 Minutes | 97 | 30.2% |
| 60 to 89 Minutes | 12 | 3.7% |
| 90 or more Minutes | 0 | 0.0% |
Commute Time by Sex in Shell Knob
The most common commute times in Shell Knob are 45 to 59 minutes (85 commuters, 35.1%) for males and 5 to 9 minutes (49 commuters, 62.0%) for females.
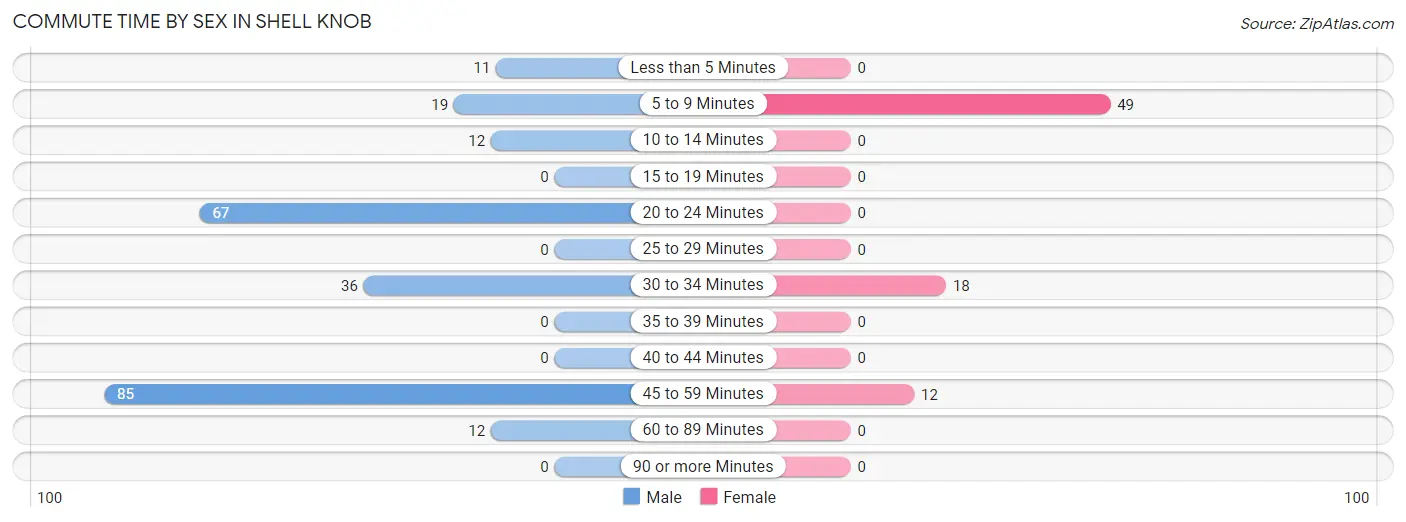
| Commute Time | Male | Female |
| Less than 5 Minutes | 11 (4.5%) | 0 (0.0%) |
| 5 to 9 Minutes | 19 (7.9%) | 49 (62.0%) |
| 10 to 14 Minutes | 12 (5.0%) | 0 (0.0%) |
| 15 to 19 Minutes | 0 (0.0%) | 0 (0.0%) |
| 20 to 24 Minutes | 67 (27.7%) | 0 (0.0%) |
| 25 to 29 Minutes | 0 (0.0%) | 0 (0.0%) |
| 30 to 34 Minutes | 36 (14.9%) | 18 (22.8%) |
| 35 to 39 Minutes | 0 (0.0%) | 0 (0.0%) |
| 40 to 44 Minutes | 0 (0.0%) | 0 (0.0%) |
| 45 to 59 Minutes | 85 (35.1%) | 12 (15.2%) |
| 60 to 89 Minutes | 12 (5.0%) | 0 (0.0%) |
| 90 or more Minutes | 0 (0.0%) | 0 (0.0%) |
Time of Departure to Work by Sex in Shell Knob
The most frequent times of departure to work in Shell Knob are 8:30 AM to 8:59 AM (152, 62.8%) for males and 5:30 AM to 5:59 AM (49, 62.0%) for females.
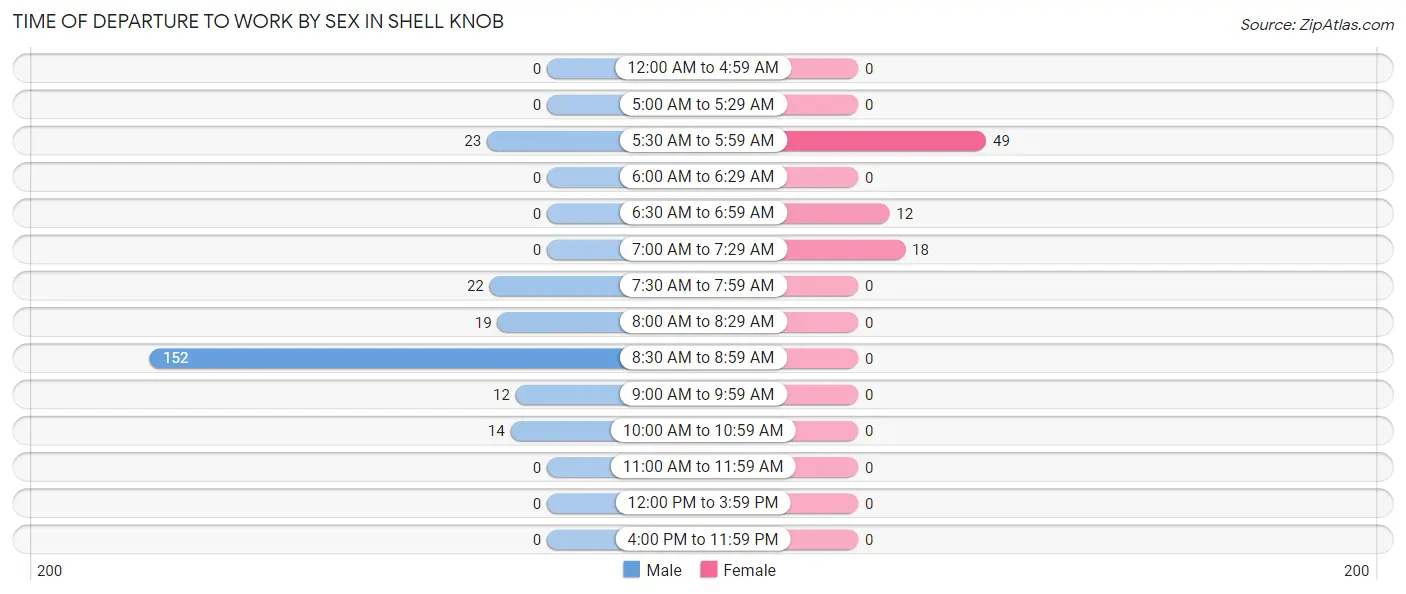
| Time of Departure | Male | Female |
| 12:00 AM to 4:59 AM | 0 (0.0%) | 0 (0.0%) |
| 5:00 AM to 5:29 AM | 0 (0.0%) | 0 (0.0%) |
| 5:30 AM to 5:59 AM | 23 (9.5%) | 49 (62.0%) |
| 6:00 AM to 6:29 AM | 0 (0.0%) | 0 (0.0%) |
| 6:30 AM to 6:59 AM | 0 (0.0%) | 12 (15.2%) |
| 7:00 AM to 7:29 AM | 0 (0.0%) | 18 (22.8%) |
| 7:30 AM to 7:59 AM | 22 (9.1%) | 0 (0.0%) |
| 8:00 AM to 8:29 AM | 19 (7.9%) | 0 (0.0%) |
| 8:30 AM to 8:59 AM | 152 (62.8%) | 0 (0.0%) |
| 9:00 AM to 9:59 AM | 12 (5.0%) | 0 (0.0%) |
| 10:00 AM to 10:59 AM | 14 (5.8%) | 0 (0.0%) |
| 11:00 AM to 11:59 AM | 0 (0.0%) | 0 (0.0%) |
| 12:00 PM to 3:59 PM | 0 (0.0%) | 0 (0.0%) |
| 4:00 PM to 11:59 PM | 0 (0.0%) | 0 (0.0%) |
| Total | 242 (100.0%) | 79 (100.0%) |
Housing Occupancy in Shell Knob
Occupancy by Ownership in Shell Knob
Of the total 736 dwellings in Shell Knob, owner-occupied units account for 679 (92.3%), while renter-occupied units make up 57 (7.7%).
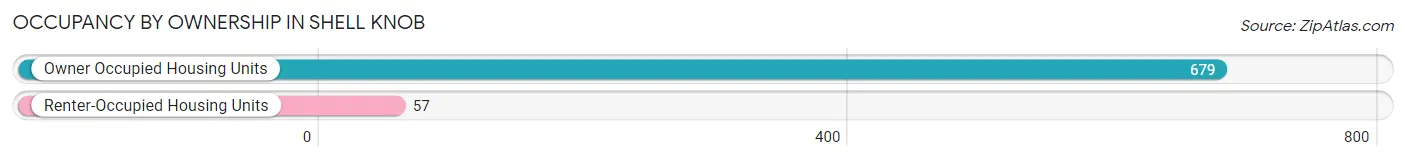
| Occupancy | # Housing Units | % Housing Units |
| Owner Occupied Housing Units | 679 | 92.3% |
| Renter-Occupied Housing Units | 57 | 7.7% |
| Total Occupied Housing Units | 736 | 100.0% |
Occupancy by Household Size in Shell Knob
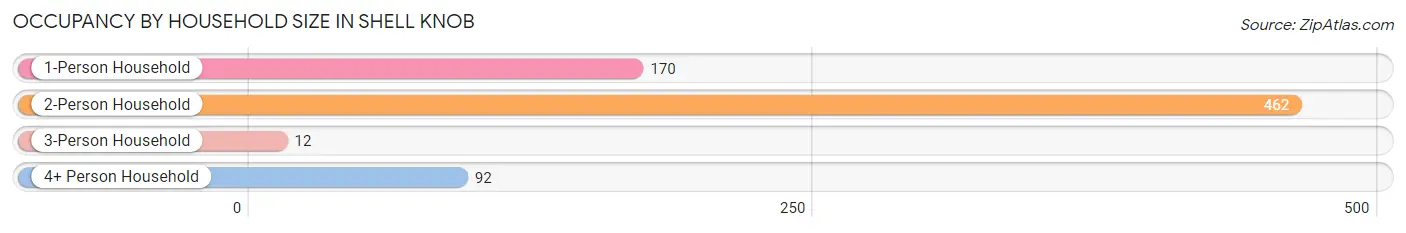
| Household Size | # Housing Units | % Housing Units |
| 1-Person Household | 170 | 23.1% |
| 2-Person Household | 462 | 62.8% |
| 3-Person Household | 12 | 1.6% |
| 4+ Person Household | 92 | 12.5% |
| Total Housing Units | 736 | 100.0% |
Occupancy by Ownership by Household Size in Shell Knob
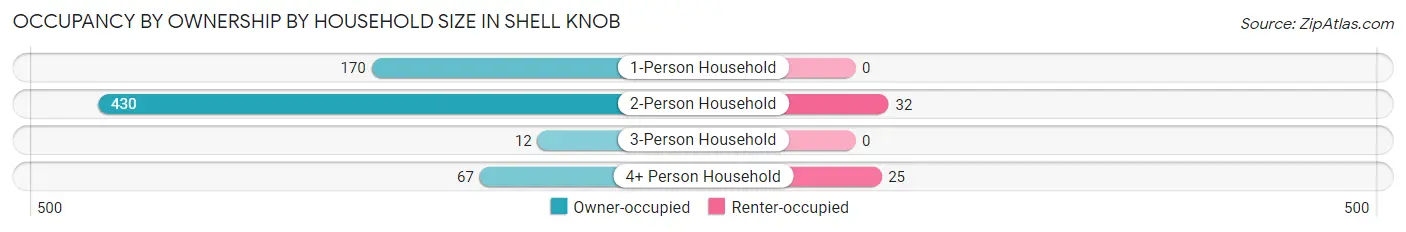
| Household Size | Owner-occupied | Renter-occupied |
| 1-Person Household | 170 (100.0%) | 0 (0.0%) |
| 2-Person Household | 430 (93.1%) | 32 (6.9%) |
| 3-Person Household | 12 (100.0%) | 0 (0.0%) |
| 4+ Person Household | 67 (72.8%) | 25 (27.2%) |
| Total Housing Units | 679 (92.3%) | 57 (7.7%) |
Occupancy by Educational Attainment in Shell Knob
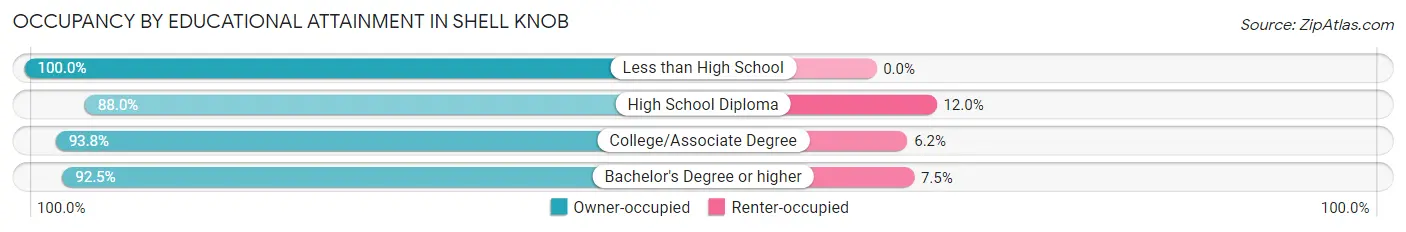
| Household Size | Owner-occupied | Renter-occupied |
| Less than High School | 57 (100.0%) | 0 (0.0%) |
| High School Diploma | 184 (88.0%) | 25 (12.0%) |
| College/Associate Degree | 228 (93.8%) | 15 (6.2%) |
| Bachelor's Degree or higher | 210 (92.5%) | 17 (7.5%) |
Occupancy by Age of Householder in Shell Knob
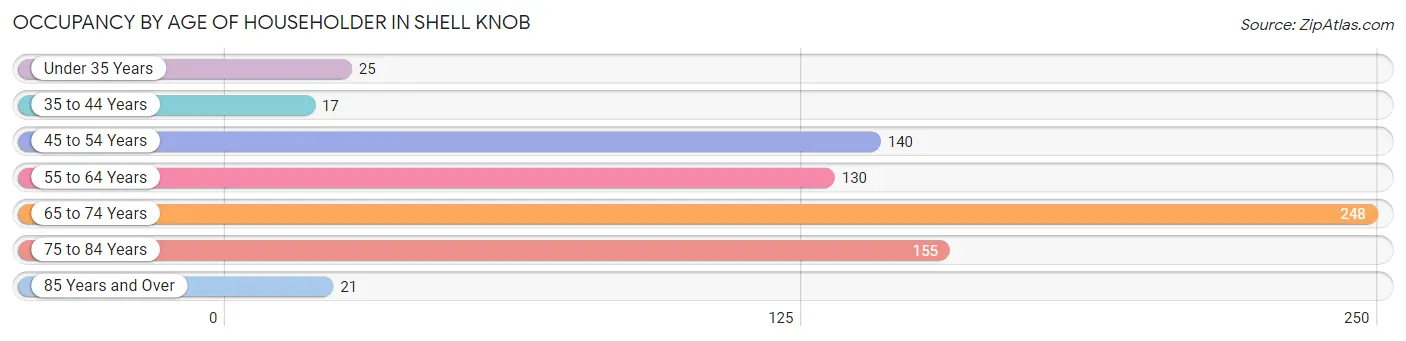
| Age Bracket | # Households | % Households |
| Under 35 Years | 25 | 3.4% |
| 35 to 44 Years | 17 | 2.3% |
| 45 to 54 Years | 140 | 19.0% |
| 55 to 64 Years | 130 | 17.7% |
| 65 to 74 Years | 248 | 33.7% |
| 75 to 84 Years | 155 | 21.1% |
| 85 Years and Over | 21 | 2.9% |
| Total | 736 | 100.0% |
Housing Finances in Shell Knob
Median Income by Occupancy in Shell Knob
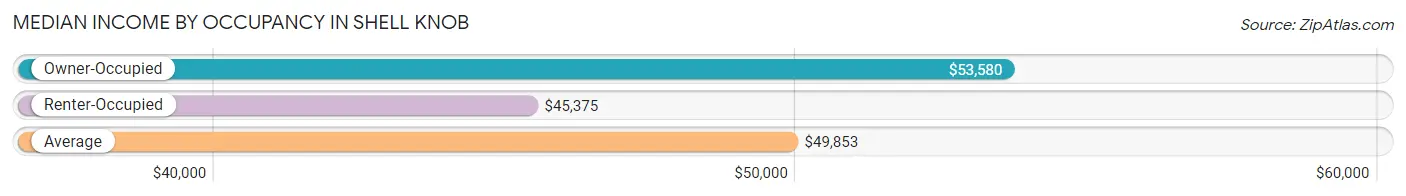
| Occupancy Type | # Households | Median Income |
| Owner-Occupied | 679 (92.3%) | $53,580 |
| Renter-Occupied | 57 (7.7%) | $45,375 |
| Average | 736 (100.0%) | $49,853 |
Occupancy by Householder Income Bracket in Shell Knob
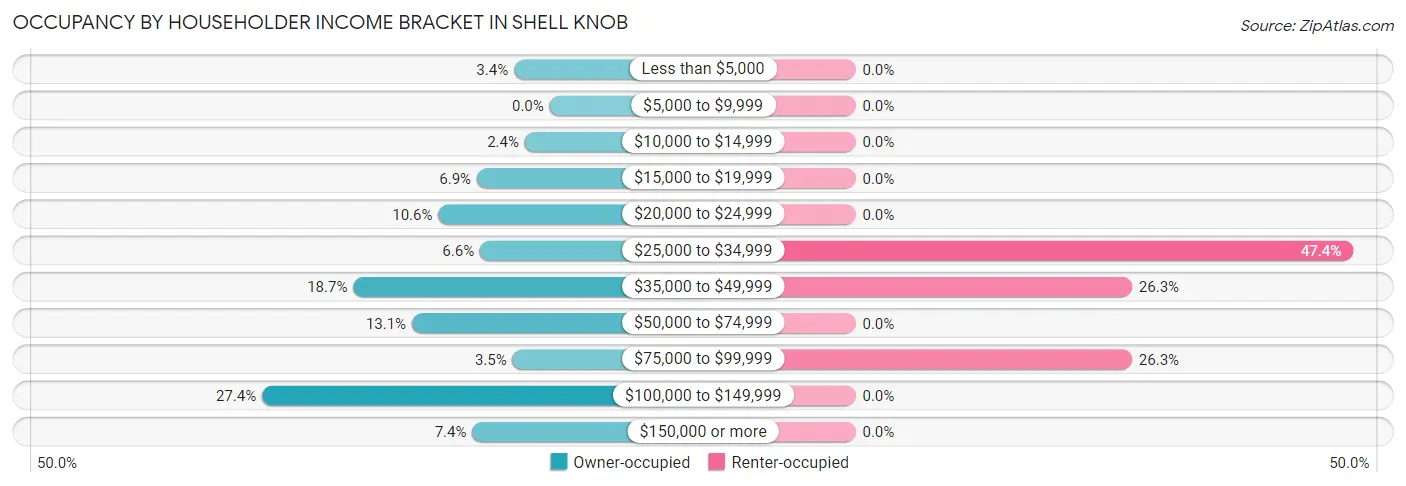
| Income Bracket | Owner-occupied | Renter-occupied |
| Less than $5,000 | 23 (3.4%) | 0 (0.0%) |
| $5,000 to $9,999 | 0 (0.0%) | 0 (0.0%) |
| $10,000 to $14,999 | 16 (2.4%) | 0 (0.0%) |
| $15,000 to $19,999 | 47 (6.9%) | 0 (0.0%) |
| $20,000 to $24,999 | 72 (10.6%) | 0 (0.0%) |
| $25,000 to $34,999 | 45 (6.6%) | 27 (47.4%) |
| $35,000 to $49,999 | 127 (18.7%) | 15 (26.3%) |
| $50,000 to $74,999 | 89 (13.1%) | 0 (0.0%) |
| $75,000 to $99,999 | 24 (3.5%) | 15 (26.3%) |
| $100,000 to $149,999 | 186 (27.4%) | 0 (0.0%) |
| $150,000 or more | 50 (7.4%) | 0 (0.0%) |
| Total | 679 (100.0%) | 57 (100.0%) |
Monthly Housing Cost Tiers in Shell Knob
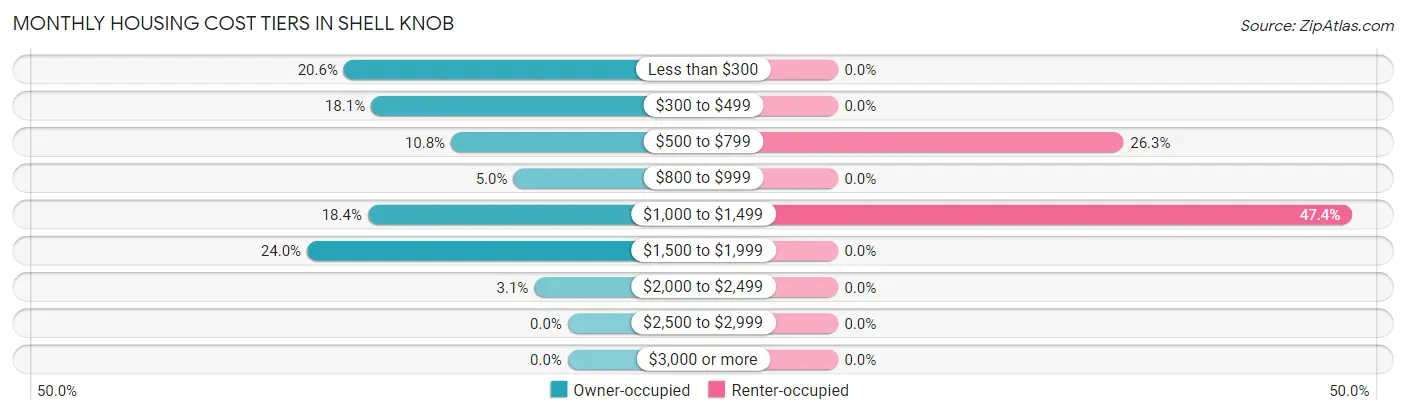
| Monthly Cost | Owner-occupied | Renter-occupied |
| Less than $300 | 140 (20.6%) | 0 (0.0%) |
| $300 to $499 | 123 (18.1%) | 0 (0.0%) |
| $500 to $799 | 73 (10.7%) | 15 (26.3%) |
| $800 to $999 | 34 (5.0%) | 0 (0.0%) |
| $1,000 to $1,499 | 125 (18.4%) | 27 (47.4%) |
| $1,500 to $1,999 | 163 (24.0%) | 0 (0.0%) |
| $2,000 to $2,499 | 21 (3.1%) | 0 (0.0%) |
| $2,500 to $2,999 | 0 (0.0%) | 0 (0.0%) |
| $3,000 or more | 0 (0.0%) | 0 (0.0%) |
| Total | 679 (100.0%) | 57 (100.0%) |
Physical Housing Characteristics in Shell Knob
Housing Structures in Shell Knob
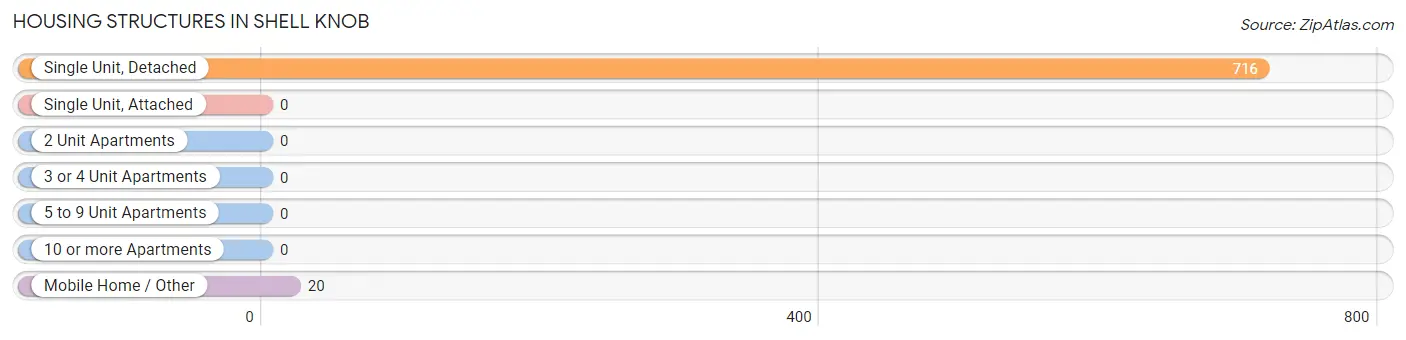
| Structure Type | # Housing Units | % Housing Units |
| Single Unit, Detached | 716 | 97.3% |
| Single Unit, Attached | 0 | 0.0% |
| 2 Unit Apartments | 0 | 0.0% |
| 3 or 4 Unit Apartments | 0 | 0.0% |
| 5 to 9 Unit Apartments | 0 | 0.0% |
| 10 or more Apartments | 0 | 0.0% |
| Mobile Home / Other | 20 | 2.7% |
| Total | 736 | 100.0% |
Housing Structures by Occupancy in Shell Knob
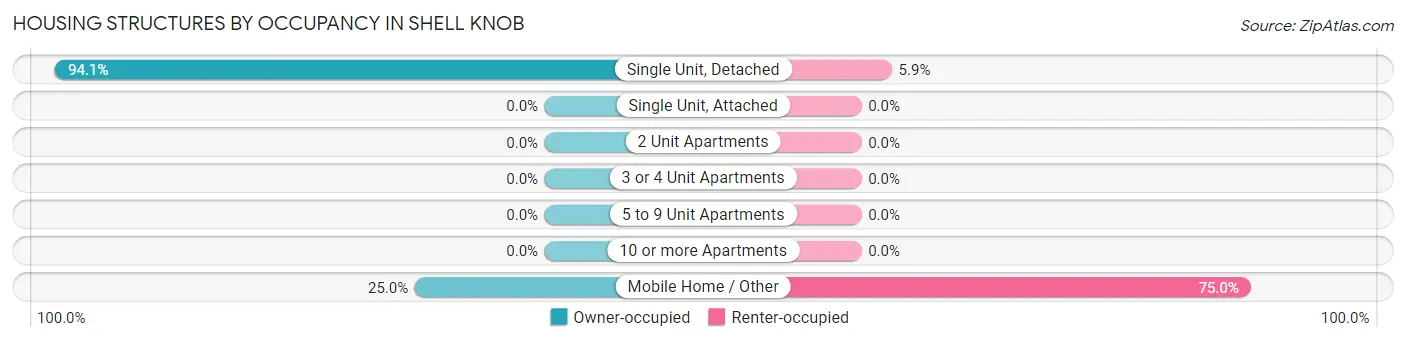
| Structure Type | Owner-occupied | Renter-occupied |
| Single Unit, Detached | 674 (94.1%) | 42 (5.9%) |
| Single Unit, Attached | 0 (0.0%) | 0 (0.0%) |
| 2 Unit Apartments | 0 (0.0%) | 0 (0.0%) |
| 3 or 4 Unit Apartments | 0 (0.0%) | 0 (0.0%) |
| 5 to 9 Unit Apartments | 0 (0.0%) | 0 (0.0%) |
| 10 or more Apartments | 0 (0.0%) | 0 (0.0%) |
| Mobile Home / Other | 5 (25.0%) | 15 (75.0%) |
| Total | 679 (92.3%) | 57 (7.7%) |
Housing Structures by Number of Rooms in Shell Knob
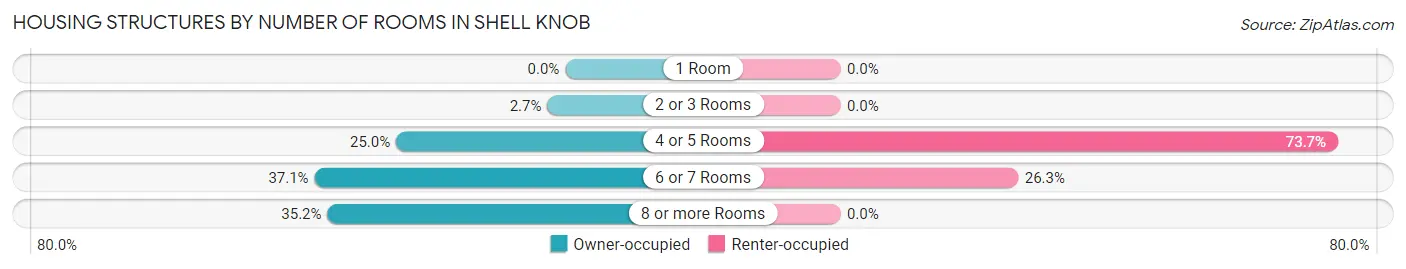
| Number of Rooms | Owner-occupied | Renter-occupied |
| 1 Room | 0 (0.0%) | 0 (0.0%) |
| 2 or 3 Rooms | 18 (2.6%) | 0 (0.0%) |
| 4 or 5 Rooms | 170 (25.0%) | 42 (73.7%) |
| 6 or 7 Rooms | 252 (37.1%) | 15 (26.3%) |
| 8 or more Rooms | 239 (35.2%) | 0 (0.0%) |
| Total | 679 (100.0%) | 57 (100.0%) |
Housing Structure by Heating Type in Shell Knob
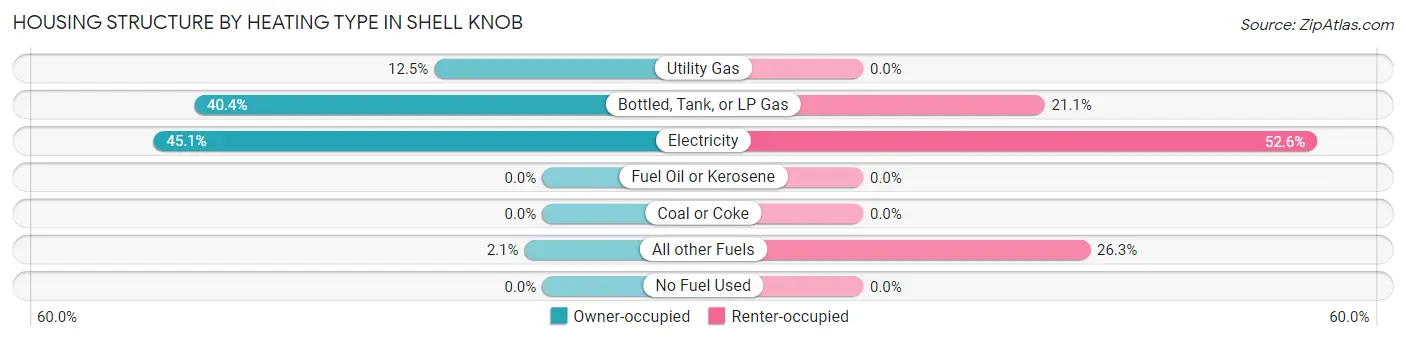
| Heating Type | Owner-occupied | Renter-occupied |
| Utility Gas | 85 (12.5%) | 0 (0.0%) |
| Bottled, Tank, or LP Gas | 274 (40.4%) | 12 (21.0%) |
| Electricity | 306 (45.1%) | 30 (52.6%) |
| Fuel Oil or Kerosene | 0 (0.0%) | 0 (0.0%) |
| Coal or Coke | 0 (0.0%) | 0 (0.0%) |
| All other Fuels | 14 (2.1%) | 15 (26.3%) |
| No Fuel Used | 0 (0.0%) | 0 (0.0%) |
| Total | 679 (100.0%) | 57 (100.0%) |
Household Vehicle Usage in Shell Knob
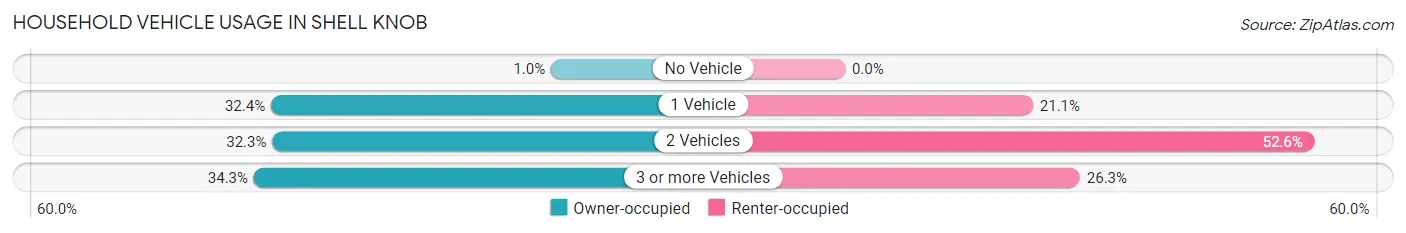
| Vehicles per Household | Owner-occupied | Renter-occupied |
| No Vehicle | 7 (1.0%) | 0 (0.0%) |
| 1 Vehicle | 220 (32.4%) | 12 (21.0%) |
| 2 Vehicles | 219 (32.3%) | 30 (52.6%) |
| 3 or more Vehicles | 233 (34.3%) | 15 (26.3%) |
| Total | 679 (100.0%) | 57 (100.0%) |
Real Estate & Mortgages in Shell Knob
Real Estate and Mortgage Overview in Shell Knob
| Characteristic | Without Mortgage | With Mortgage |
| Housing Units | 331 | 348 |
| Median Property Value | $235,200 | $350,000 |
| Median Household Income | $48,601 | $18 |
| Monthly Housing Costs | $379 | $0 |
| Real Estate Taxes | $877 | $0 |
Property Value by Mortgage Status in Shell Knob
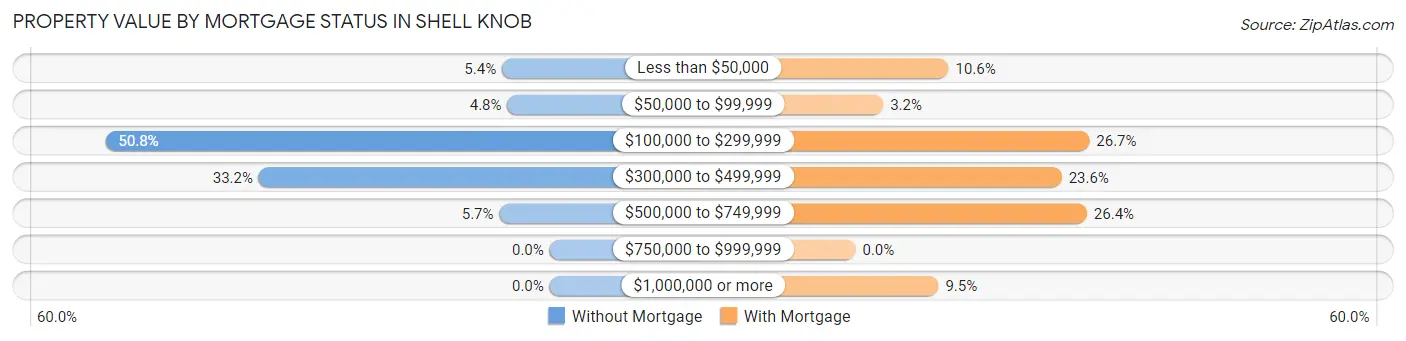
| Property Value | Without Mortgage | With Mortgage |
| Less than $50,000 | 18 (5.4%) | 37 (10.6%) |
| $50,000 to $99,999 | 16 (4.8%) | 11 (3.2%) |
| $100,000 to $299,999 | 168 (50.8%) | 93 (26.7%) |
| $300,000 to $499,999 | 110 (33.2%) | 82 (23.6%) |
| $500,000 to $749,999 | 19 (5.7%) | 92 (26.4%) |
| $750,000 to $999,999 | 0 (0.0%) | 0 (0.0%) |
| $1,000,000 or more | 0 (0.0%) | 33 (9.5%) |
| Total | 331 (100.0%) | 348 (100.0%) |
Household Income by Mortgage Status in Shell Knob
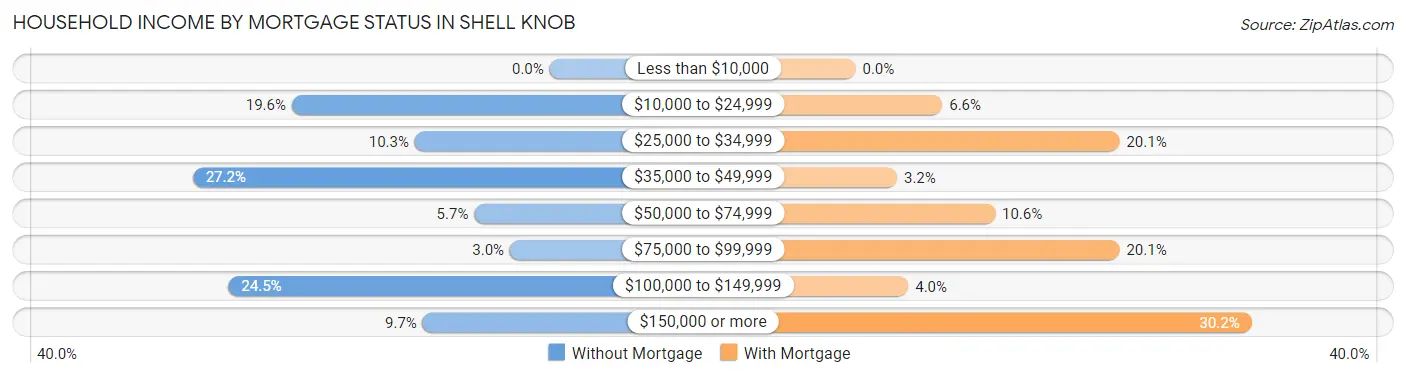
| Household Income | Without Mortgage | With Mortgage |
| Less than $10,000 | 0 (0.0%) | 0 (0.0%) |
| $10,000 to $24,999 | 65 (19.6%) | 23 (6.6%) |
| $25,000 to $34,999 | 34 (10.3%) | 70 (20.1%) |
| $35,000 to $49,999 | 90 (27.2%) | 11 (3.2%) |
| $50,000 to $74,999 | 19 (5.7%) | 37 (10.6%) |
| $75,000 to $99,999 | 10 (3.0%) | 70 (20.1%) |
| $100,000 to $149,999 | 81 (24.5%) | 14 (4.0%) |
| $150,000 or more | 32 (9.7%) | 105 (30.2%) |
| Total | 331 (100.0%) | 348 (100.0%) |
Property Value to Household Income Ratio in Shell Knob
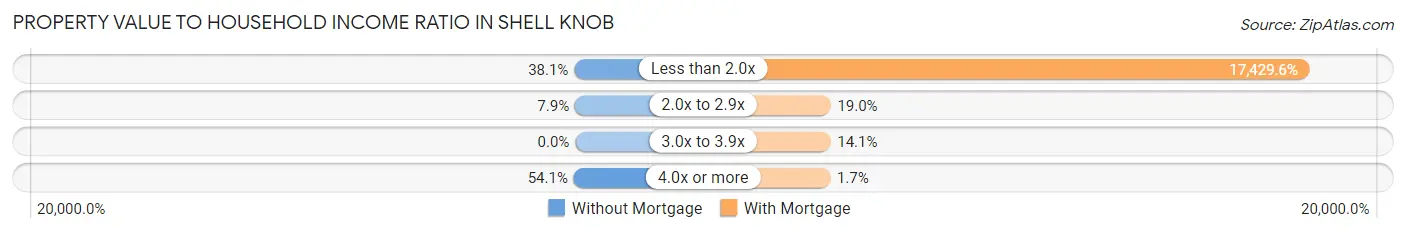
| Value-to-Income Ratio | Without Mortgage | With Mortgage |
| Less than 2.0x | 126 (38.1%) | 60,655 (17,429.6%) |
| 2.0x to 2.9x | 26 (7.9%) | 66 (19.0%) |
| 3.0x to 3.9x | 0 (0.0%) | 49 (14.1%) |
| 4.0x or more | 179 (54.1%) | 6 (1.7%) |
| Total | 331 (100.0%) | 348 (100.0%) |
Real Estate Taxes by Mortgage Status in Shell Knob
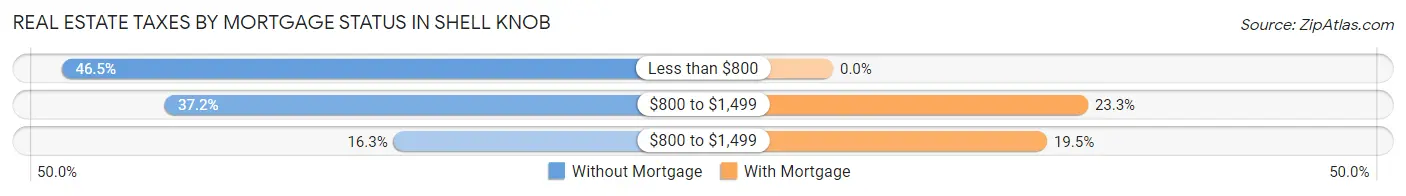
| Property Taxes | Without Mortgage | With Mortgage |
| Less than $800 | 154 (46.5%) | 0 (0.0%) |
| $800 to $1,499 | 123 (37.2%) | 81 (23.3%) |
| $800 to $1,499 | 54 (16.3%) | 68 (19.5%) |
| Total | 331 (100.0%) | 348 (100.0%) |
Health & Disability in Shell Knob
Health Insurance Coverage by Age in Shell Knob
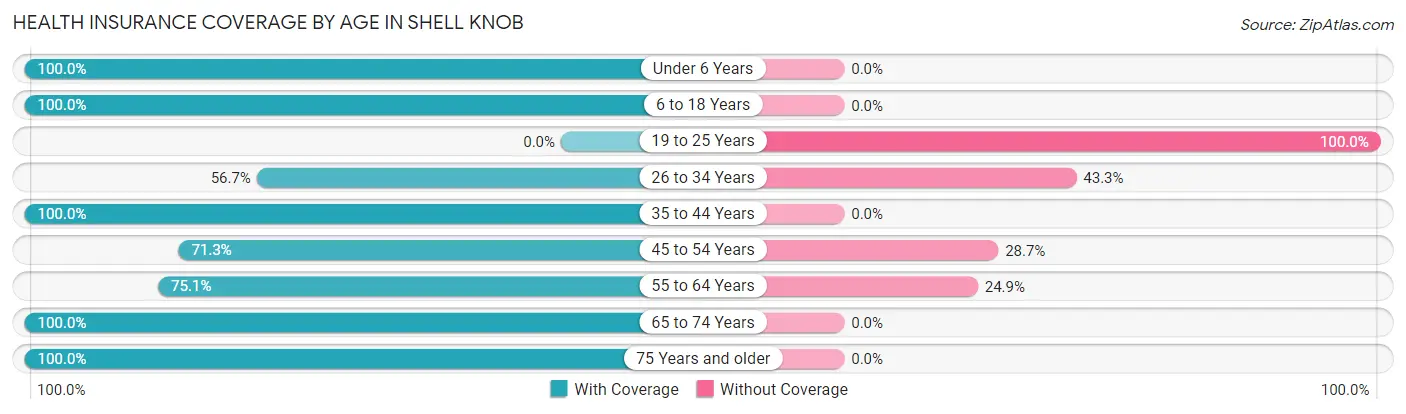
| Age Bracket | With Coverage | Without Coverage |
| Under 6 Years | 14 (100.0%) | 0 (0.0%) |
| 6 to 18 Years | 70 (100.0%) | 0 (0.0%) |
| 19 to 25 Years | 0 (0.0%) | 40 (100.0%) |
| 26 to 34 Years | 38 (56.7%) | 29 (43.3%) |
| 35 to 44 Years | 95 (100.0%) | 0 (0.0%) |
| 45 to 54 Years | 154 (71.3%) | 62 (28.7%) |
| 55 to 64 Years | 178 (75.1%) | 59 (24.9%) |
| 65 to 74 Years | 411 (100.0%) | 0 (0.0%) |
| 75 Years and older | 265 (100.0%) | 0 (0.0%) |
| Total | 1,225 (86.6%) | 190 (13.4%) |
Health Insurance Coverage by Citizenship Status in Shell Knob
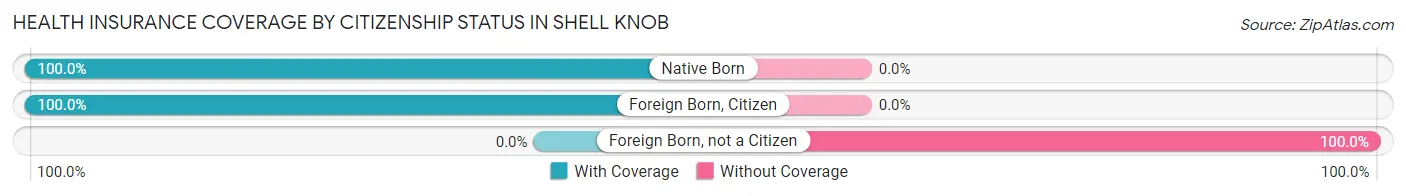
| Citizenship Status | With Coverage | Without Coverage |
| Native Born | 14 (100.0%) | 0 (0.0%) |
| Foreign Born, Citizen | 70 (100.0%) | 0 (0.0%) |
| Foreign Born, not a Citizen | 0 (0.0%) | 40 (100.0%) |
Health Insurance Coverage by Household Income in Shell Knob
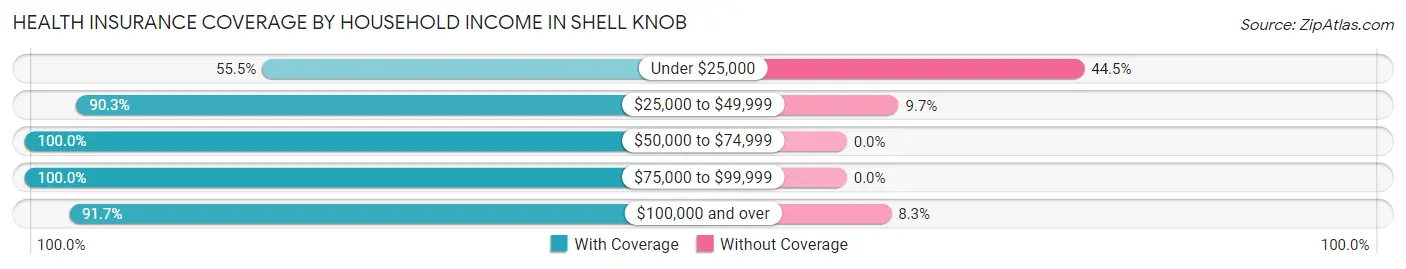
| Household Income | With Coverage | Without Coverage |
| Under $25,000 | 131 (55.5%) | 105 (44.5%) |
| $25,000 to $49,999 | 419 (90.3%) | 45 (9.7%) |
| $50,000 to $74,999 | 157 (100.0%) | 0 (0.0%) |
| $75,000 to $99,999 | 78 (100.0%) | 0 (0.0%) |
| $100,000 and over | 440 (91.7%) | 40 (8.3%) |
Public vs Private Health Insurance Coverage by Age in Shell Knob
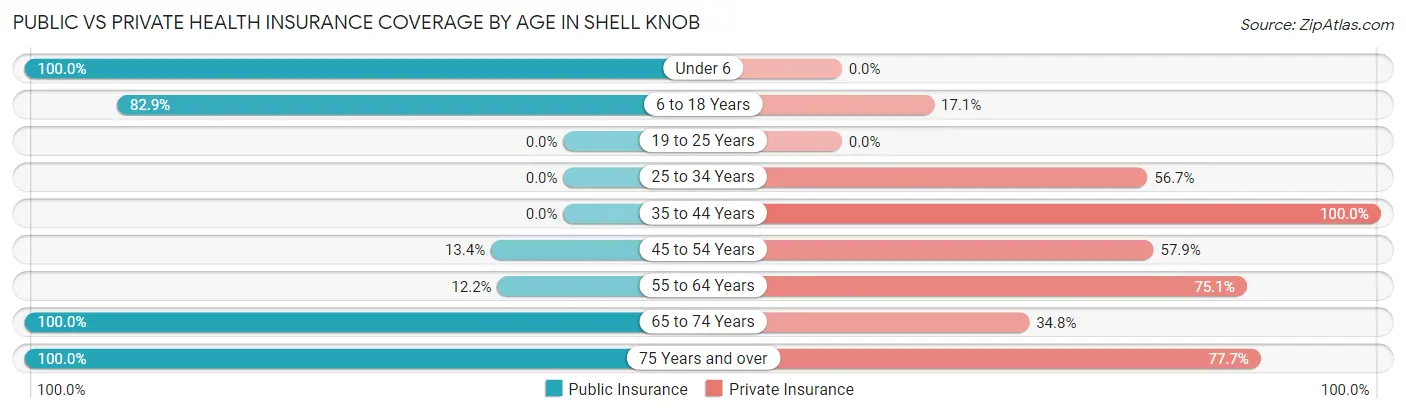
| Age Bracket | Public Insurance | Private Insurance |
| Under 6 | 14 (100.0%) | 0 (0.0%) |
| 6 to 18 Years | 58 (82.9%) | 12 (17.1%) |
| 19 to 25 Years | 0 (0.0%) | 0 (0.0%) |
| 25 to 34 Years | 0 (0.0%) | 38 (56.7%) |
| 35 to 44 Years | 0 (0.0%) | 95 (100.0%) |
| 45 to 54 Years | 29 (13.4%) | 125 (57.9%) |
| 55 to 64 Years | 29 (12.2%) | 178 (75.1%) |
| 65 to 74 Years | 411 (100.0%) | 143 (34.8%) |
| 75 Years and over | 265 (100.0%) | 206 (77.7%) |
| Total | 806 (57.0%) | 797 (56.3%) |
Disability Status by Sex by Age in Shell Knob
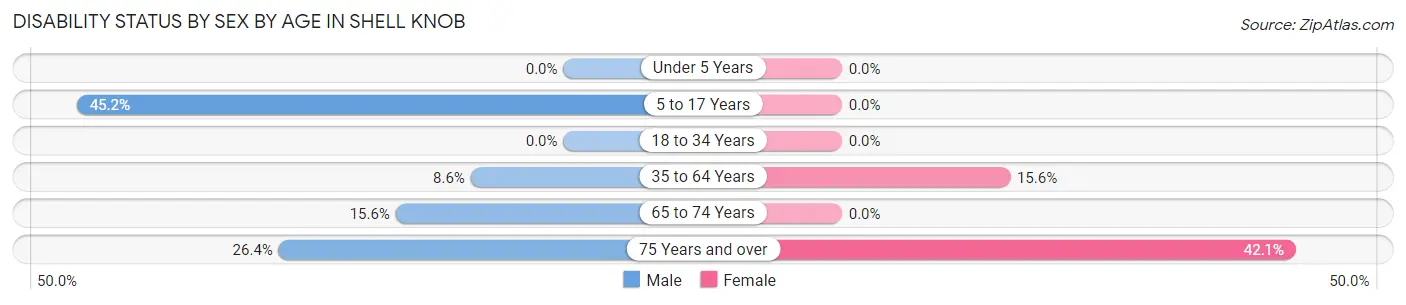
| Age Bracket | Male | Female |
| Under 5 Years | 0 (0.0%) | 0 (0.0%) |
| 5 to 17 Years | 28 (45.2%) | 0 (0.0%) |
| 18 to 34 Years | 0 (0.0%) | 0 (0.0%) |
| 35 to 64 Years | 24 (8.6%) | 42 (15.6%) |
| 65 to 74 Years | 35 (15.6%) | 0 (0.0%) |
| 75 Years and over | 28 (26.4%) | 67 (42.1%) |
Disability Class by Sex by Age in Shell Knob
Disability Class: Hearing Difficulty
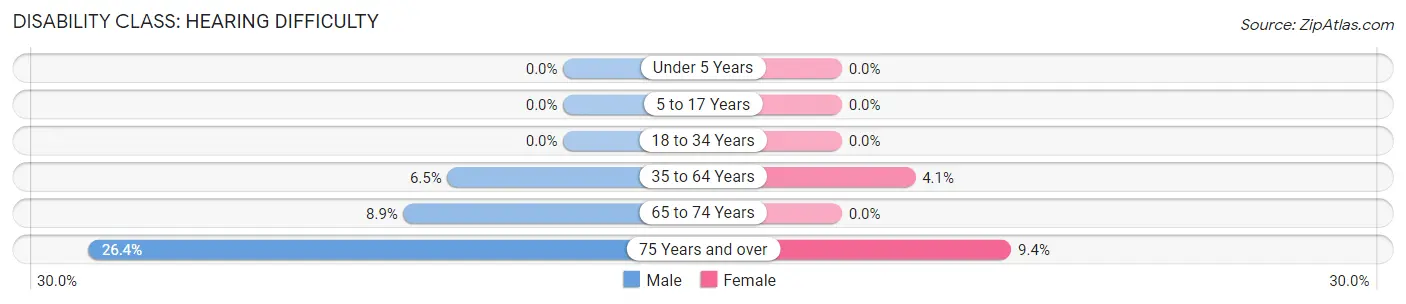
| Age Bracket | Male | Female |
| Under 5 Years | 0 (0.0%) | 0 (0.0%) |
| 5 to 17 Years | 0 (0.0%) | 0 (0.0%) |
| 18 to 34 Years | 0 (0.0%) | 0 (0.0%) |
| 35 to 64 Years | 18 (6.5%) | 11 (4.1%) |
| 65 to 74 Years | 20 (8.9%) | 0 (0.0%) |
| 75 Years and over | 28 (26.4%) | 15 (9.4%) |
Disability Class: Vision Difficulty
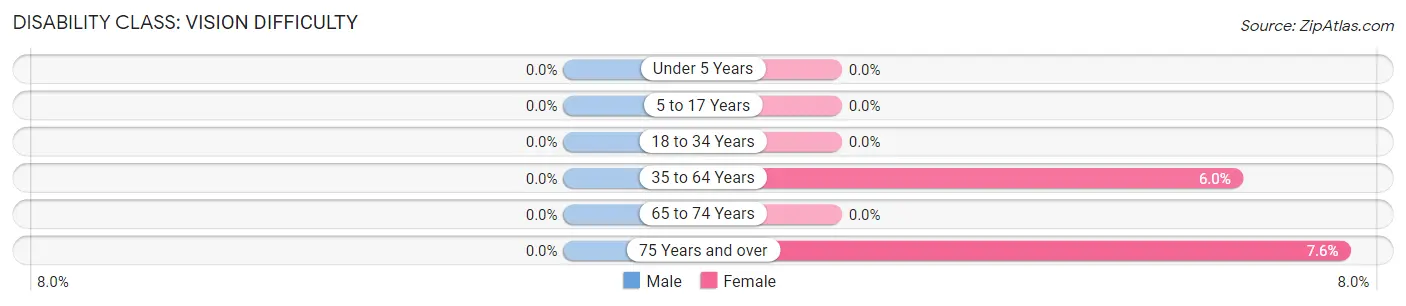
| Age Bracket | Male | Female |
| Under 5 Years | 0 (0.0%) | 0 (0.0%) |
| 5 to 17 Years | 0 (0.0%) | 0 (0.0%) |
| 18 to 34 Years | 0 (0.0%) | 0 (0.0%) |
| 35 to 64 Years | 0 (0.0%) | 16 (5.9%) |
| 65 to 74 Years | 0 (0.0%) | 0 (0.0%) |
| 75 Years and over | 0 (0.0%) | 12 (7.5%) |
Disability Class: Cognitive Difficulty
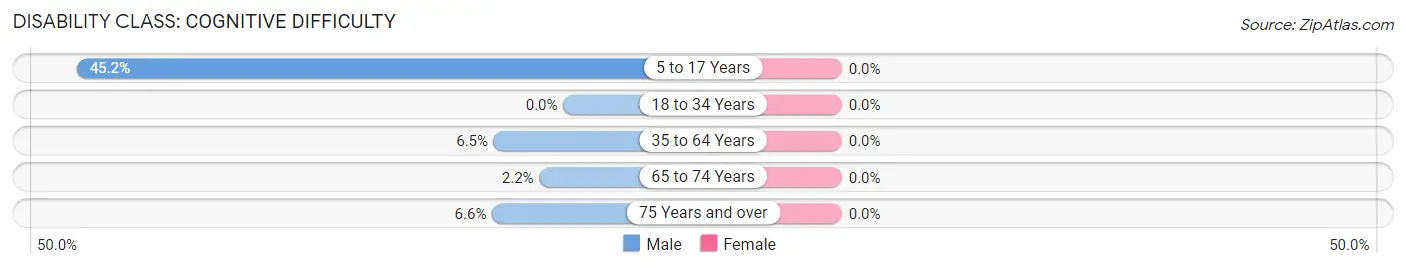
| Age Bracket | Male | Female |
| 5 to 17 Years | 28 (45.2%) | 0 (0.0%) |
| 18 to 34 Years | 0 (0.0%) | 0 (0.0%) |
| 35 to 64 Years | 18 (6.5%) | 0 (0.0%) |
| 65 to 74 Years | 5 (2.2%) | 0 (0.0%) |
| 75 Years and over | 7 (6.6%) | 0 (0.0%) |
Disability Class: Ambulatory Difficulty
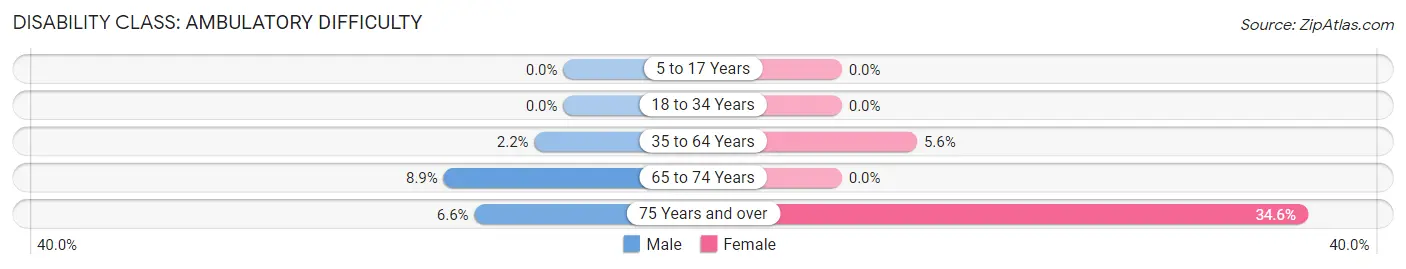
| Age Bracket | Male | Female |
| 5 to 17 Years | 0 (0.0%) | 0 (0.0%) |
| 18 to 34 Years | 0 (0.0%) | 0 (0.0%) |
| 35 to 64 Years | 6 (2.1%) | 15 (5.6%) |
| 65 to 74 Years | 20 (8.9%) | 0 (0.0%) |
| 75 Years and over | 7 (6.6%) | 55 (34.6%) |
Disability Class: Self-Care Difficulty
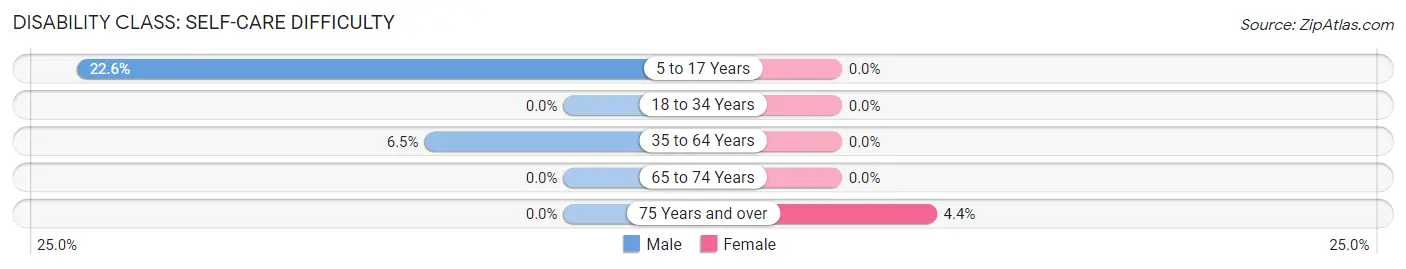
| Age Bracket | Male | Female |
| 5 to 17 Years | 14 (22.6%) | 0 (0.0%) |
| 18 to 34 Years | 0 (0.0%) | 0 (0.0%) |
| 35 to 64 Years | 18 (6.5%) | 0 (0.0%) |
| 65 to 74 Years | 0 (0.0%) | 0 (0.0%) |
| 75 Years and over | 0 (0.0%) | 7 (4.4%) |
Technology Access in Shell Knob
Computing Device Access in Shell Knob
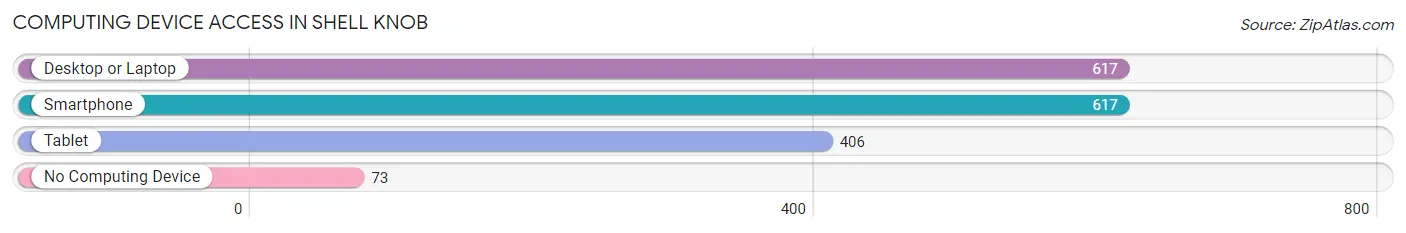
| Device Type | # Households | % Households |
| Desktop or Laptop | 617 | 83.8% |
| Smartphone | 617 | 83.8% |
| Tablet | 406 | 55.2% |
| No Computing Device | 73 | 9.9% |
| Total | 736 | 100.0% |
Internet Access in Shell Knob
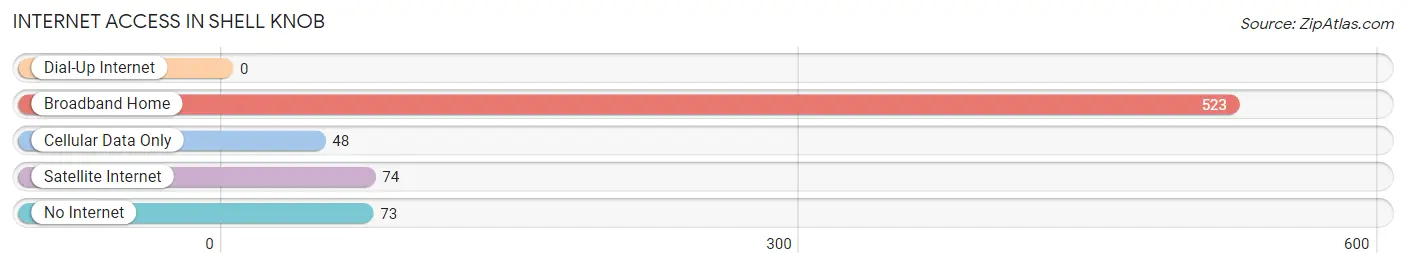
| Internet Type | # Households | % Households |
| Dial-Up Internet | 0 | 0.0% |
| Broadband Home | 523 | 71.1% |
| Cellular Data Only | 48 | 6.5% |
| Satellite Internet | 74 | 10.1% |
| No Internet | 73 | 9.9% |
| Total | 736 | 100.0% |
Shell Knob Summary
Shell Knob is a small town located in Barry County, Missouri, United States. It is situated on the banks of Table Rock Lake, a reservoir created by the damming of the White River. The town has a population of approximately 1,000 people and is a popular tourist destination due to its proximity to the lake.
History
Shell Knob was founded in the late 1800s by a group of settlers who were looking for a place to settle and farm. The town was originally called “Shell’s Knob” after the family who owned the land. The name was eventually shortened to Shell Knob.
The town was incorporated in 1906 and the first post office was established in 1907. The town grew slowly but steadily over the years, and by the 1950s it had become a popular tourist destination due to its proximity to Table Rock Lake.
Geography
Shell Knob is located in Barry County, Missouri, in the Ozark Mountains. The town is situated on the banks of Table Rock Lake, a reservoir created by the damming of the White River. The lake is a popular destination for fishing, boating, and other recreational activities.
The town is located at an elevation of 890 feet (271 meters) and has a total area of 1.2 square miles (3.2 square kilometers). The climate is humid subtropical, with hot, humid summers and mild winters.
Economy
The economy of Shell Knob is largely based on tourism. The town is a popular destination for fishing, boating, and other recreational activities. There are several marinas and boat docks in the area, as well as a number of restaurants and other businesses catering to tourists.
In addition, the town is home to several small businesses, including a grocery store, a hardware store, and a few other retail establishments. The town also has a few manufacturing businesses, including a furniture factory and a boat manufacturing plant.
Demographics
As of the 2010 census, the population of Shell Knob was 1,000 people. The racial makeup of the town was 97.2% White, 0.7% African American, 0.3% Native American, 0.2% Asian, 0.1% Pacific Islander, and 1.5% from other races.
The median household income in Shell Knob was $37,500, and the median family income was $45,000. The per capita income was $19,000. About 10.3% of the population was below the poverty line.
Conclusion
Shell Knob is a small town located in Barry County, Missouri, United States. It is situated on the banks of Table Rock Lake, a reservoir created by the damming of the White River. The town has a population of approximately 1,000 people and is a popular tourist destination due to its proximity to the lake. The economy of Shell Knob is largely based on tourism, and the town is home to several small businesses. The racial makeup of the town is predominantly White, with a small percentage of African American, Native American, Asian, and Pacific Islander residents. The median household income in Shell Knob is $37,500, and the per capita income is $19,000.
Common Questions
What is Per Capita Income in Shell Knob?
Per Capita income in Shell Knob is $37,428.
What is the Median Family Income in Shell Knob?
Median Family Income in Shell Knob is $79,044.
What is the Median Household income in Shell Knob?
Median Household Income in Shell Knob is $49,853.
What is Inequality or Gini Index in Shell Knob?
Inequality or Gini Index in Shell Knob is 0.42.
What is the Total Population of Shell Knob?
Total Population of Shell Knob is 1,415.
What is the Total Male Population of Shell Knob?
Total Male Population of Shell Knob is 721.
What is the Total Female Population of Shell Knob?
Total Female Population of Shell Knob is 694.
What is the Ratio of Males per 100 Females in Shell Knob?
There are 103.89 Males per 100 Females in Shell Knob.
What is the Ratio of Females per 100 Males in Shell Knob?
There are 96.26 Females per 100 Males in Shell Knob.
What is the Median Population Age in Shell Knob?
Median Population Age in Shell Knob is 64.5 Years.
What is the Average Family Size in Shell Knob
Average Family Size in Shell Knob is 2.2 People.
What is the Average Household Size in Shell Knob
Average Household Size in Shell Knob is 1.9 People.
How Large is the Labor Force in Shell Knob?
There are 483 People in the Labor Forcein in Shell Knob.
What is the Percentage of People in the Labor Force in Shell Knob?
36.3% of People are in the Labor Force in Shell Knob.
What is the Unemployment Rate in Shell Knob?
Unemployment Rate in Shell Knob is 3.1%.